
Global companies with offices in the Nordic region · Global companies with offices in the ......
28
Global companies with offices in the Nordic region A study of global and regional headquarters
Transcript of Global companies with offices in the Nordic region · Global companies with offices in the ......
Global companies with offices in the Nordic regionA study of global and regional headquarters

A study of global and regional headquartersGlobal companies with offices in the Nordic region 2
Introduction
The importance of headquarters for the development of a region has been shown in many previous studies. People who work in HQs or with related services are among the best paid in the business world. Earlier studies have also shown a clear relationship between the location of global companies, salaries and GDP. More headquarters equals better availability of professionals and specialists. Global companies demand talent and expertise, which favours the knowledge-intensive Nordic countries. This report is based on an analysis of Forbes Global 2000 list of the world’s 2,000 largest listed global (multinational) companies. The report shows where multinational companies locate their global and regional head offices in the Nordic region. It also shows a clear concentration of these companies in the Nordic metropolitan areas, primarily Stockholm, followed by Copenhagen.
Global companies’ with offices in the Nordic Region – a study of global and regional headquarters is a report based on an analysis of Forbes Global 2000 companies presence in the Nordic region. The analysis has been completed in 2015 and is a result of cooperation between Stockholm Business Region and Øresundsinstituttet. The study is also a continuation of the earlier reports that The Øresund Institute published 2006 (Glocalization 2006: International groups in the North) and 2010 (The location of Nordic and Global Headquarters in 2010). Analysts responsible for the report: Jenny Berthling, Stockholm Business region, Britt Andresen, ØresundsinstituttetLayout: Essen InternationalDate: Malmö and Stockholm in December 2015
A study of global and regional headquartersGlobal companies with offices in the Nordic region
01.
02.
03.
04.
05.
06.
07.
Highlights of the report
Global headquarters and regional headquarters
The location of global headquarters for Forbes Global 2000 companies
The location of regional headquarters for Forbes Global 2000 companies
Industry sectors of Forbes Global 2000 companies in the Nordic region
Further studies
Appendix
Content
3
4A study of global and regional headquartersGlobal companies with offices in the Nordic region
Highlights of the report01.
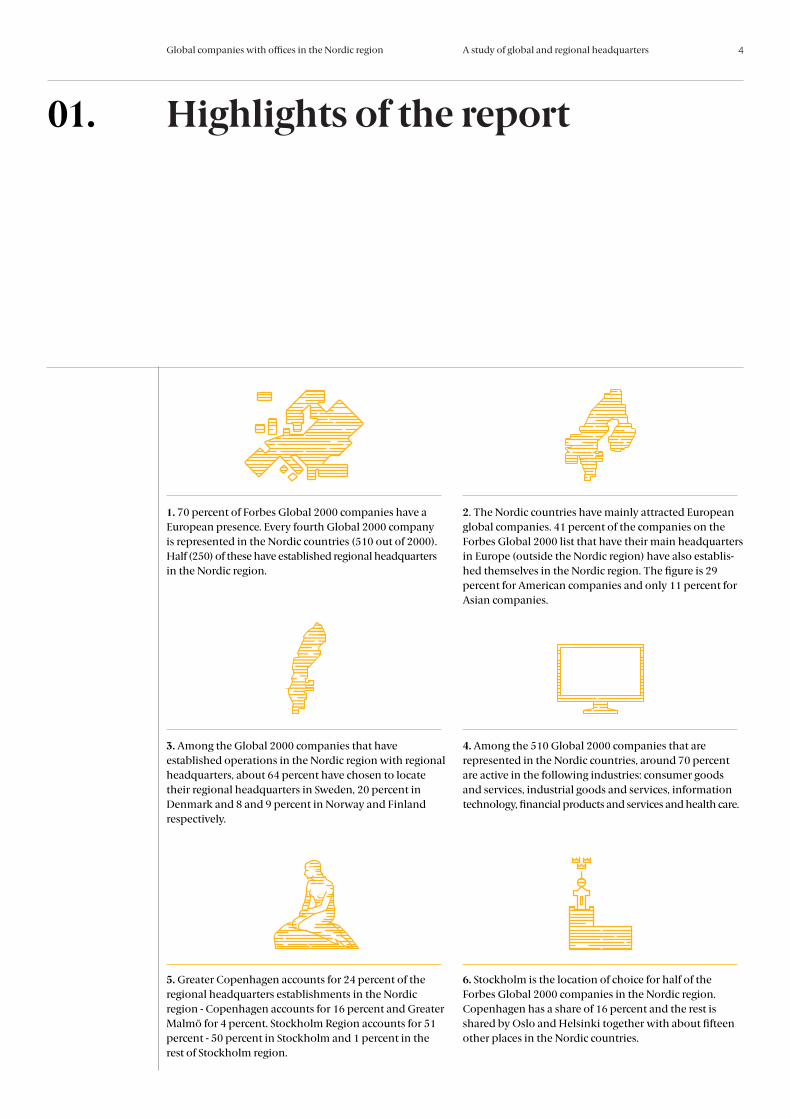
6. Stockholm is the location of choice for half of the Forbes Global 2000 companies in the Nordic region. Copenhagen has a share of 16 percent and the rest is shared by Oslo and Helsinki together with about fifteen other places in the Nordic countries.
5. Greater Copenhagen accounts for 24 percent of the regional headquarters establishments in the Nordic region - Copenhagen accounts for 16 percent and Greater Malmö for 4 percent. Stockholm Region accounts for 51 percent - 50 percent in Stockholm and 1 percent in the rest of Stockholm region.
4. Among the 510 Global 2000 companies that are represented in the Nordic countries, around 70 percent are active in the following industries: consumer goods and services, industrial goods and services, information technology, financial products and services and health care.
3. Among the Global 2000 companies that have established operations in the Nordic region with regional headquarters, about 64 percent have chosen to locate their regional headquarters in Sweden, 20 percent in Denmark and 8 and 9 percent in Norway and Finland respectively.
2. The Nordic countries have mainly attracted European global companies. 41 percent of the companies on the Forbes Global 2000 list that have their main headquarters in Europe (outside the Nordic region) have also establis-hed themselves in the Nordic region. The figure is 29 percent for American companies and only 11 percent for Asian companies.
1. 70 percent of Forbes Global 2000 companies have a European presence. Every fourth Global 2000 company is represented in the Nordic countries (510 out of 2000). Half (250) of these have established regional headquarters in the Nordic region.
5A study of global and regional headquartersGlobal companies with offices in the Nordic region
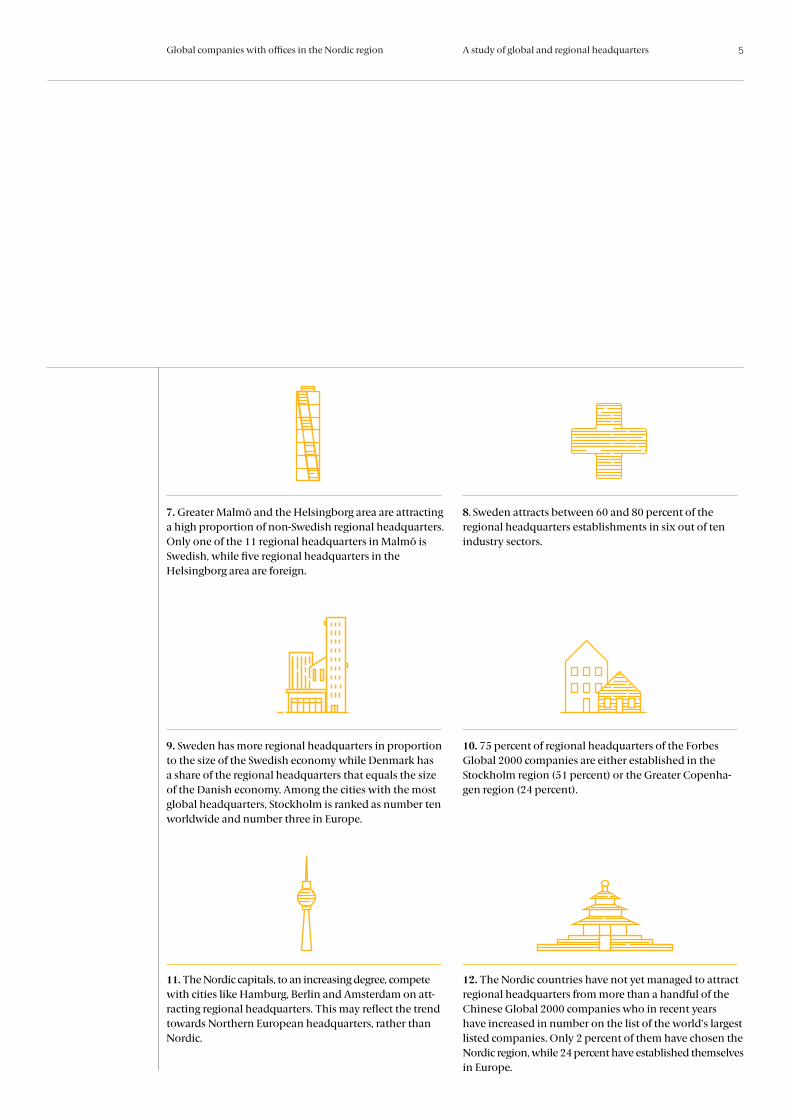
8. Sweden attracts between 60 and 80 percent of the regional headquarters establishments in six out of ten industry sectors.
7. Greater Malmö and the Helsingborg area are attracting a high proportion of non-Swedish regional headquarters. Only one of the 11 regional headquarters in Malmö is Swedish, while five regional headquarters in the Helsingborg area are foreign.
10. 75 percent of regional headquarters of the Forbes Global 2000 companies are either established in the Stockholm region (51 percent) or the Greater Copenha-gen region (24 percent).
9. Sweden has more regional headquarters in proportion to the size of the Swedish economy while Denmark has a share of the regional headquarters that equals the size of the Danish economy. Among the cities with the most global headquarters, Stockholm is ranked as number ten worldwide and number three in Europe.
12. The Nordic countries have not yet managed to attract regional headquarters from more than a handful of the Chinese Global 2000 companies who in recent years have increased in number on the list of the world’s largest listed companies. Only 2 percent of them have chosen the Nordic region, while 24 percent have established themselves in Europe.
11. The Nordic capitals, to an increasing degree, compete with cities like Hamburg, Berlin and Amsterdam on att-racting regional headquarters. This may reflect the trend towards Northern European headquarters, rather than Nordic.
6A study of global and regional headquartersGlobal companies with offices in the Nordic region
Global headquarters and regional headquarters
02.
The importance of headquarters for the develop- ment of a region has been shown in many previous studies. People who work in HQs or with related
services are among the best paid in the business world. Earlier studies have also shown a clear and positive relationship between the location of global companies, salaries and GDP. More headquarters equals better avai-lability of professionals and specialists. Global companies demand talent and expertise, which favours the knowledge- intensive Nordic countries. Global and regional headquarters need a well-functi-oning business climate with a ready supply of advanced services, talent, infrastructure and good market conditions. Which is why the share of global and regional headquarters (GHQs and RHQs respectively) can be used as a method for comparing the attractiveness of regions. Previous studies have also looked at how global com-panies organize themselves at a regional level in order to understand the interplay between metropolitan regions and global networks. This survey shows that the fundamen-tal role of regional headquarters (RHQs) is to manage and coordinate business activities between national subsidi-aries within a specific region. Thereby obtaining a more leading position within the company’s parent group.
Major metropolitan regions play a more and more important role in the global economy. Today, over half of the world’s population live in urban areas (2015). Big cities attract a highly educated workforce, form important clusters and act as knowledge centres. This in turn brings even more companies. Large cities also play an important role in attracting investments. For example, over 40 percent of foreign direct investments in Western Europe end up in one of 20 European cities. In sectors such as information and communication technology, the 20 largest cities have secured almost 50 percent of the invest-ments (source: fDiMarket 2015). One way to describe how attractive the major metropolitan regions are in interna-tional rankings of competitiveness is to measure regional operations of foreign companies in the Nordic region. Advancements in technology along with digitization have made it possible for global corporations to manage their businesses from fewer locations, which in turn means diminishing autonomy for national companies. Today, global strategies can be implemented locally from the global headquarters. As the number of locations for management functions go down, competition between cities and regions increases in terms of attracting the global companies.
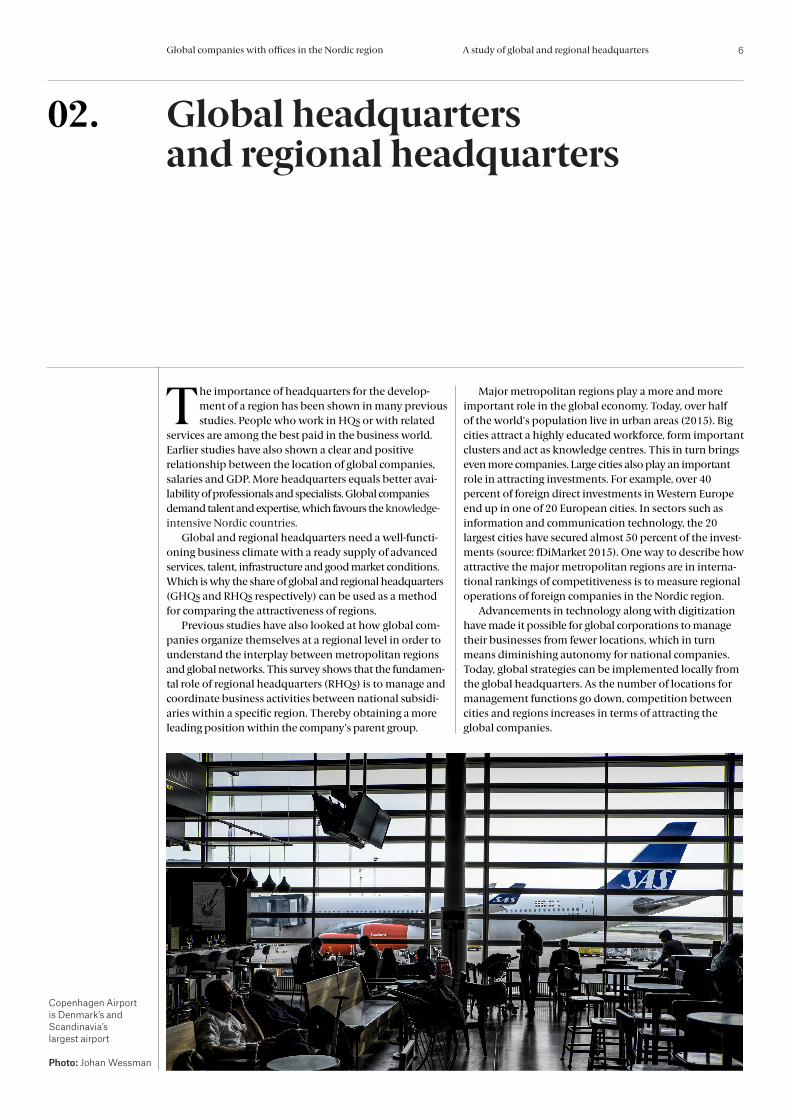
Copenhagen Airport is Denmark’s and Scandinavia’s largest airport
Photo: Johan Wessman
7A study of global and regional headquartersGlobal companies with offices in the Nordic region
The location of global headquarters for Forbes Global 2000 companies
03.
In this section of the study, we have used the latest publication of the Forbes Global 2000 list (from 2015) as it only deals with the location of the global
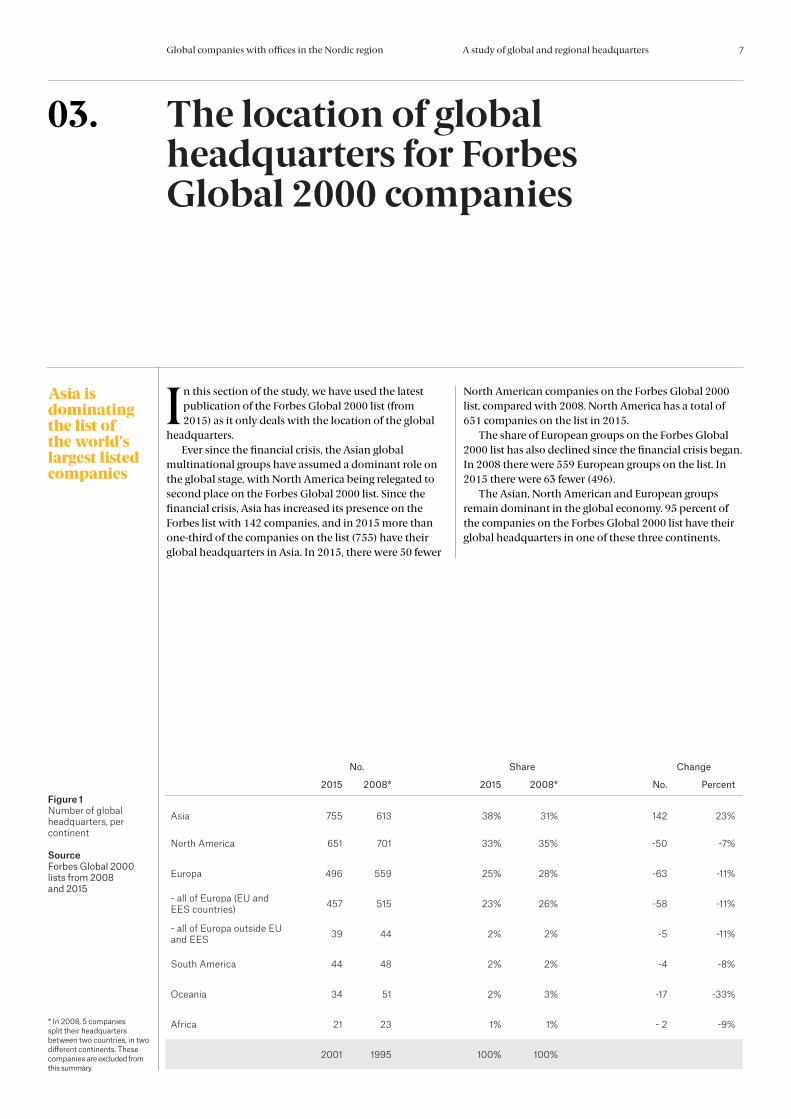
headquarters. Ever since the financial crisis, the Asian global multinational groups have assumed a dominant role on the global stage, with North America being relegated to second place on the Forbes Global 2000 list. Since the financial crisis, Asia has increased its presence on the Forbes list with 142 companies, and in 2015 more than one-third of the companies on the list (755) have their global headquarters in Asia. In 2015, there were 50 fewer
North American companies on the Forbes Global 2000 list, compared with 2008. North America has a total of 651 companies on the list in 2015. The share of European groups on the Forbes Global 2000 list has also declined since the financial crisis began. In 2008 there were 559 European groups on the list. In 2015 there were 63 fewer (496). The Asian, North American and European groups remain dominant in the global economy. 95 percent of the companies on the Forbes Global 2000 list have their global headquarters in one of these three continents.
Figure 1 Number of global headquarters, per continent
SourceForbes Global 2000 lists from 2008 and 2015
* In 2008, 5 companies split their headquarters between two countries, in two different continents. These companies are excluded from this summary.
No. 2015 2008*
Share2015 2008*
Change No. Percent
Asia 755 613 38% 31% 142 23%
North America 651 701 33% 35% -50 -7%
Europa 496 559 25% 28% -63 -11%
- all of Europa (EU and EES countries) 457 515 23% 26% -58 -11%
- all of Europa outside EU and EES 39 44 2% 2% -5 -11%
South America 44 48 2% 2% -4 -8%
Oceania 34 51 2% 3% -17 -33%
Africa 21 23 1% 1% - 2 -9%
2001 1995 100% 100%
Asia is dominating the list of the world’s largest listed companies
No. Share Change
8A study of global and regional headquartersGlobal companies with offices in the Nordic region
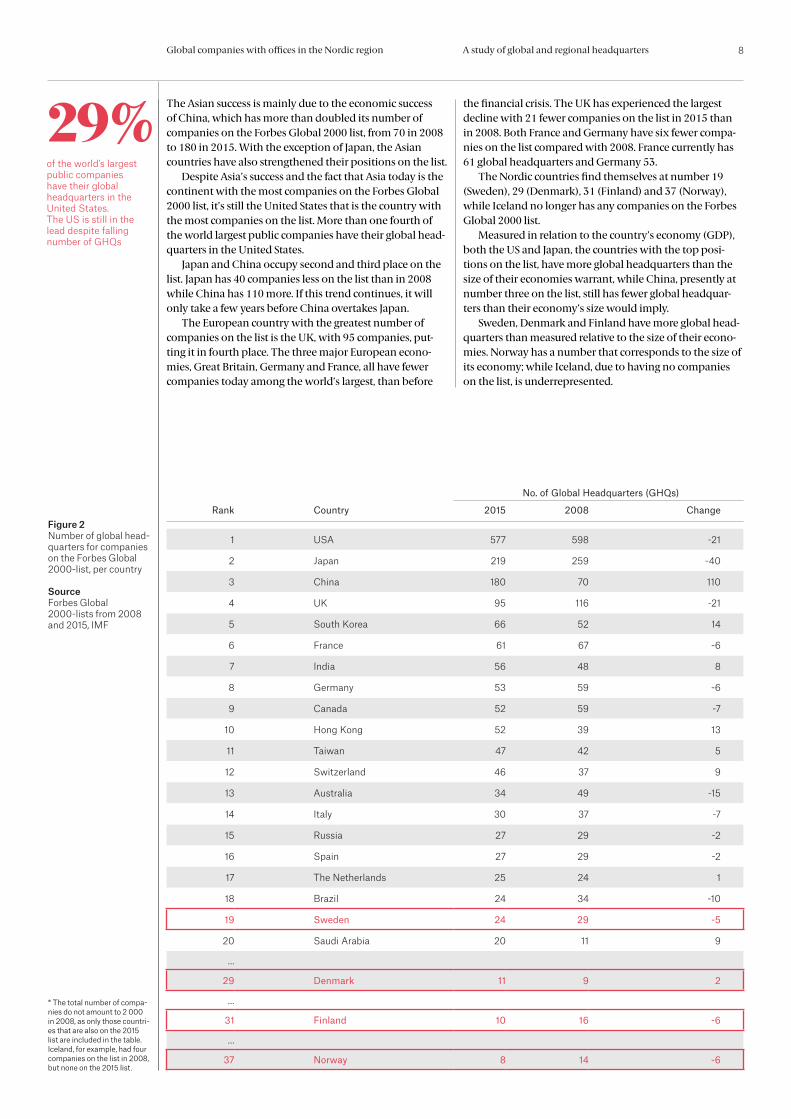
The Asian success is mainly due to the economic success of China, which has more than doubled its number of companies on the Forbes Global 2000 list, from 70 in 2008 to 180 in 2015. With the exception of Japan, the Asian countries have also strengthened their positions on the list. Despite Asia’s success and the fact that Asia today is the continent with the most companies on the Forbes Global 2000 list, it’s still the United States that is the country with the most companies on the list. More than one fourth of the world largest public companies have their global head-quarters in the United States. Japan and China occupy second and third place on the list. Japan has 40 companies less on the list than in 2008 while China has 110 more. If this trend continues, it will only take a few years before China overtakes Japan. The European country with the greatest number of companies on the list is the UK, with 95 companies, put-ting it in fourth place. The three major European econo-mies, Great Britain, Germany and France, all have fewer companies today among the world’s largest, than before
the financial crisis. The UK has experienced the largest decline with 21 fewer companies on the list in 2015 than in 2008. Both France and Germany have six fewer compa-nies on the list compared with 2008. France currently has 61 global headquarters and Germany 53. The Nordic countries find themselves at number 19 (Sweden), 29 (Denmark), 31 (Finland) and 37 (Norway), while Iceland no longer has any companies on the Forbes Global 2000 list. Measured in relation to the country’s economy (GDP), both the US and Japan, the countries with the top posi-tions on the list, have more global headquarters than the size of their economies warrant, while China, presently at number three on the list, still has fewer global headquar-ters than their economy’s size would imply. Sweden, Denmark and Finland have more global head-quarters than measured relative to the size of their econo-mies. Norway has a number that corresponds to the size of its economy; while Iceland, due to having no companies on the list, is underrepresented.
29%of the world’s largestpublic companieshave their globalheadquarters in theUnited States. The US is still in the lead despite falling number of GHQs
Figure 2 Number of global head-quarters for companies on the Forbes Global 2000-list, per country
SourceForbes Global 2000-lists from 2008 and 2015, IMF
No. of Global Headquarters (GHQs)
Rank Country 2015 2008 Change
1 USA 577 598 -21
2 Japan 219 259 -40
3 China 180 70 110
4 UK 95 116 -21
5 South Korea 66 52 14
6 France 61 67 -6
7 India 56 48 8
8 Germany 53 59 -6
9 Canada 52 59 -7
10 Hong Kong 52 39 13
11 Taiwan 47 42 5
12 Switzerland 46 37 9
13 Australia 34 49 -15
14 Italy 30 37 -7
15 Russia 27 29 -2
16 Spain 27 29 -2
17 The Netherlands 25 24 1
18 Brazil 24 34 -10
19 Sweden 24 29 -5
20 Saudi Arabia 20 11 9
…
29 Denmark 11 9 2
…
31 Finland 10 16 -6
…
37 Norway 8 14 -6
* The total number of compa-nies do not amount to 2 000 in 2008, as only those countri-es that are also on the 2015 list are included in the table. Iceland, for example, had four companies on the list in 2008, but none on the 2015 list.
9A study of global and regional headquartersGlobal companies with offices in the Nordic region
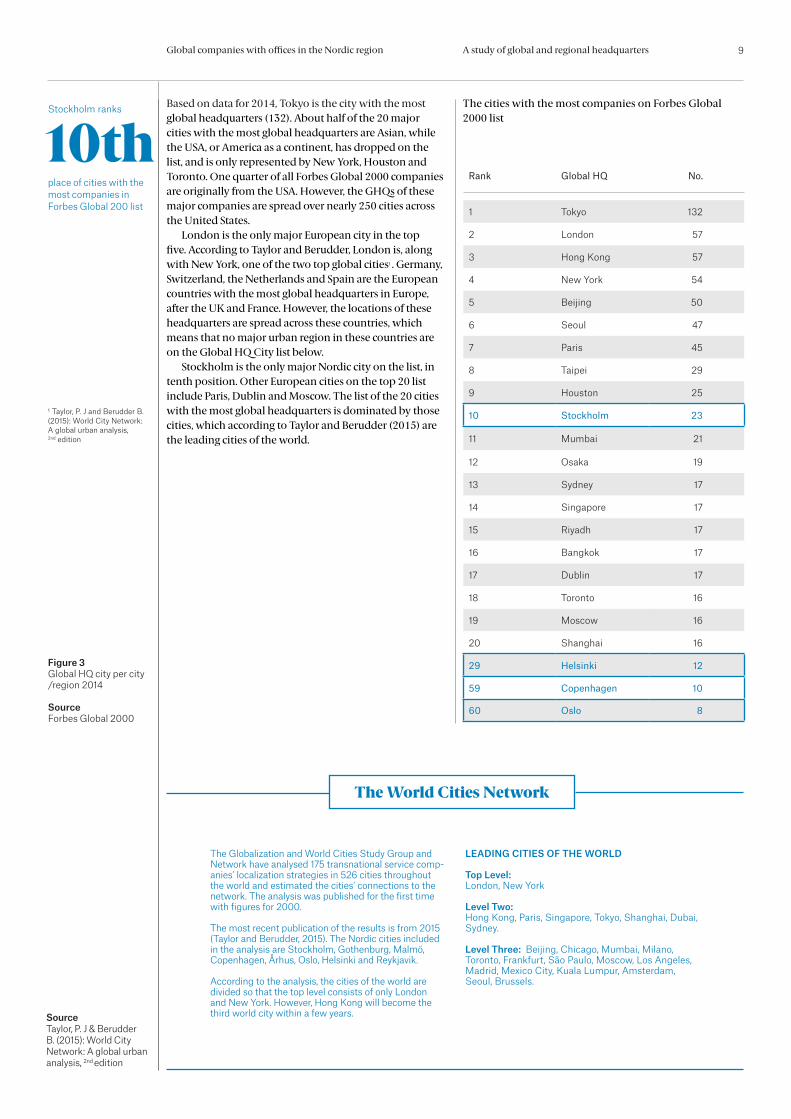
Based on data for 2014, Tokyo is the city with the most global headquarters (132). About half of the 20 major cities with the most global headquarters are Asian, while the USA, or America as a continent, has dropped on the list, and is only represented by New York, Houston and Toronto. One quarter of all Forbes Global 2000 companies are originally from the USA. However, the GHQs of these major companies are spread over nearly 250 cities across the United States. London is the only major European city in the top five. According to Taylor and Berudder, London is, along with New York, one of the two top global cities1 . Germany, Switzerland, the Netherlands and Spain are the European countries with the most global headquarters in Europe, after the UK and France. However, the locations of these headquarters are spread across these countries, which means that no major urban region in these countries are on the Global HQ City list below. Stockholm is the only major Nordic city on the list, in tenth position. Other European cities on the top 20 list include Paris, Dublin and Moscow. The list of the 20 cities with the most global headquarters is dominated by those cities, which according to Taylor and Berudder (2015) are the leading cities of the world.
Figure 3 Global HQ city per city /region 2014
SourceForbes Global 2000
The cities with the most companies on Forbes Global 2000 list
1 Taylor, P. J and Berudder B. (2015): World City Network: A global urban analysis, 2nd edition
Rank Global HQ No.
1 Tokyo 132
2 London 57
3 Hong Kong 57
4 New York 54
5 Beijing 50
6 Seoul 47
7 Paris 45
8 Taipei 29
9 Houston 25
10 Stockholm 23
11 Mumbai 21
12 Osaka 19
13 Sydney 17
14 Singapore 17
15 Riyadh 17
16 Bangkok 17
17 Dublin 17
18 Toronto 16
19 Moscow 16
20 Shanghai 16
29 Helsinki 12
59 Copenhagen 10
60 Oslo 8
SourceTaylor, P. J & Berudder B. (2015): World City Network: A global urban analysis, 2nd edition
The Globalization and World Cities Study Group and Network have analysed 175 transnational service comp-anies’ localization strategies in 526 cities throughout the world and estimated the cities’ connections to the network. The analysis was published for the first time with figures for 2000.
The most recent publication of the results is from 2015 (Taylor and Berudder, 2015). The Nordic cities included in the analysis are Stockholm, Gothenburg, Malmö, Copenhagen, Århus, Oslo, Helsinki and Reykjavik.
According to the analysis, the cities of the world are divided so that the top level consists of only London and New York. However, Hong Kong will become thethird world city within a few years.
LEADING CITIES OF THE WORLD
Top Level: London, New York
Level Two: Hong Kong, Paris, Singapore, Tokyo, Shanghai, Dubai, Sydney.
Level Three: Beijing, Chicago, Mumbai, Milano, Toronto, Frankfurt, São Paulo, Moscow, Los Angeles, Madrid, Mexico City, Kuala Lumpur, Amsterdam, Seoul, Brussels.
The World Cities Network
10thplace of cities with the most companies in Forbes Global 200 list
Stockholm ranks
10A study of global and regional headquartersGlobal companies with offices in the Nordic region
The location of regional headquarters for Forbes Global 2000 companies
04.
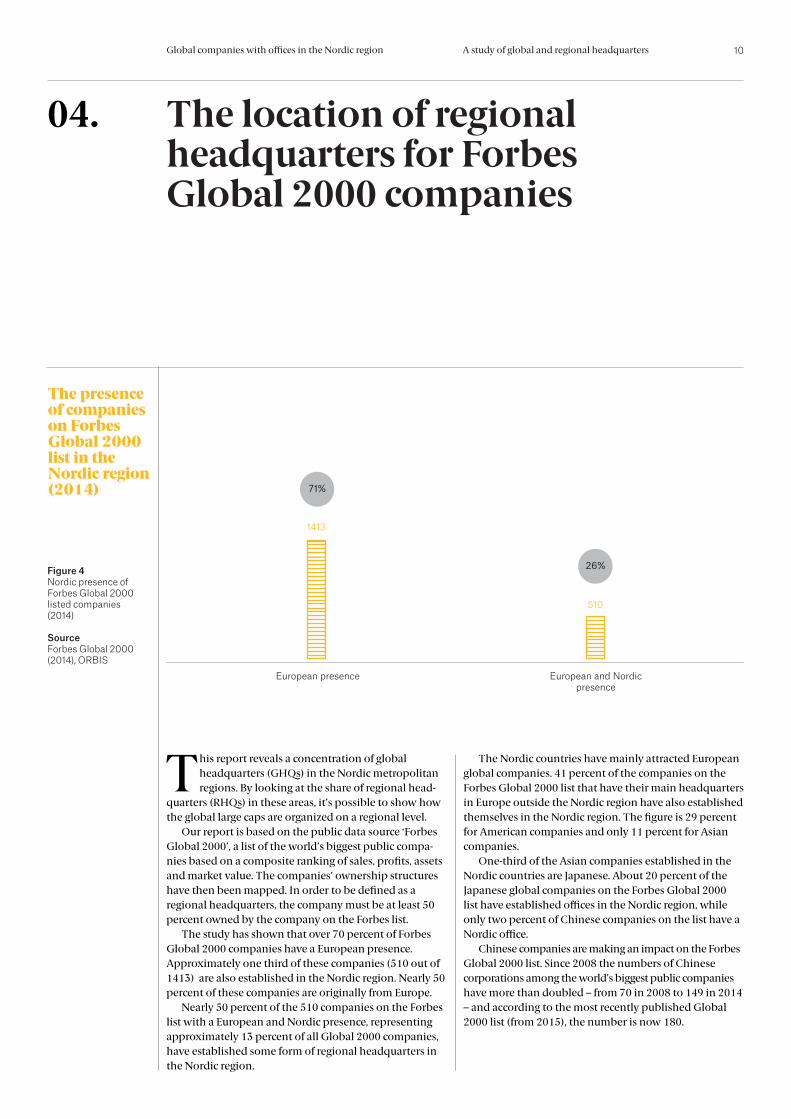
This report reveals a concentration of global headquarters (GHQs) in the Nordic metropolitan regions. By looking at the share of regional head-
quarters (RHQs) in these areas, it’s possible to show how the global large caps are organized on a regional level. Our report is based on the public data source ‘Forbes Global 2000’, a list of the world’s biggest public compa-nies based on a composite ranking of sales, profits, assets and market value. The companies’ ownership structures have then been mapped. In order to be defined as a regional headquarters, the company must be at least 50 percent owned by the company on the Forbes list. The study has shown that over 70 percent of Forbes Global 2000 companies have a European presence. Approximately one third of these companies (510 out of 1413) are also established in the Nordic region. Nearly 50 percent of these companies are originally from Europe. Nearly 50 percent of the 510 companies on the Forbes list with a European and Nordic presence, representing approximately 13 percent of all Global 2000 companies, have established some form of regional headquarters in the Nordic region.
The Nordic countries have mainly attracted European global companies. 41 percent of the companies on the Forbes Global 2000 list that have their main headquarters in Europe outside the Nordic region have also established themselves in the Nordic region. The figure is 29 percent for American companies and only 11 percent for Asian companies. One-third of the Asian companies established in the Nordic countries are Japanese. About 20 percent of the Japanese global companies on the Forbes Global 2000 list have established offices in the Nordic region, while only two percent of Chinese companies on the list have a Nordic office. Chinese companies are making an impact on the Forbes Global 2000 list. Since 2008 the numbers of Chinese corporations among the world’s biggest public companies have more than doubled – from 70 in 2008 to 149 in 2014 – and according to the most recently published Global 2000 list (from 2015), the number is now 180.
The presence of companies on Forbes Global 2000 list in the Nordic region (2014)
Figure 4 Nordic presence of Forbes Global 2000 listed companies (2014)
SourceForbes Global 2000 (2014), ORBIS
European presence
1413
71%
European and Nordic presence
510
26%
11A study of global and regional headquartersGlobal companies with offices in the Nordic region
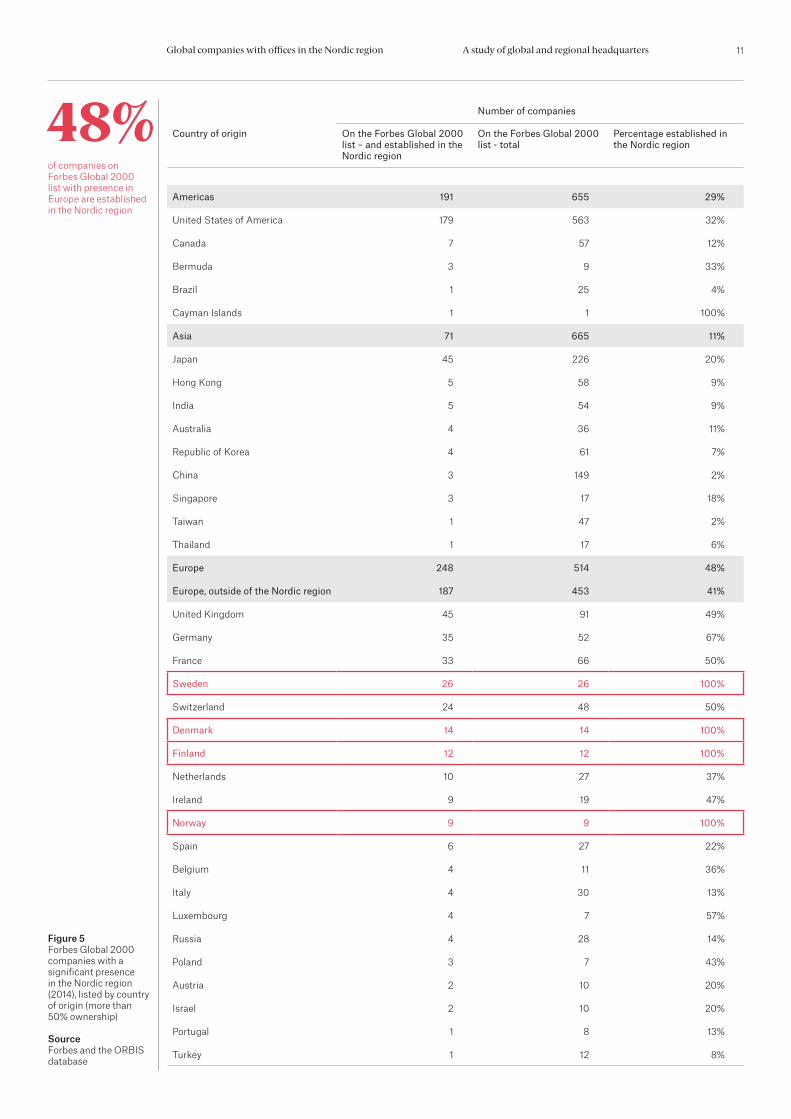
Figure 5 Forbes Global 2000 companies with a significant presence in the Nordic region (2014), listed by country of origin (more than 50% ownership)
SourceForbes and the ORBIS database
Number of companies
Country of origin On the Forbes Global 2000 list – and established in the Nordic region
On the Forbes Global 2000 list - total
Percentage established in the Nordic region
Americas 191 655 29%
United States of America 179 563 32%
Canada 7 57 12%
Bermuda 3 9 33%
Brazil 1 25 4%
Cayman Islands 1 1 100%
Asia 71 665 11%
Japan 45 226 20%
Hong Kong 5 58 9%
India 5 54 9%
Australia 4 36 11%
Republic of Korea 4 61 7%
China 3 149 2%
Singapore 3 17 18%
Taiwan 1 47 2%
Thailand 1 17 6%
Europe 248 514 48%
Europe, outside of the Nordic region 187 453 41%
United Kingdom 45 91 49%
Germany 35 52 67%
France 33 66 50%
Sweden 26 26 100%
Switzerland 24 48 50%
Denmark 14 14 100%
Finland 12 12 100%
Netherlands 10 27 37%
Ireland 9 19 47%
Norway 9 9 100%
Spain 6 27 22%
Belgium 4 11 36%
Italy 4 30 13%
Luxembourg 4 7 57%
Russia 4 28 14%
Poland 3 7 43%
Austria 2 10 20%
Israel 2 10 20%
Portugal 1 8 13%
Turkey 1 12 8%
48%of companies on Forbes Global 2000list with presence in Europe are established in the Nordic region
12A study of global and regional headquartersGlobal companies with offices in the Nordic region
Types of Headquarters
Global Headquarters (GHQ) A global headquarters is defined as
the group’s global control centre that provides the business with services such
as management, finance, accounting, marketing, human capital, IT and
legal assistance.
European Headquarters A European headquarters controls the activity of a group of national
subsidiaries operating at European level and is in direct contact with the
global headquarters.
Regional headquarters (RHQ)A regional headquarters controls the activity of a group of national
subsidiaries, and has, by virtue of this, a leading position within the
company’s organization.
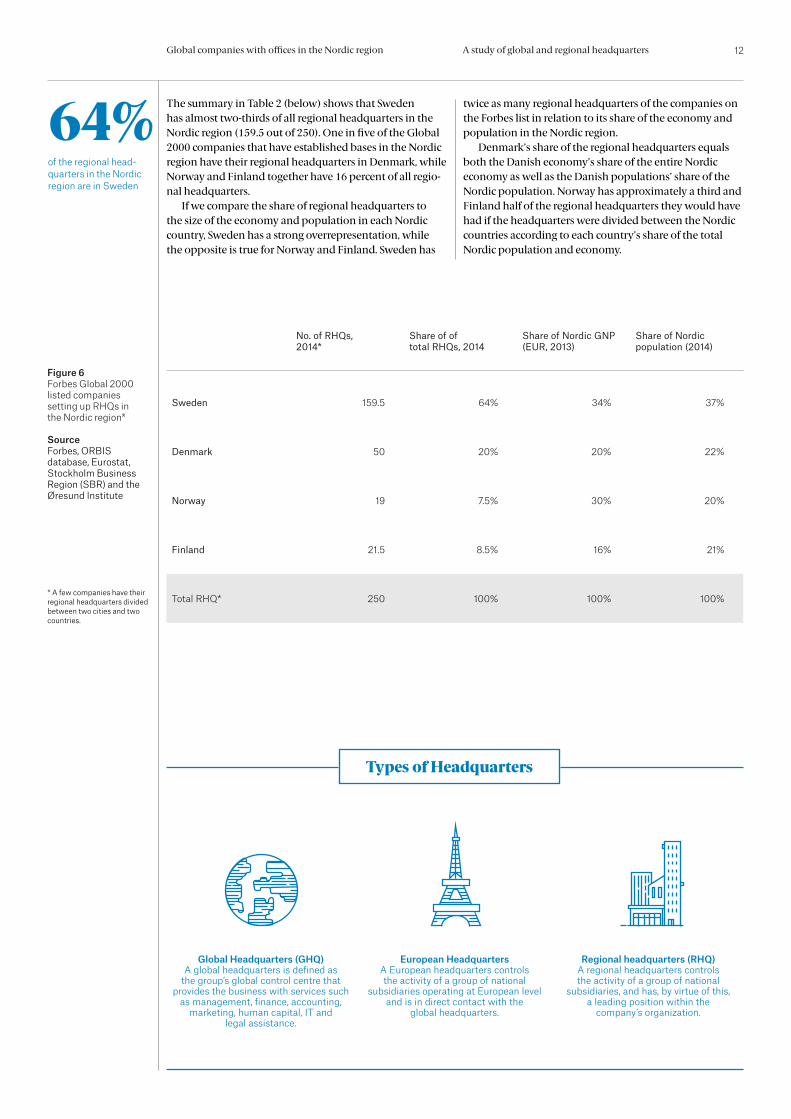
The summary in Table 2 (below) shows that Swedenhas almost two-thirds of all regional headquarters in the Nordic region (159.5 out of 250). One in five of the Global 2000 companies that have established bases in the Nordic region have their regional headquarters in Denmark, while Norway and Finland together have 16 percent of all regio-nal headquarters. If we compare the share of regional headquarters to the size of the economy and population in each Nordic country, Sweden has a strong overrepresentation, while the opposite is true for Norway and Finland. Sweden has
twice as many regional headquarters of the companies on the Forbes list in relation to its share of the economy and population in the Nordic region. Denmark’s share of the regional headquarters equals both the Danish economy’s share of the entire Nordic economy as well as the Danish populations’ share of the Nordic population. Norway has approximately a third and Finland half of the regional headquarters they would have had if the headquarters were divided between the Nordic countries according to each country’s share of the total Nordic population and economy.
No. of RHQs, 2014*
Share of of total RHQs, 2014
Share of Nordic GNP (EUR, 2013)
Share of Nordic population (2014)
Sweden 159.5 64% 34% 37%
Denmark 50 20% 20% 22%
Norway 19 7.5% 30% 20%
Finland 21.5 8.5% 16% 21%
Total RHQ* 250 100% 100% 100%
Figure 6 Forbes Global 2000 listed companies setting up RHQs in the Nordic region*
SourceForbes, ORBIS database, Eurostat, Stockholm Business Region (SBR) and the Øresund Institute
* A few companies have their regional headquarters divided between two cities and two countries.
64%of the regional head-quarters in the Nordic region are in Sweden
13A study of global and regional headquartersGlobal companies with offices in the Nordic region
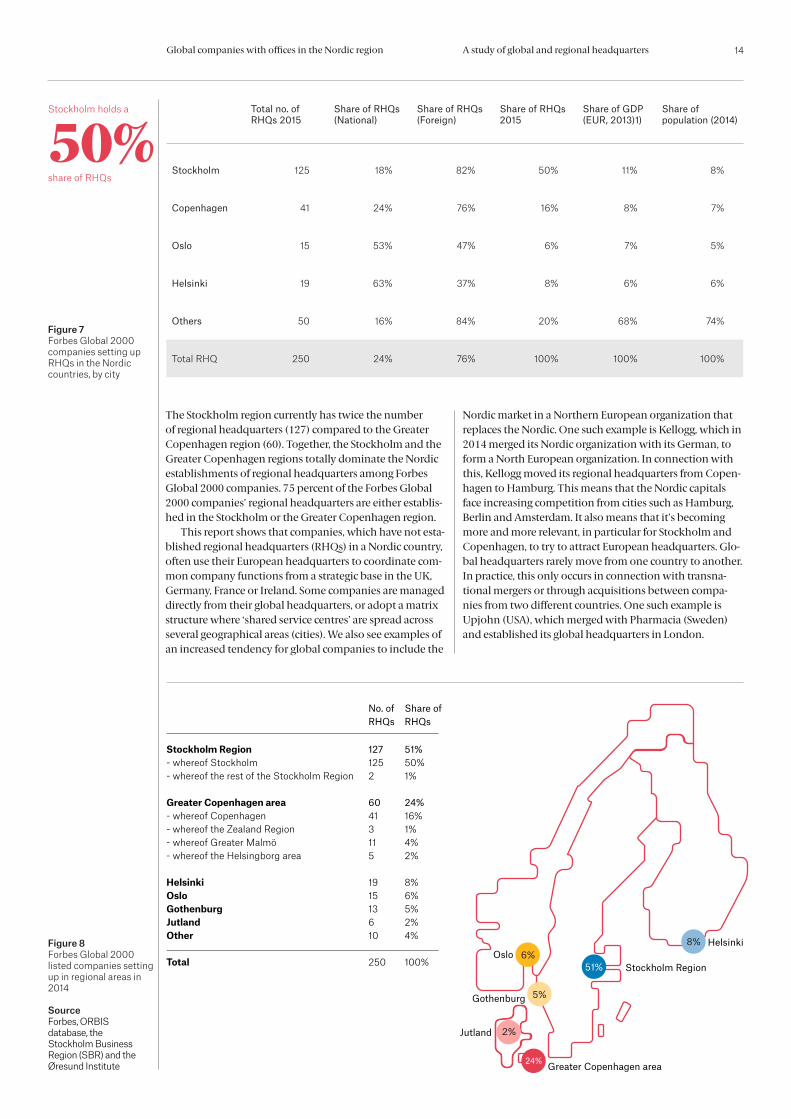
When broken down to the metropolitan level, it’s clear that there is a concentration of about 80 percent of RHQs in metropolitan areas. Figure 8 shows a summary of how RHQs in the Nordic capitals and other cities in the Nordic region are distributed. More than two-thirds of the companies that have chosen Sweden for their head office for the Nordic region have also chosen Stockholm as the location for their regional headquarters. Gothenburg has 16 regional headquarters – among them the worldwide headquarters for the truck maker Volvo Group – along with six American and three Japanese regional headqu-arters. Note that the passenger car manufacturer Volvo Cars is not part of the Volvo Group, but is now owned by Chinese Zhejiang Geely Holding Group, which is not on the Forbes Global 2000 list. Scania (Skåne) has a total of 16 regional headquarters, including German EON and Japanese Honda Motors. Scania (Skåne) has a higher share of foreign companies regional headquarters than the other Nordic regions. Only one of the 16 regional headquarters, that of Lund-based Alfa Laval, is a Swedish company who has its global and regional headquarters in Scania. Eighty percent of the regional headquarters of Forbes Global 2000 companies’ in Denmark are located in Copen-hagen, three in other locations in the Zealand region and six companies in Jutland. In Norway and Finland, the bulk of the regional headquarters (34 of 40.5 companies) are located in Oslo and Helsinki respectively.
If we compare the share of regional headquarters of the companies on the Global 2000 list in relationship to the size of the economy and population, Stockholm – but also Copenhagen – has a strong overrepresentation, while Oslo and Helsinki are represented proportionately to their respective size. A further mapping of the share of national and foreign Global 2000 companies in each metropolitan area provides another interesting insight about the presence of global companies in the Nordic region. Stockholm and Copenhagen have the largest share of global foreign companies while more than half of all RHQs in Oslo and Helsinki are domestic companies. The majority of all global companies who have chosen not to locate their RHQs in metropolitan areas are foreign. Stockholm Region accounts for 51 percent of all Global 2000 RHQs in the Nordic region while the Danish-Swedish border region Greater Copenhagen accounts for 24 percent. The city of Copenhagen, Malmö and Lund are located near to each other and are connected by the Øresund Bridge since 2000.The rest are shared between Oslo, Helsinki and some fifteen other cities in the Nordic countries. Some compa-nies have established themselves in smaller communities through acquisitions, in order to get close to an important market or to get access to a particular skill. In this case, a particular location becomes less important. This can also mean that smaller towns outside of the metropolitan regions can attract the attention of Global 2000 companies
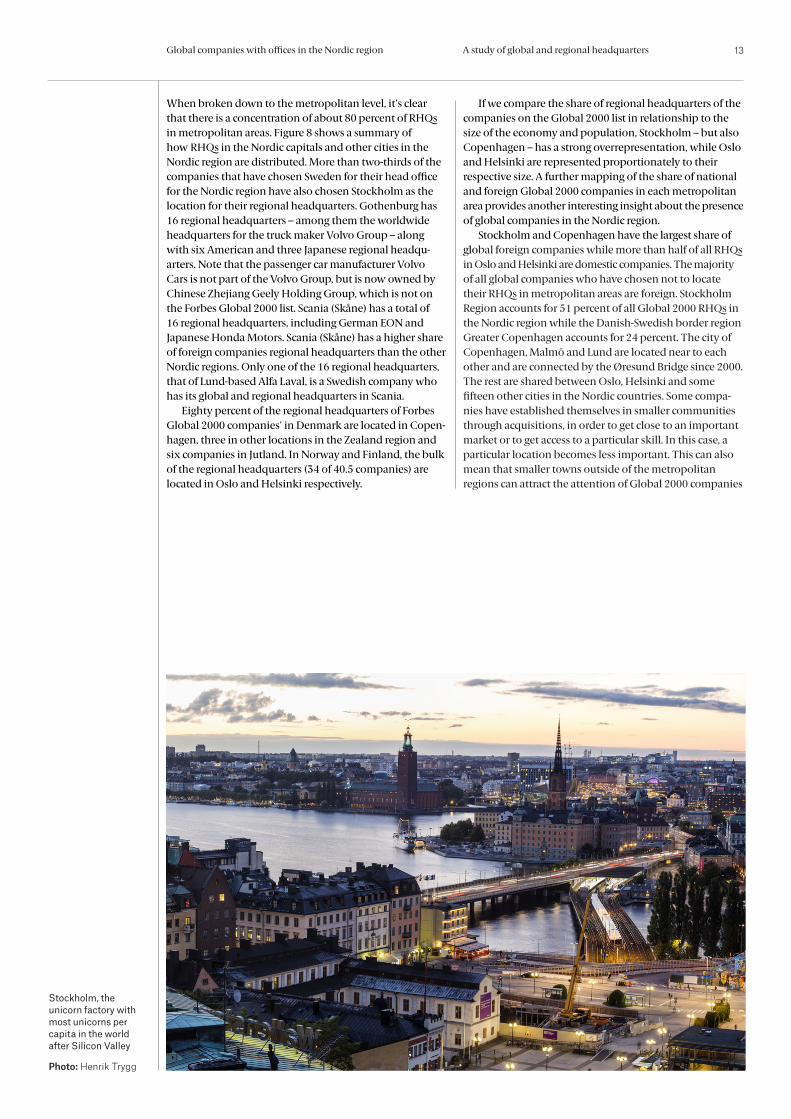
Stockholm, the unicorn factory with most unicorns per capita in the world after Silicon Valley
Photo: Henrik Trygg
14A study of global and regional headquartersGlobal companies with offices in the Nordic region
The Stockholm region currently has twice the number of regional headquarters (127) compared to the Greater Copenhagen region (60). Together, the Stockholm and the Greater Copenhagen regions totally dominate the Nordic establishments of regional headquarters among Forbes Global 2000 companies. 75 percent of the Forbes Global 2000 companies’ regional headquarters are either establis-hed in the Stockholm or the Greater Copenhagen region. This report shows that companies, which have not esta-blished regional headquarters (RHQs) in a Nordic country, often use their European headquarters to coordinate com-mon company functions from a strategic base in the UK, Germany, France or Ireland. Some companies are managed directly from their global headquarters, or adopt a matrix structure where ‘shared service centres’ are spread across several geographical areas (cities). We also see examples of an increased tendency for global companies to include the
Nordic market in a Northern European organization that replaces the Nordic. One such example is Kellogg, which in 2014 merged its Nordic organization with its German, to form a North European organization. In connection with this, Kellogg moved its regional headquarters from Copen-hagen to Hamburg. This means that the Nordic capitals face increasing competition from cities such as Hamburg, Berlin and Amsterdam. It also means that it’s becoming more and more relevant, in particular for Stockholm and Copenhagen, to try to attract European headquarters. Glo-bal headquarters rarely move from one country to another. In practice, this only occurs in connection with transna-tional mergers or through acquisitions between compa-nies from two different countries. One such example is Upjohn (USA), which merged with Pharmacia (Sweden) and established its global headquarters in London.
Figure 8 Forbes Global 2000 listed companies setting up in regional areas in 2014
SourceForbes, ORBIS database, the Stockholm Business Region (SBR) and the Øresund Institute
Figure 7 Forbes Global 2000 companies setting up RHQs in the Nordic countries, by city
Total no. of RHQs 2015
Share of RHQs (National)
Share of RHQs (Foreign)
Share of RHQs 2015
Share of GDP (EUR, 2013)1)
Share of population (2014)
Stockholm 125 18% 82% 50% 11% 8%
Copenhagen 41 24% 76% 16% 8% 7%
Oslo 15 53% 47% 6% 7% 5%
Helsinki 19 63% 37% 8% 6% 6%
Others 50 16% 84% 20% 68% 74%
Total RHQ 250 24% 76% 100% 100% 100%
50%share of RHQs
Stockholm holds a
Helsinki8%
Gothenburg 5%
Oslo 6%
Jutland 2%
Greater Copenhagen area24%
Stockholm Region51%
Stockholm Region- whereof Stockholm- whereof the rest of the Stockholm Region
Greater Copenhagen area- whereof Copenhagen- whereof the Zealand Region- whereof Greater Malmö- whereof the Helsingborg area
HelsinkiOsloGothenburgJutlandOther
Total
1271252
60413115
191513610
250
No. ofRHQs
51%50%1%
24%16%1%4%2%
8%6%5%2%4%
100%
Share ofRHQs
15A study of global and regional headquartersGlobal companies with offices in the Nordic region
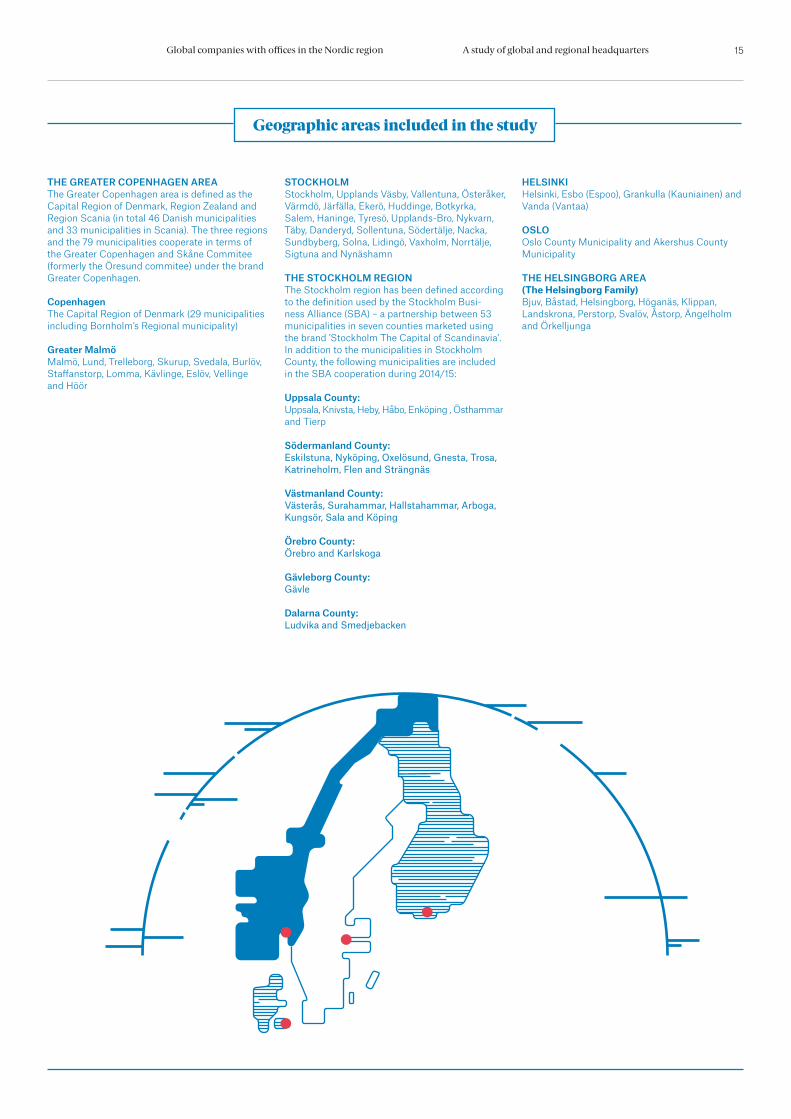
THE GREATER COPENHAGEN AREA The Greater Copenhagen area is defined as the Capital Region of Denmark, Region Zealand and Region Scania (in total 46 Danish municipalities and 33 municipalities in Scania). The three regions and the 79 municipalities cooperate in terms of the Greater Copenhagen and Skåne Commitee (formerly the Öresund commitee) under the brand Greater Copenhagen.
CopenhagenThe Capital Region of Denmark (29 municipalities including Bornholm’s Regional municipality)
Greater MalmöMalmö, Lund, Trelleborg, Skurup, Svedala, Burlöv, Staffanstorp, Lomma, Kävlinge, Eslöv, Vellinge and Höör
STOCKHOLMStockholm, Upplands Väsby, Vallentuna, Österåker, Värmdö, Järfälla, Ekerö, Huddinge, Botkyrka, Salem, Haninge, Tyresö, Upplands-Bro, Nykvarn, Täby, Danderyd, Sollentuna, Södertälje, Nacka, Sundbyberg, Solna, Lidingö, Vaxholm, Norrtälje, Sigtuna and Nynäshamn
THE STOCKHOLM REGIONThe Stockholm region has been defined according to the definition used by the Stockholm Busi-ness Alliance (SBA) – a partnership between 53 municipalities in seven counties marketed using the brand ’Stockholm The Capital of Scandinavia’. In addition to the municipalities in Stockholm County, the following municipalities are included in the SBA cooperation during 2014/15:
Uppsala County: Uppsala, Knivsta, Heby, Håbo, Enköping , Östhammar and Tierp
Södermanland County: Eskilstuna, Nyköping, Oxelösund, Gnesta, Trosa, Katrineholm, Flen and Strängnäs
Västmanland County: Västerås, Surahammar, Hallstahammar, Arboga, Kungsör, Sala and Köping
Örebro County: Örebro and Karlskoga
Gävleborg County: Gävle
Dalarna County: Ludvika and Smedjebacken
HELSINKIHelsinki, Esbo (Espoo), Grankulla (Kauniainen) and Vanda (Vantaa) OSLO Oslo County Municipality and Akershus County Municipality
THE HELSINGBORG AREA (The Helsingborg Family)Bjuv, Båstad, Helsingborg, Höganäs, Klippan, Landskrona, Perstorp, Svalöv, Åstorp, Ängelholm and Örkelljunga
Geographic areas included in the study
16A study of global and regional headquartersGlobal companies with offices in the Nordic region
2 The Helsingborg area has been defined as the Helsing-borg Family, comprising the municipalities of Helsingborg, Bjuv, Båstad, Höganäs, Klippan, Landskrona, Perstorp, Svalöv, Åstorp, Ängelholm and Örkelljunga.
Greater Malmö
27 %
18 %
9 %
46 %
Oslo
54 %
35 %
13 %
0 %
Gothenburg
46 %
23 %
16 %
15 %
Jutland
17 %17 %
50 %
16 %
The Helsingborg area
60 %
40 %
The Zealand region
33 %
67 %
The USA
Asia
Europe, outside of the Nordic
NationalRegional headquarters, broken down by country of origin
Stockholm
19 %
15 %
35 %
31 %
Copenhagen
32 %
37 %
7 %
24 %
26 %
11 %0 %
63 %
Helsinki
SourceForbes Global 2000 (2014) and the ORBIS database
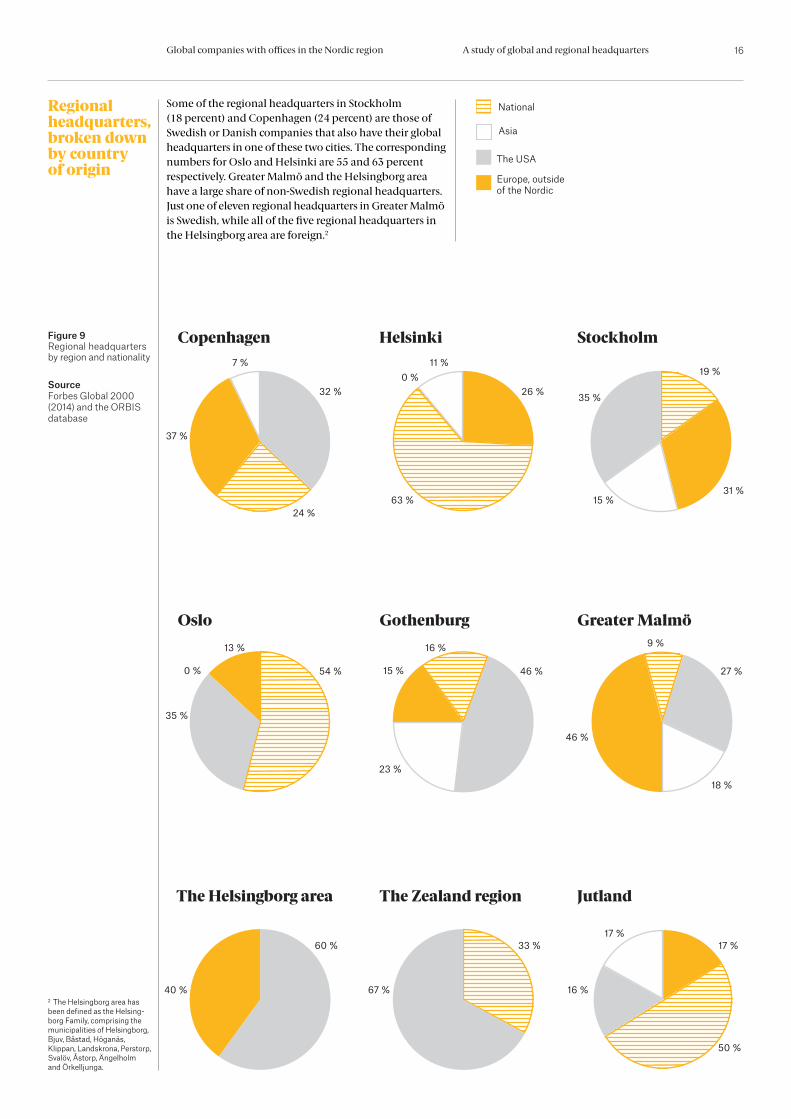
Figure 9 Regional headquarters by region and nationality
Some of the regional headquarters in Stockholm (18 percent) and Copenhagen (24 percent) are those of Swedish or Danish companies that also have their global headquarters in one of these two cities. The corresponding numbers for Oslo and Helsinki are 55 and 63 percent respectively. Greater Malmö and the Helsingborg area have a large share of non-Swedish regional headquarters. Just one of eleven regional headquarters in Greater Malmö is Swedish, while all of the five regional headquarters in the Helsingborg area are foreign.2
17A study of global and regional headquartersGlobal companies with offices in the Nordic region
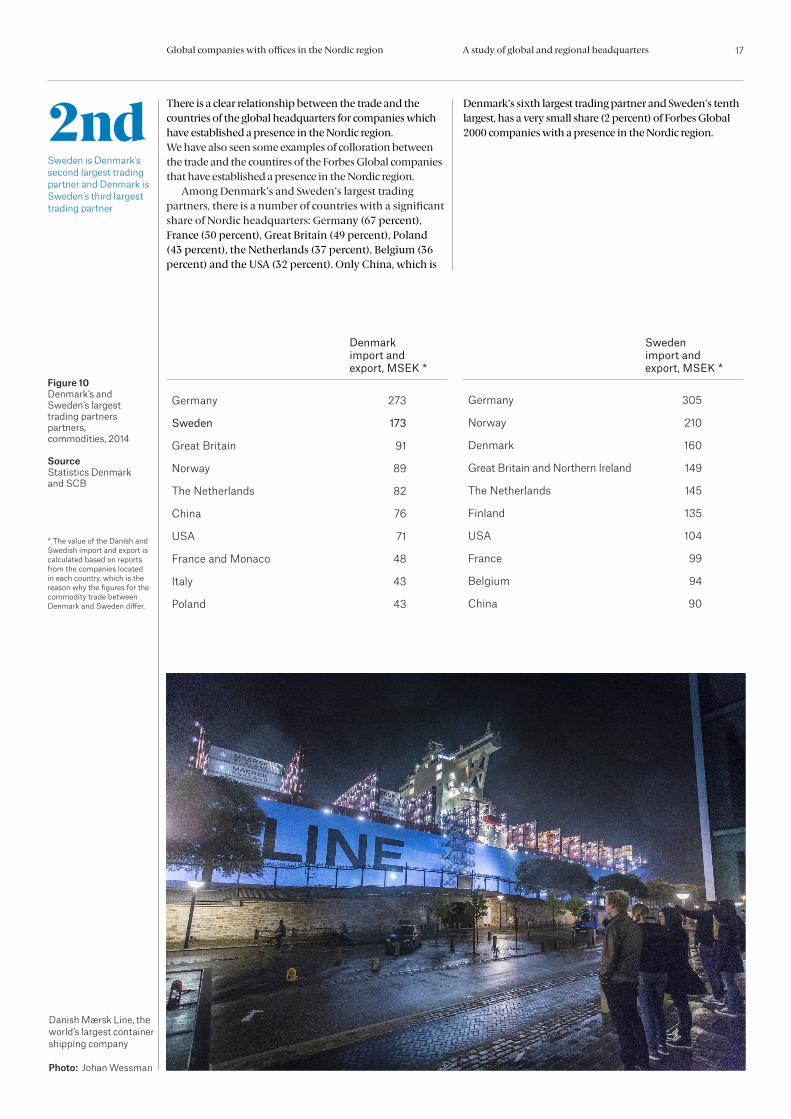
Figure 10 Denmark’s andSweden’s largest trading partners partners, commodities, 2014
SourceStatistics Denmark and SCB
* The value of the Danish and Swedish import and export is calculated based on reports from the companies located in each country, which is the reason why the figures for the commodity trade between Denmark and Sweden differ.
Denmarkimport and export, MSEK *
Germany 273
Sweden 173
Great Britain 91
Norway 89
The Netherlands 82
China 76
USA 71
France and Monaco 48
Italy 43
Poland 43
Swedenimport and export, MSEK *
Germany 305
Norway 210
Denmark 160
Great Britain and Northern Ireland 149
The Netherlands 145
Finland 135
USA 104
France 99
Belgium 94
China 90
2ndSweden is Denmark’s second largest trading partner and Denmark is Sweden’s third largest trading partner
There is a clear relationship between the trade and the countries of the global headquarters for companies which have established a presence in the Nordic region. We have also seen some examples of colloration between the trade and the countires of the Forbes Global companies that have established a presence in the Nordic region. Among Denmark’s and Sweden’s largest trading partners, there is a number of countries with a significant share of Nordic headquarters: Germany (67 percent), France (50 percent), Great Britain (49 percent), Poland (43 percent), the Netherlands (37 percent), Belgium (36 percent) and the USA (32 percent). Only China, which is
Denmark’s sixth largest trading partner and Sweden’s tenth largest, has a very small share (2 percent) of Forbes Global 2000 companies with a presence in the Nordic region.
Danish Mærsk Line, the world’s largest container shipping company
Photo: Johan Wessman

18A study of global and regional headquartersGlobal companies with offices in the Nordic region
05.
Among the 510 Global 2000 companies, which have an office in the Nordic region, we find that about 70 percent of them are active in the
following industries, according to Forbes own industry classification (Figure 10):
Consumer Goods and Services: media companies, consumer services companies, consumer goods, clothing, and automotive and components companies. Examples include H&M, BMW, Autoliv, Adecco, Western Union, Thomas Cook, Whirlpool, etc.
Consumablesconsists of companies whose primary lines of business are food, beverages, tobacco and other household products. Examples include Carlsberg, ICA gruppen, Kesko, Pandora.
Industrial Goods and Services: consists of companies that sell industrial or commercial goods and services, or are engaged in the production of industrial or commercial goods, diversified trade,
distribution operations or logistics, and communications. Examples of companies include ABB, NCC, 3M, Boeing, Caterpillar, Komatsu, and similar etc.
Information Technology: refers to companies focusing on the manufacturing of electronic components, development of software pro-grams, computers, or products and services in informa-tion technology. Examples include Nokia, TDC, Ericsson, Teliasonera.
Financial services: consists of banks and similar financial institutions, investment funds, insurance companies and real estate companies. Examples include Nordea, Danske Bank, Industrivarden, SEB, Sampoö. Health and Medical Care: Refers primarily to companies within the fields of biotech-nology, pharmaceutical and medical technology. Examples include Coloplast, Novozymes and Novo Nordisk.
Figure 11 Regional headquarters in the Nordic region for companies on the Forbes Global 2000 list, according to Forbes’ division of industries
SourceForbes, ORBIS database, Eurostat, Stockholm Business Region (SBR) & The Øresund Institute
Industry Total no. ofcompanies
No RHQ Total no. of RHQs
No. of RHQs (%) Denmark
No. of RHQs (%)
Finland
No. of RHQs (%)
Norway
No. of RHQs (%)
Sweden
Consumer goods and services 83 41 42 6 (14.3) 0 (0) 1 (2.4) 35 (83.3)
Consumables 45 17 28 10 (35.7) 3 (10.7) 2 (7.1) 13 (46.4)
Energy 33 25 8 1 (12.5) 2 (25) 4 (50) 1 (12.5)
Financial services 57 27 30 5 (16.7) 2 (6.7) 5 (16.7) 18 (60)
Health and medical care 53 19 34 8 (23.5) 0 (0) 0 (0) 26 (76.5)
Industrial goods and services 92 49 43 9 (20.9) 5 (11.6) 3 (7) 26 (60.5)
Information technology 74 45 29 4 (13.8) 2 (6.9) 0 (0) 23 (79.3)
Materials 51 25 26 6 (23.1) 5.5 (21.2) 3 (11.5) 11.5 (44.2)
Telecommunica-tions 14 7 7 1 (14.3) 1 (14.3) 1 (14.3) 4 (57.1)
Public services 8 5 3 0 (0) 1 (33.3) 0 (0) 2 (66.7)
Total 510 260 250 50 (20) 21.5 (8.6) 19 (7.6) 159.5 (63.8)
60–80%of RHQs in 6 out of 10 industries establish in Sweden
Industry sectors of Forbes Global 2000 companies in the Nordic region
19A study of global and regional headquartersGlobal companies with offices in the Nordic region
Figure 12 Regional headquarters in the Nordic region for companies on the Forbes Global 2000 list, according to Forbes industry classification for large cities
SourceForbes, ORBIS database, Eurostat, Stockholm Business Region (SBR) & The Øresund Institute
Industry Total no. of com-
panies
No RHQ
Total no. of RHQs
No. of RHQs (%)
Copenhagen
No. of RHQs (%)
Helsinki
No. of RHQs
(%) Oslo
No. of RHQs (%)
Stockholm
Total percentage3
Consumer goods and services
83 41 42 5 (11.9) 0 (0) 1 (2.4) 29 (69) 83.3
Consumables 45 17 28 9 (32.1) 2 (7.1) 2 (7.1) 10 (35.7) 82.1
Energy 33 25 8 1 (12.5) 2 (25) 1 (12.5) 1 (12.5) 62.5
Financial services 57 27 30 4 (13.3) 2 (6.7) 5 (16.7) 18 (60) 96.7
Health and medical care 53 19 34 8 (23.5) 0 (0) 0 (0) 20 (58.8) 82.4
Industrial goods and services 92 49 43 4 (9.3) 5 (11.6) 3 (7.0) 17 (39.5) 67.4
Information technology 74 45 29 4 (13.8) 2 (6.9) 0 (0) 22 (75.9) 96.6
Materials 51 25 26 5 (19.2) 4 (15.4) 2 (7.7) 3 (11.5) 53.8
Telecommuni-cations 14 7 7 1 (14.3) 1 (14.3) 1 (14.3) 4 (57.1) 100.0
Public services 8 5 3 0 (0) 1 (33.3) 0 (0) 1 (33.3) 66.7
Total 510 260 250 41 (16) 19 (7.6) 15 (6) 125 (50) 79.6
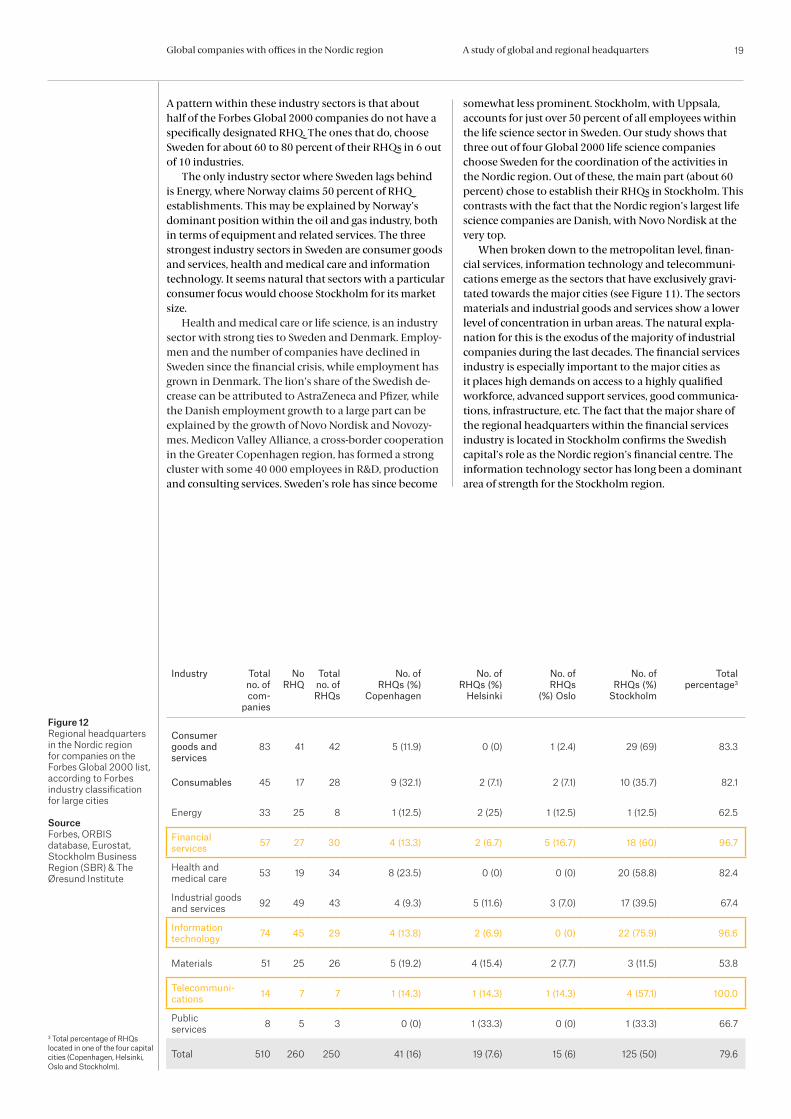
A pattern within these industry sectors is that about half of the Forbes Global 2000 companies do not have a specifically designated RHQ. The ones that do, choose Sweden for about 60 to 80 percent of their RHQs in 6 out of 10 industries. The only industry sector where Sweden lags behind is Energy, where Norway claims 50 percent of RHQ establishments. This may be explained by Norway’s dominant position within the oil and gas industry, both in terms of equipment and related services. The three strongest industry sectors in Sweden are consumer goods and services, health and medical care and information technology. It seems natural that sectors with a particular consumer focus would choose Stockholm for its market size. Health and medical care or life science, is an industry sector with strong ties to Sweden and Denmark. Employ-men and the number of companies have declined in Sweden since the financial crisis, while employment has grown in Denmark. The lion’s share of the Swedish de-crease can be attributed to AstraZeneca and Pfizer, while the Danish employment growth to a large part can be explained by the growth of Novo Nordisk and Novozy-mes. Medicon Valley Alliance, a cross-border cooperation in the Greater Copenhagen region, has formed a strong cluster with some 40 000 employees in R&D, production and consulting services. Sweden’s role has since become
somewhat less prominent. Stockholm, with Uppsala, accounts for just over 50 percent of all employees within the life science sector in Sweden. Our study shows that three out of four Global 2000 life science companies choose Sweden for the coordination of the activities in the Nordic region. Out of these, the main part (about 60 percent) chose to establish their RHQs in Stockholm. This contrasts with the fact that the Nordic region’s largest life science companies are Danish, with Novo Nordisk at the very top. When broken down to the metropolitan level, finan-cial services, information technology and telecommuni-cations emerge as the sectors that have exclusively gravi-tated towards the major cities (see Figure 11). The sectors materials and industrial goods and services show a lower level of concentration in urban areas. The natural expla-nation for this is the exodus of the majority of industrial companies during the last decades. The financial services industry is especially important to the major cities as it places high demands on access to a highly qualified workforce, advanced support services, good communica-tions, infrastructure, etc. The fact that the major share of the regional headquarters within the financial services industry is located in Stockholm confirms the Swedish capital’s role as the Nordic region’s financial centre. The information technology sector has long been a dominant area of strength for the Stockholm region.
3 Total percentage of RHQs located in one of the four capital cities (Copenhagen, Helsinki, Oslo and Stockholm).
20A study of global and regional headquartersGlobal companies with offices in the Nordic region
Further studies06.
During the course of the study, we have seen examples which may indicate that the trend is moving from Nordic headquarters towards Nort-
hern European headquarters, which means that Stock-holm and Copenhagen face competition from, among others, Amsterdam, Berlin and Hamburg. Denmark and Sweden have only occasionally mana-ged to entice Chinese companies from the Forbes Global 2000 list to establish regional Nordic headquarters. This in spite of the fact that China has more than doubled the number of companies on the Forbes list since 2008 – from 70 to 180. The studies that we have made should be followed up with some regularity in order to identify trends and structural changes over time. It would also be desirable to expand the study to also include companies that meet the criteria used for the Forbes Global 2000 list, but that are not publicly held.
In addition to this, the next version of the study could identify current issues for more in-depth studies. For example, the following questions are interesting:
What challenges have the companies that already have RHQs in the Nordic encountered and what kind of sup-port is needed to aid in their continued expansion in the Nordic region?
How do we entice global companies to set up their nort-hern headquarters in the Nordic region?
How can we get the Chinese global companies to look towards the Nordic region when they are constantly cour-ted by all the economies of the world?
Photo: Yanan Li

21A study of global and regional headquartersGlobal companies with offices in the Nordic region
Data source and data processing
The companies on the Forbes Global 2000 list have been imported as input data to the ORBIS database, in order to identify the companies’ ownership structure, with a main focus on the Nordic region.
Those companies which have at least 50 percent ownership of subsidiaries in the Nordic region, were imported to the ODIN database an additional time, in order to extract detailed business infor-mation such as number of employees, turnover, industry sector, ownership, etc.
Procedure Step 1 – Basic research The information compiled from the ORBIS and
ODIN databases provides an initial indication of a company’s geographical presence in the Nordic region. Internet searches are also included in step 1 in order to form an idea about the extent of the company’s business operations in the Nordic region.
Step 2 – Verification IWhen it’s clearly stated on the company’s official website that the company’s function matches our definition of regional headquarters, this informa-tion is deemed adequate and reliable enough to be used in the study.
If not, the next step is to make contact with indi-viduals who have a good insight into the company structure both domestically and internationally. The CEO, CFO or Corporate Communications Director are the most common titles that our questions would be put to.
Step 3 – Verification IIThose companies, whose contact person(s) have not been reachable after a few attempts by te-lephone, have received an additional mailing with some background information and the questions.
The results are based on both direct and indirect responses from 48 companies, since we have not been able to reach 12 of the 498 companies at the time of writing. The remaining companies (12) we have thus not been able to contact either by e-mail or by telephone after a number of repeated attempts. The information about their regional headquarters has not appeared clearly in other media during the course of the study. These com-panies are assumed to have no active operations in the Nordic region and are assigned to the category of companies that have no specific regional head offices in the Nordic region.
The American business magazine Forbes is well known for its lists, including their Global 2000 list of the world’s largest listed companies. The list is published annually, with the latest list from February 2015.
Forbes Global 2000 list is compiled using data from FactSet Research Systems, which screeens the largest listed companies, using four parame-
ters: sales, profits, assets and market value. The market value is based on closing prices as of April 6, 2015.
All figures are converted into US dollars. For each of the areas of sales, profits, assets and market value, a minimum value is set for the company to qualify: sales of 4.16 billion US dollars, a profit of 267 billion US dollars, assets of 8.57 billion US dol-
lars and a market value of 5.49 billion US dollars. A company must qualify for at least one of the lists in order to qualify for a spot on the final Global 2000 ranking.
Read more about the methodology behind the Forbes Global 2000 list: http://www.forbes.com/sites/andreamurphy/2015/05/06/2015-glo-bal-2000-methodology/
Facts on the Forbes Global 2000 list
Definition of regional headquarters
‘Headquarters are defined as control centres that provides the company with services in management, finance, accounting, marketing, HR, IT, and legal assistance. The fundamental role of regional headquarters is to manage activities between companies of a group of national subsidiaries, and thus have a leading position in the organization.’Based on this definition, the following questions have been formulated in our contact with relevant companies in order to determine its role and function in the context.
What is included in your activities in the Nordic region? Is there any function akin to a ’shared
service centre’ (comprehensive management of IT, HR, finance, etc.) in the Nordic countries?
Is there a Nordic or regional headquarters (RHQ) that coordinates the business activities between the companies in the Nordic countries? What reporting structure is used between your RHQ and your European HQ (EHQ) or your global HQ (GHQ)? Where is your EHQ?
Which company among your Nordic companies have decision-making powers to, for example, implement business strategies at the Nordic level? Is the CEO of this company included in the executive committee at EHQ or GHQ level? Where is the Managing Director based in the Nordic region?
If there is an RHQ, why did you choose (Stockholm / Helsinki / Copenhagen / Oslo) for your regional headquarters?
Scope and limitations
This study has a pronounced Nordic focus, that is, only those companies that have some kind of physical presence in the Nordic region are subject for further studies. It should also be clarified that the Nordic presence in this context requires that the parent company has at least 50 percent or more ownership of the local, Nordic company, in order to be regarded as having a presence in the Nordic region.
This is what we have done
Our methodology
Sweden & Finland
Gyttorp, Ori-Mattila Orica Limited 1319 Australia Diversified Metals & Mining
Sweden Stockholm BP PLC 17 United Kingdom Oil & Gas Operations
Samsung Electronics Co.,Ltd. 22 Republic of Korea Semiconductors
International Business Machi-nes Corp 35 United States of America Computer Services
Procter & Gamble CO 40 United States of America Household/Personal Care
Johnson & Johnson 41 United States of America Medical Equipment & Supplies
BMW Group 48 Germany Auto & Truck Manufacturers
Siemens AG 53 Germany Conglomerates
Novartis AG 54 Switzerland Pharmaceuticals
General Motors Company 67 United States of America Auto & Truck Manufacturers
Hewlett-Packard Company 80 United States of America Computer Hardware
Credit Agricole S.A. 89 France Major Banks
American Express Company 104 United States of America Consumer Financial Services
Morgan Stanley 106 United States of America Investment Services
Unilever N.V. 110 Netherlands Food Processing
Nordea Bank AB (Publ) 119 Sweden Regional Banks
Aviva PLC 143 United Kingdom Life & Health Insurance
Mondelez International, Inc. 148 United States of America Food Processing
Deutsche Post AG 163 Germany Air Courier
Amgen Incorporated 170 United States of America Biotechs
Astrazeneca PLC 183 United Kingdom Pharmaceuticals
3M Company 194 United States of America Conglomerates
BT Group PLC 218 United Kingdom Telecommunications services
Telefonaktiebolaget LM Ericsson 235 Sweden Communications Equipment
Danone 242 France Food Processing
Panasonic Corporation 246 Japan Consumer Electronics
Natixis 251 France Major Banks
Bristol-Myers Squibb Company 257 United States of America Pharmaceuticals
Skandinaviska Enskilda Banken AB 259 Sweden Regional Banks
Linde AG 275 Germany Diversified Chemicals
Svenska Handelsbanken 289 Sweden Major Banks
Koninklijke Philips 296 Netherlands Conglomerates
Swedbank AB 296 Sweden Major Banks
RHQ Country RHQ City Company Forbes Ranking Country of Origin Industry Forbes 2014
(1:6)
Stockholm
22A study of global and regional headquartersGlobal companies with offices in the Nordic region
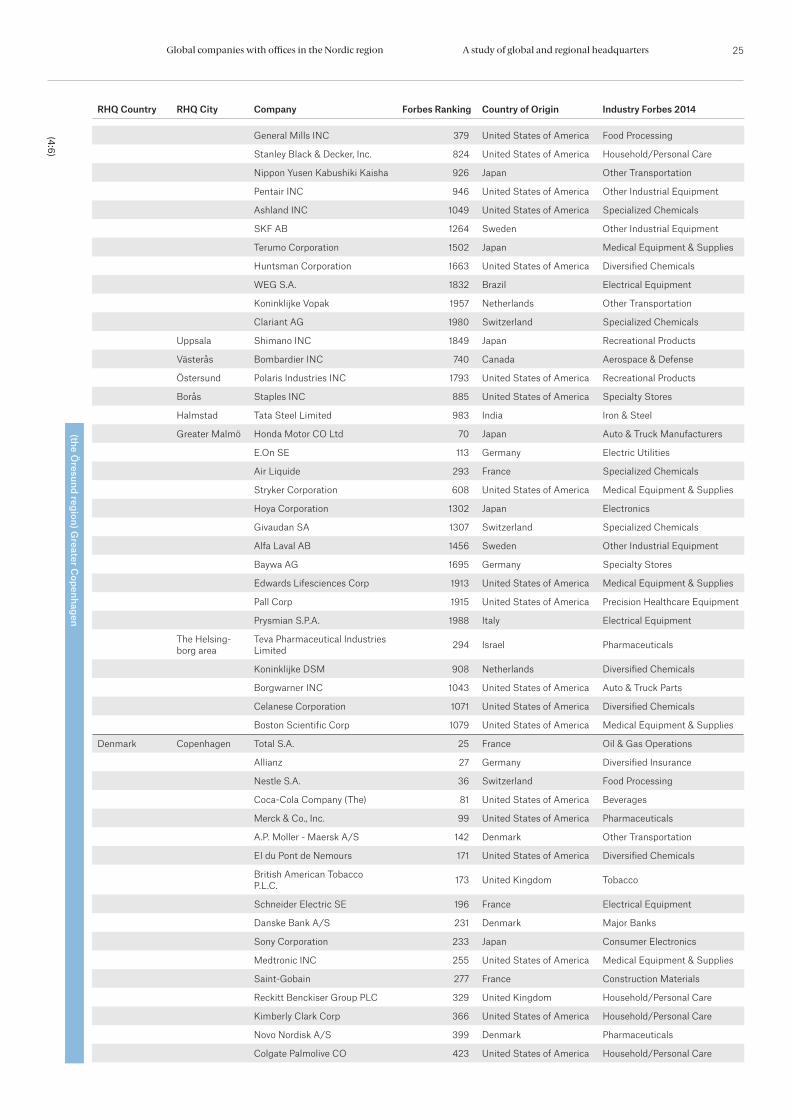
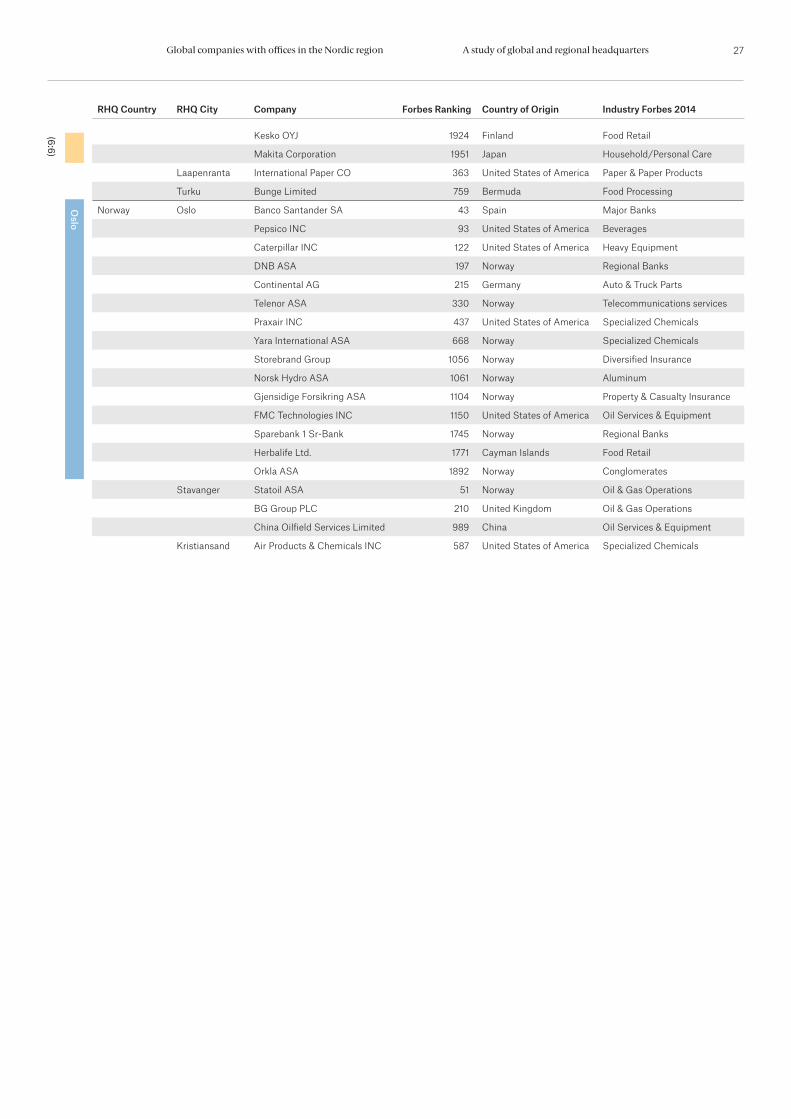
Appendix 07.
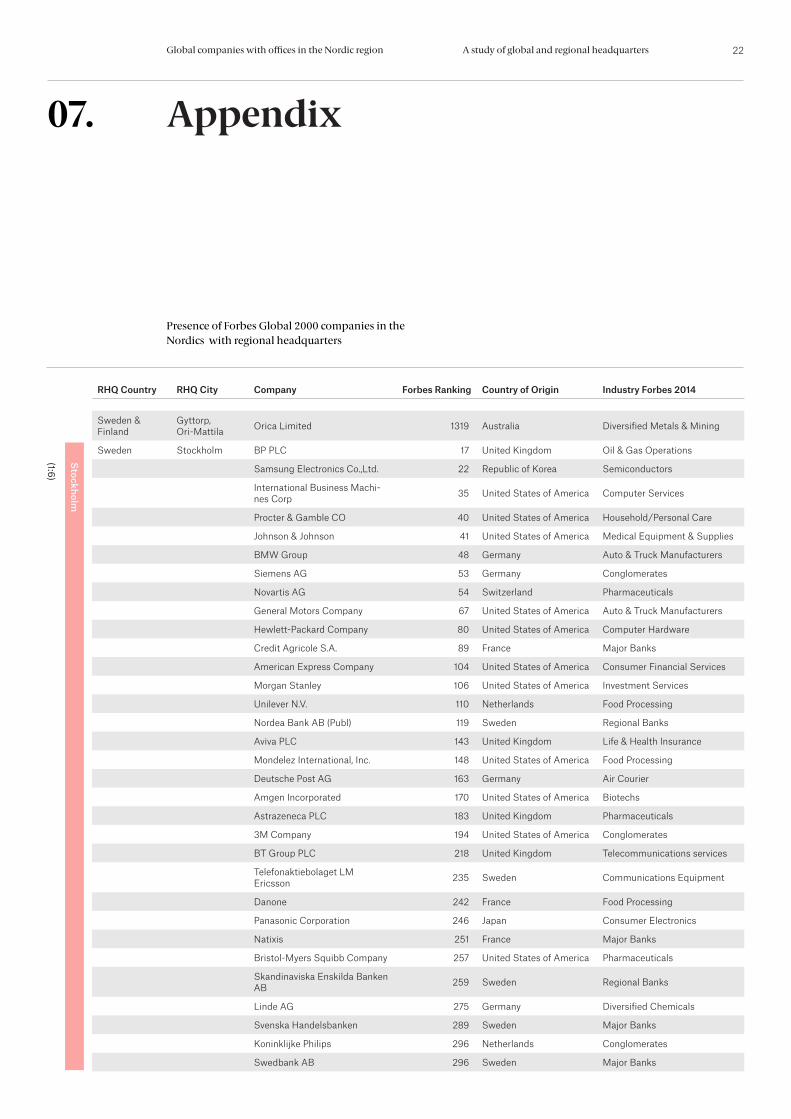
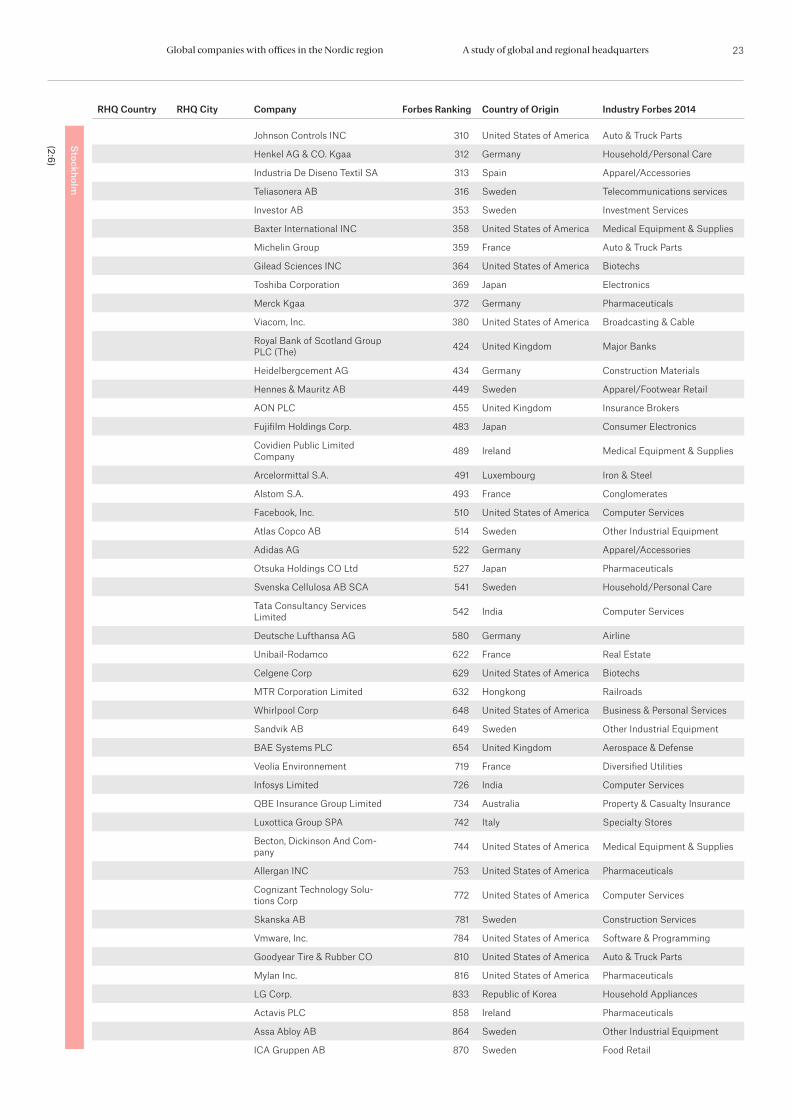
Presence of Forbes Global 2000 companies in the Nordics with regional headquarters
Johnson Controls INC 310 United States of America Auto & Truck Parts
Henkel AG & CO. Kgaa 312 Germany Household/Personal Care
Industria De Diseno Textil SA 313 Spain Apparel/Accessories
Teliasonera AB 316 Sweden Telecommunications services
Investor AB 353 Sweden Investment Services
Baxter International INC 358 United States of America Medical Equipment & Supplies
Michelin Group 359 France Auto & Truck Parts
Gilead Sciences INC 364 United States of America Biotechs
Toshiba Corporation 369 Japan Electronics
Merck Kgaa 372 Germany Pharmaceuticals
Viacom, Inc. 380 United States of America Broadcasting & Cable
Royal Bank of Scotland Group PLC (The) 424 United Kingdom Major Banks
Heidelbergcement AG 434 Germany Construction Materials
Hennes & Mauritz AB 449 Sweden Apparel/Footwear Retail
AON PLC 455 United Kingdom Insurance Brokers
Fujifilm Holdings Corp. 483 Japan Consumer Electronics
Covidien Public Limited Company 489 Ireland Medical Equipment & Supplies
Arcelormittal S.A. 491 Luxembourg Iron & Steel
Alstom S.A. 493 France Conglomerates
Facebook, Inc. 510 United States of America Computer Services
Atlas Copco AB 514 Sweden Other Industrial Equipment
Adidas AG 522 Germany Apparel/Accessories
Otsuka Holdings CO Ltd 527 Japan Pharmaceuticals
Svenska Cellulosa AB SCA 541 Sweden Household/Personal Care
Tata Consultancy Services Limited 542 India Computer Services
Deutsche Lufthansa AG 580 Germany Airline
Unibail-Rodamco 622 France Real Estate
Celgene Corp 629 United States of America Biotechs
MTR Corporation Limited 632 Hongkong Railroads
Whirlpool Corp 648 United States of America Business & Personal Services
Sandvik AB 649 Sweden Other Industrial Equipment
BAE Systems PLC 654 United Kingdom Aerospace & Defense
Veolia Environnement 719 France Diversified Utilities
Infosys Limited 726 India Computer Services
QBE Insurance Group Limited 734 Australia Property & Casualty Insurance
Luxottica Group SPA 742 Italy Specialty Stores
Becton, Dickinson And Com-pany 744 United States of America Medical Equipment & Supplies
Allergan INC 753 United States of America Pharmaceuticals
Cognizant Technology Solu-tions Corp 772 United States of America Computer Services
Skanska AB 781 Sweden Construction Services
Vmware, Inc. 784 United States of America Software & Programming
Goodyear Tire & Rubber CO 810 United States of America Auto & Truck Parts
Mylan Inc. 816 United States of America Pharmaceuticals
LG Corp. 833 Republic of Korea Household Appliances
Actavis PLC 858 Ireland Pharmaceuticals
Assa Abloy AB 864 Sweden Other Industrial Equipment
ICA Gruppen AB 870 Sweden Food Retail
RHQ Country RHQ City Company Forbes Ranking Country of Origin Industry Forbes 2014
Stockholm
(2:6)
23A study of global and regional headquartersGlobal companies with offices in the Nordic region
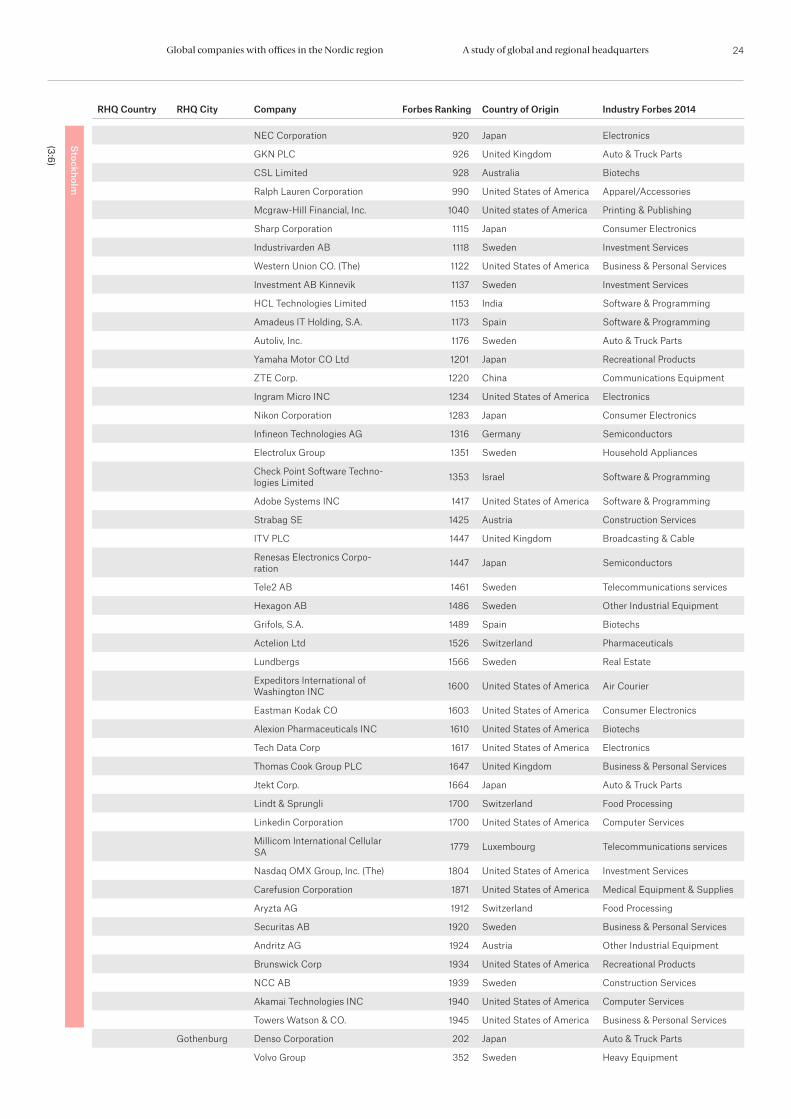
RHQ Country RHQ City Company Forbes Ranking Country of Origin Industry Forbes 2014
NEC Corporation 920 Japan Electronics
GKN PLC 926 United Kingdom Auto & Truck Parts
CSL Limited 928 Australia Biotechs
Ralph Lauren Corporation 990 United States of America Apparel/Accessories
Mcgraw-Hill Financial, Inc. 1040 United states of America Printing & Publishing
Sharp Corporation 1115 Japan Consumer Electronics
Industrivarden AB 1118 Sweden Investment Services
Western Union CO. (The) 1122 United States of America Business & Personal Services
Investment AB Kinnevik 1137 Sweden Investment Services
HCL Technologies Limited 1153 India Software & Programming
Amadeus IT Holding, S.A. 1173 Spain Software & Programming
Autoliv, Inc. 1176 Sweden Auto & Truck Parts
Yamaha Motor CO Ltd 1201 Japan Recreational Products
ZTE Corp. 1220 China Communications Equipment
Ingram Micro INC 1234 United States of America Electronics
Nikon Corporation 1283 Japan Consumer Electronics
Infineon Technologies AG 1316 Germany Semiconductors
Electrolux Group 1351 Sweden Household Appliances
Check Point Software Techno-logies Limited 1353 Israel Software & Programming
Adobe Systems INC 1417 United States of America Software & Programming
Strabag SE 1425 Austria Construction Services
ITV PLC 1447 United Kingdom Broadcasting & Cable
Renesas Electronics Corpo-ration 1447 Japan Semiconductors
Tele2 AB 1461 Sweden Telecommunications services
Hexagon AB 1486 Sweden Other Industrial Equipment
Grifols, S.A. 1489 Spain Biotechs
Actelion Ltd 1526 Switzerland Pharmaceuticals
Lundbergs 1566 Sweden Real Estate
Expeditors International of Washington INC 1600 United States of America Air Courier
Eastman Kodak CO 1603 United States of America Consumer Electronics
Alexion Pharmaceuticals INC 1610 United States of America Biotechs
Tech Data Corp 1617 United States of America Electronics
Thomas Cook Group PLC 1647 United Kingdom Business & Personal Services
Jtekt Corp. 1664 Japan Auto & Truck Parts
Lindt & Sprungli 1700 Switzerland Food Processing
Linkedin Corporation 1700 United States of America Computer Services
Millicom International Cellular SA 1779 Luxembourg Telecommunications services
Nasdaq OMX Group, Inc. (The) 1804 United States of America Investment Services
Carefusion Corporation 1871 United States of America Medical Equipment & Supplies
Aryzta AG 1912 Switzerland Food Processing
Securitas AB 1920 Sweden Business & Personal Services
Andritz AG 1924 Austria Other Industrial Equipment
Brunswick Corp 1934 United States of America Recreational Products
NCC AB 1939 Sweden Construction Services
Akamai Technologies INC 1940 United States of America Computer Services
Towers Watson & CO. 1945 United States of America Business & Personal Services
Gothenburg Denso Corporation 202 Japan Auto & Truck Parts
Volvo Group 352 Sweden Heavy Equipment
(3:6)
Stockholm
24A study of global and regional headquartersGlobal companies with offices in the Nordic region
RHQ Country RHQ City Company Forbes Ranking Country of Origin Industry Forbes 2014
General Mills INC 379 United States of America Food Processing
Stanley Black & Decker, Inc. 824 United States of America Household/Personal Care
Nippon Yusen Kabushiki Kaisha 926 Japan Other Transportation
Pentair INC 946 United States of America Other Industrial Equipment
Ashland INC 1049 United States of America Specialized Chemicals
SKF AB 1264 Sweden Other Industrial Equipment
Terumo Corporation 1502 Japan Medical Equipment & Supplies
Huntsman Corporation 1663 United States of America Diversified Chemicals
WEG S.A. 1832 Brazil Electrical Equipment
Koninklijke Vopak 1957 Netherlands Other Transportation
Clariant AG 1980 Switzerland Specialized Chemicals
Uppsala Shimano INC 1849 Japan Recreational Products
Västerås Bombardier INC 740 Canada Aerospace & Defense
Östersund Polaris Industries INC 1793 United States of America Recreational Products
Borås Staples INC 885 United States of America Specialty Stores
Halmstad Tata Steel Limited 983 India Iron & Steel
Greater Malmö Honda Motor CO Ltd 70 Japan Auto & Truck Manufacturers
E.On SE 113 Germany Electric Utilities
Air Liquide 293 France Specialized Chemicals
Stryker Corporation 608 United States of America Medical Equipment & Supplies
Hoya Corporation 1302 Japan Electronics
Givaudan SA 1307 Switzerland Specialized Chemicals
Alfa Laval AB 1456 Sweden Other Industrial Equipment
Baywa AG 1695 Germany Specialty Stores
Edwards Lifesciences Corp 1913 United States of America Medical Equipment & Supplies
Pall Corp 1915 United States of America Precision Healthcare Equipment
Prysmian S.P.A. 1988 Italy Electrical Equipment
The Helsing-borg area
Teva Pharmaceutical Industries Limited 294 Israel Pharmaceuticals
Koninklijke DSM 908 Netherlands Diversified Chemicals
Borgwarner INC 1043 United States of America Auto & Truck Parts
Celanese Corporation 1071 United States of America Diversified Chemicals
Boston Scientific Corp 1079 United States of America Medical Equipment & Supplies
Denmark Copenhagen Total S.A. 25 France Oil & Gas Operations
Allianz 27 Germany Diversified Insurance
Nestle S.A. 36 Switzerland Food Processing
Coca-Cola Company (The) 81 United States of America Beverages
Merck & Co., Inc. 99 United States of America Pharmaceuticals
A.P. Moller - Maersk A/S 142 Denmark Other Transportation
EI du Pont de Nemours 171 United States of America Diversified Chemicals
British American Tobacco P.L.C. 173 United Kingdom Tobacco
Schneider Electric SE 196 France Electrical Equipment
Danske Bank A/S 231 Denmark Major Banks
Sony Corporation 233 Japan Consumer Electronics
Medtronic INC 255 United States of America Medical Equipment & Supplies
Saint-Gobain 277 France Construction Materials
Reckitt Benckiser Group PLC 329 United Kingdom Household/Personal Care
Kimberly Clark Corp 366 United States of America Household/Personal Care
Novo Nordisk A/S 399 Denmark Pharmaceuticals
Colgate Palmolive CO 423 United States of America Household/Personal Care
(4:6)
(the Öresund region) G
reater Copenhagen
25A study of global and regional headquartersGlobal companies with offices in the Nordic region

RHQ Country RHQ City Company Forbes Ranking Country of Origin Industry Forbes 2014
PPG Industries INC 440 United States of America Diversified Chemicals
Carlsberg A/S 565 Denmark Beverages
Astellas Pharma Inc. 615 Japan Pharmaceuticals
V. F. Corporation 658 United States of America Apparel/Accessories
Wolseley PLC 731 United Kingdom Construction Materials
Solvay SA 737 Belgium Diversified Chemicals
Symantec Corp 848 United States of America Software & Programming
Essilor International SA 863 France Medical Equipment & Supplies
Beiersdorf AG 895 Germany Household/Personal Care
Computer Sciences Corp 896 United States of America Computer Services
DAI Nippon Printing CO Ltd 1160 Japan Printing & Publishing
Coloplast A/S 1353 Denmark Medical Equipment & Supplies
Garmin Ltd. 1407 Switzerland Consumer Electronics
TDC A/S 1451 Denmark Telecommunications services
Jyske Bank A/S (Group) 1517 Denmark Regional Banks
ISS A/S 1552 Denmark Security Systems
Novozymes A/S 1554 Denmark Pharmaceuticals
K+S Aktiengesellschaft 1592 Germany Diversified Chemicals
NCR Corp 1635 United States of America Computer Hardware
Waters Corp 1665 United States of America Precision Healthcare Equipment
Hugo Boss AG 1690 Germany Apparel/Accessories
Citrix Systems INC 1793 United States of America Software & Programming
Pandora A/S 1840 Denmark Household/Personal Care
Icap PLC 1878 United Kingdom Real Estate
Region Zealand CH Robinson Worldwide 1227 United States of America Other Transportation
World Fuel Services Corp 1545 United States of America Specialty Stores
DSV 1916 Denmark Trucking
Silkeborg Illinois Tool Works INC 415 United States of America Other Industrial Equipment
Umicore 1736 Belgium Diversified Metals & Mining
Esbjerg Charoen Pokphand Foods PCL 1414 Thailand Food Processing
Århus Vestas Wind Systems A/S 1574 Denmark Electrical Equipment
Aabenraa Sydbank A/S 1963 Denmark Regional Banks
Aalborg OW Bunker A/S 1768 Denmark Other Transportation
Finland Helsinki Bayer AG 120 Germany Diversified Chemicals
Sampo PLC 408 Finland Diversified Insurance
Swisscom AG 427 Switzerland Telecommunications services
Fortum OYJ 513 Finland Electric Utilities
Toyota Tsusho Corporation 516 Japan Trading Companies
Nokia OYJ 631 Finland Communications Equipment
Upm-Kymmene OYJ 829 Finland Paper & Paper Products
Kone OYJ 836 Finland Construction Services
Pohjola Bank PLC 1015 Finland Regional Banks
Neste Oil OYJ 1034 Finland Oil & Gas Operations
Stora Enso OYJ 1081 Finland Paper & Paper Products
Wartsila OYJ 1240 Finland Heavy Equipment
Ojsc Inter RAO UES 1324 Russian Federation Oil & Gas Operations
Metso OYJ 1577 Finland Other Industrial Equipment
Koninklijke Boskalis (Royal Bokalis) 1722 Netherlands Construction Services
Outokumpu OYJ 1793 Finland Iron & Steel
Gemalto N.V. 1816 Netherlands Electronics
(5:6) (the Öresund region) G
reater Copenhagen
Helsinki
26A study of global and regional headquartersGlobal companies with offices in the Nordic region
RHQ Country RHQ City Company Forbes Ranking Country of Origin Industry Forbes 2014
Kesko OYJ 1924 Finland Food Retail
Makita Corporation 1951 Japan Household/Personal Care
Laapenranta International Paper CO 363 United States of America Paper & Paper Products
Turku Bunge Limited 759 Bermuda Food Processing
Norway Oslo Banco Santander SA 43 Spain Major Banks
Pepsico INC 93 United States of America Beverages
Caterpillar INC 122 United States of America Heavy Equipment
DNB ASA 197 Norway Regional Banks
Continental AG 215 Germany Auto & Truck Parts
Telenor ASA 330 Norway Telecommunications services
Praxair INC 437 United States of America Specialized Chemicals
Yara International ASA 668 Norway Specialized Chemicals
Storebrand Group 1056 Norway Diversified Insurance
Norsk Hydro ASA 1061 Norway Aluminum
Gjensidige Forsikring ASA 1104 Norway Property & Casualty Insurance
FMC Technologies INC 1150 United States of America Oil Services & Equipment
Sparebank 1 Sr-Bank 1745 Norway Regional Banks
Herbalife Ltd. 1771 Cayman Islands Food Retail
Orkla ASA 1892 Norway Conglomerates
Stavanger Statoil ASA 51 Norway Oil & Gas Operations
BG Group PLC 210 United Kingdom Oil & Gas Operations
China Oilfield Services Limited 989 China Oil Services & Equipment
Kristiansand Air Products & Chemicals INC 587 United States of America Specialized Chemicals
(6:6)
Oslo
27A study of global and regional headquartersGlobal companies with offices in the Nordic region