Global Commodities - fullertreacymoney.com · or (more likely) in China, permitting a cobalt...
26
Global Commodities Colin Hamilton Analyst [email protected] +44 (0)20 7664 8172 Kash Kamal, CFA [email protected] +44 (0)20 7664 5352 Legal Entity: BMO Capital Markets Limited Summary • We view cobalt as a supply-constrained market into the medium term. • To put the cobalt market in simple terms, it is the power axis of DRC mining - China refining - battery demand. • In order to make space for EV demand, we have to substitute aggressively in other cobalt end uses. • Battery recycling must increase dramatically in the coming years to permit enhanced cobalt recovery. • In all scenarios we can envision, the cobalt price goes higher. Recent BMO Commodity-Related Research • Launching at BMO: Base Metals and Bulk Commodity Outlook • Lithium Recharge: Driving to Multi-Decade Thematic • Thermal Coal: Leveraging the Asian Industrial Cycle • Metals & Mining : 2017's Production Shortfalls - A Sign of More to Come? December 04, 2017 | 16:22 ET | 01:00 ET~ Global Commodities Bottom Line: Cobalt looks set to be the main constraint on battery market growth. Even without a rise in electric vehicle demand we foresee a tight market, while overreliance on the Democratic Republic of Congo on the supply side cannot be avoided. We expect aggressive substitution and scrap recovery over the coming years, but not before further price gains. A doubling of the cobalt spot price over the coming couple of years is not out the question, while we raise our long term price to $22.5/lb. Key Points Battery-powered growth. While other commodities are growing their share of consumption through batteries, cobalt has been down this path already. Around 55% of cobalt is already going into rechargeable batteries, compared to lithium’s ~40% and nickel’s ~5%, which has resulted in industry-leading trend demand growth of 6.1% CAGR since 2010. Even without EV demand, cobalt is a tight market. Add the expected EV demand into the mix, where we model 10% penetration in 2025, and we have a major problem. Without demand adjustment through substitution and thrifting, we would foresee a 60% rise in cobalt demand to 2025. However, there is simply not enough supply potential to match this. Moreover, cobalt cannot escape the overreliance on the Democratic Republic of Congo (DRC), which accounts for 60% of mined cobalt units currently and ~85% of industry supply growth over the coming five years. Indeed, around half of the cobalt produced globally is mined in the DRC and refined in China. The DRC-China Chemical-Battery power axis has become increasingly dominant over recent years. More aggressive substitution and scrap recovery are needed. We have seen some estimations of significant deficits in the cobalt market in the 2020s. That’s simply not the way commodity markets work; they will naturally self-solve to bring supply and demand closer to balance. In the near term, there is some new cobalt supply coming towards commission in the DRC, plus Glencore’s restart of its copperbelt operations. Moreover, we believe existing assets can squeeze out more supply at current prices. Beyond this, to solve the market balance we assume secondary cobalt recovery grows strongly, more than doubling in volume by 2025. We also have to model ongoing substitution in those sectors where there is less inertia to change, notably prosthetics and hard facing products, plus aggressive shifting to lower cobalt cathodes in EVs. In all scenarios we can envision, the cobalt price goes higher. To be clear, we have had to make very aggressive assumptions to bring the cobalt market anywhere near balance. To maximise supply and substitute demand in such a way need a simple catalyst – price. Whether this happens sooner or later, in our view the cobalt price will have to move from the current level of ~$30/lb back towards the 2007 peak of ~$50/ lb in order to initiate the processes needed to address the looming market deficits. We have the annual average cobalt price peaking at $40.5/lb in 2019. Cobalt: Solving for a Supply-Constrained Market This report was prepared by an analyst(s) employed by BMO Capital Markets Limited, authorised and regulated by the Financial Conduct Authority in the UK. The analyst(s) is (are) not registered as a research analyst(s) under FINRA rules. For disclosure statements, including the Analyst Certification, please refer to page(s) 24 to 26.
Transcript of Global Commodities - fullertreacymoney.com · or (more likely) in China, permitting a cobalt...

Global Commodities
Colin Hamilton [email protected]
+44 (0)20 7664 8172
Kash Kamal, [email protected]
+44 (0)20 7664 5352
Legal Entity: BMO Capital Markets Limited
Summary
• We view cobalt as a supply-constrained market into themedium term.
• To put the cobalt market in simple terms, it is the poweraxis of DRC mining - China refining - battery demand.
• In order to make space for EV demand, we have tosubstitute aggressively in other cobalt end uses.
• Battery recycling must increase dramatically in thecoming years to permit enhanced cobalt recovery.
• In all scenarios we can envision, the cobalt price goeshigher.
Recent BMO Commodity-Related Research
• Launching at BMO: Base Metals and Bulk CommodityOutlook
• Lithium Recharge: Driving to Multi-Decade Thematic
• Thermal Coal: Leveraging the Asian Industrial Cycle
• Metals & Mining: 2017's Production Shortfalls - A Signof More to Come?
December 04, 2017 | 16:22 ET | 01:00 ET~ Global Commodities
Bottom Line: Cobalt looks set to be the main constraint on battery market growth.Even without a rise in electric vehicle demand we foresee a tight market, whileoverreliance on the Democratic Republic of Congo on the supply side cannot beavoided. We expect aggressive substitution and scrap recovery over the coming years,but not before further price gains. A doubling of the cobalt spot price over the comingcouple of years is not out the question, while we raise our long term price to $22.5/lb. Key Points Battery-powered growth. While other commodities are growing their share ofconsumption through batteries, cobalt has been down this path already. Around 55%of cobalt is already going into rechargeable batteries, compared to lithium’s ~40% andnickel’s ~5%, which has resulted in industry-leading trend demand growth of 6.1%CAGR since 2010.
Even without EV demand, cobalt is a tight market. Add the expected EV demandinto the mix, where we model 10% penetration in 2025, and we have a major problem.Without demand adjustment through substitution and thrifting, we would foreseea 60% rise in cobalt demand to 2025. However, there is simply not enough supplypotential to match this. Moreover, cobalt cannot escape the overreliance on theDemocratic Republic of Congo (DRC), which accounts for 60% of mined cobalt unitscurrently and ~85% of industry supply growth over the coming five years. Indeed,around half of the cobalt produced globally is mined in the DRC and refined in China.The DRC-China Chemical-Battery power axis has become increasingly dominant overrecent years.
More aggressive substitution and scrap recovery are needed. We have seen someestimations of significant deficits in the cobalt market in the 2020s. That’s simply notthe way commodity markets work; they will naturally self-solve to bring supply anddemand closer to balance. In the near term, there is some new cobalt supply comingtowards commission in the DRC, plus Glencore’s restart of its copperbelt operations.Moreover, we believe existing assets can squeeze out more supply at current prices.Beyond this, to solve the market balance we assume secondary cobalt recovery growsstrongly, more than doubling in volume by 2025. We also have to model ongoingsubstitution in those sectors where there is less inertia to change, notably prostheticsand hard facing products, plus aggressive shifting to lower cobalt cathodes in EVs.
In all scenarios we can envision, the cobalt price goes higher. To be clear, wehave had to make very aggressive assumptions to bring the cobalt market anywherenear balance. To maximise supply and substitute demand in such a way need a simplecatalyst – price. Whether this happens sooner or later, in our view the cobalt price willhave to move from the current level of ~$30/lb back towards the 2007 peak of ~$50/lb in order to initiate the processes needed to address the looming market deficits. Wehave the annual average cobalt price peaking at $40.5/lb in 2019.
Cobalt: Solving for a Supply-Constrained Market
This report was prepared by an analyst(s) employed by BMO Capital Markets Limited, authorised andregulated by the Financial Conduct Authority in the UK. The analyst(s) is (are) not registered as aresearch analyst(s) under FINRA rules.For disclosure statements, including the Analyst Certification, please refer to page(s) 24 to 26.

Key Points to Know About the Cobalt Market
Cobalt Fact Implication
Cobalt has been the best performing metal we cover over the past 12 months
We have started to draw inventory quickly following supply problems
The cobalt market is currently around 100kt in annual market size At current spot prices, this makes cobalt a $6.6bn market
Almost all cobalt is extracted as a by-product or co-product stream Cobalt will rarely justify development of a project on its own, making supply more reliant on other metal prices
Cobalt is traded on the London Metal Exchange This gives an easily accessible reference price to investors; however, the Metal Bulletin 99.8% price is still considered the industry reference
The largest single use of cobalt is in smartphones (not EVs) Cobalt makes up 50-60% of the cathode in the average smartphone, and there is a natural reluctance to substitute this for safety and performance reasons
Only 10% of cobalt is currently consumed in electric vehicle batteries In order to make space for EV demand, we have to substitute aggressively in other cobalt end uses
We currently have a tight cobalt market without EV demand Automakers and battery manufacturers will invest heavily to thrift cobalt in battery chemistry, moving to more nickel-rich compounds
We see cobalt as the biggest potential constraint to EV penetration Even though gaining direct cobalt exposure is difficult, it is crucial to understand this market given the wider implications
China has next to no domestic cobalt resource … There are no active Chinese private sector miners to help alleviate supply issues
… but is ~80% of cobalt chemical production globally We expect Chinese companies to look to secure supply through mining asset purchases, similar to those seen recently
Around 50% of global cobalt units are mined in the DRC then refined in China
To put the cobalt market in simple terms, it is the power axis of DRC mining - China refining - battery demand
Cobalt supply from the DRC is China’s greatest reliance on a single country for commodity raw material
Any disruption to this link would cause major dislocations in the cobalt market
Only 10% of cobalt is currently recycled This must increase dramatically in the coming years, and will perhaps be the biggest growth area for cobalt
Consumer pressure is increasing to ensure traceability of cobalt amid child labour concerns
We would expect to see a 'non-DRC premium' develop for cobalt, both for current quotes and for new projects
We expect a rising cobalt metal surplus over the coming years, but also a rising cobalt chemical deficit
Metal conversion into chemicals will have to grow, either at refineries or (more likely) in China, permitting a cobalt sulphate premium.
We have to make very aggressive assumptions on both supply and demand to bring near-balance to this market in future years
In all scenarios we can envision, the cobalt price goes higher
For further detail on the electric vehicle market and battery trends, we recommend reading Lithium
Recharge: Driving to Multi-Decade Thematic published October 24, 2017, by Joel Jackson.
Global Commodities | Page 2 December 4, 2017

Exhibit 1: BMO Commodity Comparison Chart – Cobalt Is in a Good Spot
Source: BMO Capital Markets
Why Did Cobalt Rally This Year?
There has been a combination of factors that has aided cobalt’s outperformance over 2017, but in our
view three in particular have acted as catalysts:
1. Continued growth in smartphone sales. Smartphone batteries are still the main end use
market for cobalt, and after a weak H1 2016 demand growth recovered in H2 and has
continued through 2017.
2. Global cobalt mine supply is down 2.7% YoY in 2017 on our estimates, with weakness at
Glencore operations and disputes at GTL’s Big Hill primary cobalt tailings operation seeing DRC
output fall by ~5kt cobalt contained.
3. Most importantly, on December 30 last year, China announced a revised E-bus battery subsidy
policy. Essentially, this prioritised the higher battery quality technologies, penalising LFP
(lithium-iron-phosphate) and benefitting NMC (nickel-manganese-cobalt). Chinese battery
manufacturers have scrambled to add cobalt-containing NMC capacity, and also raw materials
to fill this given expectations that equivalent quality-driven subsidies will be put in place for
car batteries.
Until this, cobalt was the perennial underperformer in metals markets. While all others were gaining in
2010 as QE-led reflation took hold, cobalt was already starting to move lower, a trend that persisted
until 2013. However, prices have now risen by over threefold from the December 2015 low to levels
last seen just before the GFC, at ~$31/lb. This makes cobalt the best performer of the commodities we
cover over the past year in terms of price gains, and at current spot market pricing a market worth
$6.6bn per annum.
Pote
nti
al f
or
short
term
const
rain
t
Potential for long term shortage
Met Coal
Manganese
Steel
Nickel
Alumina
Thermal Coal
Zinc
Bauxite Copper
Chrome
Iron Ore
Aluminium
GOOD
BAD
CobaltLithium
Global Commodities | Page 3 December 4, 2017

Exhibit 2: Recent Cobalt Price History Exhibit 3: Cobalt Has Outperformed Over the Past Year
Source: Metal Bulletin, BMO Capital Markets Source: LME, Bloomberg, BMO Capital Markets
On a longer-term view, current prices have moved back above the longer-term inflation-adjusted
average of $22/lb. Cobalt has a history of spikes higher following a period of underperformance, which
is mainly related to the structure of the supply side. Without a primary mine supply side to speak of,
cobalt has less of an elastic supply buffer than peers.
Interestingly, cobalt’s ratio to its largest potential direct substitute, nickel, has also jumped. Having
been around 2:1 for many years, this ratio jumped to over 7:1 in June, a level last reached in 1999.
Given the extent of substitution we believe will be needed in this market, this is an important
development.
Exhibit 4: Cobalt to Nickel Ratio Has Risen Dramatically in 2017 Exhibit 5: Long-Term Cobalt Price History (in Today’s Money)
Source: LME, Metal Bulletin, BMO Capital Markets Source: Metal Bulletin, BMO Capital Markets
0
5000
10000
15000
20000
25000
0
10
20
30
40
50
60
Jan 0
7
Jan 0
8
Jan 0
9
Jan 1
0
Jan 1
1
Jan 1
2
Jan 1
3
Jan 1
4
Jan 1
5
Jan 1
6
Jan 1
7
$/
tonne
$/
lb
Cobalt and Lithium prices
Cobalt 99.8% MB price
Asia spot lithium carbonate (RHS)
-60 -40 -20 0 20 40 60 80 100 120 140
-60 -40 -20 0 20 40 60 80 100 120 140
Thermal Coal
Uranium
Met Coal (FOB Aus)
Iron Ore (62%)
Steel Rebar
Molybdenum
Cobalt
Alumina
Platinum
Palladium
Silver
Gold
Tin
Lead
Nickel
Zinc
Aluminium
Copper
1 Year % change
Rolling 1 year high/low rangeRolling 1 year price performance
0
1
2
3
4
5
6
7
8
Oct
10
Feb 1
1
Jun 1
1
Oct
11
Feb 1
2
Jun 1
2
Oct
12
Feb 1
3
Jun 1
3
Oct
13
Feb 1
4
Jun 1
4
Oct
14
Feb 1
5
Jun 1
5
Oct
15
Feb 1
6
Jun 1
6
Oct
16
Feb 1
7
Jun 1
7
Oct
17
Cobalt/Nickel Price Ratio
0
10
20
30
40
50
60
70
80
1938
1941
1944
1947
1950
1953
1956
1959
1962
1965
1968
1971
1974
1977
1980
1983
1986
1989
1992
1995
1998
2001
2004
2007
2010
2013
2016
Real Cobalt Prices, $/lb
Long Run Average
Global Commodities | Page 4 December 4, 2017
DRC Dependence – The Inherent Risk in Cobalt Supply
Cobalt’s supply side is unique among peers. It has heavy reliance on a single supply country (DRC), a
complex value chain, and next to no primary supply, coming as a by-product of nickel and copper
operations. What sets it aside, however, is that China has next to no domestic resource, and thus is
beholden to international markets for supply. Buffers against raw material constraint are thus limited.
Similar to peers, established assets are generally in decline. Combined output from key supply countries
Australia, Russia, and Zambia is 28% lower than seen a decade ago. Moreover, given the ongoing
underperformance in price, not just for cobalt but also for nickel and, until recently, copper, very few
new projects are coming through the pipeline in short order.
Cobalt occurs in the earth's crust to an average concentration of less than half of that of copper and
nickel. Ore-forming geological processes accumulate cobalt into minable concentrations almost
exclusively alongside copper and nickel – there are, therefore, no sizeable primary sources of cobalt. The
major deposit types that contain cobalt as a by-product metal are sediment hosted, such as those found
in the African copperbelt, hydrothermal; magmatic, and lateritic.
The process chain for cobalt normally involves mining and separation of ore, with subsequent upgrade
to a 6-8% cobalt concentrate and/or partially refined into an intermediate product (20-40% Co). This is
then further refined into cobalt metal or chemical products. Currently, <20% of cobalt is refined in the
same country in which it is mined, leading to a strong trade in concentrates (often on long-term
contracts). As an example, with the temporary closure of the Katanga facility, only state-owned miner
Gecamines is refining cobalt in the DRC at present, with the remainder of cobalt units exported.
Exhibit 6 shows the varied forms in which cobalt is supplied to global markets, all with slightly different
discounts or premia to the widely quoted 99.8% high-grade cobalt index. The LME price is also used as a
reference, though that contract is still struggling for liquidity. Cobalt is generally a trader-driven market
given the level of merchant material, and can be considered relatively opaque in terms of hard data.
To keep up with demand growth, refined cobalt supply has doubled since 2004, a CAGR of 5.5%.
Historically, production of cobalt metal dominated, but since the portable electronics revolution took
hold supply of chemicals has been driving supply growth, accounting for ~60% over the past decade.
Supply of cobalt in chemical form overtook that in metal in 2012, and is now over 40% higher.
One area where cobalt has struggled has been scrap recovery for secondary supply. The fact that cobalt
is used in alloy form in most of its main metal uses makes recovery closed loop (i.e., back into the same
process) at best, while for chemicals the difficulty in cathode separation and recovery has been widely
discussed. Even with acceleration in recent years, only ~10% of refined cobalt comes from secondary
sources. In our view, given the supply-constrained nature of the cobalt market this has to change. We
model the recovery ratio rising to 16% by 2025, doubling cobalt supply from secondary sources.
Global Commodities | Page 5 December 4, 2017

Exhibit 6: Cobalt Supply Comes in Many Forms Exhibit 7: Cobalt Chemical Supply Now Exceeds That of Metal
Source: Darton, BMO Capital Markets Source: CDI, BMO Capital Markets
The level of DRC risk in cobalt supply cannot be underplayed. In our view, the wider market has become
sanguine to the geopolitical risk in that country, and while the majority of cobalt is mined in Katanga
Province, a long way from the capital Kinshasa, turbulence has caused issues in the past. This country
was of course subject to the deadliest conflict in modern African history less than 20 years ago. Protests
against long-standing president Joseph Kabila have intensified in recent times. Presidential elections are
now overdue, and unrest is growing. We do not assume any major issues in our modelling, but the
concentrated nature of the cobalt supply side means the potential for a supply shock remains high.
In the past, the DRC has made efforts to force greater processing of cobalt ore within the country,
occasionally banning shipments on a temporary basis. This has seen a push towards more intermediate
products, but given the lack of consistent power in the country, in our view full refining is impractical
and thus unlikely.
Currently, the DRC is responsible for 60% of mined cobalt units. Given this is one of the few supply
regions across the world where existing mines can creep capacity, DRC dependence is only going to
grow. We see the DRC representing 65% of mined cobalt units in 2025.
One area we would hope supply declines in the DRC is from artisanal mining. The use of child labour in
cobalt extraction rightly received very bad press, and to date the industry has not taken adequate
measures to ensure traceability of cobalt units. With the LME launching a probe into their listed cobalt
brands and Amnesty International cranking up the pressure on China’s Zhejiang Huayou to review their
supply chain after reports they were sourcing child-mined material, we anticipate this supply will fall to
be partially offset by legitimate mining of affected areas. In our view, the consumer will increasingly
push, via the electronics companies, to ensure cobalt used in products has come from bona fide mining
operations. This situation will provide another impetus to potential cobalt substitution in batteries.
Growth in the cobalt market is dominated by certain areas. The power axis from DRC mine supply to
Chinese chemicals into batteries becomes ever-more dominant every year. Over the decade from 2010
to 2020, we expect 5.0% CAGR in DRC mine output growth, which will permit a 5.9% CAGR in Chinese
chemical output growth (we do not expect the recent clampdown on battery production plants to move
upstream to cobalt chemicals).
2017 has seen some disruption to this chain. The 5.3ktpa Big Hill cobalt mine in the DRC has seen a
blockade since March as minority owner Gecamines seeks to bring in a different partner. This tailings
Oxides, salts & other
chemicals51%
Fine powders6%
Cathode18%
Briquettes9%
Coarse powders
Broken cathodes
6%
Rounds2%
Ingots1%
Refined Cobalt Supply by Product Type
0
20
40
60
80
100
120
140
160
2000
2002
2004
2006
2008
2010
2012
2014
2016
2018E
2020E
2022E
2024E
kt
Refined cobalt supply
Secondary Chemicals Metals
Global Commodities | Page 6 December 4, 2017

operation is the DRC’s fourth-largest cobalt mine, the only major operation where cobalt is the primary
material, and is responsible for ~4.5% of global supply. According to Bloomberg reports, the court
schedule means no more cobalt is likely to be produced until 2020 unless there is a settlement to this
dispute. This, coupled with the temporary closures at Glencore’s copper-based operations in the
country, means DRC mined output has fallen YoY for the first time since 2012. Even with draws on
concentrate stocks, China’s chemical output will grow by less than 1,000t this year since 2012 – this is
not a coincidence.
We expect the 2017 DRC output to be a blip, and with the Roan Tailings project for ERG set to ramp up
from 2018 and a restart at Glencore’s Katanga facility (where cobalt output will rise towards 20ktpa),
we anticipate the DRC to be the major driver of 6% and 15% YoY growth in global mined cobalt output
over 2018 and 2019, respectively.
There are many commodity markets where Chinese refined output has come to dominate, but perhaps
none more pertinent than cobalt chemicals (including battery cathode precursor chemicals). China is
currently responsible for 80% of all refined cobalt content in chemicals globally. Indeed, were there to
be a Chinese purchaser of the 8.5ktpa Freeport Cobalt refinery in Finland, this figure would jump to 97%
overnight. Given the potential importance of this market to consumers, and the concerns over China’s
share of production in industries such as steel and aluminium, that this hasn’t garnered more attention
is perhaps somewhat of a surprise.
The bigger issue for China’s cobalt chemicals industry is securing the mine supply needed to fill this
capacity. The share of global mine output owned by Chinese producers is only 34%, and before the
purchase of Tenke Fungurume by China Molybdenum from Freeport and Lundin in 2016 this figure was
only 17%. We would not be surprised to see further Chinese purchases of cobalt assets to boost security
of supply to chemical facilities in future years.
Exhibit 8: The DRC-China Chemical-Battery Power Axis Has Become Increasingly Dominant Over Recent Years
Exhibit 9: China Has Been Trying to Secure Mine Supply to Close the Gap to Its Refined Market Share
Source: CRU, CDI, BMO Capital Markets Source: CRU, CDI, BMO Capital Markets
In other markets, certainly until the recent environmental clampdown, China’s private sector mining of
domestic resource would help solve the balance. However, without domestic resource, this is
impossible in cobalt. Cobalt units mined domestically account for just 3% of China’s cobalt consumption.
To fuel cobalt chemicals growth, China has thus had to import increasing volumes of cobalt ores and
intermediates to fuel gains in chemicals output. Currently, over 50% of ore mined globally goes to
China. However, that doesn’t tell the full story. Only 7% of this material is from the 40% of cobalt units
4.8% 5.0%5.9%
7.6%
0%
1%
2%
3%
4%
5%
6%
7%
8%
Refined outputgrowth ex-
China
DRC mineoutput
China Chemicaloutput
BatteryDemandgrowth
CAGR 2010-2020E
0%
10%
20%
30%
40%
50%
60%
70%
80%
90%
2010
2011
2012
2013
2014
2015
2016
2017E
2018E
2019E
2020E
Chinese-controlled share of global output
Refined Cobalt Cobalt Chemicals Mine Supply
Ruashi
Tenke Fungurume
Global Commodities | Page 7 December 4, 2017

mined outside the DRC. Ninety-three percent comes from the DRC, mainly in intermediate form. Or put
another way, around half of the cobalt produced globally is mined in the DRC and refined in China. This
makes cobalt supply from the DRC China’s greatest reliance on a single country for commodity raw
material – more than chrome from South Africa, tin from Myanmar and iron ore from Australia.
Exhibit 10: Chinese Cobalt Imports Continue to Rise … Exhibit 11: … but Are Dominated by DRC-Sourced Material
Source: China Customs, BMO Capital Markets Source: China Customs, BMO Capital Markets
Naturally, the cobalt price gain over 2017 has seen a push to identify and develop new projects. Spend
on cobalt-related exploration has more than tripled this year to seek potential resource additions though
no sizeable resources have been identified to date. However, just under half of global reserves are also
in the DRC, and unsurprisingly much of the focus has been on safer mining jurisdictions such as Australia
and Canada, which combined hold around 15% of global reserves. And with funding both from
traditional mining funds and technology-related funds available given the strength of the EV story, we
expect further developments in 2018. However, just as with other metals, getting such projects to
market will take a long time.
0
10
20
30
40
50
60
70
2003
2004
2005
2006
2007
2008
2009
2010
2011
2012
2013
2014
2015
2016
2017E
kt C
o
China's cobalt imports by type
Intermediate
Ore/concentrate
0
10000
20000
30000
40000
50000
60000
70000
2010
2011
2012
2013
2014
2015
2016
2017E
kt C
o
China's cobalt imports by source
Other intermediate
Other ore
DRC intermediate
DRC ore
Global Commodities | Page 8 December 4, 2017

Exhibit 12: The DRC Contains Roughly Half of Global Cobalt Reserves
Exhibit 13: Cobalt Exploration Has Surged With Price Gains
Source: USGS, BMO Capital Markets Source: S&P Global, BMO Capital Markets
Cobalt’s main challenge is that it very, very rarely will justify its own project. The vast majority of cobalt
supply globally is either from a primary copper or primary nickel operation as a by or co-product stream.
The cobalt price, while potentially helping with overall mining costs through credits, will rarely justify
development of a project on its own. For example, for most nickel-based projects even a fivefold
increase in cobalt price barely moves project IRR. Thus, unlike its battery peer lithium, there are next to
no projects that could come to market in short order. Even with funding in place the process plant
needed for cobalt is many times more complex than that for spodumene (lithium in rock), where the
Australian miners have been able to react quickly to pricing.
Exhibit 14: The Majority of Cobalt Comes as a Copper Co-Product Exhibit 15: We Need to See Accelerated Growth in DRC Supply
Source: CDI, BMO Capital Markets Source: CDI, Darton, BMO Capital Markets
In the short term, potential cobalt growth is all about the DRC. The Roan Tailings Reclamation (RTR)
project is still on track for 2018 shipments at present, and when fully ramped to 14kt Co content this will
be the fourth-largest operation in the world. Independence Group’s Nova Bollinger also shipped first
material this year, though at 1.7kt Co it is much less impactful.
-
500
1,000
1,500
2,000
2,500
3,000
3,500
4,000
Thousa
nd t
onnes
World Cobalt Reserves
0
5
10
15
20
25
30
35
40
2012 2013 2014 2015 2016 2017E
US$
m
Cobalt Exploration Budgets
Minesite
Late stage/feasibility
Grassroots
0
20
40
60
80
100
120
140
160
180
200
2010
2011
2012
2013
2014
2015
2016
2017
2018
2019
2020
2021
2022
2023
2024
2025
kt
Cobalt Supply by Project Type
Primary Other co-product
Nickel co-product Copper co-product
61 64
52 57 62 66 69
63 7
4
89 100 108
111
111
111
113
50%
52%
54%
56%
58%
60%
62%
64%
66%
68%
0
20
40
60
80
100
120
140
2010
2011
2012
2013
2014
2015
2016
2017E
2018E
2019E
2020E
2021E
2022E
2023E
2024E
2025E
kt (
bef
ore
yie
ld lo
ss)
DRC Cobalt Mine Supply
Mine Supply
% of globaloutput
Global Commodities | Page 9 December 4, 2017

We also expect restarts at currently idled operations, partly to recover cobalt but also as the nickel
market moves back towards needing additional Class I supply in future years. This would include the
1.2kt Tocantins operation for Votorantim in Brazil, plus the Glencore copperbelt restarts. We also expect
creep from existing operations as producers seek to benefit from the higher cobalt price through
optimising recovery circuits.
Beyond that, cobalt has a problem. There are very few potential projects coming through the chain,
with most still being at exploration phase. The most likely looks to be the Sunrise project in Australia for
CleanTeq, but even then first production would not be until 2021 at best. Cobalt simply cannot rely on
non-DRC mine output to solve any near-term constraints, and will need what are currently early-stage
projects to come to market by the middle of the next decade.
Exhibit 16: Potential Cobalt Projects
Source: Darton, BMO Capital Markets
Project Location Ownership Output
Roan Tailings DRC ERG 14,000 tpy Co over next 3-5 years.
Idaho Cobalt Project USA eCobalt 1,100 tpy cobalt sulphate equivalent, mine life 12.5 years.
Dumont Canada RNC/Waterton Up to 1,000 tpy cobalt, highly dependent on Ni price
NICO Canada Fortune Minerals 1,600 tpy battery grade cobalt sulphate.
Sunrise Australia Clean Teq Potential for up to 3-5,000 plus tpy of cobalt from 2021 onwards
Thakaringa Australia Broken Hill Prospecting 3 primary Co deposits - Pyrite Hill, Big Hill and Railway.
Tabac Project Australia Dragon Energy Yet to be determined.
Mt. Gilmore Australia Corazon Mining Yet to be determined.
Mt. Thirsty Australia Barra ResourcesBase case 1,900 tpy for the first five years. Plans for open pit
mine and hydrometallurgical processing plant.
Various Co assets Canada/USA Cruz Capital Corp.Total of 8 separate cobalt prospects (7 in Canada, 1 in the US).
Output yet to be determined.
Werner Lake Cobalt Project Canada Global Energy Metals Corp. Yet to be determined.
Teledyne Co Project Canada LiCo Energy Metals Inc. Yet to be determined.
Copper Prince Canada Green Swan Capital Corp. Yet to be determined.
Smith Cobalt Property Canada Cobalt PowerGroup Inc. Yet to be determined.
In construction stage
In pre-construction phase
In exploration phase
Global Commodities | Page 10 December 4, 2017

The lack of potential supply growth plus the overreliance on the DRC make cobalt a supply-constrained
market prone to supply shocks. We assume refined cobalt supply grows strongly (10%) over 2018 on a
further draw in above-ground mined inventory, with further steady gains over future years. Even
assuming a perfect DRC (without any disruption above the usual 4% allowance), project restarts, and
strong growth in secondary supply for 2025, we can only get to 137kt from 96kt in 2016. Given that a
supply-constrained market has to solve for available material, this is the starting point around which
demand projections have to solve for.
Below, we provide a list of companies with exposure to cobalt supply. This is certainly not exhaustive
and, particularly for the producers, cobalt is generally a small part of valuation. Among major
companies, Glencore has the largest exposure to cobalt, while Cobalt27 is the closest to a cobalt pure
play. Meanwhile, with its technology and expertise, Umicore is highly exposed to the growth in
secondary supply needed to balance the cobalt market.
Exhibit 17: Companies With Exposure to Cobalt Supply Exhibit 18: Selected Cobalt Development Companies
Source: Bloomberg, BMO Capital Markets Source: Bloomberg, BMO Capital Markets
Producers Main Listing Market Cap (US$ Mn)*
African Rainbow Minerals Ltd S Africa 1,792
Anglo American Platinum Ltd S Africa 7,320
China Molybdenum Co. Ltd China (HK) 18,427
Cobalt 27 Capital Corp. Canada 146
First Quantum Minerals Ltd Canada 8,068
Freeport McMoran US 19,992
GEM Co Ltd China 4,210
Glencore Plc UK 67,042
Jinchuan Group Int. Resources Co. Ltd China (HK) 678
Lundin Mining Canada 5,250
Metallurgical Corp. of China (MCC) China (HK) 14,468
Nornickel Russia 41,197
Sherritt International Corp. Canada 315
Sumitomo Metal Mining Co. Ltd Japan 11,430
Umicore Belgium 10,323
Vale SA Brazil 52,833
Vedanta Resources UK 2,741
Zheijiang Huayou Cobalt China 6,814 *As of Mid-November 2017
Development Companies Main Listing Market Cap (US$ Mn)*
Ardea Resources Ltd Australia 99
Berkut Minerals Ltd Australia 14
Broken Hill Prospecting (Cobalt Blue) Australia 5
Castle Silver Resources Inc. Canada 9
Cblt Inc. Canada 3
Clean TeQ Australia 656
Cobalt Blue Holdings Ltd Australia 17
Corazon Mining Ltd Australia 16
Cruz Cobalt Corp. Canada 10
Ecobalt Canada 86
First Cobalt Canada 65
Fortune Minerals Ltd Canada 44
Global Energy Metals Canada 3
Kings Bay Resources Corp. Canada 4
LiCo Energy Metals Canada 10 *As of Mid-November 2017
Global Commodities | Page 11 December 4, 2017

Strong Substitution Needed to Make Space for EV Demand
With long-term annual demand growth averaging 6%, cobalt demand has grown from ~40kt in 2000 to
exceed 100kt for the first time on our estimates this year. End uses are varied, with cobalt metal used
in superalloys for turbine blades and prosthetic implants, magnets, and high strength steel, and cobalt
chemicals used as catalysts in various processes plus in dyes and paints. However, it is fair to say that
these markets have not been the main driver of cobalt growth. For demand, think cobalt, think
batteries.
Exhibit 19: Cobalt Demand Breakdown Over Time – EVs Overtake Conventional LCO From 2022
Source: CDI, BMO Capital Markets
Back in 2000, batteries accounted for just 16% of total cobalt consumption. With the rapid
commercialisation of lithium-ion rechargeable technology and the shift towards lithium-cobalt oxide
(LCO) batteries for portable electronics, batteries now account for 55% of total cobalt consumption on
our estimates. This compares to lithium at ~40% going into batteries, and nickel at ~5% currently.
Cobalt-containing lithium-ion-based batteries have high charge density and power-to-weight ratios
(they can store more energy in a smaller area) versus lead-acid and nickel-metal hydride battery cells.
They also have short recharge times and high cycling ability (i.e., they can traverse charge-discharge
cycles for a long time). The low atomic weight renders lithium-ion batteries relatively lightweight
because of lithium’s low atomic mass, while cobalt is crucial in conserving battery strength and lifespan.
These properties, together with high specific energy are why LCO batteries became the staple for
smartphones, tablets and power tools.
3% 4% 6% 10% 19% 25% 28% 30% 33% 35% 38% 40%
49% 49% 48% 45%40%
36% 35% 33% 32% 31% 30% 29%
0%
10%
20%
30%
40%
50%
60%
70%
80%
90%
100%
2014 2015 2016 2017E 2018E 2019E 2020E 2021E 2022E 2023E 2023E 2025E
End Use Demand
Other
PET processing
Dyes & Paints
Tyres
Catalysts
Batteries - Other
Batteries - EVs
High Strength Steel
Diamonds & Hard Facing
Magnets
Other Superalloy
Power Generation
Prosthetics
Aircraft Engines
Global Commodities | Page 12 December 4, 2017

The key properties of the major lithium-ion battery cathode chemistries are shown in Exhibit 20, below.
While all contain lithium, not all contain cobalt, and cobalt proportion can vary significantly. Notably,
~60% of the weight in a LCO cathode is cobalt.
Exhibit 20: Battery Cathode Chemistries – NMC Favoured for EVs, LCO for Portable Electronics
Source: Battery University, BMO Capital Markets
Currently, smartphones are the largest single end-use for cobalt, representing around a quarter of total
demand. From ~300m units in 2010, global shipments are now ~1,500m units, with average cobalt
content ~16 grams each. This alone has added over 20kt to annual cobalt demand over the same
period – battery size may be small but volume is large. YoY growth rates for smartphone shipments
slowed to around zero in H1 2016, but have since recovered strongly as global economic growth has
improved. In our view, this was one of the key catalysts for 2017’s cobalt price gains.
Other segments of the portable electronics markets, such as tablets (~35g/unit) and laptops
(~40g/unit), are no longer drivers of growth. After adding 8ktpa to cobalt demand in short order, global
tablet sales are now ~24% below their 2014 peak, while laptop sales have been in steady decline over
time. Energy storage (ESS) is a growing market for cobalt, but is coming off a low base, and while more
e-bikes now use Li-ion technology, cobalt use in this area remains below 1ktpa. Power tools are a
growing area for cobalt demand, and in our estimates account for ~2ktpa at present.
Overall, portable electronics remain central to cobalt demand, and will do into the future. However, we
view demand as being on a slight downtrend in this area, as market penetration plateaus and cobalt per
unit is minimised in certain cases. Partly, this is down to the need for thrifting, as discussed in more
detail in the following pages. Without this, we would see demand moderately higher from portable
electronics in 2025 compared to today’s levels. With the potential exception of LMO gaining share in
power tools, we do not expect mass substitution of LCO in portable electronics given the natural inertia
to change, particularly after Samsung’s widely reported problems with the Galaxy Note 7. This is even
with the two main cathode raw materials having tripled in price over the past two years.
Cathode Types NMC1 NCA LFP LMO LCO
Raw Materials Lithium Nickel Cobalt Manganese Lithium Nickel Cobalt Aluminum Lithium Iron Phosphate Lithium Manganese Oxide Lithium Cobalt Oxide
Chemical Formula Li(NiMnCo)O2LiNiCoAlO2 LiFePO4
LiMn2O4 LiCoO2
NMC111: 199 200-260 90-120 100-150 150-200
NMC532: 205
NMC622: 225
NMC811: 270
Thermal Runaway
(Celsius)
210 (Stable) 150 (Least Stable) 270 (Most Stable) 250 (Most Stable) 150 (Least Stable)
Lifespan2
(# of Cycles)
1500-4500 (High) 500-1000 (Low) 1000-2000 (Medium) 500-1000 (Low) 500-1000 (Low)
Primary Applications EVs EVs EVs Power tools, medical
devices
Portable electronics
Cobalt as % of
cathode (by weight)
~19% (NMC111)
~12% (NMC622)
~6% (NMC811)
~9% Zero Zero ~60%
Notes
Shift towards more nickel content
for higher energy density, and
less cobalt/manganese
(stabilizers) without
compromising battery safety
High energy density, but high
cost due to more expensive
cobalt, and marginal safety due to
relatively lower thermal runaway
Lower energy density relative
to nickel cathodes is forcing
OEMs to switch from LFP to
NMC. Remains ideal for
commercial vehicles due to
high safety and lower cost
Relatively low energy
density and lifespan, but
absence of cobalt allows for
better affordability
Excels on high specific
energy, but limited safety.
Most OEM (Samsung,
Apple, etc.) confirm that
LCO will be first choice for
the future1NMC cathode types vary by ratios of nickel/manganese/cobalt per Li content, e.g. per one atom of Li, NMC622 contains one atom formulated with 60% Ni, 20% Mn, 20% Co2Represents the number of complete charges a battery can perform before capacity falls to 80%
Energy Density
(Wh/kg)
More nickelcontent increases energy density
Global Commodities | Page 13 December 4, 2017

Exhibit 21: Cobalt Already Has Over 50% of Demand in Batteries, With Peers Only Now Starting to Catch Up
Exhibit 22: Portable Electronics, Particularly Smartphones, Have Driven Growth in Demand – We Now Expect a Plateau
Source: CRU, CDI, BMO Capital Markets Source: IDC, Darton, BMO Capital Markets
Cobalt demand growth has not just been smartphones, however. The second-largest end use in recent
years has been in turbine blades for aircraft engines, where cobalt’s resistance to creep at high
temperatures and pressures makes it a core element of superalloys used for critical components.
Aircraft build rates are rising and order backlogs at Airbus and Boeing combined currently represent ~8
years of production. Importantly, the share of “next generation” engines continues to grow. Given
these operate at higher temperature than their predecessors, this promotes further cobalt use.
Exhibit 23: Cobalt’s Long-Term Demand Growth Has Exceeded Peers; We Assume a Slowdown Owing to Lack of Available Supply
Exhibit 24: It’s Not Just Batteries – Superalloy Demand for Jet Engines Is Also on the Rise
Source: CRU, CDI, BMO Capital Markets Source: ATI, BMO Capital Markets
Given the relative demand strength in electronics and superalloys, we would foresee a relatively tight
cobalt market on these alone given the challenges in supply growth. But of course, demand in electric
vehicles is coming, and will be the fastest growing part of the cobalt market.
0%
10%
20%
30%
40%
50%
60%
70%
80%
2014
2015
2016
2017E
2018E
2019E
2020E
2021E
2022E
2023E
2023E
2025E
% of demand in batteries
Lithium Cobalt Nickel
0
5
10
15
20
25
30
35
40
45
50
2010
2011
2012
2013
2014
2015
2016
2017E
2018E
2019E
2020E
2021E
2022E
2023E
2024E
2025E
kt
Cobalt in electronic devices
Other demand Power Tool demandLCO E-Bikes ESSLaptops TabletsMobiles ex-Smartphone Smartphones
-5%
0%
5%
10%
15%
20%
2002
2003
2004
2005
2006
2007
2008
2009
2010
2011
2012
2013
2014
2015
2016
2017E
2018E
2019E
2020E
2021E
2022E
2023E
2024E
2025E
kt
YoY cobalt demand growth
Long term = 6%
0
500
1000
1500
2000
2500
2009 2010 2011 2012 2013 2014 2015 2016 2017E 2018E 2019E
Commercial Aircraft Build Rates
Others Embrear
Bombadier Boeing
Airbus Next Gen Aircraft Total
Global Commodities | Page 14 December 4, 2017
As per our recent lithium report, the transition towards higher EV penetration now seems inevitable.
The key driver for us is regulatory and legislation pushes in Europe and China to reduce air emissions,
pressuring automobile OEMs to redesign model lineups. The ability to push for this has been boosted by
better battery range/technology, and recent EV designs with better driving experiences, emboldening
governments that car makers can produce EV cars consumers will want.
We believe base case 10% EV penetration by 2025 (6% battery electric vehicles / BEV as well as 4%
plug-in hybrids / PHEV) is reasonable. This will be too high for some, and too low for others, but 10%
seems good middle ground between realistic battery supply chain capabilities and OEM/regulatory
targets and proclamations. A variety of cathodes are used for EVs, and traditionally Chinese
manufacturers have favoured cobalt-free lithium-iron-phosphate (LFP) batteries given their lower cost
(and thus increased cost-competitiveness against internal combustion engines). However, the Chinese
government is in the process of prioritising the higher battery quality technologies, and penalising LFP.
As a result, the general market expectation is that Chinese battery producers will shift to the NMC
(nickel-manganese-cobalt) EV battery chemistry favoured in the rest of the world due to high energy
density capabilities allowing for extended range. Meanwhile, Tesla continues to drive its own path with
nickel-cobalt-aluminium (NCA) technology, with cathodes of around 9% cobalt by weight.
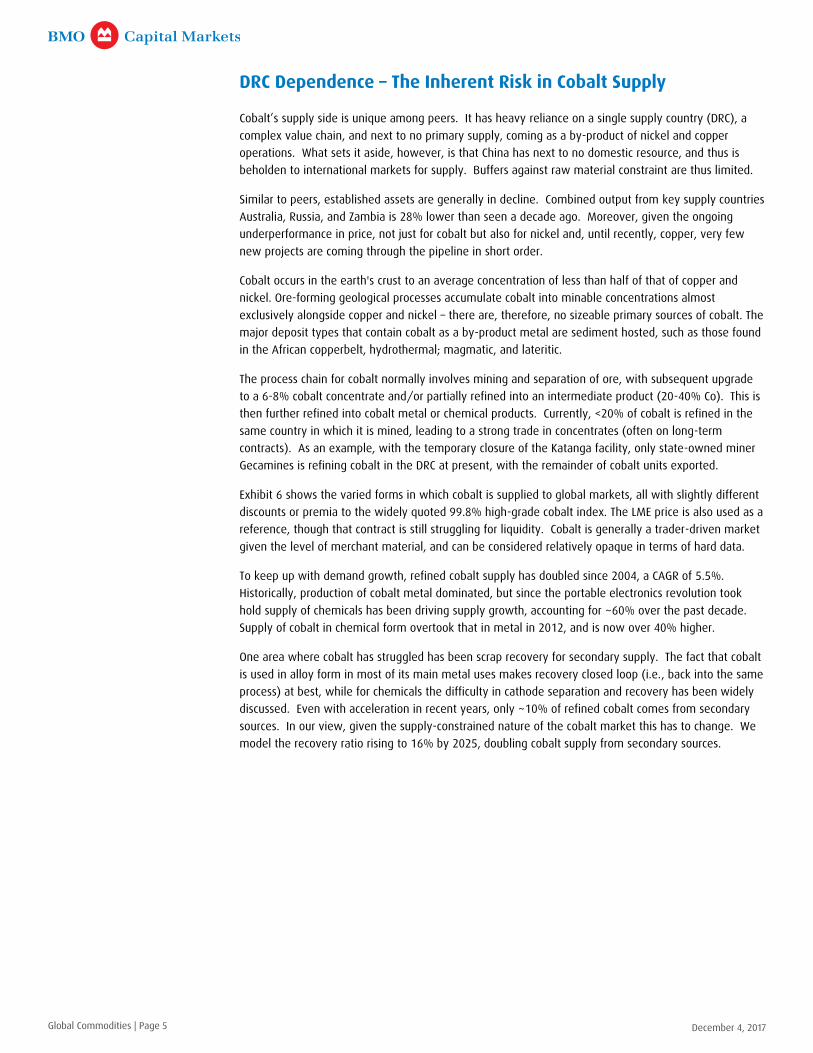
Exhibit 25: Relative to Market Size, Cobalt Is Highly Exposed to EV Demand
Exhibit 26: Flexing Global EV Penetration and Battery Size Can Have a Large Influence on Potential Cobalt Demand
Source: INSG, Bloomberg, BMO Capital Markets Source: Industry Reports, Bloomberg, BMO Capital Markets
The potential cobalt constraint on EV growth is clear, and is gaining wider acceptance. This process has
been accelerated by Volkswagen's notable failure to secure long-term cobalt supply via tender. And as a
result, we expect car companies to lean on battery makers to spend more R&D dollars to accelerate
reductions in cobalt content.
In our view, this is a process that would have happened anyway given cobalt's DRC exposure. No
purchasing manager wants to be so reliant on supply of a critical raw material from a single supply
source, particularly one with a poor human rights track record and the threat of political instability.
Unlike lithium, where the cathode chemistry has relatively little impact on overall demand, for cobalt
altering cathode market share assumptions can have a large impact. Currently, the vast majority of
cathodes for EVs are either NMC111 or LFP, with small amounts being NCA or LMO (usually in a blend).
We model an aggressive shift away from NMC111 towards NMC622 chemistry from 2020 onwards,
which amounts to a halving of contained cobalt on a like for like basis. By 2025, NMC622 has 60%
overall market share and becomes the standard EV cathode chemistry of choice. We also assume that,
2.5%
0.4% 0.0% 0.2%
11.8%
5.6%
0.0%0%
2%
4%
6%
8%
10%
12%
14%
Gra
phit
e
Nic
kel
Alu
min
um
Copper
Lith
ium
Cobalt
Manganese
Demand from one million EV batteries as % of market size
53.15 2.5% 5.0% 7.5% 10% 12.5% 15.0% 17.5%
0.26 20 40 60 80 100 120 140
0.23 18 35 53 71 88 106 124
0.20 15 31 46 62 77 92 108
0.17 13 27 40 53 66 80 93
0.15 12 23 35 46 58 69 81
0.13 10 20 30 40 50 60 70
0.11 8 17 25 34 42 51 59
EV Market Penetration Rate (%)
Cob
alt
pe
r B
att
ery
(k
g/
kW
h)
2025 EV demand scenarios (2024 cobalt demand)
Global Commodities | Page 15 December 4, 2017

after a decline in market share over the coming years, some Chinese manufacturers choose to sustain
LFP cathode use in EVs in light of tight cobalt supply, keeping the overall market share at 20%.
Meanwhile, Tesla’s NCA maintains market share more or less in line with the overall market.
Exhibit 27 shows our calculation for cobalt demand. To allow for the time gap between battery
manufacture and EV demand, we have assumed raw materials are purchased one year in advance of EV
sales (i.e., 2018’s EV sales translate to cobalt demand in 2017). Given rising EV sales and the reduction
in LFP cathode use, cobalt demand rises from 5kt last year and 10kt in 2017 to 33kt by 2020 and 59kt
by 2022, even assuming the shift to NMC622. As a result, EVs overtake portable electronics’ as in terms
of cobalt demand by 2022, and will account for 40% of total demand by 2025.
Of course, there are many potential scenarios for both cobalt cathode content and EV penetration.
Exhibit 26 presents the impact of these in a table for 2025 EV demand (and thus 2024 cobalt demand).
As an example, should average cobalt content in kg per kWh stay at today’s level of 0.20, and EV
penetration reach 15% compared to the 10% we model, cobalt into EVs would be 92kg, not much below
today’s total market size. Alternatively, should the cobalt used in EV battery cathodes drop by a quarter
to 0.15kg per kWh, and EV penetration only reach 2.5%, only 2ktpa of cobalt demand would be added
compared to 2017 levels.
Between 2016 and 2025 we see cobalt demand in batteries growing by 53kt, which breaks down into
54kt of EV demand growth, a 2kt net decline in portable electronics and 1kt of growth in energy storage.
Exhibit 27: Our Base Case Calculation for EV Cobalt Demand
Source: Industry Reports, Bloomberg, BMO Capital Markets
In our view, part of the uncertainly around EV penetration comes from the fact that automakers have
been rushed into setting targets following the bad press around emission tests, and are only now
backfilling these with strategy. In our view, they will quickly realise that EV sales targets can generally
be met by targeting urban areas. Cities have the greatest pollution problem, ability to build charging
infrastructure and potential to incentivise use through tax structures. Moreover, the typical range
anxiety that comes with driving an EV will be less acute in an urban area where charging stations and
support are likely to be closer at hand should there be any issues.
This doesn’t change the total EV sales number, but does mean that expectations of EV battery sizes
rising aggressively into the future on the back of range expansion are less likely. This in turn will help
ease the weight burden EVs currently face. We do have average pack sizes rising over time, but by less
than 10% in total over the forecast period.
2014 2015 2016 2017E 2018E 2019E 2020E 2021E 2022E 2023E 2024E 2025E
Key EV Assumptions:
Global light vehicle sales (millions) 86 89 92 94 95 98 100 102 104 106 108 110EV Market Penetration Rate
(BEV/PHEV of total car sales) 0.5% 0.6% 0.8% 1.0% 1.8% 3.6% 5.1% 6.0% 6.8% 7.7% 8.7% 10.0%
EV Car Sales (millions) 0.4 0.5 0.8 0.9 1.8 3.5 5.1 6.1 7.1 8.2 9.3 11.0
NCA share 9% 10% 11% 11% 11% 11% 11% 11% 10% 10% 10% 10%
LFP share 30% 35% 35% 31% 27% 25% 22% 20% 20% 20% 20% 20%
LMO share 5% 5% 5% 5% 4% 4% 3% 3% 2% 2% 1% 1%
NMC 111 share 56% 50% 49% 53% 50% 49% 39% 27% 23% 18% 13% 7%
NMC 622 share 0% 0% 0% 1% 8% 12% 25% 40% 45% 50% 55% 60%
NMC 811 share 0% 0% 0% 0% 0% 0% 0% 0% 0% 0% 1% 2%
EV Car Co Content (kg per kWh) 0.20 0.18 0.18 0.19 0.20 0.20 0.19 0.18 0.17 0.17 0.16 0.15
Average pack size across BEV +
PHEV (kWh) 26.7 28.5 29.3 28.7 29.0 29.4 29.7 30.0 30.4 30.7 31.1 31.4
Cobalt Demand* (kt):
EVs 3 4 5 10 21 29 33 38 42 47 53 59
*assumes purchase 1 year in advance of demand
Global Commodities | Page 16 December 4, 2017

In terms of cobalt, the implication is that one of the major reasons to push for NMC811, highly nickel-
rich cathode chemistry is alleviated. This doesn’t mean that the push for greater energy density won’t
continue or that automakers and battery manufacturers won’t keep pushing towards it, but given the
safety and lifespan concerns that come hand in hand with such a shift there is less pressure to rush
towards this technically difficult transition. We only model 2% of EVs as NMC811 in 2025.
Exhibit 28: We Assume Increasing Use of Nickel-Rich Cathodes for Electric Vehicles …
Exhibit 29: … as the Industry Seeks Higher Energy Density and Lower Cost – Provided Safety Concerns Can Be Addressed
Source: Avicenne, BMO Capital Markets Source: ACS, BMO Capital Markets
We have seen forecasts of over 160kt cobalt demand by 2025 by some reputable research houses. And
there is nothing wrong with those, as our bottom-up modelling in an unconstrained environment would
yield a similar figure. However, as we noted earlier, the maximum available supply we can muster is
137kt. The cobalt market must solve for this through demand thrifting and substitution.
In terms of the main end uses, as discussed above we already assume relatively aggressive thrifting in
EV batteries as cathode chemistries move to more nickel-rich compounds, which helps. Meanwhile, the
natural safety inertia in portable electronics mean mass substitution is improbable in our view. The
other big consumer in terms of aircraft engines also has long qualification periods for new alloys and the
ability to pass through price gains to end users; hence, we see major barriers to switching here.
Thus, we have to look at some of the smaller end uses for substitution. We believe the prosthetics
segment (knee and hip implants) is an area with viable alternatives already, and will be a natural area
of switching; however, this yields less than 1kt of lower demand. We also consider that the use of
cobalt as a binder in diamond and cemented carbide tool applications for metal cutting (currently ~9%
of demand) can be reduced through chemistry redesign, while use in magnets (3%) will see a natural
decline over the coming years. Meanwhile, cobalt use in non-high temperature superalloys for creep
prevention may also come under some pressure from composite materials. Exhibit 30 shows our
assessment of substitution risk across the various end use segments.
0%
10%
20%
30%
40%
50%
60%
70%
80%
90%
100%
2015 2020E 2025E
EV Battery Chemistry Market Share
NMC 811
NMC 622
NMC 111
LMO
LFP
NCA
Global Commodities | Page 17 December 4, 2017

As a result, we have 2025 demand at 148kt, much closer to the supply we have available at the same
time. The substitution impact really starts to kick in from 2020.
Exhibit 30: Cobalt Substitution Risk by End-Demand Segment
Source: CDI, BMO Capital Markets
Of course, there is one other source of supply/demand in the cobalt market, being strategic purchases.
Traditionally, these have come from government reserves, with the US DLA being net sellers of 12kt of
cobalt over the 2000-08 period. More recently, the DLA, Japanese government, and China’s SRB have
been purchasing cobalt sulphate as a strategic resource, effectively adding to demand. We anticipate
that, with a tighter market and higher prices, this will not continue in 2018.
Meanwhile, as the battery story has gained traction we have also seen the emergence of institutional
investors looking for direct cobalt exposure via physical metal positions. While this can amplify price
moves in tight markets (i.e., investors bidding against consumers for the same material), in general we
would view this behaviour as a market buffer, in other words, releasing material when the market is
tight and soaking it up when there is ready availability. To this end, we assume stockpiles (strategic and
institutional) are released over the 2024-25 period to ease the deficit in the market.
End useEstimated proportion of
2017 demand Substitution Risk Alternative material
Metals
Aircraft Engines 8% LowSilicon carbide (SiC) materials used to manufacture ceramic matrix composites
(CMCs)
Prosthetics 1% High Titanium-based alloys
Power Generation 1% Low-Med Nickel based alloys or ceramic-matric composities.
Other Superalloy 6% LowFibre-reinforced metal matrix composites (MMCs), reinforced carbon-carbon
composites, nickel-based and iron-based superalloys.
Magnets 3% MedBarium/strontium ferrites, neodymium-iron-boron magnets and nickel-iron
alloy magnets.
Diamonds & Hard Facing 9% Med-High Reduction of intensity through cobalt-iron-copper and iron-copper compounds.
High Strength Steel 2% Low-Med Iron-nickel alloys, cements, and ceramics.
Chemicals
Batteries - EVs 12% HighReducing cobalt per unit in NCA and NMC batteries. Elimination of liquid
electrolytes and development of solid-state electrodes.
Batteries - Other 43% Low Vanadium flow, zinc bromide redox flow batteries
Catalysts 2% Low-MedRhodium can be used as a hydroformylation catalyst. Ruthenium,
molybdenum, nickel and tungten can be used for hydrodesulphurisation.
Tyres 4% Low
Dyes & Paints 5% Med Cerium, iron, lead, manganese and vanadium.
PET processing 2% Low
Other 2% Low-Med
Global Commodities | Page 18 December 4, 2017

Of course, the London Metal Exchange does have a cobalt futures contract. However, despite some pick-
up in these volumes as the price rallied earlier this year, overall liquidity is still low. Moreover, only
cobalt metal can be used for physical delivery against positions, which, as we have discussed, is a
diminishing part of the overall market, while any liquid cobalt sulphate contract is still years away.
Thus, while the LME price is generally a decent market reference, the contract itself cannot be
considered central to the cobalt market.
Exhibit 31: LME Stocks Have Been Rising, but These Are Small as a Proportion of the Market
Exhibit 32: Trading Volumes on the LME Contract Are Growing Following the Rapid Price Move
Source: LME, BMO Capital Markets Source: LME, BMO Capital Markets
All Roads Lead to Further Price Gains, With a Substitution Level Event Needed
Putting everything together, and incorporating our aggressive assumptions to maximise supply and
substitute demand, our base case balance is shown in Exhibit 33. After a strong surplus post-GFC, we
see the refined cobalt market as having been in deficit since 2013, but 2017’s 4.3kt as the largest yet.
As such, even with strong growth in refined supply over the next couple of years, this only serves to
reduce the deficit. Only in 2020-22 do we return to surplus after more aggressive substitution kicks in.
Beyond this we again foresee a deficit even assuming almost complete release of industry stockpiles.
Notably, we see end-2017 inventory as just five weeks of consumption – lower than they were during
the 2007-08 price spike. And with deficits in the coming years, this drops to two and a half weeks by
end-2019 – a critically low level. Even with our aggressive assumptions, the level of inventory cover
doesn’t recover to end 2016 levels through our forecast period. Without doubt, cobalt is set to be a very
tight market in future years.
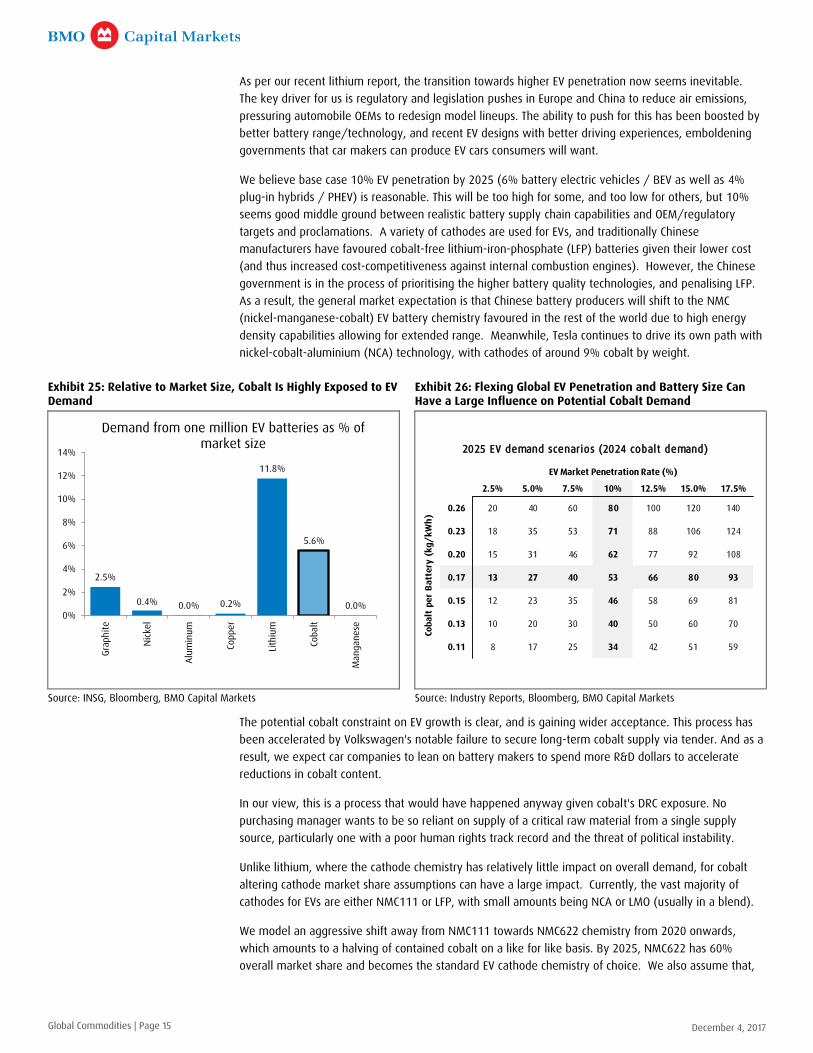
One notable sub-plot we would highlight is the growing dichotomy between metal and chemical
balances in cobalt. With restarts at metal producing operations and overall demand stagnant following
substitution, all other things being equal, cobalt metal could end up in a 30kt surplus. Conversely, direct
cobalt chemical output is set to underperform the growth in battery demand, leading to a rising deficit
in this segment of the market. We do not view this as a problem per se, as metal can be dissolved in
acid to form cobalt sulphate (or other chemicals), but as there is a cost involved with this operation
battery-grade cobalt sulphate would likely realise a premium over and above cobalt content.
Meanwhile, subject to capex costs we would anticipate some current metal producers might alter their
process to focus on the chemical market growth.
0
100
200
300
400
500
600
700
800
900
Oct
10
Jan 1
1A
pr
11
Jul 11
Oct
11
Jan 1
2A
pr
12
Jul 12
Oct
12
Jan 1
3M
ay
13
Aug 1
3N
ov
13
Feb 1
4M
ay
14
Aug 1
4N
ov
14
Feb 1
5M
ay
15
Aug 1
5N
ov
15
Feb 1
6M
ay
16
Aug 1
6N
ov
16
Feb 1
7M
ay
17
Aug 1
7
Tonnes
LME Warehouse Stocks
0
500
1000
1500
2000
2500
3000
Oct
10
Oct
11
Oct
12
Oct
13
Oct
14
Oct
15
Oct
16
Oct
17
Contr
act
s
LME Cumulative Monthly Volumes
Global Commodities | Page 19 December 4, 2017
Exhibit 33: After a Period of Heavy Stocking Post-GFC, We Have Strong Deficits Over 2015-2019
Exhibit 34: The Metal Surplus and Chemical Deficit Are Set to Grow, Unless Established Processing Capacities Change
Source: CRU, CDI, BMO Capital Markets Source: CDI, BMO Capital Markets
From 96kt in 2016, we see the cobalt market size growing to 142kt in 2025, a 4.5% CAGR. The majority
of the supply bridge to this level will come from DRC supply, with just over a quarter coming from
increased secondary supply. For demand, essentially all the growth is from batteries, with net other
demand showing a slight fall.
0
2
4
6
8
10
12
14
16
-6
-4
-2
0
2
4
6
2007
2008
2009
2010
2011
2012
2013
2014
2015
2016
2017E
2018E
2019E
2020E
2021E
2022E
2023E
2024E
2025E
kt C
o
Cobalt Market Balance
Market Balance
Weeks ofinventory (RHS)
-50
-40
-30
-20
-10
0
10
20
30
40
2010
2011
2012
2013
2014
2015
2016
2017E
2018E
2019E
2020E
2021E
2022E
2023E
2024E
2025E
kt
Cobalt balance by product form
Chemical Balance
Metal Balance
Global Commodities | Page 20 December 4, 2017

In terms of key risks to this forecast, all the major ones would drive downside to market size. If DRC
supply were to be flat on today’s levels, the 2025 market size would essentially still be ~100kt. This
reinforces the importance of the DRC to cobalt market growth – without it EV penetration simply has to
slow. Exhibit 36 also considers potential demand side scenarios that would reduce market size. Were
EV penetration to only be 5% in 2025 (at the low end of industry expectations) rather than our 10%
assumption, keeping the relative cathode shares the same this would see a 26kt drop in cobalt demand.
If NMC811 technology were to become the mainstream this could reduce demand by 37kt. Finally, if
the lack of material were to drive cobalt out of smartphones this would see a 22kt drop in market size.
All these scenarios would result in less substitution needed in other areas, but we would also note that
while they affect 2025 demand, they would not avoid the imbalance problems we are facing before the
end of the decade.
Exhibit 35: Our Base Case for Changes in Cobalt to 2025 – We Have to Assume Substitution in Other Areas to Make Way for EVs
Exhibit 36: Potential Impacts on Cobalt Market Size in 2025 From Various Scenarios
Source: CRU, CDI, BMO Capital Markets Source: CDI, BMO Capital Markets
96
96
142
60
70
80
90
100
110
120
130
140
150
160
2016 leve
l
DRC
Min
e S
upply
Oth
er
Min
e S
upply
Seco
ndar
y Su
pply
Conce
ntr
ate s
tock
chan
ge
2025E
leve
l
Bat
tery
Dem
and
Net
Oth
er
Dem
and
Stock
pile
Sal
es
2016 leve
l
kt C
o
Changes in the cobalt market, 2025E vs. 2016
-40
-26
-22
-37
-50 -40 -30 -20 -10 0
DRC mine output doesn't grow
2025 EV penetration only 5% not10%
New technology replaces LCO insmartphones
All NMC batteries move to 811(lower Co) chemistry by 2025
kt
Impact on cobalt market size
Global Commodities | Page 21 December 4, 2017

For cobalt, there are no published inventory figures such as those widely available for the base metals.
However, we can imply changes to these from the balances in the market. Exhibit 37, using the start of
2010 as a base, shows our expectations of the cumulative changes in stocks. Pre-refined (mined but not
refined) cobalt unit inventory rose strongly over 2010-11, and continued to rise through 2016.
However, with the problems in mine output we see a destock in 2017, and another next, reflecting a
raw material constraint passing through the process chain and tying in well with price action to date.
Meanwhile, refined inventory is now lower than levels seen at the start of 2010 following five
consecutive years of deficit. And by 2019-2020 on our base case, total cobalt units across the chain will
be lower than at the start of 2010, while global demand is ~60% higher.
The impact of inventory draws through the chain plays into our price outlook. While pre-refined
inventory was high (with most of this sitting in China) the cobalt price underperformed. Now, this
overhang is gone and available supply is set to get increasingly tight. We expect the gains in DRC
output will keep 2018’s average at or around current spot levels of ~$31/lb. However, to kick-start the
processes needed to solve for the supply constraint, we forecast a rise to >$40/lb on average in 2019
with potential for a spike above 2007’s ~$50/lb peak – this is the Substitution Level Event needed. With
a shift back to surplus, we forecast $30/lb for 2021. Essentially, we have on average doubled our price
forecast over the coming years.
Assessing a long-term price is more challenging for cobalt than for other commodities, given standard
incentive price models don’t work for co-products. Instead, we look towards what might be a
sustainable through the cycle price for cobalt. As we noted before, taking a guide from history the
average price in real terms is just over $22/lb. We thus raise our long-term price to $22.5/lb (from
$15/lb previously), though given the tight market ahead it may be many years before we see this level.
Exhibit 37: This Year Has Seen a Significant Draw in Cobalt Units Contained in Both Refined and Upstream Material, as Will 2018
Exhibit 38: We See the Cobalt Price Gaining Further in 2019-20 to Encourage Market Solutions, and Raise LT to $22.50/lb
Source: CRU, CDI, BMO Capital Markets Source: Metal Bulletin, BMO Capital Markets
-10
-5
0
5
10
15
20
25
30
35
2010
2011
2012
2013
2014
2015
2016
2017E
2018E
2019E
2020E
2021E
2022E
2023E
2024E
2025E
kt C
o
Cumulative stock build from start of 2010
Refined Pre-refined
14.412.9
11.5
24.8
30.9
40.538.8
30.022.5
0
5
10
15
20
25
30
35
40
45
2014
2015
2016
2017E
2018E
2019E
2020E
2021E
Long
Term
Cobalt price forecast, $/lb
Global Commodities | Page 22 December 4, 2017

Putting everything together, we see the following implications related to the cobalt market:
Further strong price gains over the coming two to three years
EV demand for cobalt forcing substitution in other end uses
A shift in EV cathode chemistry away from cobalt towards nickel
Li-ion battery recycling seeing accelerated growth
A discount emerging for material from the DRC where traceability cannot be proven
A cobalt sulphate premium over metal to reflect the deficit in the chemical market
A need to see new cobalt projects to balance the books by the middle of the next decade
Exhibit 39: BMO Cobalt Supply-Demand Balance
Source: CDI, BMO Capital Markets
2015 2016 2017E 2018E 2019E 2020E 2021E 2022E 2023E 2024E 2025E
SUPPLY
Mine Supply
Primary kt 8.3 7.6 5.3 1.8 2.5 3.9 6.5 6.2 5.7 5.3 5.3
Nickel co-product kt 40.5 39.3 42.1 44.4 45.6 46.2 48.2 50.4 51.9 51.8 53.1
Copper co-product kt 63.7 66.3 63.9 77.9 93.4 103.5 109.5 112.0 112.3 112.3 114.3
Other co-product kt 0.3 0.3 0.3 0.3 0.3 0.3 0.3 0.3 0.3 0.3 0.3
Total kt 112.9 113.5 110.5 119.4 136.1 147.7 157.9 162.1 163.3 162.9 166.0
YoY change % 6% 1% -3% 8% 14% 9% 7% 3% 1% 0% 2%
Process Losses -20 -20 -20 -21 -24 -27 -28 -29 -29 -29 -30
Recoverable Cobalt 92.6 93.1 90.6 97.9 111.6 121.2 129.4 132.9 133.9 133.5 136.1
Refined Supply
Metals kt 38.2 33.7 35.2 43.3 51.9 57.5 59.0 60.1 60.0 59.7 59.7
Chemicals kt 45.0 50.9 50.7 51.3 51.3 50.7 52.2 52.7 54.7 54.7 54.7
Secondary kt 7.7 8.4 10.4 11.2 12.9 14.6 16.6 18.1 19.6 21.1 22.6
Total kt 90.8 92.9 96.2 105.7 116.1 122.8 127.7 130.9 134.3 135.5 137.0
YoY change % 3% 2% 4% 10% 10% 6% 4% 2% 3% 1% 1%
CONSUMPTION
Metals kt 28.6 29.2 29.5 29.5 29.6 29.7 29.7 29.9 30.0 30.2 30.3
Chemicals kt 62.9 63.6 69.0 79.7 87.1 89.1 94.1 99.2 104.1 110.8 117.5
Stockpiles kt 2.2 2.8 2.0 0.0 0.0 0.0 0.0 0.0 0.0 -3.0 -6.0
Total kt 93.7 95.6 100.5 109.2 116.7 118.8 123.8 129.1 134.1 137.9 141.8
YoY change % 5% 2% 5% 9% 7% 2% 4% 4% 4% 3% 3%
Surplus (Deficit) kt -2.8 -2.7 -4.3 -3.5 -0.6 4.0 3.9 1.8 0.2 -2.4 -4.8
Inventory kt 16.8 14.1 9.7 6.2 5.6 9.6 13.5 15.2 15.5 13.1 8.3
Weeks of Consumption 9 8 5 3 2 4 6 6 6 5 3
Global Commodities | Page 23 December 4, 2017

IMPORTANT DISCLOSURES
Analyst's Certification
I, Colin Hamilton, hereby certify that the views expressed in this report accurately reflect my personal views about the subject securities orissuers. I also certify that no part of my compensation was, is, or will be, directly or indirectly, related to the specific recommendations or viewsexpressed in this report.
Analysts who prepared this report are compensated based upon (among other factors) the overall profitability of BMO Capital Markets andtheir affiliates, which includes the overall profitability of investment banking services. Compensation for research is based on effectiveness ingenerating new ideas and in communication of ideas to clients, performance of recommendations, accuracy of earnings estimates, and serviceto clients.
Analysts employed by BMO Nesbitt Burns Inc. and/or BMO Capital Markets Limited are not registered as research analysts with FINRA. Theseanalysts may not be associated persons of BMO Capital Markets Corp. and therefore may not be subject to the FINRA Rule 2241 restrictions oncommunications with a subject company, public appearances and trading securities held by a research analyst account.
Company Specific Disclosures
For Important Disclosures on the stocks discussed in this report, please go to http://researchglobal.bmocapitalmarkets.com/Public/Company_Disclosure_Public.aspx.
Distribution of Ratings (December 03, 2017)
Rating category BMO rating BMOCM USUniverse*
BMOCM US IBClients**
BMOCM US IBClients***
BMOCMUniverse****
BMOCM IBClients*****
StarMineUniverse
Buy Outperform 47.1% 24.4% 59.1% 49.0% 59.1% 53.9%
Hold Market Perform 49.5% 15.4% 39.1% 47.7% 39.4% 41.1%
Sell Underperform 3.4% 10.0% 1.7% 3.2% 1.5% 5.0%
* Reflects rating distribution of all companies covered by BMO Capital Markets Corp. equity research analysts.** Reflects rating distribution of all companies from which BMO Capital Markets Corp. has received compensation for Investment Banking servicesas percentage within ratings category.*** Reflects rating distribution of all companies from which BMO Capital Markets Corp. has received compensation for Investment Bankingservices as percentage of Investment Banking clients.**** Reflects rating distribution of all companies covered by BMO Capital Markets equity research analysts.***** Reflects rating distribution of all companies from which BMO Capital Markets has received compensation for Investment Banking servicesas percentage of Investment Banking clients.
Ratings Key (as of October 2016)
We use the following ratings system definitions:OP = Outperform - Forecast to outperform the analyst’s coverage universe on a total return basis;Mkt = Market Perform - Forecast to perform roughly in line with the analyst’s coverage universe on a total return basis;Und = Underperform - Forecast to underperform the analyst’s coverage universe on a total return basis;(S) = Speculative investment;Spd = Suspended - Coverage and rating suspended until coverage is reinstated;NR = No Rated - No rating at this time; andR = Restricted - Dissemination of research is currently restricted.
BMO Capital Markets' seven Top 15 lists guide investors to our best ideas according to different objectives (CDN Large Cap, CDN Small Cap, USLarge Cap, US Small Cap, Income, CDN Quant, and US Quant have replaced the Top Pick rating).
Prior BMO Capital Markets Rating System
(April 2013 - October 2016)http://researchglobal.bmocapitalmarkets.com/documents/2013/rating_key_2013_to_2016.pdf
(January 2010 - April 2013)http://researchglobal.bmocapitalmarkets.com/documents/2013/prior_rating_system.pdf
Other Important Disclosures
For Important Disclosures on the stocks discussed in this report, please go to http://researchglobal.bmocapitalmarkets.com/Public/Company_Disclosure_Public.aspx or write to Editorial Department, BMO Capital Markets, 3 Times Square, New York, NY 10036 or EditorialDepartment, BMO Capital Markets, 1 First Canadian Place, Toronto, Ontario, M5X 1H3.
Global Commodities | Page 24 December 4, 2017

Dissemination of Research
Dissemination of BMO Capital Markets Equity Research is available via our website https://research-ca.bmocapitalmarkets.com/Public/Secure/Login.aspx? ReturnUrl=/Member/Home/ResearchHome.aspx. Institutional clients may also receive our research via Thomson Reuters, Bloomberg,FactSet, and Capital IQ. Research reports and other commentary are required to be simultaneously disseminated internally and externally toour clients.
~ Research distribution and approval times are provided on the cover of each report. Times are approximations as system and distributionprocesses are not exact and can vary based on the sender and recipients’ services. Unless otherwise noted, times are Eastern Standard andwhen two times are provided, the approval time precedes the distribution time.
BMO Capital Markets may use proprietary models in the preparation of reports. Material information about such models may be obtained bycontacting the research analyst directly. There is no planned frequency of updates to this report.
General Disclaimer
"BMO Capital Markets" is a trade name used by the BMO Investment Banking Group, which includes the wholesale arm of Bank of Montreal andits subsidiaries BMO Nesbitt Burns Inc., BMO Capital Markets Limited in the U.K. and BMO Capital Markets Corp. in the U.S. BMO Nesbitt BurnsInc., BMO Capital Markets Limited and BMO Capital Markets Corp are affiliates. Bank of Montreal or its subsidiaries ("BMO Financial Group") haslending arrangements with, or provide other remunerated services to, many issuers covered by BMO Capital Markets. The opinions, estimatesand projections contained in this report are those of BMO Capital Markets as of the date of this report and are subject to change without notice.BMO Capital Markets endeavours to ensure that the contents have been compiled or derived from sources that we believe are reliable andcontain information and opinions that are accurate and complete. However, BMO Capital Markets makes no representation or warranty, expressor implied, in respect thereof, takes no responsibility for any errors and omissions contained herein and accepts no liability whatsoever for anyloss arising from any use of, or reliance on, this report or its contents. Information may be available to BMO Capital Markets or its affiliates thatis not reflected in this report. The information in this report is not intended to be used as the primary basis of investment decisions, and becauseof individual client objectives, should not be construed as advice designed to meet the particular investment needs of any investor. Nothingherein constitutes any investment, legal, tax or other advice nor is it to be relied on in any investment or decision. If you are in doubt about anyof the contents of this document, the reader should obtain independent professional advice. This material is for information purposes only andis not an offer to sell or the solicitation of an offer to buy any security. BMO Capital Markets or its affiliates will buy from or sell to customersthe securities of issuers mentioned in this report on a principal basis. BMO Capital Markets or its affiliates, officers, directors or employees havea long or short position in many of the securities discussed herein, related securities or in options, futures or other derivative instruments basedthereon. The reader should assume that BMO Capital Markets or its affiliates may have a conflict of interest and should not rely solely on thisreport in evaluating whether or not to buy or sell securities of issuers discussed herein.
Additional Matters
To Canadian Residents: BMO Nesbitt Burns Inc. furnishes this report to Canadian residents and accepts responsibility for the contents hereinsubject to the terms set out above. Any Canadian person wishing to effect transactions in any of the securities included in this report shoulddo so through BMO Nesbitt Burns Inc.
The following applies if this research was prepared in whole or in part by Andrew Breichmanas, Colin Hamilton, Alexander Pearce, David Round,Edward Sterck or Brendan Warn: This research is not prepared subject to Canadian disclosure requirements. This research is prepared by BMOCapital Markets Limited and subject to the regulations of the Financial Conduct Authority (FCA) in the United Kingdom. FCA regulations require thata firm providing research disclose its ownership interest in the issuer that is the subject of the research if it and its affiliates own 5% or more ofthe equity of the issuer. Canadian regulations require that a firm providing research disclose its ownership interest in the issuer that is the subjectof the research if it and its affiliates own 1% or more of the equity of the issuer that is the subject of the research. Therefore BMO Capital MarketsLimited will disclose its and its affiliates' ownership interest in the subject issuer only if such ownership exceeds 5% of the equity of the issuer.
To E.U. Residents: In an E.U. Member State this document is issued and distributed by BMO Capital Markets Limited which is authorised andregulated in the UK and operates in the E.U. on a passported basis. This document is only intended for Professional Clients, as defined in AnnexII to “Markets in Financial Instruments Directive” 2004/39/EC (“MiFID”).
Singapore: This disclaimer applies to research reports distributed by the Private Banking unit of Bank of Montreal, Singapore Branch ("BMO SG"),an exempt financial adviser under the Financial Advisers Act (Cap. 110) of Singapore ("FAA") only. This research report is prepared by BMO CapitalMarkets and distributed by BMO SG pursuant to an arrangement under regulation 32C of the Financial Advisers Regulations of Singapore. Thisresearch report is distributed by BMO SG solely to persons who qualify as accredited investors as defined in the FAA only, and is not intendedfor and may not be circulated to the general public. This report and any information contained in this report shall not be disclosed to any otherperson. If you are not an accredited investor, please disregard this report. BMO SG does not accept legal responsibility for the contents of thereport. Recipients should contact BMO SG at 65-6535 2323 for matters arising from, or in connection with the report.
To U.S. Residents: BMO Capital Markets Corp. furnishes this report to U.S. residents and accepts responsibility for the contents herein, except tothe extent that it refers to securities of Bank of Montreal. Any U.S. person wishing to effect transactions in any security discussed herein shoulddo so through BMO Capital Markets Corp.
To U.K. Residents: In the UK this document is published by BMO Capital Markets Limited which is authorised and regulated by the Financial ConductAuthority. The contents hereof are intended solely for the use of, and may only be issued or passed on to, (I) persons who have professionalexperience in matters relating to investments falling within Article 19(5) of the Financial Services and Markets Act 2000 (Financial Promotion)Order 2005 (the "Order") or (II) high net worth entities falling within Article 49(2)(a) to (d) of the Order (all such persons together referred to as"relevant persons"). The contents hereof are not intended for the use of and may not be issued or passed on to retail clients.
Global Commodities | Page 25 December 4, 2017
ADDITIONAL INFORMATION IS AVAILABLE UPON REQUESTBMO Financial Group (NYSE, TSX: BMO) is an integrated financial services provider offering a range of retail banking, wealth management, and investment and corporate
banking products. BMO serves Canadian retail clients through BMO Bank of Montreal and BMO Nesbitt Burns. In the United States, personal and commercial bankingclients are served by BMO Harris Bank N.A., (Member FDIC). Investment and corporate banking services are provided in Canada and the US through BMO Capital Markets.
BMO Capital Markets is a trade name used by BMO Financial Group for the wholesale banking businesses of Bank of Montreal, BMO Harris Bank N.A, (Member FDIC), BMOIreland Plc, and Bank of Montreal (China) Co. Ltd. and the institutional broker dealer businesses of BMO Capital Markets Corp. (Member SIPC) in the U.S., BMO Nesbitt Burns
Inc. (Member Canadian Investor Protection Fund) in Canada, Europe, and Asia, BMO Capital Markets Limited in Europe and Australia and BMO Advisors Private Limited in India.
® Registered trademark of Bank of Montreal in the United States, Canada and elsewhere.TM Trademark Bank of Montreal
©COPYRIGHT 2017 BMO CAPITAL MARKETS CORP.
A member of
These documents are provided to you on the express understanding that they must be held in complete confidence and not republished,retransmitted, distributed, disclosed, or otherwise made available, in whole or in part, directly or indirectly, in hard or soft copy, through anymeans, to any person, except with the prior written consent of BMO Capital Markets.
Click here for data vendor disclosures when referenced within a BMO Capital Markets research document.
Global Commodities | Page 26 December 4, 2017