Global Coffee Data Standard Documentation
41
Global Coffee Data Standard Documentation Release 1.0.0 Paul Meems Apr 30, 2019
Transcript of Global Coffee Data Standard Documentation
Global Coffee Data StandardDocumentation
Release 1.0.0
Paul Meems
Apr 30, 2019


Contents
1 Partners of this project 31.1 Common Indicators for Coffee Sustainability . . . . . . . . . . . . . . . . . . . . . . . . . . . . . . 41.2 Use cases . . . . . . . . . . . . . . . . . . . . . . . . . . . . . . . . . . . . . . . . . . . . . . . . . 61.3 Governance . . . . . . . . . . . . . . . . . . . . . . . . . . . . . . . . . . . . . . . . . . . . . . . . 81.4 Global Coffee Data Standard . . . . . . . . . . . . . . . . . . . . . . . . . . . . . . . . . . . . . . . 131.5 Overview of JSON schema . . . . . . . . . . . . . . . . . . . . . . . . . . . . . . . . . . . . . . . . 36
2 Indices and tables 37
i

ii

Global Coffee Data Standard Documentation, Release 1.0.0
This project displays the initial basic common indicators for farm-level coffee sustainability. The common indicatorsare a result of a collective multi-stakeholder approach on defining key metrics for sustainability performance, basedon the Sustainability Progress Framework elaborated under the joint facilitation of the Sustainable Coffee Challenge(SCC) and the Global Coffee Platform (GCP). COSA – with feedback from the members of a carefully selectedglobal expert committee – have developed and synthesized practical metrics to operationalize the indicators so theycan be functional across origins and comparable over time. The approach builds on extensive global experience withsustainability metrics and the expertise of the committee members.
Contents 1

Global Coffee Data Standard Documentation, Release 1.0.0
2 Contents

CHAPTER 1
Partners of this project
3
Global Coffee Data Standard Documentation, Release 1.0.0
The project has been supported by the ISEAL Innovations Fund, administered by the ISEAL Alliance
The ISEAL Innovations Fund is supported by the following partners:
1.1 Common Indicators for Coffee Sustainability
1.1.1 Guidelines & Key Information
This project displays the initial basic common indicators for farm-level coffee sustainability. The common indicatorsare a result of a collective multi-stakeholder approach on defining key metrics for sustainability performance, basedon the Sustainability Progress Framework elaborated under the joint facilitation of the Sustainable Coffee Challenge(SCC) and the Global Coffee Platform (GCP). The objective of this project was to define common denominators ofindicators that are considered most important by a range of experts and practitioners. An additional criterion wasthe feasibility and complexity of the indicators. COSA–with feedback from the members of a carefully selectedglobal expert committee – have developed and synthesized practical metrics to operationalize the indicators so theycan be functional across origins and comparable over time. The approach builds on extensive global experience withsustainability metrics and the expertise of the committee members.
Data Privacy
In the framework for this project, no data will be shared. However, it lays the ground for the potential to exchange dataand making it easier to do so if needed, be it between business partners, or for sending information to a sustainabilitystandard, etc. The project’s underlying philosophy is that every party has sovereignty over their own data and is notobligated to share it.
4 Chapter 1. Partners of this project

Global Coffee Data Standard Documentation, Release 1.0.0
Impact vs. Monitoring Data
The following indicator approaches are built on a Monitoring methodology and not a Full Impact approach. TheMonitoring approach generally relies on farmer recall of the most recent production year and reasonable local estimatesthat can provide good enough information in a simple way. This can facilitate wide adoption and use without theburden of full accounting which can be onerous for some organisations and farmers. Full Impact approaches canbe used where desired and are in many cases compatible as it provides more accurate information but requires moreinvestment and time in detailed record keeping, accounting, and data gathering skills.
Sustainability Monitoring (through farmer surveys) usually relies on a single farmer’s response per household–usuallythe head of household. The head of the household can be any one person in the household but is generally the farmowner or main decision maker. To track activities or other engagements provided to farmers through programs orinitiatives, an organisation may wish to capture additional information on multiple individuals in a household whererelevant (e.g., all training or service recipients). COSA has a separate protocol for this type of producer and householdidentification and tracking and can provide that to interested organisations.
Producer Sampling Guidelines
1. Representativeness: While sampling all farmers in a target group (census) is ideal, sampling a portion of farmerscan be appropriate if the farmers selected for the survey are representative of the target population as a whole.Being aware of the homogeneity of the farmer population is important as well as individual farmer locations.The ideal approach would be a simple random sample where the appropriate number of farmers are randomlyselected from a list and surveyors go to that list of farms to conduct the surveys. COSA has a Sample Sizecalculator built for Monitoring applications specifically.
2. The accuracy of farmer recall (memory) diminishes significantly beyond one year, so try only to ask aboutthe last production cycle. It is also optimal to visit farmers soon after the main harvest period (and ideally atapproximately the same time each year). It is important to ask questions as close to the end of the last productionyear as possible to ensure that the full production and harvest cycle is included in the response. The productionyear refers to the end of the last harvest to the end of the corresponding harvest before that (12 month period).
3. Try to talk to the head of the household for each farm (different people may give you different perspectives buttypically the decision-makers will yield the most accurate results).
4. Quality checks in the first week of a surveyor’s work can also make a big difference; make sure surveyors stickto the specific questions as written.
Certification & Audit Data
Some of the indicator data below may be covered in audits or through other compliance inquiries. If an entity wishesto use that data to report on the indicator framework, please be aware of the following:
1. Compliance and audit data are usually collected on a much smaller sample of farmers than typical monitoringapproaches (audit sampling typically relies on square root sampling instead of a large enough population toensure statistically sound results). This means that audit data may not be representative of the whole population.
2. Compliance data typically gives the user a binary result on a single topic, i.e., whether a certain condition wasmet or not. It does not usually convey the degree to which a certain condition was met, nor can it be used to seeincremental change over time. Therefore, to achieve more control over the supply chain and improve the abilityto remedy significant issues, it is strongly recommended to use the SMART indicator approaches detailed below(in fact, the approaches below could be built into an organisation’s compliance assessment tools).
1.1. Common Indicators for Coffee Sustainability 5

Global Coffee Data Standard Documentation, Release 1.0.0
Guidance on Green Bean Equivalent calculation
For Green Bean Equivalent (GBE) calculations, one may follow the conversion rates as recommended by the In-ternational Coffee Organisation (ICO) and quoted in the Coffee Exporters Guide (http://www.thecoffeeguide.org/coffee-guide/world-coffee-trade/conversions-and-statistics/). However, for some locations, other conversion ratesmight be recommended. Please make sure these local differences are taken into account in the relevant cases.
The reference framework for first mile farm data
For its development, the Global Coffee Data Standard has taken the reference framework for first-mile-farm data as astarting point (https://farm-level-data-standard.readthedocs.io/en/latest/). In particular, the conceptual model has beenembraced.
The first-mile reference framework has organised key data entities in the data structure, such as farmer groups, farmers,farms and plots in such a way that, many different concepts of agriculture can be incorporated, including family farms,sharecroppers, communal farms, industrial farms. In addition, the data structure is designed in such a way that itclosely matches the way end-users think and talk about concepts in the real world.
It is therefore assumed that multiple organisations can easily develop a mapping from their own internal data structuresonto such conceptual model because of the internal logic of the end-user community. The data model can thereforefunction as a neutral and organisation independent interface for the data from one database to another database. Inanalogy of the first-mile reference framework, each data element in the Global Coffee Data Standard is linked to theappropriate farmer, farm, plot level.
Also, the concept of a Global ID has been incorporated, allowing to trace each dataset back to its organisationof origin.
1.2 Use cases
The data standard for coffee sustainability indicators allows all actors along the coffee supply chain to compare,aggregate and exchange coffee sustainability data without having to clean and reorganize data manually. This enablesthe sector stakeholders to:
• align and streamline sustainability measurement
• reduce (data) production & transaction efforts and cost
• prepare for SDG and sustainability reporting requirements (e.g. EU legislation)
• publish comparable sustainability data
The data standard can be applied independent of any specific technology solution or reporting engine. Anyone workingwith data and sustainability measurement will be able to implement the results into any technology solution.
In terms of data exchange between commercial supply chain actors (farmers, cooperatives, traders, agents, roasters,retailers), there are two major use cases, vertical and horizontal exchange.
On the one hand, the standard might be used to facilitate data flow within one vertical and private supply chain betweentwo or more actors, e.g. from the cooperative to a trader or from the trader to a roaster. I.e. a cooperative might passon sustainability information attributed to the produce to a trader, who in turn might pass it on to its customer.
On the other hand, the standard might be used to facilitate horizontal exchange and aggregation between peers, e.g.to support joint sustainability reporting for a specific region or country. This might be especially relevant for theimplementation of a sustainable region or a jurisdictional approach to sustainability, also known as verified sourcingarea.
More specific use cases of the data standard include:
6 Chapter 1. Partners of this project

Global Coffee Data Standard Documentation, Release 1.0.0
1.2.1 Narrative 1: Demonstrating impact
Standards & companies are better enabled to demonstrate impact in a comparable manner and their contribution tocollective impact with minimal additional effort. The Global Coffee Data Standard creates a baseline of data elementswhich can be used for the purposes of international reporting. When these indicators are implemented by mappinginternal data to the Global Coffee Data Standard, reports and even comparisons between organisations are easily made.The indicators in the Global Coffee Data Standard are aligned with the Sustainable Development Goals, the ISEALCommon Core Indicators as well as other relevant publicly referenced indicator sets.
1.2.2 Narrative 2: Improving data quality
When the Global Coffee Data standard is widely implemented, datasets can easily be exchanged between organi-sations. This enables certification standards, companies and public institutions to cross-validate data, leading to asignificant data quality improvement.
1.2.3 Narrative 3: The development of farmer services
Standardized data make it easier to develop targeted farmer services. E.g. if farm-level data are available in a standard-ized format, a bank can develop protocols to use this data to determine his or her bankability. Equally, other serviceproviders, such as extension services, logistics or an input provider, will be enabled to operate more efficiently withbetter information available. Better comparable data can as well lead to better targeted agricultural policies by localand national governments.
1.2.4 Narrative 3: Reducing the effort of data collection
Data collection in the field is a demanding task, both for the farmer as well as for the data collector. Availability andexchange of farm data may reduce the need for additional data collection, for at least for the standard indicators. Theexisting data (of another organisation) may even be used for data analytics, for example to determine which area theseproblems are most likely to occur.
1.2.5 Narrative 4: Supporting traceability
Consumers more and more want to know where the product the buy comes from and how sustainably it is produced.When coffee data is globally standardized, this information can be provided to consumers about all coffee producingareas in the world in a standardized way, tapping into a global data resource.
1.2.6 Narrative 5: Supporting the development of sector-specific information tech-nology
Currently every company, standard, public institute is developing its own technical infrastructure to manage or monitorthe coffee sector. If these actors are more aligned in which data is collected, how data is collected and how data isstored, it will become easier to develop the specific digital tools. This applies to data collection tools, managementinformation systems, data analytics, visualization and data exchange via an API.
1.2.7 Narrative 6: Facilitating certification audits
The role of a control body is to inspect if all practices at a farm or farmers group are being performed conformcertification requirements and to inform the voluntary standards system about the results of the inspection. If theauditor, the person who actually performs the inspection, could receive farm data in advance, he could make a pre
1.2. Use cases 7
Global Coffee Data Standard Documentation, Release 1.0.0
analysis which farms he likes to visit and can use this information as a guidance in the field to focus on specificfarmers or topics. The data can also be helpful to validate some audit points in advance before the field visit or to prefill some of the data points that need to be collected in the field, for example it is less work to check a field boundarythen to measure it, saving time and money. The reuses of existing data will be facilitated if all organisation use moreor less the same data formats, can map their data on an exchange format and use the same data collection methods.
1.3 Governance
As the Global Coffee Data Standard develops over time, with updated versions and new publishers, it is importantthat a diverse group of stakeholders are engaged in the process. This document outlines the governance and revisionprocesses for the Global Coffee Data Standard.
1.3.1 Version 1.0 and Beyond
The Global Coffee Data Standard was initially developed through an iterative process in 2017 & 2018, resulting in aninitial draft version in November 2018.
During 2019, we have been working towards a first version of the standard, version 1.0. Our work has focused onaddressing some issues identified through wider adoption of the Standard during 2019 and 2020.
This document outlines a process for managing changes to the Global Coffee Data Standard during the move from adraft version to an officially agreed version, which will be numbered 1.0.
Currently the following new projects from the ISEAL Innovation Fund are upcoming:
1. The Delta Project with BCI, GCP, partnering with the International Coffee Organisation (ICO) and the Interna-tional Cotton Advisory Committee (ICAC) to develop common cross-commodity sustainability indicators.
It is expected that the further development, adoption and elaboration of the data standard becomes an integral part ofthese projects.
1.3.2 Stewardship and Governance
Global Coffee Platform (GCP) acts as the lead steward of the Global Coffee Data Standard. The organisation is led byan Executive Director. The organisation’s activities are overseen by a Board of Directors.
In the pursuit of openness and community-driven process, subscribers to the Global Coffee Data Standard and thoseengaging with the Global Coffee Data Standard GitHub repository will be kept informed at all stages about plannedrevisions to the Global Coffee Data Standard, and will be offered clear and timely opportunities to input and comment.
To ensure the relevance, quality and effective implementation of proposed updates to the Standard, new version re-leases will be subjected to a process of peer review with invited reviewers from publisher and user communities, andan open review process.
A Standard Stewardship Committee, responsible for giving final approval to formal upgrades of the Standard andensuring the processes in this document have been properly carried out will be set up in due course.
Intellectual property
The Global Coffee Data Standard is the joint intellectual property of GCP and ISEAL.
Contributors to the Global Coffee Data Standard agree to transfer any copyright in their contributions to GCP andCOSA, in order that it is held in trust as part of the Standard. No content infringing upon third-party IntellectualProperty Rights will be included in the Standard.
8 Chapter 1. Partners of this project

Global Coffee Data Standard Documentation, Release 1.0.0
Governance principles
We are committed to the Open Standard principles for standards development. The Global Coffee Data Standard hasbeen developed with:
• Due process: Decisions will be made with equity and fairness among participants. Through an open process forsubmitting issues, extensions and requests for updates, no one party will dominate or guide standard develop-ment. All processes will be transparent and opportunities will exist to appeal decisions. Processes for periodicstandards review and updating are well defined in this document.
• Broad consensus: The process will allow for all views to be considered and addressed, such that agreement canbe found across a range of interests.
• Transparency: We will provide advance public notice of proposed standards development activities, the scopeof work to be undertaken and conditions for participation. Easily accessible records of decisions and the mate-rials used in reaching those decisions will be provided. Public comment periods will be provided before finalstandards approval and adoption.
• Balance: Standard activities will not be exclusively dominated by any particular person, company or interestgroup.
• Openness: The Global Coffee Data Standard processes are open to all interested and informed parties.
1.3.3 Versioning and Upgrade Process
Over time, changes will be needed to the Standard, including addition of new codes and fields, and occasionallyinvolving changes to existing fields and structures.
The revision process will ensure:
• The consequences of any change for different stakeholders are identified and considered; It is clear why changesare needed, and that there is broad support for any proposed changes;
• Changes are easy to identify and are transparent, and publishers, users and intermediaries have clear documen-tation to allow them to update their data and tools;
• Changes to the Global Coffee Data Standard should be made periodically, with the version number of thestandard incremented to indicate that changes have been made, and a change-log maintained.
• That backwards compatibility will be maintained wherever possible.
Versions
Distinct branches of the Standard will be maintained within Github for each version. Branches can be in one of twostates:
• Development. Both schema and documentation on a development branch can be updated and should only beimplemented on an experimental basis.
• Master. Only documentation updates are permitted on a master branch. All documentation changes must bereviewed to ensure they do not make any changes to the meaning of the Standard.
Semantic Versioning practices will be used to distinguish between:
• Major versions which make backwards-incompatible API changes; and
• Minor versions which add functionality in a backwards-compatible manner.
These are captured by a version number in the format MAJOR.MINOR
1.3. Governance 9

Global Coffee Data Standard Documentation, Release 1.0.0
Revision process
To release a new minor or major version upgrade will involve a number of stages outlined in the flowchart below, anddescribed in more depth in the following sections.
10 Chapter 1. Partners of this project

Global Coffee Data Standard Documentation, Release 1.0.0
1.3. Governance 11

Global Coffee Data Standard Documentation, Release 1.0.0
The revision process will follow these general principles:
• Publicity: All stages of the revision process will be announced via the GCP website. This is the formal channelfor notification during the process.
• Consensus: The process should act in the interest of the data standard, with particular consideration givento what the changes will mean for current publishers. All processes should aim towards gaining communityconsensus for changes. In cases where consensus cannot be reached, the process will be put to a final majorityvote by the Stewardship Committee. The GCP technical team are responsible for generating key documentationduring the process, but should always be guided by community consensus, submitting all decisions for publicdiscussion.
• Appeal: Any party may appeal against decisions made during the process by writing to the Standard StewardshipCommittee via the GCP discussion forum. The Stewardship Committee has the authority to reject proposedrevisions on the Standard in response to appeals
Proposals
Changes to the Standard can be proposed by anyone at any point via the GCP discussion forum either as issues fordiscussion, or pull requests with a clear description of the proposed change. Contributors are encouraged to raisediscussions in order to seek consensus on proposed changes. Changes may be proposed as updated field definitions orcode list entries, or as new features to the Standard.
1.3.4 Prioritisation
The technical team, with reference to community views, identify change proposals and extensions which should beconsidered for adoption in the next version of the Standard, assigning these to milestones in the issue tracker on GitHubwhere they are open for discussion.
Periodically, at the start of a revision process a cut-off date for proposals will be announced with at least two weeks’notice. After that date, a prioritised list of updates is produced. Any new proposed changes received after this periodmay not be considered until the next prioritisation phase.
Prioritisation review
The list is shared on the GCP website, with at least a two-week window for discussion.
Based on discussions, a final list is then proposed by the technical team with all the issues that will be taken forwardinto the rest of the process. A proposal that has made it this far may or may not make it into the final upgrade. As theproposal is worked into final concrete examples and schema changes, further issues may arise that mean the originalproposal cannot be implemented.
All reviews and the judgement made will be published. Community members may also submit their own reviews ofthe whole revision, or specific elements. The minimum period for Committee review is one month.
Revisions
The GCP technical team, with reference to the Standard Stewardship Committee as appropriate, should evaluatereviews and decide whether the whole upgrade, or specific features of it, need to be revised, rejected or postponedto future processes.
If only minor changes are suggested, then the revised Standard can be submitted back to reviewers for a brief reviewperiod of at least two weeks. If major changes are required, then a longer follow up review process of at least onemonth should be allowed for.
12 Chapter 1. Partners of this project

Global Coffee Data Standard Documentation, Release 1.0.0
Release
Once all reviewer comments have been addressed to the satisfaction of the reviewer in question, then the updatedversion of the Standard should be submitted to the Standard Stewardship Committee for final approval, along with ashort report of the process.
Following Stewardship Committee approval, the revision branch can be set to live.
1.3.5 Deprecation Policy
If a term (an indicator or property) is scheduled to be renamed or removed from the specification as a result of therevision process, the next release of the specification must deprecate the term within the schema, and the followingmajor release must rename or remove the term from the schema, making the term obsolete. Implementations may usedeprecated terms, but will receive warnings from the GCP Data Quality tool described below. Implementations maynot use obsolete terms, and will receive errors from the Data Quality tool.
1.3.6 Support Policy
Support will be offered for one prior version of the Standard. Support for any earlier versions than this will be endedwhen a new version is released. For example, when 1.1 is the latest release, 1.0 will be supported in the Data Qualitytool and other relevant tools and platforms managed by GCP. When 1.2 is released, support for 1.0 will no longer beguaranteed.
Publishers are encouraged to review each new version when released, and to consider how they might adopt newfeatures. Publishers should aim to move to a new major version within 18 months of its release.
1.4 Global Coffee Data Standard
This project displays the initial basic common indicators for farm-level coffee sustainability. The common indicatorsare a result of a collective multi-stakeholder approach on defining key metrics for sustainability performance, basedon the Sustainability Progress Framework elaborated under the joint facilitation of the Sustainable Coffee Challenge(SCC) and the Global Coffee Platform (GCP). COSA – with feedback from the members of a carefully selectedglobal expert committee – have developed and synthesized practical metrics to operationalize the indicators so theycan be functional across origins and comparable over time. The approach builds on extensive global experience withsustainability metrics and the expertise of the committee members.
Contents
• Global Coffee Data Standard
– 1 Metadata
* 1.1 Coffee Dataset Id
* 1.2 Schema version
* 1.3 Production year
· 1.3.1 The start of the projection year in YYYYMM
· 1.3.2 The end of the projection year in YYYYMM
– 2 Farmer
1.4. Global Coffee Data Standard 13

Global Coffee Data Standard Documentation, Release 1.0.0
* 2.1 General farmer characteristics
· 2.1.1 Unique ID of the farmer
· 2.1.2 Name of the farmer
· 2.1.3 The address of the farm
· 2.1.4 Date of birth
· 2.1.5 Gender
· 2.1.6 Farm Ids
· 2.1.7 Third-party identifier
* 2.2 Social farmer characteristics
· 2.2.1 Poverty level
· 2.2.2 Child labor
· 2.2.3 Hunger days
– 3 Farm
* 3.1 General farm characteristics
· 3.1.1 Farm Id
· 3.1.2 Farmer Id
· 3.1.3 Location of the farm
· 3.1.4 Farm address
· 3.1.5 Total farm size (ha)
· 3.1.6 Total Area planted in Coffee (ha)
· 3.1.7 Third-party identifier
* 3.2 Social farm characteristics
· 3.2.1 Labor Practices
· 3.2.2 Wages
* 3.3 Economic farm characteristics
· 3.3.1 Coffee Profit
· 3.3.2 Yield / Productivity
· 3.3.3 Cost of Production
· 3.3.4 Average Price
· 3.3.5 Sustainable purchases
* 3.4 Environmental farm characteristics
· 3.4.1 Forest and Ecosystem Protection
· 3.4.2 Fertilizer use
· 3.4.3 Water Conservation & Contamination Prevention
· 3.4.4 Pest control - hazards
14 Chapter 1. Partners of this project

Global Coffee Data Standard Documentation, Release 1.0.0
· 3.4.5 Soil Conservation
– 4 Plot
* 4.1 General plot characteristics
· 4.1.1 Unique ID of the plot
· 4.1.2 Farm ID
· 4.1.3 Plot boundary
· 4.1.4 Plot area
· 4.1.5 Third-party identifier
* 4.2 Economic plot characteristics
· 4.2.1 Yield
· 4.2.2 Productivity
1.4.1 1 Metadata
Details:
Property name: metadata
Type: object
1 "metadata": {2 "globalCoffeeDatasetId": {3 "identifier": "634748-hfgf-ydhgd",4 "organisation": "COSA",5 "timestamp": "2019-01-02"6 },7 "schemaVersion": "0.0.5",8 "productionYear": {9 "start": 201802,
10 "end": 20181111 }12 }
1.1 Coffee Dataset Id
Details:
Property name: globalCoffeeDatasetId
Reference: global-unique-id.json
The unique identifier for this dataset. The organisation is responsible for the best-practice values.
1.4. Global Coffee Data Standard 15
Global Coffee Data Standard Documentation, Release 1.0.0
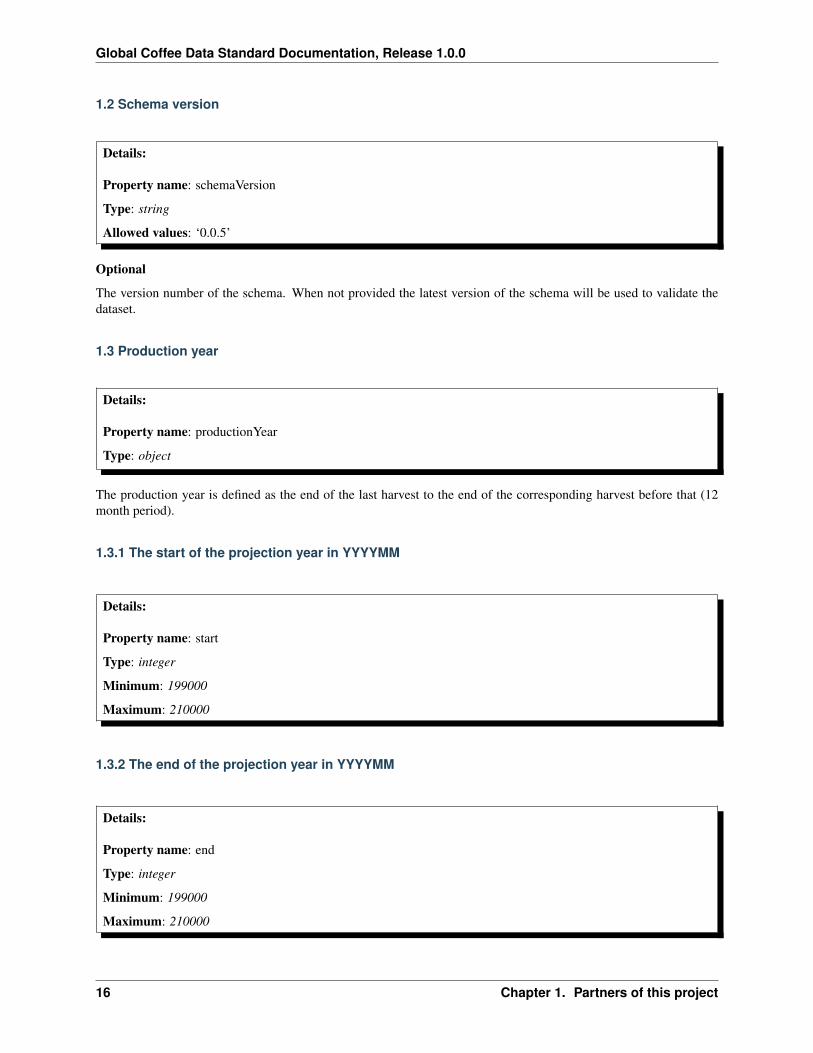
1.2 Schema version
Details:
Property name: schemaVersion
Type: string
Allowed values: ‘0.0.5’
Optional
The version number of the schema. When not provided the latest version of the schema will be used to validate thedataset.
1.3 Production year
Details:
Property name: productionYear
Type: object
The production year is defined as the end of the last harvest to the end of the corresponding harvest before that (12month period).
1.3.1 The start of the projection year in YYYYMM
Details:
Property name: start
Type: integer
Minimum: 199000
Maximum: 210000
1.3.2 The end of the projection year in YYYYMM
Details:
Property name: end
Type: integer
Minimum: 199000
Maximum: 210000
16 Chapter 1. Partners of this project

Global Coffee Data Standard Documentation, Release 1.0.0
1.4.2 2 Farmer
Details:
Property name: farmer
Type: object
The farmer characteristics
2.1 General farmer characteristics
Details:
Property name: general
Type: object
The general farmer characteristics
1 "general": {2 "farmerId": {3 "organisation": "Chamber of Commerce, Burundi",4 "identifier": "1035413151",5 "timestamp": "2010-05-21"6 },7 "name": {8 "firstName": "Carlos",9 "lastName": "de la Huerta"
10 },11 "address": {12 "streetAddress": "1600 Amphitheatre Pkwy",13 "countryName": "Burundi"14 },15 "dateOfBirth": "1974-12-31",16 "gender": "M",17 "thirdPartyIds": [18 {19 "identifier": "N2786-Q5572-H8123-S9007",20 "organisation": "UN Blue number",21 "timestamp": "2018-12-08"22 },23 {24 "identifier": "514356411",25 "organisation": "COSA",26 "timestamp": "2017-12-30"27 }28 ],29 "farmIds": [30 {31 "identifier": "2345",32 "organisation": "Land register of Burundi",33 "timestamp": "1998-12-28"
(continues on next page)
1.4. Global Coffee Data Standard 17

Global Coffee Data Standard Documentation, Release 1.0.0
(continued from previous page)
34 }35 ]36 }
2.1.1 Unique ID of the farmer
Details:
Property name: farmerId
Reference: global-unique-id.json
Globally Unique ID of the recording of the farmer at a specific time and by a specific organisation.
Each producer should have a unique ID. Optimally this can be a national ID, but in its absence a buyer ID, project IDor other unique number can serve. It is important to keep in mind that various entities may have access to reporteddata, so confidential information should not be included in the shared record (e.g. Social Security number).
2.1.2 Name of the farmer
Details:
Property name: name
Reference: name.json
First and last name(s) of the farmer surveyed should be collected in separate fields/columns to ensure consistency(avoiding confusion between Carlos de la Huerta and De la Huerta, Carlos). Initials should be avoided when possible.In places where farmers use only one name (a family name), that name should be entered as the Last Name and anappropriate prefix or “Farmer” could be entered as the First Name.
2.1.3 The address of the farm
Details:
Property name: address
Reference: address.json
Generally, data should include Country and then State/Department and Municipality/District, unless the address iscollected for the sake of auditing. This should be the location of the farm itself (main plot), not the home of the farmer,if different.
2.1.4 Date of birth
18 Chapter 1. Partners of this project

Global Coffee Data Standard Documentation, Release 1.0.0
Details:
Property name: dateOfBirth
Type: string
Examples: ‘2000-08-17’, ‘1973-05-30’
Pattern: ^[12][0-9]{3}-[01][0-9]-[0-3][0-9]$
Best practice is to use ‘Year of Birth’ as opposed to age. Age has to be updated annually, but year of birth is the sameindefinitely, and can be used to calculate age at any point.
Data point used to understand the relative presence of youth and calculate youth engagement: % of producers in thesustainability program or supply chain 35 years old and under.
2.1.5 Gender
Details:
Property name: gender
Type: string
Allowed values: ‘M’, ‘F’, ‘O’, ‘NA’
Data point used to understand the relative presence of women and to calculate women’s engagement and the outcomesthey experience as diverse from men: % of women in the sustainability program or supply chain.
2.1.6 Farm Ids
Details:
Property name: farmIds
Type: array
Unique items: True
Minimum items: 1
Array items: global-unique-id.json
Which farms belong to this farmer. At least one is required.
2.1.7 Third-party identifier
Details:
Property name: thirdPartyIds
1.4. Global Coffee Data Standard 19

Global Coffee Data Standard Documentation, Release 1.0.0
Type: array
Unique items: True
Array items: global-unique-id.json
When this dataset is reused by another organisation who needs to use their own Global Unique Identifier, the originalidentifier can be saved here, to track history and origin.
2.2 Social farmer characteristics
Details:
Property name: social
Type: object
The social farmer characteristics
1 "social": {2 "povertyLevel": {3 "householdMembers": 3,4 "totalHouseholdIncome": 20.585 },6 "childLabor": {7 "schoolAgeHouseholdMembers": 33.3,8 "hazardousProhibition": "No"9 },
10 "hunger": 011 }
2.2.1 Poverty level
Details:
Property name: povertyLevel
Reference: poverty-level.json
Comparison of total household revenue to World Bank International Extreme Poverty Line (total divided by # adultindividuals in household).
The Monitoring approach is to ask producers the proportion of total household income coming from the sale of coffee(since the coffee revenue amount from the Net Income indicator (Profit) is already known, an estimate of the fullhousehold income amount can be derived with that proportion). This allows a good sense of the economic picture onthe farm without adding substantial detail to the approach in terms of all household income streams (e.g., sales of othercrops or services, income from other businesses, gifts and remittances, etc.) and any associated costs.
The World Bank International Extreme Poverty Line is $1.90 USD per day as of 2015 (https://datahelpdesk.worldbank.org/knowledgebase/articles/906519). Comparison to national poverty lines may be useful for discussion related to onecountry or domestic policy but that can be calculated separately as needed.
20 Chapter 1. Partners of this project

Global Coffee Data Standard Documentation, Release 1.0.0
An organisation may choose to use the PPI score evaluation of the propensity of a farmer or community to be poor asanother option that can be more relevant in some rural areas and can be calculated separately as needed. Organisationsmay also choose to participate on this topic in the Living Income Community of Practice.
2.2.2 Child labor
Details:
Property name: childLabor
Reference: child-labor.json
The issue of Child Labor is often addressed as a compliance audit question, but it is rarely answered because of themoral hazard (nobody wants to answer that they have child labor). Instead, “children in school at the appropriategrade level” serves to provide a valuable proxy that directly reflects an outcome of child labor and results in a betterunderstanding of the plight of children in a community. Note that in many countries the compulsory school age may belower than 18, and organisations are welcome to include other age limits in their own analysis of the data, but childrenin the appropriate grade for their age through 18 serves as an aspirational target. This data can be segmented by genderto get additional insights into the differences in education levels for both boys and girls in a community.
As an additional option, it may be desirable to ask whether young workers (those under age 18) are working inhazardous conditions (applying chemical pesticides, using hazardous machinery, moving excessive weights/loads,etc.)
These concepts are common to many sustainability standards and the approach is built on the ILO standards and theSDGs.
We recognize that child labor can also occur outside the family setting. At this initial stage of common metrics, it isnecessary to note that capturing that requires either a labor assessment targeting workers (risky for them, often requiresan independent surveyor, and timing is critical) or a risk assessment or data from the wider community (consider costsand comparability). This is an important topic and it is necessary to adequately understand which communities aremore prone to this situation, therefore, we propose that it be addressed with different tools than these basic performanceindicators developed with the GCP.
2.2.3 Hunger days
Details:
Property name: hunger
Type: integer
Minimum: 0
Whether the household was food secure during the last production year (report 0 days of food insecurity–i.e., notskipping meals or significantly reducing food intake because food was not available).
The simple approach depends on asking the producer the number of days during the last production year that anymember of household cut food consumption due to lack of food. It is good practice to ask this question in ranges ofdays to help with farmer recall: 0 days; 1-9 days, 10-19 days; 20-29 days; 30 or more days in the past year. Producersthat answer ‘0 days’ are considered to be food secure. Optimally, the approach would also include the months whenfood insecurity occurred in order to understand the times of year when producers experience more or less food security.
1.4. Global Coffee Data Standard 21

Global Coffee Data Standard Documentation, Release 1.0.0
More comprehensive nutritional indicators can be expensive and require significant technical ability, time and re-sources to carry out effectively, so instead the focus is on days of food insecurity as a proxy. Note that while thissurvey question is often asked to the head of household, this indicator is best expressed when it includes multipleperspectives in the household. This indicator is an important human development issue and a core indicator for socialjustice.
1.4.3 3 Farm
Details:
Property name: farm
Type: object
The farm characteristics
3.1 General farm characteristics
Details:
Property name: general
Type: object
The general farm characteristics
1 "general": {2 "farmId": {3 "identifier": "2345",4 "organisation": "Land register of Burundi",5 "timestamp": "1998-12-28"6 },7 "farmerId": {8 "organisation": "Chamber of Commerce, Burundi",9 "identifier": "1035413151",
10 "timestamp": "2010-05-21"11 },12 "address": {13 "countryName": "Mali",14 "postalCode": "5987 BL"15 },16 "totalFarmSize": 150.25,17 "totalAreaCoffee": 160.48,18 "location": {19 "geoLocation": {20 "coordinates": [21 125.25,22 135.25523 ],24 "type": "Point"25 },26 "positionTakenAt": "Location of the front door of the head office"
(continues on next page)
22 Chapter 1. Partners of this project

Global Coffee Data Standard Documentation, Release 1.0.0
(continued from previous page)
27 }28 }
3.1.1 Farm Id
Details:
Property name: farmId
Reference: global-unique-id.json
Globally Unique ID of the recording of the farm at a specific time and by a specific organisation.
3.1.2 Farmer Id
Details:
Property name: farmerId
Reference: global-unique-id.json
Globally Unique ID of the farmer of this farm
3.1.3 Location of the farm
Details:
Property name: location
Reference: farm-location.json
GPS should be captured for each farm plot if possible. GPS readings should be taken outside of buildings and awayfrom significant tree coverage to avoid interference in the signal. GPS should be captured in the middle of the plot,and/or near the entrance to any main building (if there is one). Where the main residence or other buildings are notlocated on the farm plot, GPS should be taken in the middle of the plot.
3.1.4 Farm address
Details:
Property name: address
Reference: address.json
This should be the location of the farm itself (main plot), not the home of the farmer, if different.
1.4. Global Coffee Data Standard 23

Global Coffee Data Standard Documentation, Release 1.0.0
3.1.5 Total farm size (ha)
Details:
Property name: totalFarmSize
Type: number
Exclusive minimum: 0
Total Farm size refers to total property size, including land used to grow crops, pasture, wooded areas, land coveredby buildings, and any other area included in the property.
Best practice is to collect response in any given unit, and then perform conversion to a standard international unit (ha).Data validation should ensure that the total area planted in coffee should be less than the total farm size. It is ok torely on farmer recall although more rigorous estimates will include GPS or polygonal mapping data. Consider thatfarms may contain multiple plots (plots are farm land areas that are not connected, or farm areas that are manageddifferently, or both). Make sure to add all relevant plots managed by members of a household together (that is, thefarm area should coincide with the land used to account for the farm cost and revenue data being reported).
3.1.6 Total Area planted in Coffee (ha)
Details:
Property name: totalAreaCoffee
Type: number
Exclusive minimum: 0
Sum of coffee farm areas from producers in the sustainability program or supply chain (ha)
Area under coffee production can also be triangulated with other pieces of data collected (e.g., trees planted per unitland (density rate) and/or total number of trees planted).
3.1.7 Third-party identifier
Details:
Property name: thirdPartyIds
Type: array
Unique items: True
Array items: global-unique-id.json
When this dataset is reused by another organisation that needs to use their own Global Unique Identifier, the originalidentifier can be saved here, to track history and origin.
24 Chapter 1. Partners of this project

Global Coffee Data Standard Documentation, Release 1.0.0
3.2 Social farm characteristics
Details:
Property name: social
Type: object
The social farm characteristics
1 "social": {2 "laborPractices": {3 "prohibitingDiscrimination": "Yes",4 "clearContracting": "No",5 "hazardousWorkingCondition": "Yes",6 "rightToOrganise": "Yes"7 },8 "wages": {9 "wagesProcessing": 4,
10 "wagesHarvesting": 14,11 "wagesCoffee": 16,12 "nationalMinimumWage": 12.513 }14 }
3.2.1 Labor Practices
Details:
Property name: laborPractices
Reference: labor-practices.json
% of good labor practices adopted (of those listed). This indicator is applicable where farms rely on hired labor (notlabor of household members).
The percent refers to the number of good labor practices from the list that are adopted (meaning that each practiceshould have a binary response) and change over time is noted by the type and number of practices.
These concepts are common to many sustainability standards and the approach is built on the ILO standards and theSDGs. While there may be moral hazard in asking these questions outright, asking the questions themselves serves toeducate the respondent about the norms and aspirations that are part of general good labor practices.
3.2.2 Wages
Details:
Property name: wages
Reference: wages.json
1.4. Global Coffee Data Standard 25

Global Coffee Data Standard Documentation, Release 1.0.0
Daily average earnings for farm labor compared to (rural) minimum wage. Wage is listed and also expressed as apercentage of the rural minimum wage (where that exists), alternately to the national minimum wage.
The approach involves asking for the average daily wage rate paid. If applicable, include wages for coffee production,harvesting, and processing and take an average across all three categories.
Wage is listed and also expressed as a percentage of the rural minimum wage (where that exists), alternately to thenational minimum wage.
This approach gives a good sense of worker earnings coming from the most prominent types of labor without needingto detail individual jobs, rates, benefits, etc.
Organisations may wish to participate in working groups to define and measure living wage. There is still no widelyused methodology, but the ability to understand whether a worker could survive on the wage earned would be usefulfor any industry.
3.3 Economic farm characteristics
Details:
Property name: economic
Type: object
The economic farm characteristics
1 "economic": {2 "coffeeProfit": 4.5,3 "productivity": {4 "coffeeProductiveArea": 1500,5 "amountHarvested": 2500,6 "formOfCoffee": "Dry cherry"7 },8 "productionCosts": {9 "fertilizers": {
10 "amount": 2500,11 "percentage": 10012 },13 "pesticides": {14 "amount": 2500,15 "percentage": 9016 },17 "hiredLabor": {18 "amount": 2544,19 "percentage": 9820 },21 "plantingMaterial": {22 "amount": 1258,23 "percentage": 10024 },25 "renovation": {26 "amount": 0,27 "percentage": 028 },29 "other": {30 "amount": 1851,
(continues on next page)
26 Chapter 1. Partners of this project

Global Coffee Data Standard Documentation, Release 1.0.0
(continued from previous page)
31 "percentage": 5032 }33 },34 "price": {35 "totalCoffeeRevenue": 25800,36 "kgSold": 251037 },38 "sustainablePurchases": {39 "volumeOfSustainablePurchases": 1500,40 "proportionOfTotal": 2541 }42 }
3.3.1 Coffee Profit
Details:
Property name: coffeeProfit
Type: number
Exclusive minimum: 0
Total revenue from coffee sales minus total costs for coffee production (Reported in USD/ha of coffee productivearea.)
The simple approach (which avoids the additional time and resources necessary for detailed accounting while stillproviding good results) is to ask for the total revenue from sales of coffee as a whole, and subtract main costs. Thisindicator is reported on a per hectare basis to allow comparability across projects and regions.
This simplified approach does not cover asking the producer about revenue and prices for each transaction or amountsold, nor any premiums or deductions. It also factors in only the main costs in the coffee production system (see Costof Production indicator below).
3.3.2 Yield / Productivity
Details:
Property name: productivity
Reference: productivity.json
kgs of GBE (harvested)/ha of coffee productive area
For general GBE conversion guidance, please see: http://www.thecoffeeguide.org/coffee-guide/world-coffee-trade/conversions-and-statistics/
3.3.3 Cost of Production
1.4. Global Coffee Data Standard 27

Global Coffee Data Standard Documentation, Release 1.0.0
Details:
Property name: productionCosts
Reference: production-costs.json
Costs incurred to produce the coffee during the last production year (calculated per kg of GBE)
The simple approach asks only about the main costs in the production system that typically account for the vastmajority of total costs (and the total amount spent on each during the last production year). By focusing on the maincosts in a system, this provides a good sense of the economic picture on the farm without adding substantial detail tothe approach.
Main costs typically include (at a minimum):
• Fertilizers
• Pesticides
• Hired Labor
• Planting material/ Renovation costs
For those using the Full cost accounting approach the categories are comparable though fewer. The full approachwould include: deductions by buyers, rent of land, energy, irrigation, capital assets, cultivation practices, traceabilityand record keeping, costs of standards or certifications, planting and reforestation costs, training costs, interest oncredit, crop insurance, cooperative fees, or the value of unpaid family labor (although any important costs in a systemshould be captured).
Costs should be associated with the coffee production only (i.e., if labor is hired for multiple crops, only the portionused for coffee production should be included). One way to make sure that costs are correctly associated with theproduction of the coffee is to ask for the percent of inputs that were used for the coffee.
When calculating costs, include only expenditures coming from the household’s own revenue. If inputs are provided astechnical assistance for free or at a subsidized cost on a persistent, substantial, and systemic basis it is recommendedto account for the value of the input as a cost in the calculation (at an appropriately determined rate).
This indicator is a Sub-metric for Net Income (or Profit).
3.3.4 Average Price
Details:
Property name: price
Reference: average-price.json
Average Price received per kg of coffee (GBE). The simple approach involves asking for the total revenue receivedfrom coffee during the last production year as well as the amount sold (and the form). The average price per unit canthen be calculated. For multiple sales, calculate the price average of sales
The average price can then be compared to the global reference price (e.g., ICO).
This approach avoids the additional time and resources necessary for detailed accounting and asking about each sale(and the associated premiums, deductions or bonuses) while still providing good results.
28 Chapter 1. Partners of this project

Global Coffee Data Standard Documentation, Release 1.0.0
3.3.5 Sustainable purchases
Details:
Property name: sustainablePurchases
Reference: sustainable-purchases.json
The volume of sustainable purchases by the buyer and as a proportion of the total, and change year to year.
Detailed methodology developed by the SPF Working Group (not a farmer level metric).
3.4 Environmental farm characteristics
Details:
Property name: environmental
Type: object
The environmental farm characteristics
1 "environmental": {2 "forestEcosystemProtection": {3 "areaConvertedLand": {4 "absoluteArea": 15,5 "proportiesOfFarm": 1006 },7 "ecosystemProtection": 18.588 },9 "fertilizerUse": "Yes",
10 "water": {11 "waterConservation": {12 "dripIrrigation": "No",13 "waterCatchments": "Yes",14 "waterEfficientProcessing": "No"15 },16 "waterContamination": {17 "preventUntreatedWater": "Yes",18 "noPesticideCleaningNearWater": "No",19 "noLivestockNearWater": "Yes",20 "noDomesticDischarge": "Yes"21 }22 },23 "pestControl": {24 "ipmPractices": {25 "conductRegularVisualExaminations": "Yes",26 "pestRepelSpecies": "No",27 "useNaturalPesticides": "Yes",28 "applyAfterIdentifying": "No",29 "predatorPlaces": "Yes",30 "recordPestInfestation": "No"31 },
(continues on next page)
1.4. Global Coffee Data Standard 29

Global Coffee Data Standard Documentation, Release 1.0.0
(continued from previous page)
32 "useOfBannedPesticides": "No"33 },34 "soilConservation": {35 "checkDams": "Yes",36 "interplanting": "No",37 "contourPlanting": "No",38 "recyclingOrganicMatter": "Yes",39 "liveFences": "Yes"40 }41 }
3.4.1 Forest and Ecosystem Protection
Details:
Property name: forestEcosystemProtection
Reference: forest-ecosystem-protection.json
The approach involves asking producers if they converted any natural land (e.g., forest, savanna) to land used forcoffee production and how much [both in absolute terms (ha) and relative terms (proportion of the farm)] during thelast 5 years.
In addition, overlaying gps coordinates of farms (See GPS Coordinate instructions above) with regional deforestationmaps provides more interesting data at a landscape level to understand areas of risk. Note though that usually only asingle gps point will exist for many smallholder farms, meaning that there often isn’t sufficient information to track thecontribution of individual farms to deforestation in most cases. However, even with single gps points, general farmingareas prone to deforestation will still be visible.
Forest and ecosystem protection practices include:
1. Reforestation with non-productive trees (i.e., those trees that will not be regularly pruned or removed)
2. Laying land aside (fallow) and/or blocking active use (including hunting).
3.4.2 Fertilizer use
Details:
Property name: fertilizerUse
Type: string
Allowed values: ‘Yes’, ‘No’
Whether a professional assessment or advice was used to determine fertilizer needs on the farm. It does not requirein-depth fertilizer information: nutrient amounts, local commercial names, dosage amounts, application rates, etc.
The simple approach depends on asking the producer about fertilizer use best practices instead of all the individualfertilizer types and amounts they use. Asking if the producer based their fertilizer use on professional advice orassessments is easy to ask in a standardized way globally and can be a proxy for proper fertilization on the farm (there
30 Chapter 1. Partners of this project

Global Coffee Data Standard Documentation, Release 1.0.0
is ample evidence that the correlation between fertilizer use and yields is not as good as prescribed fertilization andyields).
Professional assessments include advice from an extension agent or other sustainability program implementer andNOT input sellers.
This approach does not require in-depth fertilizer information: nutrient amounts, local commercial names, dosageamounts, application rates, etc.
3.4.3 Water Conservation & Contamination Prevention
Details:
Property name: water
Reference: water.json
Water conservation practices include (relevance of individual practices will need to be determined by region):
1. Drip irrigation
2. Water catchments
3. Water-efficient processing
For practices that conserve soil moisture balance and control runoff, please reference the “Soil Conservation” indicatorbelow.
Water contamination prevention measures include the following:
1. Pesticide equipment is cleaned away from natural water bodies
2. Ensuring untreated water from processing does not enter natural water bodies
3. Grazing livestock away from natural water bodies
4. Domestic discharge prevented from entering natural water bodies
These concepts are common to many sustainability standards and the approach is built on FAO Good AgriculturalPractices.
Asking about best practice adoption is a standardized way to address this indicator globally without the expensiveand technical expertise required to measure water use amounts (and evaluating that in the local context) or takingwater samples to evaluate contamination levels and the required protocols for that (taking samples at the appropriatelocations and time, factoring in elements that may be beyond an individual producers control, etc.).
3.4.4 Pest control - hazards
Details:
Property name: pestControl
Reference: pest-control.json
Standard IPM techniques include:
• Conduct regular visual examinations of the coffee to detect pests and/or diseases
1.4. Global Coffee Data Standard 31

Global Coffee Data Standard Documentation, Release 1.0.0
• Use traps, repellants, and natural pesticides
• Create or preserve places (including plant species) for beneficial predators of pests to live
• Maintain written record of pest infestation, treatments, and results
• Plant or preserve species that repel pests of the coffee
• Apply pesticide or kill pests only after identifying the pest and only at the best time in the pest’s life cycle topermanently reduce its population
Banned or hazardous pesticides will be based of the WHO Ia and Ib lists. COSA suggests that over time it will beuseful to understand the types and/ or individual banned pesticides being used so that research bodies can developvarietals or take other actions that help prevent the need for their use in the field. This approach does not addressproper disposal of pesticide containers.
Pesticides include insecticides, fungicides, rodenticides, nematicides and herbicides.
Focusing on IPM techniques is a globally standardized way to understand pest management best practices without themore costly and time-consuming process of detailing individual pesticides, active ingredients, amount used in localunits, etc.
3.4.5 Soil Conservation
Details:
Property name: soilConservation
Reference: soil-conservation.json
% of applicable soil conservation practices used on the farm (of those listed)
Soil conservation measures include:
1. contour planting, terracing, or soil ridges around trees
2. live fences, hedgerows or buffer zones
3. recycling organic matter and crop waste
4. interplanting, nitrogen fixing plants, cover crops, or mulching
5. check dams, drainage channels or diversion ditches
These concepts are common to many sustainability standards and the approach is built on FAO Good AgriculturalPractices.
Asking about best practice adoption is a standardized way to address this indicator globally without the expensive andtechnical expertise required to measure the actual amount of soil conserved or to do individual soil testing on farms.
1.4.4 4 Plot
Details:
Property name: plot
Type: object
32 Chapter 1. Partners of this project

Global Coffee Data Standard Documentation, Release 1.0.0
The plot characteristics. This is an example of what is possible. The plot property is optional.
4.1 General plot characteristics
Details:
Property name: general
Type: object
The general plot characteristics
1 "general": {2 "plotId": {3 "identifier": "pl956304",4 "organisation": "Land registry Burundi",5 "timestamp": "1999-02-28"6 },7 "farmId": {8 "identifier": "2345",9 "organisation": "Land register of Burundi",
10 "timestamp": "1998-12-28"11 },12 "boundary": {13 "type": "Polygon",14 "coordinates": [15 [16 [17 100.0,18 0.019 ],20 [21 101.0,22 0.023 ],24 [25 101.0,26 1.027 ],28 [29 100.0,30 1.031 ],32 [33 100.0,34 0.035 ]36 ]37 ]38 },39 "area": 145.57,40 "thirdPartyIds": [41 {42 "identifier": "pl956306",43 "organisation": "Land registry Burundi",
(continues on next page)
1.4. Global Coffee Data Standard 33

Global Coffee Data Standard Documentation, Release 1.0.0
(continued from previous page)
44 "timestamp": "2005-01-12"45 }46 ]47 }
4.1.1 Unique ID of the plot
Details:
Property name: plotId
Reference: global-unique-id.json
Globally Unique ID of the recording of the plot at a specific time and by a specific organisation.
4.1.2 Farm ID
Details:
Property name: farmId
Reference: global-unique-id.json
To which farm belongs this plot
4.1.3 Plot boundary
Details:
Property name: boundary
The boundary of the plot
4.1.4 Plot area
Details:
Property name: area
Type: number
Minimum: 0
Area of the plot
34 Chapter 1. Partners of this project

Global Coffee Data Standard Documentation, Release 1.0.0
4.1.5 Third-party identifier
Details:
Property name: thirdPartyIds
Type: array
Unique items: True
Array items: global-unique-id.json
When this dataset is reused by another organisation who needs to use their own Global Unique Identifier, the originalidentifier can be saved here, to track history and origin.
4.2 Economic plot characteristics
Details:
Property name: economic
Type: object
The economic plot characteristics
1 "economic": {2 "productivity": 7,3 "yield": 204 }
4.2.1 Yield
Details:
Property name: yield
Type: number
Minimum: 0
kgs of GBE (harvested)
4.2.2 Productivity
Details:
Property name: productivity
1.4. Global Coffee Data Standard 35

Global Coffee Data Standard Documentation, Release 1.0.0
Type: number
Minimum: 0
Total revenue from coffee sales minus total costs for coffee production (Reported in USD/ha of coffee productivearea.)
1.5 Overview of JSON schema
The complete data structure is visualized in the table below:All required data attributes are indicated in bold,By clicking on the blue table title -> all data attributes become visible,By clicking on the data entity buttons -> all data attributes become visible of that data entity and,By clicking on the {} symbols -> the JSON becomes visible
36 Chapter 1. Partners of this project

CHAPTER 2
Indices and tables
• genindex
• modindex
• search
37