Projected land-use change impacts on ecosystem services in ...
Global change impacts on ecosystem services and the vulnerability
of the human-environment system– The European assessment ATEAM
Dagmar Schröter and Marc J. Metzger
Potsdam Institute for Climate Impact Research
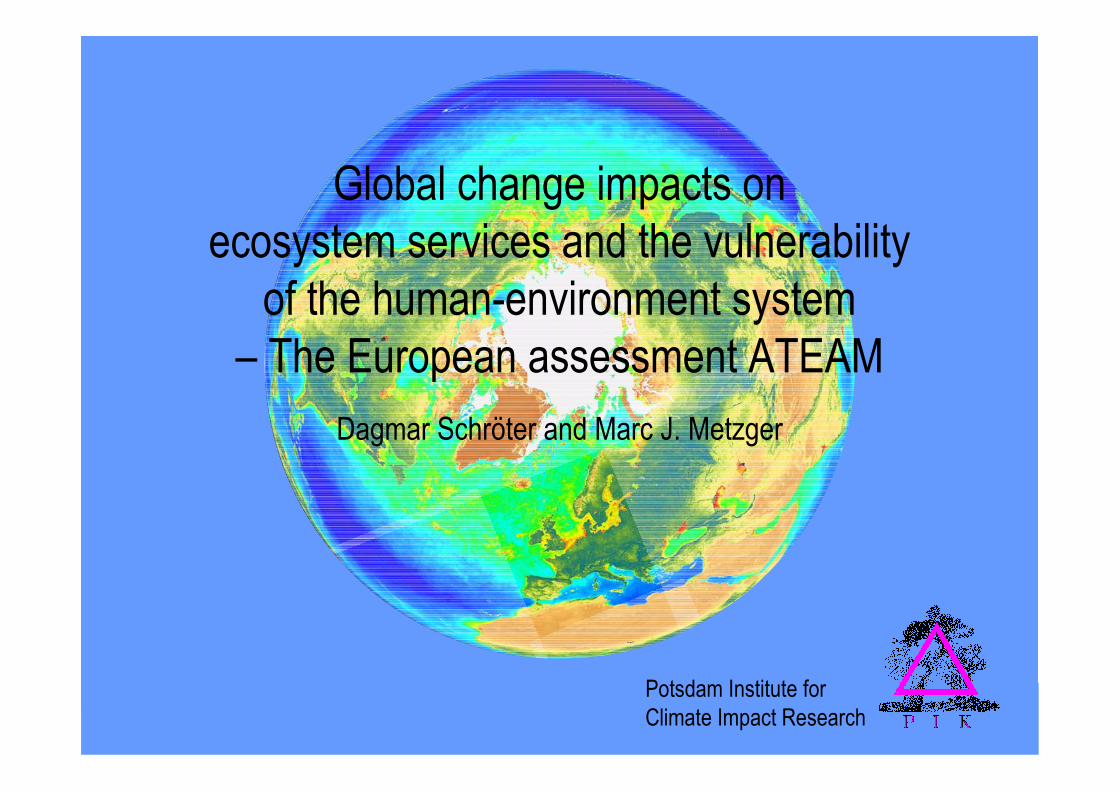
European vulnerability study
ATEAM-project, www.pik-potsdam.de/ateam
17 partners and sub-contractors, Funded by the European Union, 2001-2004.

1. To assess potential impacts of global change on ecosystem services in Europe
2. To translate these impacts into maps of ourvulnerability � these maps should inform the decision-making of stakeholders about adaptation options to global change
Objectives
Examples of questions to tackle• Which regions are most vulnerable to global change?• Which sectors are the most vulnerable in a certain region?• Which scenario is the least harmful for a sector?

The environmental dimension of vulnerability
• Ecosystems provide services that sustain and fulfill human life (see 1st MA book, Alcamo et al. 2003)
• To know the potential impacts of global change on ecosystem services within a specific region is to understand an essential part of this region’s vulnerability.
food production
flood protection
carbon sequestration
biodiversity
shelter for life stockgame reserve
fibre production
beautyrecreation
pollination
tourist attraction
fodder production
stabilising micro-climate
fire preventionslope stability water storage

dialogue between stakeholders and scientists
European Vulnerability Assessment
maps of vulnerability
multiple scenarios of global change:CO2climate,socio-econ.land use,N deposition
ecosystem models
changes in ecosystem
servicescombinedindicators
changes in adaptive capacity
socio-economic
Metzger & Schröter 2004 (submitted).
Methodology

Consistent global change scenarios
• Spatially explicit: 10' x 10' (ca. 16 x 16 km)• 4 time slices (1990, 2020, 2050, 2080)• 4 Socio-Economic Scenarios• 4 Emission Trajectories (greenhouse gases)• 17 Climate Scenarios (four climate models, one control)• 7 Land Use Scenarios• 4 Nitrogen Deposition Scenarios
As input to our ecosystem and adaptive capacity models.

Sectors, ecosystem services and modelled indicators
Metzger & Schröter 2004 (submitted).
• Runoff quantity • Runoff seasonality
Water supply (drinking, irrigation, hydropower)Drought & flood prevention
Water
• Species richness and turnover (plants, mammals, birds, reptiles, amphibian)
• Shifts in suitable habitats
BeautyLife support processes(e.g. pollination)
Biodiversity
• Snow (elevation of snow line)Tourism (e.g. winter sports)Recreation
Mountains
• Carbon storage in vegetation• Carbon storage in soil
Climate protectionCarbon storage
• Tree productivity: growing stock & incrementWood production Forestry
• Agricultural land area (Farmer livelihood)• Suitability of crops• Biomass energy yield
Food & fibre production Bioenergy production
Agriculture
IndicatorsServicesSectors

Agriculture• Decline in arable land (cropland, grassland)
• Surplus land (up to over 10 % of European land surface)
• Land demand for bioenergy may go up, CO2 offset may approach 15% of 1990-emissions in 2080
• Climate driven decline in soil organic carbon, partly counteracted by land use and stimulated plant growth
• Crop suitabilitiy changes; some current agricultural areas become too hot and too dry to support agriculture

Vulnerability
exposure sensitivity adaptive capacity
potential impact
vulnerability

Integration: Vulnerability2080A1 wood production
vuln
erab
ility
0
1.0
-1.0
PI
AC lowhigh
V
high
low
adap
tive
capa
city Sstr
1.0
0.0
pote
ntia
l im
pact PI
0
1.0
-1.0
AC
�PI
V = f(PI, AC)A relationship that is not specified beyond high PI and low AC � high V, etc...
Visual overlay
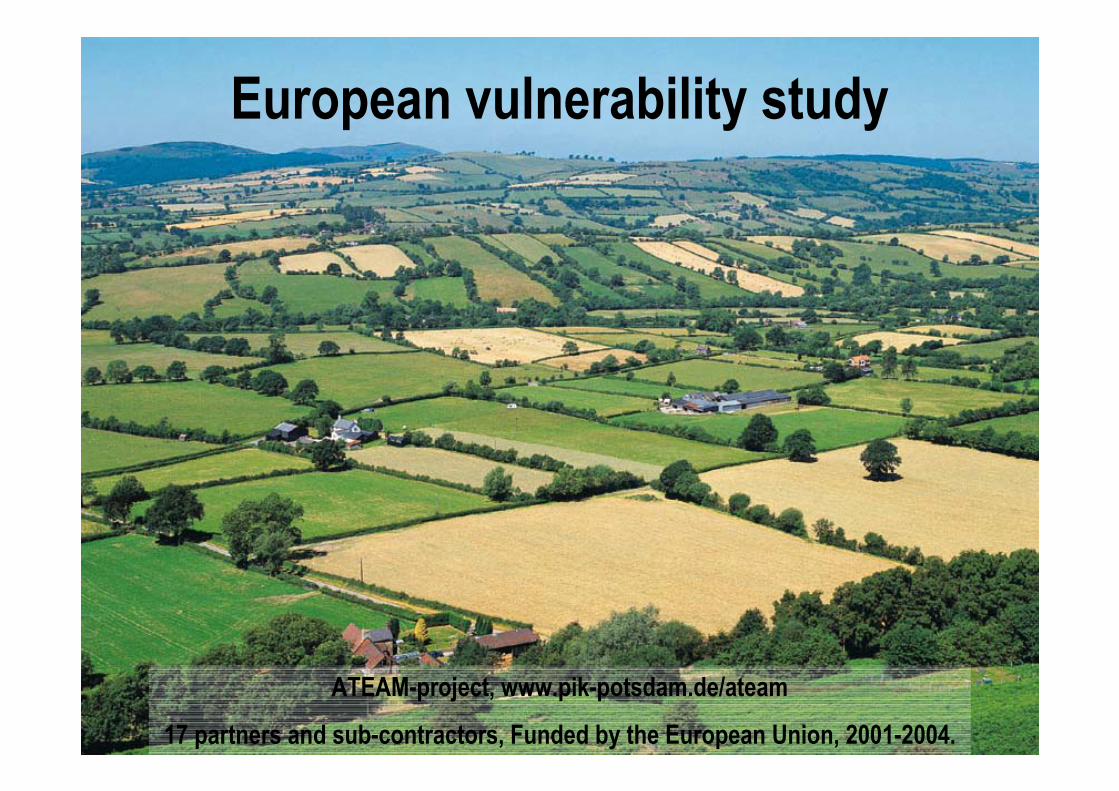
… our digital atlas: ATEAM mapping toolCa. 3200 maps and many more summarising charts. Under construction...

...which areas, and who is vulnerable to global change?
How can we adapt?
dialogue between stakeholders and scientists
maps of vulnerability
multiple scenarios of global change:CO2climate,socio-econ.land use,N deposition
ecosystem models
Potential impacts
combinedindicators
changes in adaptive capacity
socio-economic
Schröter et al. 2004 (in press), Metzger & Schröter 2004 (submitted).

Conclusions: Vulnerability• Vulnerable region: Mediterranean seems most vulnerable within Europe -
multiple potential impacts [water, forestry, agriculture, tourism, carbon storage]and low generic adaptive capacity
• Vulnerable sectors:- Agriculture? Soil. Extensification potential. How do farmers decide? CAP...- Forestry? Fire risk. Biofuel potential. Shift to other species.- Carbon storage. Soil respiration and fire vs. net primary production- Mountain tourism. Reliable snowcover declines. Risks and discomfort?- Water. Droughts, floods. Seasonality changes. Hydropower, storage capacity.- Biodiversity. Current debate. Syndrome of impoverishment? Dynamic reserve
management.• Dialogue between science and stakeholders is an important part of the results.
Informed by best science, fair, focussed and sustained. Coordination, moderation, social learning.
• The digital Atlas developed with stakeholders is a useful communication tool in thisdialogue.
- What will be most helpful to stakeholders? Maps of V? Maps of AC? Maps of 'raw data'? Which time slices? Scenarios?