Global Automotive Supplier Study 2018 · 2018-02-22 · Lazard, Roland Berger Global Automotive...
86
Transformation in light of automotive disruption December 2017 Global Automotive Supplier Study 2018
Transcript of Global Automotive Supplier Study 2018 · 2018-02-22 · Lazard, Roland Berger Global Automotive...
Transformation in light of automotive disruption
December 2017
Global Automotive Supplier Study 2018
2 Global Automotive Supplier Study 2018.pptx
Contents
This document shall be treated as confidential. It has been compiled for the exclusive, internal use by our client and is not complete without the underlying detail analyses and the oral presentation.
It may not be passed on and/or may not be made available to third parties without prior written consent from and .
© Roland Berger/Lazard
The status
Record volumes and profits, but key markets are at a tipping point
A The consequence
Automotive suppliers need to transform their business models
D
Roland Berger and Lazard Automotive teams
The Contacts
E The challenge
Suppliers' traditional business will be questioned on multiple levels
C The future
Upcoming automotive disruption will fundamentally change the industry
B
3 Global Automotive Supplier Study 2018.pptx Source: Lazard, Roland Berger
Executive Summary (1/2)
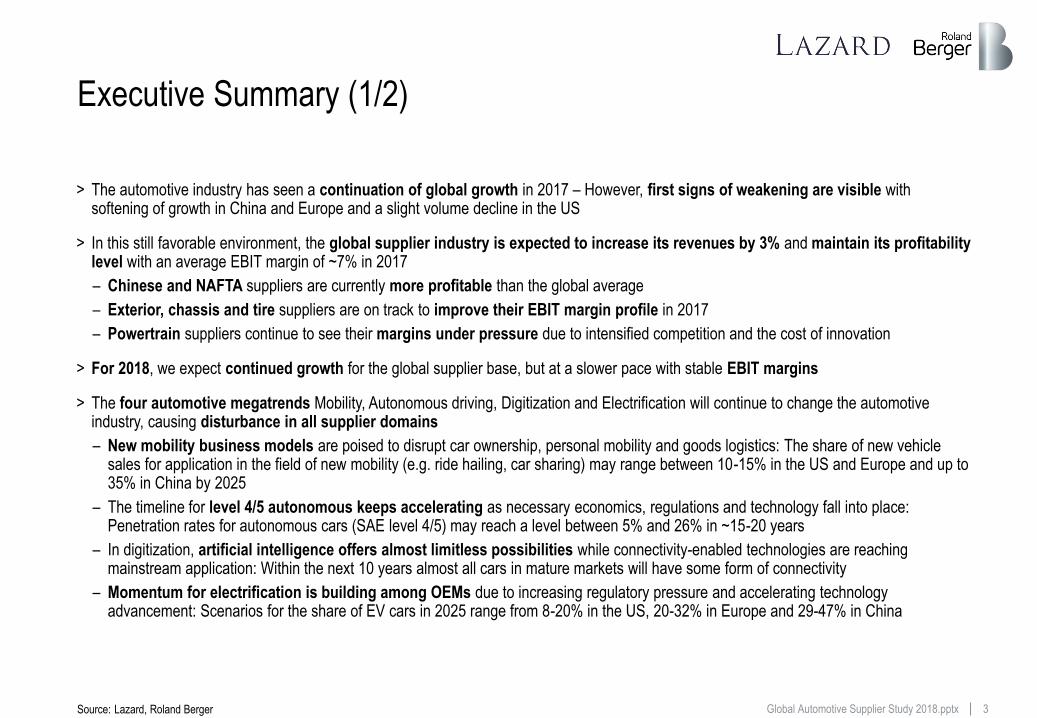
> The automotive industry has seen a continuation of global growth in 2017 – However, first signs of weakening are visible with softening of growth in China and Europe and a slight volume decline in the US
> In this still favorable environment, the global supplier industry is expected to increase its revenues by 3% and maintain its profitability level with an average EBIT margin of ~7% in 2017
– Chinese and NAFTA suppliers are currently more profitable than the global average
– Exterior, chassis and tire suppliers are on track to improve their EBIT margin profile in 2017
– Powertrain suppliers continue to see their margins under pressure due to intensified competition and the cost of innovation
> For 2018, we expect continued growth for the global supplier base, but at a slower pace with stable EBIT margins
> The four automotive megatrends Mobility, Autonomous driving, Digitization and Electrification will continue to change the automotive industry, causing disturbance in all supplier domains
– New mobility business models are poised to disrupt car ownership, personal mobility and goods logistics: The share of new vehicle sales for application in the field of new mobility (e.g. ride hailing, car sharing) may range between 10-15% in the US and Europe and up to 35% in China by 2025
– The timeline for level 4/5 autonomous keeps accelerating as necessary economics, regulations and technology fall into place: Penetration rates for autonomous cars (SAE level 4/5) may reach a level between 5% and 26% in ~15-20 years
– In digitization, artificial intelligence offers almost limitless possibilities while connectivity-enabled technologies are reaching mainstream application: Within the next 10 years almost all cars in mature markets will have some form of connectivity
– Momentum for electrification is building among OEMs due to increasing regulatory pressure and accelerating technology advancement: Scenarios for the share of EV cars in 2025 range from 8-20% in the US, 20-32% in Europe and 29-47% in China
4 Global Automotive Supplier Study 2018.pptx Source: Lazard, Roland Berger
Executive Summary (2/2)
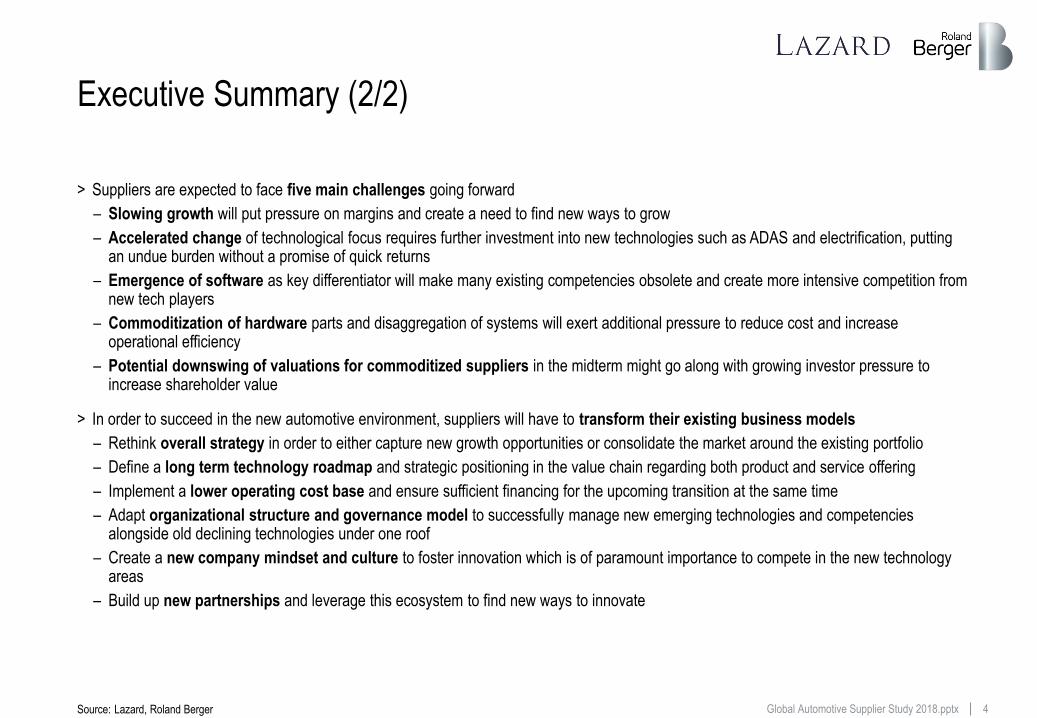
> Suppliers are expected to face five main challenges going forward
– Slowing growth will put pressure on margins and create a need to find new ways to grow
– Accelerated change of technological focus requires further investment into new technologies such as ADAS and electrification, putting an undue burden without a promise of quick returns
– Emergence of software as key differentiator will make many existing competencies obsolete and create more intensive competition from new tech players
– Commoditization of hardware parts and disaggregation of systems will exert additional pressure to reduce cost and increase operational efficiency
– Potential downswing of valuations for commoditized suppliers in the midterm might go along with growing investor pressure to increase shareholder value
> In order to succeed in the new automotive environment, suppliers will have to transform their existing business models
– Rethink overall strategy in order to either capture new growth opportunities or consolidate the market around the existing portfolio
– Define a long term technology roadmap and strategic positioning in the value chain regarding both product and service offering
– Implement a lower operating cost base and ensure sufficient financing for the upcoming transition at the same time
– Adapt organizational structure and governance model to successfully manage new emerging technologies and competencies alongside old declining technologies under one roof
– Create a new company mindset and culture to foster innovation which is of paramount importance to compete in the new technology areas
– Build up new partnerships and leverage this ecosystem to find new ways to innovate
5 Global Automotive Supplier Study 2018.pptx
Contents
This document shall be treated as confidential. It has been compiled for the exclusive, internal use by our client and is not complete without the underlying detail analyses and the oral presentation.
It may not be passed on and/or may not be made available to third parties without prior written consent from and .
© Roland Berger/Lazard
The status
Record volumes and profits, but key markets are at a tipping point
A The consequence
Automotive suppliers need to transform their business models
D
Roland Berger and Lazard Automotive teams
The Contacts
E The challenge
Suppliers' traditional business will be questioned on multiple levels
C The future
Upcoming automotive disruption will fundamentally change the industry
B
6 Global Automotive Supplier Study 2018.pptx
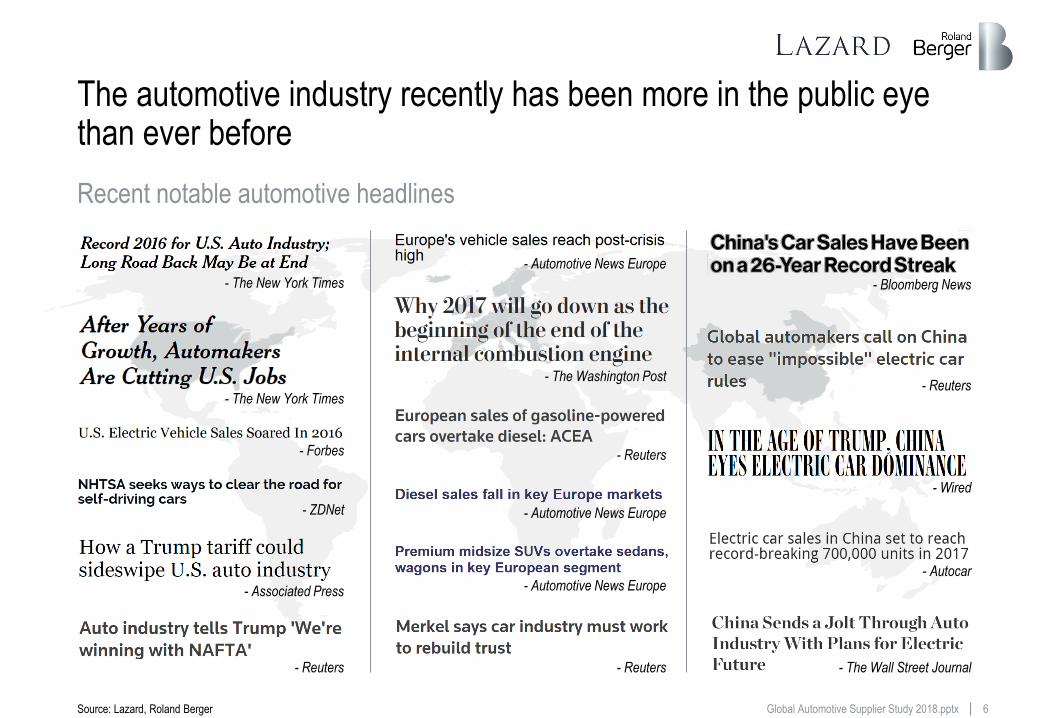
The automotive industry recently has been more in the public eye than ever before
Recent notable automotive headlines
Source: Lazard, Roland Berger
- The New York Times
- The New York Times
- Forbes
- ZDNet
- Associated Press
- Reuters
- Automotive News Europe
- The Washington Post
- Reuters
- Automotive News Europe
- Automotive News Europe
- Reuters
- Bloomberg News
- Reuters
- Wired
- Autocar
- The Wall Street Journal
7 Global Automotive Supplier Study 2018.pptx
7
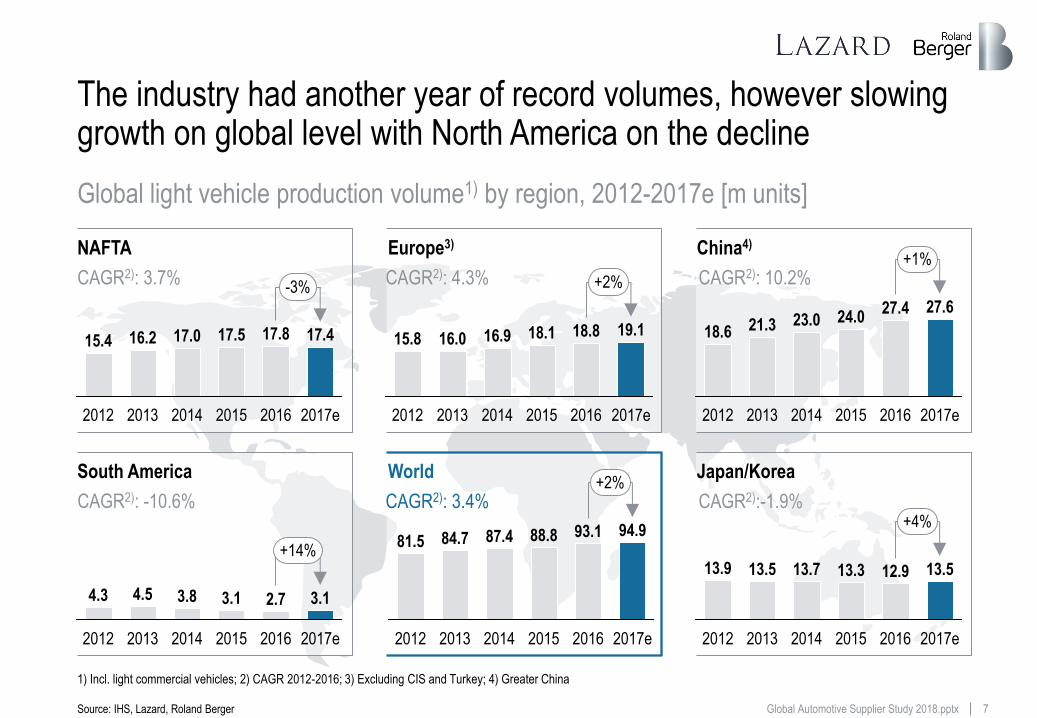
The industry had another year of record volumes, however slowing growth on global level with North America on the decline
World
NAFTA Europe3) China4)
Japan/Korea
CAGR2): 3.7% CAGR2): 4.3% CAGR2): 10.2%
CAGR2): 3.4% CAGR2):-1.9%
17.4
-3%
2016
17.8
2015
17.5
2014
17.0
2017e 2013 2012
16.2 15.4 18.1 16.9
2013 2012
16.0 15.8
2014
+2%
2017e
19.1
2016
18.8
2015 2015
27.6 23.0
2016
18.6
+1%
2014 2013
27.4
2017e
21.3
2012
24.0
South America
CAGR2): -10.6%
4.3
2012 2014 2017e
2.7
2016
3.8 3.1 4.5
+14%
3.1
2015 2013
13.7
2013 2017e
13.5
2016
12.9
2015
13.3
+4%
2014
13.5 13.9
2012
+2%
2017e
94.9
2016
93.1
2015
88.8 81.5
2013 2014
87.4 84.7
2012
Global light vehicle production volume1) by region, 2012-2017e [m units]
Source: IHS, Lazard, Roland Berger
1) Incl. light commercial vehicles; 2) CAGR 2012-2016; 3) Excluding CIS and Turkey; 4) Greater China

8 Global Automotive Supplier Study 2018.pptx
-15
-10
-5
0
5
10
15
20
11 10 9 8 7 5 4 3 2 1 0 6 28
Thailand
United Kingdom
Turkey
Iran Russia
Czech Republic
Indonesia
Italy
Slovakia
Canada
France
Brazil
Spain
Mexico
South Korea
India
Germany
Japan
United States
China
-25
-20
-15
-10
-5
0
5
10
15
20
25
30
0 11 10 9 8 7 6 5 4 3 2 1
Geely
SAIC-GM-Wuling
BMW
Daimler
Suzuki
FCA
Honda
Ford GM
Hyundai
R-N
Toyota
VW
PSA
Dongfeng
Tata
Great Wall BAIC Mazda
Changan
Winners
In 2017, the U.S. and Canada experienced significant declines – Mexican and Japanese production driving global production growth
Production ∆ 2017e vs. 2016 [%]2)
Avg. 2.0%
By production country By OEM group
Total production 2017e [m units]
Winners
Losers Losers
Top 20 by country and by OEM group, light vehicle production1)
Source: IHS, Lazard, Roland Berger
1) Incl. light commercial vehicles; 2) Year-on-year growth rate
9 Global Automotive Supplier Study 2018.pptx Source: Company information, analyst forecasts, Lazard, Roland Berger
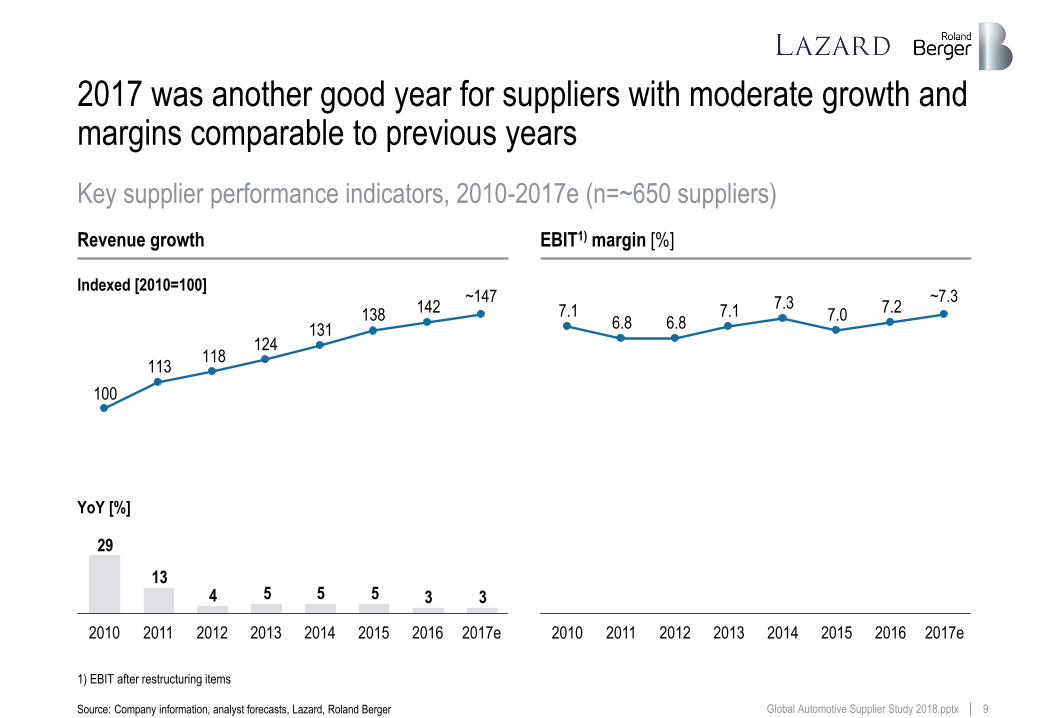
2017 was another good year for suppliers with moderate growth and margins comparable to previous years
Revenue growth EBIT1) margin [%]
33555413
29
142138131
124118
113
100
2012 2010 2011 2013 2014 2017e 2015
~147
2016
7.27.07.37.1
6.86.87.1
2015 2017e
~7.3
2012 2013 2010 2011 2014 2016
Key supplier performance indicators, 2010-2017e (n=~650 suppliers)
1) EBIT after restructuring items
Indexed [2010=100]
YoY [%]
10 Global Automotive Supplier Study 2018.pptx
10-y-Ø = 6.2x2)
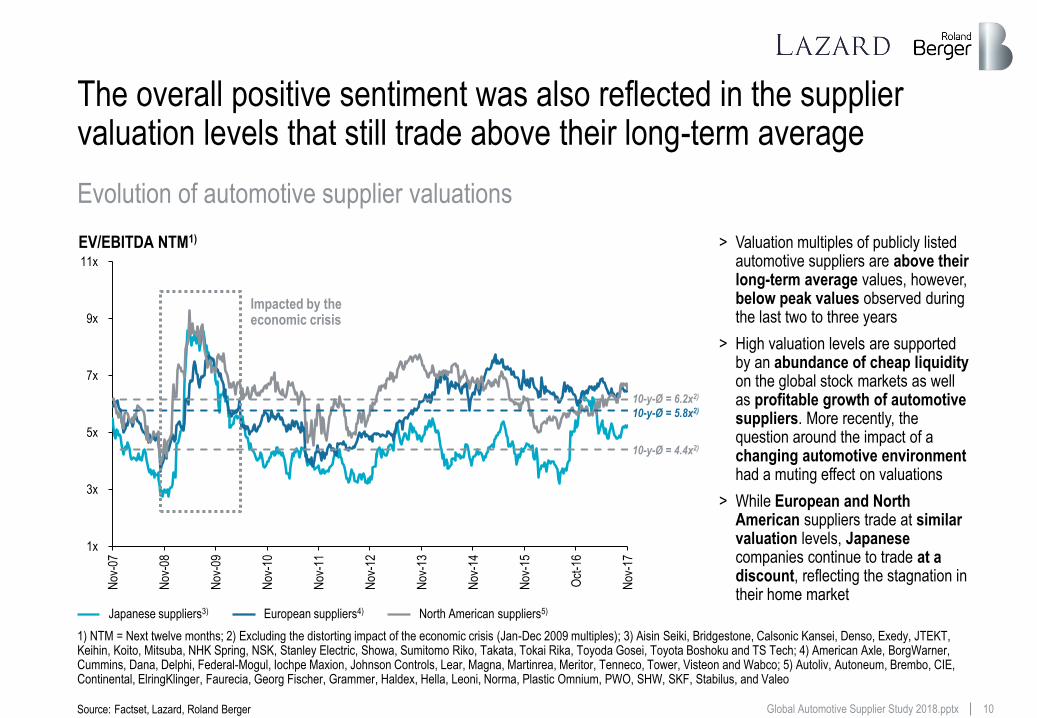
The overall positive sentiment was also reflected in the supplier valuation levels that still trade above their long-term average
Source: Factset, Lazard, Roland Berger
EV/EBITDA NTM1)
1x
3x
5x
7x
9x
11x
Nov
-07
Nov
-08
Nov
-09
Nov
-10
Nov
-11
Nov
-12
Nov
-13
Nov
-14
Nov
-15
Oct
-16
Nov
-17
> Valuation multiples of publicly listed automotive suppliers are above their long-term average values, however, below peak values observed during the last two to three years
> High valuation levels are supported by an abundance of cheap liquidity on the global stock markets as well as profitable growth of automotive suppliers. More recently, the question around the impact of a changing automotive environment had a muting effect on valuations
> While European and North American suppliers trade at similar valuation levels, Japanese companies continue to trade at a discount, reflecting the stagnation in their home market
Japanese suppliers3) European suppliers4) North American suppliers5)
10-y-Ø = 5.8x2)
10-y-Ø = 4.4x2)
Impacted by the economic crisis
Evolution of automotive supplier valuations
1) NTM = Next twelve months; 2) Excluding the distorting impact of the economic crisis (Jan-Dec 2009 multiples); 3) Aisin Seiki, Bridgestone, Calsonic Kansei, Denso, Exedy, JTEKT, Keihin, Koito, Mitsuba, NHK Spring, NSK, Stanley Electric, Showa, Sumitomo Riko, Takata, Tokai Rika, Toyoda Gosei, Toyota Boshoku and TS Tech; 4) American Axle, BorgWarner, Cummins, Dana, Delphi, Federal-Mogul, Iochpe Maxion, Johnson Controls, Lear, Magna, Martinrea, Meritor, Tenneco, Tower, Visteon and Wabco; 5) Autoliv, Autoneum, Brembo, CIE, Continental, ElringKlinger, Faurecia, Georg Fischer, Grammer, Haldex, Hella, Leoni, Norma, Plastic Omnium, PWO, SHW, SKF, Stabilus, and Valeo
11 Global Automotive Supplier Study 2018.pptx
11
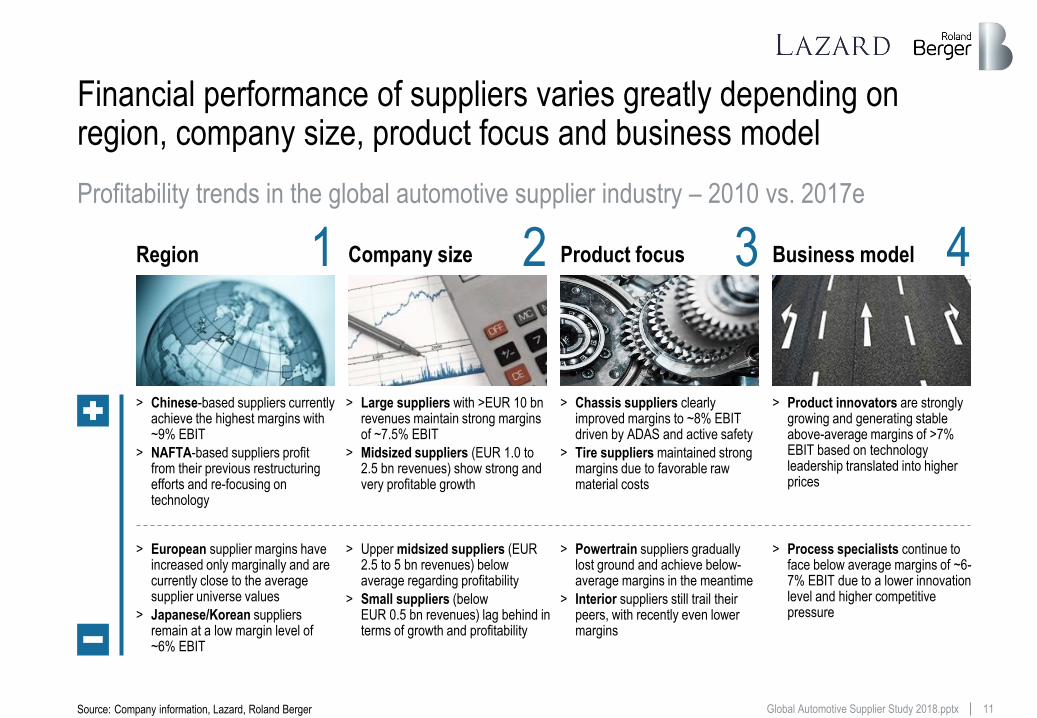
Financial performance of suppliers varies greatly depending on region, company size, product focus and business model
Source: Company information, Lazard, Roland Berger
> Chinese-based suppliers currently achieve the highest margins with ~9% EBIT
> NAFTA-based suppliers profit from their previous restructuring efforts and re-focusing on technology
> European supplier margins have increased only marginally and are currently close to the average supplier universe values
> Japanese/Korean suppliers remain at a low margin level of ~6% EBIT
> Large suppliers with >EUR 10 bn revenues maintain strong margins of ~7.5% EBIT
> Midsized suppliers (EUR 1.0 to 2.5 bn revenues) show strong and very profitable growth
> Upper midsized suppliers (EUR 2.5 to 5 bn revenues) below average regarding profitability
> Small suppliers (below EUR 0.5 bn revenues) lag behind in terms of growth and profitability
> Chassis suppliers clearly improved margins to ~8% EBIT driven by ADAS and active safety
> Tire suppliers maintained strong margins due to favorable raw material costs
> Powertrain suppliers gradually lost ground and achieve below-average margins in the meantime
> Interior suppliers still trail their peers, with recently even lower margins
> Product innovators are strongly growing and generating stable above-average margins of >7% EBIT based on technology leadership translated into higher prices
> Process specialists continue to face below average margins of ~6-7% EBIT due to a lower innovation level and higher competitive pressure
Region Company size Product focus Business model 1 2 3 4 Profitability trends in the global automotive supplier industry – 2010 vs. 2017e
12 Global Automotive Supplier Study 2018.pptx
11.7
7.5 6.9
8.5
5.5
~8.7 ~8.3
~7.2
~6.5 ~6.3
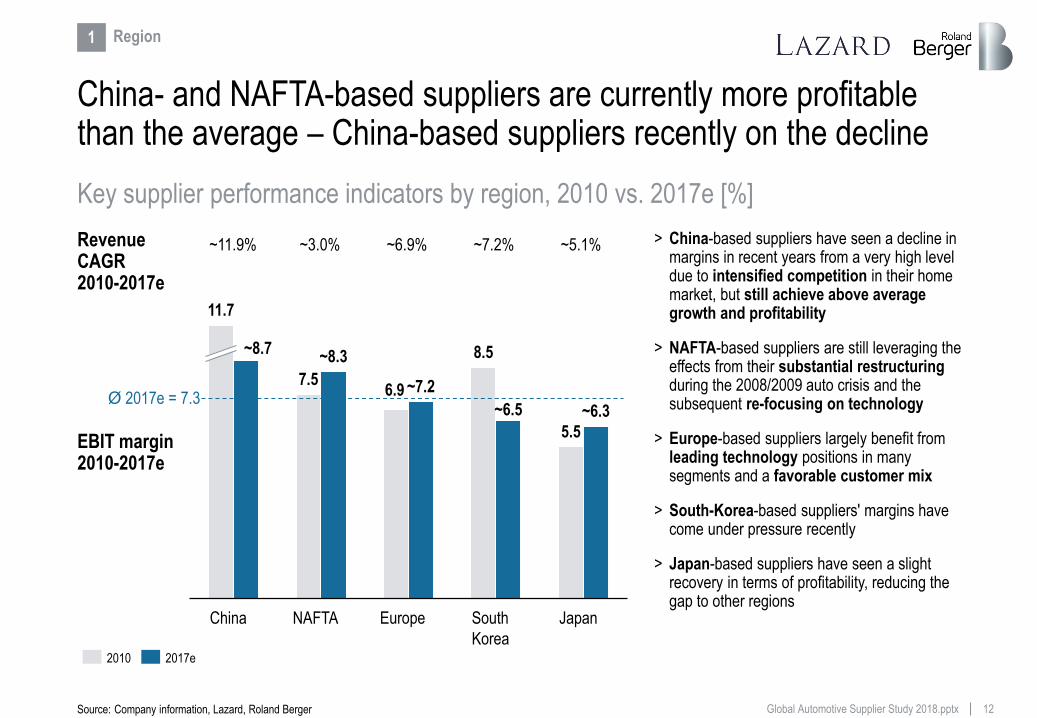
China- and NAFTA-based suppliers are currently more profitable than the average – China-based suppliers recently on the decline
Source: Company information, Lazard, Roland Berger
Japan South
Korea
Europe NAFTA China
2017e 2010
Revenue CAGR 2010-2017e
EBIT margin 2010-2017e
1 Region
Ø 2017e = 7.3
~11.9% ~3.0% ~6.9% ~7.2% ~5.1% > China-based suppliers have seen a decline in margins in recent years from a very high level due to intensified competition in their home market, but still achieve above average growth and profitability
> NAFTA-based suppliers are still leveraging the effects from their substantial restructuring during the 2008/2009 auto crisis and the subsequent re-focusing on technology
> Europe-based suppliers largely benefit from leading technology positions in many segments and a favorable customer mix
> South-Korea-based suppliers' margins have come under pressure recently
> Japan-based suppliers have seen a slight recovery in terms of profitability, reducing the gap to other regions
Key supplier performance indicators by region, 2010 vs. 2017e [%]
13 Global Automotive Supplier Study 2018.pptx
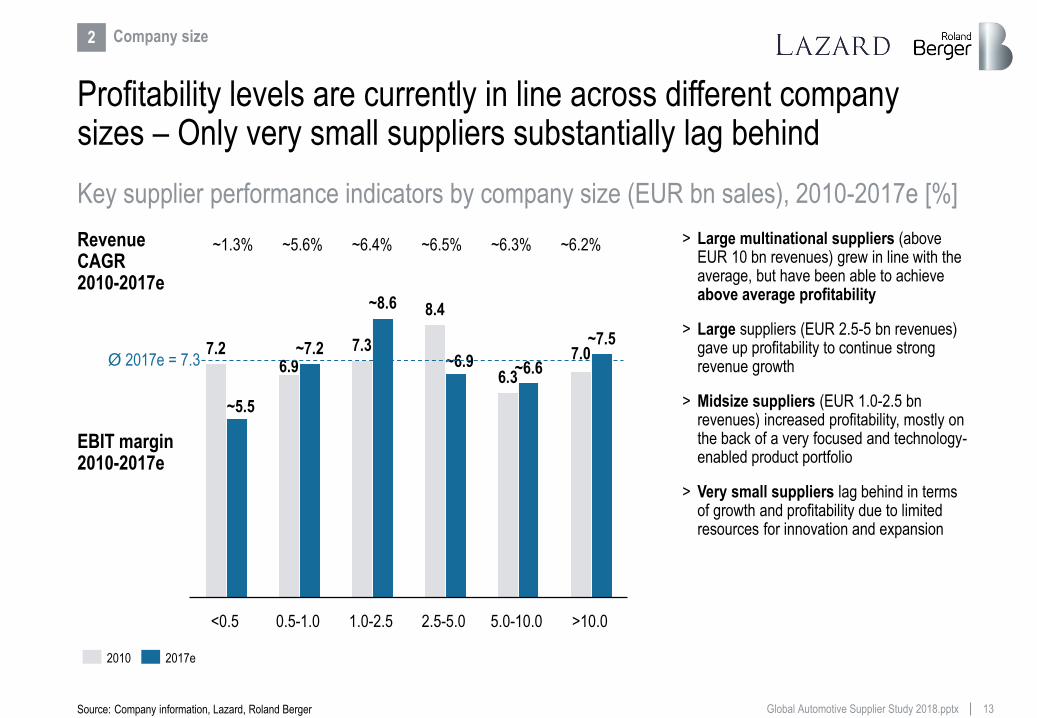
7.2 6.9
7.3
8.4
6.3
7.0
~5.5
~7.2
~8.6
~6.9 ~6.6
~7.5
2 Company size
Source: Company information, Lazard, Roland Berger
> Large multinational suppliers (above EUR 10 bn revenues) grew in line with the average, but have been able to achieve above average profitability
> Large suppliers (EUR 2.5-5 bn revenues) gave up profitability to continue strong revenue growth
> Midsize suppliers (EUR 1.0-2.5 bn revenues) increased profitability, mostly on the back of a very focused and technology-enabled product portfolio
> Very small suppliers lag behind in terms of growth and profitability due to limited resources for innovation and expansion
>10.0 <0.5 0.5-1.0 1.0-2.5 2.5-5.0 5.0-10.0
Profitability levels are currently in line across different company sizes – Only very small suppliers substantially lag behind
2017e 2010
Revenue CAGR 2010-2017e
EBIT margin 2010-2017e
Ø 2017e = 7.3
~1.3% ~5.6% ~6.4% ~6.5% ~6.3% ~6.2%
Key supplier performance indicators by company size (EUR bn sales), 2010-2017e [%]
14 Global Automotive Supplier Study 2018.pptx
6.6 6.8
7.3 7.6 7.3
5.9
~11.5
~8.0
~6.4
~7.8
~6.1
~5.5
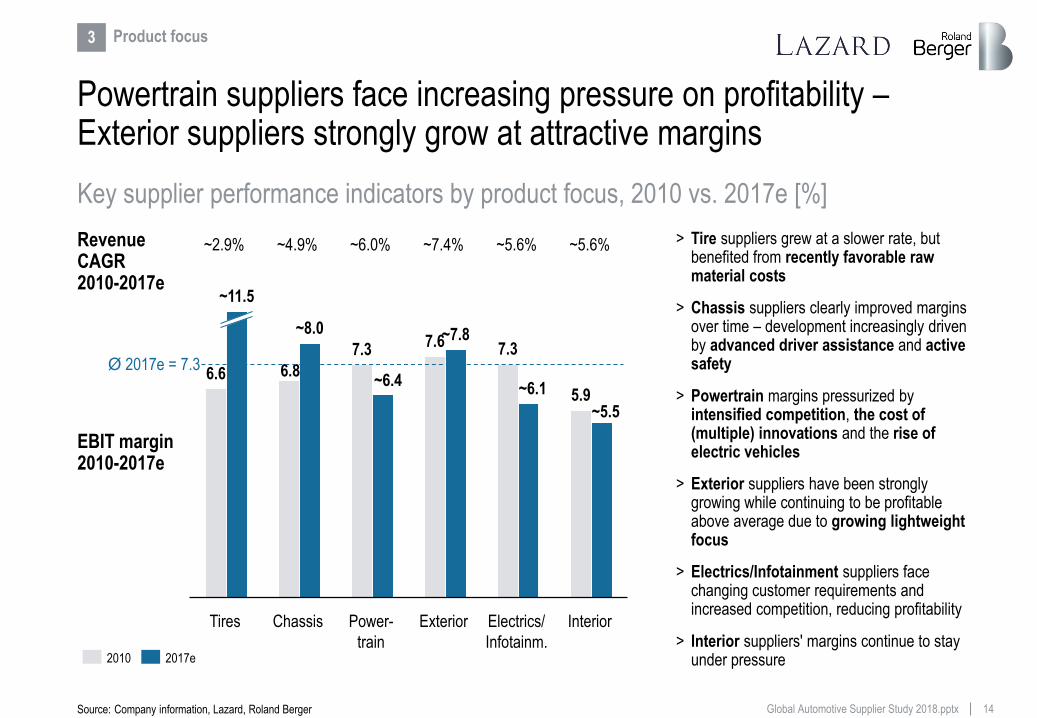
Powertrain suppliers face increasing pressure on profitability – Exterior suppliers strongly grow at attractive margins
Source: Company information, Lazard, Roland Berger
3 Product focus
> Tire suppliers grew at a slower rate, but benefited from recently favorable raw material costs
> Chassis suppliers clearly improved margins over time – development increasingly driven by advanced driver assistance and active safety
> Powertrain margins pressurized by intensified competition, the cost of (multiple) innovations and the rise of electric vehicles
> Exterior suppliers have been strongly growing while continuing to be profitable above average due to growing lightweight focus
> Electrics/Infotainment suppliers face changing customer requirements and increased competition, reducing profitability
> Interior suppliers' margins continue to stay under pressure
Electrics/
Infotainm.
Exterior Chassis Power-
train
Interior Tires
~2.9% ~4.9% ~6.0% ~7.4% ~5.6% ~5.6%
2017e 2010
Revenue CAGR 2010-2017e
EBIT margin 2010-2017e
Ø 2017e = 7.3
Key supplier performance indicators by product focus, 2010 vs. 2017e [%]
15 Global Automotive Supplier Study 2018.pptx
7.7
6.7
~7.2
~6.7
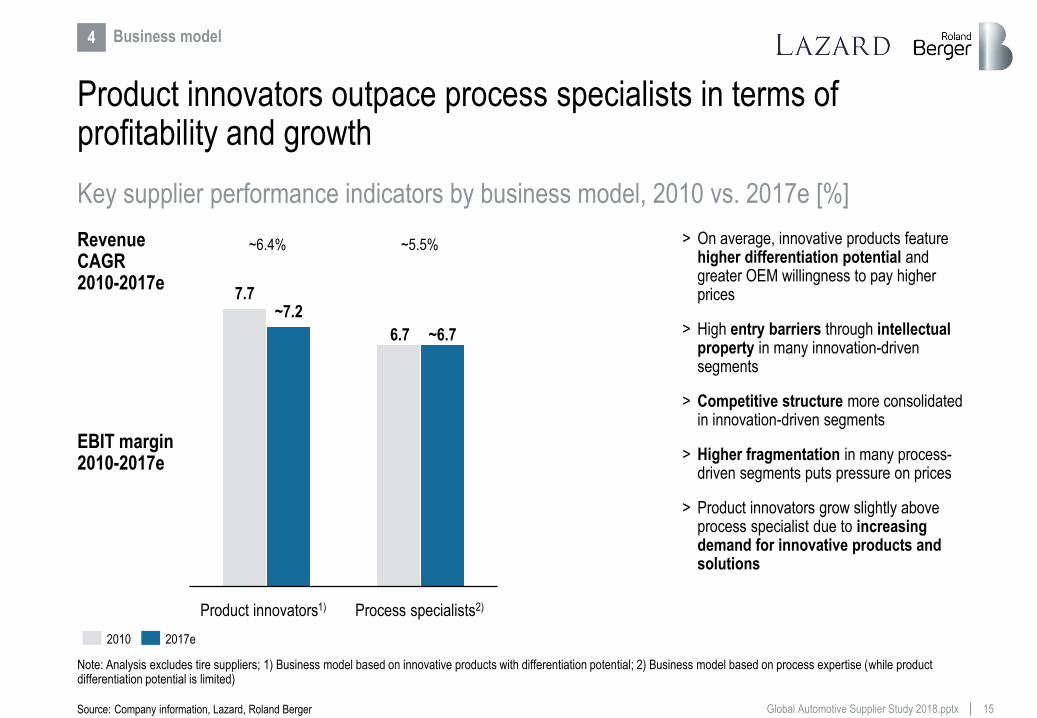
Product innovators outpace process specialists in terms of profitability and growth
Source: Company information, Lazard, Roland Berger
4 Business model
> On average, innovative products feature higher differentiation potential and greater OEM willingness to pay higher prices
> High entry barriers through intellectual property in many innovation-driven segments
> Competitive structure more consolidated in innovation-driven segments
> Higher fragmentation in many process-driven segments puts pressure on prices
> Product innovators grow slightly above process specialist due to increasing demand for innovative products and solutions
Process specialists2) Product innovators1)
~6.4% ~5.5%
2017e 2010
Revenue CAGR 2010-2017e
EBIT margin 2010-2017e
Key supplier performance indicators by business model, 2010 vs. 2017e [%]
Note: Analysis excludes tire suppliers; 1) Business model based on innovative products with differentiation potential; 2) Business model based on process expertise (while product differentiation potential is limited)
16 Global Automotive Supplier Study 2018.pptx
100
122 132
149
163
180
194
100 112 112
118 120 119 116
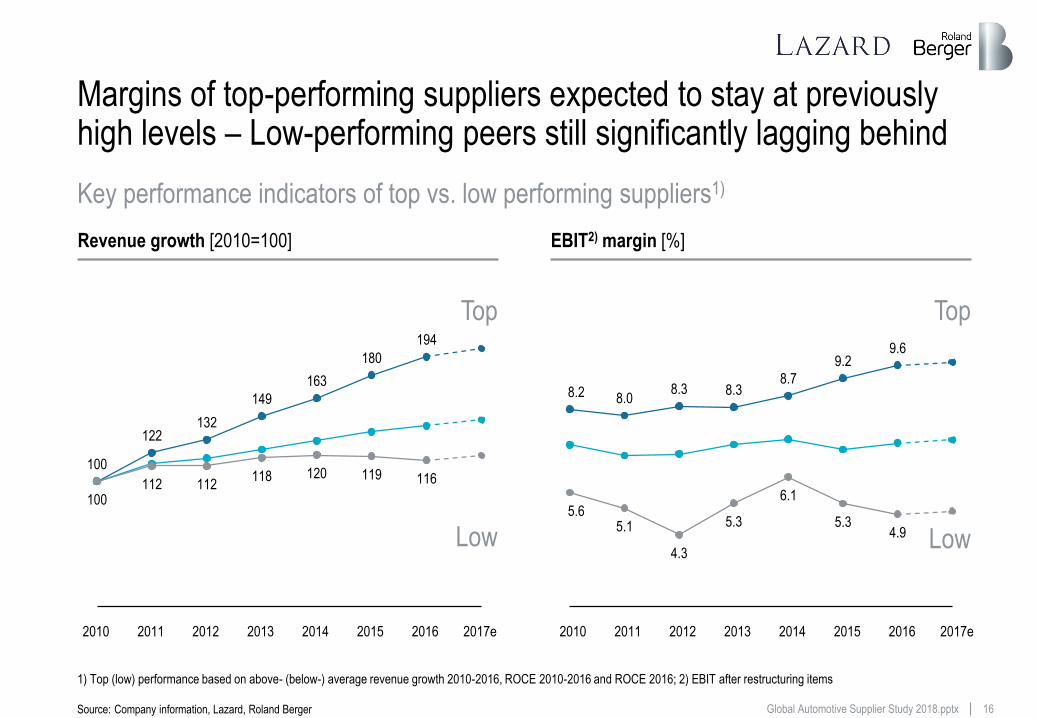
Margins of top-performing suppliers expected to stay at previously high levels – Low-performing peers still significantly lagging behind
8.2 8.0 8.3 8.3
8.7
9.2 9.6
5.6 5.1
4.3
5.3
6.1
5.3 4.9
Revenue growth [2010=100] EBIT2) margin [%]
Low
Top
Source: Company information, Lazard, Roland Berger
Low
Top
2010 2011 2012 2013 2014 2015 2016 2017e 2010 2011 2012 2013 2014 2015 2016 2017e
Key performance indicators of top vs. low performing suppliers1)
1) Top (low) performance based on above- (below-) average revenue growth 2010-2016, ROCE 2010-2016 and ROCE 2016; 2) EBIT after restructuring items
17 Global Automotive Supplier Study 2018.pptx
0
1
2
3
4
5
6
7
8
9
10
11
12
13
14
0 1 2 3 4 5 6 7 8 9 10 11 12 13
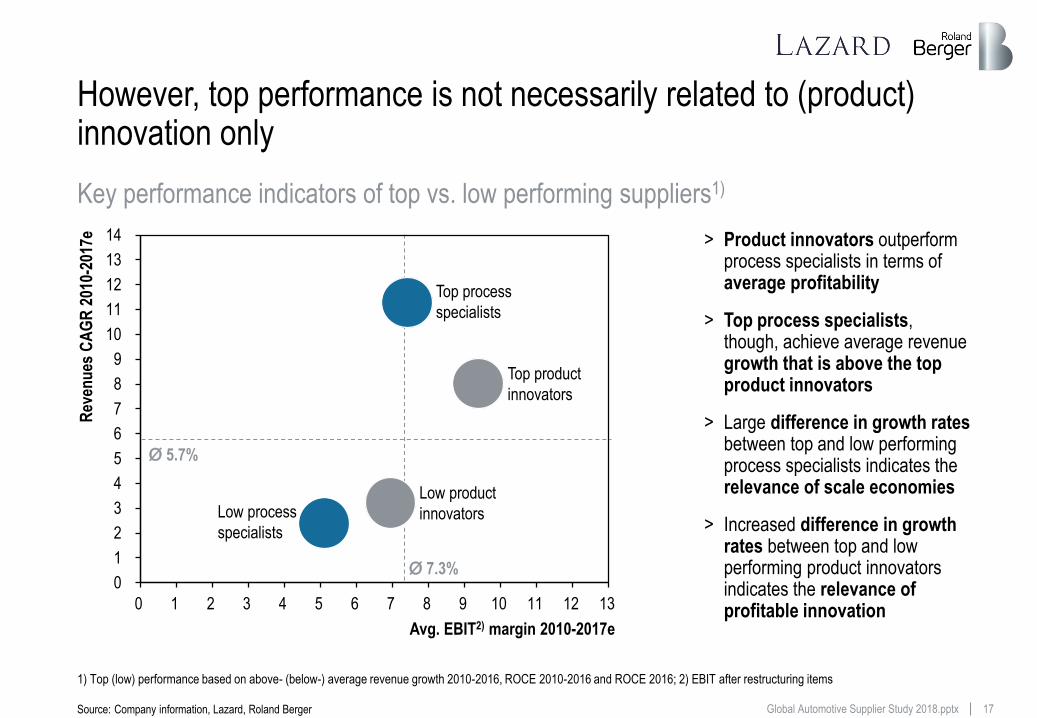
However, top performance is not necessarily related to (product) innovation only
Source: Company information, Lazard, Roland Berger
Rev
enu
es C
AG
R 2
010-
2017
e
Low product
innovators
Top process
specialists
Low process
specialists
Top product
innovators
Avg. EBIT2) margin 2010-2017e
> Product innovators outperform process specialists in terms of average profitability
> Top process specialists, though, achieve average revenue growth that is above the top product innovators
> Large difference in growth rates between top and low performing process specialists indicates the relevance of scale economies
> Increased difference in growth rates between top and low performing product innovators indicates the relevance of profitable innovation
Ø 5.7%
Ø 7.3%
Key performance indicators of top vs. low performing suppliers1)
1) Top (low) performance based on above- (below-) average revenue growth 2010-2016, ROCE 2010-2016 and ROCE 2016; 2) EBIT after restructuring items
18 Global Automotive Supplier Study 2018.pptx
7.1 6.8 6.8
7.1 7.3 7.0
7.2 ~7.3
17e 13 11 10 14 16 15 12 18e 18e 17e 13 16 11 10 15 14 12
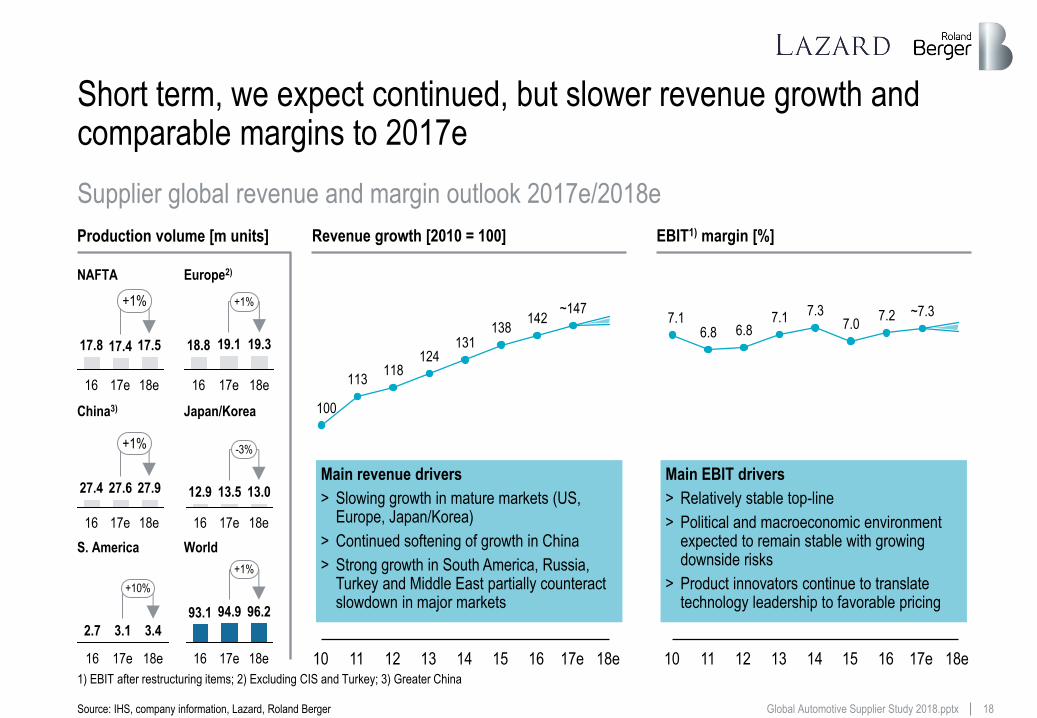
Short term, we expect continued, but slower revenue growth and comparable margins to 2017e
Production volume [m units]
Main revenue drivers
> Slowing growth in mature markets (US, Europe, Japan/Korea)
> Continued softening of growth in China
> Strong growth in South America, Russia, Turkey and Middle East partially counteract slowdown in major markets
Revenue growth [2010 = 100] EBIT1) margin [%]
Main EBIT drivers
> Relatively stable top-line
> Political and macroeconomic environment expected to remain stable with growing downside risks
> Product innovators continue to translate technology leadership to favorable pricing
NAFTA Europe2)
China3) Japan/Korea
S. America World
17.5
18e
+1%
17e 16
17.8 17.4
+1%
19.3
18e
19.1
16
18.8
17e
+1%
18e
27.9 27.4
16
27.6
17e
13.5
-3%
13.0
17e 16
12.9
18e
3.1
+10%
18e 17e 16
2.7 3.4
96.2
18e
+1%
17e
94.9 93.1
16
100
113 118
124 131
138 142
~147
Supplier global revenue and margin outlook 2017e/2018e
1) EBIT after restructuring items; 2) Excluding CIS and Turkey; 3) Greater China
Source: IHS, company information, Lazard, Roland Berger
19 Global Automotive Supplier Study 2018.pptx
Contents
This document shall be treated as confidential. It has been compiled for the exclusive, internal use by our client and is not complete without the underlying detail analyses and the oral presentation.
It may not be passed on and/or may not be made available to third parties without prior written consent from and .
© Roland Berger/Lazard
The status
Record volumes and profits, but key markets are at a tipping point
A The consequence
Automotive suppliers need to transform their business models
D
Roland Berger and Lazard Automotive teams
The Contacts
E The challenge
Suppliers' traditional business will be questioned on multiple levels
C The future
Upcoming automotive disruption will fundamentally change the industry
B
20 Global Automotive Supplier Study 2018.pptx
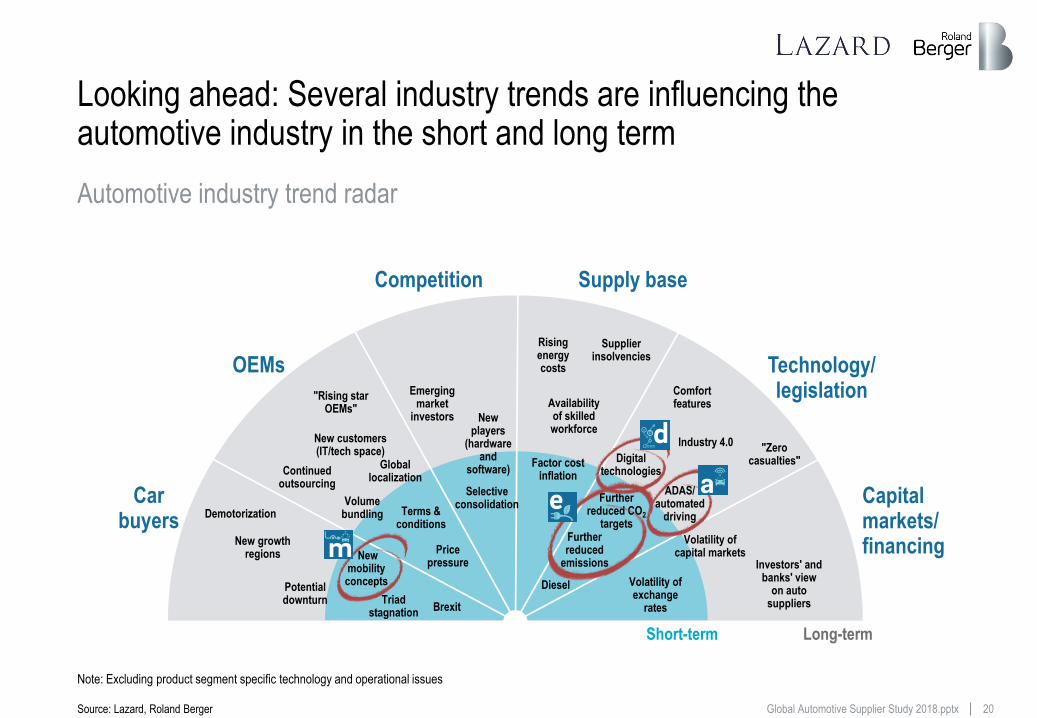
Looking ahead: Several industry trends are influencing the automotive industry in the short and long term
Car buyers
OEMs
Competition Supply base
Capital markets/ financing
Technology/ legislation
Long-term Short-term
Volatility of capital markets
"Zero casualties"
Rising energy costs
Availability of skilled workforce
Supplier insolvencies
Factor cost inflation
Selective consolidation
"Rising star OEMs"
Global localization
Price pressure
Volume bundling
Emerging market
investors
New growth regions
Continued outsourcing
ADAS/ automated
driving
Further reduced
emissions
Comfort features
New players
(hardware and
software)
Volatility of exchange
rates
Demotorization
Digital technologies
Triad stagnation
Investors' and banks' view
on auto suppliers
New mobility concepts
Terms & conditions
Further reduced CO2
targets
Potential downturn
Diesel
Industry 4.0 New customers (IT/tech space)
Brexit
Automotive industry trend radar
Note: Excluding product segment specific technology and operational issues
Source: Lazard, Roland Berger
21 Global Automotive Supplier Study 2018.pptx
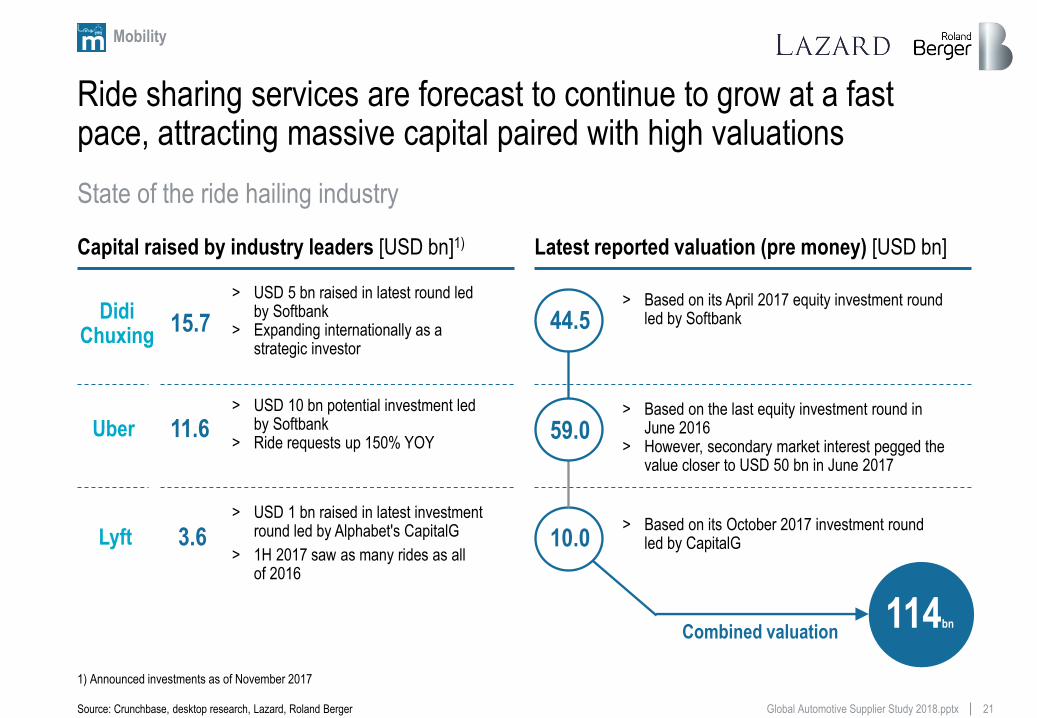
Ride sharing services are forecast to continue to grow at a fast pace, attracting massive capital paired with high valuations
Capital raised by industry leaders [USD bn]1)
114bn Combined valuation
Mobility
Latest reported valuation (pre money) [USD bn]
11.6 > USD 10 bn potential investment led
by Softbank > Ride requests up 150% YOY
59.0 > Based on the last equity investment round in
June 2016 > However, secondary market interest pegged the
value closer to USD 50 bn in June 2017
15.7
> USD 5 bn raised in latest round led by Softbank
> Expanding internationally as a strategic investor
44.5 > Based on its April 2017 equity investment round
led by Softbank
3.6 > USD 1 bn raised in latest investment
round led by Alphabet's CapitalG
> 1H 2017 saw as many rides as all of 2016
10.0 > Based on its October 2017 investment round
led by CapitalG
Didi Chuxing
Lyft
Uber
State of the ride hailing industry
1) Announced investments as of November 2017
Source: Crunchbase, desktop research, Lazard, Roland Berger
22 Global Automotive Supplier Study 2018.pptx
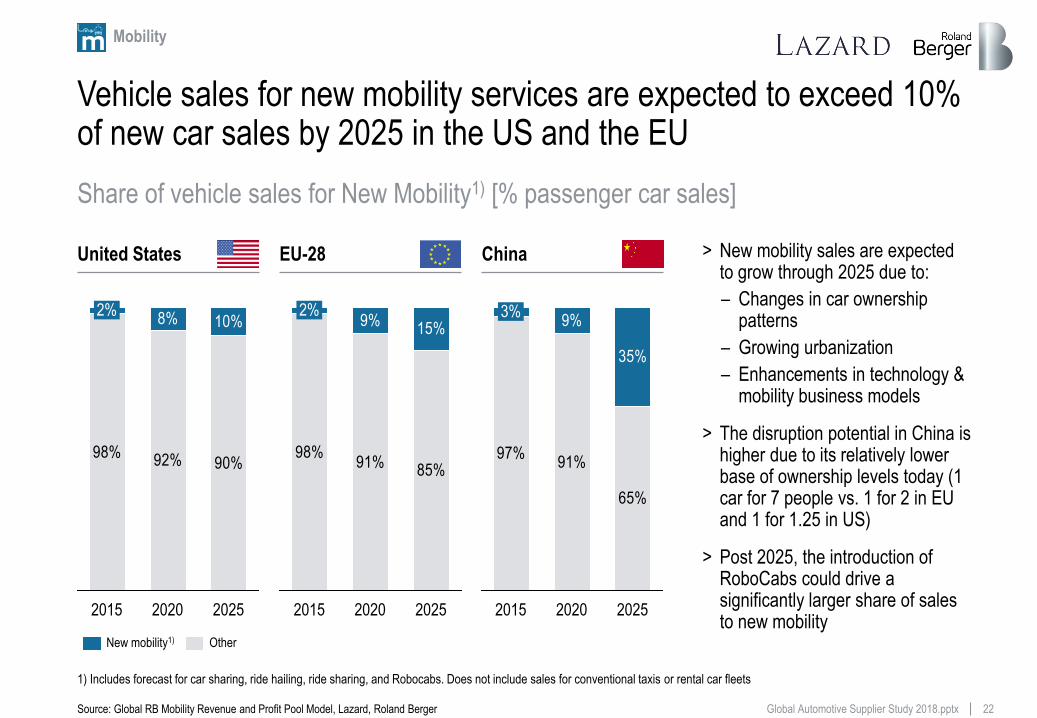
Vehicle sales for new mobility services are expected to exceed 10% of new car sales by 2025 in the US and the EU
98%92% 90%
8% 10%
2025 2020 2015
2%
Other New mobility1)
> New mobility sales are expected to grow through 2025 due to:
– Changes in car ownership patterns
– Growing urbanization
– Enhancements in technology & mobility business models
> The disruption potential in China is higher due to its relatively lower base of ownership levels today (1 car for 7 people vs. 1 for 2 in EU and 1 for 1.25 in US)
> Post 2025, the introduction of RoboCabs could drive a significantly larger share of sales to new mobility
98%91%
85%
9%15%
2025 2020 2015
2%
United States EU-28
97%91%
65%
9%
35%
2025
3%
2015 2020
China
Share of vehicle sales for New Mobility1) [% passenger car sales]
1) Includes forecast for car sharing, ride hailing, ride sharing, and Robocabs. Does not include sales for conventional taxis or rental car fleets
Source: Global RB Mobility Revenue and Profit Pool Model, Lazard, Roland Berger
Mobility
23 Global Automotive Supplier Study 2018.pptx
23
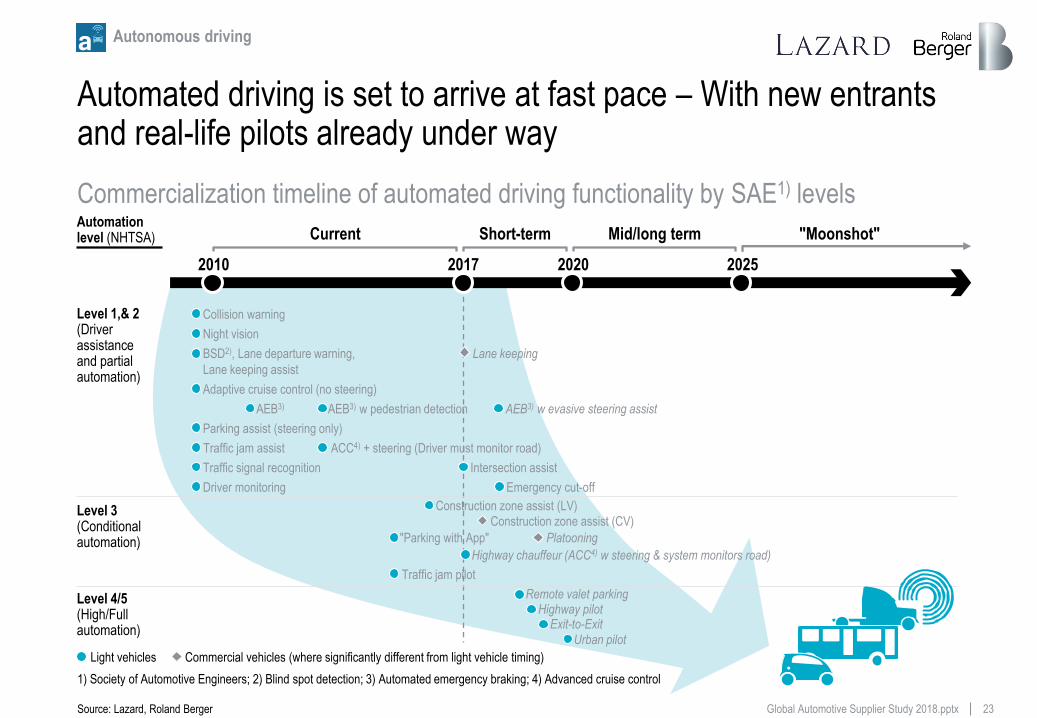
Automated driving is set to arrive at fast pace – With new entrants and real-life pilots already under way
Level 1,& 2 (Driver assistance and partial automation)
Parking assist (steering only)
BSD2), Lane departure warning,
Lane keeping assist
Collision warning
Adaptive cruise control (no steering)
Driver monitoring
Night vision
Traffic signal recognition
Level 3 (Conditional automation)
Level 4/5 (High/Full automation)
2017 2010 2025 2020
AEB3) w evasive steering assist AEB3) AEB3) w pedestrian detection
Traffic jam assist ACC4) + steering (Driver must monitor road)
"Parking with App"
Remote valet parking Highway pilot
Urban pilot
Current Short-term Mid/long term "Moonshot" Automation level (NHTSA)
Traffic jam pilot
Light vehicles Commercial vehicles (where significantly different from light vehicle timing)
Construction zone assist (LV)
Highway chauffeur (ACC4) w steering & system monitors road)
Platooning
Lane keeping
Intersection assist
Emergency cut-off
Exit-to-Exit
Autonomous driving
Construction zone assist (CV)
Commercialization timeline of automated driving functionality by SAE1) levels
1) Society of Automotive Engineers; 2) Blind spot detection; 3) Automated emergency braking; 4) Advanced cruise control
Source: Lazard, Roland Berger
24 Global Automotive Supplier Study 2018.pptx
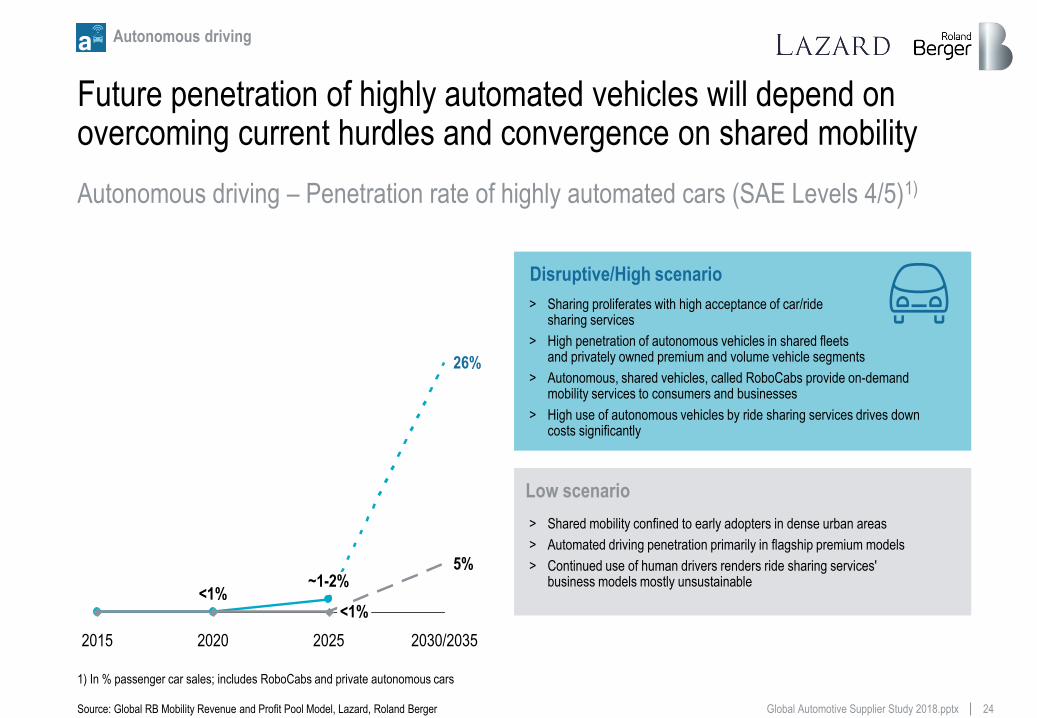
26%
5%
2030/2035 2020 2025
<1%
~1-2%
2015
<1%
Future penetration of highly automated vehicles will depend on overcoming current hurdles and convergence on shared mobility
> Shared mobility confined to early adopters in dense urban areas
> Automated driving penetration primarily in flagship premium models
> Continued use of human drivers renders ride sharing services' business models mostly unsustainable
Low scenario
> Sharing proliferates with high acceptance of car/ride sharing services
> High penetration of autonomous vehicles in shared fleets and privately owned premium and volume vehicle segments
> Autonomous, shared vehicles, called RoboCabs provide on-demand mobility services to consumers and businesses
> High use of autonomous vehicles by ride sharing services drives down costs significantly
Disruptive/High scenario
Autonomous driving – Penetration rate of highly automated cars (SAE Levels 4/5)1)
1) In % passenger car sales; includes RoboCabs and private autonomous cars
Source: Global RB Mobility Revenue and Profit Pool Model, Lazard, Roland Berger
Autonomous driving
25 Global Automotive Supplier Study 2018.pptx
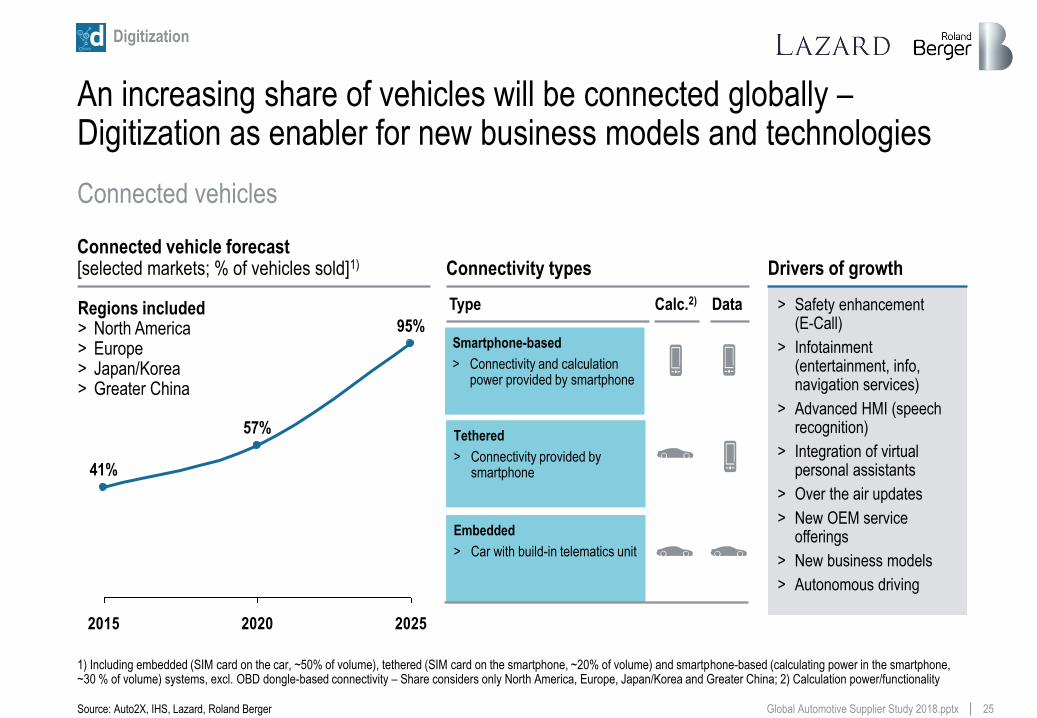
An increasing share of vehicles will be connected globally – Digitization as enabler for new business models and technologies
Digitization
2015 2020 2025
41%
57%
95% Regions included > North America > Europe > Japan/Korea > Greater China
Calc.2) Data Type
Smartphone-based
> Connectivity and calculation power provided by smartphone
Tethered
> Connectivity provided by smartphone
Embedded
> Car with build-in telematics unit
Connected vehicle forecast [selected markets; % of vehicles sold]1) Connectivity types
> Safety enhancement (E-Call)
> Infotainment (entertainment, info, navigation services)
> Advanced HMI (speech recognition)
> Integration of virtual personal assistants
> Over the air updates
> New OEM service offerings
> New business models
> Autonomous driving
Drivers of growth
Connected vehicles
1) Including embedded (SIM card on the car, ~50% of volume), tethered (SIM card on the smartphone, ~20% of volume) and smartphone-based (calculating power in the smartphone, ~30 % of volume) systems, excl. OBD dongle-based connectivity – Share considers only North America, Europe, Japan/Korea and Greater China; 2) Calculation power/functionality
Source: Auto2X, IHS, Lazard, Roland Berger
26 Global Automotive Supplier Study 2018.pptx
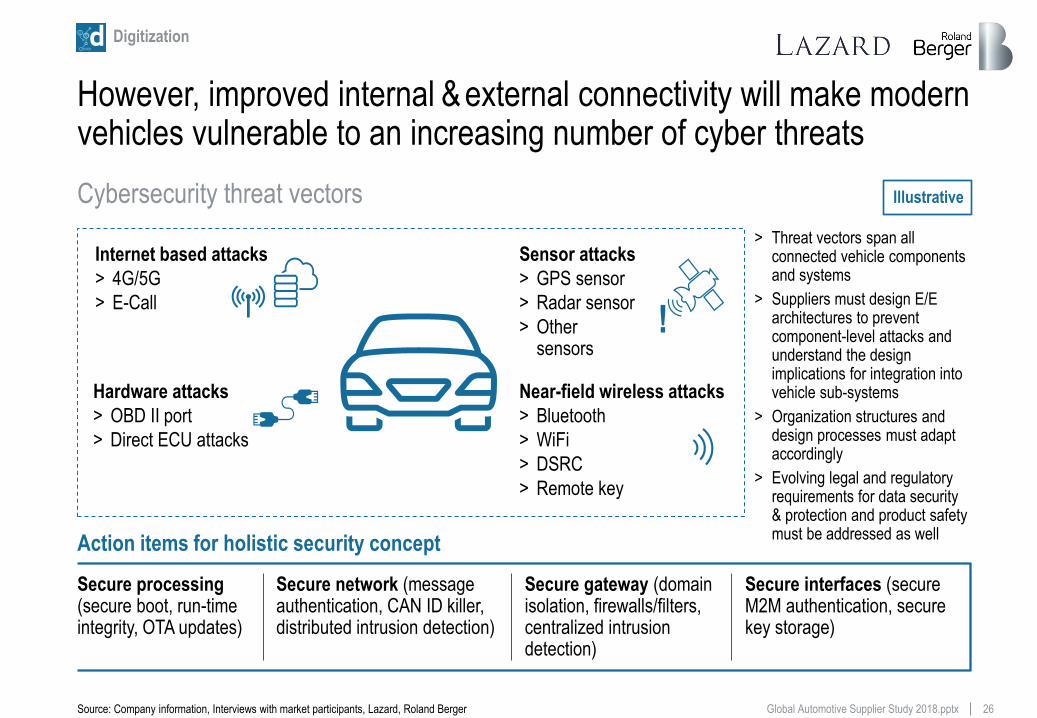
However, improved internal & external connectivity will make modern vehicles vulnerable to an increasing number of cyber threats
!
Action items for holistic security concept
Internet based attacks
> 4G/5G
> E-Call
Hardware attacks
> OBD II port
> Direct ECU attacks
Sensor attacks
> GPS sensor
> Radar sensor
> Other sensors
Near-field wireless attacks
> Bluetooth
> WiFi
> DSRC
> Remote key
Secure gateway (domain isolation, firewalls/filters, centralized intrusion detection)
Secure interfaces (secure M2M authentication, secure key storage)
Secure processing (secure boot, run-time integrity, OTA updates)
Secure network (message authentication, CAN ID killer, distributed intrusion detection)
Illustrative
> Threat vectors span all connected vehicle components and systems
> Suppliers must design E/E architectures to prevent component-level attacks and understand the design implications for integration into vehicle sub-systems
> Organization structures and design processes must adapt accordingly
> Evolving legal and regulatory requirements for data security & protection and product safety must be addressed as well
Cybersecurity threat vectors
Source: Company information, Interviews with market participants, Lazard, Roland Berger
Digitization
27 Global Automotive Supplier Study 2018.pptx
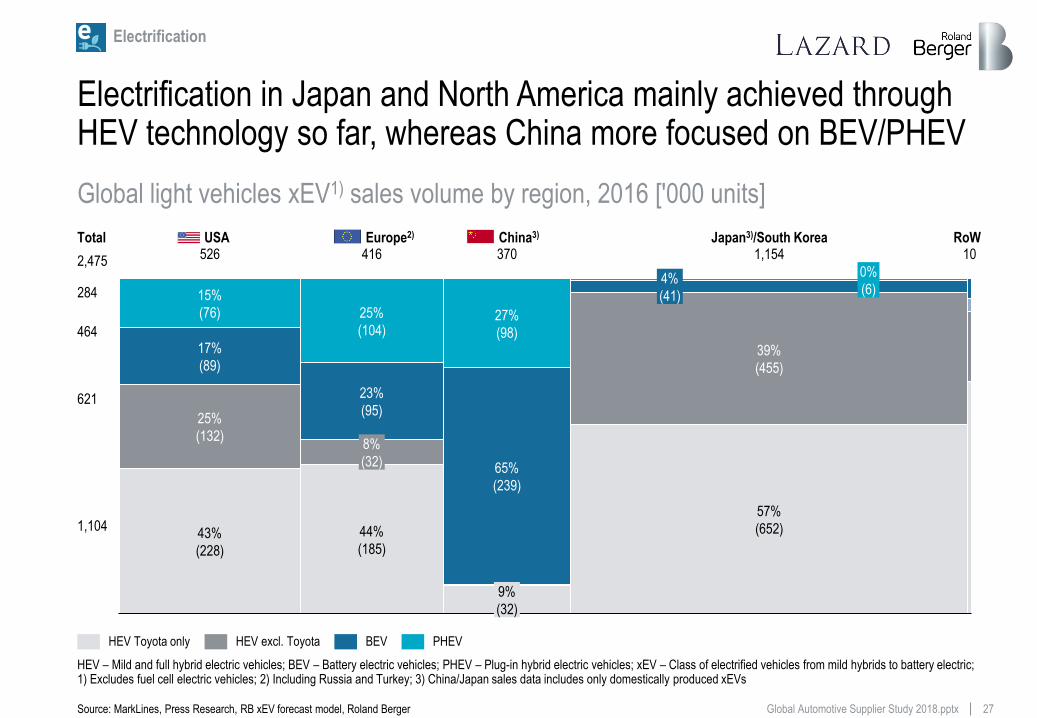
Electrification in Japan and North America mainly achieved through HEV technology so far, whereas China more focused on BEV/PHEV
HEV Toyota only HEV excl. Toyota BEV PHEV
10 1,154
57%
(652)
39%
(455)
4%
(41)
0%
(6)
370
9%
(32)
65%
(239)
27%
(98)
416
44%
(185)
8%
(32)
23%
(95)
25%
(104)
526
43%
(228)
25%
(132)
17%
(89)
15%
(76)
USA Europe2) China3) Japan3)/South Korea RoW
284
464
621
1,104
2,475
Total
Electrification
Global light vehicles xEV1) sales volume by region, 2016 ['000 units]
HEV – Mild and full hybrid electric vehicles; BEV – Battery electric vehicles; PHEV – Plug-in hybrid electric vehicles; xEV – Class of electrified vehicles from mild hybrids to battery electric; 1) Excludes fuel cell electric vehicles; 2) Including Russia and Turkey; 3) China/Japan sales data includes only domestically produced xEVs
Source: MarkLines, Press Research, RB xEV forecast model, Roland Berger
28 Global Automotive Supplier Study 2018.pptx
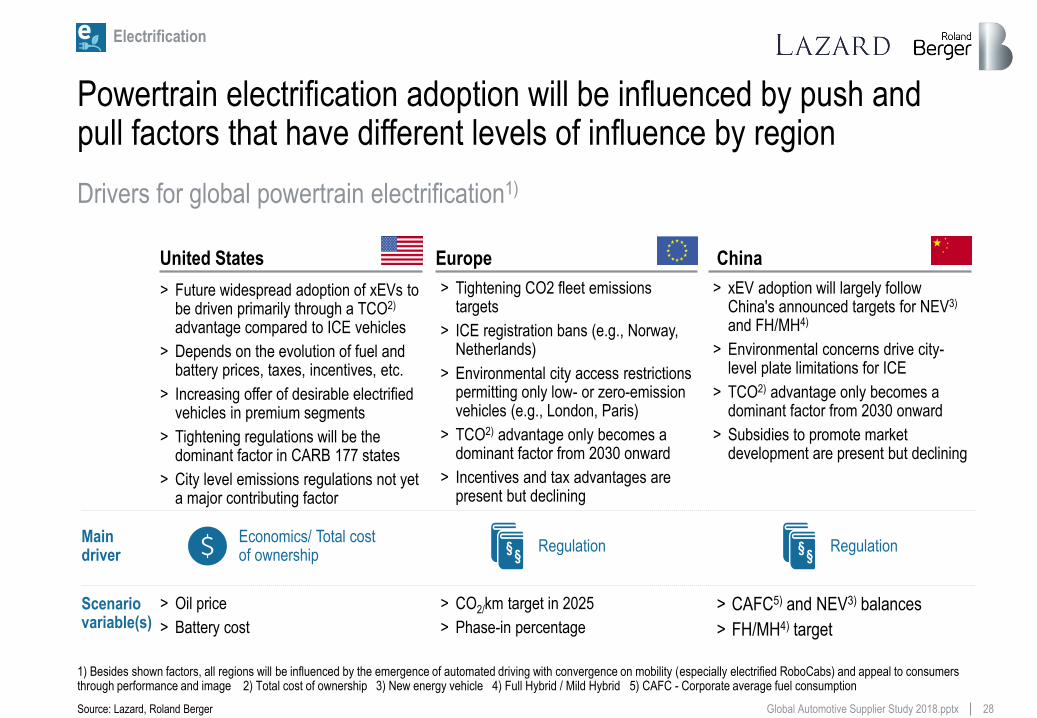
Powertrain electrification adoption will be influenced by push and pull factors that have different levels of influence by region
Economics/ Total cost of ownership
§ §
Drivers for global powertrain electrification1)
1) Besides shown factors, all regions will be influenced by the emergence of automated driving with convergence on mobility (especially electrified RoboCabs) and appeal to consumers through performance and image 2) Total cost of ownership 3) New energy vehicle 4) Full Hybrid / Mild Hybrid 5) CAFC - Corporate average fuel consumption
Source: Lazard, Roland Berger
Electrification
United States Europe China
> Future widespread adoption of xEVs to be driven primarily through a TCO2) advantage compared to ICE vehicles
> Depends on the evolution of fuel and battery prices, taxes, incentives, etc.
> Increasing offer of desirable electrified vehicles in premium segments
> Tightening regulations will be the dominant factor in CARB 177 states
> City level emissions regulations not yet a major contributing factor
> Tightening CO2 fleet emissions targets
> ICE registration bans (e.g., Norway, Netherlands)
> Environmental city access restrictions permitting only low- or zero-emission vehicles (e.g., London, Paris)
> TCO2) advantage only becomes a dominant factor from 2030 onward
> Incentives and tax advantages are present but declining
> xEV adoption will largely follow China's announced targets for NEV3) and FH/MH4)
> Environmental concerns drive city-level plate limitations for ICE
> TCO2) advantage only becomes a dominant factor from 2030 onward
> Subsidies to promote market development are present but declining
Main driver
§ §
Regulation Regulation
Scenario variable(s)
> CO2/km target in 2025
> Phase-in percentage
> Oil price
> Battery cost
> CAFC5) and NEV3) balances
> FH/MH4) target
29 Global Automotive Supplier Study 2018.pptx
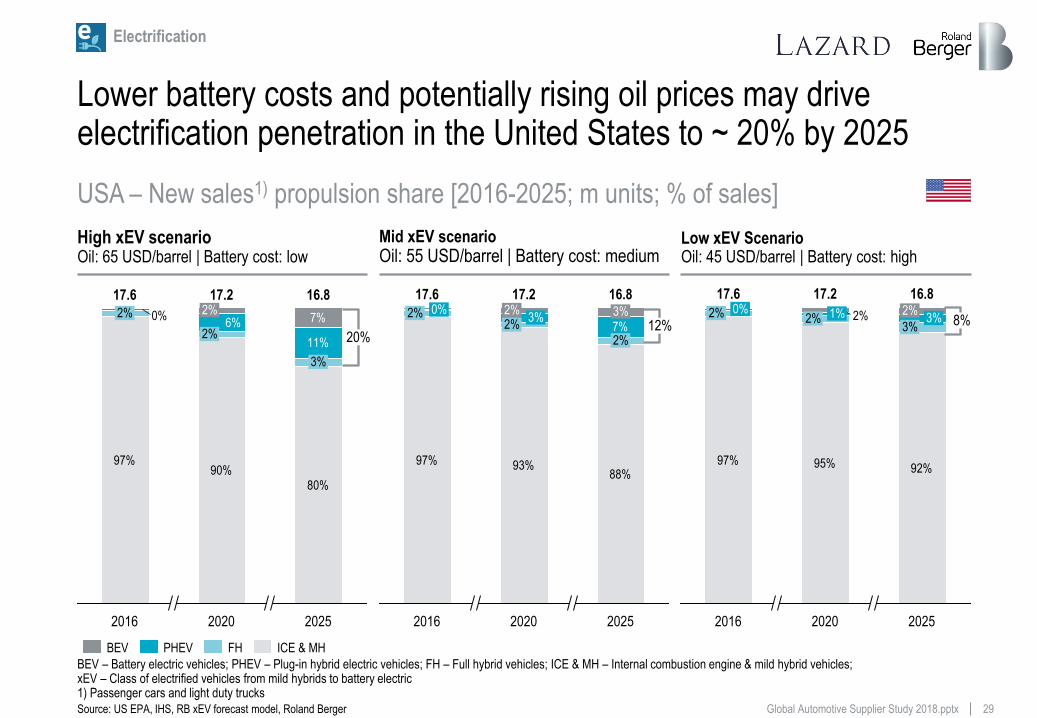
97%90%
80%
11%
6%0% 7%
2025
16.8
3%
2020
17.2
2%
2%
2016
17.6
2%
Lower battery costs and potentially rising oil prices may drive electrification penetration in the United States to ~ 20% by 2025
High xEV scenario Oil: 65 USD/barrel | Battery cost: low
Low xEV Scenario Oil: 45 USD/barrel | Battery cost: high
Mid xEV scenario Oil: 55 USD/barrel | Battery cost: medium
97% 93%88%
7%
2025
16.8
2%
3%
2020
17.2
2% 3%
2%
2016
17.6
2% 0%
97% 95% 92%
2%
2025
16.8
3% 3%
2%
2020
17.2
2% 1%
2016
17.6
2% 0%
ICE & MH FH PHEV BEV
20% 8% 12%
USA – New sales1) propulsion share [2016-2025; m units; % of sales]
BEV – Battery electric vehicles; PHEV – Plug-in hybrid electric vehicles; FH – Full hybrid vehicles; ICE & MH – Internal combustion engine & mild hybrid vehicles; xEV – Class of electrified vehicles from mild hybrids to battery electric 1) Passenger cars and light duty trucks
Source: US EPA, IHS, RB xEV forecast model, Roland Berger
Electrification
30 Global Automotive Supplier Study 2018.pptx
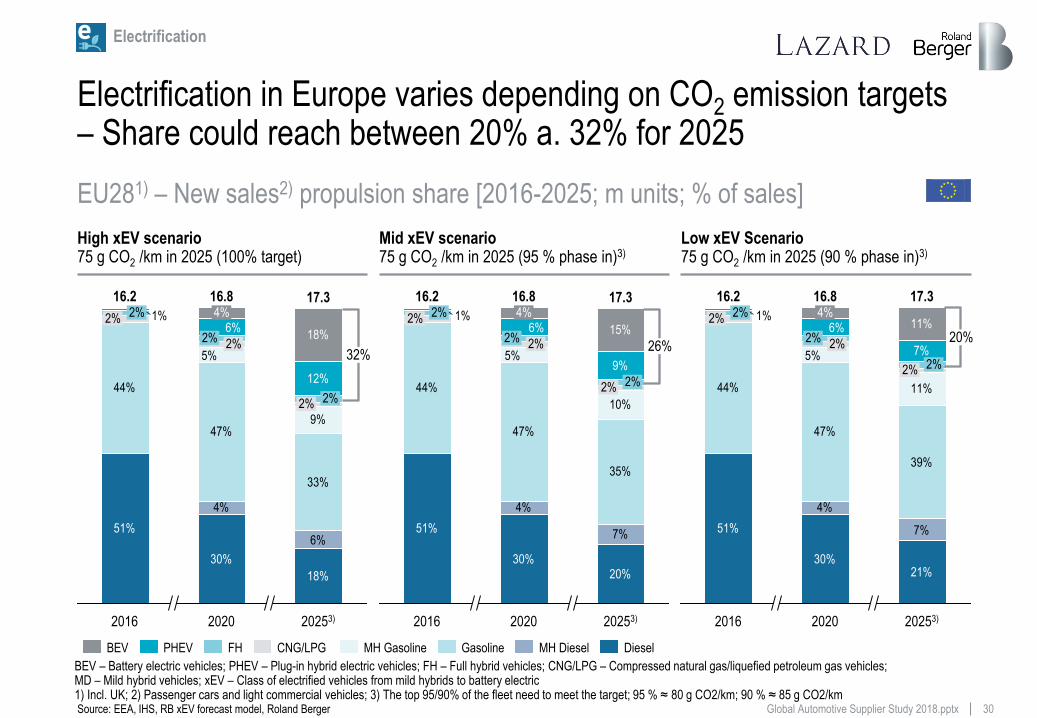
Electrification in Europe varies depending on CO2 emission targets – Share could reach between 20% a. 32% for 2025
High xEV scenario 75 g CO2 /km in 2025 (100% target)
Low xEV Scenario 75 g CO2 /km in 2025 (90 % phase in)3)
Mid xEV scenario 75 g CO2 /km in 2025 (95 % phase in)3)
51%
30%
18%
4%
6%
44%
47%
33%
9%
12%
5%
6%1%
18%
20253)
17.3
2% 2%
2020
16.8
2% 2%
4%
2016
16.2
2% 2%
51%
30%20%
4%
7%
44%
47%
35%
10%
9%5%
6%1%
15%
20253)
17.3
2% 2%
2%
2020
16.8
2% 2%
4%
2016
16.2
2%
51%
30%21%
4%
7%
44%
47%
39%
11%
7%5%
6%1%
11%
20253)
17.3
2020
16.8
2% 2%
2% 2% 4%
2016
16.2
2% 2%
PHEV BEV Diesel MH Diesel Gasoline MH Gasoline CNG/LPG FH
32%
20% 26%
EU281) – New sales2) propulsion share [2016-2025; m units; % of sales]
BEV – Battery electric vehicles; PHEV – Plug-in hybrid electric vehicles; FH – Full hybrid vehicles; CNG/LPG – Compressed natural gas/liquefied petroleum gas vehicles; MD – Mild hybrid vehicles; xEV – Class of electrified vehicles from mild hybrids to battery electric 1) Incl. UK; 2) Passenger cars and light commercial vehicles; 3) The top 95/90% of the fleet need to meet the target; 95 % ≈ 80 g CO2/km; 90 % ≈ 85 g CO2/km Source: EEA, IHS, RB xEV forecast model, Roland Berger
Electrification
31 Global Automotive Supplier Study 2018.pptx
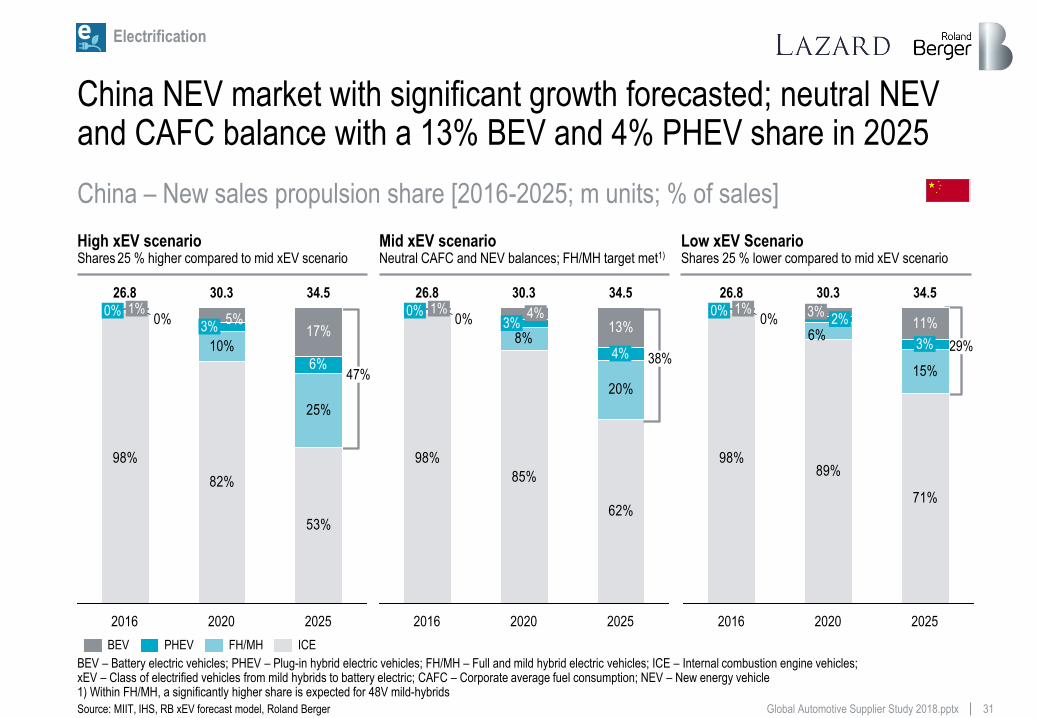
China NEV market with significant growth forecasted; neutral NEV and CAFC balance with a 13% BEV and 4% PHEV share in 2025
High xEV scenario Shares 25 % higher compared to mid xEV scenario
Low xEV Scenario Shares 25 % lower compared to mid xEV scenario
Mid xEV scenario Neutral CAFC and NEV balances; FH/MH target met1)
98%
85%
62%
8%
20%
0%13%
4%
4%
2025
0% 3%
30.3 34.5
2020
1%
2016
26.8
47%
29% 38%
98%
82%
53%
10%
25%
17%0%
6%
5%0%
34.5 30.3
2016
1% 26.8
2020
3%
2025
98%89%
71%
15%
6%0% 11%
1% 2%
2020 2025
3%
30.3
2016
26.8
3%
34.5
0%
ICE BEV FH/MH PHEV
China – New sales propulsion share [2016-2025; m units; % of sales]
BEV – Battery electric vehicles; PHEV – Plug-in hybrid electric vehicles; FH/MH – Full and mild hybrid electric vehicles; ICE – Internal combustion engine vehicles; xEV – Class of electrified vehicles from mild hybrids to battery electric; CAFC – Corporate average fuel consumption; NEV – New energy vehicle 1) Within FH/MH, a significantly higher share is expected for 48V mild-hybrids
Source: MIIT, IHS, RB xEV forecast model, Roland Berger
Electrification
32 Global Automotive Supplier Study 2018.pptx
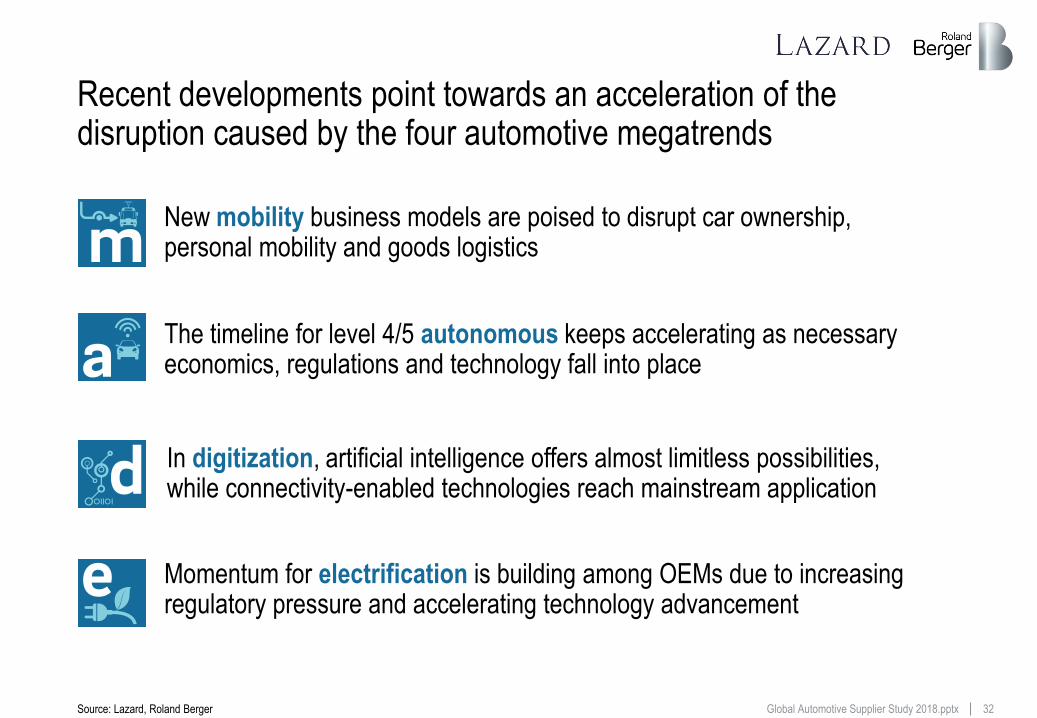
Recent developments point towards an acceleration of the disruption caused by the four automotive megatrends
The timeline for level 4/5 autonomous keeps accelerating as necessary economics, regulations and technology fall into place
Momentum for electrification is building among OEMs due to increasing regulatory pressure and accelerating technology advancement
In digitization, artificial intelligence offers almost limitless possibilities, while connectivity-enabled technologies reach mainstream application
Source: Lazard, Roland Berger
New mobility business models are poised to disrupt car ownership, personal mobility and goods logistics
33 Global Automotive Supplier Study 2018.pptx
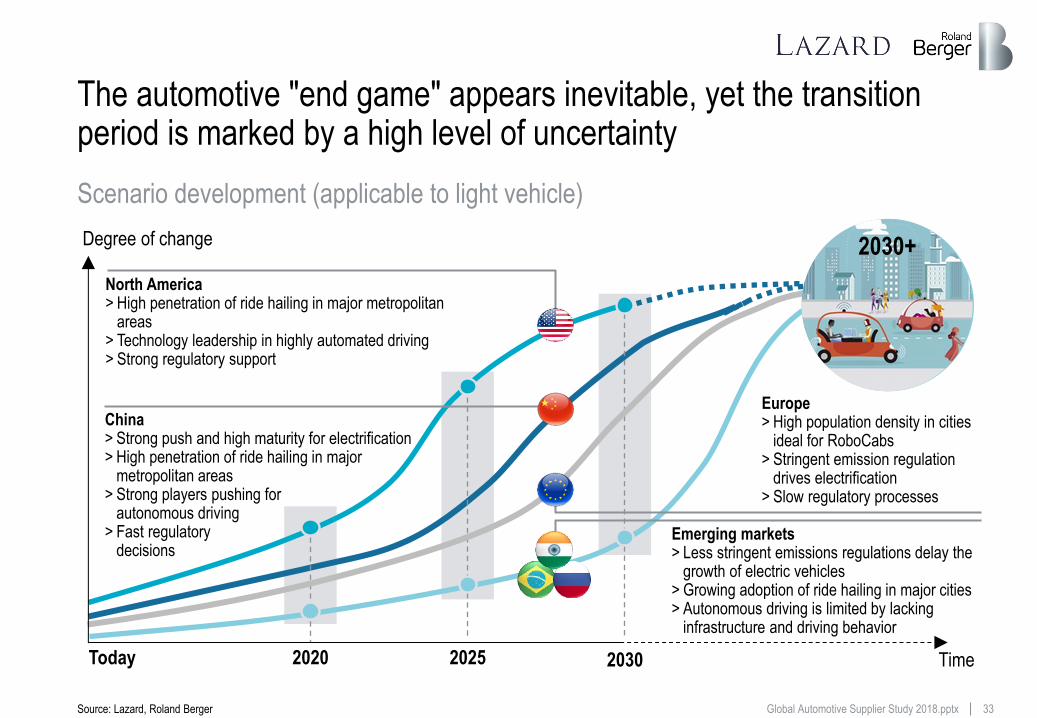
The automotive "end game" appears inevitable, yet the transition period is marked by a high level of uncertainty
Time Today
Degree of change
2020 2025 2030
North America > High penetration of ride hailing in major metropolitan
areas > Technology leadership in highly automated driving > Strong regulatory support
China > Strong push and high maturity for electrification > High penetration of ride hailing in major
metropolitan areas > Strong players pushing for
autonomous driving > Fast regulatory
decisions
Europe > High population density in cities
ideal for RoboCabs > Stringent emission regulation
drives electrification > Slow regulatory processes
Emerging markets > Less stringent emissions regulations delay the
growth of electric vehicles > Growing adoption of ride hailing in major cities > Autonomous driving is limited by lacking
infrastructure and driving behavior
Scenario development (applicable to light vehicle)
Source: Lazard, Roland Berger
2030+
34 Global Automotive Supplier Study 2018.pptx
Automotive End game zone
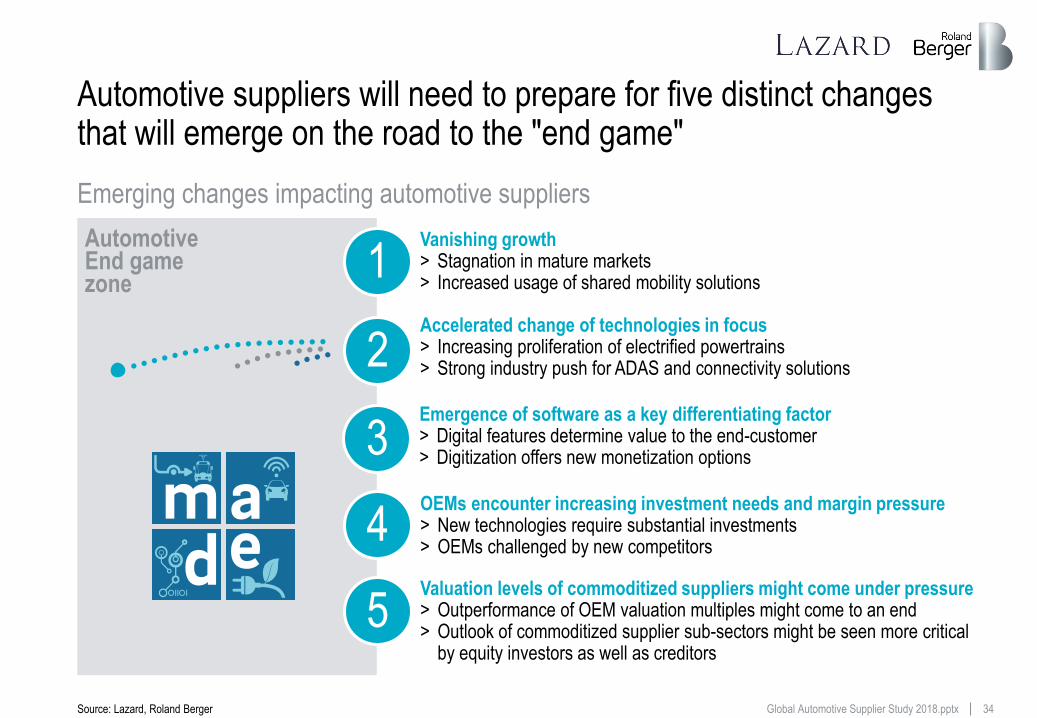
Automotive suppliers will need to prepare for five distinct changes that will emerge on the road to the "end game"
Emergence of software as a key differentiating factor > Digital features determine value to the end-customer > Digitization offers new monetization options 3
Vanishing growth > Stagnation in mature markets > Increased usage of shared mobility solutions
1 Accelerated change of technologies in focus > Increasing proliferation of electrified powertrains > Strong industry push for ADAS and connectivity solutions 2
OEMs encounter increasing investment needs and margin pressure > New technologies require substantial investments > OEMs challenged by new competitors
4 Valuation levels of commoditized suppliers might come under pressure > Outperformance of OEM valuation multiples might come to an end > Outlook of commoditized supplier sub-sectors might be seen more critical
by equity investors as well as creditors
5
Emerging changes impacting automotive suppliers
Source: Lazard, Roland Berger
35 Global Automotive Supplier Study 2018.pptx
Contents
This document shall be treated as confidential. It has been compiled for the exclusive, internal use by our client and is not complete without the underlying detail analyses and the oral presentation.
It may not be passed on and/or may not be made available to third parties without prior written consent from and .
© Roland Berger/Lazard
The status
Record volumes and profits, but key markets are at a tipping point
A The consequence
Automotive suppliers need to transform their business models
D
Roland Berger and Lazard Automotive teams
The Contacts
E The challenge
Suppliers' traditional business will be questioned on multiple levels
C The future
Upcoming automotive disruption will fundamentally change the industry
B
36 Global Automotive Supplier Study 2018.pptx
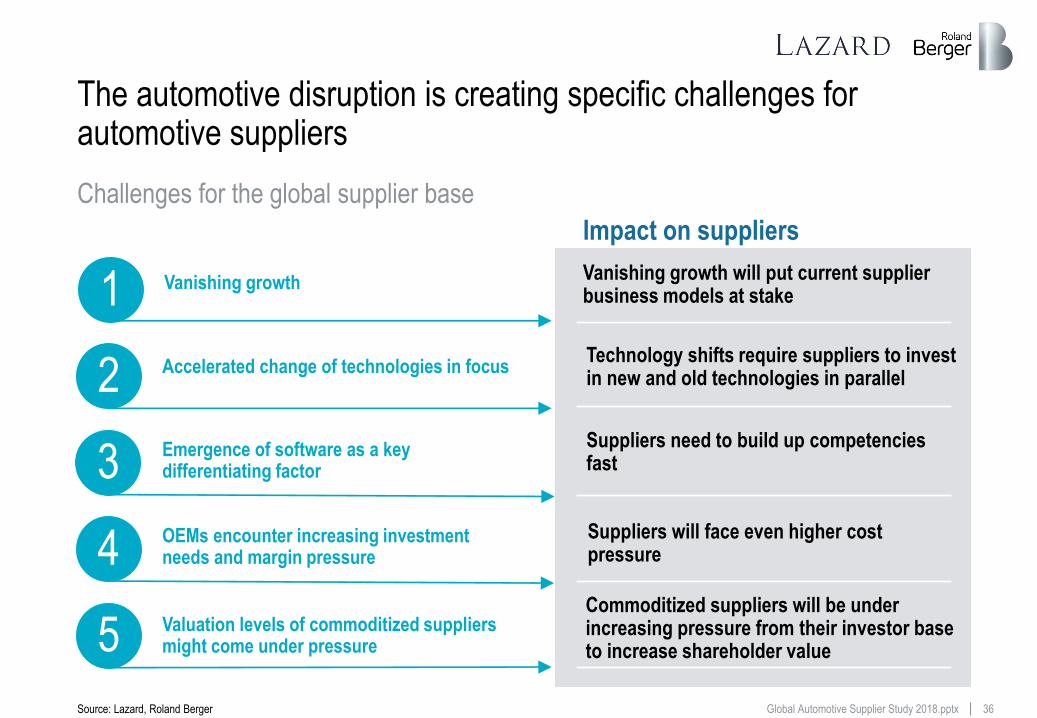
The automotive disruption is creating specific challenges for automotive suppliers
Vanishing growth will put current supplier business models at stake
Technology shifts require suppliers to invest in new and old technologies in parallel
Suppliers need to build up competencies fast
Suppliers will face even higher cost pressure
Impact on suppliers
Commoditized suppliers will be under increasing pressure from their investor base to increase shareholder value
Vanishing growth 1
Accelerated change of technologies in focus 2
Emergence of software as a key differentiating factor 3
OEMs encounter increasing investment needs and margin pressure 4
Valuation levels of commoditized suppliers might come under pressure 5
Challenges for the global supplier base
Source: Lazard, Roland Berger
Vanishing growth will put
current supplier business
models at stake
1
38 Global Automotive Supplier Study 2018.pptx
2025 2020 2010 2030/2035 2015
101.9 94.9
74.4
88.8
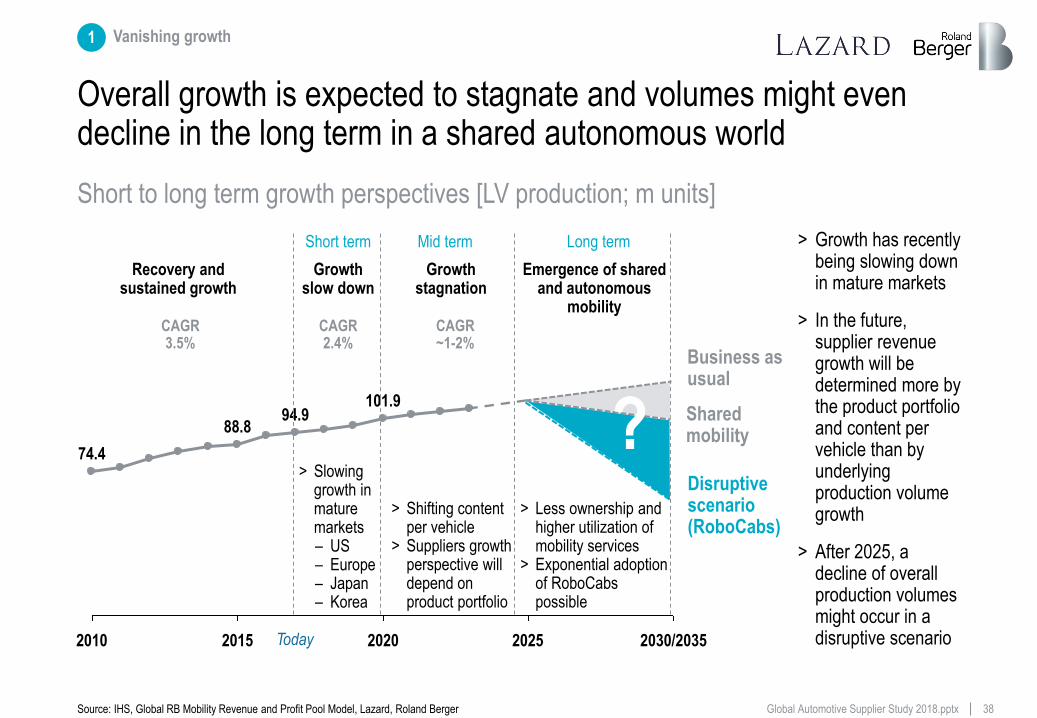
Overall growth is expected to stagnate and volumes might even decline in the long term in a shared autonomous world
1 Vanishing growth
> Growth has recently being slowing down in mature markets
> In the future, supplier revenue growth will be determined more by the product portfolio and content per vehicle than by underlying production volume growth
> After 2025, a decline of overall production volumes might occur in a disruptive scenario
Business as usual
Disruptive scenario (RoboCabs)
Recovery and sustained growth
Growth slow down
Growth stagnation
Emergence of shared and autonomous
mobility
Short term Mid term Long term
> Slowing growth in mature markets – US – Europe – Japan – Korea
> Shifting content per vehicle
> Suppliers growth perspective will depend on product portfolio
> Less ownership and higher utilization of mobility services
> Exponential adoption of RoboCabs possible
Today
CAGR 3.5%
CAGR 2.4%
CAGR ~1-2%
Shared mobility ?
Short to long term growth perspectives [LV production; m units]
Source: IHS, Global RB Mobility Revenue and Profit Pool Model, Lazard, Roland Berger
39 Global Automotive Supplier Study 2018.pptx
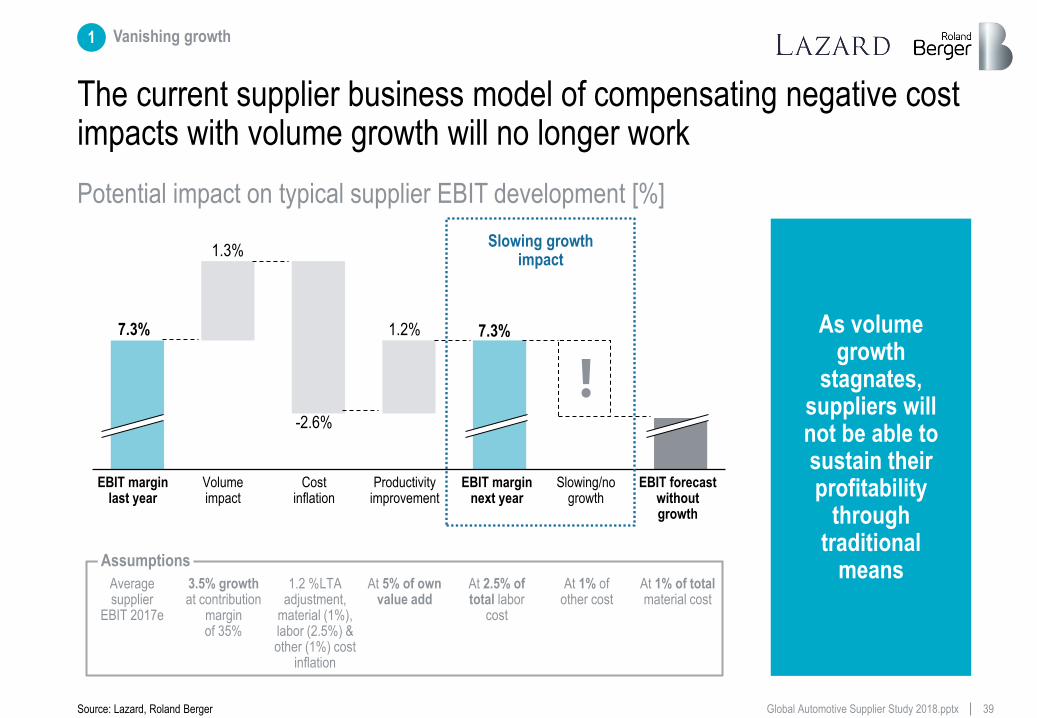
1.3%
The current supplier business model of compensating negative cost impacts with volume growth will no longer work
EBIT forecast without growth
Productivity improvement
7.3%
-2.6%
Volume impact
1.2%
EBIT margin last year
Slowing/no growth
7.3%
EBIT margin next year
Cost inflation
Average supplier
EBIT 2017e
3.5% growth at contribution
margin of 35%
1.2 %LTA adjustment,
material (1%), labor (2.5%) & other (1%) cost
inflation
At 1% of total material cost
At 2.5% of total labor
cost
At 1% of other cost
At 5% of own value add
Assumptions
As volume growth
stagnates, suppliers will not be able to sustain their profitability
through traditional
means
Slowing growth impact
Potential impact on typical supplier EBIT development [%]
Source: Lazard, Roland Berger
1 Vanishing growth
40 Global Automotive Supplier Study 2018.pptx
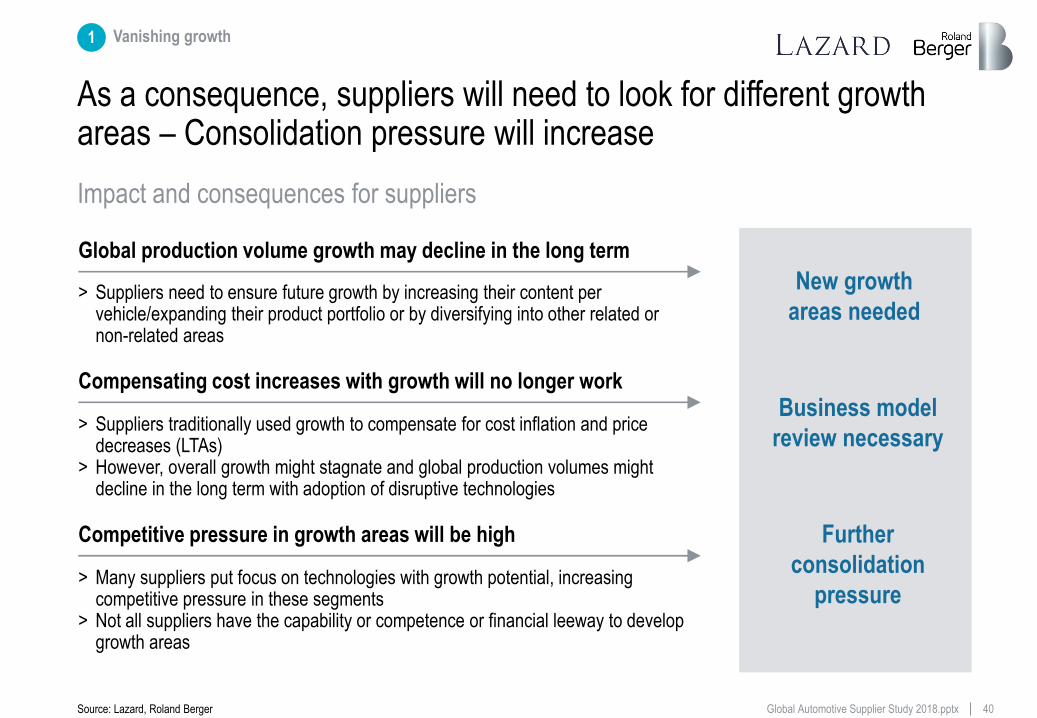
As a consequence, suppliers will need to look for different growth areas – Consolidation pressure will increase
Further
consolidation
pressure
New growth
areas needed
Global production volume growth may decline in the long term
> Suppliers need to ensure future growth by increasing their content per vehicle/expanding their product portfolio or by diversifying into other related or non-related areas
Compensating cost increases with growth will no longer work
> Suppliers traditionally used growth to compensate for cost inflation and price decreases (LTAs)
> However, overall growth might stagnate and global production volumes might decline in the long term with adoption of disruptive technologies
Business model
review necessary
Competitive pressure in growth areas will be high
> Many suppliers put focus on technologies with growth potential, increasing competitive pressure in these segments
> Not all suppliers have the capability or competence or financial leeway to develop growth areas
Impact and consequences for suppliers
Source: Lazard, Roland Berger
1 Vanishing growth
Technology shifts
require suppliers to
invest in new and old
technologies in parallel
2
42 Global Automotive Supplier Study 2018.pptx
2 Technology shifts
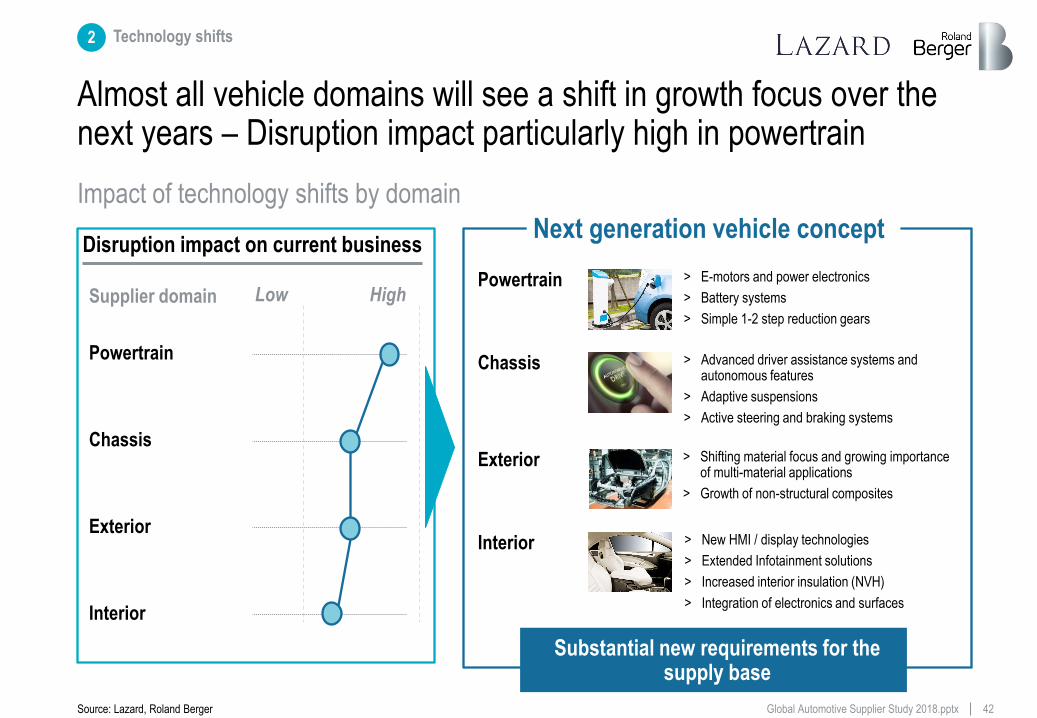
Almost all vehicle domains will see a shift in growth focus over the next years – Disruption impact particularly high in powertrain
Impact of technology shifts by domain
Source: Lazard, Roland Berger
Disruption impact on current business
Supplier domain Low High
Interior
Exterior
Chassis
Powertrain
Powertrain > E-motors and power electronics
> Battery systems
> Simple 1-2 step reduction gears
Interior > New HMI / display technologies
> Extended Infotainment solutions
> Increased interior insulation (NVH)
> Integration of electronics and surfaces
Next generation vehicle concept
Substantial new requirements for the supply base
Chassis > Advanced driver assistance systems and autonomous features
> Adaptive suspensions
> Active steering and braking systems
> Shifting material focus and growing importance of multi-material applications
> Growth of non-structural composites
Exterior
43 Global Automotive Supplier Study 2018.pptx
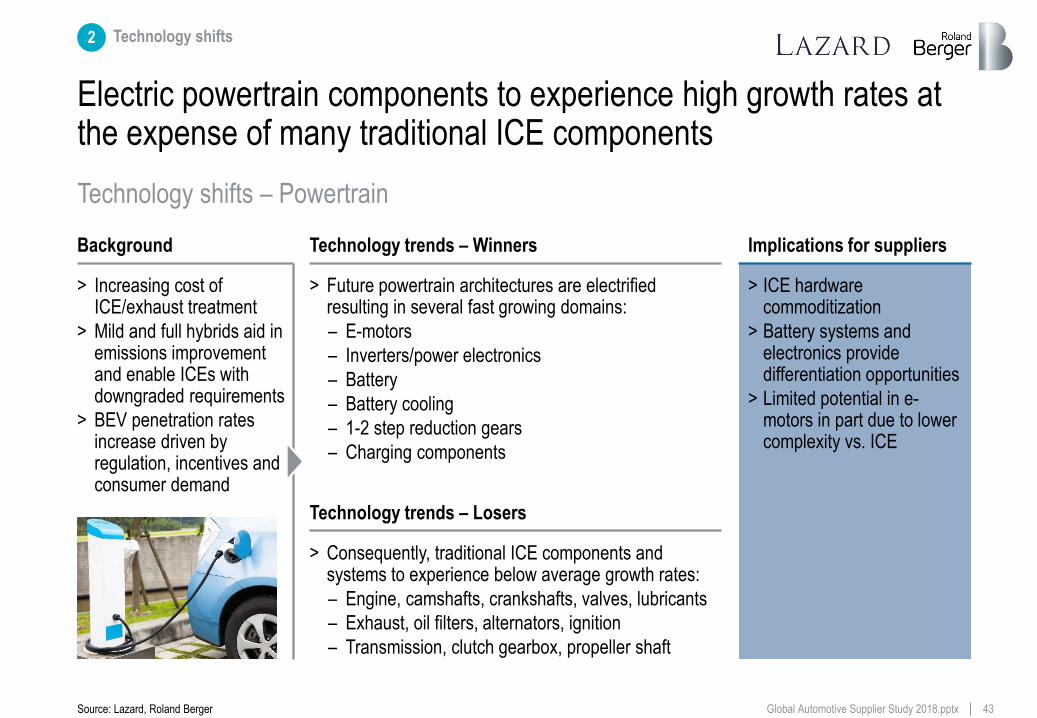
Electric powertrain components to experience high growth rates at the expense of many traditional ICE components
Implications for suppliers
> ICE hardware commoditization
> Battery systems and electronics provide differentiation opportunities
> Limited potential in e-motors in part due to lower complexity vs. ICE
Background
> Increasing cost of ICE/exhaust treatment
> Mild and full hybrids aid in emissions improvement and enable ICEs with downgraded requirements
> BEV penetration rates increase driven by regulation, incentives and consumer demand
Technology trends – Winners
> Future powertrain architectures are electrified resulting in several fast growing domains:
– E-motors
– Inverters/power electronics
– Battery
– Battery cooling
– 1-2 step reduction gears
– Charging components
Technology trends – Losers
> Consequently, traditional ICE components and systems to experience below average growth rates:
– Engine, camshafts, crankshafts, valves, lubricants
– Exhaust, oil filters, alternators, ignition
– Transmission, clutch gearbox, propeller shaft
Technology shifts – Powertrain
Source: Lazard, Roland Berger
2 Technology shifts
44 Global Automotive Supplier Study 2018.pptx
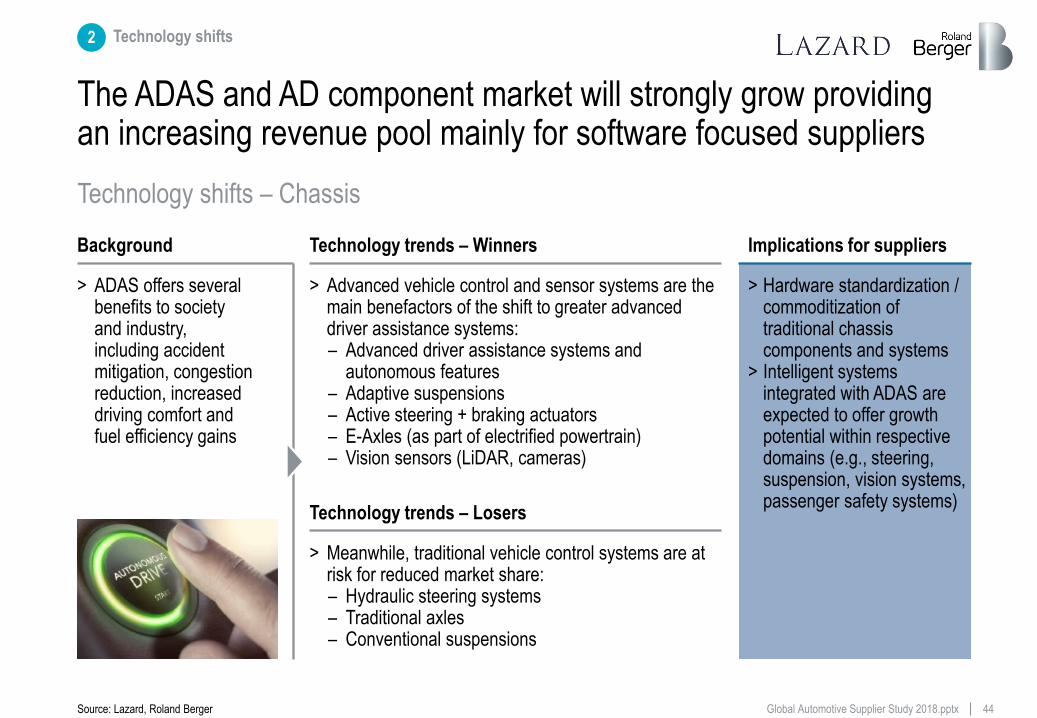
The ADAS and AD component market will strongly grow providing an increasing revenue pool mainly for software focused suppliers
Implications for suppliers
> Hardware standardization / commoditization of traditional chassis components and systems
> Intelligent systems integrated with ADAS are expected to offer growth potential within respective domains (e.g., steering, suspension, vision systems, passenger safety systems)
Background
> ADAS offers several benefits to society and industry, including accident mitigation, congestion reduction, increased driving comfort and fuel efficiency gains
> Advanced vehicle control and sensor systems are the main benefactors of the shift to greater advanced driver assistance systems: – Advanced driver assistance systems and
autonomous features – Adaptive suspensions – Active steering + braking actuators – E-Axles (as part of electrified powertrain) – Vision sensors (LiDAR, cameras)
Technology trends – Winners
Technology trends – Losers
> Meanwhile, traditional vehicle control systems are at risk for reduced market share: – Hydraulic steering systems – Traditional axles – Conventional suspensions
Technology shifts – Chassis
Source: Lazard, Roland Berger
2 Technology shifts
45 Global Automotive Supplier Study 2018.pptx
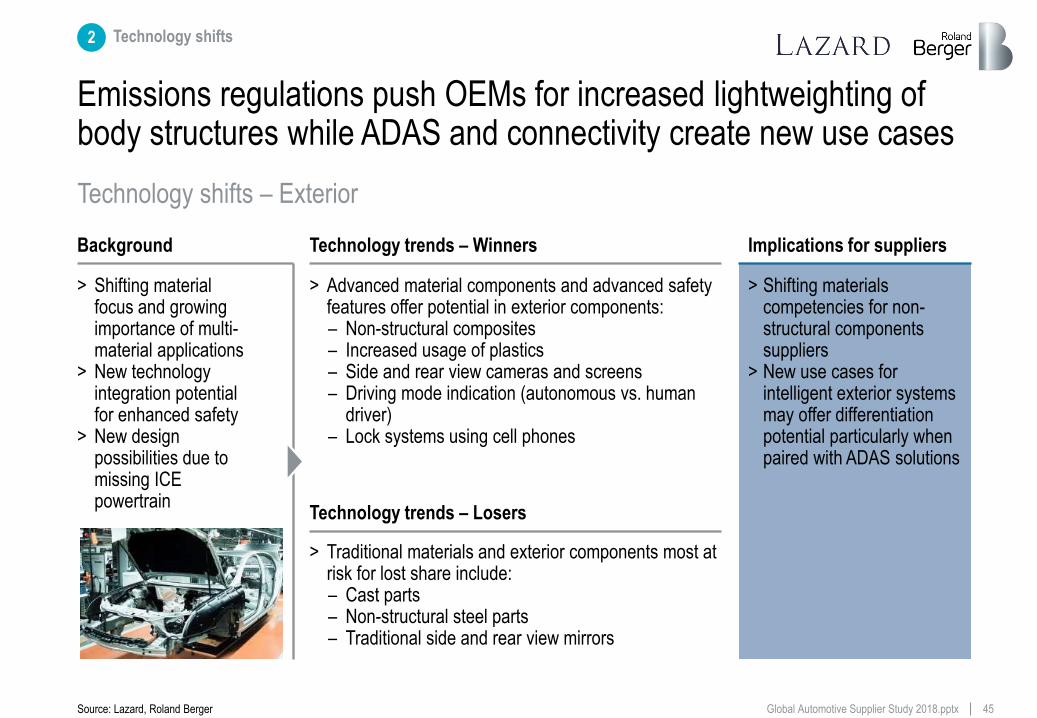
Emissions regulations push OEMs for increased lightweighting of body structures while ADAS and connectivity create new use cases
Implications for suppliers
> Shifting materials competencies for non-structural components suppliers
> New use cases for intelligent exterior systems may offer differentiation potential particularly when paired with ADAS solutions
Background
> Shifting material focus and growing importance of multi-material applications
> New technology integration potential for enhanced safety
> New design possibilities due to missing ICE powertrain
> Advanced material components and advanced safety features offer potential in exterior components: – Non-structural composites – Increased usage of plastics – Side and rear view cameras and screens – Driving mode indication (autonomous vs. human
driver) – Lock systems using cell phones
Technology trends – Winners
Technology trends – Losers
> Traditional materials and exterior components most at risk for lost share include: – Cast parts – Non-structural steel parts – Traditional side and rear view mirrors
Technology shifts – Exterior
Source: Lazard, Roland Berger
2 Technology shifts
46 Global Automotive Supplier Study 2018.pptx
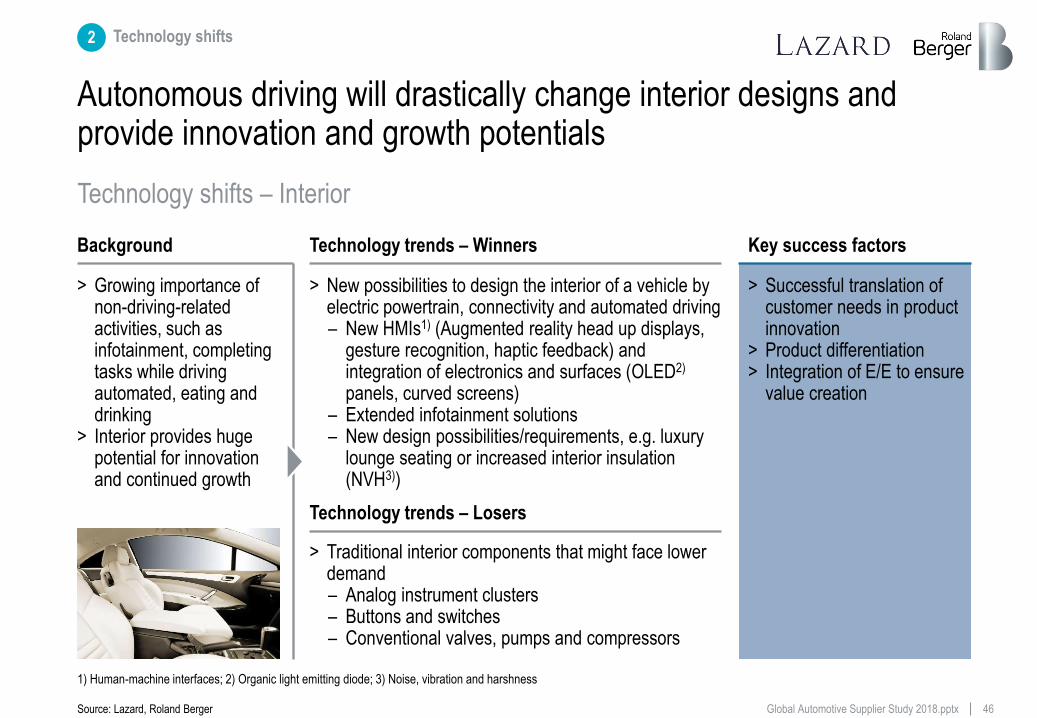
Autonomous driving will drastically change interior designs and provide innovation and growth potentials
Background
> Growing importance of non-driving-related activities, such as infotainment, completing tasks while driving automated, eating and drinking
> Interior provides huge potential for innovation and continued growth
Technology trends – Winners
> New possibilities to design the interior of a vehicle by electric powertrain, connectivity and automated driving – New HMIs1) (Augmented reality head up displays,
gesture recognition, haptic feedback) and integration of electronics and surfaces (OLED2) panels, curved screens)
– Extended infotainment solutions – New design possibilities/requirements, e.g. luxury
lounge seating or increased interior insulation (NVH3))
Key success factors
> Successful translation of customer needs in product innovation
> Product differentiation > Integration of E/E to ensure
value creation
Technology trends – Losers
> Traditional interior components that might face lower demand – Analog instrument clusters – Buttons and switches – Conventional valves, pumps and compressors
Technology shifts – Interior
1) Human-machine interfaces; 2) Organic light emitting diode; 3) Noise, vibration and harshness
Source: Lazard, Roland Berger
2 Technology shifts
47 Global Automotive Supplier Study 2018.pptx
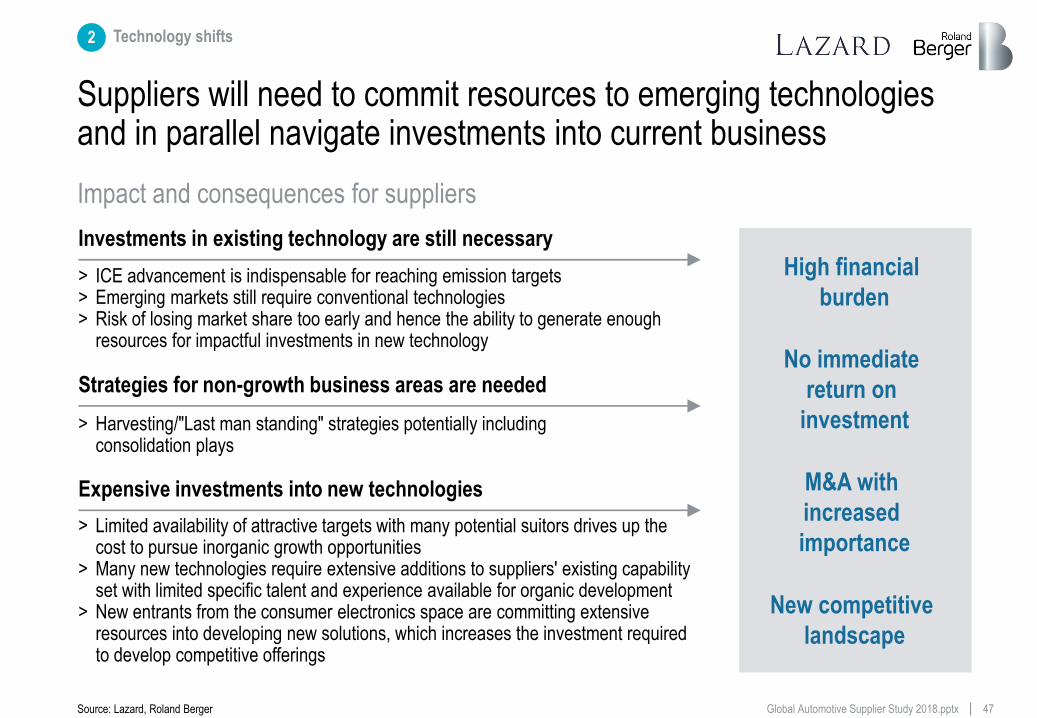
Suppliers will need to commit resources to emerging technologies and in parallel navigate investments into current business
Investments in existing technology are still necessary
> ICE advancement is indispensable for reaching emission targets > Emerging markets still require conventional technologies > Risk of losing market share too early and hence the ability to generate enough
resources for impactful investments in new technology
Expensive investments into new technologies
> Limited availability of attractive targets with many potential suitors drives up the cost to pursue inorganic growth opportunities
> Many new technologies require extensive additions to suppliers' existing capability set with limited specific talent and experience available for organic development
> New entrants from the consumer electronics space are committing extensive resources into developing new solutions, which increases the investment required to develop competitive offerings
Strategies for non-growth business areas are needed
> Harvesting/"Last man standing" strategies potentially including consolidation plays
High financial
burden
No immediate
return on
investment
M&A with
increased
importance
New competitive
landscape
Impact and consequences for suppliers
Source: Lazard, Roland Berger
2 Technology shifts
Suppliers need to build up
competencies fast
3
49 Global Automotive Supplier Study 2018.pptx
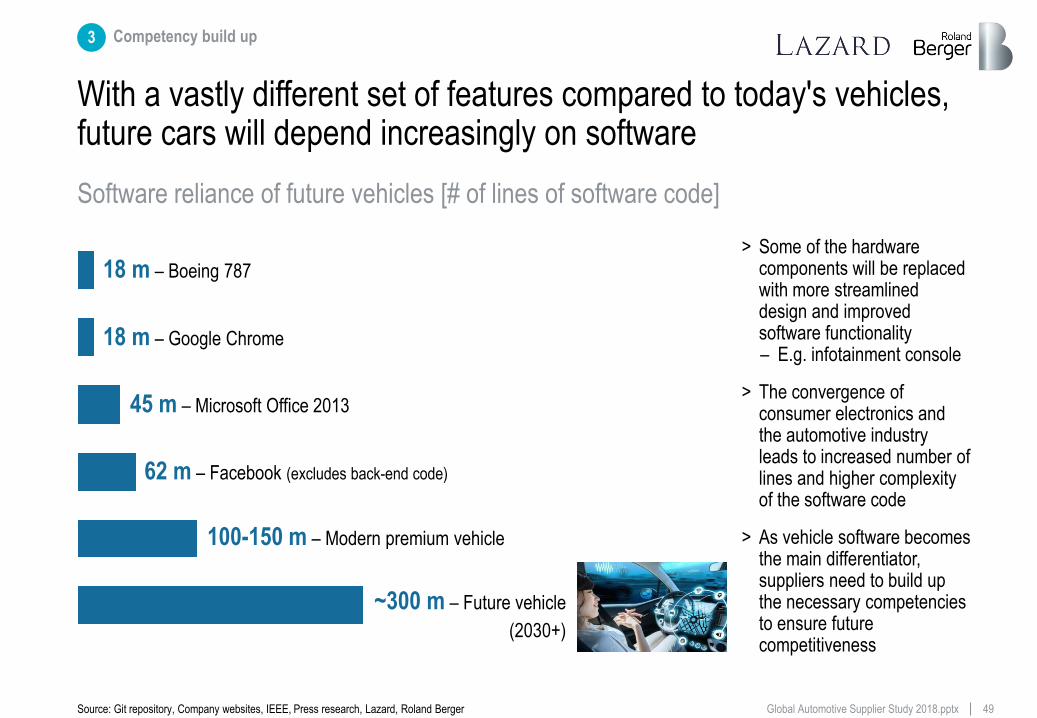
With a vastly different set of features compared to today's vehicles, future cars will depend increasingly on software
3 Competency build up
> Some of the hardware components will be replaced with more streamlined design and improved software functionality – E.g. infotainment console
> The convergence of consumer electronics and the automotive industry leads to increased number of lines and higher complexity of the software code
> As vehicle software becomes the main differentiator, suppliers need to build up the necessary competencies to ensure future competitiveness
18 m – Boeing 787
18 m – Google Chrome
45 m – Microsoft Office 2013
62 m – Facebook (excludes back-end code)
100-150 m – Modern premium vehicle
~300 m – Future vehicle
(2030+)
Software reliance of future vehicles [# of lines of software code]
Source: Git repository, Company websites, IEEE, Press research, Lazard, Roland Berger
50 Global Automotive Supplier Study 2018.pptx
IVI hardware integrator
IVI software integrator
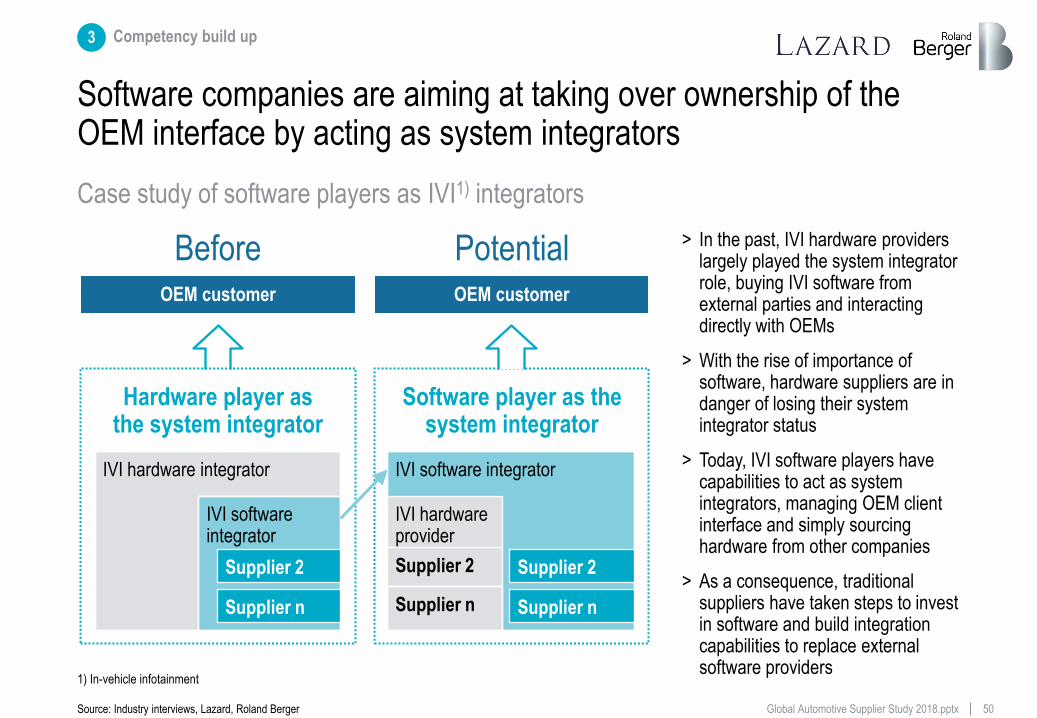
Software companies are aiming at taking over ownership of the OEM interface by acting as system integrators
Before Potential > In the past, IVI hardware providers largely played the system integrator role, buying IVI software from external parties and interacting directly with OEMs
> With the rise of importance of software, hardware suppliers are in danger of losing their system integrator status
> Today, IVI software players have capabilities to act as system integrators, managing OEM client interface and simply sourcing hardware from other companies
> As a consequence, traditional suppliers have taken steps to invest in software and build integration capabilities to replace external software providers
OEM customer OEM customer
Hardware player as the system integrator
Supplier 2
Supplier n
IVI software integrator
Supplier 2
Supplier n
Software player as the system integrator
Supplier 2
Supplier n
IVI hardware provider
Case study of software players as IVI1) integrators
1) In-vehicle infotainment
Source: Industry interviews, Lazard, Roland Berger
3 Competency build up
51 Global Automotive Supplier Study 2018.pptx
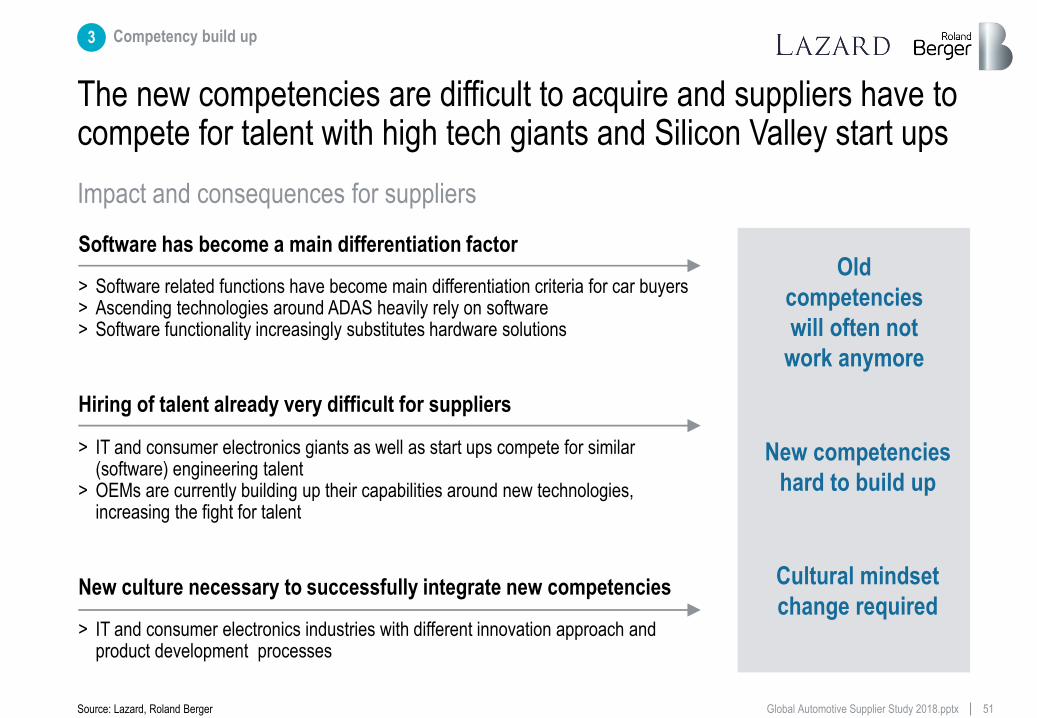
The new competencies are difficult to acquire and suppliers have to compete for talent with high tech giants and Silicon Valley start ups
Cultural mindset
change required
Old
competencies
will often not
work anymore
Software has become a main differentiation factor
> Software related functions have become main differentiation criteria for car buyers > Ascending technologies around ADAS heavily rely on software > Software functionality increasingly substitutes hardware solutions
Hiring of talent already very difficult for suppliers
> IT and consumer electronics giants as well as start ups compete for similar (software) engineering talent
> OEMs are currently building up their capabilities around new technologies, increasing the fight for talent
New competencies
hard to build up
> IT and consumer electronics industries with different innovation approach and product development processes
New culture necessary to successfully integrate new competencies
Impact and consequences for suppliers
Source: Lazard, Roland Berger
3 Competency build up
Suppliers will face even
higher cost pressure
4
53 Global Automotive Supplier Study 2018.pptx
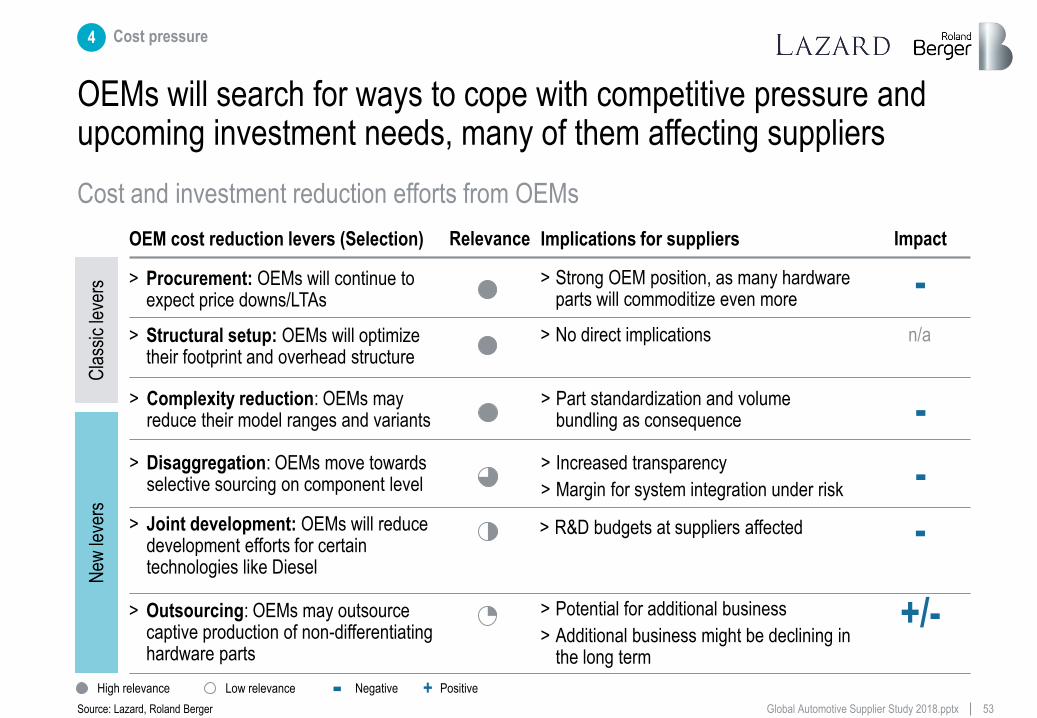
OEMs will search for ways to cope with competitive pressure and upcoming investment needs, many of them affecting suppliers
4 Cost pressure
OEM cost reduction levers (Selection)
> Disaggregation: OEMs move towards selective sourcing on component level
Implications for suppliers
> Increased transparency
> Margin for system integration under risk
Relevance Impact
-
+/- > Outsourcing: OEMs may outsource captive production of non-differentiating hardware parts
> Potential for additional business
> Additional business might be declining in the long term
- > Procurement: OEMs will continue to expect price downs/LTAs
> Strong OEM position, as many hardware parts will commoditize even more
> Joint development: OEMs will reduce development efforts for certain technologies like Diesel
> R&D budgets at suppliers affected -
> Structural setup: OEMs will optimize their footprint and overhead structure
> No direct implications
> Complexity reduction: OEMs may reduce their model ranges and variants
> Part standardization and volume bundling as consequence -
Cla
ssic
leve
rs
New
leve
rs
- + Negative Positive High relevance Low relevance
n/a
Cost and investment reduction efforts from OEMs
Source: Lazard, Roland Berger
54 Global Automotive Supplier Study 2018.pptx
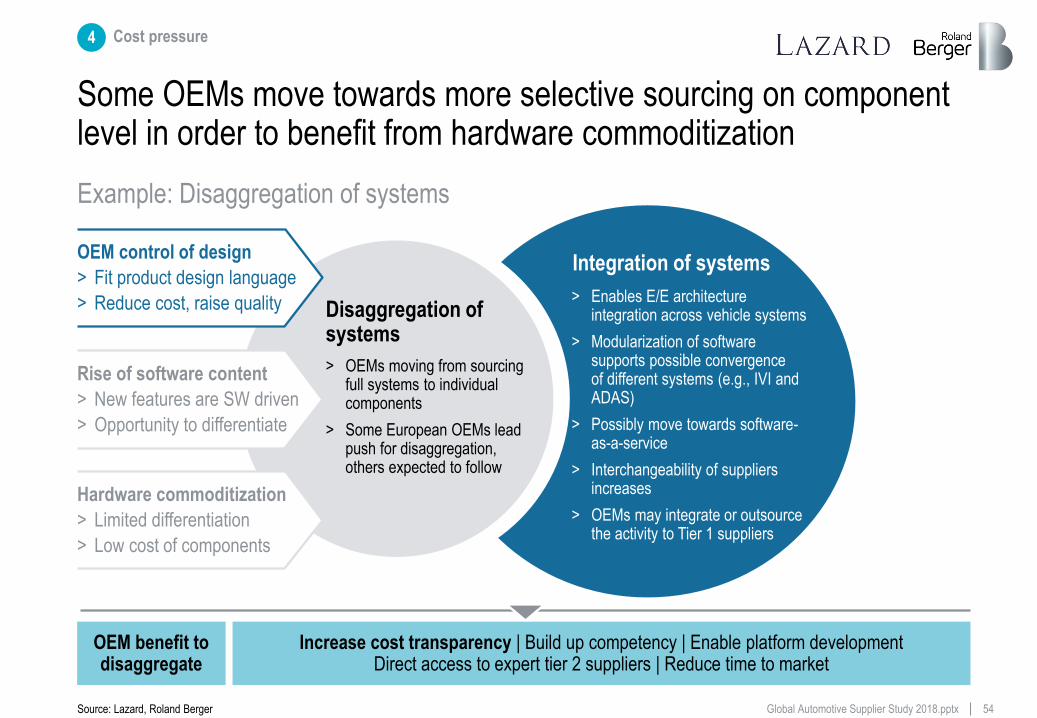
Some OEMs move towards more selective sourcing on component level in order to benefit from hardware commoditization
Hardware commoditization
> Limited differentiation
> Low cost of components
Disaggregation of systems
> OEMs moving from sourcing full systems to individual components
> Some European OEMs lead push for disaggregation, others expected to follow
Rise of software content
> New features are SW driven
> Opportunity to differentiate
OEM control of design
> Fit product design language
> Reduce cost, raise quality
Integration of systems
> Enables E/E architecture integration across vehicle systems
> Modularization of software supports possible convergence of different systems (e.g., IVI and ADAS)
> Possibly move towards software-as-a-service
> Interchangeability of suppliers increases
> OEMs may integrate or outsource the activity to Tier 1 suppliers
Increase cost transparency | Build up competency | Enable platform development Direct access to expert tier 2 suppliers | Reduce time to market
OEM benefit to disaggregate
Example: Disaggregation of systems
Source: Lazard, Roland Berger
4 Cost pressure
55 Global Automotive Supplier Study 2018.pptx
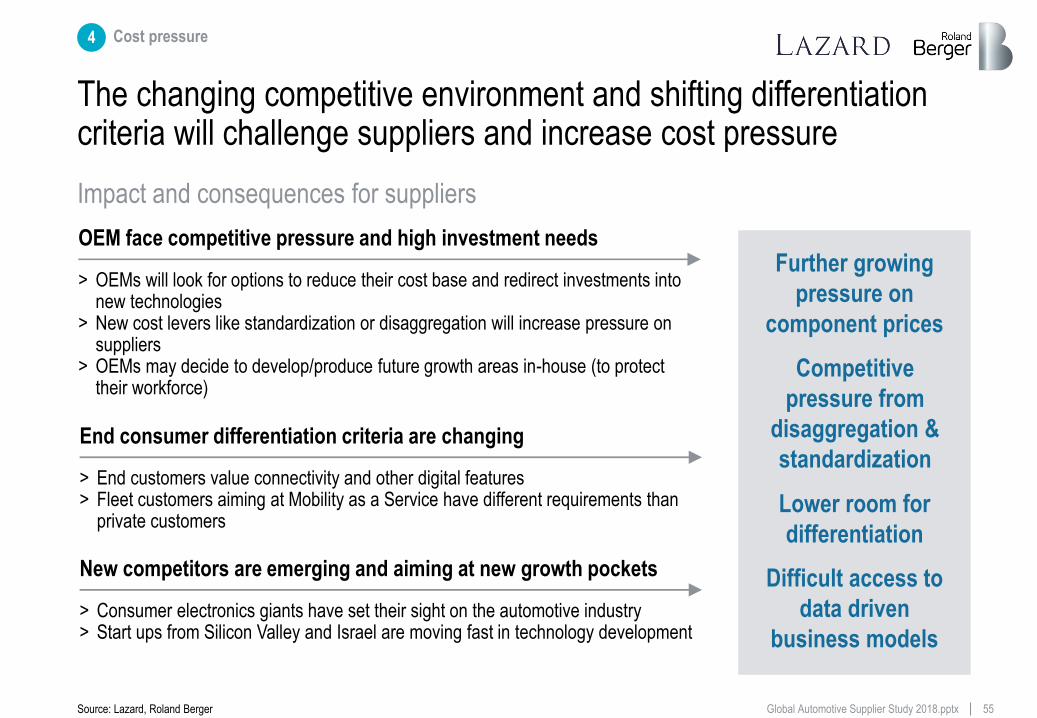
The changing competitive environment and shifting differentiation criteria will challenge suppliers and increase cost pressure
Further growing
pressure on
component prices
Competitive
pressure from
disaggregation &
standardization
OEM face competitive pressure and high investment needs
> OEMs will look for options to reduce their cost base and redirect investments into new technologies
> New cost levers like standardization or disaggregation will increase pressure on suppliers
> OEMs may decide to develop/produce future growth areas in-house (to protect their workforce)
Lower room for
differentiation
Difficult access to
data driven
business models
New competitors are emerging and aiming at new growth pockets
> Consumer electronics giants have set their sight on the automotive industry > Start ups from Silicon Valley and Israel are moving fast in technology development
End consumer differentiation criteria are changing
> End customers value connectivity and other digital features > Fleet customers aiming at Mobility as a Service have different requirements than
private customers
Impact and consequences for suppliers
Source: Lazard, Roland Berger
4 Cost pressure
Valuation levels of
commoditized suppliers
might come under pressure
5
57 Global Automotive Supplier Study 2018.pptx
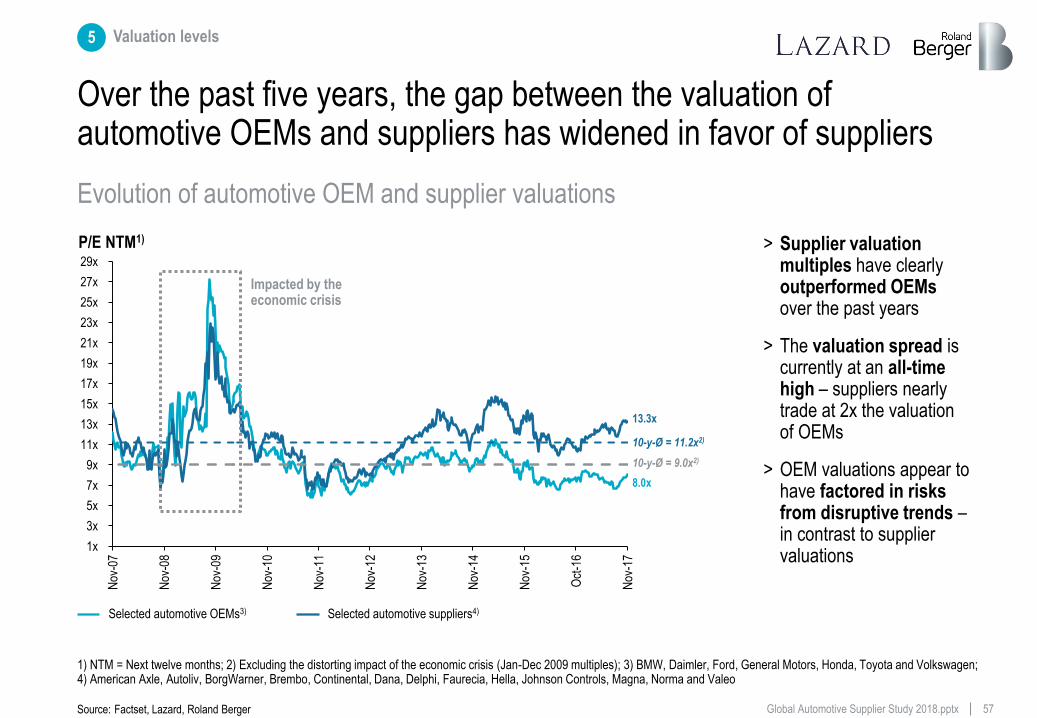
Over the past five years, the gap between the valuation of automotive OEMs and suppliers has widened in favor of suppliers
Source: Factset, Lazard, Roland Berger
P/E NTM1)
1x
3x
5x
7x
9x
11x
13x
15x
17x
19x
21x
23x
25x
27x
29x
Nov
-07
Nov
-08
Nov
-09
Nov
-10
Nov
-11
Nov
-12
Nov
-13
Nov
-14
Nov
-15
Oct
-16
Nov
-17
> Supplier valuation multiples have clearly outperformed OEMs over the past years
> The valuation spread is currently at an all-time high – suppliers nearly trade at 2x the valuation of OEMs
> OEM valuations appear to have factored in risks from disruptive trends – in contrast to supplier valuations
Selected automotive OEMs3) Selected automotive suppliers4)
Impacted by the economic crisis
10-y-Ø = 11.2x2)
8.0x
10-y-Ø = 9.0x2)
13.3x
5 Valuation levels
Evolution of automotive OEM and supplier valuations
1) NTM = Next twelve months; 2) Excluding the distorting impact of the economic crisis (Jan-Dec 2009 multiples); 3) BMW, Daimler, Ford, General Motors, Honda, Toyota and Volkswagen; 4) American Axle, Autoliv, BorgWarner, Brembo, Continental, Dana, Delphi, Faurecia, Hella, Johnson Controls, Magna, Norma and Valeo
58 Global Automotive Supplier Study 2018.pptx
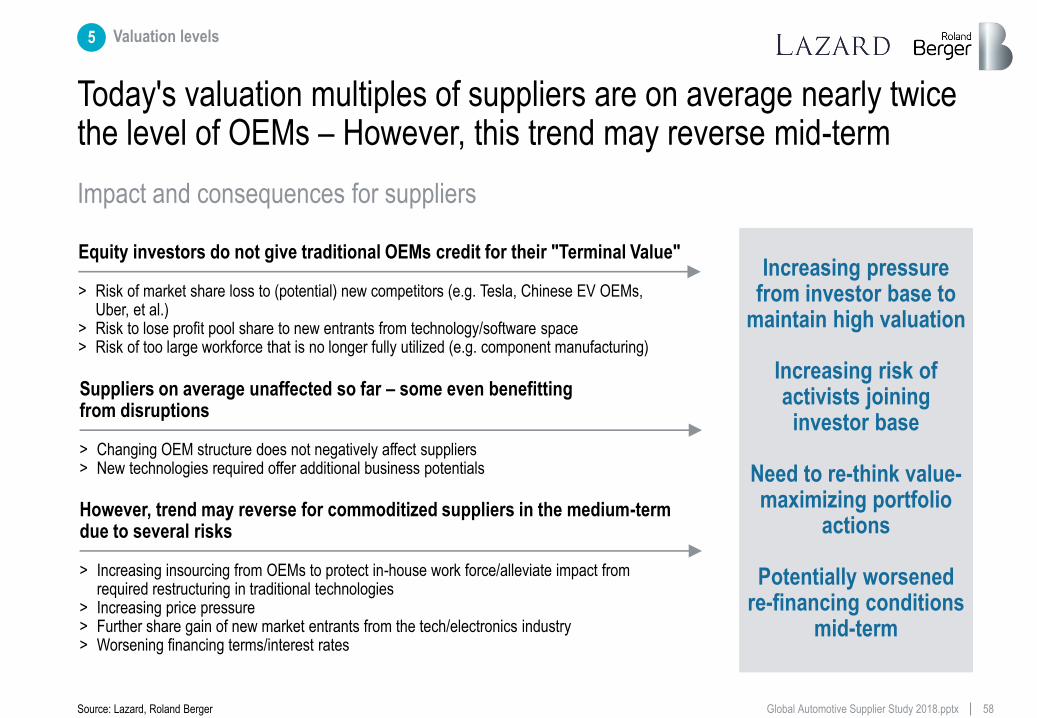
Today's valuation multiples of suppliers are on average nearly twice the level of OEMs – However, this trend may reverse mid-term
Equity investors do not give traditional OEMs credit for their "Terminal Value"
> Risk of market share loss to (potential) new competitors (e.g. Tesla, Chinese EV OEMs, Uber, et al.)
> Risk to lose profit pool share to new entrants from technology/software space > Risk of too large workforce that is no longer fully utilized (e.g. component manufacturing)
However, trend may reverse for commoditized suppliers in the medium-term due to several risks
> Increasing insourcing from OEMs to protect in-house work force/alleviate impact from required restructuring in traditional technologies
> Increasing price pressure > Further share gain of new market entrants from the tech/electronics industry > Worsening financing terms/interest rates
Suppliers on average unaffected so far – some even benefitting from disruptions
> Changing OEM structure does not negatively affect suppliers > New technologies required offer additional business potentials
Increasing pressure from investor base to
maintain high valuation
Increasing risk of activists joining investor base
Need to re-think value-maximizing portfolio
actions
Potentially worsened re-financing conditions
mid-term
Impact and consequences for suppliers
Source: Lazard, Roland Berger
5 Valuation levels
59 Global Automotive Supplier Study 2018.pptx
Contents
This document shall be treated as confidential. It has been compiled for the exclusive, internal use by our client and is not complete without the underlying detail analyses and the oral presentation.
It may not be passed on and/or may not be made available to third parties without prior written consent from and .
© Roland Berger/Lazard
The status
Record volumes and profits, but key markets are at a tipping point
A The consequence
Automotive suppliers need to transform their business models
D
Roland Berger and Lazard Automotive teams
The Contacts
E The challenge
Suppliers' traditional business will be questioned on multiple levels
C The future
Upcoming automotive disruption will fundamentally change the industry
B
60 Global Automotive Supplier Study 2018.pptx
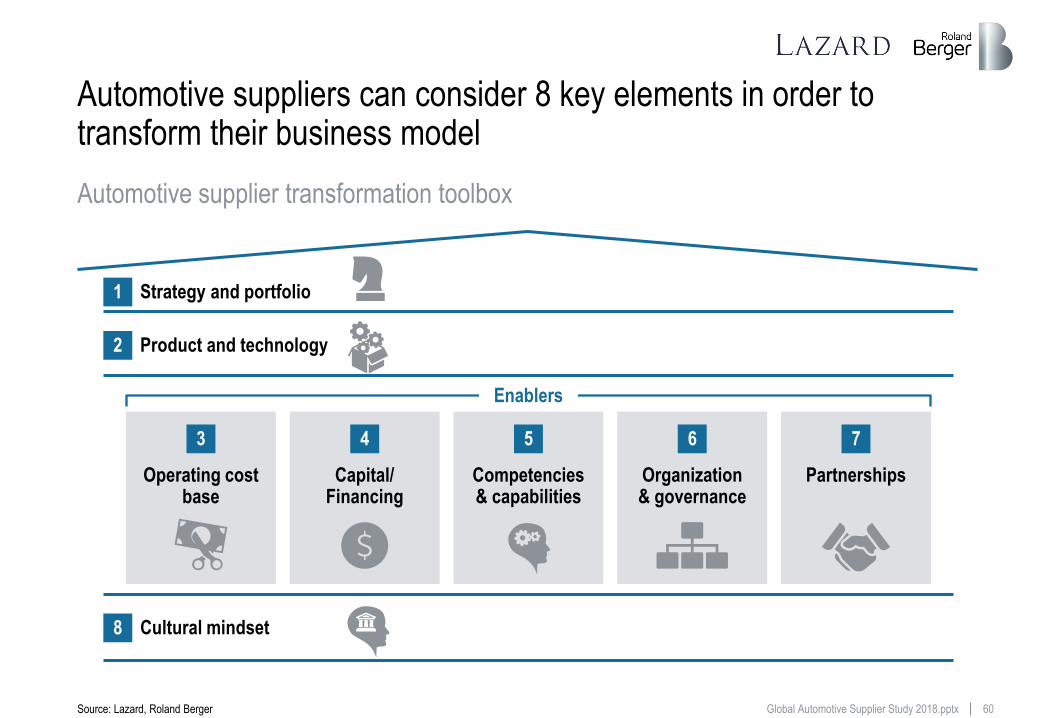
Automotive suppliers can consider 8 key elements in order to transform their business model
1 Strategy and portfolio
2 Product and technology
8 Cultural mindset
Operating cost base
Capital/ Financing
Competencies & capabilities
Organization & governance
Partnerships
3 4 5 6 7
Enablers
Automotive supplier transformation toolbox
Source: Lazard, Roland Berger
61 Global Automotive Supplier Study 2018.pptx
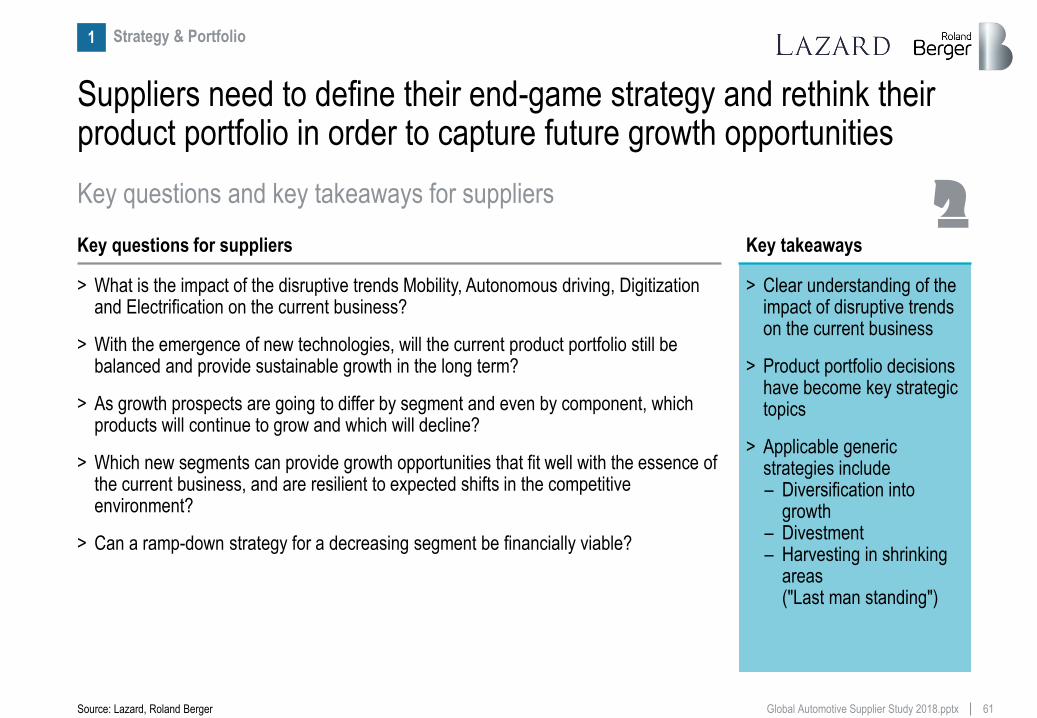
Suppliers need to define their end-game strategy and rethink their product portfolio in order to capture future growth opportunities
Strategy & Portfolio 1
Key questions for suppliers
> What is the impact of the disruptive trends Mobility, Autonomous driving, Digitization and Electrification on the current business?
> With the emergence of new technologies, will the current product portfolio still be balanced and provide sustainable growth in the long term?
> As growth prospects are going to differ by segment and even by component, which products will continue to grow and which will decline?
> Which new segments can provide growth opportunities that fit well with the essence of the current business, and are resilient to expected shifts in the competitive environment?
> Can a ramp-down strategy for a decreasing segment be financially viable?
Key takeaways
> Clear understanding of the impact of disruptive trends on the current business
> Product portfolio decisions have become key strategic topics
> Applicable generic strategies include – Diversification into
growth – Divestment – Harvesting in shrinking
areas ("Last man standing")
Key questions and key takeaways for suppliers
Source: Lazard, Roland Berger
62 Global Automotive Supplier Study 2018.pptx
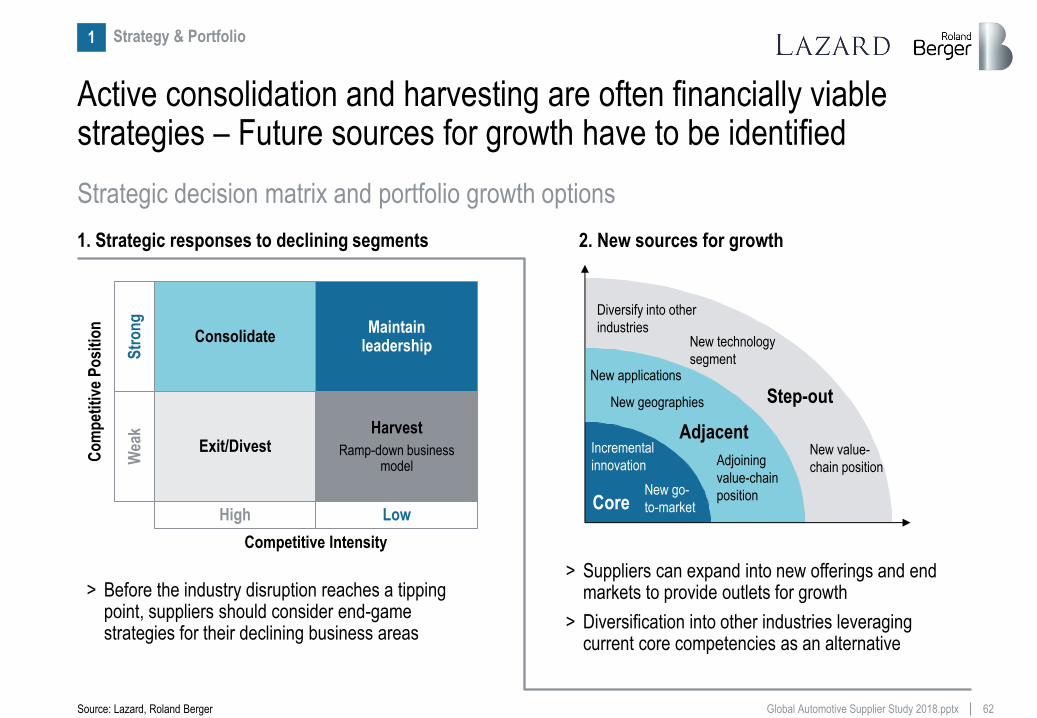
Active consolidation and harvesting are often financially viable strategies – Future sources for growth have to be identified
1. Strategic responses to declining segments 2. New sources for growth
Consolidate Maintain
leadership
Harvest
Ramp-down business model
Exit/Divest
Competitive Intensity
Low High
Co
mp
etit
ive
Po
siti
on
Wea
k S
tro
ng
> Before the industry disruption reaches a tipping point, suppliers should consider end-game strategies for their declining business areas
> Suppliers can expand into new offerings and end markets to provide outlets for growth
> Diversification into other industries leveraging current core competencies as an alternative
Core
Adjacent
Step-out
Incremental
innovation
New go-
to-market
Diversify into other
industries
New value-
chain position
New applications
Adjoining
value-chain
position
New technology
segment
New geographies
Strategic decision matrix and portfolio growth options
Source: Lazard, Roland Berger
Strategy & Portfolio 1
63 Global Automotive Supplier Study 2018.pptx
2012
Bohong / Wescast Industries
Continental/Freudenberg molded brake parts
Tupy / Cifunsa
Wuhan Iron & Steel/ThyssenKrupp TB
Bosch/ SPX
Metalsa / ISE Automotive
Hebei Lingyun / Kiekert
Delphi / FCI MVL
Magna/ Ixetic
Faurecia/ ACH Interiors
Grupo Antolin/ CML
Lear/ Guilford Mills
Nemak / JL French Automotive
Continental/ Parker Hannifin MCS
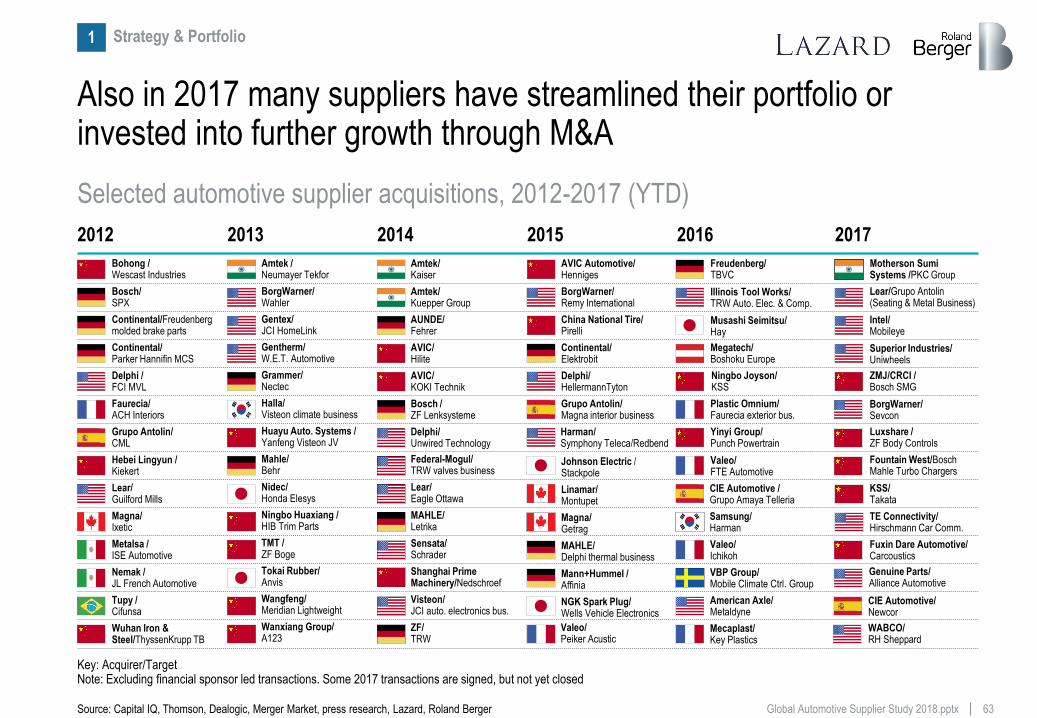
Also in 2017 many suppliers have streamlined their portfolio or invested into further growth through M&A
2013
Amtek / Neumayer Tekfor
Wanxiang Group/ A123
Ningbo Huaxiang / HIB Trim Parts
Huayu Auto. Systems / Yanfeng Visteon JV
BorgWarner/ Wahler
Mahle/ Behr
Gentherm/ W.E.T. Automotive
Tokai Rubber/ Anvis
Grammer/ Nectec
Gentex/ JCI HomeLink
TMT / ZF Boge
Halla/ Visteon climate business
Wangfeng/ Meridian Lightweight
Nidec/ Honda Elesys
2014
Amtek/ Kuepper Group
AVIC/ Hilite
AVIC/ KOKI Technik
AUNDE/ Fehrer
Amtek/ Kaiser
Bosch / ZF Lenksysteme
Shanghai Prime Machinery/Nedschroef
MAHLE/ Letrika
ZF/ TRW
Lear/ Eagle Ottawa
Visteon/ JCI auto. electronics bus.
Sensata/ Schrader
Delphi/ Unwired Technology
Federal-Mogul/ TRW valves business
2015
AVIC Automotive/ Henniges
China National Tire/ Pirelli
Delphi/ HellermannTyton
Continental/ Elektrobit
BorgWarner/ Remy International
Grupo Antolin/ Magna interior business
Mann+Hummel / Affinia
Magna/ Getrag
Linamar/ Montupet
Johnson Electric / Stackpole
MAHLE/ Delphi thermal business
NGK Spark Plug/ Wells Vehicle Electronics
Valeo/ Peiker Acustic
Harman/ Symphony Teleca/Redbend
2016
Illinois Tool Works/ TRW Auto. Elec. & Comp.
Musashi Seimitsu/ Hay
Freudenberg/ TBVC
Yinyi Group/ Punch Powertrain
Plastic Omnium/ Faurecia exterior bus.
Ningbo Joyson/ KSS
Megatech/ Boshoku Europe
Valeo/ FTE Automotive
Samsung/ Harman
Valeo/ Ichikoh
VBP Group/ Mobile Climate Ctrl. Group
American Axle/ Metaldyne
Mecaplast/ Key Plastics
CIE Automotive / Grupo Amaya Telleria
Intel/ Mobileye
Superior Industries/ Uniwheels
Lear/Grupo Antolin (Seating & Metal Business)
BorgWarner/ Sevcon
ZMJ/CRCI / Bosch SMG
Luxshare / ZF Body Controls
Fountain West/Bosch Mahle Turbo Chargers
2017
KSS/ Takata
TE Connectivity/ Hirschmann Car Comm.
Fuxin Dare Automotive/ Carcoustics
Motherson Sumi Systems /PKC Group
Genuine Parts/ Alliance Automotive
CIE Automotive/ Newcor
WABCO/ RH Sheppard
Selected automotive supplier acquisitions, 2012-2017 (YTD)
Key: Acquirer/Target Note: Excluding financial sponsor led transactions. Some 2017 transactions are signed, but not yet closed
Source: Capital IQ, Thomson, Dealogic, Merger Market, press research, Lazard, Roland Berger
Strategy & Portfolio 1
64 Global Automotive Supplier Study 2018.pptx
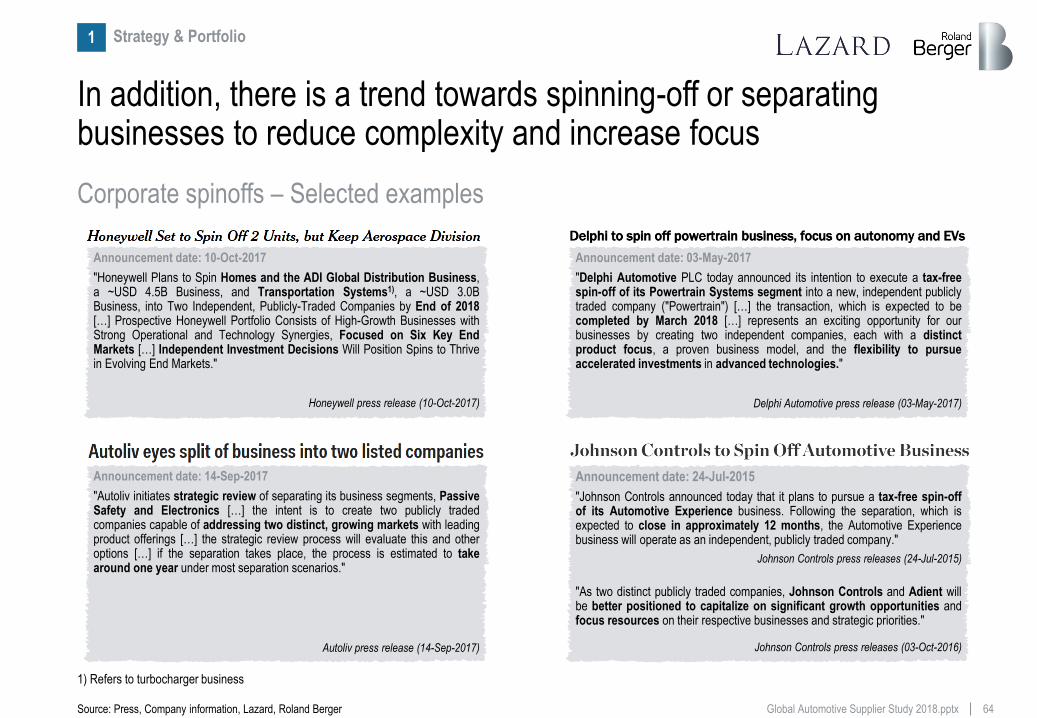
In addition, there is a trend towards spinning-off or separating businesses to reduce complexity and increase focus
Announcement date: 10-Oct-2017
"Honeywell Plans to Spin Homes and the ADI Global Distribution Business, a ~USD 4.5B Business, and Transportation Systems1), a ~USD 3.0B Business, into Two Independent, Publicly-Traded Companies by End of 2018 […] Prospective Honeywell Portfolio Consists of High-Growth Businesses with Strong Operational and Technology Synergies, Focused on Six Key End Markets […] Independent Investment Decisions Will Position Spins to Thrive in Evolving End Markets."
Honeywell press release (10-Oct-2017)
Announcement date: 14-Sep-2017
"Autoliv initiates strategic review of separating its business segments, Passive Safety and Electronics […] the intent is to create two publicly traded companies capable of addressing two distinct, growing markets with leading product offerings […] the strategic review process will evaluate this and other options […] if the separation takes place, the process is estimated to take around one year under most separation scenarios."
Autoliv press release (14-Sep-2017)
Announcement date: 03-May-2017
"Delphi Automotive PLC today announced its intention to execute a tax-free spin-off of its Powertrain Systems segment into a new, independent publicly traded company ("Powertrain") […] the transaction, which is expected to be completed by March 2018 […] represents an exciting opportunity for our businesses by creating two independent companies, each with a distinct product focus, a proven business model, and the flexibility to pursue accelerated investments in advanced technologies."
Delphi Automotive press release (03-May-2017)
Announcement date: 24-Jul-2015
"Johnson Controls announced today that it plans to pursue a tax-free spin-off of its Automotive Experience business. Following the separation, which is expected to close in approximately 12 months, the Automotive Experience business will operate as an independent, publicly traded company."
Johnson Controls press releases (24-Jul-2015)
"As two distinct publicly traded companies, Johnson Controls and Adient will be better positioned to capitalize on significant growth opportunities and focus resources on their respective businesses and strategic priorities."
Johnson Controls press releases (03-Oct-2016)
Corporate spinoffs – Selected examples
1) Refers to turbocharger business
Source: Press, Company information, Lazard, Roland Berger
Strategy & Portfolio 1
65 Global Automotive Supplier Study 2018.pptx
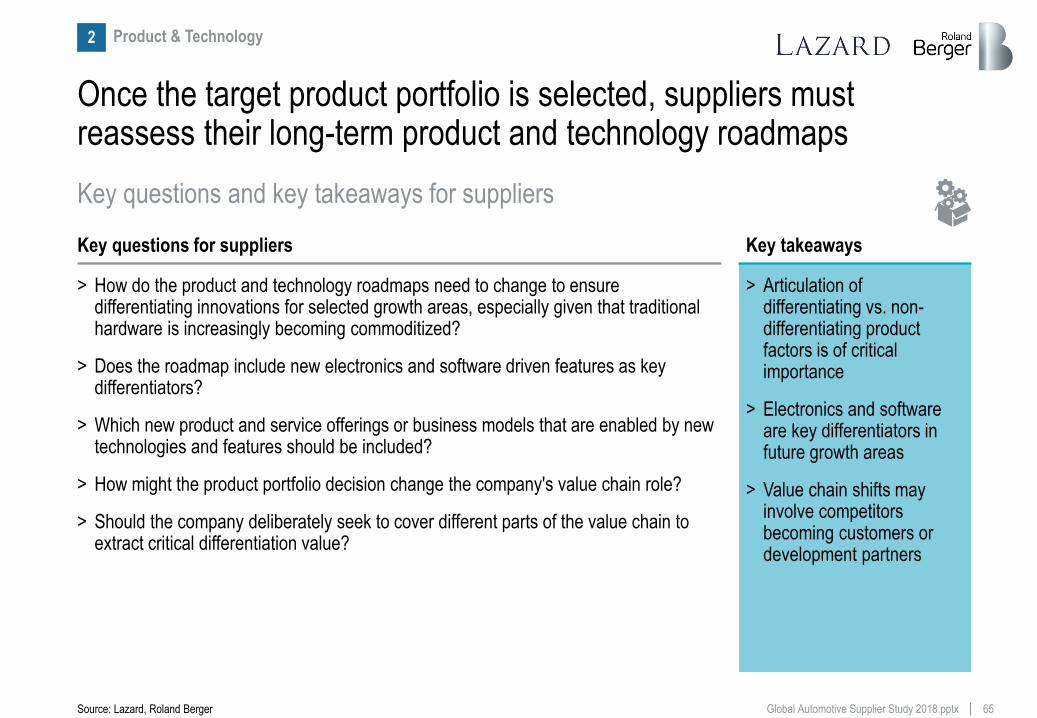
Once the target product portfolio is selected, suppliers must reassess their long-term product and technology roadmaps
Product & Technology 2
Key questions for suppliers
> How do the product and technology roadmaps need to change to ensure differentiating innovations for selected growth areas, especially given that traditional hardware is increasingly becoming commoditized?
> Does the roadmap include new electronics and software driven features as key differentiators?
> Which new product and service offerings or business models that are enabled by new technologies and features should be included?
> How might the product portfolio decision change the company's value chain role?
> Should the company deliberately seek to cover different parts of the value chain to extract critical differentiation value?
Key questions and key takeaways for suppliers
Source: Lazard, Roland Berger
Key takeaways
> Articulation of differentiating vs. non-differentiating product factors is of critical importance
> Electronics and software are key differentiators in future growth areas
> Value chain shifts may involve competitors becoming customers or development partners
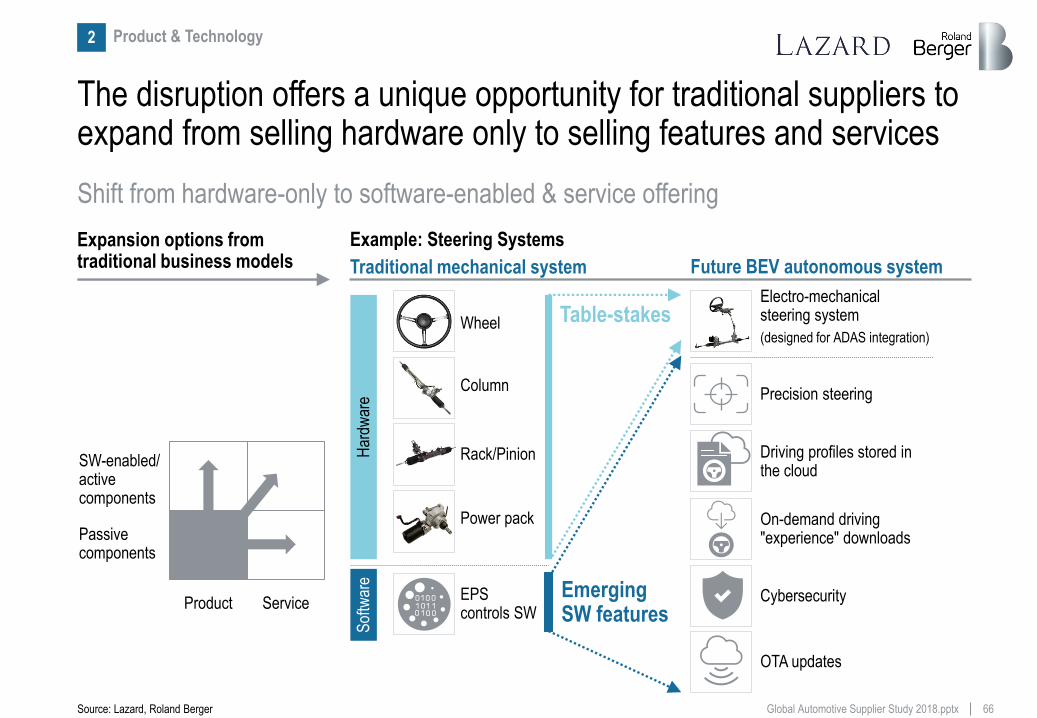
66 Global Automotive Supplier Study 2018.pptx
The disruption offers a unique opportunity for traditional suppliers to expand from selling hardware only to selling features and services
Expansion options from traditional business models
Product Service
SW-enabled/ active components
Passive components
EPS controls SW
Sof
twar
e
Table-stakes
Emerging SW features
Wheel
Rack/Pinion
Precision steering
On-demand driving "experience" downloads
Driving profiles stored in the cloud
Electro-mechanical steering system
(designed for ADAS integration)
Cybersecurity
Future BEV autonomous system
Power pack
Column
Har
dwar
e
Example: Steering Systems
Traditional mechanical system
OTA updates
Shift from hardware-only to software-enabled & service offering
Source: Lazard, Roland Berger
Product & Technology 2
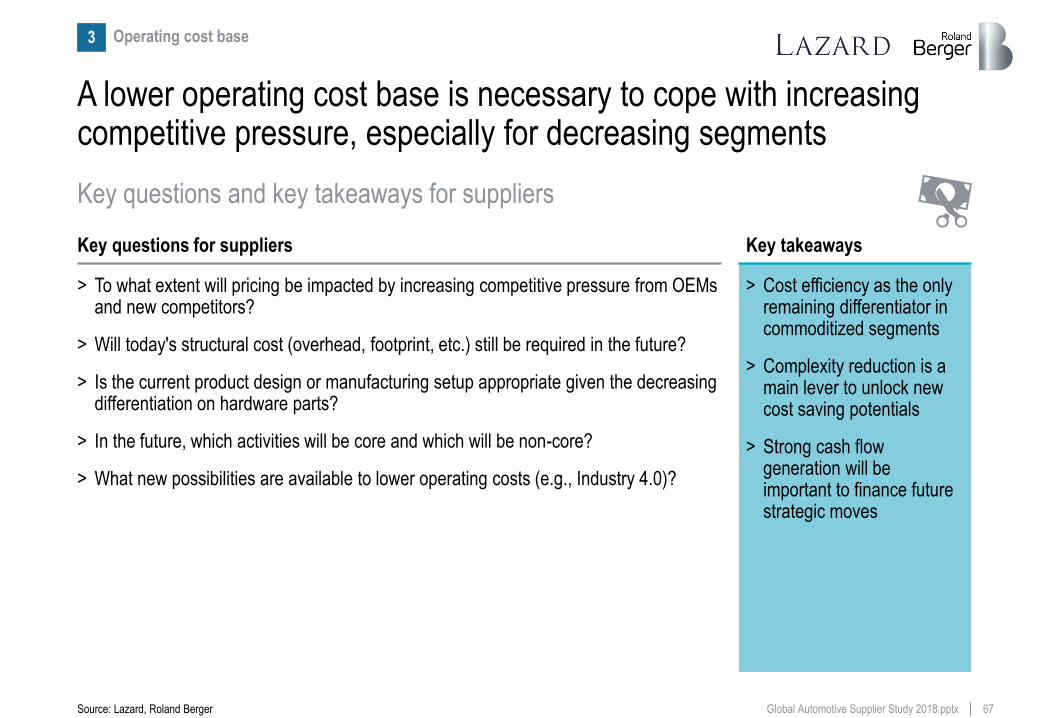
67 Global Automotive Supplier Study 2018.pptx
A lower operating cost base is necessary to cope with increasing competitive pressure, especially for decreasing segments
Operating cost base 3
Key questions for suppliers
> To what extent will pricing be impacted by increasing competitive pressure from OEMs and new competitors?
> Will today's structural cost (overhead, footprint, etc.) still be required in the future?
> Is the current product design or manufacturing setup appropriate given the decreasing differentiation on hardware parts?
> In the future, which activities will be core and which will be non-core?
> What new possibilities are available to lower operating costs (e.g., Industry 4.0)?
Key questions and key takeaways for suppliers
Source: Lazard, Roland Berger
Key takeaways
> Cost efficiency as the only remaining differentiator in commoditized segments
> Complexity reduction is a main lever to unlock new cost saving potentials
> Strong cash flow generation will be important to finance future strategic moves
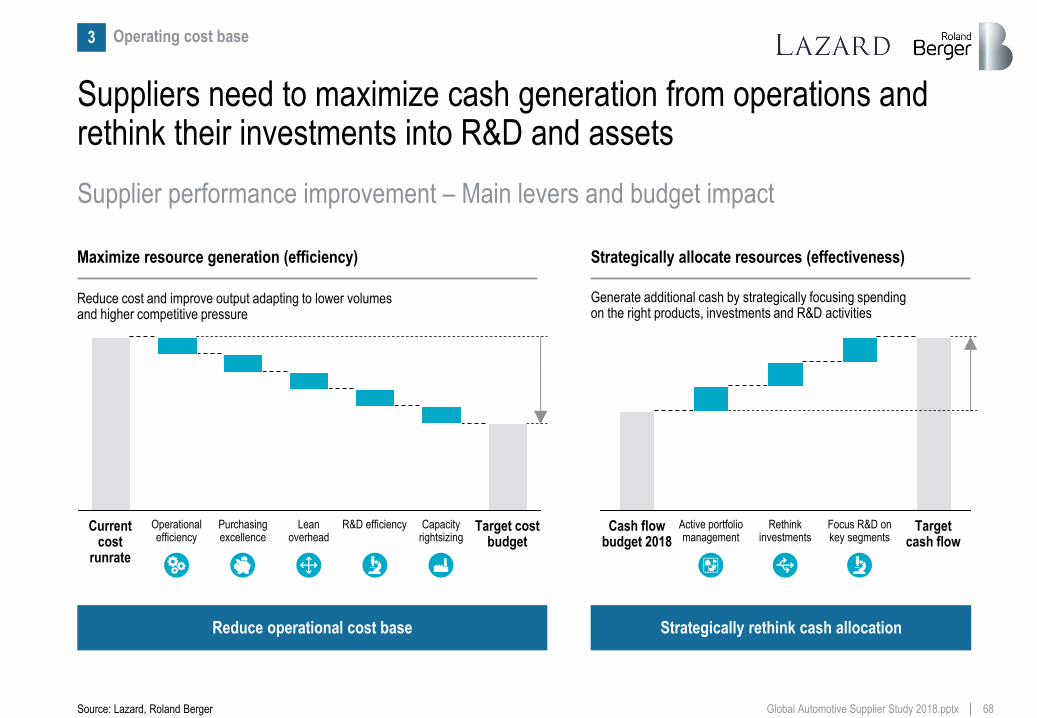
68 Global Automotive Supplier Study 2018.pptx
Suppliers need to maximize cash generation from operations and rethink their investments into R&D and assets
Capacity rightsizing
Target cost budget
Purchasing excellence
Lean overhead
Operational efficiency
Current cost
runrate
R&D efficiency
Maximize resource generation (efficiency) Strategically allocate resources (effectiveness)
Reduce cost and improve output adapting to lower volumes and higher competitive pressure
Generate additional cash by strategically focusing spending on the right products, investments and R&D activities
Target cash flow
Focus R&D on key segments
Rethink investments
Active portfolio management
Cash flow budget 2018
Reduce operational cost base Strategically rethink cash allocation
Supplier performance improvement – Main levers and budget impact
Source: Lazard, Roland Berger
Operating cost base 3
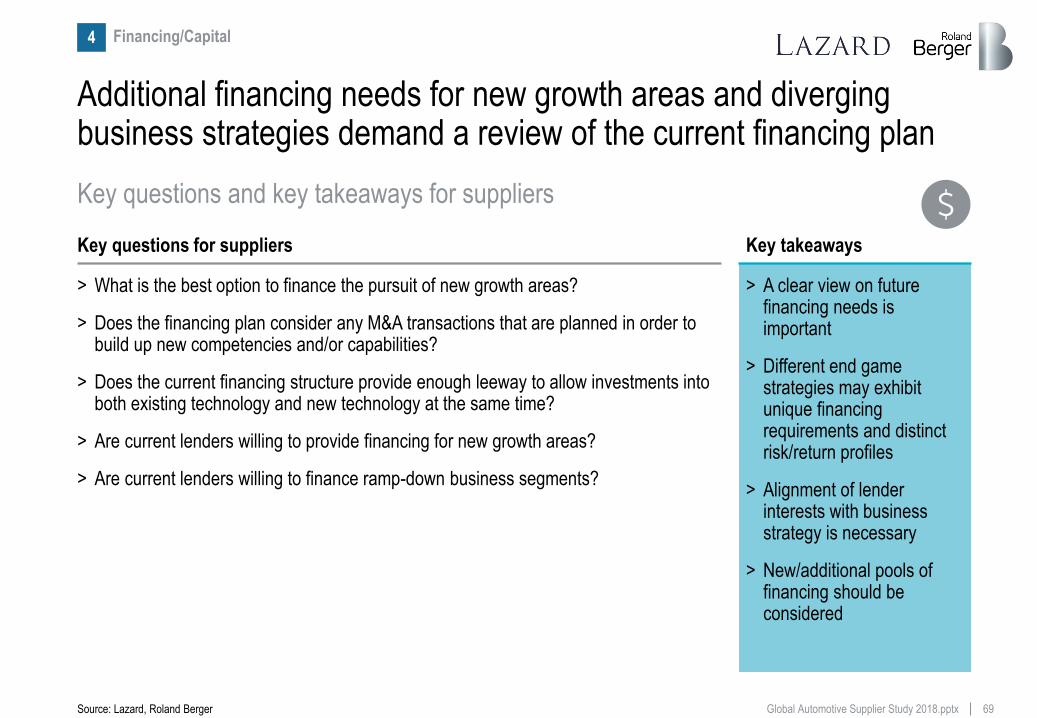
69 Global Automotive Supplier Study 2018.pptx
Additional financing needs for new growth areas and diverging business strategies demand a review of the current financing plan
Financing/Capital 4
Key questions for suppliers
> What is the best option to finance the pursuit of new growth areas?
> Does the financing plan consider any M&A transactions that are planned in order to build up new competencies and/or capabilities?
> Does the current financing structure provide enough leeway to allow investments into both existing technology and new technology at the same time?
> Are current lenders willing to provide financing for new growth areas?
> Are current lenders willing to finance ramp-down business segments?
Key questions and key takeaways for suppliers
Source: Lazard, Roland Berger
Key takeaways
> A clear view on future financing needs is important
> Different end game strategies may exhibit unique financing requirements and distinct risk/return profiles
> Alignment of lender interests with business strategy is necessary
> New/additional pools of financing should be considered
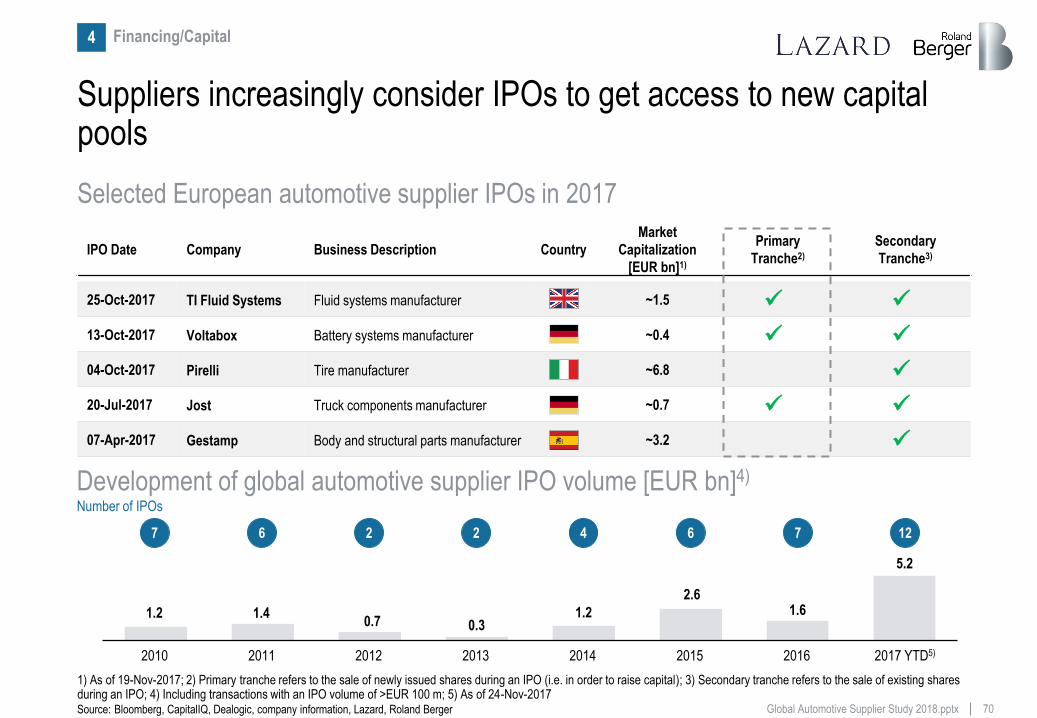
70 Global Automotive Supplier Study 2018.pptx Source: Bloomberg, CapitalIQ, Dealogic, company information, Lazard, Roland Berger
Suppliers increasingly consider IPOs to get access to new capital pools
IPO Date Company Business Description Country
Market
Capitalization
[EUR bn]1)
Primary
Tranche2)
Secondary
Tranche3)
25-Oct-2017 TI Fluid Systems Fluid systems manufacturer ~1.5
13-Oct-2017 Voltabox Battery systems manufacturer ~0.4
04-Oct-2017 Pirelli Tire manufacturer ~6.8
20-Jul-2017 Jost Truck components manufacturer ~0.7
07-Apr-2017 Gestamp Body and structural parts manufacturer ~3.2
1.2 1.4 0.7 0.3
1.2
2.6 1.6
5.2
Development of global automotive supplier IPO volume [EUR bn]4)
12 7 6 4 2 2 6 7
Number of IPOs
2010 2011 2012 2013 2014 2015 2016 2017 YTD5)
Selected European automotive supplier IPOs in 2017
1) As of 19-Nov-2017; 2) Primary tranche refers to the sale of newly issued shares during an IPO (i.e. in order to raise capital); 3) Secondary tranche refers to the sale of existing shares during an IPO; 4) Including transactions with an IPO volume of >EUR 100 m; 5) As of 24-Nov-2017
Financing/Capital 4
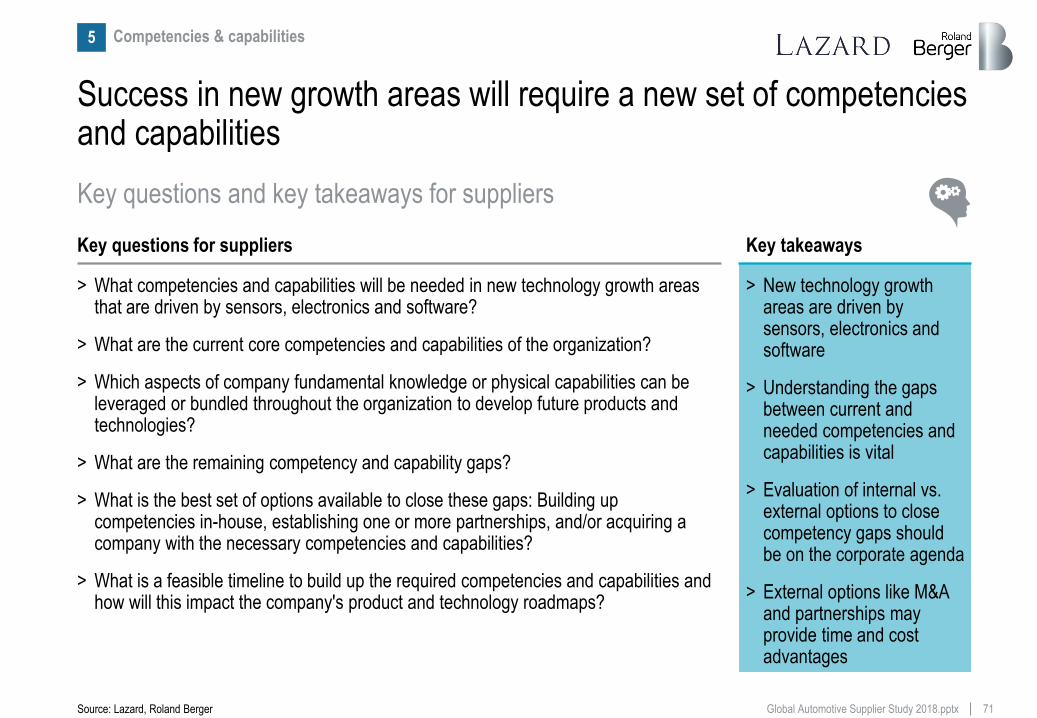
71 Global Automotive Supplier Study 2018.pptx
Success in new growth areas will require a new set of competencies and capabilities
Competencies & capabilities 5
Key questions for suppliers
> What competencies and capabilities will be needed in new technology growth areas that are driven by sensors, electronics and software?
> What are the current core competencies and capabilities of the organization?
> Which aspects of company fundamental knowledge or physical capabilities can be leveraged or bundled throughout the organization to develop future products and technologies?
> What are the remaining competency and capability gaps?
> What is the best set of options available to close these gaps: Building up competencies in-house, establishing one or more partnerships, and/or acquiring a company with the necessary competencies and capabilities?
> What is a feasible timeline to build up the required competencies and capabilities and how will this impact the company's product and technology roadmaps?
Key questions and key takeaways for suppliers
Source: Lazard, Roland Berger
Key takeaways
> New technology growth areas are driven by sensors, electronics and software
> Understanding the gaps between current and needed competencies and capabilities is vital
> Evaluation of internal vs. external options to close competency gaps should be on the corporate agenda
> External options like M&A and partnerships may provide time and cost advantages
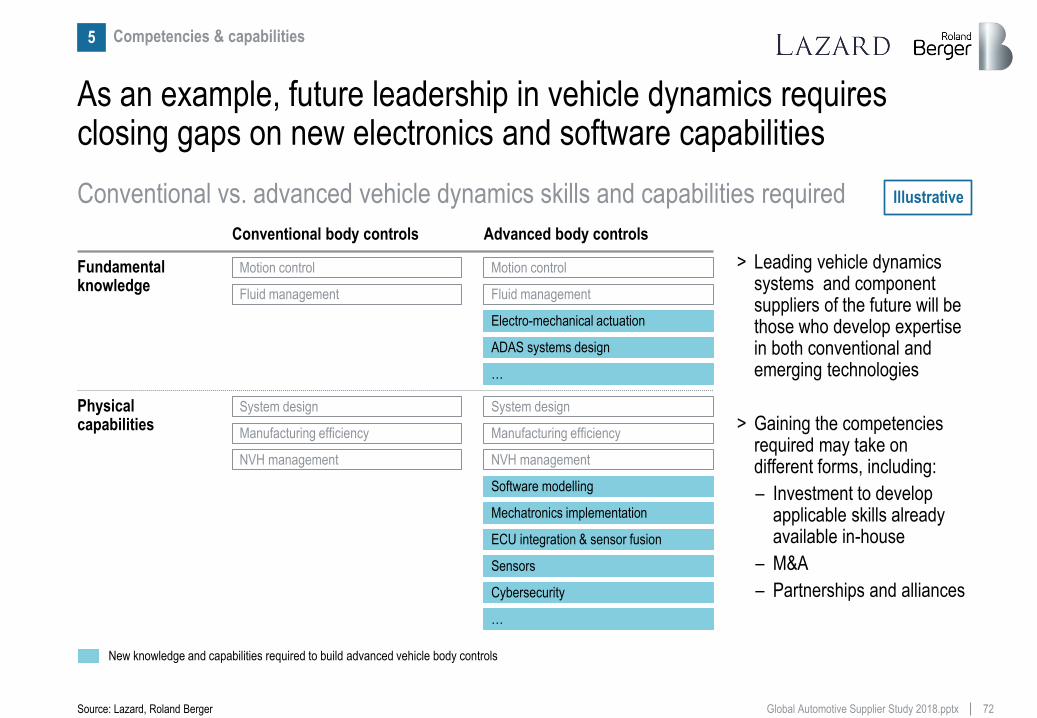
72 Global Automotive Supplier Study 2018.pptx
As an example, future leadership in vehicle dynamics requires closing gaps on new electronics and software capabilities
Conventional body controls Advanced body controls
> Leading vehicle dynamics systems and component suppliers of the future will be those who develop expertise in both conventional and emerging technologies
> Gaining the competencies required may take on different forms, including:
– Investment to develop applicable skills already available in-house
– M&A
– Partnerships and alliances
Illustrative
Fundamental knowledge
Motion control Motion control
Electro-mechanical actuation
Physical capabilities
System design System design
Mechatronics implementation
Manufacturing efficiency Manufacturing efficiency
NVH management NVH management
Software modelling
ECU integration & sensor fusion
Fluid management Fluid management
ADAS systems design
…
Sensors
Cybersecurity
…
Conventional vs. advanced vehicle dynamics skills and capabilities required
Source: Lazard, Roland Berger
New knowledge and capabilities required to build advanced vehicle body controls
Competencies & capabilities 5
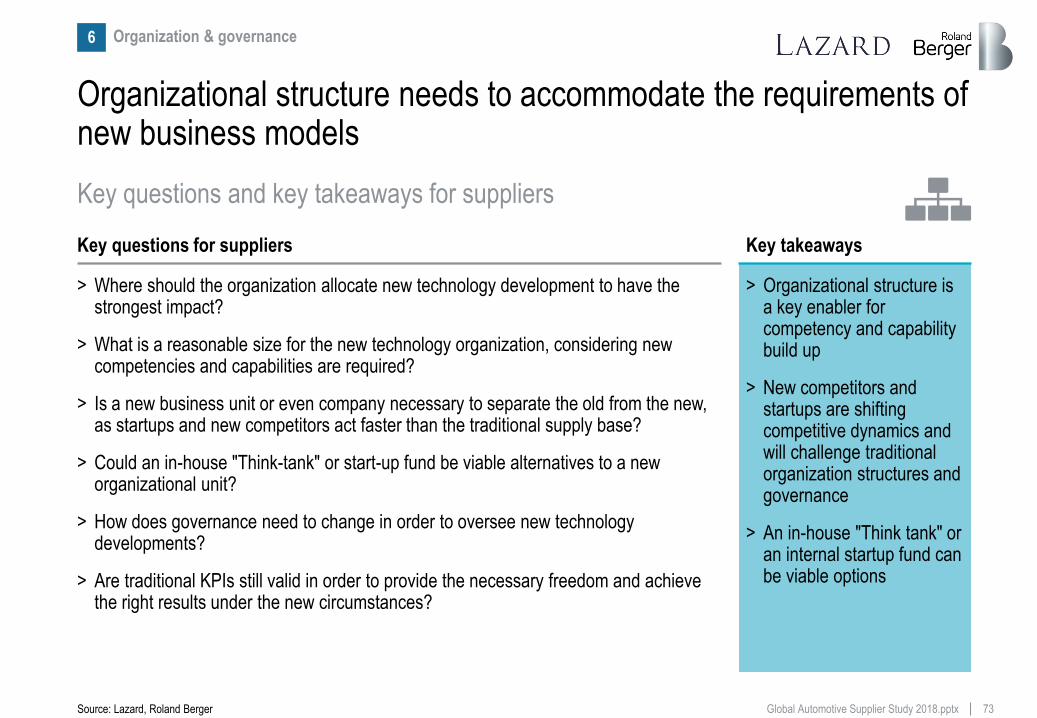
73 Global Automotive Supplier Study 2018.pptx
Organizational structure needs to accommodate the requirements of new business models
Organization & governance 6
Key questions for suppliers
> Where should the organization allocate new technology development to have the strongest impact?
> What is a reasonable size for the new technology organization, considering new competencies and capabilities are required?
> Is a new business unit or even company necessary to separate the old from the new, as startups and new competitors act faster than the traditional supply base?
> Could an in-house "Think-tank" or start-up fund be viable alternatives to a new organizational unit?
> How does governance need to change in order to oversee new technology developments?
> Are traditional KPIs still valid in order to provide the necessary freedom and achieve the right results under the new circumstances?
Key questions and key takeaways for suppliers
Source: Lazard, Roland Berger
Key takeaways
> Organizational structure is a key enabler for competency and capability build up
> New competitors and startups are shifting competitive dynamics and will challenge traditional organization structures and governance
> An in-house "Think tank" or an internal startup fund can be viable options

74 Global Automotive Supplier Study 2018.pptx
Many suppliers will have to manage two fundamentally different business models under one roof – Organizational structure is key
> High levels of product standardization to minimize the required investment levels for product development
> Target high levels of centralization of certain functions to reduce OPEX
> Create a culture focused on streamlined processes built around commoditized product
> Choose a governance model to optimize cash generation
> Export transferrable competencies to the New BU and legacy BUs that will be pillars for new growth
> High visibility to senior leadership/CEO to ensure fast decision making and necessary support
> Bundling of necessary internal competencies in one place in the organization
> Facilitate add-on of additional external competencies
> Implement an innovation culture with agile principles
> Right growth focused governance model with new business metrics and objectives
> Shield the business from the "old way" of operating
New technologies/"Start-up" Old technologies/"Harvest"
Emergence of differing organizational requirements
Source: Lazard, Roland Berger
Organization & governance 6
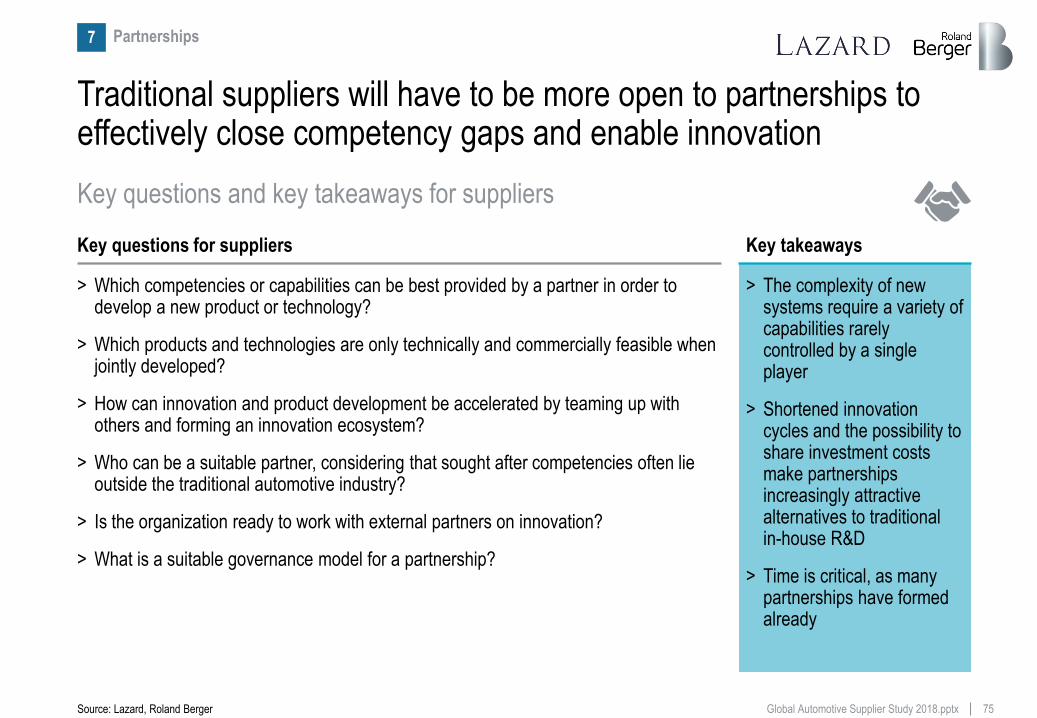
75 Global Automotive Supplier Study 2018.pptx
Traditional suppliers will have to be more open to partnerships to effectively close competency gaps and enable innovation
Partnerships 7
Key questions for suppliers
> Which competencies or capabilities can be best provided by a partner in order to develop a new product or technology?
> Which products and technologies are only technically and commercially feasible when jointly developed?
> How can innovation and product development be accelerated by teaming up with others and forming an innovation ecosystem?
> Who can be a suitable partner, considering that sought after competencies often lie outside the traditional automotive industry?
> Is the organization ready to work with external partners on innovation?
> What is a suitable governance model for a partnership?
Key questions and key takeaways for suppliers
Source: Lazard, Roland Berger
Key takeaways
> The complexity of new systems require a variety of capabilities rarely controlled by a single player
> Shortened innovation cycles and the possibility to share investment costs make partnerships increasingly attractive alternatives to traditional in-house R&D
> Time is critical, as many partnerships have formed already
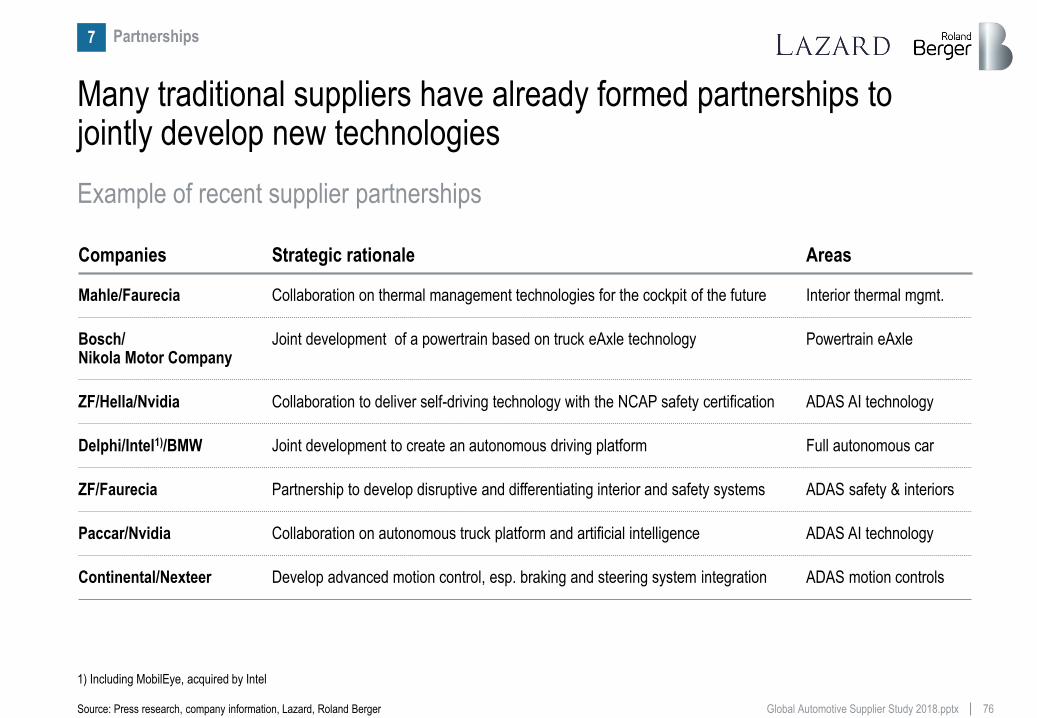
76 Global Automotive Supplier Study 2018.pptx
Many traditional suppliers have already formed partnerships to jointly develop new technologies
Companies Strategic rationale Areas
Interior thermal mgmt. Collaboration on thermal management technologies for the cockpit of the future Mahle/Faurecia
Powertrain eAxle Joint development of a powertrain based on truck eAxle technology Bosch/ Nikola Motor Company
ADAS motion controls Develop advanced motion control, esp. braking and steering system integration Continental/Nexteer
ADAS AI technology Collaboration on autonomous truck platform and artificial intelligence Paccar/Nvidia
ADAS safety & interiors Partnership to develop disruptive and differentiating interior and safety systems ZF/Faurecia
ADAS AI technology Collaboration to deliver self-driving technology with the NCAP safety certification ZF/Hella/Nvidia
Full autonomous car Joint development to create an autonomous driving platform Delphi/Intel1)/BMW
Example of recent supplier partnerships
1) Including MobilEye, acquired by Intel
Source: Press research, company information, Lazard, Roland Berger
Partnerships 7
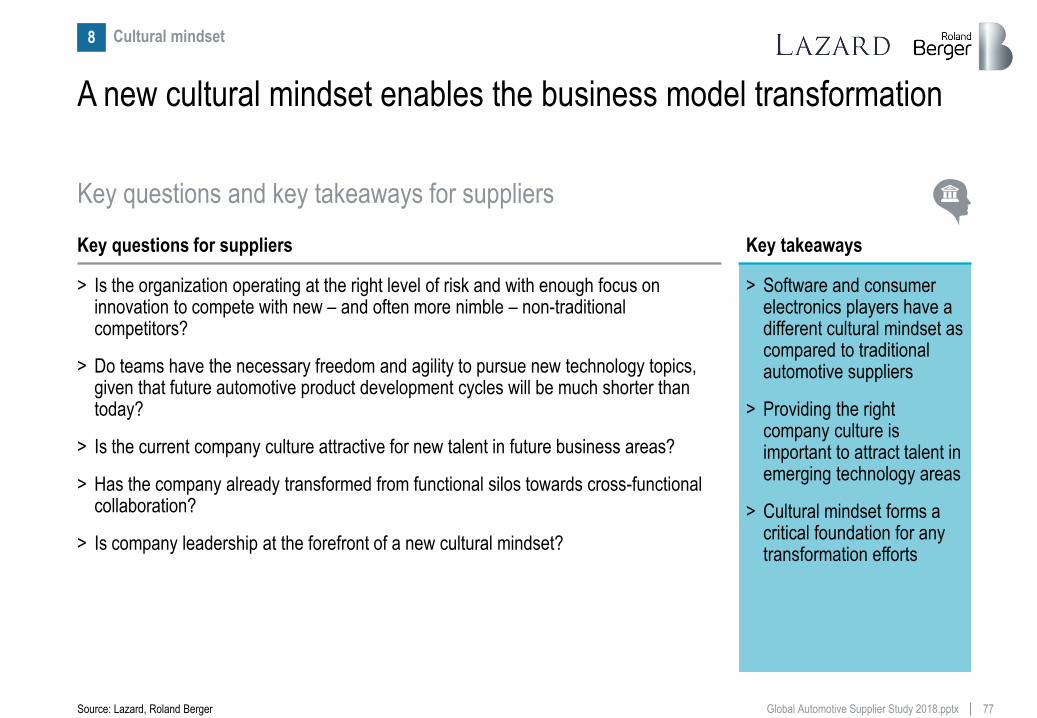
77 Global Automotive Supplier Study 2018.pptx
A new cultural mindset enables the business model transformation
Cultural mindset 8
Key questions for suppliers
> Is the organization operating at the right level of risk and with enough focus on innovation to compete with new – and often more nimble – non-traditional competitors?
> Do teams have the necessary freedom and agility to pursue new technology topics, given that future automotive product development cycles will be much shorter than today?
> Is the current company culture attractive for new talent in future business areas?
> Has the company already transformed from functional silos towards cross-functional collaboration?
> Is company leadership at the forefront of a new cultural mindset?
Key questions and key takeaways for suppliers
Source: Lazard, Roland Berger
Key takeaways
> Software and consumer electronics players have a different cultural mindset as compared to traditional automotive suppliers
> Providing the right company culture is important to attract talent in emerging technology areas
> Cultural mindset forms a critical foundation for any transformation efforts
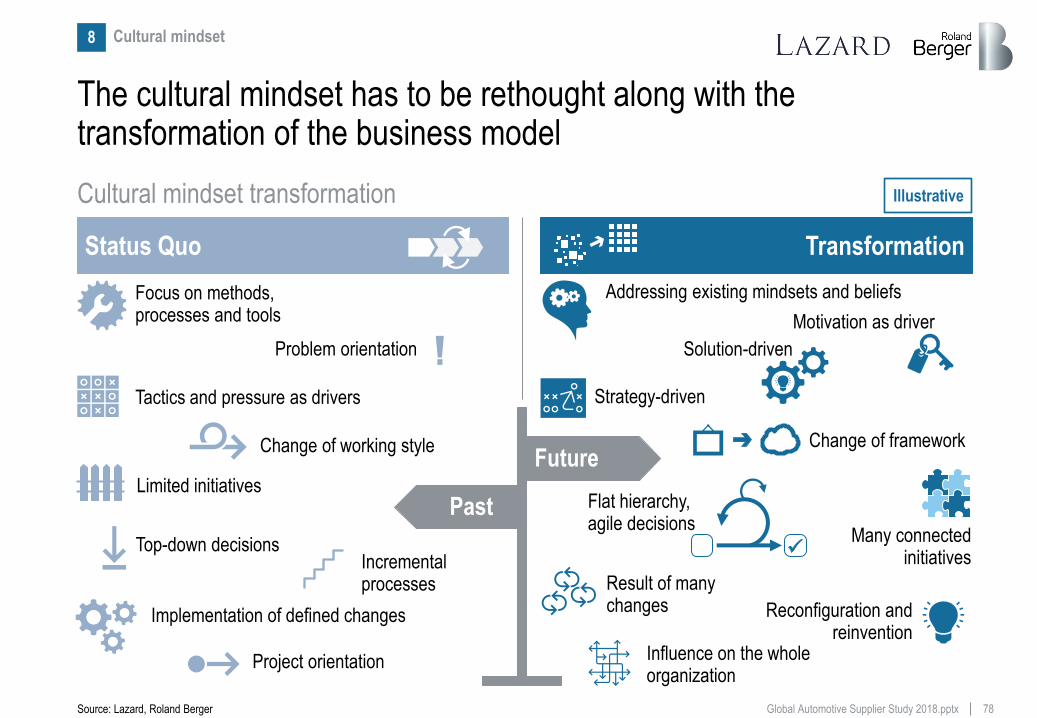
78 Global Automotive Supplier Study 2018.pptx
The cultural mindset has to be rethought along with the transformation of the business model
Transformation
Future
Past
Focus on methods, processes and tools
Incremental processes
Tactics and pressure as drivers
Change of working style
Implementation of defined changes
Status Quo
Addressing existing mindsets and beliefs
Strategy-driven
Many connected initiatives
Reconfiguration and reinvention
Change of framework
Result of many changes
Solution-driven Problem orientation
Limited initiatives
Project orientation Influence on the whole organization
Flat hierarchy, agile decisions
Top-down decisions
Motivation as driver
Illustrative Cultural mindset transformation
Source: Lazard, Roland Berger
Cultural mindset 8
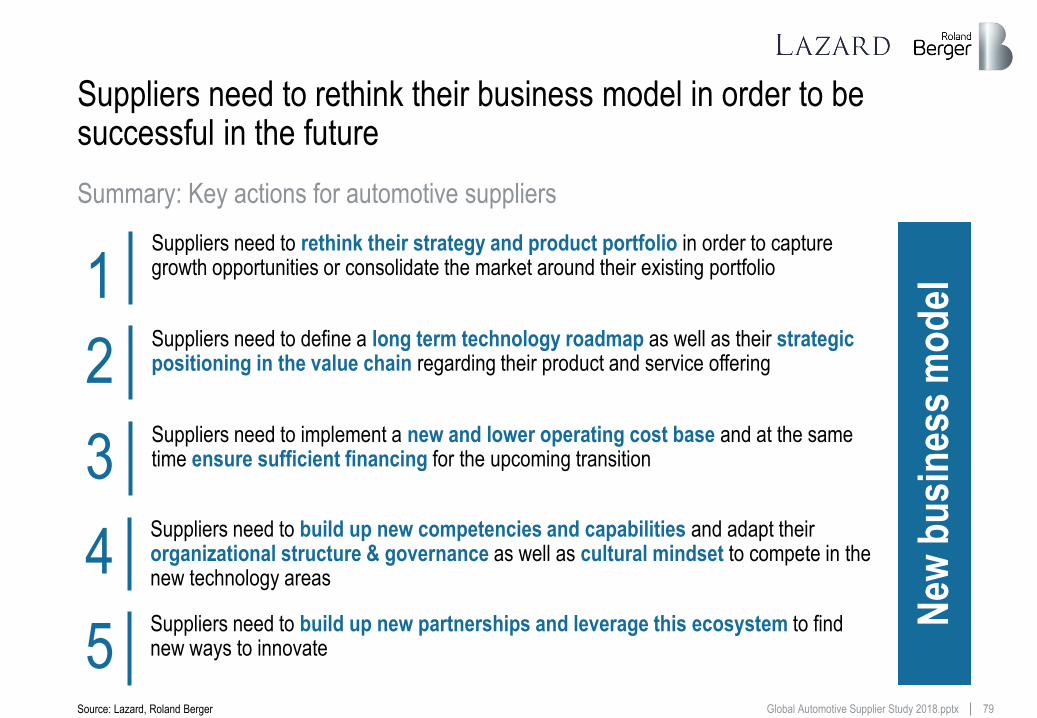
79 Global Automotive Supplier Study 2018.pptx
Suppliers need to rethink their business model in order to be successful in the future
1 Suppliers need to rethink their strategy and product portfolio in order to capture growth opportunities or consolidate the market around their existing portfolio
3 Suppliers need to implement a new and lower operating cost base and at the same time ensure sufficient financing for the upcoming transition
4 Suppliers need to build up new competencies and capabilities and adapt their organizational structure & governance as well as cultural mindset to compete in the new technology areas
5 Suppliers need to build up new partnerships and leverage this ecosystem to find new ways to innovate
New
bu
sin
ess
mo
del
2 Suppliers need to define a long term technology roadmap as well as their strategic positioning in the value chain regarding their product and service offering
Summary: Key actions for automotive suppliers
Source: Lazard, Roland Berger
80 Global Automotive Supplier Study 2018.pptx
Contents
This document shall be treated as confidential. It has been compiled for the exclusive, internal use by our client and is not complete without the underlying detail analyses and the oral presentation.
It may not be passed on and/or may not be made available to third parties without prior written consent from and .
© Roland Berger/Lazard
The status
Record volumes and profits, but key markets are at a tipping point
A The consequence
Automotive suppliers need to transform their business models
D
Roland Berger and Lazard Automotive teams
The Contacts
E The challenge
Suppliers' traditional business will be questioned on multiple levels
C The future
Upcoming automotive disruption will fundamentally change the industry
B
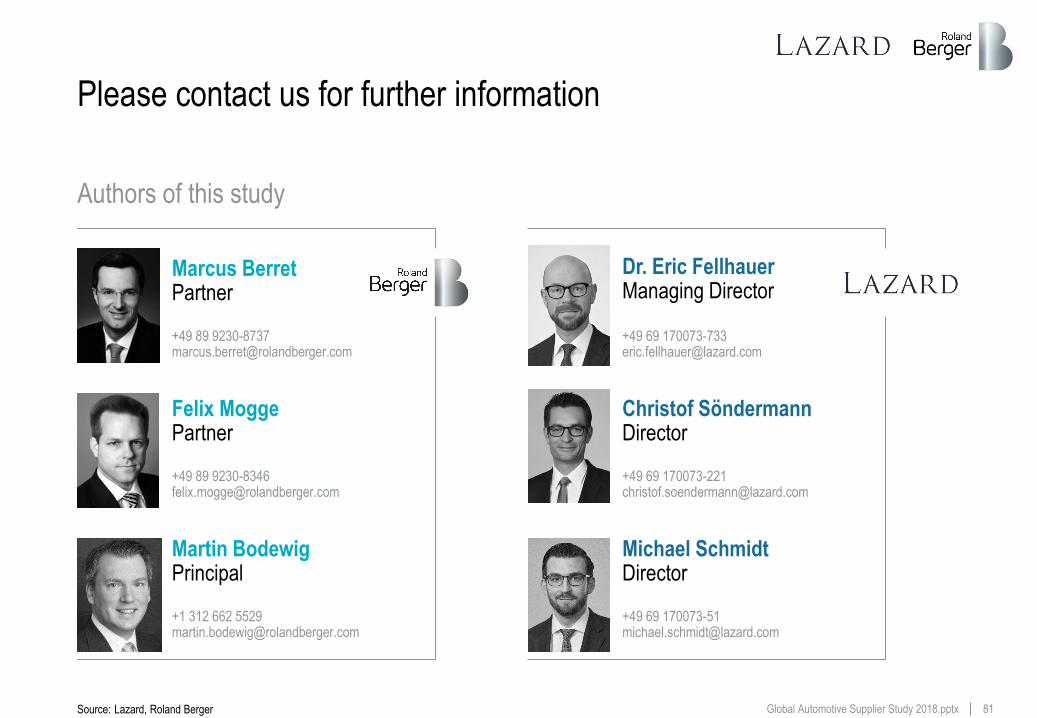
81 Global Automotive Supplier Study 2018.pptx
Please contact us for further information
Source: Lazard, Roland Berger
Dr. Eric Fellhauer Managing Director
+49 69 170073-733 [email protected]
Marcus Berret Partner
+49 89 9230-8737 [email protected]
Michael Schmidt Director
+49 69 170073-51 [email protected]
Martin Bodewig Principal
+1 312 662 5529 [email protected]
Christof Söndermann Director
+49 69 170073-221 [email protected]
Felix Mogge Partner
+49 89 9230-8346 [email protected]
Authors of this study
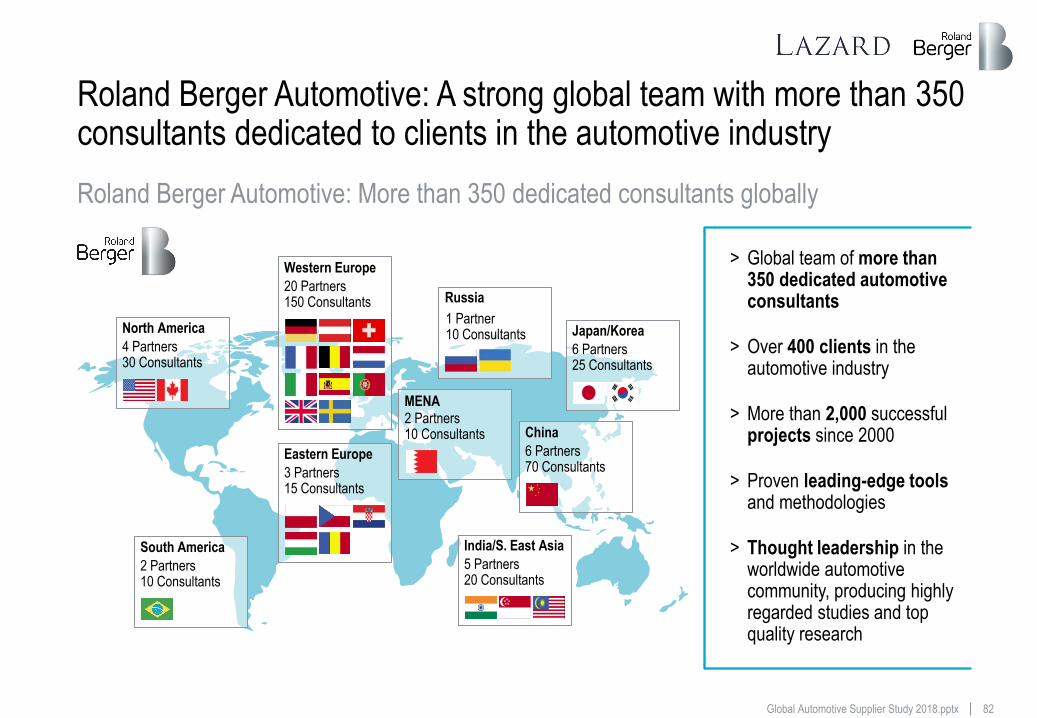
82 Global Automotive Supplier Study 2018.pptx
China
6 Partners 70 Consultants
5 Partners 20 Consultants
India/S. East Asia South America
2 Partners 10 Consultants
North America
4 Partners 30 Consultants
Western Europe
20 Partners 150 Consultants
Eastern Europe
3 Partners 15 Consultants
Russia
1 Partner 10 Consultants
2 Partners 10 Consultants
MENA
Japan/Korea
6 Partners 25 Consultants
Roland Berger Automotive: A strong global team with more than 350 consultants dedicated to clients in the automotive industry
> Global team of more than 350 dedicated automotive consultants
> Over 400 clients in the automotive industry
> More than 2,000 successful projects since 2000
> Proven leading-edge tools and methodologies
> Thought leadership in the worldwide automotive community, producing highly regarded studies and top quality research
Roland Berger Automotive: More than 350 dedicated consultants globally
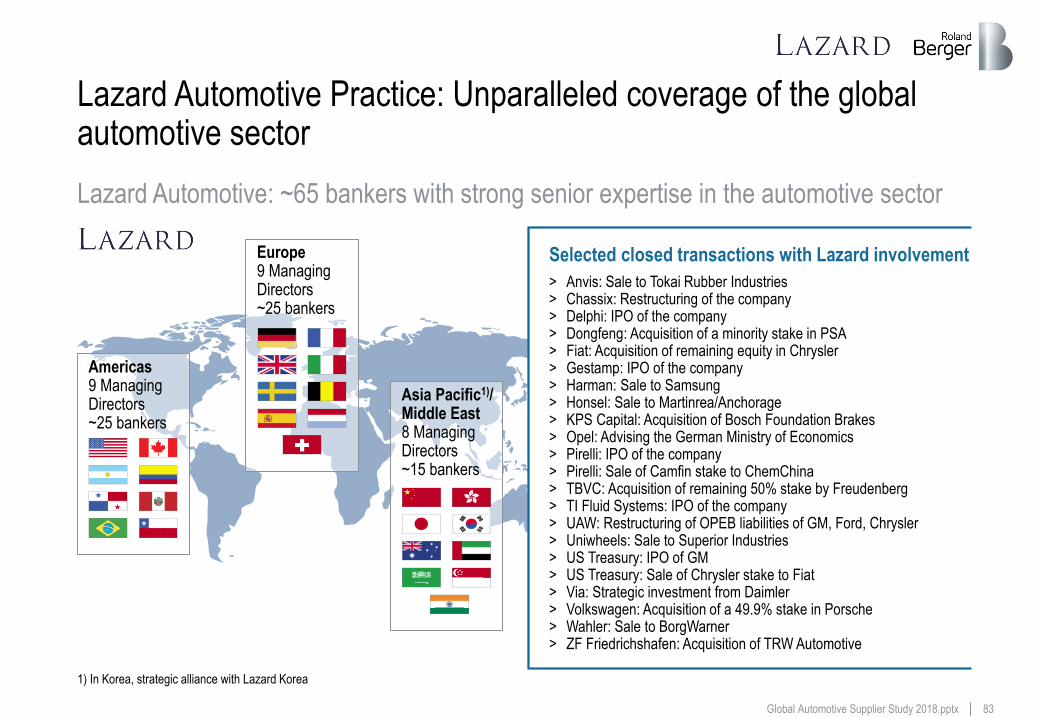
83 Global Automotive Supplier Study 2018.pptx
Lazard Automotive Practice: Unparalleled coverage of the global automotive sector
Selected closed transactions with Lazard involvement
> Anvis: Sale to Tokai Rubber Industries > Chassix: Restructuring of the company > Delphi: IPO of the company > Dongfeng: Acquisition of a minority stake in PSA > Fiat: Acquisition of remaining equity in Chrysler > Gestamp: IPO of the company > Harman: Sale to Samsung > Honsel: Sale to Martinrea/Anchorage > KPS Capital: Acquisition of Bosch Foundation Brakes > Opel: Advising the German Ministry of Economics > Pirelli: IPO of the company > Pirelli: Sale of Camfin stake to ChemChina > TBVC: Acquisition of remaining 50% stake by Freudenberg > TI Fluid Systems: IPO of the company > UAW: Restructuring of OPEB liabilities of GM, Ford, Chrysler > Uniwheels: Sale to Superior Industries > US Treasury: IPO of GM > US Treasury: Sale of Chrysler stake to Fiat > Via: Strategic investment from Daimler > Volkswagen: Acquisition of a 49.9% stake in Porsche > Wahler: Sale to BorgWarner > ZF Friedrichshafen: Acquisition of TRW Automotive
Asia Pacific1)/ Middle East 8 Managing Directors ~15 bankers
Europe 9 Managing Directors ~25 bankers
Americas
9 Managing Directors ~25 bankers
Lazard Automotive: ~65 bankers with strong senior expertise in the automotive sector
1) In Korea, strategic alliance with Lazard Korea
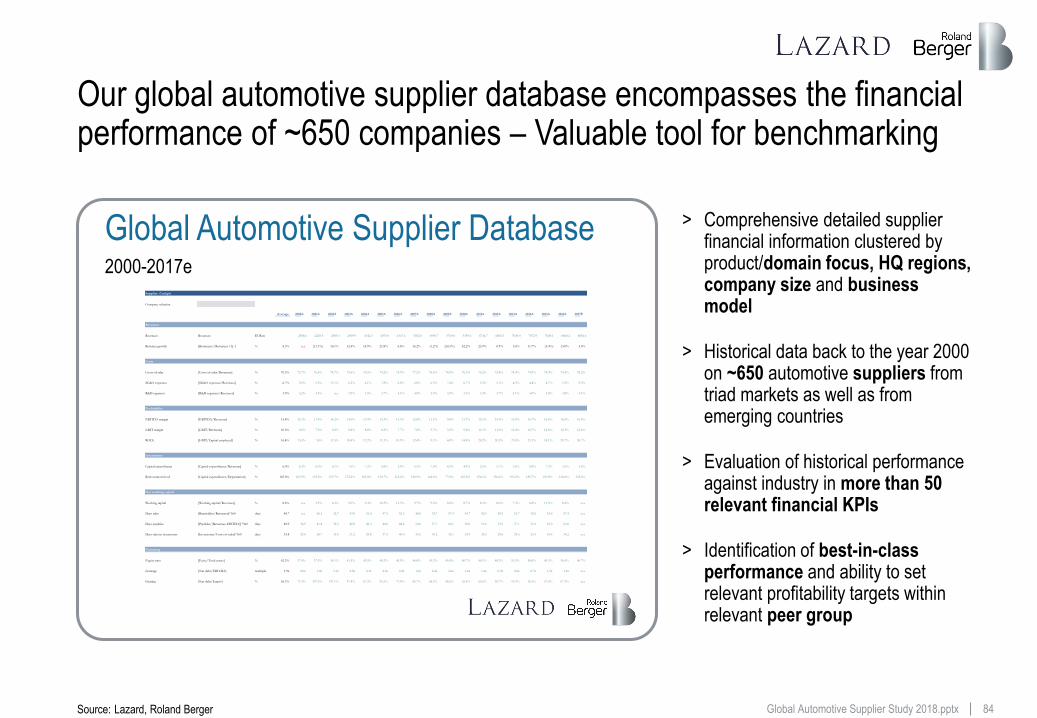
84 Global Automotive Supplier Study 2018.pptx
Our global automotive supplier database encompasses the financial performance of ~650 companies – Valuable tool for benchmarking
Source: Lazard, Roland Berger
> Comprehensive detailed supplier financial information clustered by product/domain focus, HQ regions, company size and business model
> Historical data back to the year 2000 on ~650 automotive suppliers from triad markets as well as from emerging countries
> Evaluation of historical performance against industry in more than 50 relevant financial KPIs
> Identification of best-in-class performance and ability to set relevant profitability targets within relevant peer group
Global Automotive Supplier Database 2000-2017e
Supplier_Cockpit
Company selection BorgWarner Inc.
Average 2000A 2001A 2002A 2003A 2004A 2005A 2006A 2007A 2008A 2009A 2010A 2011A 2012A 2013A 2014A 2015A 2016A 2017E
Revenues
Revenues Revenues EUR m 2508.6 2229.5 2589.3 2909.9 3342.3 4070.9 4347.4 5052.0 4990.7 3769.8 5359.6 6746.7 6805.3 7049.0 7872.9 7608.1 8600.2 8856.6
Revenue growth [Revenues t/Revenues t-1]-1 % 8.3% n.a. (11.1%) 16.1% 12.4% 14.9% 21.8% 6.8% 16.2% (1.2%) (24.5%) 42.2% 25.9% 0.9% 3.6% 11.7% (3.4%) 13.0% 3.0%
Costs
Costs of sales [Costs of sales/Revenues] % 76.3% 75.7% 76.6% 74.7% 75.6% 76.5% 74.2% 75.9% 77.2% 78.6% 78.9% 76.3% 76.2% 75.8% 74.9% 74.9% 74.9% 74.4% 78.2%
SG&A expenses [SG&A expenses/Revenues] % 6.7% 5.0% 5.5% 11.1% 6.5% 6.1% 7.8% 6.8% 6.0% 6.3% 7.4% 6.7% 5.3% 5.1% 4.5% 4.4% 4.7% 5.2% 9.2%
R&D expenses [R&D expenses/Revenues] % 3.9% 4.2% 4.4% n.a. 3.9% 3.5% 3.7% 4.1% 4.0% 3.9% 3.9% 3.3% 3.4% 3.7% 4.1% 4.0% 3.8% 3.8% 4.1%
Profitability
EBITDA margin [EBITDA/Revenues] % 14.8% 15.1% 13.4% 14.2% 14.0% 13.9% 14.3% 13.3% 12.8% 11.1% 9.8% 13.7% 15.1% 15.4% 16.5% 16.7% 16.6% 16.6% 16.9%
EBIT margin [EBIT/Revenues] % 10.0% 9.6% 7.2% 9.2% 8.8% 8.8% 8.3% 7.7% 7.8% 5.7% 3.2% 9.2% 11.1% 11.4% 12.4% 12.7% 12.6% 12.3% 12.6%
ROCE [EBIT/Capital employed] % 16.4% 13.5% 7.4% 11.5% 10.8% 12.2% 11.1% 10.9% 12.4% 9.1% 4.0% 14.8% 20.2% 20.3% 21.8% 23.1% 18.1% 20.7% 30.7%
Investments
Capital expenditures [Capital expenditures/Revenues] % 6.0% 6.3% 6.0% 6.1% 7.0% 7.2% 6.8% 5.9% 5.5% 7.0% 4.3% 4.9% 5.5% 5.7% 5.6% 6.8% 7.2% 5.5% 5.6%
Reinvestment level [Capital expenditures/Depreciation] % 145.0% 163.5% 135.2% 153.7% 172.2% 181.8% 130.7% 112.2% 120.9% 142.4% 73.3% 123.2% 156.1% 156.6% 153.2% 185.7% 191.8% 142.6% 132.6%
Net working capital
Working capital [Working capital/Revenues] % 8.6% n.a. 3.3% 6.3% 9.0% 9.4% 10.5% 11.3% 9.7% 9.2% 8.8% 8.7% 8.3% 8.0% 7.3% 8.8% 11.5% 8.4% n.a.
Days sales [Receivables/Revenues]*360 days 48.7 n.a. 26.1 32.7 43.9 51.0 47.5 52.3 48.8 35.7 57.4 54.7 52.5 50.9 51.7 52.0 63.8 57.4 n.a.
Days payables [Payables/(Revenues-EBITDA)]*360 days 49.9 36.9 41.8 39.5 40.9 46.3 44.0 48.4 50.6 37.7 60.1 59.0 53.6 52.9 57.1 51.0 65.9 63.0 n.a.
Days sales in inventories [Inventories/Costs of sales]*360 days 33.8 29.0 28.7 31.8 31.2 29.8 37.5 40.0 39.2 39.2 36.1 35.9 30.2 29.6 29.6 29.3 43.4 34.2 n.a.
Fianncing
Equity ratio [Euity/Total assets] % 42.2% 37.4% 37.5% 34.1% 41.5% 43.5% 40.2% 40.9% 46.8% 43.2% 45.4% 40.7% 40.1% 48.2% 51.5% 50.0% 40.3% 36.4% 40.7%
Leverage [Net debt/EBITDA] multiple 1.9x 2.0x 3.8x 3.1x 2.8x 2.1x 2.6x 2.2x 1.6x 2.2x 2.6x 1.6x 1.4x 0.9x 0.6x 0.7x 1.5x 1.4x n.a.
Gearing [Net debt/Equity] % 65.2% 71.9% 107.5% 121.1% 97.4% 67.2% 95.5% 71.4% 45.7% 64.3% 46.6% 55.4% 63.6% 30.7% 19.3% 26.5% 57.4% 67.3% n.a.
85 Global Automotive Supplier Study 2018.pptx
This presentation was prepared by Lazard & Co. GmbH ("Lazard") and Roland Berger GmbH ("RB") exclusively for the benefit and internal use of our clients and solely
as a basis for discussion of certain topics related to the automotive supplier industry described herein. This presentation is strictly confidential and may not be
reproduced, summarized or disclosed, in whole or in part, without the prior written authorization both of Lazard and RB, and by accepting this presentation you hereby
agree to be bound by the restrictions contained herein.
This presentation is based on publicly available information that has not been independently verified by Lazard or RB. Any estimates and projections contained herein
involve significant elements of subjective judgment and analysis, which may or may not be correct. Neither Lazard, nor any of its affiliates, nor any of its direct or indirect
shareholders, nor any of its or their respective members, employees or agents nor RB provides any guarantee or warranty (express or implied) or assumes any
responsibility with respect to the authenticity, origin, validity, accuracy or completeness of the information and data contained herein or assumes any obligation for
damages, losses or costs (including, without limitation, any direct or consequential losses) resulting from any errors or omissions in this presentation.
The economic estimates, projections and valuations contained in this presentation are necessarily based on current market conditions, which may change significantly
over a short period of time. In addition, this presentation contains certain forward-looking statements regarding, among other things, the future financial performance of
automotive suppliers which may include projections based on growth strategies, business plans and trends in the automotive sector and global markets. These forward-
looking statements are only predictions based on current expectations; the actual future results, levels of activity and/or financial performance of automotive suppliers
may differ materially from the predictions contained in this presentation. Changes and events occurring after the date hereof may, therefore, affect the validity of the
statements contained in this presentation and neither Lazard nor RB assumes any obligation to update and/or revise this presentation or the information and data upon
which it has been based.