Glenorchy identity development and precinct planning
57
GLENORCHY IDENTITY DEVELOPMENT AND PRECINCT PLANNING [FINAL] Prepared for [29/09/2020] ERA Planning
Transcript of Glenorchy identity development and precinct planning
GLENORCHY IDENTITY DEVELOPMENT AND PRECINCT PLANNING
[FINAL] Prepared for
[29/09/2020] ERA Planning
20200184_Report_290920.docx
© SGS Economics and Planning Pty Ltd 2020
This report has been prepared for ERA Planning. SGS Economics and Planning has taken all due care in the preparation of this report. However, SGS and its associated consultants are not liable to any person or entity for any damage or loss that has occurred, or may occur, in relation to that person or entity taking or not taking action in respect of any representation, statement, opinion or advice referred to herein.
SGS Economics and Planning Pty Ltd ACN 007 437 729 www.sgsep.com.au Offices in Canberra, Hobart, Melbourne, and Sydney, on Ngunnawal, Muwinina, Wurundjeri, and Gadigal Country
Glenorchy identity development and precinct planning i
TABLE OF CONTENTS
EXECUTIVE SUMMARY IV
1. POLICY CONTEXT 1
3.1 Policy Review 1
2. PRECINCT PROFILES 9
2.1 Glenorchy CBD 9
2.2 Moonah 15
2.3 Claremont 21
2.4 Employment activity across centres 26
2.5 Summary 29
3. RETAIL ANALYSIS 31
3.1 Retail Supply 31
3.2 Retail Demand 34
3.3 Retail Gap 39
3.1 Summary 42
4. COMMERCIAL/INDUSTRIAL GAP 43
4.1 Future Development Activity 43
4.2 Future commercial and industrial floorspace demand 44
4.3 Summary 47
CONSIDERATIONS 48
4.4 Precinct considerations 48
4.5 Strategic considerations 49
LIST OF FIGURES
FIGURE 1 GLENORCHY TO HOBART PRECINCT TYPOLOGIES 7
FIGURE 2: GLENORCHY CBD BOUNDARY AND ASSOCIATED ZONING 9
FIGURE 3: GLENORCHY CBD BOUNDARY AND ASSOCIATED TRAVEL ZONES 10
FIGURE 4: POPULATION CHANGE ACROSS GLENORCHY LGA 12
FIGURE 5: SOCIO-ECONOMIC DISADVANTAGE, GLENORCHY CBD 13
FIGURE 6: MOONAH PRECINCT 15
FIGURE 7: MOONAH PRECINCT BOUNDARY 16
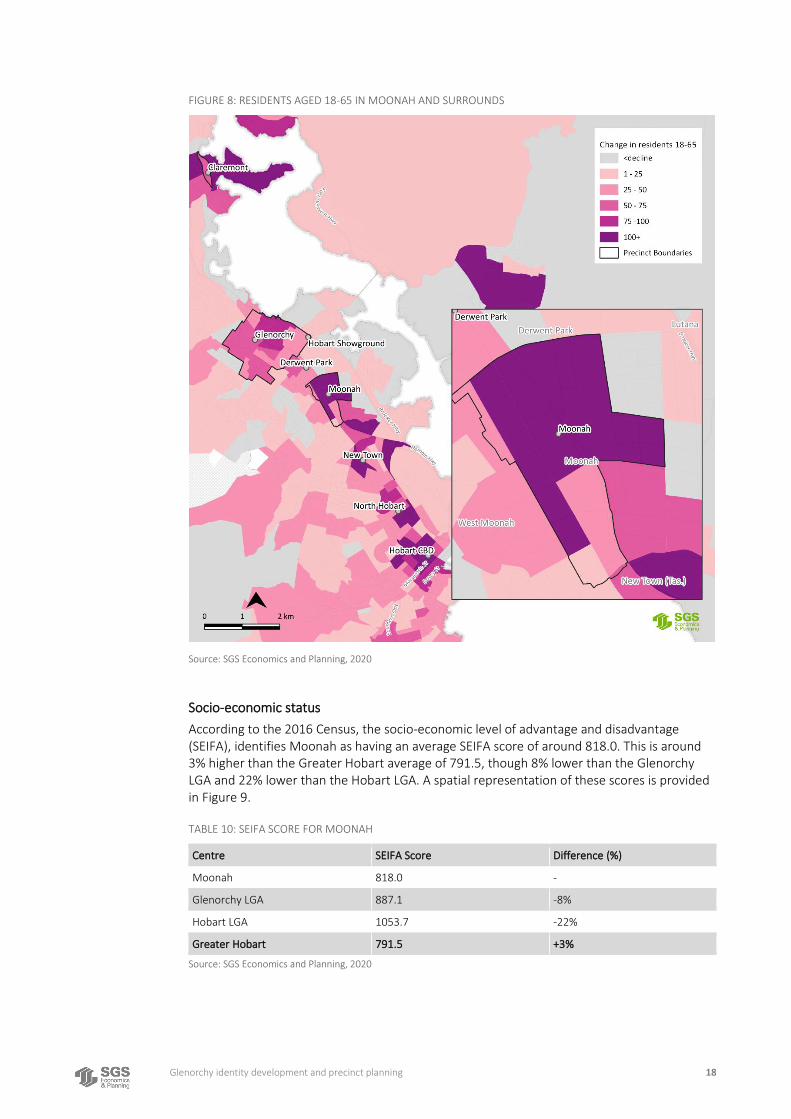
FIGURE 8: RESIDENTS AGED 18-65 IN MOONAH AND SURROUNDS 18
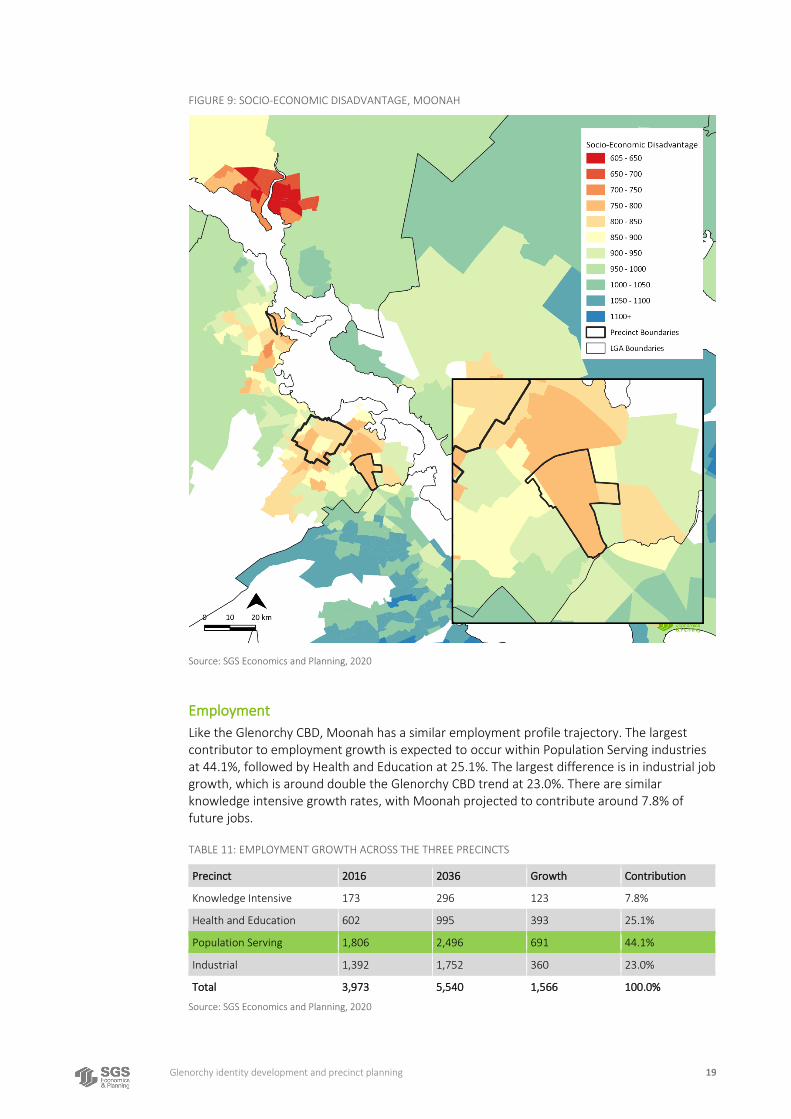
FIGURE 9: SOCIO-ECONOMIC DISADVANTAGE, MOONAH 19
FIGURE 10: MOONAH PRECINCT 21
Glenorchy identity development and precinct planning ii
FIGURE 11: RESIDENTS AGED 65+ IN CLAREMONT AND SURROUNDS 23
FIGURE 12: SOCIO-ECONOMIC DISADVANTAGE, CLAREMONT 24
FIGURE 13: EMPLOYMENT GROWTH ACROSS GREATER HOBART 26
FIGURE 14: CURRENT AND FUTURE FLOORSPACE ACROSS GREATER HOBART 33
FIGURE 15: ONLINE RETAIL MARKET SHARE UNDER DIFFERENT SCENARIOS 36
FIGURE 16: RETAIL EXPENDITURE CHANGE 2016-36 ($M) 38
FIGURE 17: 2036 RETAIL GAP ACROSS GREATER HOBART 41
FIGURE 18: COMMERCIAL & INDUSTRIAL DEVELOPMENT MAP, AUGUST 2020 44
LIST OF TABLES
TABLE 1: POPULATION GROWTH WITHIN THE GLENORCHY CBD PRECINCT 10
TABLE 2: GLENORCHY CBD DEMOGRAPHIC CHANGE 11
TABLE 3: GLENORCHY CBD DEMOGRAPHIC CHANGE, AS A PROPORTION 11
TABLE 4: SEIFA SCORE FOR MOONAH 12
TABLE 5: EMPLOYMENT GROWTH ACROSS THE THREE PRECINCTS 13
TABLE 6: GLENORCHY CBD INDUSTRY CONTRIBUTION CHANGE 2016 TO 2036 14
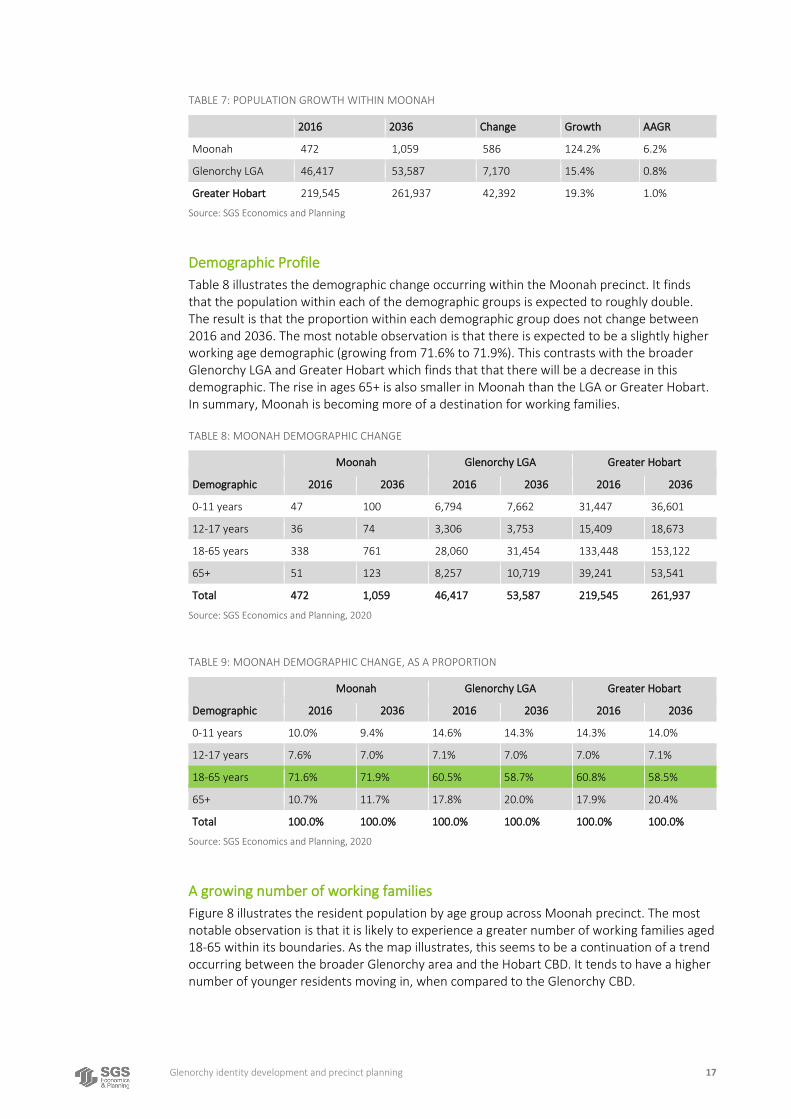
TABLE 7: POPULATION GROWTH WITHIN MOONAH 17
TABLE 8: MOONAH DEMOGRAPHIC CHANGE 17
TABLE 9: MOONAH DEMOGRAPHIC CHANGE, AS A PROPORTION 17
TABLE 10: SEIFA SCORE FOR MOONAH 18
TABLE 11: EMPLOYMENT GROWTH ACROSS THE THREE PRECINCTS 19
TABLE 12: MOONAH INDUSTRY CONTRIBUTION CHANGE 2016 TO 2036 20
TABLE 13: POPULATION GROWTH WITHIN CLAREMONT 22
TABLE 14: CLAREMONT DEMOGRAPHIC CHANGE 22
TABLE 15: CLAREMONT DEMOGRAPHIC CHANGE, AS A PROPORTION 22
TABLE 16: SEIFA SCORE FOR MOONAH 23
TABLE 17: EMPLOYMENT GROWTH ACROSS THE THREE PRECINCTS 24
TABLE 18: CLAREMONT INDUSTRY CONTRIBUTION CHANGE 2016 TO 2036 25
TABLE 19: COMPARING INDUSTRY CONTRIBUTION CHANGES 27
TABLE 20: INDUSTRY SPECIALISATION AGAINST GREATER HOBART 28
TABLE 21: FUTURE EMPLOYMENT SCENARIO 29
TABLE 22: TOTAL FLOORSPACE 32
TABLE 23: TOTAL FLOORSPACE BY COMMODITY TYPE 32
TABLE 24: FUTURE RETAIL FLOORSPACE ACROSS GREATER HOBART 32
TABLE 25: RETAIL EXPENDITURE BETWEEN GLENORCHY LGA AND GREATER HOBART ($M) 37
TABLE 26: RETAIL TURNOVER VS RETAIL EXPENDITURE ACROSS THE GLENORCHY LGA 39
TABLE 27: TOTAL RETAIL GAP ACROSS THE GLENORCHY LGA 39
TABLE 28: RETAIL GAP ACROSS THE GLENORCHY LGA, BY COMMODITY TYPE (SQM) 40
TABLE 29: RETAIL GAP BY CENTRE (SQM) 40
TABLE 30: RETAIL GAP BY CENTRE, 2036 (SQM) 41
TABLE 31: COMMERCIAL & INDUSTRIAL DEVELOPMENT ACROSS GREATER HOBART 43
TABLE 32: CATEGORISATION OF OFFICE AND INDUSTRIAL EMPLOYMENT CATEGORIES 44
TABLE 33: COMMERCIAL AND INDUSTRIAL JOB GROWTH, 2016 - 2036 45
TABLE 34: COMMERCIAL FLOORSPACE DEMAND, GLENORCHY CBD 45
Glenorchy identity development and precinct planning iii
TABLE 35: COMMERCIAL FLOORSPACE DEMAND, MOONAH 46
TABLE 36: COMMERCIAL FLOORSPACE DEMAND, CLAREMONT 46
TABLE 37: FLOORSPACE DEMAND SUMMARY 46
Glenorchy identity development and precinct planning iv
EXECUTIVE SUMMARY
The purpose of this study is to provide projections of required floorspace for retail and commercial floorspace for three precincts in Glenorchy. These projections are based on the area’s population and employment profile, projections and a retail and commercial analysis of three centres within the Glenorchy LGA. The three centres are the Glenorchy CBD, Moonah and Claremont. All three have distinct characteristics – one classified as a city centre, one as a popular high street and one as a local neighbourhood shopping centre.
The study has utilised the latest Small Area Land Use Projections, known as ‘SALUP’, to identify the current and future population and employment profile of each centre, as well as the broader LGA and metropolitan area. It finds that each of the three centres are growing, though in different ways. The relatively high levels of population and employment growth across the lower half of the Glenorchy LGA seem to indicate that the CBD is unable to consolidate its position as a city-centre. Moonah is emerging as a popular high street that is increasingly appealing to inner city working families. Claremont is the most economically distant centre and is surrounded by a growing elderly population.
The retail analysis has determined that Glenorchy CBD will have a surplus of retail floorspace by 2036, of around 1,012sqm. This equates to about 2% of its current supply. Claremont is projected to have a shortfall of around 505 sqm, equal to around 5.7% of its current supply. Moonah is expected to have a shortfall of around 4,132 sqm, equal to around 7.1% of its current supply.
A high level commercial and industrial demand analysis finds that there will be demand for an additional 10,719 sqm of commercial floorspace and 52,415 sqm of industrial floorspace in Glenorchy. Much of the commercial floorspace demand will occur in Glenorchy CBD and Moonah, with the majority of industrial floorspace in demand in Moonah.
Glenorchy identity development and precinct planning 1
1. POLICY CONTEXT
A review of key strategies and plans relevant to the Glenorchy precincts has been undertaken with the view to better understand the vision and context influencing the precincts. These include:
1. The Hobart City Deal (2019) 2. Greater Hobart Socio-Economic Profile and Opportunity Assessment (2019) 3. The Greater Hobart Destination Action Plan 2016-2018 (2016) 4. The Welcoming Cities Standard (2018) 5. Glenorchy City Council Annual Plan 2020/21-2023/24 (2020) 6. Asset Management Strategy for Infrastructure Assets 2019-2023 (2019) 7. Glenorchy City Council Open Spaces 8. Glenorchy Socio -Economic Profile & Opportunity Assessment 9. Parking Occupancy Survey Report – Glenorchy Commercial Precinct 10. Glenorchy Multicultural Community Spaces Plan 11. Glenorchy to Hobart Public Transport and Corridor Study (2016) 12. Main Road Glenorchy Concept Urban Design (2016)
3.1 Policy Review
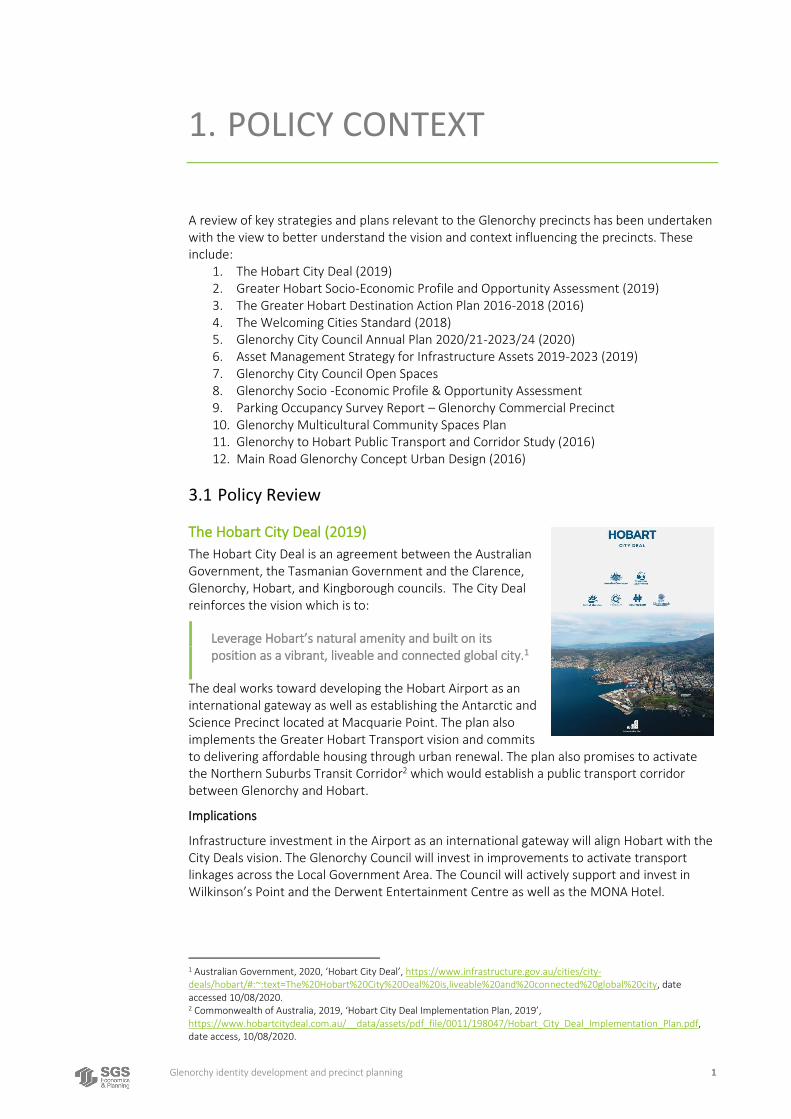
The Hobart City Deal (2019)
The Hobart City Deal is an agreement between the Australian Government, the Tasmanian Government and the Clarence, Glenorchy, Hobart, and Kingborough councils. The City Deal reinforces the vision which is to:
Leverage Hobart’s natural amenity and built on its position as a vibrant, liveable and connected global city.1
The deal works toward developing the Hobart Airport as an international gateway as well as establishing the Antarctic and Science Precinct located at Macquarie Point. The plan also implements the Greater Hobart Transport vision and commits to delivering affordable housing through urban renewal. The plan also promises to activate the Northern Suburbs Transit Corridor2 which would establish a public transport corridor between Glenorchy and Hobart.
Implications
Infrastructure investment in the Airport as an international gateway will align Hobart with the City Deals vision. The Glenorchy Council will invest in improvements to activate transport linkages across the Local Government Area. The Council will actively support and invest in Wilkinson’s Point and the Derwent Entertainment Centre as well as the MONA Hotel.
1 Australian Government, 2020, ‘Hobart City Deal’, https://www.infrastructure.gov.au/cities/city-deals/hobart/#:~:text=The%20Hobart%20City%20Deal%20is,liveable%20and%20connected%20global%20city, date accessed 10/08/2020. 2 Commonwealth of Australia, 2019, ‘Hobart City Deal Implementation Plan, 2019’, https://www.hobartcitydeal.com.au/__data/assets/pdf_file/0011/198047/Hobart_City_Deal_Implementation_Plan.pdf, date access, 10/08/2020.
Glenorchy identity development and precinct planning 2
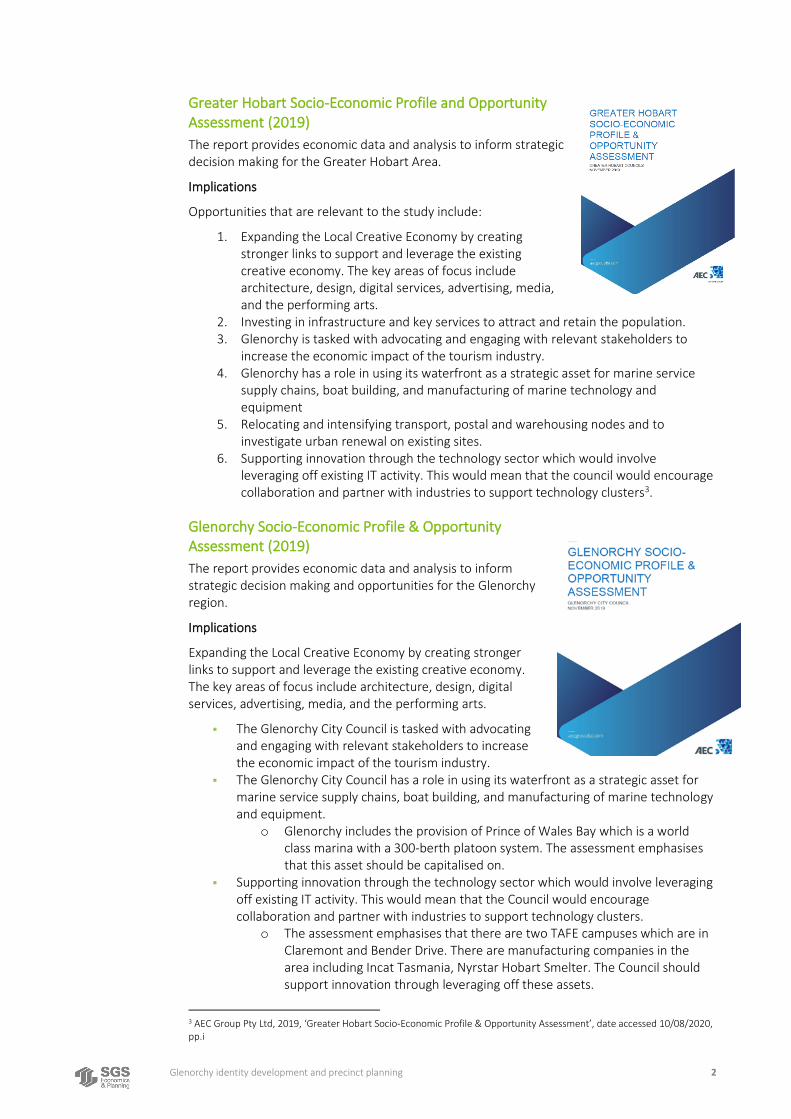
Greater Hobart Socio-Economic Profile and Opportunity Assessment (2019)
The report provides economic data and analysis to inform strategic decision making for the Greater Hobart Area.
Implications
Opportunities that are relevant to the study include:
1. Expanding the Local Creative Economy by creating stronger links to support and leverage the existing creative economy. The key areas of focus include architecture, design, digital services, advertising, media, and the performing arts.
2. Investing in infrastructure and key services to attract and retain the population. 3. Glenorchy is tasked with advocating and engaging with relevant stakeholders to
increase the economic impact of the tourism industry. 4. Glenorchy has a role in using its waterfront as a strategic asset for marine service
supply chains, boat building, and manufacturing of marine technology and equipment
5. Relocating and intensifying transport, postal and warehousing nodes and to investigate urban renewal on existing sites.
6. Supporting innovation through the technology sector which would involve leveraging off existing IT activity. This would mean that the council would encourage collaboration and partner with industries to support technology clusters3.
Glenorchy Socio-Economic Profile & Opportunity Assessment (2019)
The report provides economic data and analysis to inform strategic decision making and opportunities for the Glenorchy region.
Implications
Expanding the Local Creative Economy by creating stronger links to support and leverage the existing creative economy. The key areas of focus include architecture, design, digital services, advertising, media, and the performing arts.
▪ The Glenorchy City Council is tasked with advocating and engaging with relevant stakeholders to increase the economic impact of the tourism industry.
▪ The Glenorchy City Council has a role in using its waterfront as a strategic asset for marine service supply chains, boat building, and manufacturing of marine technology and equipment.
o Glenorchy includes the provision of Prince of Wales Bay which is a world class marina with a 300-berth platoon system. The assessment emphasises that this asset should be capitalised on.
▪ Supporting innovation through the technology sector which would involve leveraging off existing IT activity. This would mean that the Council would encourage collaboration and partner with industries to support technology clusters.
o The assessment emphasises that there are two TAFE campuses which are in Claremont and Bender Drive. There are manufacturing companies in the area including Incat Tasmania, Nyrstar Hobart Smelter. The Council should support innovation through leveraging off these assets.
3 AEC Group Pty Ltd, 2019, ‘Greater Hobart Socio-Economic Profile & Opportunity Assessment’, date accessed 10/08/2020, pp.i
Glenorchy identity development and precinct planning 3
▪ Advocate for a large-scale multi-use conference Facility in Greater Hobart. ▪ The Council should play a role in increasing educational attainment by creating
education pathways for students where there are skills shortages. Council should work towards linking business, industry and education institutions.
The Greater Hobart Destination Action Plan 2016-2018 (2016)
The Destination Action Plan was developed to identify strategies and actions for the tourism sector in the greater Hobart area. The plan builds on the Tasmanian Visitor Economy Strategy 2015-2020, and aims to grow tourism by implementing the following objectives which include:
▪ To increase visitor number ▪ To increase visitor length of stay ▪ To increase visitor dispersal ▪ To increase visitor satisfaction.4
Currently the tourism sector accounts for 13,000 jobs in the Hobart Greater Area.
Implications
Local governments should actively support the tourism industry and collaborate with each other to develop the tourism sector.
The Welcoming Cities Standard (2019)
This document sets a standard for local governments to lead a socially cohesive community which aims to reduce disparities between cultures. The Welcoming Cities Standard seeks to facilitate cultural inclusion and economic engagement in communities that face additional barriers and vulnerabilities such as Aboriginals and Torres Strait Islanders, people from migrant background, people with disabilities, and people who identify as LGBTQI.
The document identifies four objectives which include:
“Receiving communities are welcoming and actively engaged with migrant communities.
Local councils and community stakeholders have networks and resources that facilitate effective planning for welcoming and inclusion
Local council have comprehensive plans and active messaging for cultural diversity and inclusion policy, multi sector engagement, activities, and economic development approaches.
Local councils are committed to facilitating a whole of community approach to building social & cultural inclusion, economic engagement, and civic participation.” (pp.6)5
Implications
4 Destination Southern Tasmania, 2016, The Greater Hobart Destination Action Plan 2016-2018, date accessed 10/082020 pp.5. 5 Welcoming Cities, 2018, ‘The Welcoming Cities Standard’, date accessed 11/08/2020, pp.6.

Glenorchy identity development and precinct planning 4
Glenorchy has a large migrant population; this needs to be reflected in the planned precincts in Greater Glenorchy. Communities that face additional barriers and vulnerabilities need to be actively engaged by the Council. Further hubs that offer services and spaces are required in the planned precincts as well as clear policies and frameworks that worked towards facilitating a whole of community approach to development.
Glenorchy Multicultural Community Spaces Plan (2016)
The Plan aligns with the ‘Welcoming Cities Standard (2019)’and helps to achieve the council’s objective of creating a socially cohesive community. The Plan supports the provision of space and facilities that meet the needs of the target groups which include Emerging and Newly Arrived Multicultural Groups, Young People and Established groups.
Implications
The actions (see below) will have implications for Greater Glenorchy precincts:
▪ The old Moonah Arts centre will house a multicultural hub. This will be run and facilitated by a community service provider.
▪ A Youth Facility for young people from multicultural background adjacent will be added to the KGV. This centre would provide after school and drop in-activities.
▪ “Undertake master planning for the whole KGV Precinct to address needs for various user groups, including safety and CPTED and improved connectivity to the Glenorchy CBD”.6
Asset Management Strategy for Infrastructure Assets 2019-2023 (2019)
The asset management policy informs the long-term approach to managing infrastructure assets in the Glenorchy Shire. The Strategy sets guiding principles for the management often following assets including:
▪ “transport assets (public roads, footpaths & bridges) drainage assets (underground pipe network, culverts & channels, retention basis)
▪ buildings ▪ and other infrastructure (Recreational facilities
and parks infrastructure).”7
Implications
This document aligns with the Councils long term strategic plan and suggests that the Glenorchy CBD area should be invested in as it is a high use area. The council will also dispose of surplus assets and underutilised land. This will include the closure of the Derwent Park Reuse Scheme as well as the consolidation playgrounds. Stormwater System management plans and flood studies are also identified as a task within the strategy. Four-year capital works programs that are relevant to the subject sites can be seen below:
▪ Glenorchy CBD Revitalisation ▪ Upgrades to Parks, Playground, Roads, Footpaths and facilities.
6 Glenorchy Council, 2016, ‘Glenorchy Multicultural Community Spaces Plan’, date accessed 11/08/2020. 7 Glenorchy City Council, 2019, ‘Asset Management Strategy Assets 2019-2023’, date accessed 11/08/2020.
Glenorchy identity development and precinct planning 5
Glenorchy Open Space Strategy (2015)
The strategy builds off the Glenorchy Healthy Communities Plan and guides the provision, allocation, management, and planning for open spaces within the Glenorchy LGA.
Implications
The Glenorchy Open Space Strategy (2015) emphasises that Claremont would benefit from providing open space for water-based recreation and social/family recreation. The strategy suggests that Glenorchy should include the provision of more natural settings as 40% of open space is dominated by grassy open areas. This would help to increase environmental amenity. West Moonah is identified as providing good open spaces with vegetation coverings, whereas the strategy stresses that Moonah should include the provision of more urban tree canopy cover and plantings to alleviate the visual amenity issues that are subjected to the Moonah Built environment.
Parking Occupancy Survey Report – Glenorchy Commercial Precinct (2017)
The survey report identifies and establishes the utilisation rate of car parking in the Glenorchy Commercial Precinct.
Implications
Most parking in the Glenorchy Commercial Precinct is underutilised with on streetcar parking at 58.7% occupancy and off-street parking at 56.2%. Despite this, the council owned car park were utilised at a high capacity and on streetcar parking on main roads were used at a high rate. Car parks with a high utilisation rate during the day include Main Road (Eady St to Barry St), KGV Car Park, Barry Street #12 and #3 Car Park, Terry Streetcar Park and Eady Street Sports Ground Car Park.
Glenorchy City Council Annual Plan (2019)
The Glenorchy City Council Annual Plan (2019) provides the planning framework for the development of the Glenorchy City Council LGA.
The Plan aims to deliver the vision which is:
We are a proud city; a city of arts; of opportunity; of partnerships8
Implications
The priority and relevant goals and actions that relate to the Glenorchy Precincts include:
1. “Making lives Better ▪ Action 1.1.1 – Conduct quarterly community yarns ▪ Action 1.2.3 Deliver the Moonah Taste of the World Festival ▪ Action 1.31 Develop and implement a Customer Service Strategy
2. Open for Business
8 Glenorchy City Council, 2019, ‘Glenorchy Annual Plan (2019), date accessed 10/08/2020, pp.6.
Glenorchy identity development and precinct planning 6
▪ 2.1.2 Develop an Economic Development Strategy ▪ 2.2.1 Progress major projects in the municipality
3. Valuing our Environment ▪ 3.1.1Complete Stage 3b of the Glenorchy CBD Revitalisation Project ▪ 3.1.2Develop and Implement the Future Glenorchy Program ▪ 3.1.3 Progress the Northern Transit Corridor
4. Leading our community ▪ 4.3.1 Support implementation of the Hobart City Deal
5. Building image and pride ▪ 5.1.1 Implement the Product of Glenorchy Project ▪ 5.1.1 Commence Developing an Arts and Culture Strategy.”9
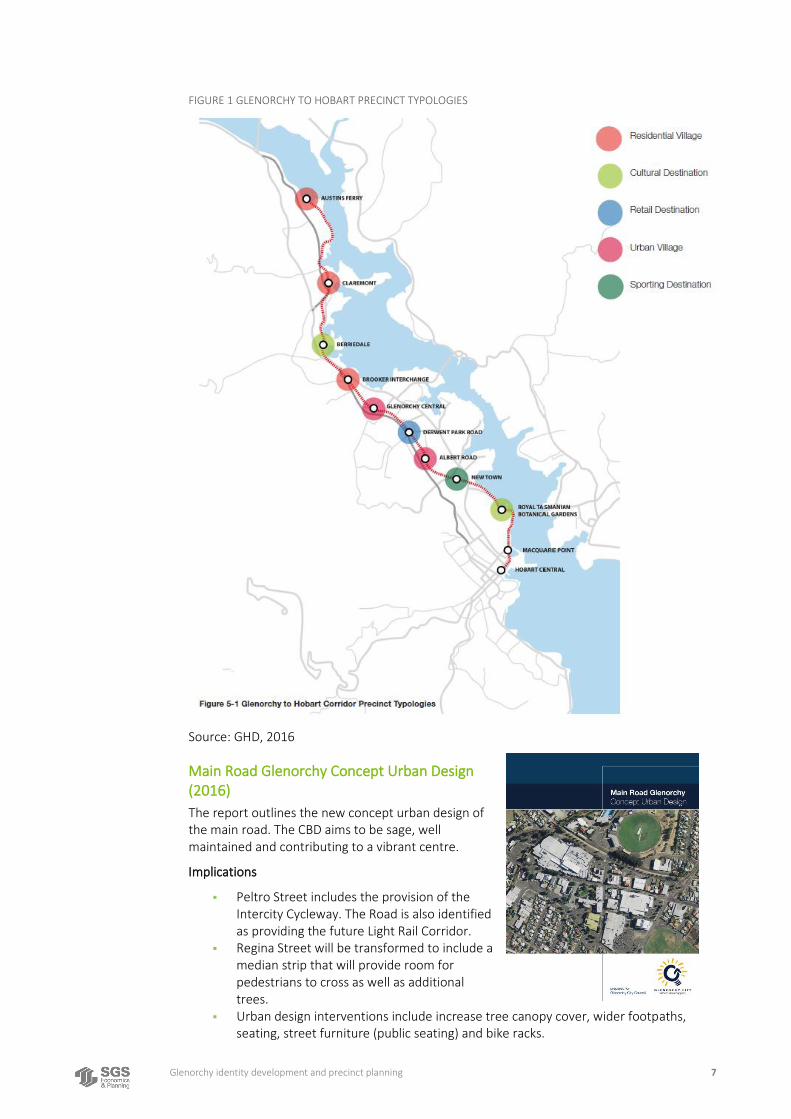
Glenorchy to Hobart Public Transport and Corridor Study (2016)
The study examines how the Glenorchy to Hobart Public Transport Corridor will potentially uplift and revitalise Glenorchy and Claremont. The report by GHD suggests that the Transport Corridor will catalyse urban renewal in the region by increasing connectivity and attracting to higher density development. Despite this, the study recognises that urban renewal is inextricably linked to the quality of transit along the transport corridor. Figure 1 identifies the precinct typologies of the Glenorchy and Claremont areas. Glenorchy Central is identified as an Urban Village which will be transit orientated developments that will be enhanced by retail development. Whereas Claremont is identified as being a residential village that will have a residential character and provide opportunities to increase residential density.
Implications
Outcomes that are relevant to the precincts include:
▪ “Zone Changes: Rezone 22 Wrights Road (McKay’s Timber Mill Site) and 97a Grove Road from Light Industrial to Inner Residential.
▪ Specific Area Plan: Applied to 22 Wrights Road area to provide Local Area Objectives, Desired Future Character Statements and scheme standards that provide for higher densities and greater heights to facilitate up to 4 storey development, ground floor retailing in appropriate locations, and provision of recreation and open space areas as an extension of Humphrey’s Rivulet parkland
▪ Applying Inner Residential zoning (which allows for greater residential density) to residential areas within approximately 10 minutes walkable distance of the Glenorchy, Moonah and Claremont activity centres (modified for topography) and other wide within approximately 5 minutes of the Main Road high frequency public transport corridor.
▪ Providing for explicit recognition of alternative transport modes in the development standards in the Parking and Access Code in the Glenorchy Activity Centre.
▪ Encourage mixed use residential development within activity centres”10 ▪ Encourage the use of the Intercity Cycleway which is adjacent to the corridor.
9 Glenorchy City Council, 2019, ‘Glenorchy Annual Plan (2019), date accessed 10/08/2020, pp.8. 10 GHD, 2016, ‘Glenorchy to Hobart Public Transport and Corridor Study’, date accessed 13/08/2020.
Glenorchy identity development and precinct planning 7
FIGURE 1 GLENORCHY TO HOBART PRECINCT TYPOLOGIES
Source: GHD, 2016
Main Road Glenorchy Concept Urban Design (2016)
The report outlines the new concept urban design of the main road. The CBD aims to be sage, well maintained and contributing to a vibrant centre.
Implications
▪ Peltro Street includes the provision of the Intercity Cycleway. The Road is also identified as providing the future Light Rail Corridor.
▪ Regina Street will be transformed to include a median strip that will provide room for pedestrians to cross as well as additional trees.
▪ Urban design interventions include increase tree canopy cover, wider footpaths, seating, street furniture (public seating) and bike racks.

Glenorchy identity development and precinct planning 8
▪ Art activities will be supported in the redevelopment of the public space with the Council’s Public Art Policy.
Summary
▪ The Hobart City Deal (2019) suggests that infrastructure investment in the Airport as an international gateway will align Hobart with the City Deals’ vision. As per the City Deal, active transport connections across the LGA will improve connectivity. Investments into Wilkinson’s Point, the Derwent Entertainment Centre and the MONA Hotel support the tourism economy.
▪ A study into the opportunities for greater Hobart and Glenorchy reveal that the Glenorchy City Council should expand the local creative economy and the tourism economy as a key priority. Assets such as Glenorchy’s waterfront should be capitalised on to support marine services. The Council should partner with industries to support technology clusters. Council also has a role in linking business, industry, and educational institutions to increase educational attainment in the Glenorchy City Council area.
▪ The Greater Hobart Destination Plan (2016) emphasises that Local governments should prioritise the tourism industry and collaborate with councils in the Greater Hobart area to develop the tourism sector.
▪ The Welcoming Cities Standard (2019) and the Glenorchy Multicultural Community Space Plan (2016) reveal that local centres should be viewed as high-quality places and as important social connecters at the heart of the local community. Glenorchy has a large migrant population; this needs to be reflected in the planned precincts in Greater Glenorchy. Communities that face additional barriers and vulnerabilities need to be actively engaged by the Council. Further, hubs that offer services and spaces are required in the planned precincts as well as clear policies and frameworks that work towards facilitating a whole of community approach to development. Precinct planning should support the provision of facilities that meet the needs of vulnerable target groups.
▪ The Asset Management Strategy reveals that there will be investment into the Glenorchy CBD through revitalisation works. Investment into the wider LGA will be also undertaken.
▪ The Glenorchy Open Space Strategy (2015) emphasises that the West Moonah area provides sufficient and appropriate Open Space. Whereas the Claremont, Glenorchy and Moonah would benefit from greater natural settings as well as water-based recreation and space for social/family recreation.
▪ The Parking Occupancy Survey Report (2017) found that car parking in the Glenorchy Commerical Precinct was well serviced.
▪ The Glenorchy City Council Annual Plan (2019) prioritises several objectives and actions which include committing to delivering the Glenorchy Hobart Transport Corridor, the CBD revitalisation project etc.
▪ In the longer term the development of the Glenorchy to Hobart Transport corridor will create opportunities for urban renewal and residential intensification. Further, Council should support the intercity cycleway as a strategic asset.
Glenorchy identity development and precinct planning 9
2. PRECINCT PROFILES
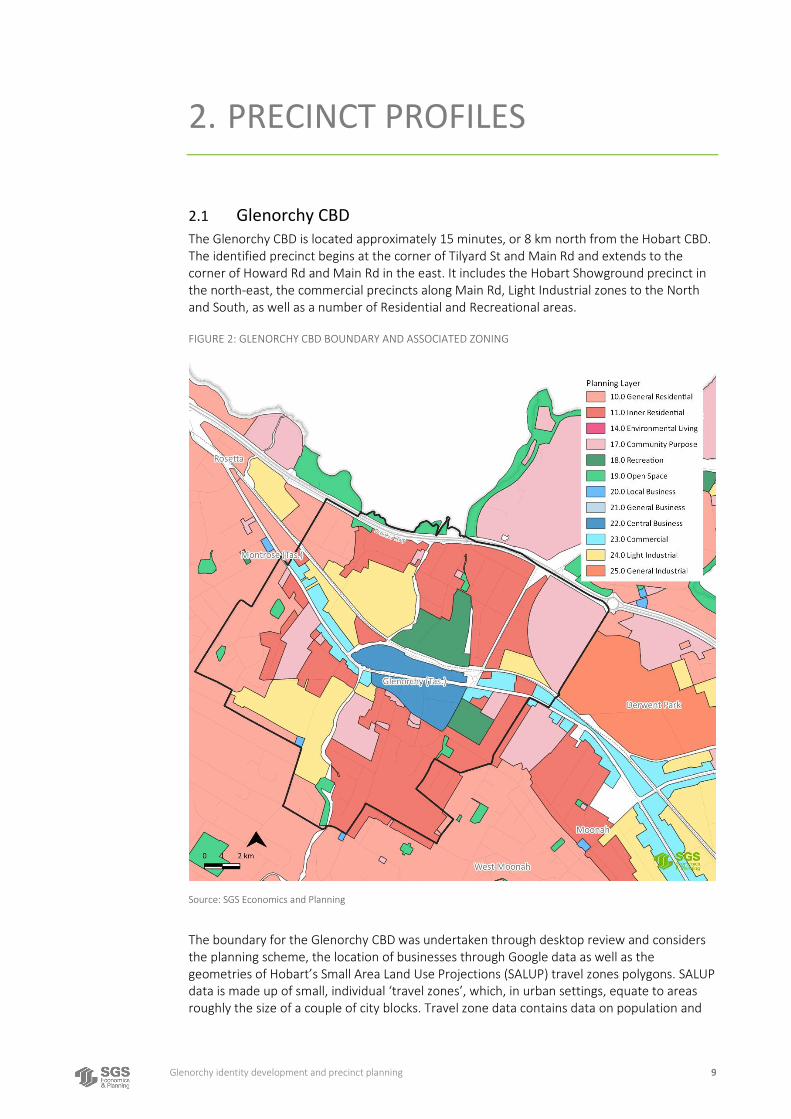
2.1 Glenorchy CBD The Glenorchy CBD is located approximately 15 minutes, or 8 km north from the Hobart CBD. The identified precinct begins at the corner of Tilyard St and Main Rd and extends to the corner of Howard Rd and Main Rd in the east. It includes the Hobart Showground precinct in the north-east, the commercial precincts along Main Rd, Light Industrial zones to the North and South, as well as a number of Residential and Recreational areas.
FIGURE 2: GLENORCHY CBD BOUNDARY AND ASSOCIATED ZONING
Source: SGS Economics and Planning
The boundary for the Glenorchy CBD was undertaken through desktop review and considers the planning scheme, the location of businesses through Google data as well as the geometries of Hobart’s Small Area Land Use Projections (SALUP) travel zones polygons. SALUP data is made up of small, individual ‘travel zones’, which, in urban settings, equate to areas roughly the size of a couple of city blocks. Travel zone data contains data on population and
Glenorchy identity development and precinct planning 10
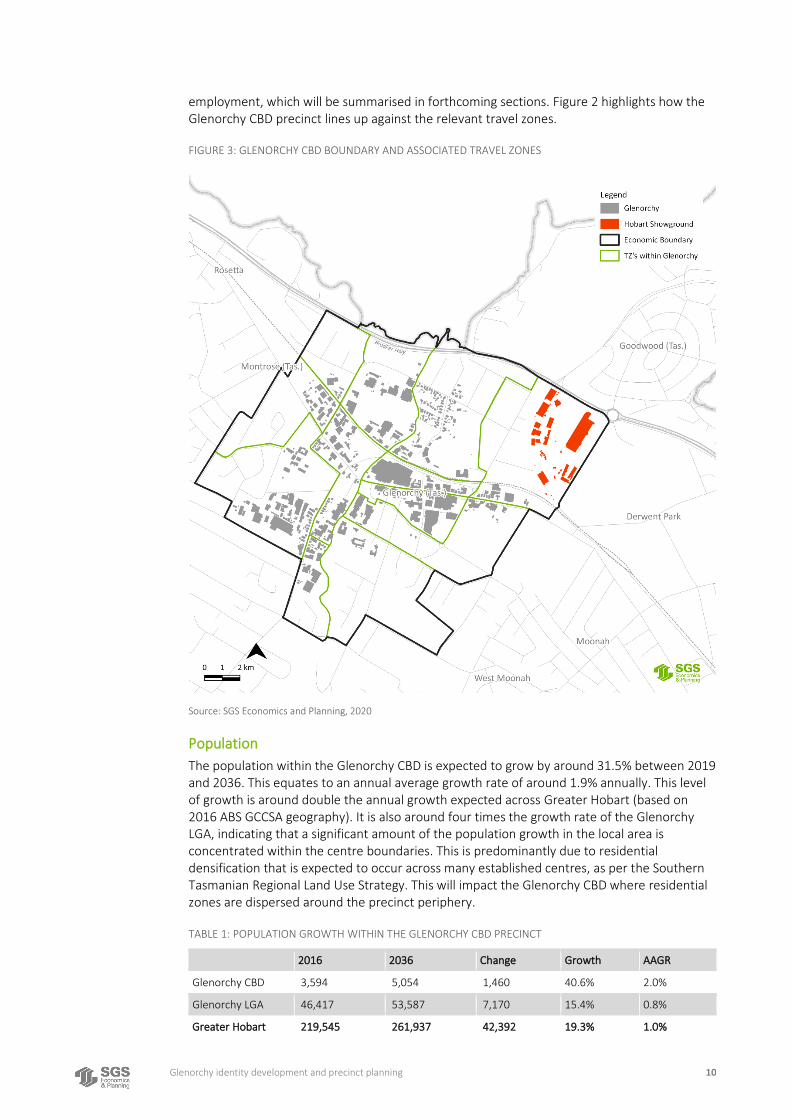
employment, which will be summarised in forthcoming sections. Figure 2 highlights how the Glenorchy CBD precinct lines up against the relevant travel zones.
FIGURE 3: GLENORCHY CBD BOUNDARY AND ASSOCIATED TRAVEL ZONES
Source: SGS Economics and Planning, 2020
Population
The population within the Glenorchy CBD is expected to grow by around 31.5% between 2019 and 2036. This equates to an annual average growth rate of around 1.9% annually. This level of growth is around double the annual growth expected across Greater Hobart (based on 2016 ABS GCCSA geography). It is also around four times the growth rate of the Glenorchy LGA, indicating that a significant amount of the population growth in the local area is concentrated within the centre boundaries. This is predominantly due to residential densification that is expected to occur across many established centres, as per the Southern Tasmanian Regional Land Use Strategy. This will impact the Glenorchy CBD where residential zones are dispersed around the precinct periphery.
TABLE 1: POPULATION GROWTH WITHIN THE GLENORCHY CBD PRECINCT
2016 2036 Change Growth AAGR
Glenorchy CBD 3,594 5,054 1,460 40.6% 2.0%
Glenorchy LGA 46,417 53,587 7,170 15.4% 0.8%
Greater Hobart 219,545 261,937 42,392 19.3% 1.0%
Glenorchy identity development and precinct planning 11
Source: SGS Economics and Planning
Figure 3 provides an overview of the economic boundary for the precinct. It is predominantly a centre built around a commercial corridor, though with Light Industrial zoning on the northern and southern edges. The remaining land use is predominantly made up of General and Inner Residential zoning, with some community purpose facilities in the north-eastern corner, making up the Hobart Showground.
Demographics
Table 2 illustrates the demographic change occurring within the Glenorchy CBD precinct. It finds that the population will be growing predominantly in the 65+ demographic, rising from around 1,030 to 1,539 people. This is around double the number of elderly residents aged 65+, when compared to the wider LGA and Greater Hobart. In 2016, residents aged 65+ made up around 28.7% of the population, compared to 17.8% across the LGA. This is expected to rise to around 30.5% by 2036, around 10% higher than the LGA and Greater Hobart. The Glenorchy CBD also tends to have less children and young adults, as well as less working residents as a proportion, when compared to the LGA and Greater Hobart.
TABLE 2: GLENORCHY CBD DEMOGRAPHIC CHANGE
Glenorchy CBD Glenorchy LGA Greater Hobart
Demographic 2016 2036 2016 2036 2016 2036
0-11 years 440 603 6,794 7,662 31,447 36,601
12-17 years 195 265 3,306 3,753 15,409 18,673
18-65 years 1,928 2,647 28,060 31,454 133,448 153,122
65+ 1,030 1,539 8,257 10,719 39,241 53,541
Total 3,594 5,054 46,417 53,587 219,545 261,937
Source: SGS Economics and Planning, 2020
TABLE 3: GLENORCHY CBD DEMOGRAPHIC CHANGE, AS A PROPORTION
Glenorchy CBD Glenorchy LGA Greater Hobart
Demographic 2016 2036 2016 2036 2016 2036
0-11 years 12.3% 11.9% 14.6% 14.3% 14.3% 14.0%
12-17 years 5.4% 5.2% 7.1% 7.0% 7.0% 7.1%
18-65 years 53.7% 52.4% 60.5% 58.7% 60.8% 58.5%
65+ 28.7% 30.5% 17.8% 20.0% 17.9% 20.4%
Total 100.0% 100.0% 100.0% 100.0% 100.0% 100.0%
Source: SGS Economics and Planning, 2020
A growing residential population within its boundary
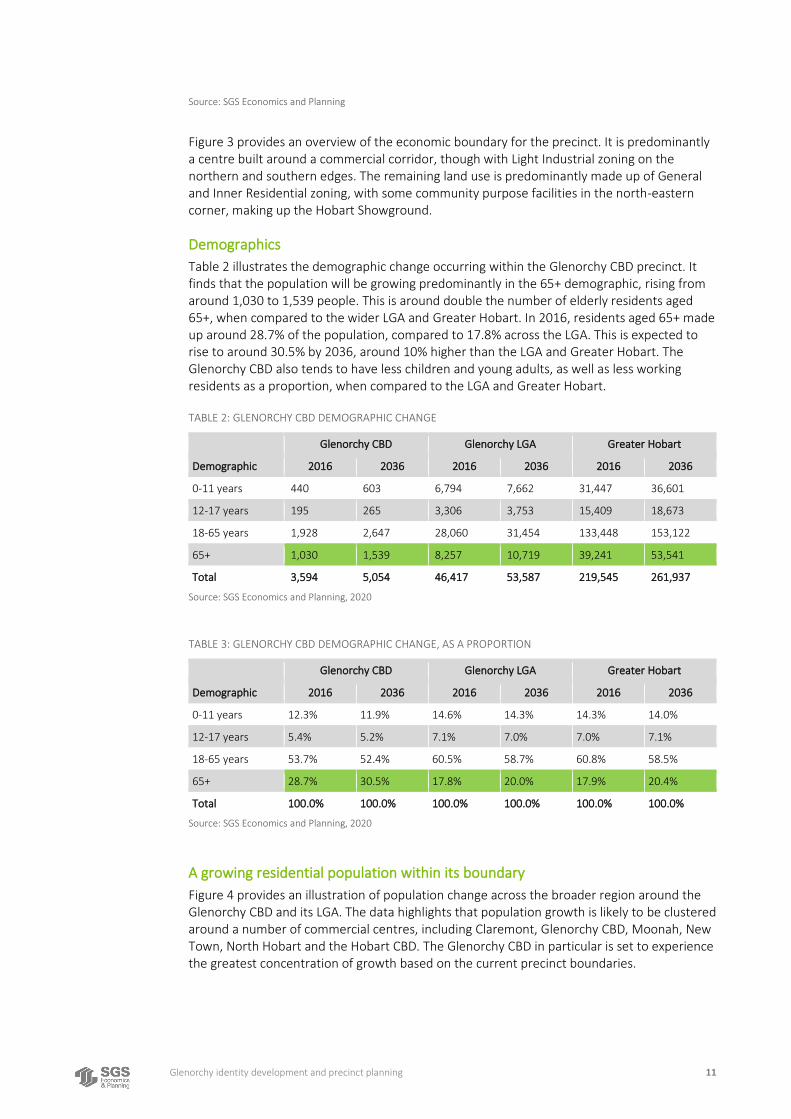
Figure 4 provides an illustration of population change across the broader region around the Glenorchy CBD and its LGA. The data highlights that population growth is likely to be clustered around a number of commercial centres, including Claremont, Glenorchy CBD, Moonah, New Town, North Hobart and the Hobart CBD. The Glenorchy CBD in particular is set to experience the greatest concentration of growth based on the current precinct boundaries.
Glenorchy identity development and precinct planning 12
FIGURE 4: POPULATION CHANGE ACROSS GLENORCHY LGA
Source: SGS Economics and Planning, 2020
Socio-economic status
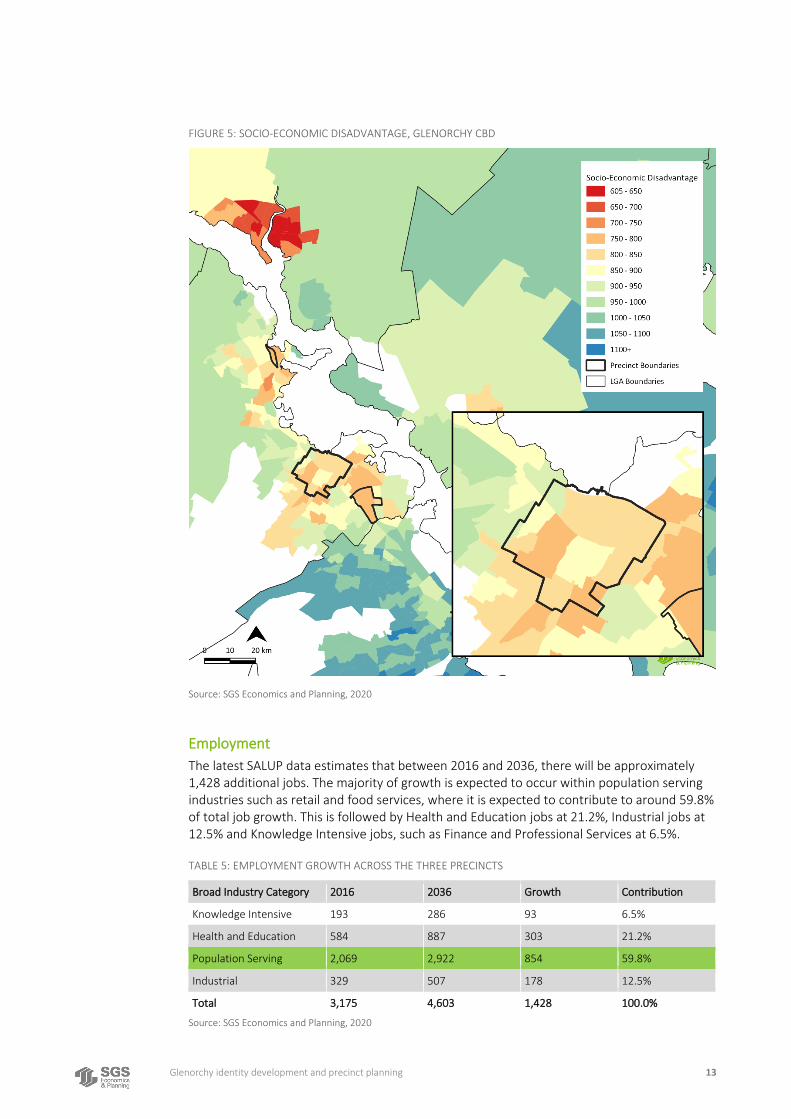
An analysis of socio-economic level of advantage and disadvantage (SEIFA) was undertaken. A high score indicates relatively advantaged communities, whereas a low SEIFA score indicates relatively greater disadvantage. According to the 2016 Census, the socio-economic level of advantage and disadvantage (SEIFA), identifies the Glenorchy CBD as having an average SEIFA score of around 836.7. This is around 6% higher than the Greater Hobart average of 791.5, though 6% lower than the Glenorchy LGA and 21% lower than the Hobart LGA. A spatial representation of these scores is provided in Figure 9. An initial observation sees clear delineations across local government boundaries, where there are higher SEIFA scores to the south in the Hobart LGA. To the north are even greater levels of disadvantage in Bridgewater and Green Point.
TABLE 4: SEIFA SCORE FOR MOONAH
Centre SEIFA Score Difference (%)
Glenorchy CBD 836.7 -
Glenorchy LGA 887.1 -6%
Hobart LGA 1053.7 -21%
Greater Hobart 791.5 +6%
Source: SGS Economics and Planning, 2020
Glenorchy identity development and precinct planning 13
FIGURE 5: SOCIO-ECONOMIC DISADVANTAGE, GLENORCHY CBD
Source: SGS Economics and Planning, 2020
Employment
The latest SALUP data estimates that between 2016 and 2036, there will be approximately 1,428 additional jobs. The majority of growth is expected to occur within population serving industries such as retail and food services, where it is expected to contribute to around 59.8% of total job growth. This is followed by Health and Education jobs at 21.2%, Industrial jobs at 12.5% and Knowledge Intensive jobs, such as Finance and Professional Services at 6.5%.
TABLE 5: EMPLOYMENT GROWTH ACROSS THE THREE PRECINCTS
Broad Industry Category 2016 2036 Growth Contribution
Knowledge Intensive 193 286 93 6.5%
Health and Education 584 887 303 21.2%
Population Serving 2,069 2,922 854 59.8%
Industrial 329 507 178 12.5%
Total 3,175 4,603 1,428 100.0%
Source: SGS Economics and Planning, 2020
Glenorchy identity development and precinct planning 14
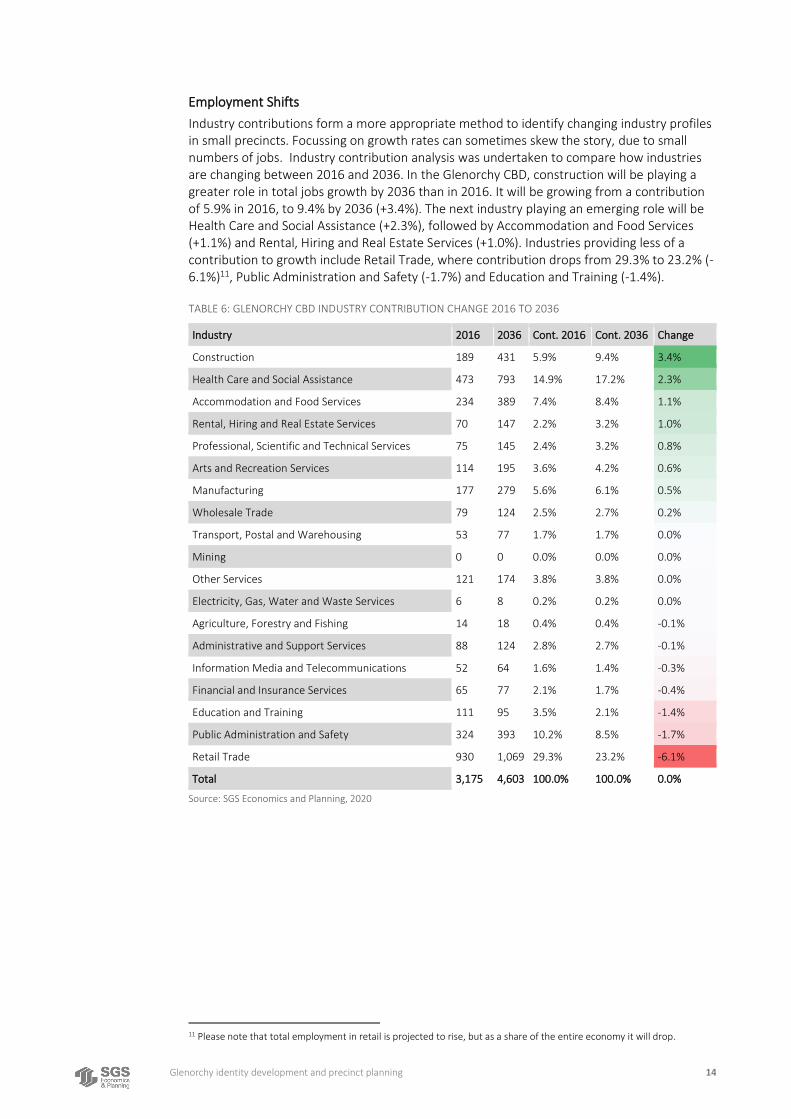
Employment Shifts
Industry contributions form a more appropriate method to identify changing industry profiles in small precincts. Focussing on growth rates can sometimes skew the story, due to small numbers of jobs. Industry contribution analysis was undertaken to compare how industries are changing between 2016 and 2036. In the Glenorchy CBD, construction will be playing a greater role in total jobs growth by 2036 than in 2016. It will be growing from a contribution of 5.9% in 2016, to 9.4% by 2036 (+3.4%). The next industry playing an emerging role will be Health Care and Social Assistance (+2.3%), followed by Accommodation and Food Services (+1.1%) and Rental, Hiring and Real Estate Services (+1.0%). Industries providing less of a contribution to growth include Retail Trade, where contribution drops from 29.3% to 23.2% (-6.1%)11, Public Administration and Safety (-1.7%) and Education and Training (-1.4%).
TABLE 6: GLENORCHY CBD INDUSTRY CONTRIBUTION CHANGE 2016 TO 2036
Industry 2016 2036 Cont. 2016 Cont. 2036 Change
Construction 189 431 5.9% 9.4% 3.4%
Health Care and Social Assistance 473 793 14.9% 17.2% 2.3%
Accommodation and Food Services 234 389 7.4% 8.4% 1.1%
Rental, Hiring and Real Estate Services 70 147 2.2% 3.2% 1.0%
Professional, Scientific and Technical Services 75 145 2.4% 3.2% 0.8%
Arts and Recreation Services 114 195 3.6% 4.2% 0.6%
Manufacturing 177 279 5.6% 6.1% 0.5%
Wholesale Trade 79 124 2.5% 2.7% 0.2%
Transport, Postal and Warehousing 53 77 1.7% 1.7% 0.0%
Mining 0 0 0.0% 0.0% 0.0%
Other Services 121 174 3.8% 3.8% 0.0%
Electricity, Gas, Water and Waste Services 6 8 0.2% 0.2% 0.0%
Agriculture, Forestry and Fishing 14 18 0.4% 0.4% -0.1%
Administrative and Support Services 88 124 2.8% 2.7% -0.1%
Information Media and Telecommunications 52 64 1.6% 1.4% -0.3%
Financial and Insurance Services 65 77 2.1% 1.7% -0.4%
Education and Training 111 95 3.5% 2.1% -1.4%
Public Administration and Safety 324 393 10.2% 8.5% -1.7%
Retail Trade 930 1,069 29.3% 23.2% -6.1%
Total 3,175 4,603 100.0% 100.0% 0.0%
Source: SGS Economics and Planning, 2020
11 Please note that total employment in retail is projected to rise, but as a share of the entire economy it will drop.
Glenorchy identity development and precinct planning 15
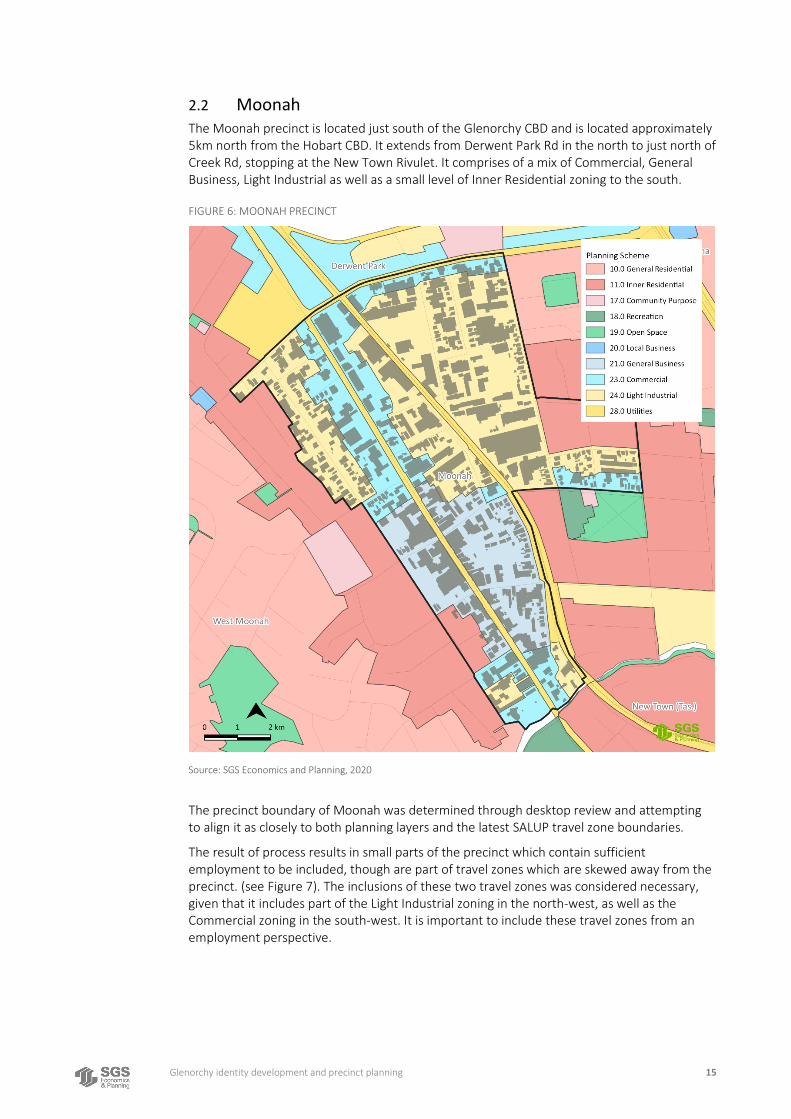
2.2 Moonah The Moonah precinct is located just south of the Glenorchy CBD and is located approximately 5km north from the Hobart CBD. It extends from Derwent Park Rd in the north to just north of Creek Rd, stopping at the New Town Rivulet. It comprises of a mix of Commercial, General Business, Light Industrial as well as a small level of Inner Residential zoning to the south.
FIGURE 6: MOONAH PRECINCT
Source: SGS Economics and Planning, 2020
The precinct boundary of Moonah was determined through desktop review and attempting to align it as closely to both planning layers and the latest SALUP travel zone boundaries.
The result of process results in small parts of the precinct which contain sufficient employment to be included, though are part of travel zones which are skewed away from the precinct. (see Figure 7). The inclusions of these two travel zones was considered necessary, given that it includes part of the Light Industrial zoning in the north-west, as well as the Commercial zoning in the south-west. It is important to include these travel zones from an employment perspective.
Glenorchy identity development and precinct planning 16
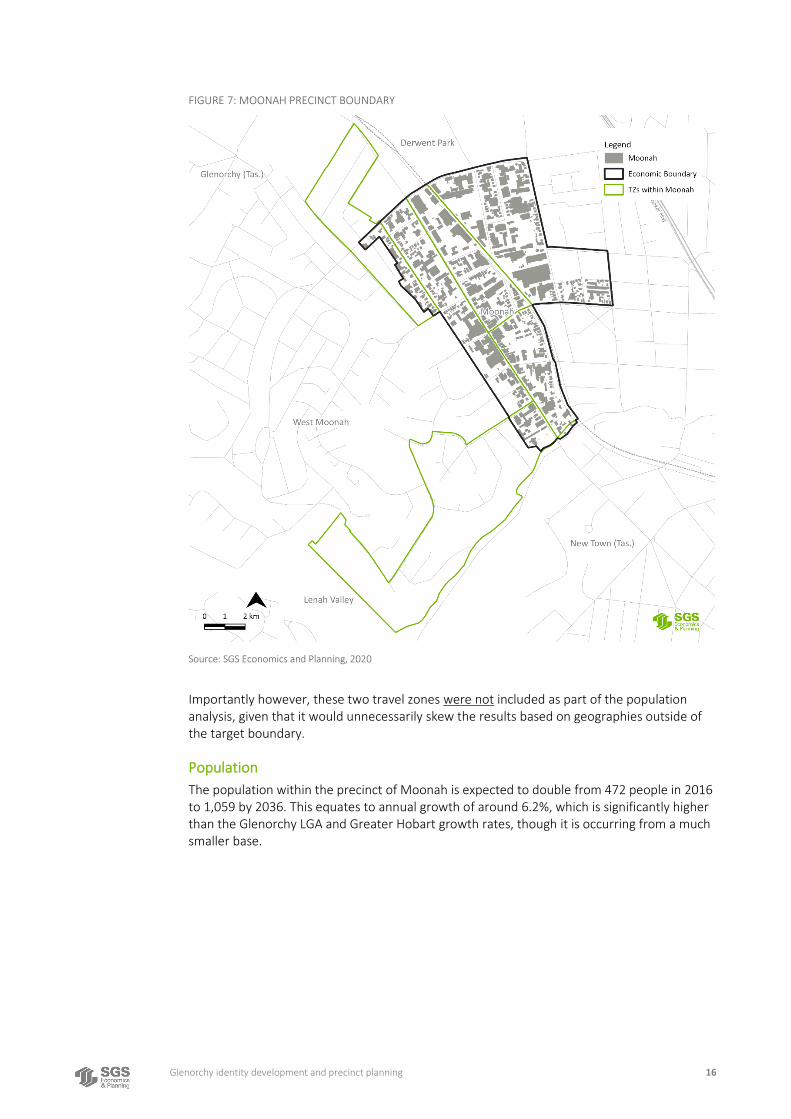
FIGURE 7: MOONAH PRECINCT BOUNDARY
Source: SGS Economics and Planning, 2020
Importantly however, these two travel zones were not included as part of the population analysis, given that it would unnecessarily skew the results based on geographies outside of the target boundary.
Population
The population within the precinct of Moonah is expected to double from 472 people in 2016 to 1,059 by 2036. This equates to annual growth of around 6.2%, which is significantly higher than the Glenorchy LGA and Greater Hobart growth rates, though it is occurring from a much smaller base.
Glenorchy identity development and precinct planning 17
TABLE 7: POPULATION GROWTH WITHIN MOONAH
2016 2036 Change Growth AAGR
Moonah 472 1,059 586 124.2% 6.2%
Glenorchy LGA 46,417 53,587 7,170 15.4% 0.8%
Greater Hobart 219,545 261,937 42,392 19.3% 1.0%
Source: SGS Economics and Planning
Demographic Profile
Table 8 illustrates the demographic change occurring within the Moonah precinct. It finds that the population within each of the demographic groups is expected to roughly double. The result is that the proportion within each demographic group does not change between 2016 and 2036. The most notable observation is that there is expected to be a slightly higher working age demographic (growing from 71.6% to 71.9%). This contrasts with the broader Glenorchy LGA and Greater Hobart which finds that that there will be a decrease in this demographic. The rise in ages 65+ is also smaller in Moonah than the LGA or Greater Hobart. In summary, Moonah is becoming more of a destination for working families.
TABLE 8: MOONAH DEMOGRAPHIC CHANGE
Moonah Glenorchy LGA Greater Hobart
Demographic 2016 2036 2016 2036 2016 2036
0-11 years 47 100 6,794 7,662 31,447 36,601
12-17 years 36 74 3,306 3,753 15,409 18,673
18-65 years 338 761 28,060 31,454 133,448 153,122
65+ 51 123 8,257 10,719 39,241 53,541
Total 472 1,059 46,417 53,587 219,545 261,937
Source: SGS Economics and Planning, 2020
TABLE 9: MOONAH DEMOGRAPHIC CHANGE, AS A PROPORTION
Moonah Glenorchy LGA Greater Hobart
Demographic 2016 2036 2016 2036 2016 2036
0-11 years 10.0% 9.4% 14.6% 14.3% 14.3% 14.0%
12-17 years 7.6% 7.0% 7.1% 7.0% 7.0% 7.1%
18-65 years 71.6% 71.9% 60.5% 58.7% 60.8% 58.5%
65+ 10.7% 11.7% 17.8% 20.0% 17.9% 20.4%
Total 100.0% 100.0% 100.0% 100.0% 100.0% 100.0%
Source: SGS Economics and Planning, 2020
A growing number of working families
Figure 8 illustrates the resident population by age group across Moonah precinct. The most notable observation is that it is likely to experience a greater number of working families aged 18-65 within its boundaries. As the map illustrates, this seems to be a continuation of a trend occurring between the broader Glenorchy area and the Hobart CBD. It tends to have a higher number of younger residents moving in, when compared to the Glenorchy CBD.
Glenorchy identity development and precinct planning 18
FIGURE 8: RESIDENTS AGED 18-65 IN MOONAH AND SURROUNDS
Source: SGS Economics and Planning, 2020
Socio-economic status
According to the 2016 Census, the socio-economic level of advantage and disadvantage (SEIFA), identifies Moonah as having an average SEIFA score of around 818.0. This is around 3% higher than the Greater Hobart average of 791.5, though 8% lower than the Glenorchy LGA and 22% lower than the Hobart LGA. A spatial representation of these scores is provided in Figure 9.
TABLE 10: SEIFA SCORE FOR MOONAH
Centre SEIFA Score Difference (%)
Moonah 818.0 -
Glenorchy LGA 887.1 -8%
Hobart LGA 1053.7 -22%
Greater Hobart 791.5 +3%
Source: SGS Economics and Planning, 2020
Glenorchy identity development and precinct planning 19
FIGURE 9: SOCIO-ECONOMIC DISADVANTAGE, MOONAH
Source: SGS Economics and Planning, 2020
Employment
Like the Glenorchy CBD, Moonah has a similar employment profile trajectory. The largest contributor to employment growth is expected to occur within Population Serving industries at 44.1%, followed by Health and Education at 25.1%. The largest difference is in industrial job growth, which is around double the Glenorchy CBD trend at 23.0%. There are similar knowledge intensive growth rates, with Moonah projected to contribute around 7.8% of future jobs.
TABLE 11: EMPLOYMENT GROWTH ACROSS THE THREE PRECINCTS
Precinct 2016 2036 Growth Contribution
Knowledge Intensive 173 296 123 7.8%
Health and Education 602 995 393 25.1%
Population Serving 1,806 2,496 691 44.1%
Industrial 1,392 1,752 360 23.0%
Total 3,973 5,540 1,566 100.0%
Source: SGS Economics and Planning, 2020
Glenorchy identity development and precinct planning 20
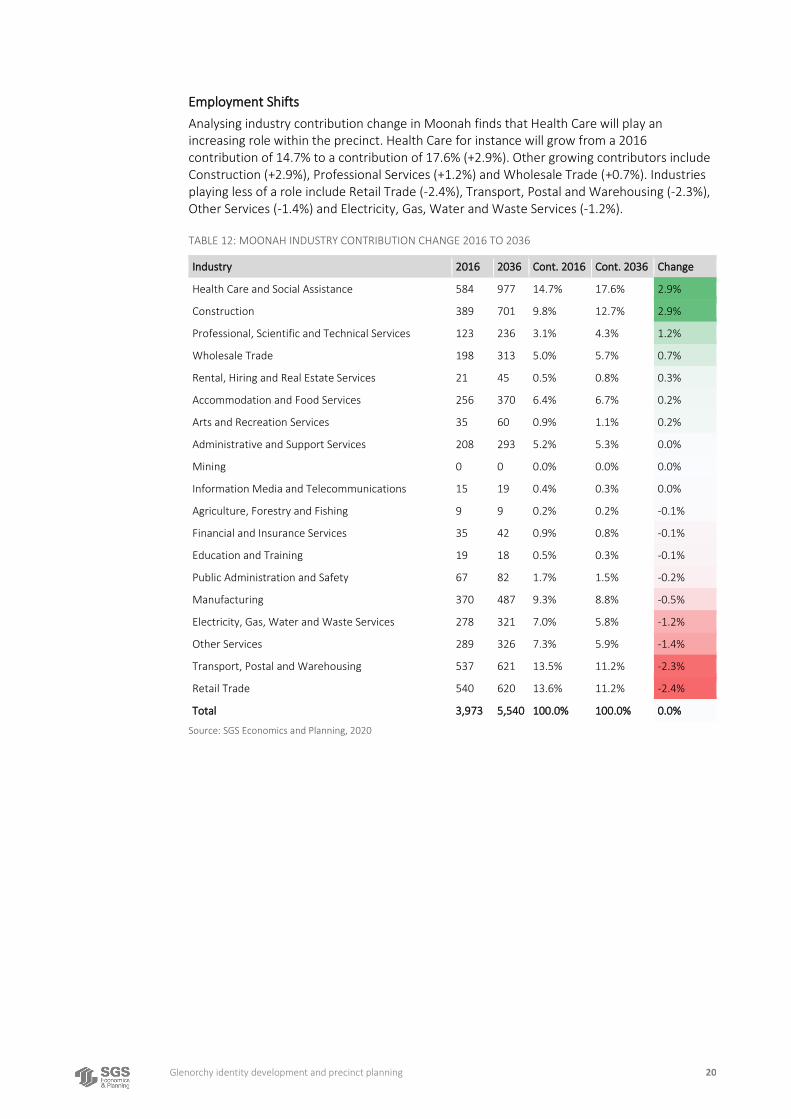
Employment Shifts
Analysing industry contribution change in Moonah finds that Health Care will play an increasing role within the precinct. Health Care for instance will grow from a 2016 contribution of 14.7% to a contribution of 17.6% (+2.9%). Other growing contributors include Construction (+2.9%), Professional Services (+1.2%) and Wholesale Trade (+0.7%). Industries playing less of a role include Retail Trade (-2.4%), Transport, Postal and Warehousing (-2.3%), Other Services (-1.4%) and Electricity, Gas, Water and Waste Services (-1.2%).
TABLE 12: MOONAH INDUSTRY CONTRIBUTION CHANGE 2016 TO 2036
Industry 2016 2036 Cont. 2016 Cont. 2036 Change
Health Care and Social Assistance 584 977 14.7% 17.6% 2.9%
Construction 389 701 9.8% 12.7% 2.9%
Professional, Scientific and Technical Services 123 236 3.1% 4.3% 1.2%
Wholesale Trade 198 313 5.0% 5.7% 0.7%
Rental, Hiring and Real Estate Services 21 45 0.5% 0.8% 0.3%
Accommodation and Food Services 256 370 6.4% 6.7% 0.2%
Arts and Recreation Services 35 60 0.9% 1.1% 0.2%
Administrative and Support Services 208 293 5.2% 5.3% 0.0%
Mining 0 0 0.0% 0.0% 0.0%
Information Media and Telecommunications 15 19 0.4% 0.3% 0.0%
Agriculture, Forestry and Fishing 9 9 0.2% 0.2% -0.1%
Financial and Insurance Services 35 42 0.9% 0.8% -0.1%
Education and Training 19 18 0.5% 0.3% -0.1%
Public Administration and Safety 67 82 1.7% 1.5% -0.2%
Manufacturing 370 487 9.3% 8.8% -0.5%
Electricity, Gas, Water and Waste Services 278 321 7.0% 5.8% -1.2%
Other Services 289 326 7.3% 5.9% -1.4%
Transport, Postal and Warehousing 537 621 13.5% 11.2% -2.3%
Retail Trade 540 620 13.6% 11.2% -2.4%
Total 3,973 5,540 100.0% 100.0% 0.0%
Source: SGS Economics and Planning, 2020
Glenorchy identity development and precinct planning 21
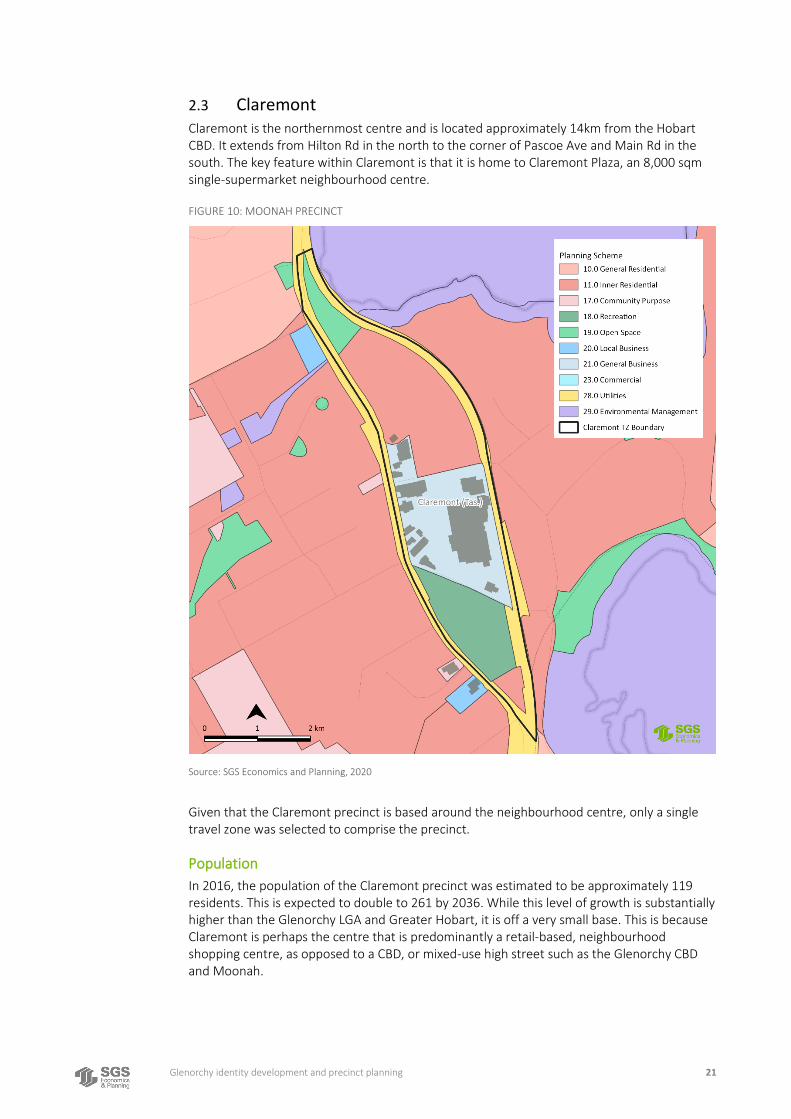
2.3 Claremont Claremont is the northernmost centre and is located approximately 14km from the Hobart CBD. It extends from Hilton Rd in the north to the corner of Pascoe Ave and Main Rd in the south. The key feature within Claremont is that it is home to Claremont Plaza, an 8,000 sqm single-supermarket neighbourhood centre.
FIGURE 10: MOONAH PRECINCT
Source: SGS Economics and Planning, 2020
Given that the Claremont precinct is based around the neighbourhood centre, only a single travel zone was selected to comprise the precinct.
Population
In 2016, the population of the Claremont precinct was estimated to be approximately 119 residents. This is expected to double to 261 by 2036. While this level of growth is substantially higher than the Glenorchy LGA and Greater Hobart, it is off a very small base. This is because Claremont is perhaps the centre that is predominantly a retail-based, neighbourhood shopping centre, as opposed to a CBD, or mixed-use high street such as the Glenorchy CBD and Moonah.

Glenorchy identity development and precinct planning 22
TABLE 13: POPULATION GROWTH WITHIN CLAREMONT
2016 2036 Change Growth AAGR
Claremont 119 261 142 118.7% 5.9%
Glenorchy LGA 46,417 53,587 7,170 15.4% 0.8%
Greater Hobart 219,545 261,937 42,392 19.3% 1.0%
Source: SGS Economics and Planning
Demographics
Because of this smaller population base, it is difficult to have certainty of the future population demographic. Table 2 illustrates demographic change, with the highest level of growth occurring within the ages of 18-65 and 65+. These two demographics account for almost all of the future growth. Investigating the data as a proportion finds that Claremont has a much older demographic when compared to the Glenorchy LGA and Greater Hobart. Residents aged 65+ make up around 44.6% in 2016, compared to around 18% in the Glenorchy LGA and Greater Hobart. By 2036, this is expected to grow to almost 47.9%, which is approximately 28% higher than Glenorchy LGA and the Greater Hobart.
TABLE 14: CLAREMONT DEMOGRAPHIC CHANGE
Moonah Glenorchy LGA Greater Hobart
Demographic 2016 2036 2016 2036 2016 2036
0-11 years 5 11 6,794 7,662 31,447 36,601
12-17 years 1 1 3,306 3,753 15,409 18,673
18-65 years 60 123 28,060 31,454 133,448 153,122
65+ 53 125 8,257 10,719 39,241 53,541
Total 119 261 46,417 53,587 219,545 261,937
Source: SGS Economics and Planning, 2020
TABLE 15: CLAREMONT DEMOGRAPHIC CHANGE, AS A PROPORTION
Moonah Glenorchy LGA Greater Hobart
Demographic 2016 2036 2016 2036 2016 2036
0-11 years 4.5% 4.3% 14.6% 14.3% 14.3% 14.0%
12-17 years 0.6% 0.6% 7.1% 7.0% 7.0% 7.1%
18-65 years 50.4% 47.2% 60.5% 58.7% 60.8% 58.5%
65+ 44.6% 47.9% 17.8% 20.0% 17.9% 20.4%
Total 100.0% 100.0% 100.0% 100.0% 100.0% 100.0%
Source: SGS Economics and Planning, 2020
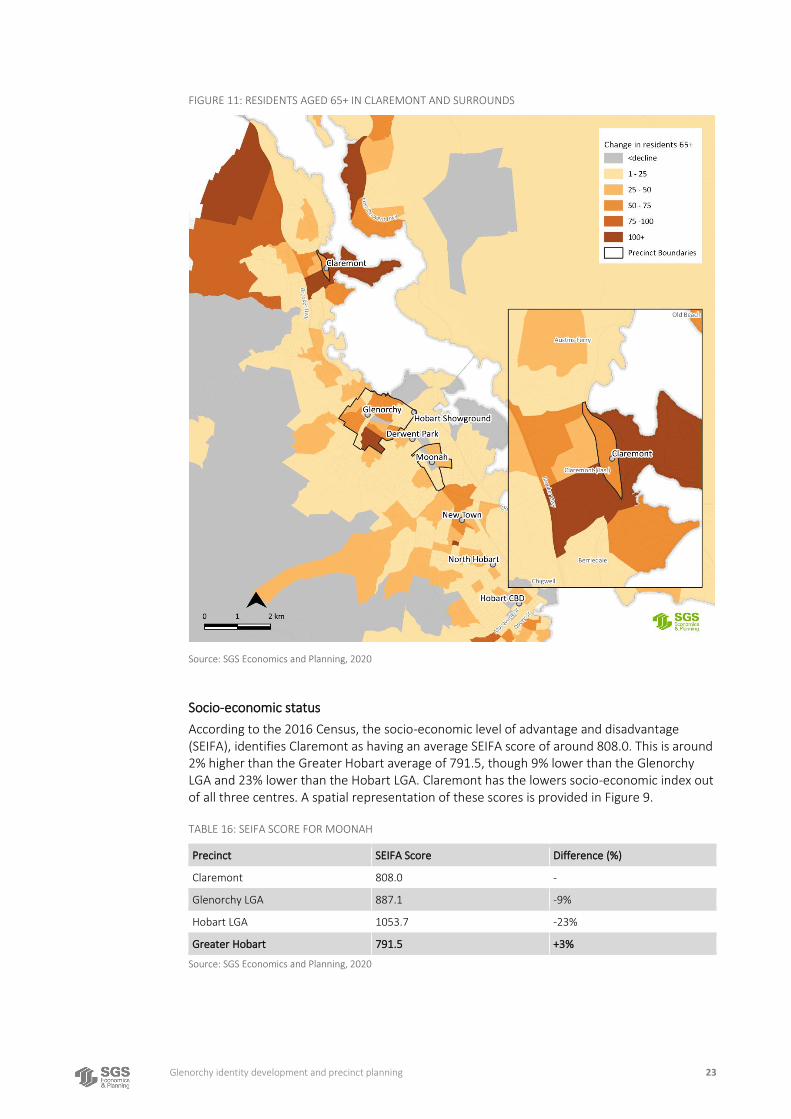
A growing elderly population
Figure 8 illustrates the resident population aged 65+ around Claremont. It indicates that the northern tip of the Glenorchy LGA is an area where there is a greater number of elderly residents. This contrasts with more southern areas of the LGA, where there is a much lower level of growth in elderly residents, aside from a small pocket in the southern edge of the Glenorchy CBD.
Glenorchy identity development and precinct planning 23
FIGURE 11: RESIDENTS AGED 65+ IN CLAREMONT AND SURROUNDS
Source: SGS Economics and Planning, 2020
Socio-economic status
According to the 2016 Census, the socio-economic level of advantage and disadvantage (SEIFA), identifies Claremont as having an average SEIFA score of around 808.0. This is around 2% higher than the Greater Hobart average of 791.5, though 9% lower than the Glenorchy LGA and 23% lower than the Hobart LGA. Claremont has the lowers socio-economic index out of all three centres. A spatial representation of these scores is provided in Figure 9.
TABLE 16: SEIFA SCORE FOR MOONAH
Precinct SEIFA Score Difference (%)
Claremont 808.0 -
Glenorchy LGA 887.1 -9%
Hobart LGA 1053.7 -23%
Greater Hobart 791.5 +3%
Source: SGS Economics and Planning, 2020
Glenorchy identity development and precinct planning 24
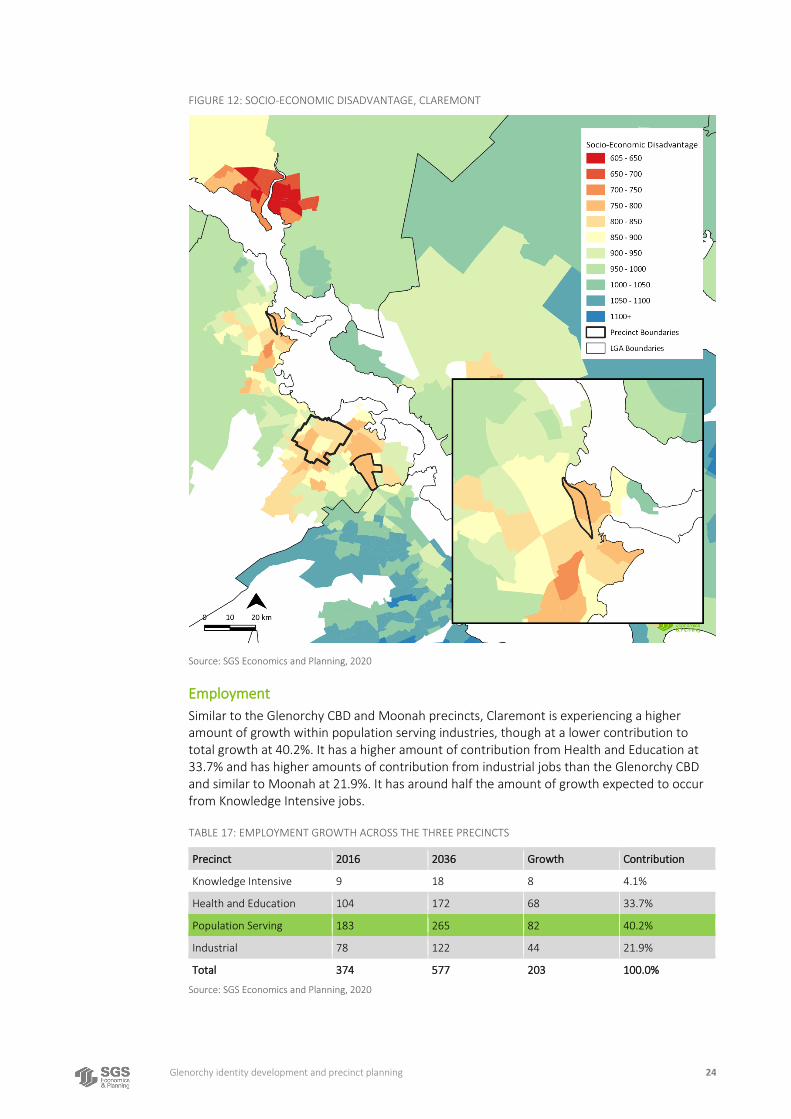
FIGURE 12: SOCIO-ECONOMIC DISADVANTAGE, CLAREMONT
Source: SGS Economics and Planning, 2020
Employment
Similar to the Glenorchy CBD and Moonah precincts, Claremont is experiencing a higher amount of growth within population serving industries, though at a lower contribution to total growth at 40.2%. It has a higher amount of contribution from Health and Education at 33.7% and has higher amounts of contribution from industrial jobs than the Glenorchy CBD and similar to Moonah at 21.9%. It has around half the amount of growth expected to occur from Knowledge Intensive jobs.
TABLE 17: EMPLOYMENT GROWTH ACROSS THE THREE PRECINCTS
Precinct 2016 2036 Growth Contribution
Knowledge Intensive 9 18 8 4.1%
Health and Education 104 172 68 33.7%
Population Serving 183 265 82 40.2%
Industrial 78 122 44 21.9%
Total 374 577 203 100.0%
Source: SGS Economics and Planning, 2020
Glenorchy identity development and precinct planning 25
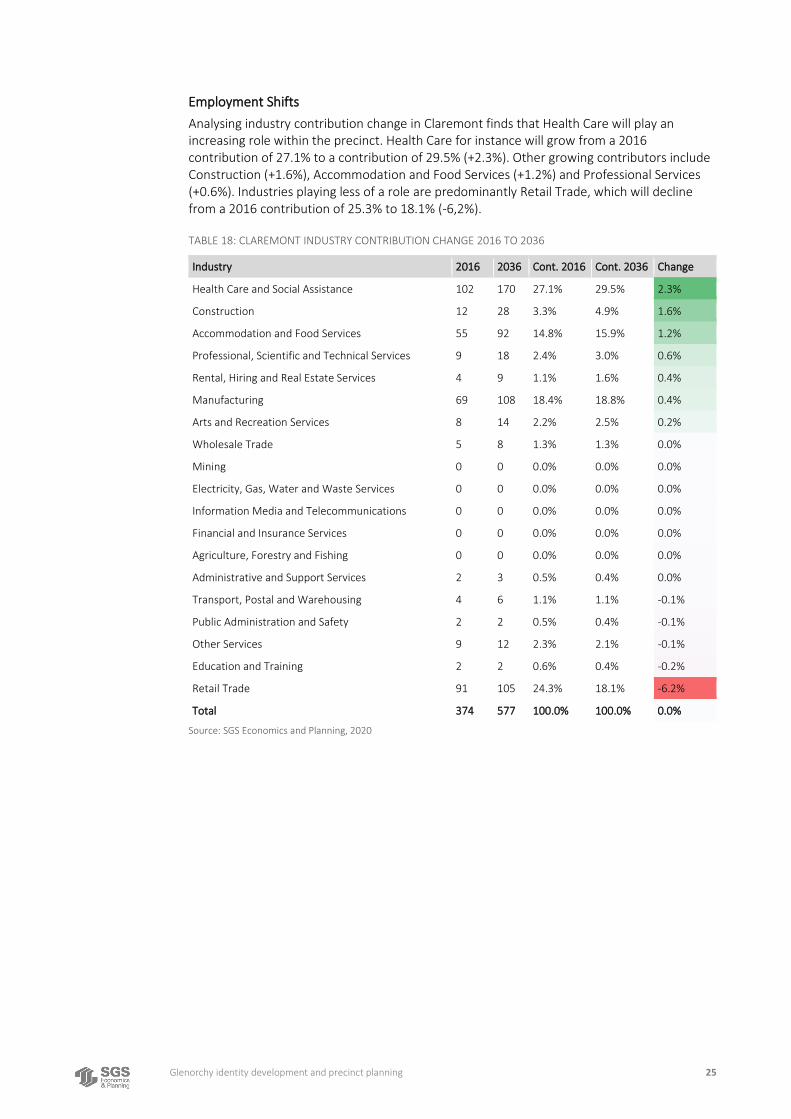
Employment Shifts
Analysing industry contribution change in Claremont finds that Health Care will play an increasing role within the precinct. Health Care for instance will grow from a 2016 contribution of 27.1% to a contribution of 29.5% (+2.3%). Other growing contributors include Construction (+1.6%), Accommodation and Food Services (+1.2%) and Professional Services (+0.6%). Industries playing less of a role are predominantly Retail Trade, which will decline from a 2016 contribution of 25.3% to 18.1% (-6,2%).
TABLE 18: CLAREMONT INDUSTRY CONTRIBUTION CHANGE 2016 TO 2036
Industry 2016 2036 Cont. 2016 Cont. 2036 Change
Health Care and Social Assistance 102 170 27.1% 29.5% 2.3%
Construction 12 28 3.3% 4.9% 1.6%
Accommodation and Food Services 55 92 14.8% 15.9% 1.2%
Professional, Scientific and Technical Services 9 18 2.4% 3.0% 0.6%
Rental, Hiring and Real Estate Services 4 9 1.1% 1.6% 0.4%
Manufacturing 69 108 18.4% 18.8% 0.4%
Arts and Recreation Services 8 14 2.2% 2.5% 0.2%
Wholesale Trade 5 8 1.3% 1.3% 0.0%
Mining 0 0 0.0% 0.0% 0.0%
Electricity, Gas, Water and Waste Services 0 0 0.0% 0.0% 0.0%
Information Media and Telecommunications 0 0 0.0% 0.0% 0.0%
Financial and Insurance Services 0 0 0.0% 0.0% 0.0%
Agriculture, Forestry and Fishing 0 0 0.0% 0.0% 0.0%
Administrative and Support Services 2 3 0.5% 0.4% 0.0%
Transport, Postal and Warehousing 4 6 1.1% 1.1% -0.1%
Public Administration and Safety 2 2 0.5% 0.4% -0.1%
Other Services 9 12 2.3% 2.1% -0.1%
Education and Training 2 2 0.6% 0.4% -0.2%
Retail Trade 91 105 24.3% 18.1% -6.2%
Total 374 577 100.0% 100.0% 0.0%
Source: SGS Economics and Planning, 2020
Glenorchy identity development and precinct planning 26
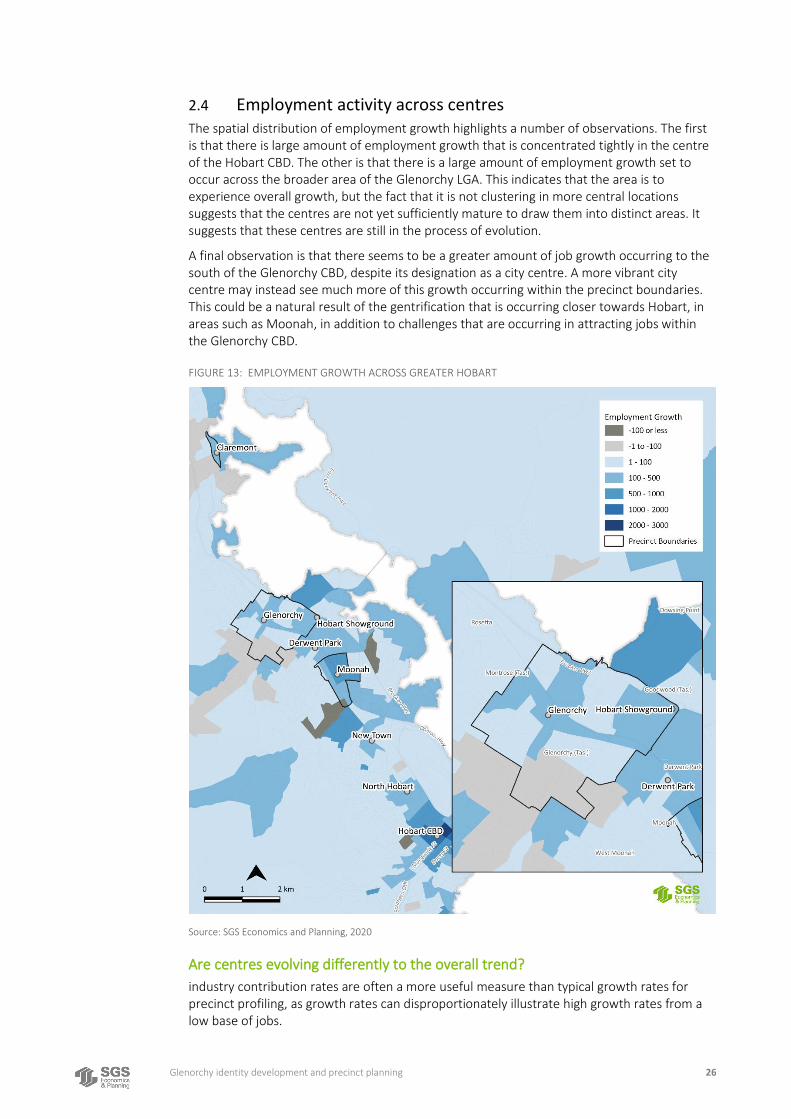
2.4 Employment activity across centres The spatial distribution of employment growth highlights a number of observations. The first is that there is large amount of employment growth that is concentrated tightly in the centre of the Hobart CBD. The other is that there is a large amount of employment growth set to occur across the broader area of the Glenorchy LGA. This indicates that the area is to experience overall growth, but the fact that it is not clustering in more central locations suggests that the centres are not yet sufficiently mature to draw them into distinct areas. It suggests that these centres are still in the process of evolution.
A final observation is that there seems to be a greater amount of job growth occurring to the south of the Glenorchy CBD, despite its designation as a city centre. A more vibrant city centre may instead see much more of this growth occurring within the precinct boundaries. This could be a natural result of the gentrification that is occurring closer towards Hobart, in areas such as Moonah, in addition to challenges that are occurring in attracting jobs within the Glenorchy CBD.
FIGURE 13: EMPLOYMENT GROWTH ACROSS GREATER HOBART
Source: SGS Economics and Planning, 2020
Are centres evolving differently to the overall trend?
industry contribution rates are often a more useful measure than typical growth rates for precinct profiling, as growth rates can disproportionately illustrate high growth rates from a low base of jobs.
Glenorchy identity development and precinct planning 27
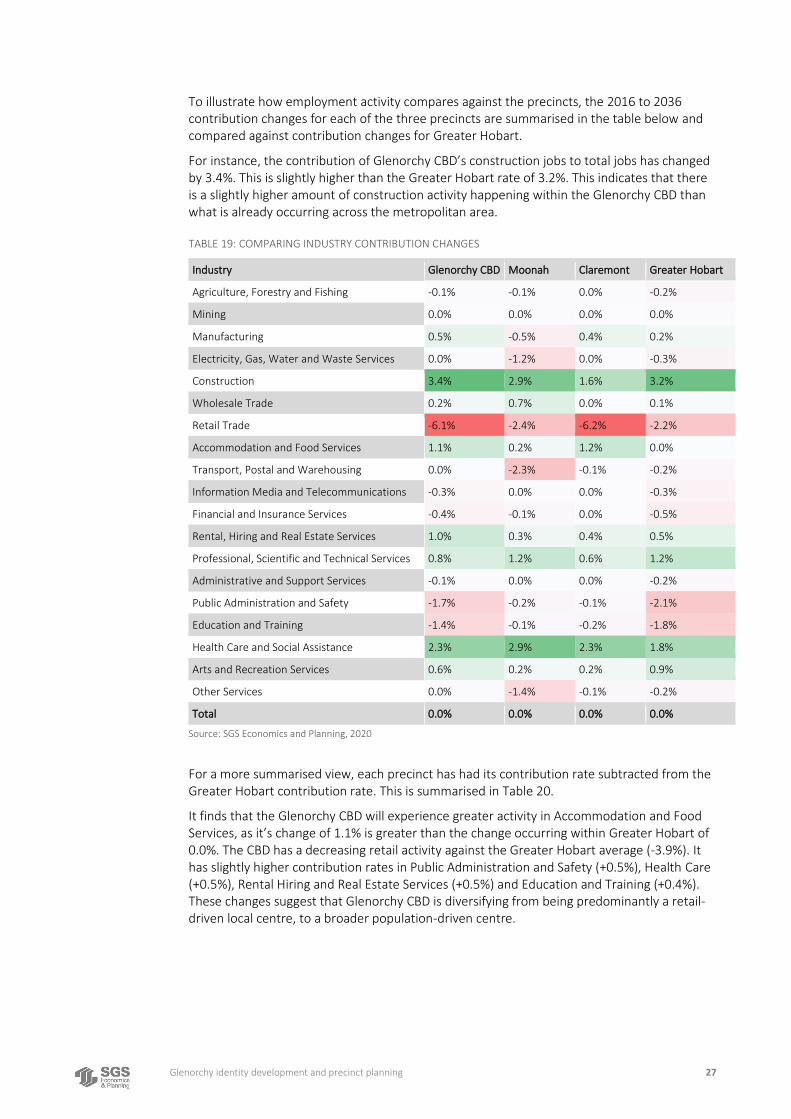
To illustrate how employment activity compares against the precincts, the 2016 to 2036 contribution changes for each of the three precincts are summarised in the table below and compared against contribution changes for Greater Hobart.
For instance, the contribution of Glenorchy CBD’s construction jobs to total jobs has changed by 3.4%. This is slightly higher than the Greater Hobart rate of 3.2%. This indicates that there is a slightly higher amount of construction activity happening within the Glenorchy CBD than what is already occurring across the metropolitan area.
TABLE 19: COMPARING INDUSTRY CONTRIBUTION CHANGES
Industry Glenorchy CBD Moonah Claremont Greater Hobart
Agriculture, Forestry and Fishing -0.1% -0.1% 0.0% -0.2%
Mining 0.0% 0.0% 0.0% 0.0%
Manufacturing 0.5% -0.5% 0.4% 0.2%
Electricity, Gas, Water and Waste Services 0.0% -1.2% 0.0% -0.3%
Construction 3.4% 2.9% 1.6% 3.2%
Wholesale Trade 0.2% 0.7% 0.0% 0.1%
Retail Trade -6.1% -2.4% -6.2% -2.2%
Accommodation and Food Services 1.1% 0.2% 1.2% 0.0%
Transport, Postal and Warehousing 0.0% -2.3% -0.1% -0.2%
Information Media and Telecommunications -0.3% 0.0% 0.0% -0.3%
Financial and Insurance Services -0.4% -0.1% 0.0% -0.5%
Rental, Hiring and Real Estate Services 1.0% 0.3% 0.4% 0.5%
Professional, Scientific and Technical Services 0.8% 1.2% 0.6% 1.2%
Administrative and Support Services -0.1% 0.0% 0.0% -0.2%
Public Administration and Safety -1.7% -0.2% -0.1% -2.1%
Education and Training -1.4% -0.1% -0.2% -1.8%
Health Care and Social Assistance 2.3% 2.9% 2.3% 1.8%
Arts and Recreation Services 0.6% 0.2% 0.2% 0.9%
Other Services 0.0% -1.4% -0.1% -0.2%
Total 0.0% 0.0% 0.0% 0.0%
Source: SGS Economics and Planning, 2020
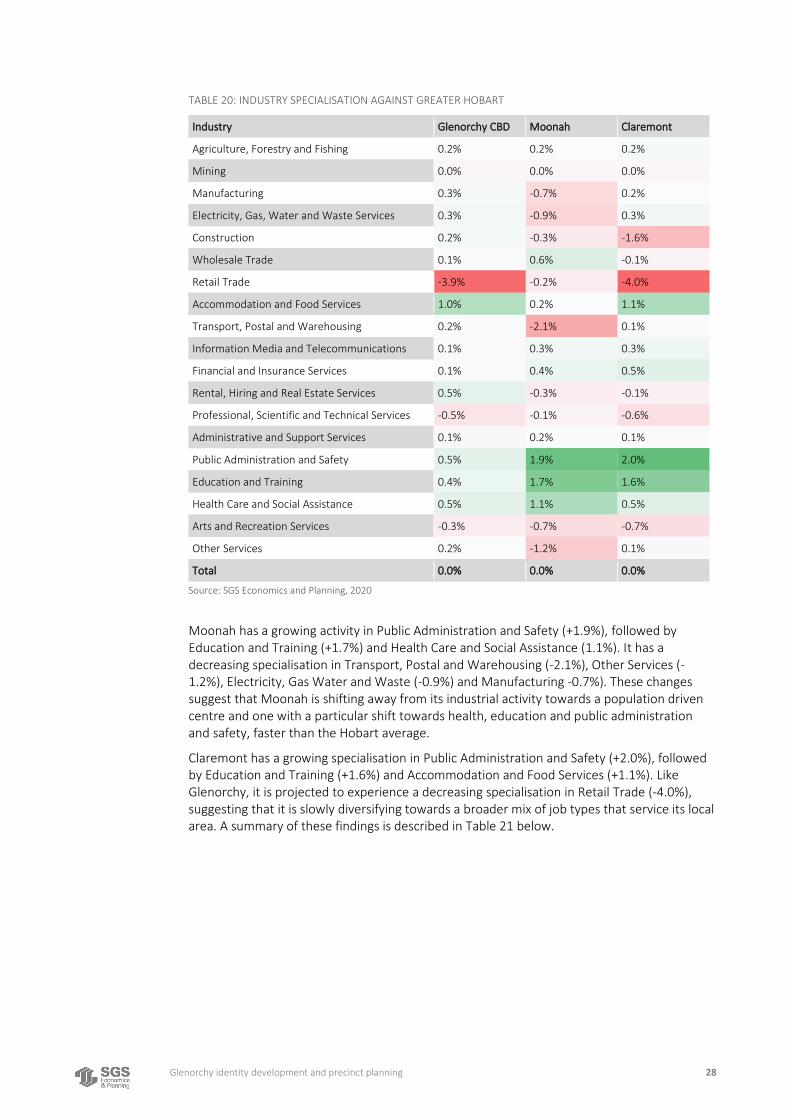
For a more summarised view, each precinct has had its contribution rate subtracted from the Greater Hobart contribution rate. This is summarised in Table 20.
It finds that the Glenorchy CBD will experience greater activity in Accommodation and Food Services, as it’s change of 1.1% is greater than the change occurring within Greater Hobart of 0.0%. The CBD has a decreasing retail activity against the Greater Hobart average (-3.9%). It has slightly higher contribution rates in Public Administration and Safety (+0.5%), Health Care (+0.5%), Rental Hiring and Real Estate Services (+0.5%) and Education and Training (+0.4%). These changes suggest that Glenorchy CBD is diversifying from being predominantly a retail-driven local centre, to a broader population-driven centre.
Glenorchy identity development and precinct planning 28
TABLE 20: INDUSTRY SPECIALISATION AGAINST GREATER HOBART
Industry Glenorchy CBD Moonah Claremont
Agriculture, Forestry and Fishing 0.2% 0.2% 0.2%
Mining 0.0% 0.0% 0.0%
Manufacturing 0.3% -0.7% 0.2%
Electricity, Gas, Water and Waste Services 0.3% -0.9% 0.3%
Construction 0.2% -0.3% -1.6%
Wholesale Trade 0.1% 0.6% -0.1%
Retail Trade -3.9% -0.2% -4.0%
Accommodation and Food Services 1.0% 0.2% 1.1%
Transport, Postal and Warehousing 0.2% -2.1% 0.1%
Information Media and Telecommunications 0.1% 0.3% 0.3%
Financial and Insurance Services 0.1% 0.4% 0.5%
Rental, Hiring and Real Estate Services 0.5% -0.3% -0.1%
Professional, Scientific and Technical Services -0.5% -0.1% -0.6%
Administrative and Support Services 0.1% 0.2% 0.1%
Public Administration and Safety 0.5% 1.9% 2.0%
Education and Training 0.4% 1.7% 1.6%
Health Care and Social Assistance 0.5% 1.1% 0.5%
Arts and Recreation Services -0.3% -0.7% -0.7%
Other Services 0.2% -1.2% 0.1%
Total 0.0% 0.0% 0.0%
Source: SGS Economics and Planning, 2020
Moonah has a growing activity in Public Administration and Safety (+1.9%), followed by Education and Training (+1.7%) and Health Care and Social Assistance (1.1%). It has a decreasing specialisation in Transport, Postal and Warehousing (-2.1%), Other Services (-1.2%), Electricity, Gas Water and Waste (-0.9%) and Manufacturing -0.7%). These changes suggest that Moonah is shifting away from its industrial activity towards a population driven centre and one with a particular shift towards health, education and public administration and safety, faster than the Hobart average.
Claremont has a growing specialisation in Public Administration and Safety (+2.0%), followed by Education and Training (+1.6%) and Accommodation and Food Services (+1.1%). Like Glenorchy, it is projected to experience a decreasing specialisation in Retail Trade (-4.0%), suggesting that it is slowly diversifying towards a broader mix of job types that service its local area. A summary of these findings is described in Table 21 below.
Glenorchy identity development and precinct planning 29
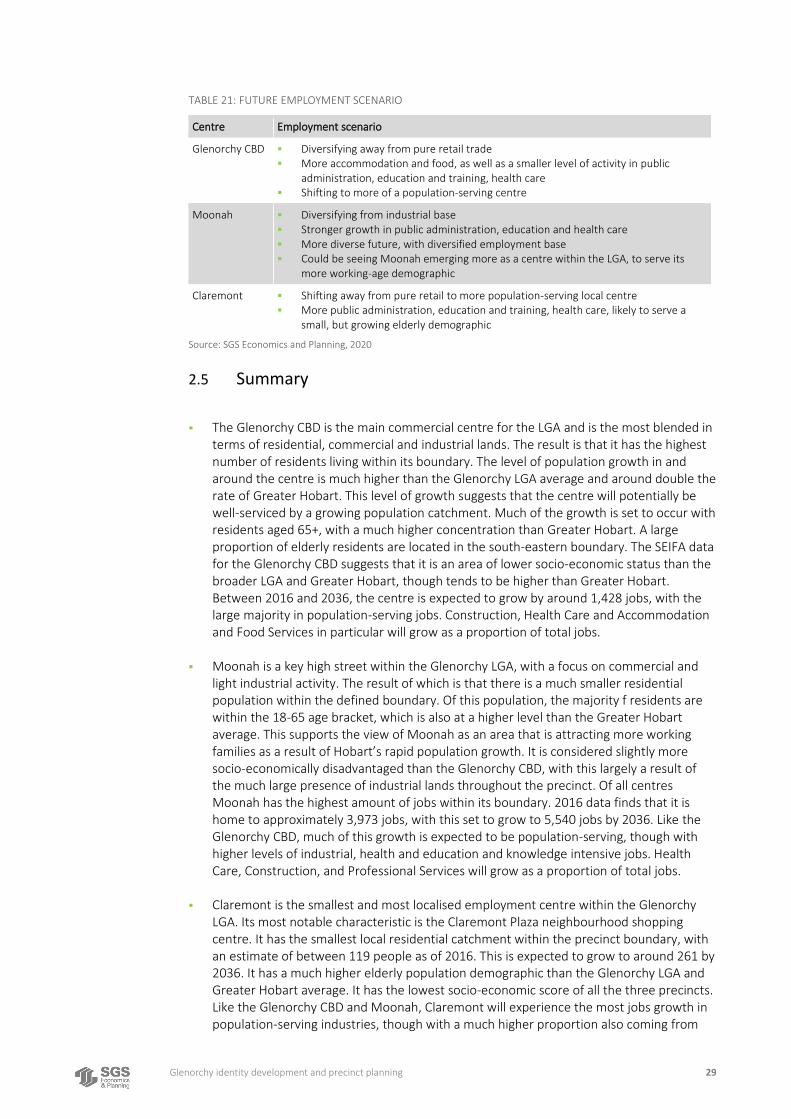
TABLE 21: FUTURE EMPLOYMENT SCENARIO
Centre Employment scenario
Glenorchy CBD ▪ Diversifying away from pure retail trade ▪ More accommodation and food, as well as a smaller level of activity in public
administration, education and training, health care ▪ Shifting to more of a population-serving centre
Moonah ▪ Diversifying from industrial base ▪ Stronger growth in public administration, education and health care ▪ More diverse future, with diversified employment base ▪ Could be seeing Moonah emerging more as a centre within the LGA, to serve its
more working-age demographic
Claremont ▪ Shifting away from pure retail to more population-serving local centre ▪ More public administration, education and training, health care, likely to serve a
small, but growing elderly demographic
Source: SGS Economics and Planning, 2020
2.5 Summary
▪ The Glenorchy CBD is the main commercial centre for the LGA and is the most blended in terms of residential, commercial and industrial lands. The result is that it has the highest number of residents living within its boundary. The level of population growth in and around the centre is much higher than the Glenorchy LGA average and around double the rate of Greater Hobart. This level of growth suggests that the centre will potentially be well-serviced by a growing population catchment. Much of the growth is set to occur with residents aged 65+, with a much higher concentration than Greater Hobart. A large proportion of elderly residents are located in the south-eastern boundary. The SEIFA data for the Glenorchy CBD suggests that it is an area of lower socio-economic status than the broader LGA and Greater Hobart, though tends to be higher than Greater Hobart. Between 2016 and 2036, the centre is expected to grow by around 1,428 jobs, with the large majority in population-serving jobs. Construction, Health Care and Accommodation and Food Services in particular will grow as a proportion of total jobs.
▪ Moonah is a key high street within the Glenorchy LGA, with a focus on commercial and light industrial activity. The result of which is that there is a much smaller residential population within the defined boundary. Of this population, the majority f residents are within the 18-65 age bracket, which is also at a higher level than the Greater Hobart average. This supports the view of Moonah as an area that is attracting more working families as a result of Hobart’s rapid population growth. It is considered slightly more socio-economically disadvantaged than the Glenorchy CBD, with this largely a result of the much large presence of industrial lands throughout the precinct. Of all centres Moonah has the highest amount of jobs within its boundary. 2016 data finds that it is home to approximately 3,973 jobs, with this set to grow to 5,540 jobs by 2036. Like the Glenorchy CBD, much of this growth is expected to be population-serving, though with higher levels of industrial, health and education and knowledge intensive jobs. Health Care, Construction, and Professional Services will grow as a proportion of total jobs.
▪ Claremont is the smallest and most localised employment centre within the Glenorchy LGA. Its most notable characteristic is the Claremont Plaza neighbourhood shopping centre. It has the smallest local residential catchment within the precinct boundary, with an estimate of between 119 people as of 2016. This is expected to grow to around 261 by 2036. It has a much higher elderly population demographic than the Glenorchy LGA and Greater Hobart average. It has the lowest socio-economic score of all the three precincts. Like the Glenorchy CBD and Moonah, Claremont will experience the most jobs growth in population-serving industries, though with a much higher proportion also coming from

Glenorchy identity development and precinct planning 30
health and education. This supports the view of the centre acting to service its growing elderly catchment. Health Care, Construction and Accommodation will grow as a proportion of total jobs, though from a small base.
▪ Comparing the changing employment patterns for the three centres against employment patterns for Greater Hobart notes that the Glenorchy CBD is set to diversify away increasingly from retail and more to population-serving industries. The same patterns are happening within Claremont, albeit at a localised level and with a greater level of employment growth in public administration and education jobs. Moonah is perhaps expected to experience the greatest level of change, where it is experiencing a shift away from its industrial base and more towards a population-based centre, with a specialised health and education focus.
Glenorchy identity development and precinct planning 31
3. RETAIL ANALYSIS
3.1 Retail Supply
Overview
SGS applies a metropolitan-wide retail analysis in order to understand the performance of retail. To make this analysis function at such a large scale, it is necessary to have an estimate of floorspace across the metro area.
Retail supply was calculated in three steps. Comprehensive information from Google data, was combined with building footprint data to estimate business usage. For this study, the three LGA’s of Glenorchy, Hobart and Clarence City Councils were analysed using this approach. Last, manual auditing that was undertaken for major shopping centres within these three LGA’s. Manual auditing is undertaken to address multiple story buildings, whereas typical street level retail exists only at the ground level. Relying purely on the automated Google method would not have captured any retail that occurs across multiple levels.
Outside of these three LGA’s, a broader jobs to floorspace estimate from the 2016 Census is utilised, to provide an estimate of retail floorspace. This is for the remaining LGA’s, to ensure that the full geography of Greater Hobart is captured. The result is fine-grained data at the subject area, followed by more generalised data in distant areas.
Specifically, the method involves the following steps:
(i) Downloading Google data and then blending it with building footprint data obtained through PSMA Australia
(ii) Estimating how much of retail is within each building (iii) Manually checking any buildings with a quantum over a certain threshold (iv) Adding in shopping centre data (v) Adding in 2016 Census data for distant areas (vi) Aggregating data at the building level up to a centre level
A key caveat to this methodology is that it only focusses on identified ‘retail’ floorspace, as defined by ABS retail categories. It eliminates any non-retail floorspace that is often defined as retail ‘services’ and retains retail floorspace that is classified as ‘goods’. Therefore, retail services such as massage clinics, doctor’s surgeries, banks, etc are moved out of this audit of total retail supply.
Assumptions regarding Glenorchy CBD
The Glenorchy CBD boundary, as identified in Figure 2 encompasses the Glenorchy CBD and Hobart Showground for the purposes of economic profiling. This was considered appropriate based on the Showground’s proximity to the city centre and various zoning layers.
For the purposes of the retail modelling however, the Hobart Showground were separated from the rest of the Glenorchy CBD centre. This is primarily because the Hobart Showground do not necessarily behave in the same way as the Glenorchy CBD, since it is home to a large Bunnings, and will soon be the location of further bulky goods stores such as a Spotlight and Anaconda. As such, separation for retail modelling purposes has been undertaken to analyse the impacts that this bulky goods centre may have on the future profile of the Glenorchy CBD.
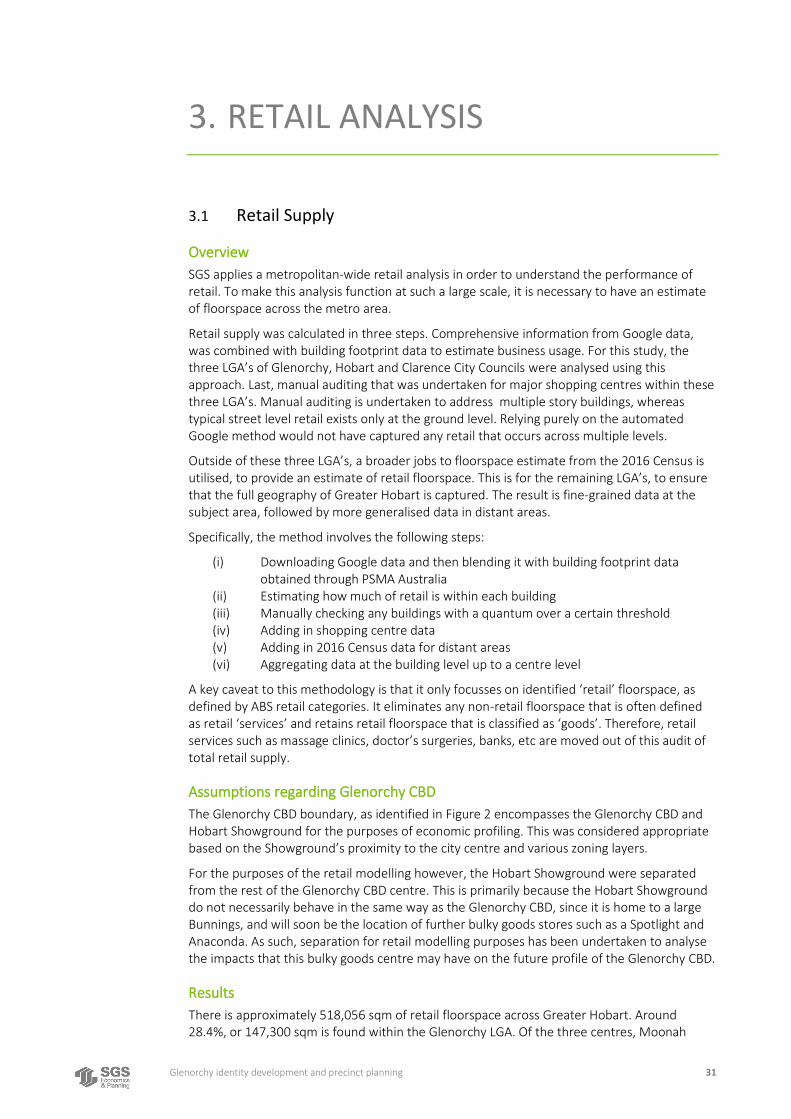
Results
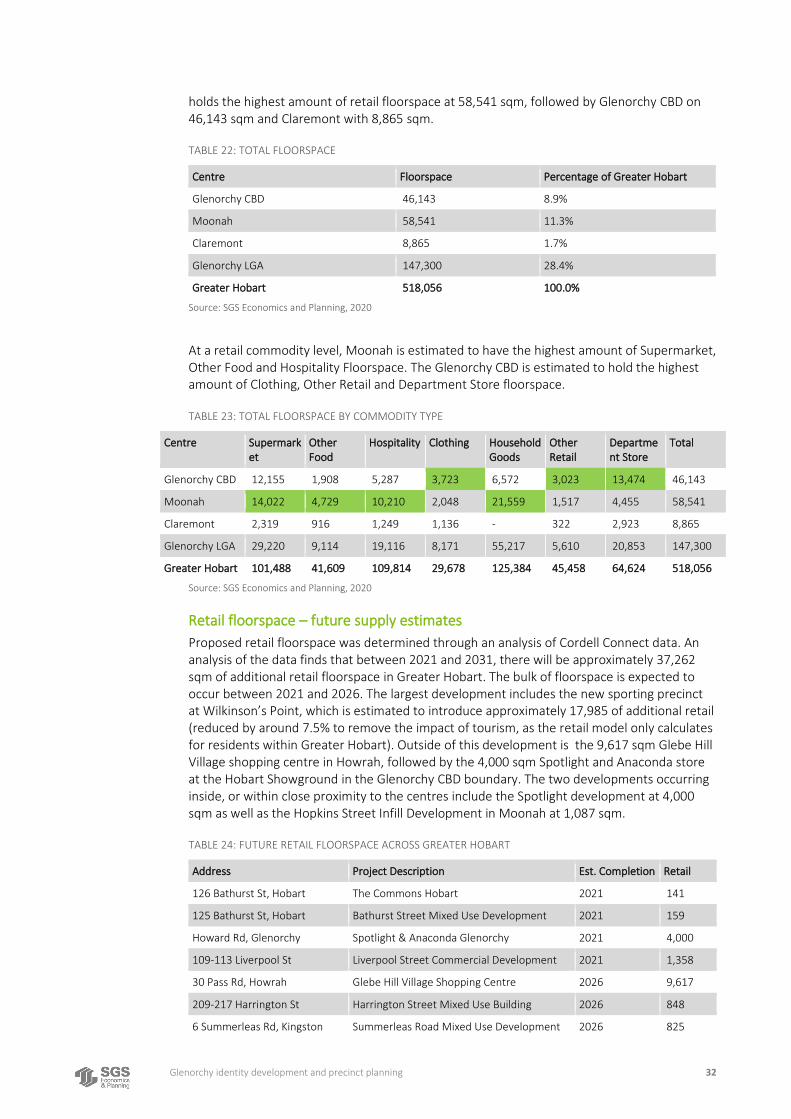
There is approximately 518,056 sqm of retail floorspace across Greater Hobart. Around 28.4%, or 147,300 sqm is found within the Glenorchy LGA. Of the three centres, Moonah
Glenorchy identity development and precinct planning 32
holds the highest amount of retail floorspace at 58,541 sqm, followed by Glenorchy CBD on 46,143 sqm and Claremont with 8,865 sqm.
TABLE 22: TOTAL FLOORSPACE
Centre Floorspace Percentage of Greater Hobart
Glenorchy CBD 46,143 8.9%
Moonah 58,541 11.3%
Claremont 8,865 1.7%
Glenorchy LGA 147,300 28.4%
Greater Hobart 518,056 100.0%
Source: SGS Economics and Planning, 2020
At a retail commodity level, Moonah is estimated to have the highest amount of Supermarket, Other Food and Hospitality Floorspace. The Glenorchy CBD is estimated to hold the highest amount of Clothing, Other Retail and Department Store floorspace.
TABLE 23: TOTAL FLOORSPACE BY COMMODITY TYPE
Centre Supermarket
Other Food
Hospitality Clothing Household Goods
Other Retail
Department Store
Total
Glenorchy CBD 12,155 1,908 5,287 3,723 6,572 3,023 13,474 46,143
Moonah 14,022 4,729 10,210 2,048 21,559 1,517 4,455 58,541
Claremont 2,319 916 1,249 1,136 - 322 2,923 8,865
Glenorchy LGA 29,220 9,114 19,116 8,171 55,217 5,610 20,853 147,300
Greater Hobart 101,488 41,609 109,814 29,678 125,384 45,458 64,624 518,056
Source: SGS Economics and Planning, 2020
Retail floorspace – future supply estimates
Proposed retail floorspace was determined through an analysis of Cordell Connect data. An analysis of the data finds that between 2021 and 2031, there will be approximately 37,262 sqm of additional retail floorspace in Greater Hobart. The bulk of floorspace is expected to occur between 2021 and 2026. The largest development includes the new sporting precinct at Wilkinson’s Point, which is estimated to introduce approximately 17,985 of additional retail (reduced by around 7.5% to remove the impact of tourism, as the retail model only calculates for residents within Greater Hobart). Outside of this development is the 9,617 sqm Glebe Hill Village shopping centre in Howrah, followed by the 4,000 sqm Spotlight and Anaconda store at the Hobart Showground in the Glenorchy CBD boundary. The two developments occurring inside, or within close proximity to the centres include the Spotlight development at 4,000 sqm as well as the Hopkins Street Infill Development in Moonah at 1,087 sqm.
TABLE 24: FUTURE RETAIL FLOORSPACE ACROSS GREATER HOBART
Address Project Description Est. Completion Retail
126 Bathurst St, Hobart The Commons Hobart 2021 141
125 Bathurst St, Hobart Bathurst Street Mixed Use Development 2021 159
Howard Rd, Glenorchy Spotlight & Anaconda Glenorchy 2021 4,000
109-113 Liverpool St Liverpool Street Commercial Development 2021 1,358
30 Pass Rd, Howrah Glebe Hill Village Shopping Centre 2026 9,617
209-217 Harrington St Harrington Street Mixed Use Building 2026 848
6 Summerleas Rd, Kingston Summerleas Road Mixed Use Development 2026 825
Glenorchy identity development and precinct planning 33
431 Elizabeth St Elizabeth Street Mixed Use Building 2026 45
62 Patrick Street Patrick Street Mixed Development 2026 972
Hopkins St and Sunderland St Hopkins Street Infill Development 2026 1,087
143-145 New Town Road New Town Road Development Site 2026 225
Brooker Hwy, Glenorchy Wilkinson’s Point Sporting Precinct 2026 7,925
Brooker Hwy, Glenorchy Wilkinson’s Point Sporting Precinct 2031 10,060
Total 37,262
Source: Cordell Connect, 2020
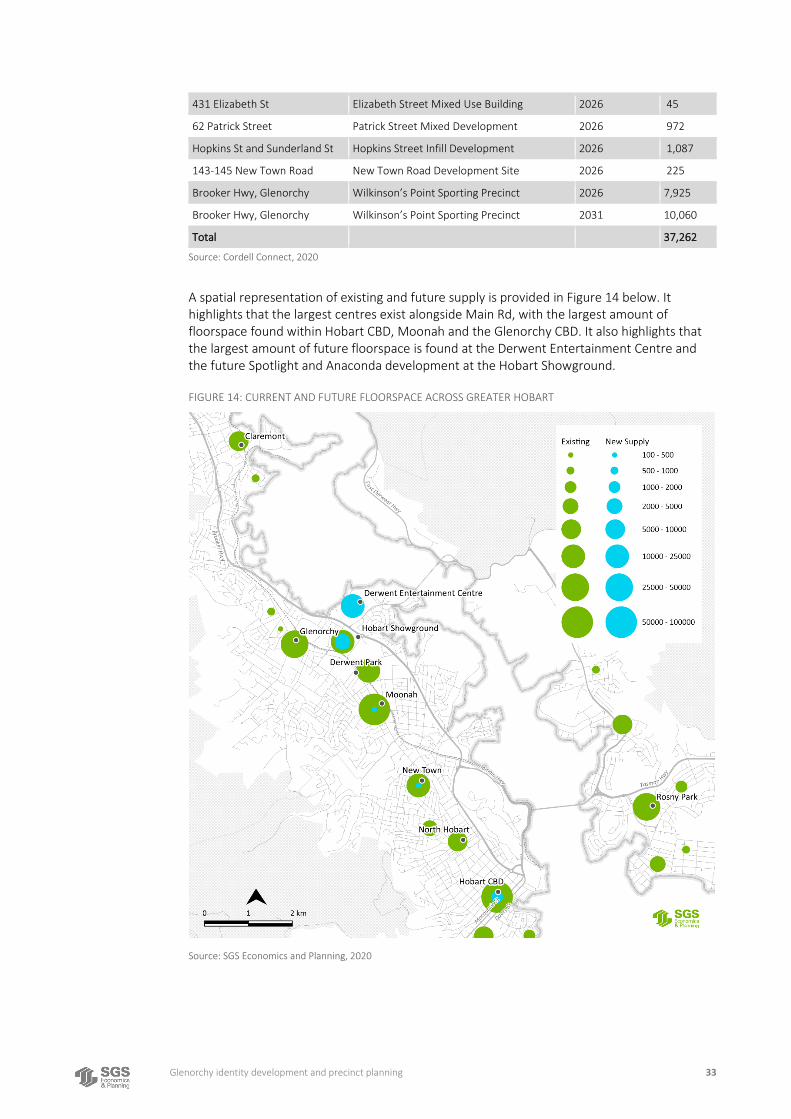
A spatial representation of existing and future supply is provided in Figure 14 below. It highlights that the largest centres exist alongside Main Rd, with the largest amount of floorspace found within Hobart CBD, Moonah and the Glenorchy CBD. It also highlights that the largest amount of future floorspace is found at the Derwent Entertainment Centre and the future Spotlight and Anaconda development at the Hobart Showground.
FIGURE 14: CURRENT AND FUTURE FLOORSPACE ACROSS GREATER HOBART
Source: SGS Economics and Planning, 2020
Glenorchy identity development and precinct planning 34
3.2 Retail Demand
Overview
In this section, demand for retail floorspace across Greater Hobart is assessed. The analysis carried out below is based upon a gravity modelling approach. This approach weighs centre size, accessibility and attractiveness against the volume and location of available expenditure in the system to estimate expenditure capture at each centre (and hence the quantity of floorspace likely to be needed) at various points in the future. It makes clear where there are shortages of retail floorspace, as well as places where there is potentially an overprovision and in doing so inform the Glenorchy LGA’s future planning.
SGS Gravity Model
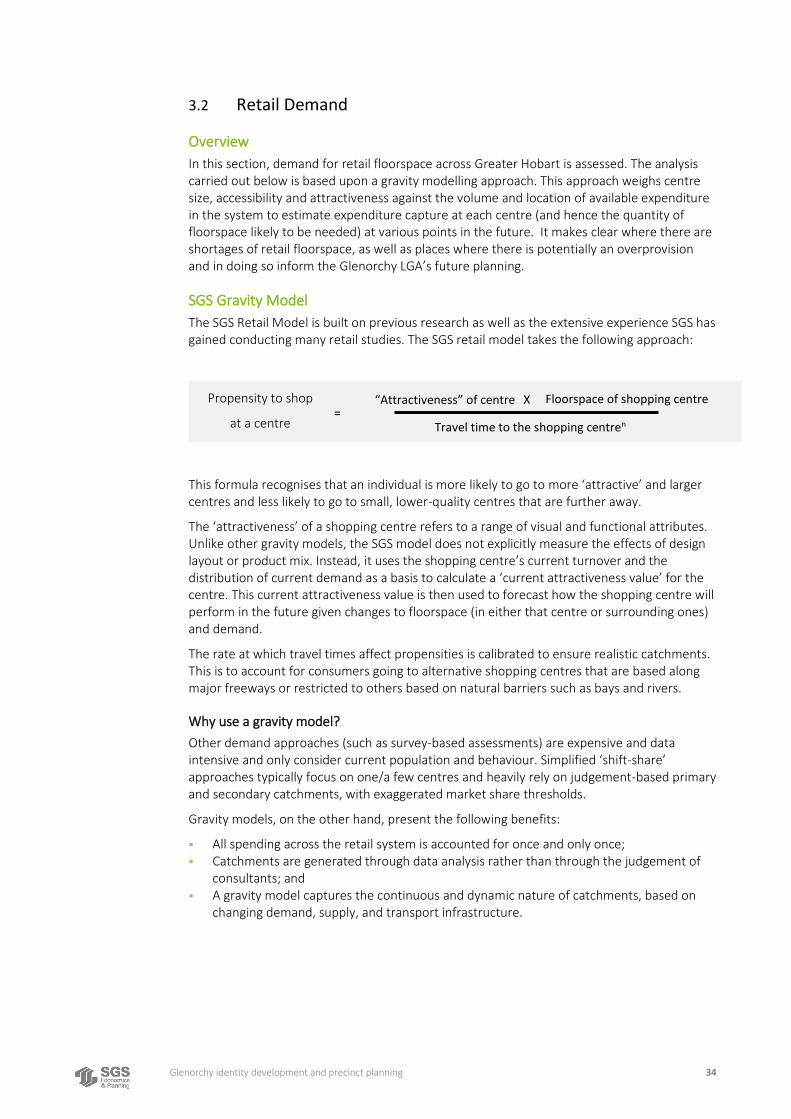
The SGS Retail Model is built on previous research as well as the extensive experience SGS has gained conducting many retail studies. The SGS retail model takes the following approach:
This formula recognises that an individual is more likely to go to more ‘attractive’ and larger centres and less likely to go to small, lower-quality centres that are further away.
The ‘attractiveness’ of a shopping centre refers to a range of visual and functional attributes. Unlike other gravity models, the SGS model does not explicitly measure the effects of design layout or product mix. Instead, it uses the shopping centre’s current turnover and the distribution of current demand as a basis to calculate a ‘current attractiveness value’ for the centre. This current attractiveness value is then used to forecast how the shopping centre will perform in the future given changes to floorspace (in either that centre or surrounding ones) and demand.
The rate at which travel times affect propensities is calibrated to ensure realistic catchments. This is to account for consumers going to alternative shopping centres that are based along major freeways or restricted to others based on natural barriers such as bays and rivers.
Why use a gravity model?
Other demand approaches (such as survey-based assessments) are expensive and data intensive and only consider current population and behaviour. Simplified ‘shift-share’ approaches typically focus on one/a few centres and heavily rely on judgement-based primary and secondary catchments, with exaggerated market share thresholds.
Gravity models, on the other hand, present the following benefits:
▪ All spending across the retail system is accounted for once and only once; ▪ Catchments are generated through data analysis rather than through the judgement of
consultants; and ▪ A gravity model captures the continuous and dynamic nature of catchments, based on
changing demand, supply, and transport infrastructure.
Propensity to shop
at a centre =
Floorspace of shopping centre
Travel time to the shopping centren
“Attractiveness” of centre X
Glenorchy identity development and precinct planning 35
Retail expenditure estimates
Although this analysis focuses on the Glenorchy LGA, the retail gravity model upon which it is based upon demand drawn from across the wider region. The recognition of this surrounding region reflects the reality that retail expenditure regularly and routinely transfers across municipal boundaries. The gravity model matches retail expenditure against existing and known proposed retail floorspace across the region, using a broader retail system beyond the local retail system allows for incorporating expenditure flows in and out of the local retail system.
Retail expenditure
Retail expenditure data has been developed out of resident-based expenditure accounts across 24 commodity groups at an SA1 level (e.g. fresh food, groceries, pharmaceuticals, restaurants, etc). These expenditure accounts are sourced from MarketInfo’s Market Data Systems (MDS) for 2018. MDS are the industry benchmark in estimating small area expenditure that draws on the latest Household Expenditure Survey (HES), ABS Census and other datasets. These expenditure per capita benchmarks are then projected out for population and employment, derived out of Transport for NSW’s population and employment projections, and adjusted to factor in the latest retail spending trends from the ABS.
The retail expenditure data also considers changing consumer spending patterns, such as the growing role of online shopping, in addition to factoring in the degree to which expenditure is influenced by work-based, education-based and tourism-based spending. These considerations help to capture overall leakage/capture for the whole system.
Online retail market share
The market share of online retail in the future will change the amount of retail expenditure occurring in physical stores. Online retail spending is currently growing rapidly, and there are a variety of estimates of its size and growth rate. To reflect the uncertainty in how quickly online retailing will grow in the future, three scenarios have been modelled, and are discussed below.
Online retail growth scenarios are based on experimental time-series statistics of online retail market share produced by the ABS. These time series show the market share to be growing by around 0.75% per year, and as of March 2020 and to be around 7.2%. While they are experimental, these estimates are the most relevant to the SGS retail model, as SGS uses a similar categorisation of what is included in retail expenditure and what is not as the ABS, while some third-party retail market share estimates may be based on different categorisations.
Online retail market share was broken down into shares for each retail commodity based on reported market shares for various goods and services from a variety of third-party research sources, including NAB, IBIS World, and Australia Post. These shares are lowest for supermarkets and hospitality and highest for department stores and clothing. Shares for every commodity were assumed to grow in the future, although the highest growth is expected to occur in those commodities which have the highest current online retail market penetration (department stores, clothing and household goods).
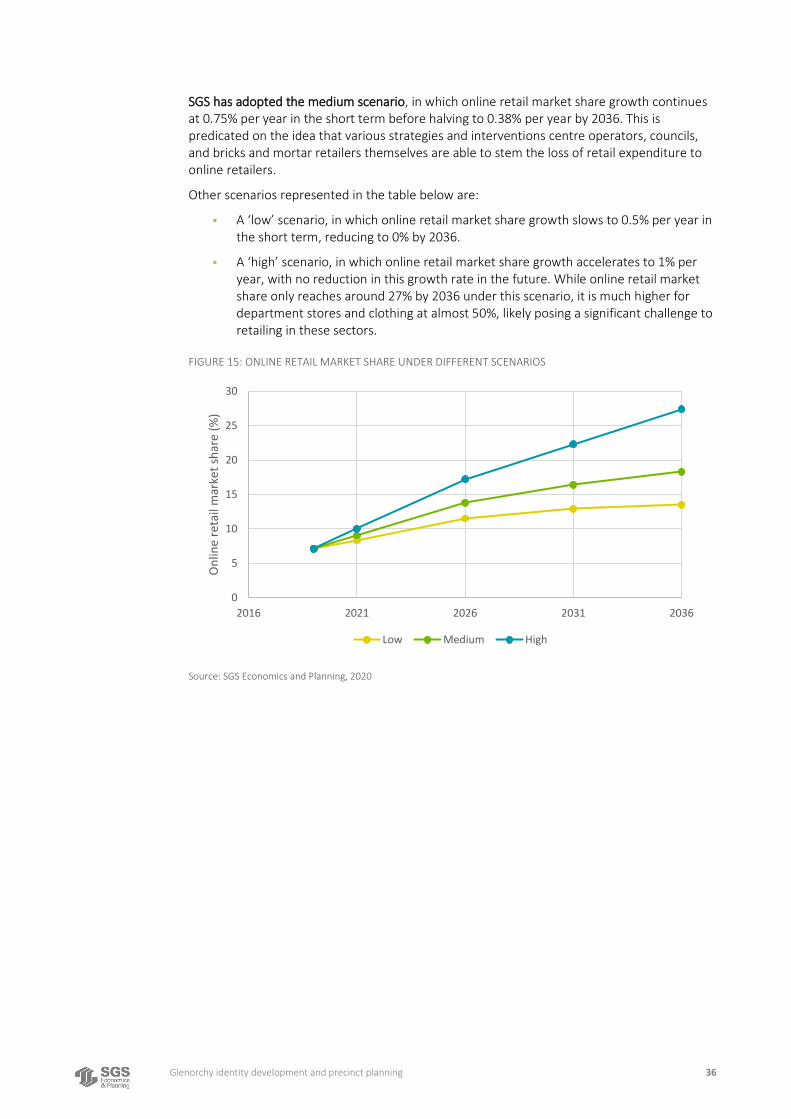
The figure below shows the projection scenarios for online retail market share. In both the low and medium scenarios, the growth rate of the online market share is expected to decline in the future, reflecting a decrease in growth rates of the online retail industry. Growth in the number of customers is likely to slow in the future as almost everyone who is likely to shop online does so sometimes. In addition, it is likely that the easiest gains will be made earlier, leaving online retail competing to capture transactions which people prefer to make in-store.
Glenorchy identity development and precinct planning 36
SGS has adopted the medium scenario, in which online retail market share growth continues at 0.75% per year in the short term before halving to 0.38% per year by 2036. This is predicated on the idea that various strategies and interventions centre operators, councils, and bricks and mortar retailers themselves are able to stem the loss of retail expenditure to online retailers.
Other scenarios represented in the table below are:
▪ A ‘low’ scenario, in which online retail market share growth slows to 0.5% per year in the short term, reducing to 0% by 2036.
▪ A ‘high’ scenario, in which online retail market share growth accelerates to 1% per year, with no reduction in this growth rate in the future. While online retail market share only reaches around 27% by 2036 under this scenario, it is much higher for department stores and clothing at almost 50%, likely posing a significant challenge to retailing in these sectors.
FIGURE 15: ONLINE RETAIL MARKET SHARE UNDER DIFFERENT SCENARIOS
Source: SGS Economics and Planning, 2020
0
5
10
15
20
25
30
2016 2021 2026 2031 2036
On
line
reta
il m
arke
t sh
are
(%)
Low Medium High
Glenorchy identity development and precinct planning 37
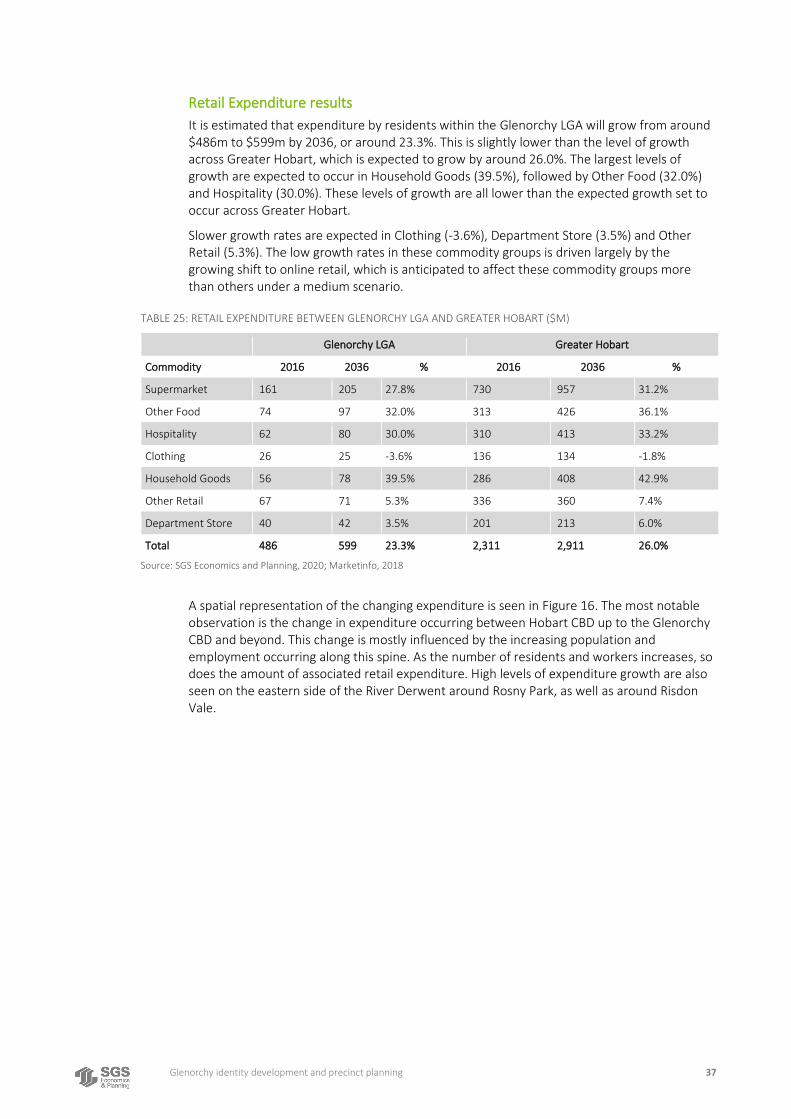
Retail Expenditure results
It is estimated that expenditure by residents within the Glenorchy LGA will grow from around $486m to $599m by 2036, or around 23.3%. This is slightly lower than the level of growth across Greater Hobart, which is expected to grow by around 26.0%. The largest levels of growth are expected to occur in Household Goods (39.5%), followed by Other Food (32.0%) and Hospitality (30.0%). These levels of growth are all lower than the expected growth set to occur across Greater Hobart.
Slower growth rates are expected in Clothing (-3.6%), Department Store (3.5%) and Other Retail (5.3%). The low growth rates in these commodity groups is driven largely by the growing shift to online retail, which is anticipated to affect these commodity groups more than others under a medium scenario.
TABLE 25: RETAIL EXPENDITURE BETWEEN GLENORCHY LGA AND GREATER HOBART ($M)
Glenorchy LGA Greater Hobart
Commodity 2016 2036 % 2016 2036 %
Supermarket 161 205 27.8% 730 957 31.2%
Other Food 74 97 32.0% 313 426 36.1%
Hospitality 62 80 30.0% 310 413 33.2%
Clothing 26 25 -3.6% 136 134 -1.8%
Household Goods 56 78 39.5% 286 408 42.9%
Other Retail 67 71 5.3% 336 360 7.4%
Department Store 40 42 3.5% 201 213 6.0%
Total 486 599 23.3% 2,311 2,911 26.0%
Source: SGS Economics and Planning, 2020; Marketinfo, 2018
A spatial representation of the changing expenditure is seen in Figure 16. The most notable observation is the change in expenditure occurring between Hobart CBD up to the Glenorchy CBD and beyond. This change is mostly influenced by the increasing population and employment occurring along this spine. As the number of residents and workers increases, so does the amount of associated retail expenditure. High levels of expenditure growth are also seen on the eastern side of the River Derwent around Rosny Park, as well as around Risdon Vale.
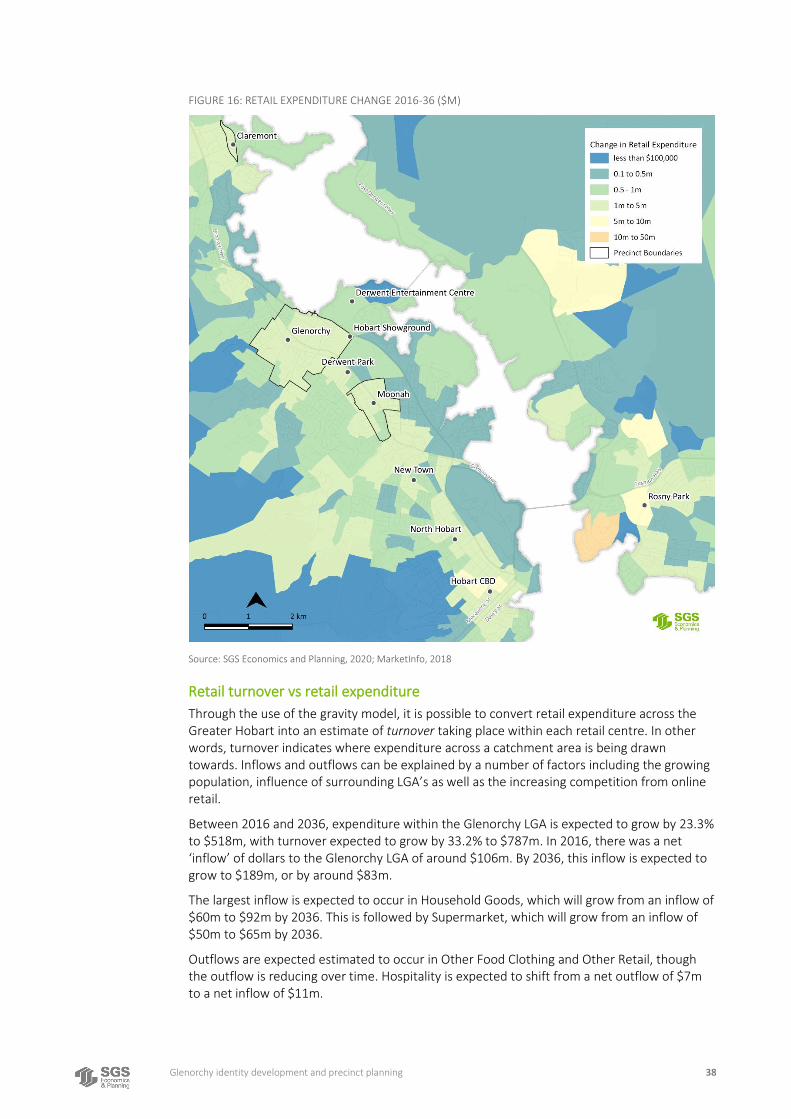
Glenorchy identity development and precinct planning 38
FIGURE 16: RETAIL EXPENDITURE CHANGE 2016-36 ($M)
Source: SGS Economics and Planning, 2020; MarketInfo, 2018
Retail turnover vs retail expenditure
Through the use of the gravity model, it is possible to convert retail expenditure across the Greater Hobart into an estimate of turnover taking place within each retail centre. In other words, turnover indicates where expenditure across a catchment area is being drawn towards. Inflows and outflows can be explained by a number of factors including the growing population, influence of surrounding LGA’s as well as the increasing competition from online retail.
Between 2016 and 2036, expenditure within the Glenorchy LGA is expected to grow by 23.3% to $518m, with turnover expected to grow by 33.2% to $787m. In 2016, there was a net ‘inflow’ of dollars to the Glenorchy LGA of around $106m. By 2036, this inflow is expected to grow to $189m, or by around $83m.
The largest inflow is expected to occur in Household Goods, which will grow from an inflow of $60m to $92m by 2036. This is followed by Supermarket, which will grow from an inflow of $50m to $65m by 2036.
Outflows are expected estimated to occur in Other Food Clothing and Other Retail, though the outflow is reducing over time. Hospitality is expected to shift from a net outflow of $7m to a net inflow of $11m.
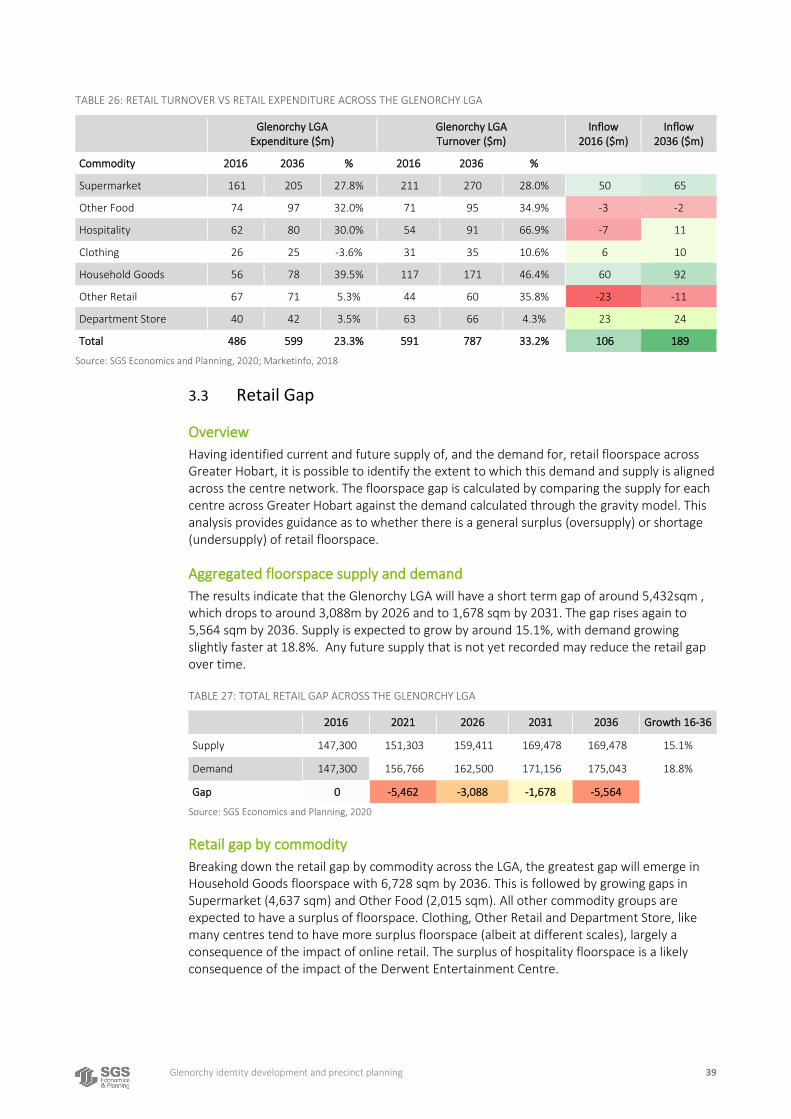
Glenorchy identity development and precinct planning 39
TABLE 26: RETAIL TURNOVER VS RETAIL EXPENDITURE ACROSS THE GLENORCHY LGA
Glenorchy LGA Expenditure ($m)
Glenorchy LGA Turnover ($m)
Inflow 2016 ($m)
Inflow 2036 ($m)
Commodity 2016 2036 % 2016 2036 %
Supermarket 161 205 27.8% 211 270 28.0% 50 65
Other Food 74 97 32.0% 71 95 34.9% -3 -2
Hospitality 62 80 30.0% 54 91 66.9% -7 11
Clothing 26 25 -3.6% 31 35 10.6% 6 10
Household Goods 56 78 39.5% 117 171 46.4% 60 92
Other Retail 67 71 5.3% 44 60 35.8% -23 -11
Department Store 40 42 3.5% 63 66 4.3% 23 24
Total 486 599 23.3% 591 787 33.2% 106 189
Source: SGS Economics and Planning, 2020; Marketinfo, 2018
3.3 Retail Gap
Overview
Having identified current and future supply of, and the demand for, retail floorspace across Greater Hobart, it is possible to identify the extent to which this demand and supply is aligned across the centre network. The floorspace gap is calculated by comparing the supply for each centre across Greater Hobart against the demand calculated through the gravity model. This analysis provides guidance as to whether there is a general surplus (oversupply) or shortage (undersupply) of retail floorspace.
Aggregated floorspace supply and demand
The results indicate that the Glenorchy LGA will have a short term gap of around 5,432sqm , which drops to around 3,088m by 2026 and to 1,678 sqm by 2031. The gap rises again to 5,564 sqm by 2036. Supply is expected to grow by around 15.1%, with demand growing slightly faster at 18.8%. Any future supply that is not yet recorded may reduce the retail gap over time.
TABLE 27: TOTAL RETAIL GAP ACROSS THE GLENORCHY LGA
2016 2021 2026 2031 2036 Growth 16-36
Supply 147,300 151,303 159,411 169,478 169,478 15.1%
Demand 147,300 156,766 162,500 171,156 175,043 18.8%
Gap 0 -5,462 -3,088 -1,678 -5,564
Source: SGS Economics and Planning, 2020
Retail gap by commodity
Breaking down the retail gap by commodity across the LGA, the greatest gap will emerge in Household Goods floorspace with 6,728 sqm by 2036. This is followed by growing gaps in Supermarket (4,637 sqm) and Other Food (2,015 sqm). All other commodity groups are expected to have a surplus of floorspace. Clothing, Other Retail and Department Store, like many centres tend to have more surplus floorspace (albeit at different scales), largely a consequence of the impact of online retail. The surplus of hospitality floorspace is a likely consequence of the impact of the Derwent Entertainment Centre.
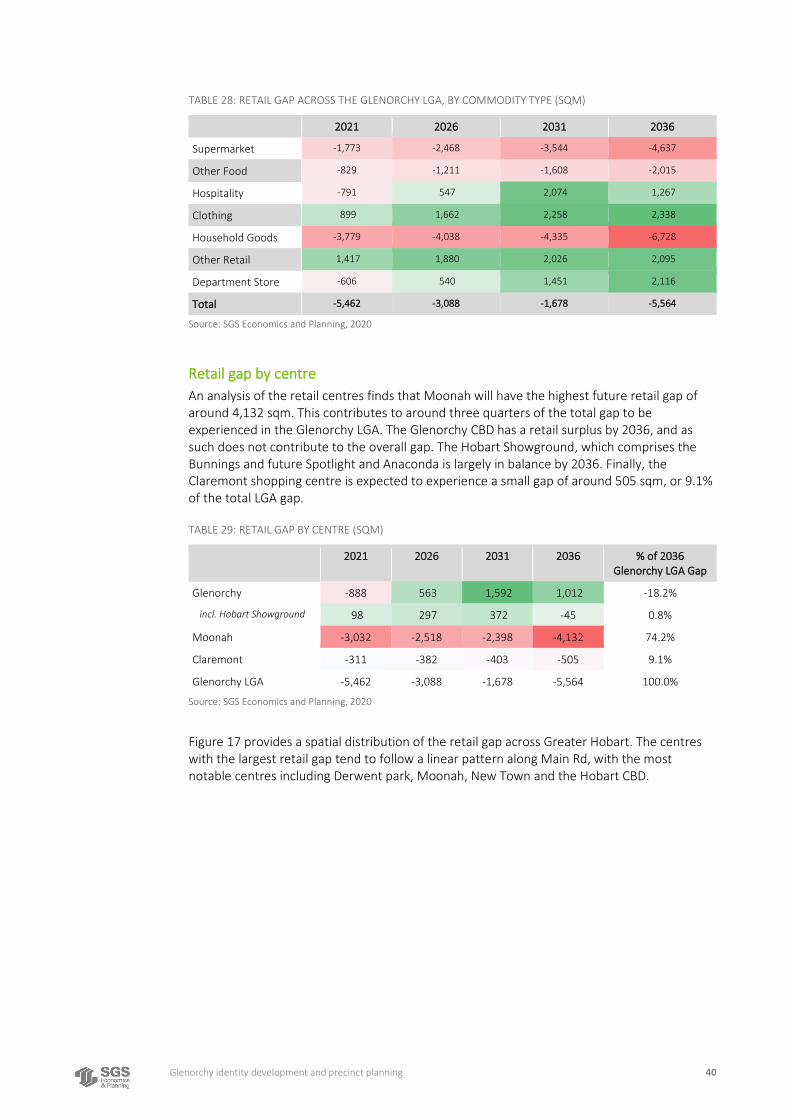
Glenorchy identity development and precinct planning 40
TABLE 28: RETAIL GAP ACROSS THE GLENORCHY LGA, BY COMMODITY TYPE (SQM)
2021 2026 2031 2036
Supermarket -1,773 -2,468 -3,544 -4,637
Other Food -829 -1,211 -1,608 -2,015
Hospitality -791 547 2,074 1,267
Clothing 899 1,662 2,258 2,338
Household Goods -3,779 -4,038 -4,335 -6,728
Other Retail 1,417 1,880 2,026 2,095
Department Store -606 540 1,451 2,116
Total -5,462 -3,088 -1,678 -5,564
Source: SGS Economics and Planning, 2020
Retail gap by centre
An analysis of the retail centres finds that Moonah will have the highest future retail gap of around 4,132 sqm. This contributes to around three quarters of the total gap to be experienced in the Glenorchy LGA. The Glenorchy CBD has a retail surplus by 2036, and as such does not contribute to the overall gap. The Hobart Showground, which comprises the Bunnings and future Spotlight and Anaconda is largely in balance by 2036. Finally, the Claremont shopping centre is expected to experience a small gap of around 505 sqm, or 9.1% of the total LGA gap.
TABLE 29: RETAIL GAP BY CENTRE (SQM)
2021 2026 2031 2036 % of 2036 Glenorchy LGA Gap
Glenorchy -888 563 1,592 1,012 -18.2%
incl. Hobart Showground 98 297 372 -45 0.8%
Moonah -3,032 -2,518 -2,398 -4,132 74.2%
Claremont -311 -382 -403 -505 9.1%
Glenorchy LGA -5,462 -3,088 -1,678 -5,564 100.0%
Source: SGS Economics and Planning, 2020
Figure 17 provides a spatial distribution of the retail gap across Greater Hobart. The centres with the largest retail gap tend to follow a linear pattern along Main Rd, with the most notable centres including Derwent park, Moonah, New Town and the Hobart CBD.
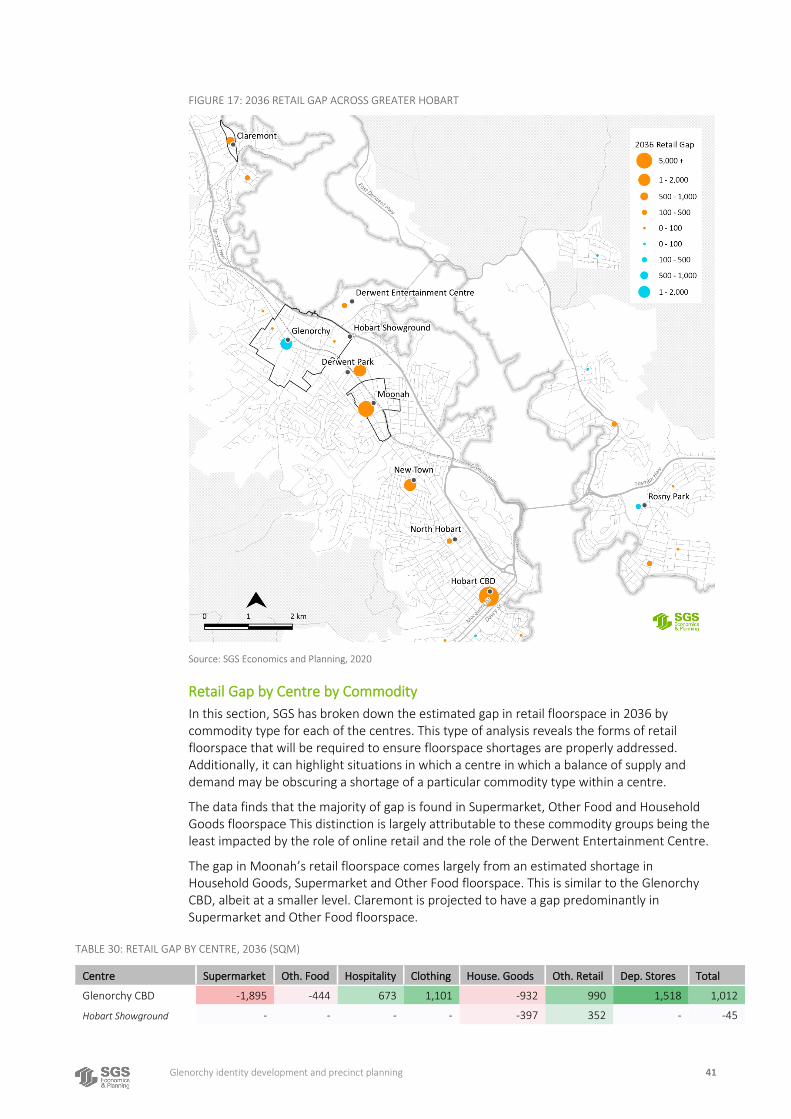
Glenorchy identity development and precinct planning 41
FIGURE 17: 2036 RETAIL GAP ACROSS GREATER HOBART
Source: SGS Economics and Planning, 2020
Retail Gap by Centre by Commodity
In this section, SGS has broken down the estimated gap in retail floorspace in 2036 by commodity type for each of the centres. This type of analysis reveals the forms of retail floorspace that will be required to ensure floorspace shortages are properly addressed. Additionally, it can highlight situations in which a centre in which a balance of supply and demand may be obscuring a shortage of a particular commodity type within a centre.
The data finds that the majority of gap is found in Supermarket, Other Food and Household Goods floorspace This distinction is largely attributable to these commodity groups being the least impacted by the role of online retail and the role of the Derwent Entertainment Centre.
The gap in Moonah’s retail floorspace comes largely from an estimated shortage in Household Goods, Supermarket and Other Food floorspace. This is similar to the Glenorchy CBD, albeit at a smaller level. Claremont is projected to have a gap predominantly in Supermarket and Other Food floorspace.
TABLE 30: RETAIL GAP BY CENTRE, 2036 (SQM)
Centre Supermarket Oth. Food Hospitality Clothing House. Goods Oth. Retail Dep. Stores Total
Glenorchy CBD -1,895 -444 673 1,101 -932 990 1,518 1,012
Hobart Showground - - - - -397 352 - -45
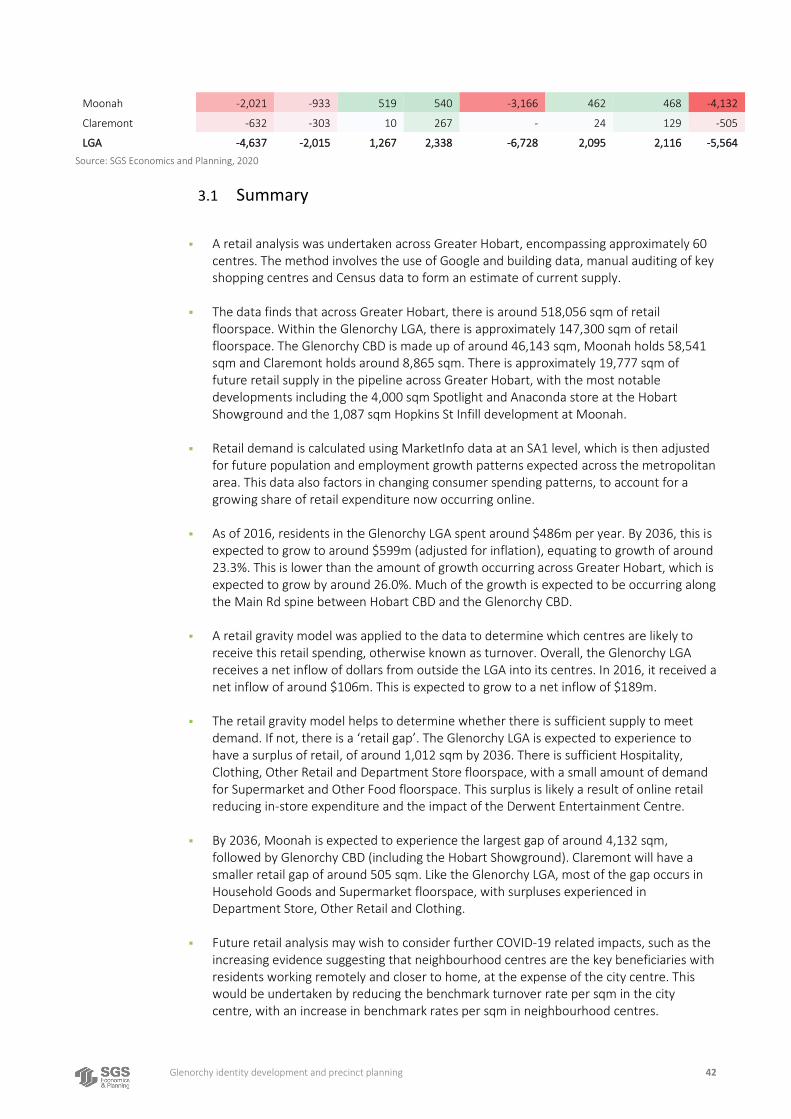
Glenorchy identity development and precinct planning 42
Moonah -2,021 -933 519 540 -3,166 462 468 -4,132
Claremont -632 -303 10 267 - 24 129 -505
LGA -4,637 -2,015 1,267 2,338 -6,728 2,095 2,116 -5,564
Source: SGS Economics and Planning, 2020
3.1 Summary
▪ A retail analysis was undertaken across Greater Hobart, encompassing approximately 60 centres. The method involves the use of Google and building data, manual auditing of key shopping centres and Census data to form an estimate of current supply.
▪ The data finds that across Greater Hobart, there is around 518,056 sqm of retail floorspace. Within the Glenorchy LGA, there is approximately 147,300 sqm of retail floorspace. The Glenorchy CBD is made up of around 46,143 sqm, Moonah holds 58,541 sqm and Claremont holds around 8,865 sqm. There is approximately 19,777 sqm of future retail supply in the pipeline across Greater Hobart, with the most notable developments including the 4,000 sqm Spotlight and Anaconda store at the Hobart Showground and the 1,087 sqm Hopkins St Infill development at Moonah.
▪ Retail demand is calculated using MarketInfo data at an SA1 level, which is then adjusted for future population and employment growth patterns expected across the metropolitan area. This data also factors in changing consumer spending patterns, to account for a growing share of retail expenditure now occurring online.
▪ As of 2016, residents in the Glenorchy LGA spent around $486m per year. By 2036, this is expected to grow to around $599m (adjusted for inflation), equating to growth of around 23.3%. This is lower than the amount of growth occurring across Greater Hobart, which is expected to grow by around 26.0%. Much of the growth is expected to be occurring along the Main Rd spine between Hobart CBD and the Glenorchy CBD.
▪ A retail gravity model was applied to the data to determine which centres are likely to receive this retail spending, otherwise known as turnover. Overall, the Glenorchy LGA receives a net inflow of dollars from outside the LGA into its centres. In 2016, it received a net inflow of around $106m. This is expected to grow to a net inflow of $189m.
▪ The retail gravity model helps to determine whether there is sufficient supply to meet demand. If not, there is a ‘retail gap’. The Glenorchy LGA is expected to experience to have a surplus of retail, of around 1,012 sqm by 2036. There is sufficient Hospitality, Clothing, Other Retail and Department Store floorspace, with a small amount of demand for Supermarket and Other Food floorspace. This surplus is likely a result of online retail reducing in-store expenditure and the impact of the Derwent Entertainment Centre.
▪ By 2036, Moonah is expected to experience the largest gap of around 4,132 sqm, followed by Glenorchy CBD (including the Hobart Showground). Claremont will have a smaller retail gap of around 505 sqm. Like the Glenorchy LGA, most of the gap occurs in Household Goods and Supermarket floorspace, with surpluses experienced in Department Store, Other Retail and Clothing.
▪ Future retail analysis may wish to consider further COVID-19 related impacts, such as the increasing evidence suggesting that neighbourhood centres are the key beneficiaries with residents working remotely and closer to home, at the expense of the city centre. This would be undertaken by reducing the benchmark turnover rate per sqm in the city centre, with an increase in benchmark rates per sqm in neighbourhood centres.
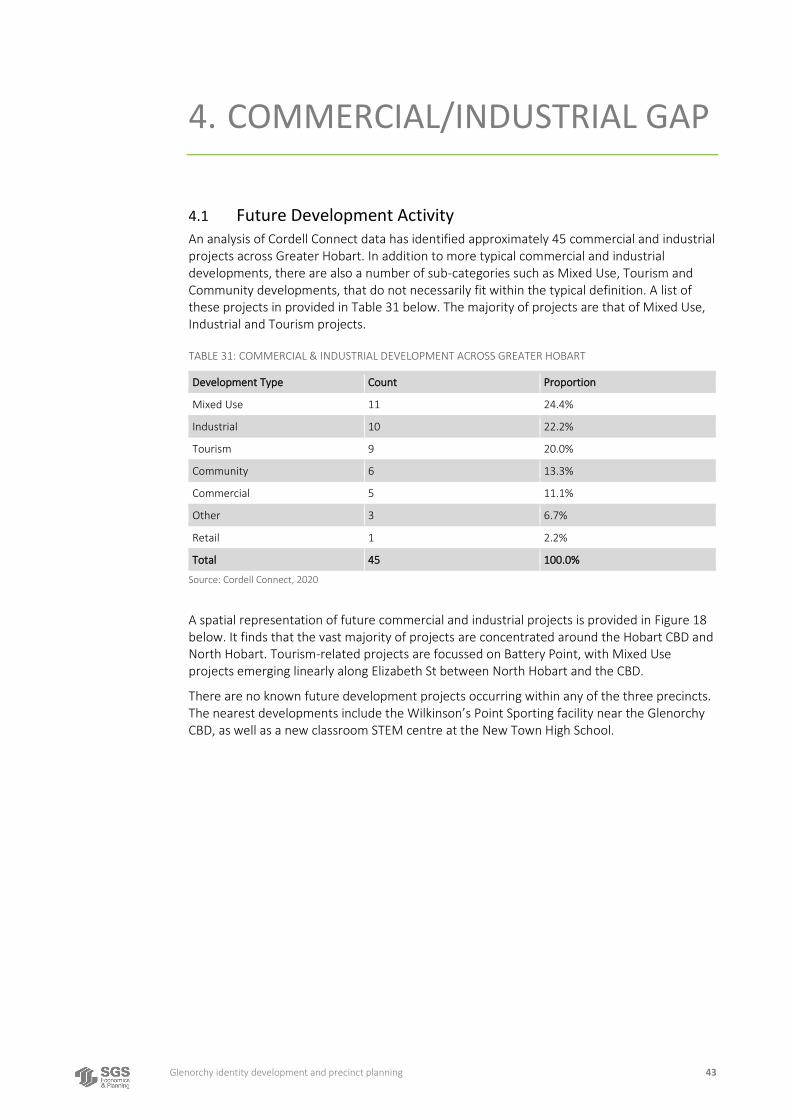
Glenorchy identity development and precinct planning 43
4. COMMERCIAL/INDUSTRIAL GAP
4.1 Future Development Activity An analysis of Cordell Connect data has identified approximately 45 commercial and industrial projects across Greater Hobart. In addition to more typical commercial and industrial developments, there are also a number of sub-categories such as Mixed Use, Tourism and Community developments, that do not necessarily fit within the typical definition. A list of these projects in provided in Table 31 below. The majority of projects are that of Mixed Use, Industrial and Tourism projects.
TABLE 31: COMMERCIAL & INDUSTRIAL DEVELOPMENT ACROSS GREATER HOBART
Development Type Count Proportion
Mixed Use 11 24.4%
Industrial 10 22.2%
Tourism 9 20.0%
Community 6 13.3%
Commercial 5 11.1%
Other 3 6.7%
Retail 1 2.2%
Total 45 100.0%
Source: Cordell Connect, 2020
A spatial representation of future commercial and industrial projects is provided in Figure 18 below. It finds that the vast majority of projects are concentrated around the Hobart CBD and North Hobart. Tourism-related projects are focussed on Battery Point, with Mixed Use projects emerging linearly along Elizabeth St between North Hobart and the CBD.
There are no known future development projects occurring within any of the three precincts. The nearest developments include the Wilkinson’s Point Sporting facility near the Glenorchy CBD, as well as a new classroom STEM centre at the New Town High School.
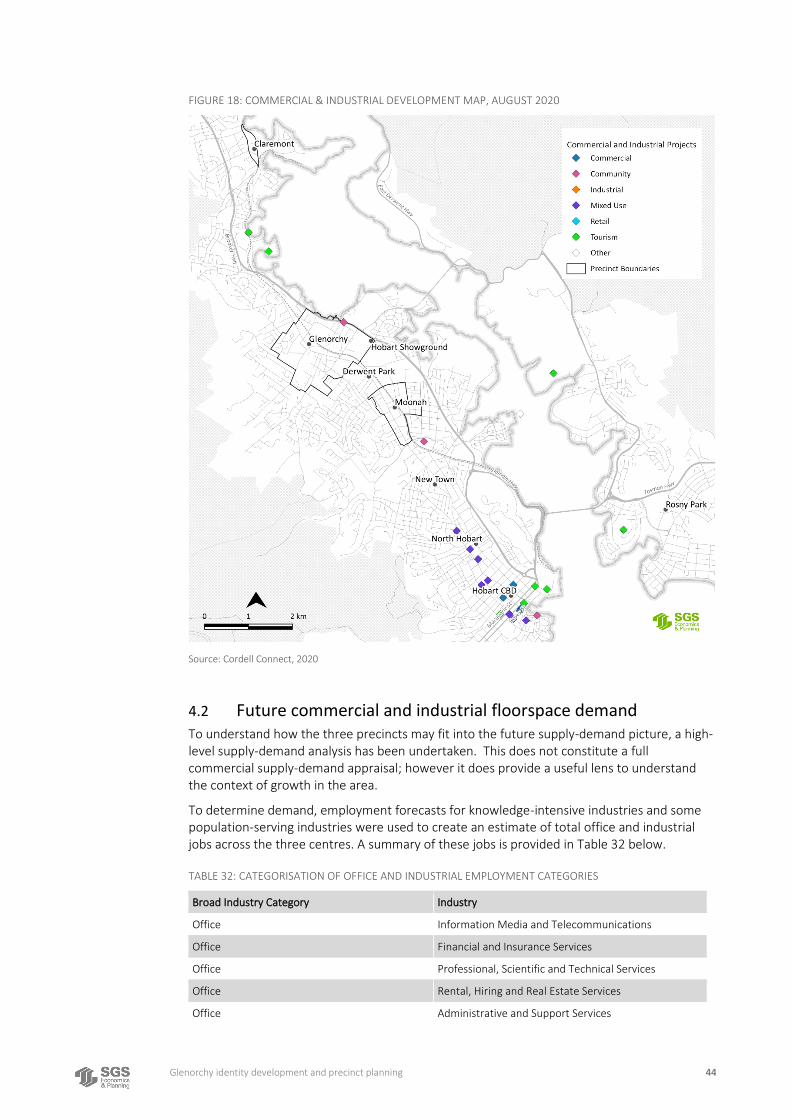
Glenorchy identity development and precinct planning 44
FIGURE 18: COMMERCIAL & INDUSTRIAL DEVELOPMENT MAP, AUGUST 2020
Source: Cordell Connect, 2020
4.2 Future commercial and industrial floorspace demand To understand how the three precincts may fit into the future supply-demand picture, a high-level supply-demand analysis has been undertaken. This does not constitute a full commercial supply-demand appraisal; however it does provide a useful lens to understand the context of growth in the area.
To determine demand, employment forecasts for knowledge-intensive industries and some population-serving industries were used to create an estimate of total office and industrial jobs across the three centres. A summary of these jobs is provided in Table 32 below.
TABLE 32: CATEGORISATION OF OFFICE AND INDUSTRIAL EMPLOYMENT CATEGORIES
Broad Industry Category Industry
Office Information Media and Telecommunications
Office Financial and Insurance Services
Office Professional, Scientific and Technical Services
Office Rental, Hiring and Real Estate Services
Office Administrative and Support Services
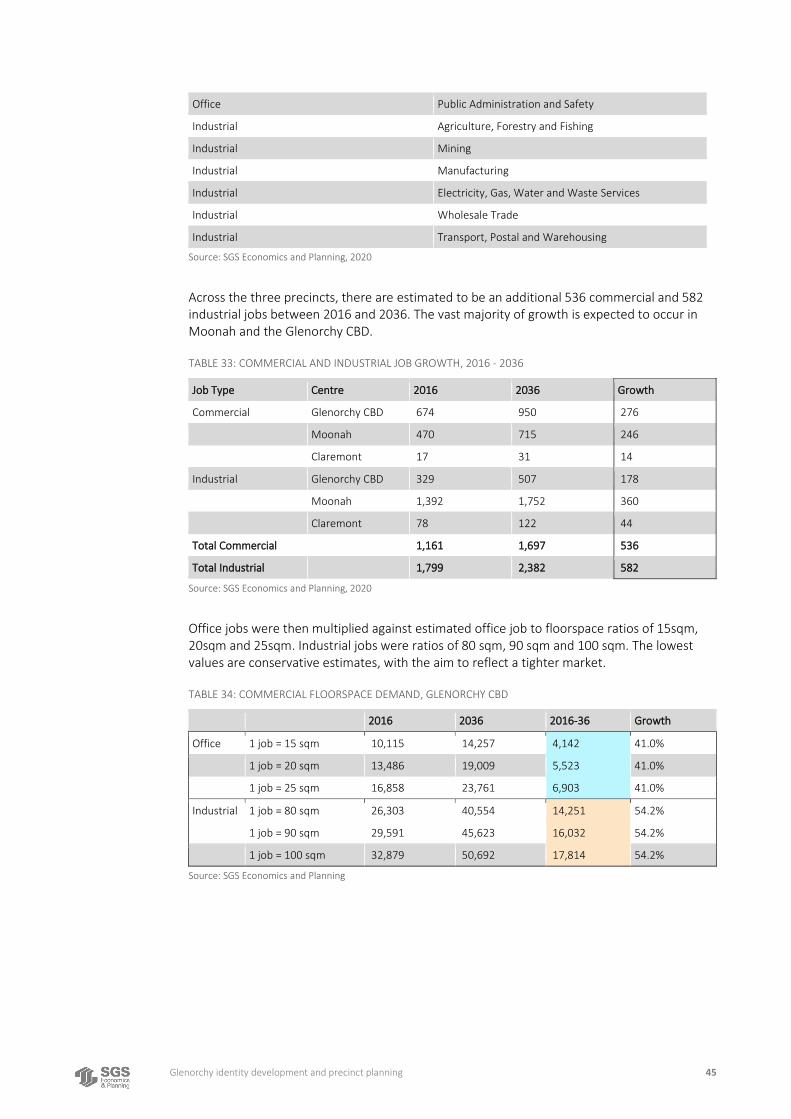
Glenorchy identity development and precinct planning 45
Office Public Administration and Safety
Industrial Agriculture, Forestry and Fishing
Industrial Mining
Industrial Manufacturing
Industrial Electricity, Gas, Water and Waste Services
Industrial Wholesale Trade
Industrial Transport, Postal and Warehousing
Source: SGS Economics and Planning, 2020
Across the three precincts, there are estimated to be an additional 536 commercial and 582 industrial jobs between 2016 and 2036. The vast majority of growth is expected to occur in Moonah and the Glenorchy CBD.
TABLE 33: COMMERCIAL AND INDUSTRIAL JOB GROWTH, 2016 - 2036
Job Type Centre 2016 2036 Growth
Commercial Glenorchy CBD 674 950 276
Moonah 470 715 246
Claremont 17 31 14
Industrial Glenorchy CBD 329 507 178
Moonah 1,392 1,752 360
Claremont 78 122 44
Total Commercial 1,161 1,697 536
Total Industrial 1,799 2,382 582
Source: SGS Economics and Planning, 2020
Office jobs were then multiplied against estimated office job to floorspace ratios of 15sqm, 20sqm and 25sqm. Industrial jobs were ratios of 80 sqm, 90 sqm and 100 sqm. The lowest values are conservative estimates, with the aim to reflect a tighter market.
TABLE 34: COMMERCIAL FLOORSPACE DEMAND, GLENORCHY CBD
2016 2036 2016-36 Growth
Office 1 job = 15 sqm 10,115 14,257 4,142 41.0%
1 job = 20 sqm 13,486 19,009 5,523 41.0%
1 job = 25 sqm 16,858 23,761 6,903 41.0%
Industrial 1 job = 80 sqm 26,303 40,554 14,251 54.2%
1 job = 90 sqm 29,591 45,623 16,032 54.2%
1 job = 100 sqm 32,879 50,692 17,814 54.2%
Source: SGS Economics and Planning
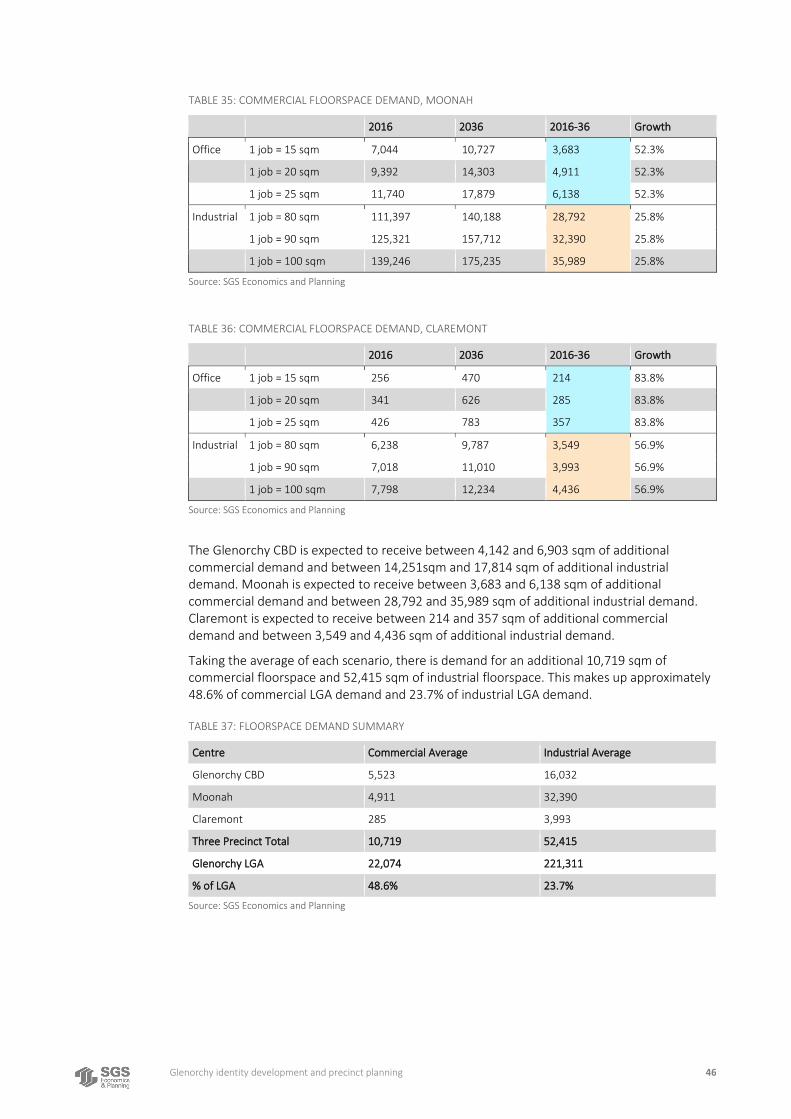
Glenorchy identity development and precinct planning 46
TABLE 35: COMMERCIAL FLOORSPACE DEMAND, MOONAH
2016 2036 2016-36 Growth
Office 1 job = 15 sqm 7,044 10,727 3,683 52.3%
1 job = 20 sqm 9,392 14,303 4,911 52.3%
1 job = 25 sqm 11,740 17,879 6,138 52.3%
Industrial 1 job = 80 sqm 111,397 140,188 28,792 25.8%
1 job = 90 sqm 125,321 157,712 32,390 25.8%
1 job = 100 sqm 139,246 175,235 35,989 25.8%
Source: SGS Economics and Planning
TABLE 36: COMMERCIAL FLOORSPACE DEMAND, CLAREMONT
2016 2036 2016-36 Growth
Office 1 job = 15 sqm 256 470 214 83.8%
1 job = 20 sqm 341 626 285 83.8%
1 job = 25 sqm 426 783 357 83.8%
Industrial 1 job = 80 sqm 6,238 9,787 3,549 56.9%
1 job = 90 sqm 7,018 11,010 3,993 56.9%
1 job = 100 sqm 7,798 12,234 4,436 56.9%
Source: SGS Economics and Planning
The Glenorchy CBD is expected to receive between 4,142 and 6,903 sqm of additional commercial demand and between 14,251sqm and 17,814 sqm of additional industrial demand. Moonah is expected to receive between 3,683 and 6,138 sqm of additional commercial demand and between 28,792 and 35,989 sqm of additional industrial demand. Claremont is expected to receive between 214 and 357 sqm of additional commercial demand and between 3,549 and 4,436 sqm of additional industrial demand.
Taking the average of each scenario, there is demand for an additional 10,719 sqm of commercial floorspace and 52,415 sqm of industrial floorspace. This makes up approximately 48.6% of commercial LGA demand and 23.7% of industrial LGA demand.
TABLE 37: FLOORSPACE DEMAND SUMMARY
Centre Commercial Average Industrial Average
Glenorchy CBD 5,523 16,032
Moonah 4,911 32,390
Claremont 285 3,993
Three Precinct Total 10,719 52,415
Glenorchy LGA 22,074 221,311
% of LGA 48.6% 23.7%
Source: SGS Economics and Planning
Glenorchy identity development and precinct planning 47
4.3 Summary
▪ An analysis of future development data finds that there are no proposed commercial or industrial developments set to occur within the three centres. Much of the activity is occurring closer to the Hobart CBD and is predominantly made up of Mixed Use and Tourism-related developments.
▪ To estimate future commercial and industrial demand, a high-level job to floorspace projection was undertaken for the three precincts.
▪ Taking the average demand rates (at 20 sqm per commercial job; 90 sqm per industrial job) finds that there is commercial demand of approximately 10,719 sqm and industrial demand of around 52,415 sqm across the three precincts. This makes up approximately 48.6% of the LGA’s future commercial demand and 23.7% of the LGA’s future industrial demand
▪ The Glenorchy CBD has the highest level of demand averaging around 5,523 sqm by 2036. Moonah has the highest level of industrial demand, averaging around 32,390 sqm.
▪ Future analysis may wish to estimate the existing supply of commercial and industrial floorspace as well as the future land use capacity to determine if there is sufficient future land available to meet this demand
Glenorchy identity development and precinct planning 48
CONSIDERATIONS
This report has aimed to provide an analysis of the economic trends and drivers occurring across the Glenorchy LGA, particularly on the Glenorchy CBD, Moonah and Claremont. The data has found that each centre is unique and actually has a number of unique opportunities and challenge in its future development.
4.4 Precinct considerations
Glenorchy
The future of Glenorchy CBD is one which is diversifying away from being a more traditional retail centre. Other industries are emerging, particularly in health, accommodation and food services, rental services and professional services. This shift is happening at a faster rate than the Greater Hobart average, indicating that the centre is slowly emerging as a commercial centre.
What seems to be the most pressing planning direction is the need to better consolidate the Glenorchy CBD as the city centre. As discussed in Section 2.4, future employment growth seems to be relatively scattered across the LGA, rather than experiencing a consolidation as is occurring in the Hobart CBD. Though the aim is not to necessarily replicate the Hobart CBD, there is a need to consider consolidation to ensure the centre vibrant and viable into the future. This is particularly relevant, given that there seems to be growing indication of economic activity shifting south into Moonah.
The Hobart City Deal identifies Wilkinson’s Point, the Derwent Entertainment Centre and the MONA hotel as key future investments, all connected via the necessary active transport linkages. Similarly, the Asset Management Strategy reveals that there will be investment into the Glenorchy CBD through various revitalisation works. Improving the position of the Glenorchy CBD could occur by leveraging these investments to connect them into the CBD as much as possible, allowing the centre to diversify from the local economic spillovers. The result is that the city centre will be more economically diverse and therefore more sustainable into the future.
Another consideration and of more relevance to this study is the more strategic use of future retail and employment demand occurring within the LGA and particularly between Moonah and the Glenorchy CBD. A key output of the retail modelling is that the results should not be seen solely as the future retail direction of a centre. Rather, any retail gaps are to be utilised strategically by being shifted in ways that enhance the strategic direction. For example, rather than allocating Moonah’s retail gap of 4,132 sqm to any future proposed development, there could be strategies put in place to shift this into the Glenorchy CBD. The same concept could apply to the 4,911 sqm of additional commercial floorspace demand. The result is that any future retail and commercial floorspace is strategically planned to benefit the Glenorchy CBD. This will ultimately assist to consolidate the Glenorchy CBD as the primary centre and reduce the likelihood that Moonah will emerge as a competing centre and gradually erode away Glenorchy’s hierarchy.
Moonah
Moonah is emerging as a key centre within the Glenorchy LGA, with a growing number of jobs and working families moving into the local area. It also has the highest retail gap of around 4,132 sqm. As per the previous recommendation, any retail gap should be considered strategically, with any future floorspace allocations in Moonah potentially shifted to the
Glenorchy identity development and precinct planning 49
Glenorchy CBD. Paradoxically, this could enhance the position of Moonah by orienting it towards more that of a high-end boutique centre. Any supply restrictions only seek to reflect the gentrification that is already occurring. It would upscale the centre, positioning Moonah as a desirable ‘destination retail’ and creative business centre. Higher rents would encourage more traditional retailers and commercial operators to shift towards the Glenorchy CBD, therefore benefitting both centres.
Claremont
Claremont is surrounded by a growing working family and elderly resident demographic. Given this trend, and the centres position as a neighbourhood centre, the focus for Claremont should be to appropriately serve its local demographic. This is supported by the Welcoming Cities Standard (2019) and Glenorchy Multicultural Community Space Plan (2016) which explains that local centres should be seen as high-quality social connectors, with planning aiming to support the needs of vulnerable target groups. Claremont’s relative distance from the economic centre of Hobart, it’s ageing population and lower socio-economic ranking on SEIFA mean that the Claremont neighbourhood centre will play a key local role. Recommendations may include enhancing the neighbourhood centre through small amenity upgrades, government services and community facilities. Given that there is a small retail gap, this could be used to ‘buffer’ against more macro-economic shifts. Rather than cater to increase the floorspace within the centre, supply could be restricted, knowing that there is a gap, to reduce the centre’s future vacancy rates and therefore enhance its viability.
4.5 Strategic considerations In order to accommodate demand for additional retail and commercial uses, while maintaining and strengthening the existing activity centre hierarchy, some considerations need to be made:
▪ The Northern Transit Corridor – if this goes ahead it creates substantial opportunities for the existing three activity centres. Around key stops along the corridor there will be opportunities for Transit-Oriented Development (TOD). TODs are higher density centres which provide a wide range of services, and also include higher density living for households benefitting from optimal access to public transport and services. TODs in turn, provide the rapid transit corridor with the passenger numbers to make it viable. The Transit Corridor will improve travel times and enable residents with a greater choice about mode of transport in addition to the car.
o To optimise the benefits and feasibility of the Northern Transit Corridor there is a need for the planning system to allow and support higher density retail, commercial and residential uses within a 500 to 900 meter radius around transit stops.
o The Northern Transit Corridor and TODs have the ability to drive substantial land value uplift as a result of improved travel times and connectivity. This uplift will be prominent for those land uses and zonings that benefit from density, pedestrian and transit connectivity: retail, commercial and residential uses.
▪ To accommodate future demand for retail and commercial uses within the existing activity centre hierarchy and to maximise land value uplift, there may be opportunities to:
o Repurpose excess and underutilised car parking. Previous parking analysis has shown that car parking around the Glenorchy CBD has relatively high vacancy rates. The highest and best use value of this land therefore may not lie in parking, but rather in retail and commercial uses.
o Consider the highest and best use value of some industrial zoned land close to residential uses and services.
▪ There may be multiple examples of sites conflicting with adjacent sensitive uses and cannot be optimally used for industrial activities.

Glenorchy identity development and precinct planning 50
▪ In addition, there will be sites that are optimally located along the Northern Transit Corridor, future TODS and/or the existing activity centres. Industrial land does not benefit much from close proximity to NTC, TODS and activity centres and vice versa.
▪ To accommodate future needs for industrial land, appropriate locations elsewhere in Glenorchy and Greater Hobart may need to be considered.

Contact us
CANBERRA Level 2, 28-36 Ainslie Place Canberra ACT 2601 +61 2 6257 4525 [email protected]
HOBART PO Box 123 Franklin TAS 7113 +61 421 372 940 [email protected]
MELBOURNE Level 14, 222 Exhibition St Melbourne VIC 3000 +61 3 8616 0331 [email protected]
SYDNEY 209/50 Holt St Surry Hills NSW 2010 +61 2 8307 0121 [email protected]