Glenn Leitch HRL Investor Day 2015
31
Jennie-O Turkey Store Glenn Leitch Group Vice President President, Jennie-O Turkey Store
-
Upload
hormel-foods-corporation -
Category
Business
-
view
80 -
download
1
Transcript of Glenn Leitch HRL Investor Day 2015

Jennie-O Turkey Store
Glenn Leitch
Group Vice President
President, Jennie-O Turkey Store

Agenda
• Industry metrics• Impact of avian influenza• Brand strength• Value added growth• Summary

Total Industry Live Weight Harvest Pounds
Jan
Feb
Mar Ap
rMay Ju
n Jul
Aug
Sep
Oct
Nov
Dec
450
500
550
600
650
700
750
2013 2014 2015
Mill
ion
Pou
nd
s

Avian Influenza ImpactJennie-O Turkey Store data as of 6/11/2015
• 66 farms impacted• 2H15 sales guidance
• Down 15% YOY
• 2H15 margin guidance• 10% to 12%

Detection of Infected Minnesota Flocks Total Poultry Industry Commercial Flocks
3/1/
2015
3/4/
2015
3/7/
2015
3/10
/201
5
3/13
/201
5
3/16
/201
5
3/19
/201
5
3/22
/201
5
3/25
/201
5
3/28
/201
5
3/31
/201
5
4/3/
2015
4/6/
2015
4/9/
2015
4/12
/201
5
4/15
/201
5
4/18
/201
5
4/21
/201
5
4/24
/201
5
4/27
/201
5
4/30
/201
5
5/3/
2015
5/6/
2015
5/9/
2015
5/12
/201
5
5/15
/201
5
5/18
/201
5
5/21
/201
5
5/24
/201
5
5/27
/201
5
5/30
/201
5
6/2/
2015
6/5/
2015
0
5
10
15
20
25
30
35
12
4
8
13
33
12 12
32
7
3

Avg. Infected Age = 15.5 weeks
0 5 10 15 20 250
5
10
15
20
25
30
Age
Cases
Ag
e
Age of Infected Commercial Flocks (initial turkey cases – JOTS only)
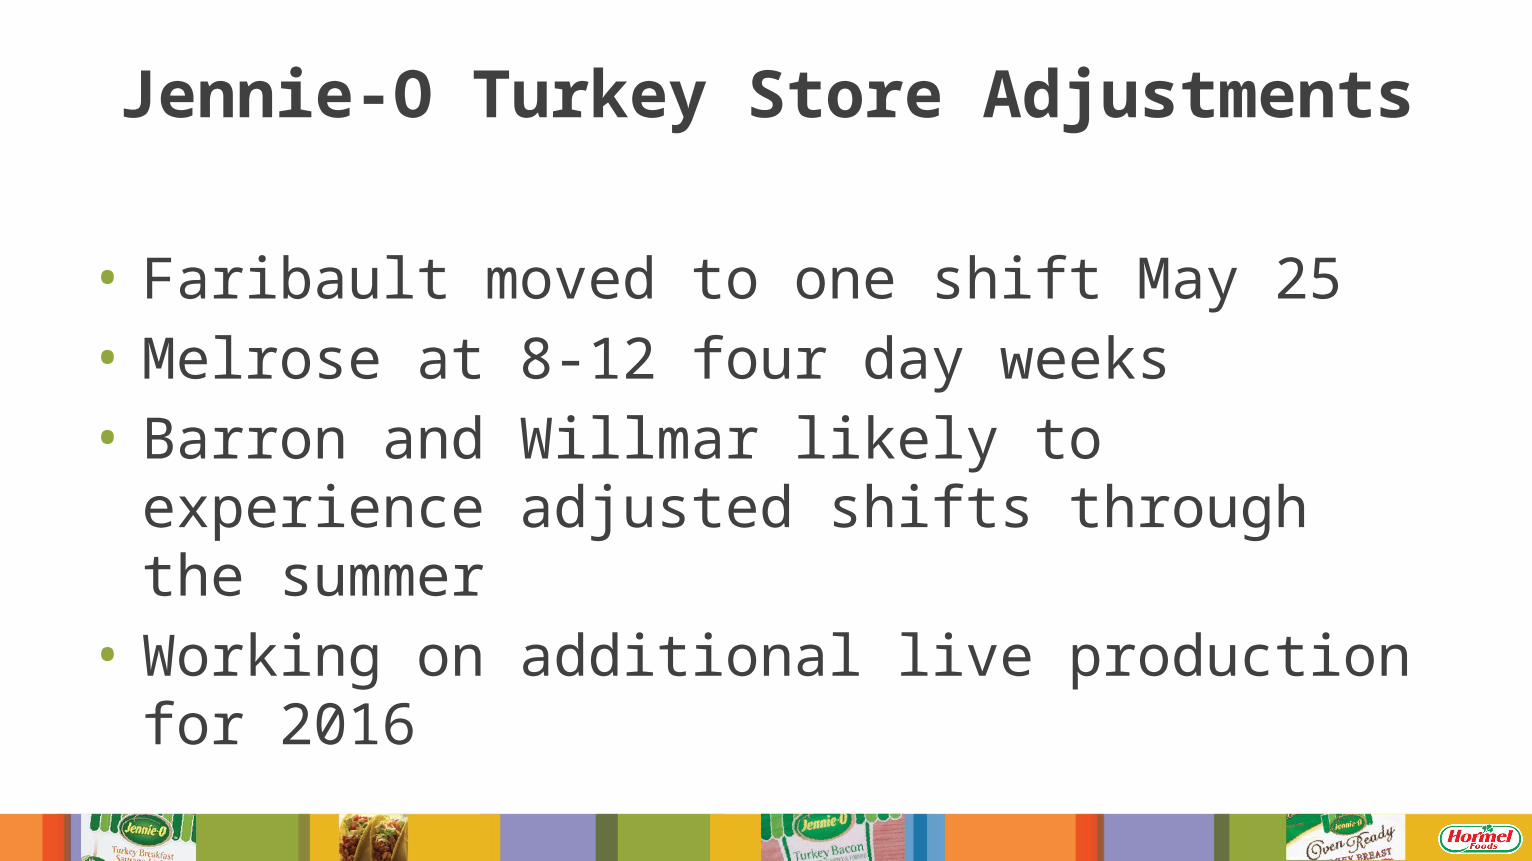
Jennie-O Turkey Store Adjustments
• Faribault moved to one shift May 25• Melrose at 8-12 four day weeks• Barron and Willmar likely to experience adjusted
shifts through the summer• Working on additional live production for 2016
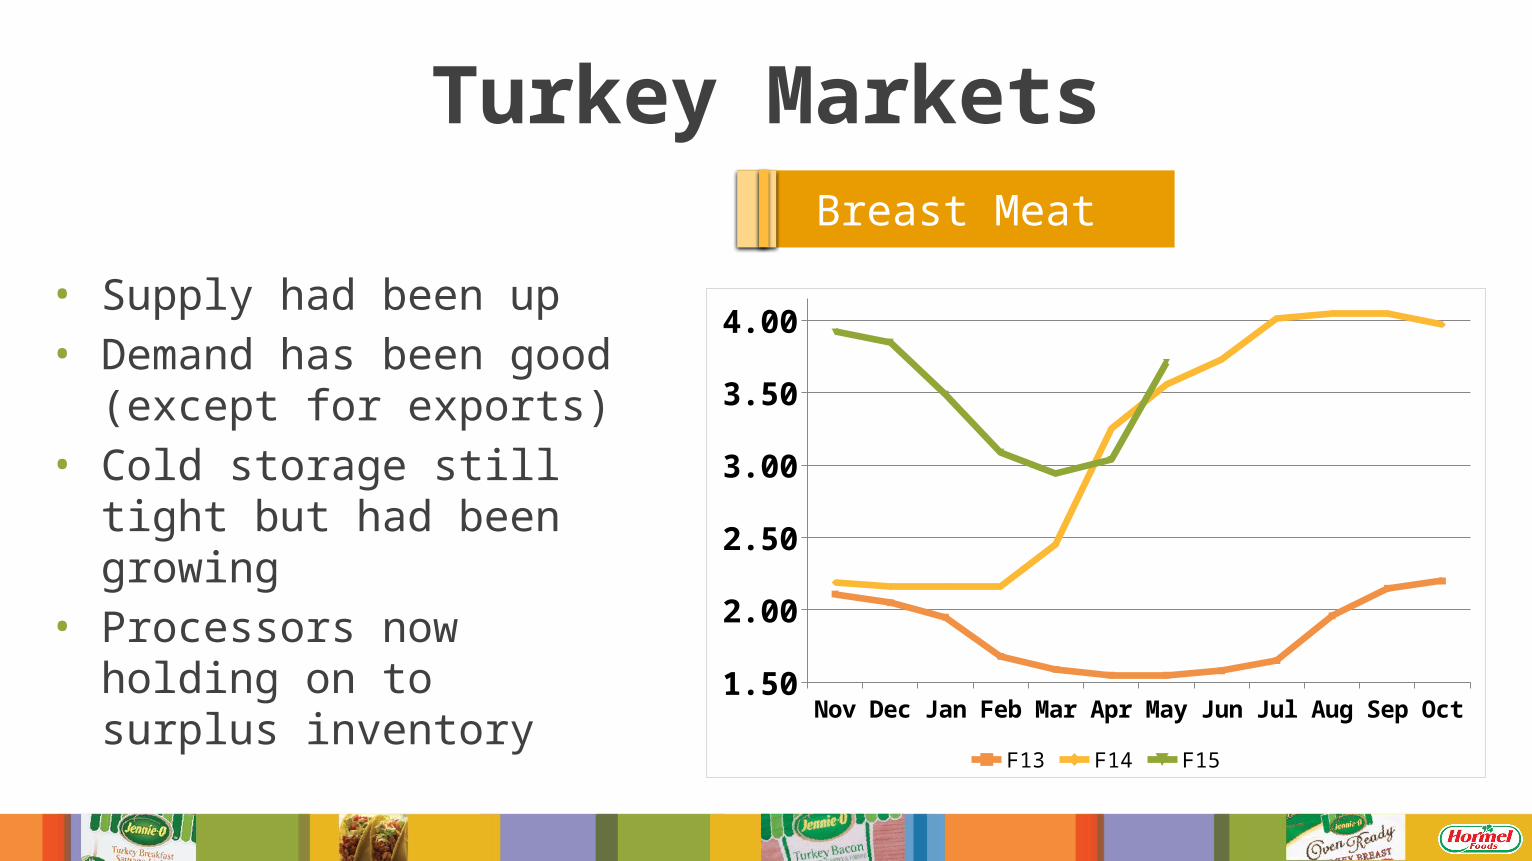
Turkey Markets
• Supply had been up• Demand has been good
(except for exports)• Cold storage still tight but
had been growing• Processors now holding on
to surplus inventory
Breast Meat
Nov Dec Jan Feb Mar Apr May Jun Jul Aug Sep Oct1.50
2.00
2.50
3.00
3.50
4.00
F13 F14 F15
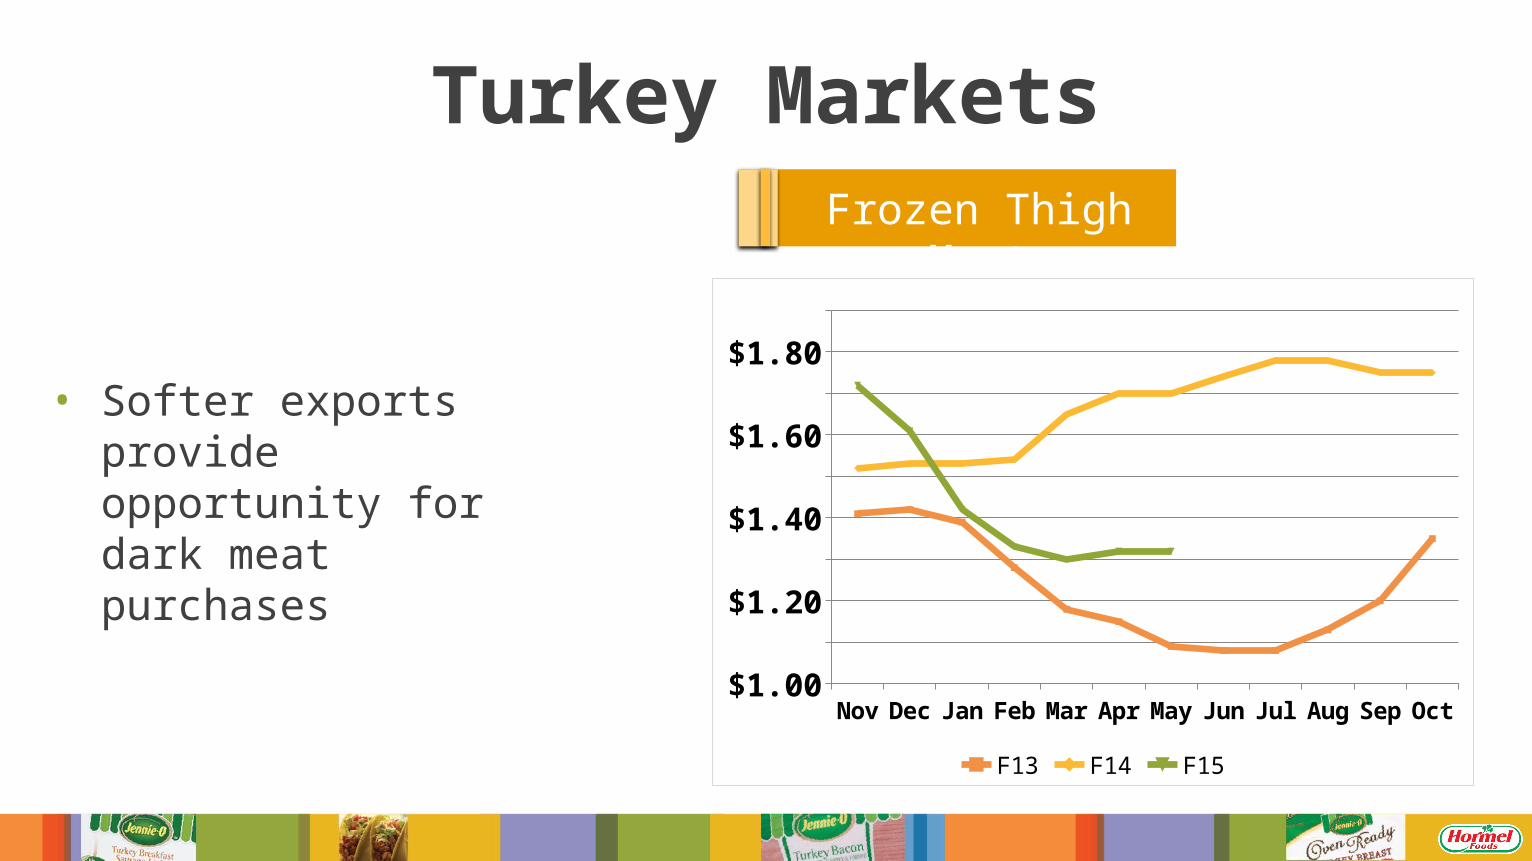
• Softer exports provide opportunity for dark meat purchases
Turkey MarketsFrozen Thigh Meat
Nov Dec Jan Feb Mar Apr May Jun Jul Aug Sep Oct$1.00$1.10$1.20$1.30$1.40$1.50$1.60$1.70$1.80$1.90
F13 F14 F15

Positioned for Long-Term Growth
2009 2010 2011 2012 2013 2014$0
$200,000
$400,000
$600,000
$800,000
$1,000,000
$1,200,000
$1,400,000
$1,600,000
$1,800,000 CAGR 6%
Net Sales
Mill
ions

28%
Total AwarenessJennie-O® Brand
Household PenetrationJennie-O® Brand
Brand LeadershipJennie-O® has emerged as a clear category leader in turkey and
the brand is now found in households nationwide.
2014
2009
Credited to ongoing advertising investment, the Jennie-O® brand has grown from 77% to
nearly 90% total awareness.
Millennials
(+0.4pt vs YAGO)
(+0.9pt vs YAGO)
24%General Population
Healthy/Holistic

Total Purchase IntentJennie-O® Brand
Brand ImageryJennie-O® Brand
Brand Leadership
2009 20140%
10%
20%
30%
40%
50%
60%
Purchase Intent (National Average)Purchase Intent (Advertised Markets)
JENNIE-O® brand is strongly associated with the following imagery:
Is good for a healthy lifestyle
Is a brand I would feel good about serving
Tastes good
54%
31%
Healthy/Holistic

Make The Switch® Campaign
Launch : 20105-Year Projected Net
Sales CAGR of Advertised Products:
+18%
Launch : 20123-Year Projected Net
Sales CAGR of Advertised Products
+39%
Launch : 20142-Year Projected Net
Sales CAGR of Advertised Products:
+19%
Healthy/Holistic

Statistics
Jennie-O Turkey Store uses a multi-prong approach to reaching consumers - from
social media to public relations, from grassroots level sampling to national
prime time television

• Health-conscious millennials are embracing “fresh” and the Jennie-O® brand
• Jennie-O® product distribution continues to expand• Ground beef price inflation is enhancing the value proposition
Driving Ground Turkey Sales Growth
Healthy/Holistic

Ground Beef
Ground TurkeyFresh ground beef and ground turkey volume change vs. LY – 13 weeks ended 1/24/15
Average retail price per pound for 13 weeks ended 1/24/15 was $4.34 +19% vs. LY
Fresh Ground Turkey Growth vs. Ground Beef
+ 12.0%
+ 15.0%
+ 9.6%
+ 21.9%
+ 16.9%
+ 11.1%
+ 11.4%
+ 14.2%
- 9.5%
- 7.4%
- 6.4%
- 7.0%
- 8.3%
- 6.9%
- 2.9%
- 7.6%
- 8.7%

Ground Turkey Share is Growing
1 Share Point = 21 Million Pounds
Pounds Sold 1.9B 264M
Retail Value $6.9B $922M
Ground Beef Ground Turkey
Source: Perishables Data
Healthy/Holistic
Share of Ground Meats
2009 2010 2011 2012 2013 2014
12.6%11.4%11.1%10.9%10.5%
9.6%

Jennie-O ® Lean Ground Turkey Ranks #2 Among All
Exact Weight Items in the Meat Department Nationally
Driving Growth: Ground Turkey
IRI: Latest 52 Weeks Ending 03-22-15
Measures : Dollar SalesProduct Total US - Multi Outlet
1 OSCAR MAYER NATURAL HARDWOD SMKD BACON SLICED RFG 16 OZ - 0044700019881 $234,025,1662 JENNIE O TURKEY STORE RFG REGULAR TURKEY GROUND 20 OZ - 0039272020011 $166,840,9163 PRIVATE LABEL FROZEN REGULAR CHICKEN FILLET 48 OZ - 10589237 $157,967,6814 PRIVATE LABEL RFG REGULAR BEEF 80 OZ - 35626042 $150,967,1715 BAR S RFG CHICKEN AND PORK FRANK 8 CT 12 OZ - 0015900134011 $142,080,4726 PRIVATE LABEL RFG REGULAR BEEF 48 OZ - 35625782 $139,005,0807 PRIVATE LABEL RFG REGULAR BEEF 16 OZ - 35625635 $136,772,4788 JIMMY DEAN RFG REGULAR SAUSAGE 16 OZ - 0077900115533 $127,447,9089 HORMEL BLACK LABEL REGULAR BACON SLICED RFG 16 OZ - 0037600351601 $126,369,508
10 PRIVATE LABEL RFG REGULAR BEEF 80 OZ - 35626043 $124,382,748
3 Year CAGRFresh Ground Turkey without Jennie-O Turkey Store = 6%
Jennie-O Turkey Store fresh ground turkey = 16%Healthy/Holistic

Driving Growth: Fresh Breakfast Sausage Rolls
IRI - LASTEST 13 WEEKS ENDING 3-15-15 Current%Change vs
YAChange vs YA
JIMMY DEAN PORK SAUSAGE ROLL 16OZ 9,524,351 5.8% 524,357JIMMY DEAN HOT PORK SAUSAGE ROLL 16OZ 4,401,424 6.5% 268,442ODOMS TENNESSEE PRIDE MILD PORK SAUSAGE ROLL 16OZ 4,274,042 10.3% 398,750BOB EVANS PORK SAUSAGE ROLL 16OZ 2,690,270 -1.3% -34,092JIMMY DEAN SAGE PORK SAUSAGE ROLL 16OZ 2,310,697 -0.6% -14,220JENNIE-O TURKEY STORE MILD TURKEY BREAKFAST SAUSAGE ROLL 16OZ 1,789,945 23.9% 344,706
Volume Sales
3 Year CAGR = 132%
Ranked 6th Nationally Among all Roll Sausage SKU’s
3 years ago 2 years ago 1 year ago 52 Wks Ending 3-15-15
Healthy/Holistic

Driving Growth: Oven Ready
From Freezer to Oven to Perfect!Oven Ready Shipped Volume 3 Year CAGR = 13%
Healthy/Holistic
3 years ago 2 years ago 52 Wks Ending 3-15-15

Driving Growth: Turkey Breast SticksNEW PRODUCT : All Natural Turkey Breast Sticks
• Single-serve packaging• Clean ingredient statement• Portable
On-the-Go
Healthy/Holistic
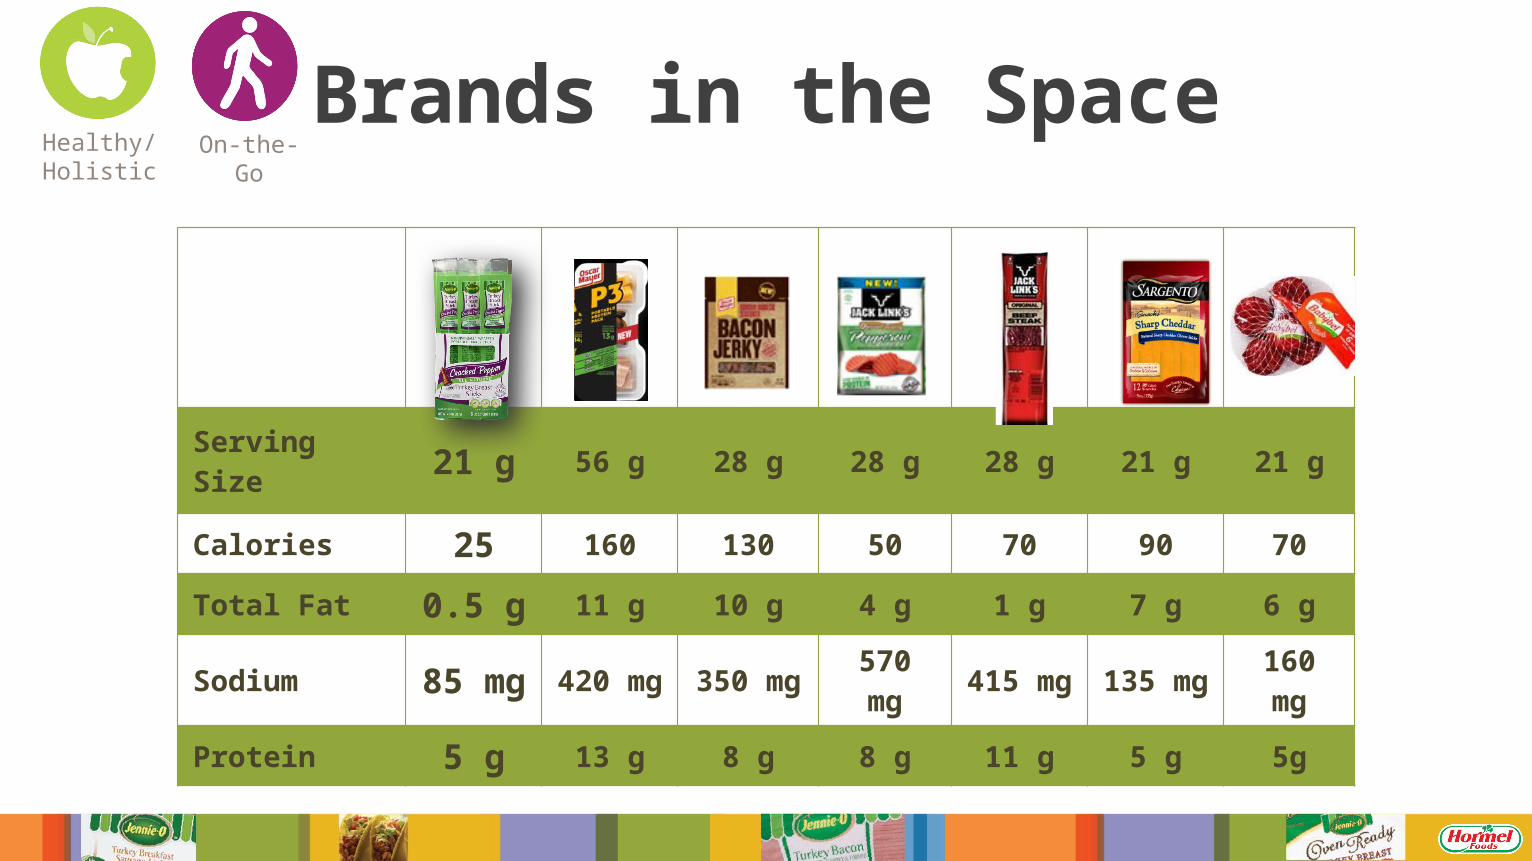
Brands in the Space
Serving Size 21 g 56 g 28 g 28 g 28 g 21 g 21 g
Calories 25 160 130 50 70 90 70
Total Fat 0.5 g 11 g 10 g 4 g 1 g 7 g 6 g
Sodium 85 mg 420 mg 350 mg 570 mg 415 mg 135 mg160 mg
Protein 5 g 13 g 8 g 8 g 11 g 5 g 5g
On-the-Go
Healthy/Holistic

2015 Foodservice Growth Drivers
Sector / Category % Chg Lbs. LY
National Accounts 14%
K-12 Schools 7%
Street Business 6%
Breakfast Category 15%
Cooked Breast Category 9%
Sliced Breast Category 5%
Healthy/Holistic

2015 Turkey Takeovers
Student Dining Center Colorado State University, Fort Collins, CO
Completed 4/15
Student Dining Center Colorado State University, Fort Collins, CO

2015 Turkey Takeovers Video

Menu Maximizer
*The customer can select the protein that they are currently using on their menu
Healthy/Holistic
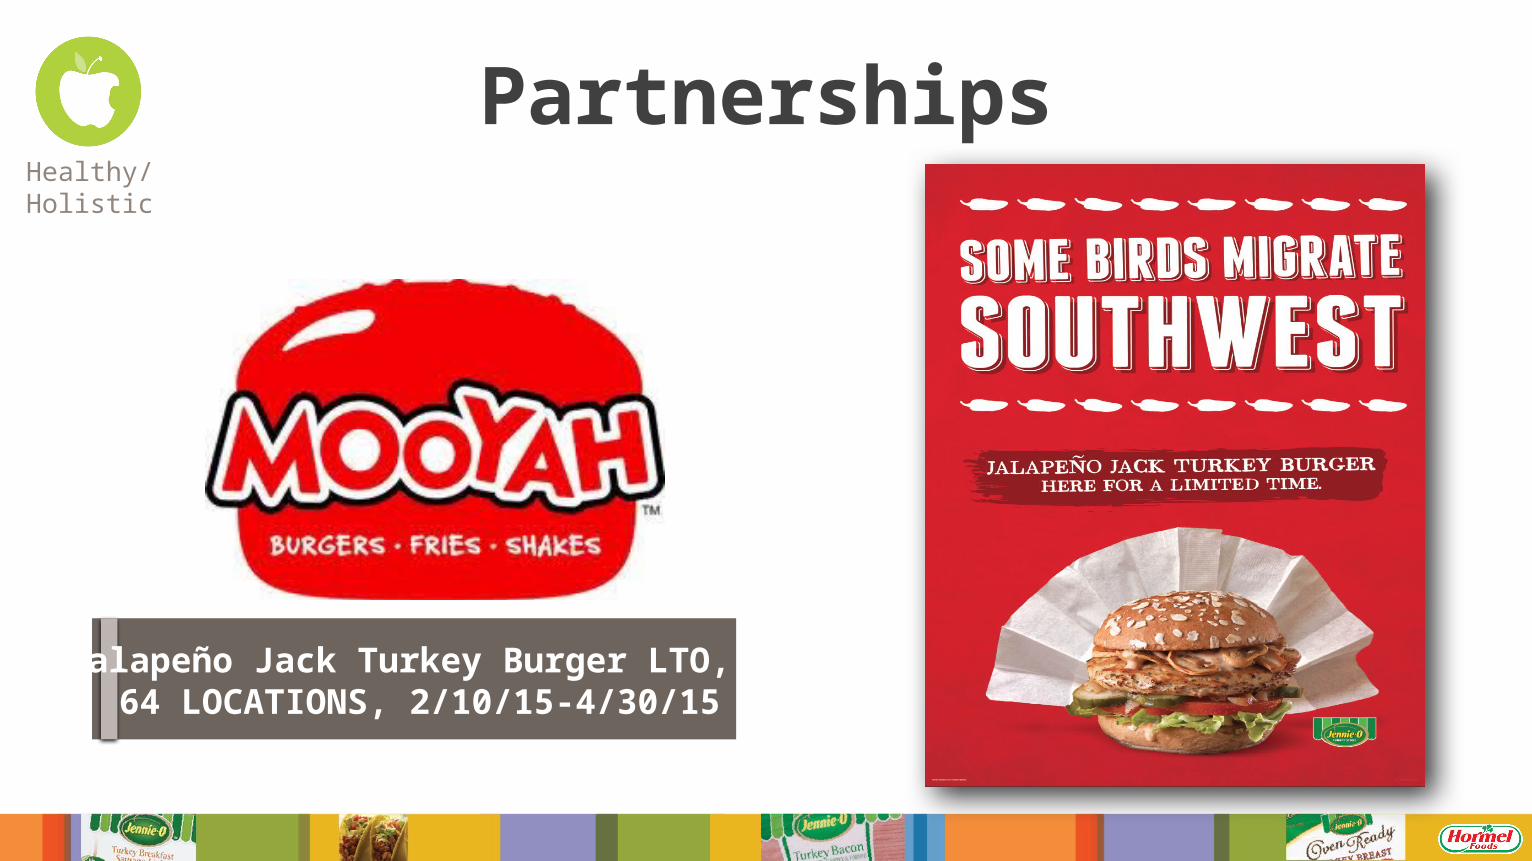
Partnerships
Jalapeño Jack Turkey Burger LTO, 64 LOCATIONS, 2/10/15-4/30/15
Healthy/Holistic

Premium Position in Deli
Healthy/Holistic

Premium Deli Products
3-Yr CAGR2013-15
Premium Behind The Glass
15.7% Sales Growth*
Industry 3% Sales Growth
• Premium deli• Branded distribution targets tied
to retail tray pack
• Multi protein• Project “One Look” with
Hormel Foods• Local and national
• Authentic grab & go• Portions, medallions, shredded
& thick sliced • Portioned and prepackagedHealthy/
Holistic
Initiatives
*Estimate based on internal Jennie-O Turkey Store data

Summary
• Great first half• Retail dollar sales up 11%• Foodservice dollar sales up 11%• Deli dollar sales up 14%
• Significant second half challenges due to avian influenza
• Strong relationships
• Experienced team

Jennie-O Turkey Store


![[MS-HRL]: Hyper-V Replica Log (HRL) File Format...FileType: This field identifies the type of the log file. For an HRL file, this field’s value is set to 0. For an HRL file, this](https://static.fdocuments.net/doc/165x107/5f3c75afbcdce535f956eeb6/ms-hrl-hyper-v-replica-log-hrl-file-format-filetype-this-field-identifies.jpg)