Glaxo SmithKline Consumer Healthcare Ltd Analyst …...Quarter Highlights Impressive Sales Growth at...
13
Glaxo SmithKline Consumer Healthcare Ltd Analyst Presentation Q 2 2011 Update 3 rd August 2011
Transcript of Glaxo SmithKline Consumer Healthcare Ltd Analyst …...Quarter Highlights Impressive Sales Growth at...
Glaxo SmithKline Consumer Healthcare Ltd Analyst Presentation
Q 2 2011 Update
3rd August 2011

AGENDA
Quarter highlights
Financial Performance
Working Capital
Market Performance

Quarter Highlights
Impressive Sales Growth at 22% • Driven by strong volume growth of 16%• Best in the FMCG sector in volume
Investments behind brands continue ; A&P growing at 33%
Cost of goods sold higher by 300 bps • High Input costs • Planned lower production• Emphasis on Cost reduction initiatives
Operating profits grew by 13% ; PBT margins slightly higher at 14% leveraging treasury initiatives
PAT at Rs 83 crs grew by 15% Q on Q

Sustained Growth….
Rs in crs
567
689
Q 2 10 Q 2 11
Sales (Gross)
537
653
Q 2 10 Q 2 11
Sales (Net)
72
82
Q 2 10 Q 2 11
PAT
108
122
Q 2 10 Q 2 11
PBT
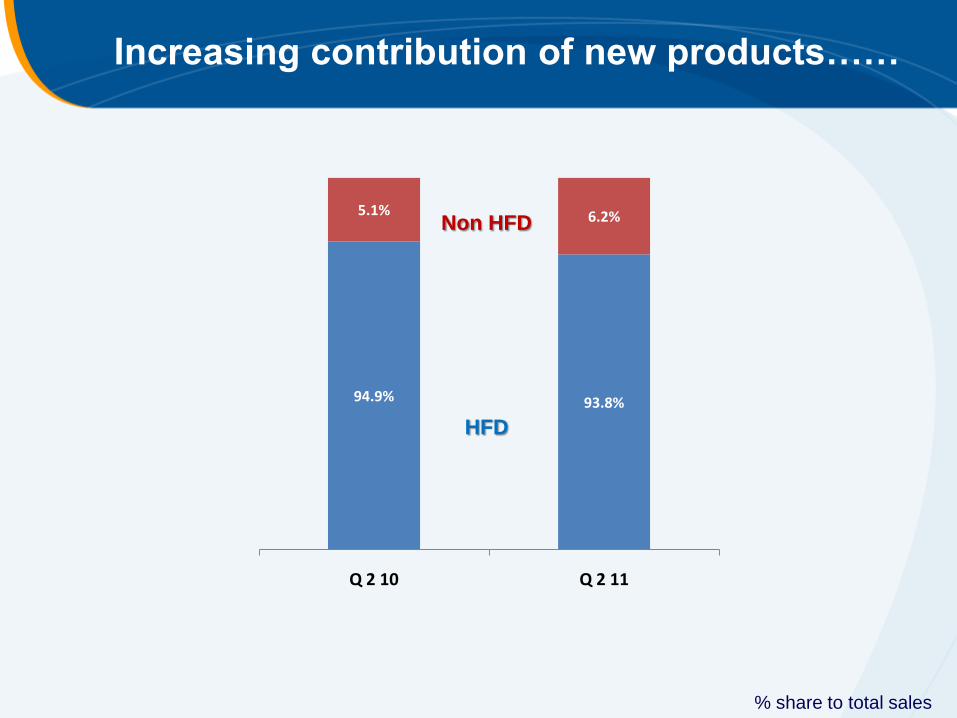
94.9% 93.8%
5.1% 6.2%
Q 2 10 Q 2 11
Increasing contribution of new products……
% share to total sales
Non HFD
HFD

Regional Split
% share to total sales
89%
11%
Domestic Exports
6%
34%
44%
4% 11%
North East South West Exports
% Increase in regions
Region % Inc
North 31%
South 16%
East 20%
West 16%
Exports 57%

5.9%15.5 %
Q on Q sales growth
Price
VolumeOverall Growth
21.4%
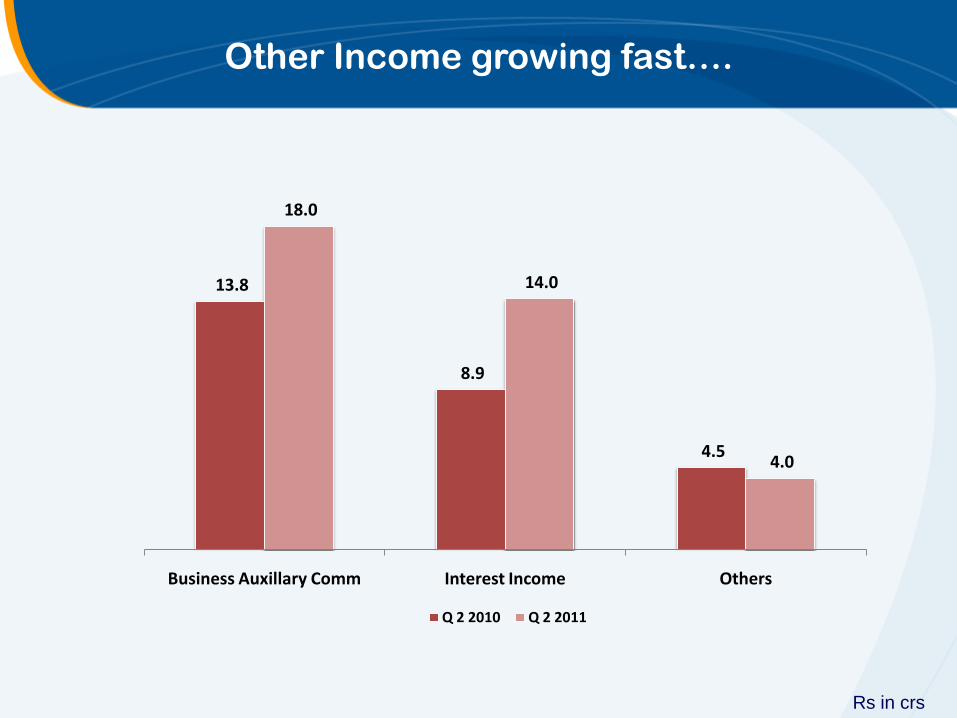
Other Income growing fast….
Rs in crs
13.8
8.9
4.5
18.0
14.0
4.0
Business Auxillary Comm Interest Income Others
Q 2 2010 Q 2 2011

Inflationary trend in input costs
Q1 2010 Q2 2010 Q3 2010 Q4 2010 Q 1 2011 Q 2 2011
Wheat Floursoftening a bit
18
19
20
21
22
23
24
25
Q1 2010 Q2 2010 Q3 2010 Q4 2010 Q 1 2011 Q 2 2011
Malted Barleyhigh inflation continues
16%
120 125 130 135 140 145 150 155 160 165 170 175
Q1 2009
Q2 2009
Q3 2009
Q4 2009
Q1 2010
Q2 2010
Q3 2010
Q4 2010
Q 1 2011
Q 2 2011
SMP16%
-
5
10
15
20
25
30
35
40
45
Q1 2009
Q2 2009
Q3 2009
Q4 2009
Q1 2010
Q2 2010
Q3 2010
Q4 2010
Q 1 2011
Q 2 2011
Sugarstill on the higher side20% at all time high levels
6%
Represents Q on Q inflation
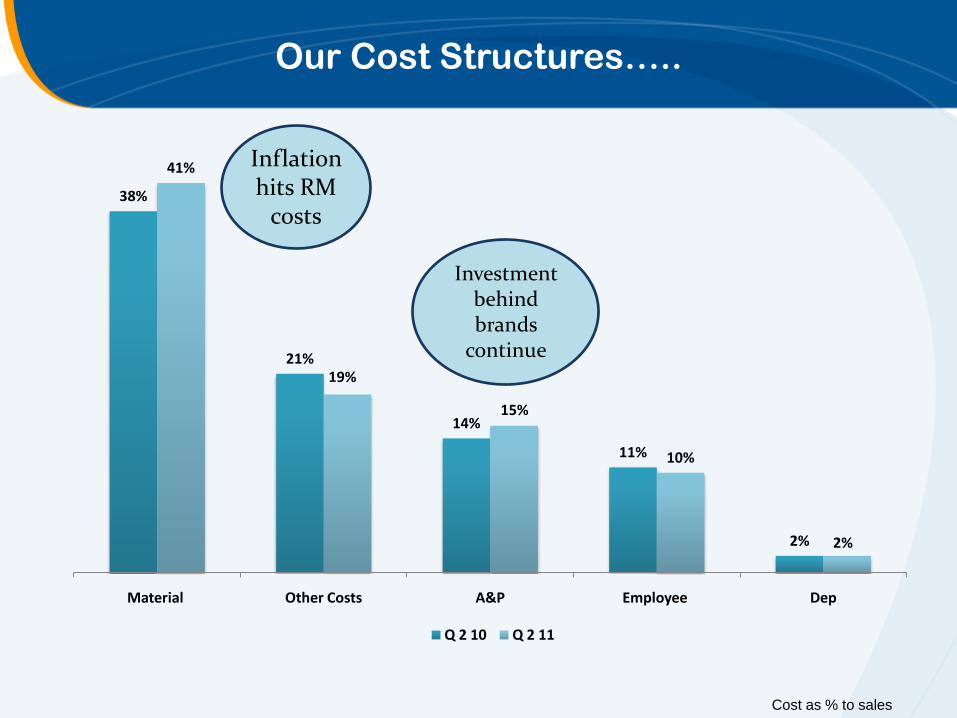
Our Cost Structures…..
Cost as % to sales
38%
21%
14%
11%
2%
41%
19%
15%
10%
2%
Material Other Costs A&P Employee Dep
Q 2 10 Q 2 11
Inflation hits RM
costs
Investmentbehind brands
continue

Sustained Negative Working Capital …..
109
43
(61)(69)
(118)
(65)
(160)
(108)
(211)
(102)
(250)
(200)
(150)
(100)
(50)
-
50
100
150
Mar-09 Jun-09 Sep-09 Dec-09 Mar-10 Jun-10 Sep-10 Dec-10 Mar-11 Jun-11
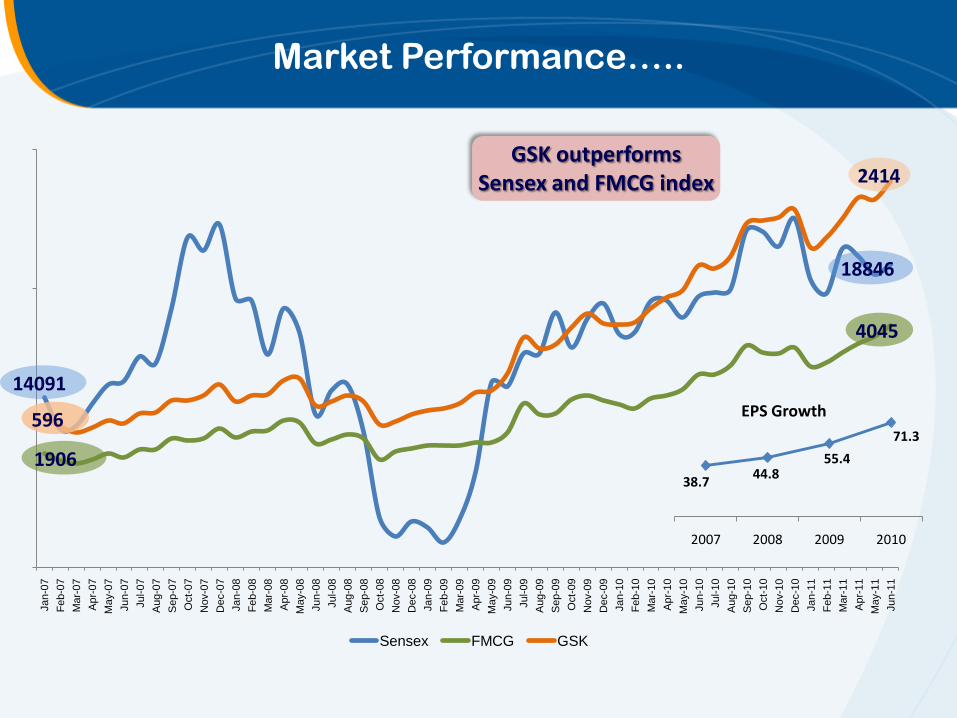
Market Performance…..Jan-0
7
Fe
b-0
7
Mar-
07
Apr-
07
May-0
7
Jun-0
7
Jul-07
Aug-0
7
Sep-0
7
Oct-
07
Nov-0
7
Dec-0
7
Jan-0
8
Fe
b-0
8
Mar-
08
Apr-
08
May-0
8
Jun-0
8
Jul-08
Aug-0
8
Sep-0
8
Oct-
08
Nov-0
8
Dec-0
8
Jan-0
9
Fe
b-0
9
Mar-
09
Apr-
09
May-0
9
Jun-0
9
Jul-09
Aug-0
9
Sep-0
9
Oct-
09
Nov-0
9
Dec-0
9
Jan-1
0
Fe
b-1
0
Mar-
10
Apr-
10
May-1
0
Jun-1
0
Jul-10
Aug-1
0
Sep-1
0
Oct-
10
Nov-1
0
Dec-1
0
Jan-1
1
Fe
b-1
1
Mar-
11
Apr-
11
May-1
1
Jun-1
1
Sensex FMCG GSK
18846
4045
2414
1906
596
GSK outperforms Sensex and FMCG index
14091
38.7 44.8
55.4
71.3
2007 2008 2009 2010
EPS Growth
Thank you


![Foro de la OMPI para Jueces de Propiedad Intelectual de 2019 · of Food & Drugs and Glaxo SmithKline, asunto N.º 149907 − Tribunal de Casación de Turquía [2014]: Merinos v n11.com,](https://static.fdocuments.net/doc/165x107/5fcc233718f5196d093fddfa/foro-de-la-ompi-para-jueces-de-propiedad-intelectual-de-2019-of-food-drugs.jpg)