
Glaucoma Workplace 3 - zeiss.com · Glaucoma Workplace Preface 000000-2231-545-GA-US-210817 Page 7...
118
Glaucoma Workplace Software version 3.1 Document set
Transcript of Glaucoma Workplace 3 - zeiss.com · Glaucoma Workplace Preface 000000-2231-545-GA-US-210817 Page 7...

Glaucoma Workplace
Software version 3.1
Document set


Contents
Glaucoma Workplace Instructions for UseSoftware version 3.1
[000000-2231-545-GA-US-210817]1
000000-2231-545-Contents-US


Glaucoma Workplace
Software version 3.1
Instructions for Use

About this manual The sample patient data shown is fictitious. Any similarity to living persons is therefore purely coincidental.
Area of application This manual is intended for the Glaucoma Workplace software version 3.1.
Informationon the manufacturer
Subject to change in design and scope of delivery and as a result of ongoing technical development. Printed in Germany.
© Carl Zeiss Meditec AG 2017
Trademarks FORUM, Humphrey and VISUPLAN are trademarks of Carl Zeiss Meditec, Inc. that are registered in the United States and/or other countries.
Any other trademarks mentioned in this document are the property of the respective owner.
Document number and language version 000000-2231-545-GA-US
Version 3.1
Date 210817
Carl Zeiss Meditec AGGoeschwitzer Str. 51–5207745 JenaGermany
E-mail: [email protected]: www.zeiss.com/med

Glaucoma Workplace Chapter overview
Chapter overview
Preface.............................................................................................. 7
Hazard symbols in these Instructions for Use ............................................... 7
Software description ................................................................................... 7
CE conformity ............................................................................................. 8
Symbols ...................................................................................................... 8
Chapter 1: Safety measures ............................................................................... 9
Protective measures for IT systems and networks ........................................ 9
Data protection and information security .................................................. 10
Connection to data networks .................................................................... 11
Suitable hardware platform....................................................................... 11
Important information for users ................................................................ 11
Intended Use/ Indications for Use .............................................................. 13
Normal Use .............................................................................................. 14
Chapter 2: Requirements, installation, and troubleshooting ............................ 15
Requirements ............................................................................................ 15
System configuration requirements...................................................... 16
Hardware platform requirements......................................................... 16
Software platform requirements .......................................................... 17
Installing Glaucoma Workplace ................................................................. 18
Obtaining licenses ............................................................................... 18
Installing Glaucoma Workplace server software ................................... 18
Configuring your firewall ..................................................................... 20
Configuring your virus protection software.......................................... 20
Troubleshooting ........................................................................................ 21
000000-2231-545-GA-US-210817 Page 3

Chapter overview Glaucoma Workplace
Chapter 3: Getting started with Glaucoma Workplace ..................................... 23
Opening Glaucoma Workplace.................................................................. 23
Configuring Glaucoma Workplace............................................................. 25
Opening the configuration window..................................................... 25
Configuring general settings................................................................ 26
Configuring display settings................................................................. 27
Configuring automatic reports............................................................. 27
Configuring data export ...................................................................... 28
Configuring data caching .................................................................... 29
Configuring user-specific settings ........................................................ 29
Chapter 4: Glaucoma Workplace overview ....................................................... 30
Key to abbreviations ................................................................................. 30
MD and PSD Labeling ............................................................................... 31
"Visual Field GPA" Preselection.................................................................. 33
"Visual Fields - Overview" Preselection ...................................................... 35
"Visual Fields - Browser" Preselection ........................................................ 36
"Structure-Function GPA" Preselection ...................................................... 37
Viewing and adding comments................................................................. 39
Adding comments to an exam ............................................................ 39
Viewing comments for an exam .......................................................... 41
Viewing exam reliability indicators ........................................................... 41
Using Gaze Tracker information........................................................... 41
Viewing RelEYE data ........................................................................... 42
Chapter 5: Working with the GPA tools ........................................................... 45
Using the tool bars.................................................................................... 46
Zooming in and out............................................................................. 46
Selecting the time axis units ................................................................ 47
Page 4 000000-2231-545-GA-US-210817

Glaucoma Workplace Chapter overview
Working with the Visual Field regression plot ............................................ 48
Selecting the VF regression plot type ................................................... 50
Hiding and showing the confidence bands .......................................... 51
Selecting the test strategy.................................................................... 52
Working with baseline and follow-up exams ............................................. 53
Selecting baseline and follow-up exams............................................... 53
Setting a dual baseline......................................................................... 55
Excluding and including HFA exams..................................................... 57
Working with clinical events...................................................................... 58
Working with event templates............................................................. 60
Additional tools for the "Visual Field GPA" Preselection ............................ 62
Working with IOP and CCT values ....................................................... 62
Walking through the follow-up exams................................................. 63
Additional tools for the "Structure-Function GPA" Preselection.................. 64
Selecting metrics for OCT Trend Analysis ............................................. 64
To change the analysis display ............................................................. 65
Selecting the display mode for the timeline.......................................... 65
Connecting to CIRRUS Review Software .............................................. 67
Importing updated CIRRUS data .......................................................... 67
Chapter 6: Creating and printing reports ......................................................... 68
Creating and customizing reports .............................................................. 69
Creating GPA reports........................................................................... 69
Creating SFA reports............................................................................ 70
Creating a report for an individual visual field exam............................. 70
Creating Structure-Function reports ..................................................... 72
Viewing and printing reports ..................................................................... 75
Viewing reports ................................................................................... 75
Printing reports.................................................................................... 76
Overview of reports................................................................................... 77
Overview report................................................................................... 77
Single Field Analysis report .................................................................. 79
000000-2231-545-GA-US-210817 Page 5

Chapter overview Glaucoma Workplace
GPA Summary report........................................................................... 81
Single Field Analysis with GPA ............................................................. 83
Full GPA report ................................................................................... 85
Last Three GPA Follow-up report ........................................................ 88
Structure-Function GPA report ............................................................ 89
Structure-Function OU (Single Exam) reports ....................................... 92
Index ............................................................................................ 100
Page 6 000000-2231-545-GA-US-210817
Glaucoma Workplace Preface
Preface
Hazard symbols in these Instructions for Use
The following safety information has been incorporated in the Instructions for Use. Please note this information and be particularly careful in these cases.
Software description
Glaucoma Workplace is a software application that is integrated into FORUM®. It is designed for processing and displaying visual field data, includ-ing the Guided Progression Analysis (GPA) and Optical Coherence Tomogra-phy (OCT) data.
Glaucoma Workplace makes it possible to carry out visual field and OCT analyses for progression based on the various existing data for a patient and to create Structure-Function reports. The software uses existing raw data collected in FORUM from devices used for visual field exams, Optical Coher-ence Tomography (OCT) device data, and fundus images taken using the following devices:
– ZEISS Humphrey® Field Analyzer (HFA) devices, including the Humphrey Field Analyzer 3 (HFA3), for visual field reports
– ZEISS CIRRUS OCT devices (analysis of the back ocular segment)
– Any fundus camera (fundus images stored in DICOM-compatible format)
Not all features are available in all markets.
NOTE Indicates a hazard which might result in injuries or impairments which are not serious.
000000-2231-545-GA-US-210817 Page 7

Preface Glaucoma Workplace
CE conformity
The product satisfies the fundamental requirements laid down in Annex I of the 93/42/EEC Directive governing medical devices. The product is labeled with:
Symbols
The following symbols are used in this Instructions for Use:
Additional information and tips. This symbol indicates useful additional information only and does not indicate any kind of hazard.
The following symbols are used on the label:
Indicator for electronic Instructions for Use (eIFU)
Please follow the Instructions for Use.
Manufacturing date
Manufacturer
Page 8 000000-2231-545-GA-US-210817

Glaucoma Workplace Chapter 1: Safety Measures
Chapter 1: Safety measures
Protective measures for IT systems and networks
The Glaucoma Workplace software may be operated only in virus-protected networks. The operator of the network is responsible for the security of the network.
– The consequences of virus attacks cannot be foreseen.
– The user of Glaucoma Workplace is responsible for ensuring that external storage media (for example, USB thumb drives) that are used for data exchange are free from viruses.
– There is a risk of data corruption or data loss if devices are connected that do not meet the requirements of the FORUM DICOM Conformance State-ment (DICOM: Digital Imaging and Communication in Medicine).
– The user should carry out a risk analysis and risk evaluation and take the appropriate counter-measures if necessary. This must be updated after each change to the (data) network.
000000-2231-545-GA-US-210817 Page 9

Chapter 1: Safety Measures Glaucoma Workplace
Data protection and information security
– The user or IT officer must ensure compliance with the national laws and regulations relating to data protection.
– The operators of IT systems and IT networks are responsible for the definition of the safety standards required—that is, for the creation of the necessary technical and organizational framework.
– Misuse exists if protected personal data is collected, processed or used without proper authorization.
Please note the following definitions:
– Personal data means any information concerning the personal or material circumstances of an identified or identifiable individual. All data directly attributable to a person (patient, employee, customer, supplier)—for example, marital status, type of employment, religion, income—must be protected.
– Data processing means the storage (entry, recording or preservation), transfer (transmission to third parties outside the organization), modifica-tion (alteration of the substance, including anonymization and aliasing), erasure (deletion) and blocking (labeling so as to restrict further process-ing or use) of data.
– Use means any utilization of data (for example, in-house transmission).
– Recipient means any person or body receiving data.
– Third party means any person or body other than the responsible body (legal entity). The transmission of data to third parties is deemed to con-stitute data transfer.
Page 10 000000-2231-545-GA-US-210817

Glaucoma Workplace Chapter 1: Safety Measures
Connection to data networks
When the software transmits data to the data network or when data is made available in the data network, there is always the risk that this data is falsified or transferred incompletely. For this reason, no liability can be accepted for the correctness of the data.
The operator of the data network is responsible for compliance with the legal requirements regarding data protection and for the protection of personal rights.
Suitable measures must be taken to ensure that only authorized users can access computers on which Glaucoma Workplace is installed—for example, by locking the computer.
Suitable hardware platform
The use of an unsuitable hardware platform may impair the function of the software. You are responsible for the correct selection and function of the hardware.
Important information for users
• These Instructions for Use explain how to use Glaucoma Workplace, which uses data and analyses from HFA and CIRRUS instruments. HFA and CIRRUS functionality, terminology, analysis tools, and interpretation guidelines are not explained in these Instructions for Use under the assumption that the user is already familiar with them. For more informa-tion, please refer to HFA and/or CIRRUS user documentation.
• Make sure that you are thoroughly familiar with the contents of the Instructions for Use before operating the software. Also read the Instruc-tions for Use pertaining to the devices and systems to be connected.
000000-2231-545-GA-US-210817 Page 11

Chapter 1: Safety Measures Glaucoma Workplace
• Rx OnlyCaution: Federal (USA) Law restricts this device to sale by or on order of a physician.
• Please keep the Instructions for Use where it is easily accessible to operat-ing staff at any time.
• Glaucoma Workplace may only be used by staff who have undergone appropriate training and instruction. The customer or institution operating the software is responsible for providing training and instruction courses for the relevant staff.
• Glaucoma Workplace may only be used by trained healthcare professionals.
• Make sure you are familiar with the user settings of the software.
• Use the software only for the intended purpose as described.
• Warranty and liability are determined by the specific provisions in the contract.
• The manufacturer does not accept any liability for damage caused by unauthorized persons tampering with the product. Furthermore, any rights to claim under warranty would be null and void.
• Modifications to this product are not permitted. Performing any modi-fications to the device not described in these Instructions for Use makes you a legal manufacturer of a medical device as defined under national regulations.
• Glaucoma Workplace is a FORUM application. This software has been designed in accordance with U.S., European and other international med-ical device standards. Unauthorized modification of this software can jeopardize its performance as well as the integrity of patient data. Unau-thorized modification also voids the software warranty.
NOTE The probability statements in GPA and the STATPAC statistical page are an aid to interpretation, not a diagnosis. Note that statistical significance is not the same as clinical significance; the doctor’s judgment is still the most important element in determining the clinical significance of perimetric findings. The probability statements are based on the distribution seen in a reference nor-mative database study population. Some patients commonly seen in a clinical practice may not meet the criteria of normality (for example visual acuity) which had to be applied in creating a normals database. These patients may fall outside normal limits established in this statistical package for reasons other than field loss, such as cataracts.
RAXXX
Page 12 000000-2231-545-GA-US-210817

Glaucoma Workplace Chapter 1: Safety Measures
Safe working order
The Glaucoma Workplace product is a supporting system and does not assume any diagnostic functions that are critical to safety. Treatments can be performed without Glaucoma Workplace at any time.
Intended Use/ Indications for Use
Glaucoma Workplace is a FORUM software application intended for the management, display, and analysis of visual field and optical coherence tomography data. Glaucoma Workplace is indicated as an aid to the detec-tion, measurement, and management of visual field defects and progression of visual field loss.
Glaucoma Workplace is also intended for generating reports that contain results from perimetry, optical coherence tomography and fundus photography.
Glaucoma Workplace implements Cirrus algorithms and normative databases for retinal nerve fiber layer thickness, ganglion cell plus inner plexiform thick-ness and optic nerve head measurement and Humphrey Field Analyzer algo-rithms and databases for visual field measurements and Guided Progression Analysis.
NOTE The GPA and STATPAC statistical packages and OCT analysis in Glaucoma Workplace are solely an aid to the practitioner in making medical decisions. The practitioner must bear the ultimate responsibility for all decisions. Rules of common medical sense must be applied when using Glaucoma Workplace. For details on the statistical analysis package and underlying normative patient databases, please refer to HFA and/or CIRRUS user documentation.
RA013
NOTE If a failure occurs that you cannot correct using the instructions in "Trouble-shooting" on page 21, attach an out-of-order notice to the computer and contact the ZEISS Service.
RA037
000000-2231-545-GA-US-210817 Page 13

Chapter 1: Safety Measures Glaucoma Workplace
Normal Use
Glaucoma Workplace is an optional, additional application to FORUM, which is offered separately. It integrates the following complementary functions into FORUM:
– Processing and displaying visual field data and optical coherence tomography (OCT) data
– Generating visual field reports
– Generating reports that contain results from perimetry, OCT, and fundus photography
– Providing CIRRUS algorithms and databases for retinal nerve fiber layer thickness (RNFL), ganglion cell plus inner plexiform thickness, optic nerve head (ONH) measurement, and Guided Progression Analysis (GPA). For details about CIRRUS algorithms and databases, please refer to CIRRUS user documentation.
– Providing Humphrey Field Analyzer (HFA) algorithms and databases for visual field measurements and GPA. For details about HFA algorithms and databases, please refer to HFA user documentation.
– Aiding trained healthcare professionals in the detection, measurement, and management of visual field defects and progression of visual field loss.
Page 14 000000-2231-545-GA-US-210817
Glaucoma Workplace Chapter 2: Requirements, installation, and troubleshooting
Chapter 2: Requirements, installation, and troubleshooting
This chapter explains the requirements for using Glaucoma Workplace. You’ll also find installation instructions and information about troubleshooting.
Requirements
Glaucoma Workplace integrates into an existing FORUM client-server installa-tion. Typically at least two computers are used: 1) a system that hosts both the FORUM server and Glaucoma Workplace server software, and 2) the PC that hosts both the FORUM client and the Glaucoma Workplace client. How-ever, you can configure both clients and both servers on the same machine. That is, both clients (FORUM client and Glaucoma Workplace client) and both servers (FORUM server and the Glaucoma Workplace server software) can be installed on the same physical system.
000000-2231-545-GA-US-210817 Page 15

Chapter 2: Requirements, installation, and troubleshooting Glaucoma Workplace
System configuration requirements
– FORUM 4.1 or higher must be installed and be working.
– The computers and other ZEISS devices in your practice must be net-worked. You are responsible for setting up the network.
To install and configure Glaucoma Workplace, personnel at the customer’s site must have the following qualifications:
– Knowledge and authorization to configure and act as a system administrator for medical device software
– Familiarity with local hardware and software and the IT network
– System administrator rights to work with the relevant IT system components
– Knowledge and authorization to configure the locally used firewall, including the management and unblocking of ports
– Knowledge and authorization to configure the locally used anti-virus soft-ware, including the ability to deactivate this software during installation and to exclude certain folders
If you don't have the requisite IT system expertise available in your practice or if you simply prefer to have Glaucoma Workplace installed by a ZEISS Service technician, please contact the ZEISS Service. If a service technician installs the Glaucoma Workplace software, please make sure that the briefing protocol is filled out and signed.
Hardware platform requirements
Your system must meet these minimum requirements in order to function properly:
– Intel Core i5-750 Processor or similar
– A minimum of 8 GB free RAM
– A minimum of 8 GB free space on the hard disk drive
– Network connection
NOTE If the computer where Glaucoma Workplace is installed does not meet the minimum hardware requirements, Glaucoma Workplace may not run as intended. Please make sure that the hardware requirements are met.
RA005
Page 16 000000-2231-545-GA-US-210817

Glaucoma Workplace Chapter 2: Requirements, installation, and troubleshooting
– Minimum screen resolution of 1680 x 1050 pixels. However, Glaucoma Workplace has been optimized for displays at 1920 x 1080 pixels or higher.
– The PC on which you use Glaucoma Workplace must have a graphics card with at least 256 MB RAM.
The use of an unsuitable hardware platform may impair the function of the software. You as the operator are responsible for the correct selection and function of the hardware.
Software platform requirements
If the operating system where Glaucoma Workplace is installed does not meet the minimum software requirements, Glaucoma Workplace may not run as intended. Glaucoma Workplace supports the following operating systems:
– Microsoft Windows 7 (64 bit) with Service Pack 1
– Microsoft Windows 8.1 (64 bit)
– Microsoft Windows 10 (64 bit)
– Microsoft Windows Server 2008 R2 with Service Pack 1
– Microsoft Windows Terminal Server 2008 R2 (64 bit)
– Microsoft Windows Server 2012 R2
Glaucoma Workplace server software can also be installed on a virtual machine via VMware vSphere® Client 5.0.0 (EsXi).
000000-2231-545-GA-US-210817 Page 17

Chapter 2: Requirements, installation, and troubleshooting Glaucoma Workplace
Installing Glaucoma Workplace
This section describes the steps for installing Glaucoma Workplace.
Glaucoma Workplace is a plug-in to FORUM Version 4.1 or higher, which must already be installed in order for the Glaucoma Workplace installation to proceed.
Obtaining licenses
Please see the FORUM document set for information on all the licenses you need to run Glaucoma Workplace and how to install these licenses.
Installing Glaucoma Workplace server software
To install Glaucoma Workplace, you first install the server software for the application. Once the server software is installed, the client software is auto-matically installed when a user with access privileges to the program logs on to FORUM.
To install the application, you must have Windows administrator privileges.
• On the FORUM server, log in as a Windows administrator.
• Ensure that FORUM is closed.
• Insert the Glaucoma Workplace media (DVD) into the drive. You can also download the software and instructions from the ZEISS Software Down-load Portal at http://www.zeiss.com/med/sdp. If you do not have an account for the ZEISS Software Download Portal yet, you will be asked to register. Your account will be activated within 24 hours.
Typically, the setup process starts automatically, but it may be necessary to double-click the *.exe file. The install wizard starts.
• If the Windows "User Account Control" window appears, click <Yes>.
• If you have a previous version already installed, the installation wizard prompts you to uninstall it before installing the new version. Follow the onscreen prompts to uninstall the previous version.
Page 18 000000-2231-545-GA-US-210817

Glaucoma Workplace Chapter 2: Requirements, installation, and troubleshooting
• If the message "Keep cached data and configuration settings?" appears, click <Yes>.
• Click "Finish", when the Uninstall is complete.
• Read the license agreement carefully. Select "I accept the agreement", then click <Next>.
• In the "Install Location" window, specify the folder in which to install the Glaucoma Workplace, then click <Next>.The default location (Program Files on the C: drive) is fine in most cases. However, you can use this window to specify another location for the installation as required in your practice.
• If the message appears "The directory: ... already exists. Would you like to install to that directory anyway?" click <Yes>.
• Select a cache directory, then click <Next>.
• Enter a maximum cache size, then click <Next>.
• If the wizard prompts you to install .NET Framework, click <OK>.
• If the wizard prompts you to install Microsoft Visual C++, click <OK>.
The wizard installs the Glaucoma Workplace server software.
• When the "Completing the Glaucoma Workplace Setup Wizard" window appears, click <Finish>.
• Click "Yes" to the question "Would you like to restart now?". If you want to reboot later, click "No". Note, it is strongly recommended to reboot after the installation is complete in order to ensure that all new functionality is properly applied.
If you are upgrading from a previous version of Glaucoma Workplace, you may experience long loading times when opening a patient record in the Structure-Function GPA tab. However, as soon as FORUM receives newly acquired HFA or CIRRUS data for a patient, his/her entire patient record will automatically be processed and loading times will reduce significantly.
000000-2231-545-GA-US-210817 Page 19

Chapter 2: Requirements, installation, and troubleshooting Glaucoma Workplace
Configuring your firewall
If your system uses a firewall to protect data security, a critical post-installation step is to configure an exception in the firewall so that it does not block the Glaucoma Workplace application. By default, Glaucoma Workplace needs port 10101 to work properly. Please consult the documentation for the firewall for instructions on how to configure the firewall so that this port is unblocked.
If port 10101 is already being used by another application or process, the Glaucoma Workplace server will choose the next higher available port.
An alternative way to allow the Glaucoma Workplace application to communicate with FORUM is to add the executable "% Glaucoma Workplace%\prunsrv.exe" to the list of applications that are permitted to use all ports.
On some systems, you must have system administrator privileges to configure firewall ports. If this is the case in your system, contact your system administrator to perform this preliminary step.
Configuring your virus protection software
If your system uses virus protection software, it may slow Glaucoma Workplace down unless you set the virus scanner to treat the cache files as an exception. The location of the cache files is configured using the installation wizard. Please consult the documentation for your virus protection software for details on setting up this exception.
On some systems, you must have system administrator privileges to configure virus software. If this is the case in your system, contact your system adminis-trator to perform this preliminary step.
Page 20 000000-2231-545-GA-US-210817

Glaucoma Workplace Chapter 2: Requirements, installation, and troubleshooting
Troubleshooting
Many error conditions can be resolved by checking that you have taken care of all of the following:
• If you have a firewall installed, make sure that the firewall is not blocking the connection between the FORUM server and Glaucoma Workplace.
• Make sure you have all the appropriate licenses.
• Make sure you (and other users of Glaucoma Workplace) are configured for Glaucoma Workplace access in the FORUM client.
Follow the directions in Table 2.1 and Table 2.2 if an error occurs. If you can-not resolve the error, contact the ZEISS Service.
Table 2.1: Malfunctions
Malfunction Cause/Procedure
No Structure-Function report created A Structure-Function OU (Single Exam) report is only created when a complete data set is available.
A complete data set consists of a visual field exam for each eye and a CIRRUS data set for each eye.
A Structure-Function OU (Single Exam) report can only be automat-ically created if the visual field exam and CIRRUS data are from the same date and are saved in FORUM.
000000-2231-545-GA-US-210817 Page 21

Chapter 2: Requirements, installation, and troubleshooting Glaucoma Workplace
Table 2.2: Error Messages
Software area
Error message Cause Procedure
Total No connection to Glaucoma Workplace server available. Please contact your system administrator.
The firewall may be block-ing access.
The Windows services "CZM-Glaucoma-Workplace-Service" and "CZM-Glaucoma-Workplace-Analysis-Service" must be config-ured as an exception in the fire-wall, if there is one.
The network settings have changed.
Restart the services "CZM-Glau-coma-Workplace-Analysis-Ser-vice" and "CZM-Glaucoma-Work-place-Service".
Internal Glaucoma Work-place server error. Please contact your system adminis-trator.
An internal error occurred.
Please contact the system admin-istrator or the ZEISS Service.
The network settings have changed.
Restart the services "CZM-Glau-coma-Workplace-Analysis-Ser-vice" and "CZM-Glaucoma-Work-place-Service".
Page 22 000000-2231-545-GA-US-210817

Glaucoma Workplace Chapter 3: Getting started with Glaucoma Workplace
Chapter 3: Getting started with Glaucoma Workplace
This chapter explains how to get started with Glaucoma Workplace. It also explains how to configure the application for your practice.
Opening Glaucoma Workplace
• Consult the FORUM documentation for instructions on starting FORUM.
• On the FORUM "Patient Directory" page, double-click on a patient record. Alternatively, select a patient, then select the <Document Display> button.
The "Document Display" window opens (shown in Figure 3.1), with thumbnails of fundus images and reports for the most recent exam in the middle and a list of all exams for the patient record that have associated reports or fundus images on the right.
• Select one of the five Glaucoma Workplace preselections in the left Presets.
• When you open a page, the Presets are hidden. To move to a different preselection, select the arrow on the far left to show the Presets again.
• To show the exam list and document thumbnails from any preselection, select the arrow on the far right .
000000-2231-545-GA-US-210817 Page 23

Chapter 3: Getting started with Glaucoma Workplace Glaucoma Workplace
Figure 3.1: "Document Display" window
1 Create Reports preselection
Opens the "Create Reports" preselection, which offers options for creating and printing reports
2 Structure-Function GPA preselection
Opens the "Structure-Function GPA" preselection, which displays both visual field exam and OCT scan data for Structure-Function Guided Progression Analysis (GPA)
3 Visual Fields - Browser preselection
Opens the "Visual Fields - Browser" preselection, which displays a list of all available visual field exams, along with more detailed information for the selected exam
4 Visual Fields - Overview preselection
Opens the "Visual Fields - Overview" preselection, which displays summary data for all available visual field threshold exams
5 Visual Field GPA preselection
Opens the "Visual Field GPA" preselection, which displays visual field exam data for visual field GPA
6 Sort buttons Sorts the thumbnails by eye ("Laterality") or scan/report type ("Device")
7 Thumbnails Displays thumbnails of all reports and fundus images available for the selected exam date
8 Exam list Lists all exams with associated reports or fundus images for the selected patient
9 Refresh button Refreshes the display when new data or reports have been added
10 Patient Directory button
Returns to the FORUM Patient Directory
6 7 8 9
23
45
10
1
Page 24 000000-2231-545-GA-US-210817

Glaucoma Workplace Chapter 3: Getting started with Glaucoma Workplace
Configuring Glaucoma Workplace
You can adapt Glaucoma Workplace to your needs by configuring the application for your practice, including your clinical preferences and your particular patient population.
Opening the configuration window
• In the top menu bar, select <System><Workplace Administration><Glau-coma Workplace>.
The "Glaucoma Workplace Configuration" window opens.
Figure 3.2: "Glaucoma Workplace Configuration" window
The left side of the screen controls the settings that are common to all users, while the right side of the screen controls the settings for the user that is currently logged in.
000000-2231-545-GA-US-210817 Page 25

Chapter 3: Getting started with Glaucoma Workplace Glaucoma Workplace
Configuring general settings
Use the "General Settings" section of the "System Settings" to configure settings that apply to both the onscreen display and to reports.
Table 3.1: "General Settings" Configuration options
NOTE The user is responsible for ensuring that the normative data setting for Glau-coma Workplace is compatible with the setting for the acquisition device.RA024
Configuration option Description
OCT normative database
Sets the default normative database used as Diversified (default) or Asian. However, if a patient record is already associated with a normative database when it is imported, that associated database will be used for that patient.
Format of visual acuity data
Sets the format for the visual acuity data as decimal (default), snellen, or metric.
Default for Perimetry Trend Analysis
Sets whether the default visual field trend analysis in the "Visual Field GPA" preselection is the Mean Deviation or Visual Field Index (default) plot.
OD/OS display orientation
On screens that display data for both eyes, sets which eye is on which side of the screen. The default is OD left, OS right.
GPA report type Sets the default visual field GPA report for both automatic reports and reports created using the <Create report> button in the "Visual Field GPA" preselection. The default is the GPA Summary report.
Create normative data details page for Structure-Function OU (Single Exam) reports
Sets whether normative details pages are included in the Structure-Function OU (Single Exam) report. This setting is enabled by default.
Order of patient name display for reports
For patients who have multiple character types in their names (alphabetic, phonetic, and/or ideographic), sets the order in which the name is arranged. To change the order, select the character type and use the arrows to move it up or down.
Page 26 000000-2231-545-GA-US-210817

Glaucoma Workplace Chapter 3: Getting started with Glaucoma Workplace
Configuring display settings
Use the "Glaucoma Workplace Configuration" page to adjust how data is displayed on the screen.
Configuring automatic reports
Use the "Automatic Report Creation" section of the "Glaucoma Workplace Configuration" window to select which reports Glaucoma Workplace creates automatically when patient data comes into FORUM.
• Check the appropriate boxes for the reports you would like.
Configuration option Description
Order of exams in Visual Fields - Overview
Sets whether exams are listed from oldest to newest or vice versa in the "Visual Fields - Overview" preselection
Maximum number of OCT follow-up exams
Sets the maximum number (up to 13) of follow-up OCT exams that are displayed in the "Structure-Function GPA" preselection
Preselection Configura-tion option
Description
Language for automatic reports
Sets the language used on automatic reports (the user interface language is used for manually created reports)
Create single exam report Creates a single exam report for each new visual field exam that is imported into FORUM
Create overview report for 24-2/24-2C/30-2
Creates a new Overview report each time a new 24-2, 24-2C or 30-2 threshold exam is imported into FORUM
Create overview report for 10-2
Creates a new Overview report each time a new 10-2 threshold exam is imported into FORUM
000000-2231-545-GA-US-210817 Page 27

Chapter 3: Getting started with Glaucoma Workplace Glaucoma Workplace
See "Overview of reports" beginning on page 77 for descriptions of each report.
Configuring data export
The DICOM OPV format is a standardized, vendor-independent data format that has been defined for perimetry data.
• Use the "Create DICOM OPV format for Visual Fields" option in the "Data Export Options" section of the "Glaucoma Workplace Configuration" win-dow to automatically create OPV data for every visual field test.
Users wishing to electronically export summary results and analyses for clinical purposes should refer to the DICOM Conformance Statement.
Create GPA report Creates a new GPA report every time a new threshold exam is imported for a patient who already has at least two existing threshold exams that used a compatible test pattern (e.g., all 24-2, 24-2C and 30-2 or all 10-2). The GPA report type depends on the default that is set under "General Settings".
Create Structure-Function OU (Single Exam) report
Creates a Structure-Function OU (Single Exam) report every time at least one visual field exam and one OCT exam from the same date (for the same patient) are imported into FORUM
Create single exam reports for existing exams
Retroactively creates single exam reports for visual field exams that are already in the database
RNFL Thickness Profile orientation
Sets whether the RNFL thickness profile graph starts from the nasal position ("NSTIN"a)) or the temporal position ("TSNIT")
a) NSTIN orientation as suggested in Hood DC, Raza AS, On improving the use of OCT imaging for detecting glaucomatous damage. -HYPERLINK "https://www.ncbi.nlm.nih.gov/pubmed/24934219" \o "The British journal of ophthalmol-ogy."Br J Ophthalmol. 2014 Jul; 98(Suppl 2): ii1–ii9.
Preselection Configura-tion option
Description
Page 28 000000-2231-545-GA-US-210817

Glaucoma Workplace Chapter 3: Getting started with Glaucoma Workplace
Configuring data caching
• Use the "Cache Settings" section of the "Glaucoma Workplace Configura-tion" window to set how cached data is managed.
Configuring user-specific settings
• Use the right side of the "Glaucoma Workplace Configuration" window to set display options that are specific to the logged in user.
Configuration option Description
Cache location Sets the destination for cached data
Maximum cache size in GB
Sets the maximum amount of data that can be cached
Pre-load data for patients in worklist
Proactively caches previous data for the patients scheduled for exams within the specified caching window
Hours in advance to pre-load data
Sets how far in advance of a patient’s scheduled exam previous data is cached
Configuration option Description
Default RNFL Thickness Profile orientation
Sets whether the RNFL thickness profile graph starts from the nasal position ("NSTIN") or the temporal position ("TSNIT") by default
Default Dual Baseline mode
Sets how dual baselines are shown:
– Continuous (default): two separate trend lines – one that starts at the first pair of baseline exams and one that starts at the second pair of baseline exams
– Consecutive: two shorter trend line segments that connect at the second pair of baseline exams
Default time axis in charts
Sets whether the time axis for regression plots is by date or patient age
000000-2231-545-GA-US-210817 Page 29

Chapter 4: Glaucoma Workplace overview Glaucoma Workplace
Chapter 4: Glaucoma Workplace overview
Glaucoma Workplace has five preselections
– The "Visual Field GPA" preselection for working with the Guided Progres-sion Analysis tools for visual field exams
– The "Visual Fields - Overview" preselection for displaying a serial overview of visual field threshold exams, filtered by test pattern
– The "Visual Fields - Browser" preselection for displaying a list of all visual field exams, as well as detail for the selected exam
– The "Structure-Function GPA" preselection for viewing both visual field exam and OCT exam data together, along with Guided Progression Analysis tools
– The "Create Reports" preselection for creating reports (see "Chapter 6: Creating and printing reports" on page 68)
Key to abbreviations
Reports and onscreen displays include a number of abbreviations, summarized in Table 4.1.
Table 4.1: Report and onscreen abbreviations
Abbreviation Meaning
C/D Cup-to-Disc
CPSD Corrected Pattern Standard Deviation
FL Fixation Loss
FN False Negative
FP False Positive
GCA Ganglion Cell Analysis
Page 30 000000-2231-545-GA-US-210817

Glaucoma Workplace Chapter 4: Glaucoma Workplace overview
MD and PSD Labeling
For all central threshold tests, MD (Mean Deviation) and PSD (Pattern Standard Deviation) are reported on screen and in reports with the following labels:
– Mean Deviation: MD24-2, MD24-2C, MD30-2 or MD10-2
– Pattern Standard Deviation: PSD24-2, PSD24-2C, PSD30-2 or PSD10-2
The number after "MD" or "PSD" indicates for which test points the MD/PSD value was calculated. For example, MD24-2 means that the MD value was calculated based on all 24-2 test points. In general, the MD label will always correspond to the actual test pattern that was used to perform the test.
However, in GPA analysis, it is important that exams with different test patterns are comparable to each other. Therefore, the MD and PSD values are calculated based on the test points that all exams in the GPA series have in common.
GCL Ganglion Cell Layer
GHT Glaucoma Hemifield Test
IPL Inner Plexiform Layer
MD Mean Deviation
ONH Optic Nerve Head
P Percentile
PSD Pattern Standard Deviation
RNFL Retinal Nerve Fiber Layer
SF Standard Fluctuation
SS Signal Strength
VFI Visual Field Index
Abbreviation Meaning
000000-2231-545-GA-US-210817 Page 31

Chapter 4: Glaucoma Workplace overview Glaucoma Workplace
Figure 4.1 below shows an example for a GPA summary report. The GPA series has two baseline exams of the 30-2 pattern and at least one follow-up exam of the 24-2 pattern. Therefore, all MD and PSD values are reported based on the common 24-2 test points and are listed as "MD24-2" and "PSD24-2".
You can view the "true" MD and PSD value for each individual test outside the GPA screens, such as in the Visual Field browser or on the SFA report.
Figure 4.1: GPA summary report
Page 32 000000-2231-545-GA-US-210817

Glaucoma Workplace Chapter 4: Glaucoma Workplace overview
"Visual Field GPA" Preselection
Use the "Visual Field GPA" preselection to see visual field regression analysis for both eyes at the same time, based on all available visual field exams that used the selected test strategy (SITA Standard, SITA Fast, SITA Faster and/or Full Threshold). This preselection also shows individual exam details for two baseline exams and progression analysis, compared to the baseline, for any selected follow-up exam.
Data from at least three visual field exams is required in order to display the exams in a trend plot; at least five visual field exams are required in order to analyze trends.
The "Visual Field GPA" preselection makes use of analysis from the HFA:
– Trend analysis – The Visual Field Index (VFI) and Mean Deviation (MD) regression analyses quantify the rate of progression and provide a visual display of the progression pattern.
– Progression analysis (also referred to as "event analysis") – The Progression Analysis probability plot is based on significance limits for test-retest vari-ability in Pattern Deviation at each point in the central visual field.
000000-2231-545-GA-US-210817 Page 33
Chapter 4: Glaucoma Workplace overview Glaucoma Workplace
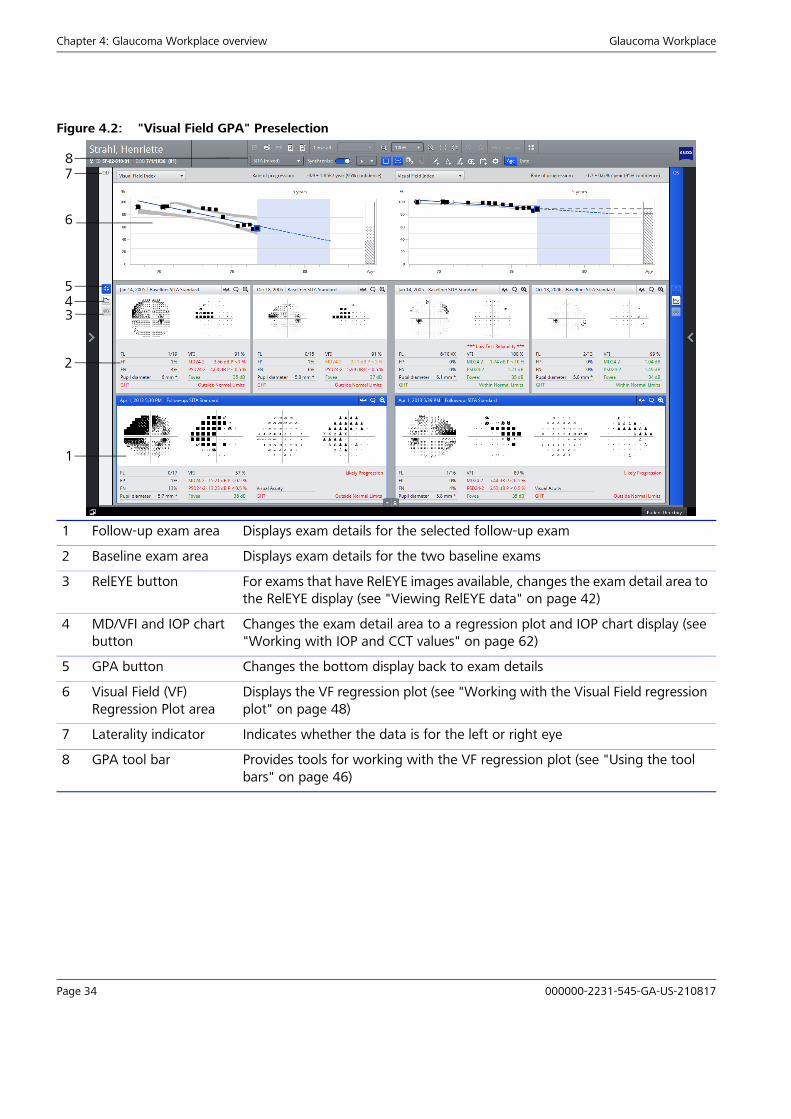
Figure 4.2: "Visual Field GPA" Preselection
1 Follow-up exam area Displays exam details for the selected follow-up exam
2 Baseline exam area Displays exam details for the two baseline exams
3 RelEYE button For exams that have RelEYE images available, changes the exam detail area to the RelEYE display (see "Viewing RelEYE data" on page 42)
4 MD/VFI and IOP chart button
Changes the exam detail area to a regression plot and IOP chart display (see "Working with IOP and CCT values" on page 62)
5 GPA button Changes the bottom display back to exam details
6 Visual Field (VF) Regression Plot area
Displays the VF regression plot (see "Working with the Visual Field regression plot" on page 48)
7 Laterality indicator Indicates whether the data is for the left or right eye
8 GPA tool bar Provides tools for working with the VF regression plot (see "Using the tool bars" on page 46)
1
2
345
6
78
Page 34 000000-2231-545-GA-US-210817

Glaucoma Workplace Chapter 4: Glaucoma Workplace overview
"Visual Fields - Overview" Preselection
Use the "Visual Fields - Overview" preselection to scroll through summary data for all visual field threshold exams that used the selected test pattern on one continuous page.
Figure 4.3: "Visual Fields - Overview" Preselection
1 Exam detail area Displays the graytone, threshold, total deviation, and pattern deviation plots, as well as reliability indices and other key parameters for each exam. Use the scroll bar to see additional exams. Mouse over any of the plots for a larger view.
2 Laterality indicator Indicates whether the data is for the left or right eye.
3 Print button Prints a copy of the overview report for the selected eye.
4 Test pattern menu Determines whether the exams displayed are 10-2 threshold exams, 24-2/30-2 Blue-Yellow threshold exams, or 24-2/24-2C/30-2 White threshold exams.
1
2
3 4 5 6 7 8
000000-2231-545-GA-US-210817 Page 35

Chapter 4: Glaucoma Workplace overview Glaucoma Workplace
"Visual Fields - Browser" Preselection
Use the "Visual Fields - Browser" preselection to see a list of all available visual field exams for both eyes and display an expanded view of the detail for any visual field exam.
Figure 4.4: "Visual Fields - Browser" Preselection
5 Create report button Creates an overview report for the selected eye and saves it to FORUM.
6 Show gaze tracker button
Opens the gaze graph for the exam.
7 Add comment button Opens the "Comments" window for viewing or adding comments to the exam.
8 Show legend button Opens the legend for visual field exam plots.
1
2
34
5
6 7 8 9 10
Page 36 000000-2231-545-GA-US-210817

Glaucoma Workplace Chapter 4: Glaucoma Workplace overview
"Structure-Function GPA" Preselection
Use the "Structure-Function GPA" preselection to see Structure-Function pro-gression analysis for one eye, displaying HFA and OCT data side-by-side. Four regression plots display trend analysis based on data from multiple visual field or OCT exams. In addition, plots and maps from individual exams are aligned along a timeline to show more detailed information over time.
Data from at least two baseline exams and three follow-up exams is required in order to analyze visual field trends. For RNFL trend analysis, data from at least four OCT exams is required.
1 Gaze graph Displays the gaze tracking for the exam, if available
2 Exam detail area Depending on the exam type, displays plots, reliability indices, and other key parameters for the selected exam
3 RelEYE button If RelEYE data is available, shows the RelEYE images for the selected exam
4 Visual Field button Switches back to the exam detail from the RelEYE display
5 Laterality indicator Indicates whether the data is for the left or right eye
6 Exam list Lists all visual field exams available for the patient
7 Print button Prints a report for the selected exam
8 Create report button Creates a report for the selected exam
9 Show legend button Opens the legend for visual field exam plots
10 Add comment button Opens the "Comments" window for viewing or adding comments to the exam
000000-2231-545-GA-US-210817 Page 37

Chapter 4: Glaucoma Workplace overview Glaucoma Workplace
Figure 4.5: "Structure-Function GPA" Preselection
1 OCT map timeline Displays deviation, progression, or thickness maps for individual OCT ONH and Macula exams
2 Show tables button Shows or hides the exam data and graphs for individual exams
3 Show thickness and sensitivity button
Toggles the individual exam area to graytone plots and thickness maps
4 Show deviation from normal button
Toggles the individual exam area to deviation plots and maps
5 Show progression button
Toggles the individual exam area to progression analyses and maps
6 Trend analysis display Displays OCT and visual field trend analyses and/or RNFL thickness profile
7 Trend analysis menu Selects a trend analysis (OCT or visual field) or RNFL profile graph to display
8 Tool bars Provides tools for working with the visual field and OCT progression data (see "Using the tool bars" on page 46)
9 RNFL thickness profile orientation
Selects whether the RNFL thickness profile graph starts from the nasal position (NSTIN) or the temporal position (TSNIT)
1
2345
6
7
8
11
9
10
Page 38 000000-2231-545-GA-US-210817

Glaucoma Workplace Chapter 4: Glaucoma Workplace overview
Viewing and adding comments
This section explains how to add and view comments about exams.
Adding comments to an exam
You can add comments to a visual field exam in the "Visual Field GPA" prese-lection, the "Visual Fields - Overview" preselection, or the "Visual Fields - Browser" preselection. Comments are specific to an exam, not to a preselec-tion, so a comment added in one preselection also appears when the com-ments list is opened from either of the other two preselections.
• Select the exam in the VF regression plot or exam list.
• In the exam detail area, click the button ("Add comment") at the top of the relevant exam. If the exam has been excluded from GPA, right-click on the exam in the VF regression plot and select "Show comments".
The "Comments" window opens.
10 RNFL thickness profile mode
Selects whether the RNFL thickness profile graph is shown with progression information or with normative data
11 Visual field plot timeline
Displays progression, deviation, or graytone plots for individual visual field exams
000000-2231-545-GA-US-210817 Page 39

Chapter 4: Glaucoma Workplace overview Glaucoma Workplace
Figure 4.6: "Comments" window
• Enter your comment in the "New Comment" field and click <Add>.
The comment is added to the list at the top of the "Comments" window.
• Deselect the "Include in report" box if you don’t want the comment to appear in the SFA report for the exam.
• Click <Close>.
Once a comment is added to an exam, it cannot be edited or removed.
Page 40 000000-2231-545-GA-US-210817
Glaucoma Workplace Chapter 4: Glaucoma Workplace overview
Viewing comments for an exam
• Right-click on the exam in the VF regression plot and select "Show com-ments", or select the button ("Show comments") above the exam detail area for the relevant exam.
The "Comments" window opens.
• Click <Close> to close the "Comments" window.
Viewing exam reliability indicators
The reliability indices—including fixation losses (FL), false positives (FP), and false negatives (FN)—and various alerts are built-in indicators of exam reliabil-ity. For details about these features, refer to the HFA user documentation. In addition, Gaze Tracker and RelEYE information, when available, indicate how well the patient was fixating during the exam.
Using Gaze Tracker information
Gaze tracking is a feature on most HFA II-i and HFA3 models. The gaze graph documents movement of the patient’s test eye to show how well the patient was fixating.
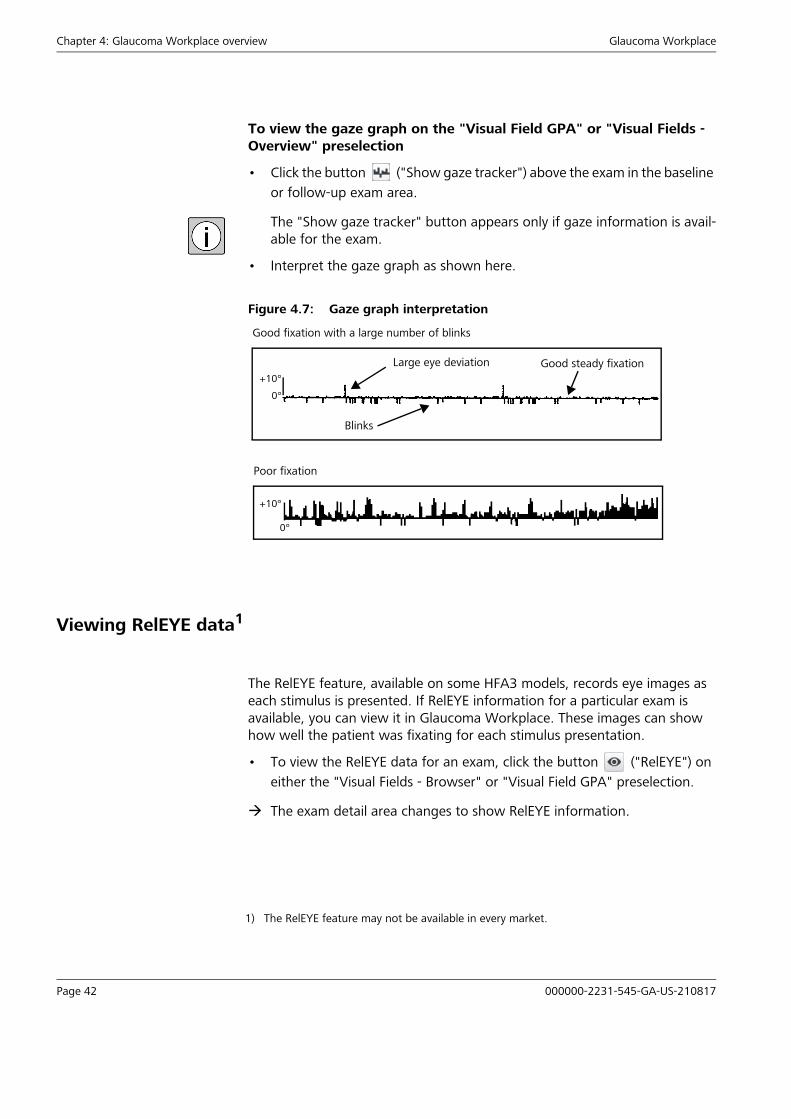
Upward markings in the gaze graph (see Figure 4.7) indicate that the test eye deviated from the fixation target at the time of stimulus presentation. The higher the marking, the greater the deviation.
Downward markings indicate that the gaze tracker system could not locate the patient’s gaze: small downward markings indicate that the gaze tracker system was unable to detect gaze direction; large markings indicate that the patient blinked while the stimulus was being presented. Minimal deviation of the markings (depicted as a horizontal line) indicates excellent fixation.
The gaze graph, when it is available, is automatically included at the bottom of the exam data in the "Visual Fields - Browser" preselection.
000000-2231-545-GA-US-210817 Page 41
Chapter 4: Glaucoma Workplace overview Glaucoma Workplace
To view the gaze graph on the "Visual Field GPA" or "Visual Fields - Overview" preselection
• Click the button ("Show gaze tracker") above the exam in the baseline or follow-up exam area.
The "Show gaze tracker" button appears only if gaze information is avail-able for the exam.
• Interpret the gaze graph as shown here.
Figure 4.7: Gaze graph interpretation
Viewing RelEYE data1
The RelEYE feature, available on some HFA3 models, records eye images as each stimulus is presented. If RelEYE information for a particular exam is available, you can view it in Glaucoma Workplace. These images can show how well the patient was fixating for each stimulus presentation.
• To view the RelEYE data for an exam, click the button ("RelEYE") on either the "Visual Fields - Browser" or "Visual Field GPA" preselection.
The exam detail area changes to show RelEYE information.
Large eye deviation Good steady fixation
Blinks
0°
+10°
Good fixation with a large number of blinks
0°
+10°
Poor fixation
1) The RelEYE feature may not be available in every market.
Page 42 000000-2231-545-GA-US-210817

Glaucoma Workplace Chapter 4: Glaucoma Workplace overview
Figure 4.8: RelEYE display
The "RelEYE" button is grayed out when RelEYE data is not available.
• Double-click an eye image to expand it.
• To compare the same test point between two exams, click the lock icon at the top of the RelEYE display, then select another exam in the VF regression plot or exam list.
The eye images from the second exam are displayed alongside the eye images from the first exam.
000000-2231-545-GA-US-210817 Page 43

Chapter 4: Glaucoma Workplace overview Glaucoma Workplace
Figure 4.9: Comparing points with RelEYE feature
• Select any test point to display the eye images for that point. The same test point is selected in the second exam.
Page 44 000000-2231-545-GA-US-210817

Glaucoma Workplace Chapter 5: Working with the GPA tools
Chapter 5: Working with the GPA tools
One the most powerful tools in Glaucoma Workplace is the Guided Progres-sion Analysis (GPA). GPA helps the clinician monitor progression over time, as well as highlighting rates of progression that may be indicative of glaucoma. The tools in the GPA preselections allow you to go beyond just looking at visual field results and GPA reports.
In the "Visual Field GPA" preselection, you can dynamically interact with the HFA test results and manipulate them in order to assess progression in a flex-ible manner. For example, you can select a second pair of baseline exams in order to assess the rate of progression before and after a clinical intervention. You can also mix test strategies, deselect exams you would like to exclude from the GPA, and plot VFI, MD, or MD for the inferior or superior hemifield. See "Key to abbreviations" on page 30 for an overview of the "Visual Field GPA" preselection.
If you also want to work with CIRRUS OCT data, you can use the "Structure-Function GPA" preselection. In addition to having the same tools as the "Visual Field GPA" preselection, the "Structure-Function GPA" preselection presents OCT analysis data (structure) and visual field data (function) side-by-side. OCT scans and visual field tests from the same time interval are lined up for comparison to give you a simultaneous view of structure and function pro-gression. The OCT timeline and trending plots allow you to note structural changes that may occur long before the visual fields show signs of function loss. See ""Structure-Function GPA" Preselection" on page 37 for an overview of the "Structure-Function GPA" page.
This section explains how to work with the tools on the "Visual Field GPA" and "Structure-Function GPA" preselections to focus on the data you want to see.
000000-2231-545-GA-US-210817 Page 45
Chapter 5: Working with the GPA tools Glaucoma Workplace
Using the tool bars
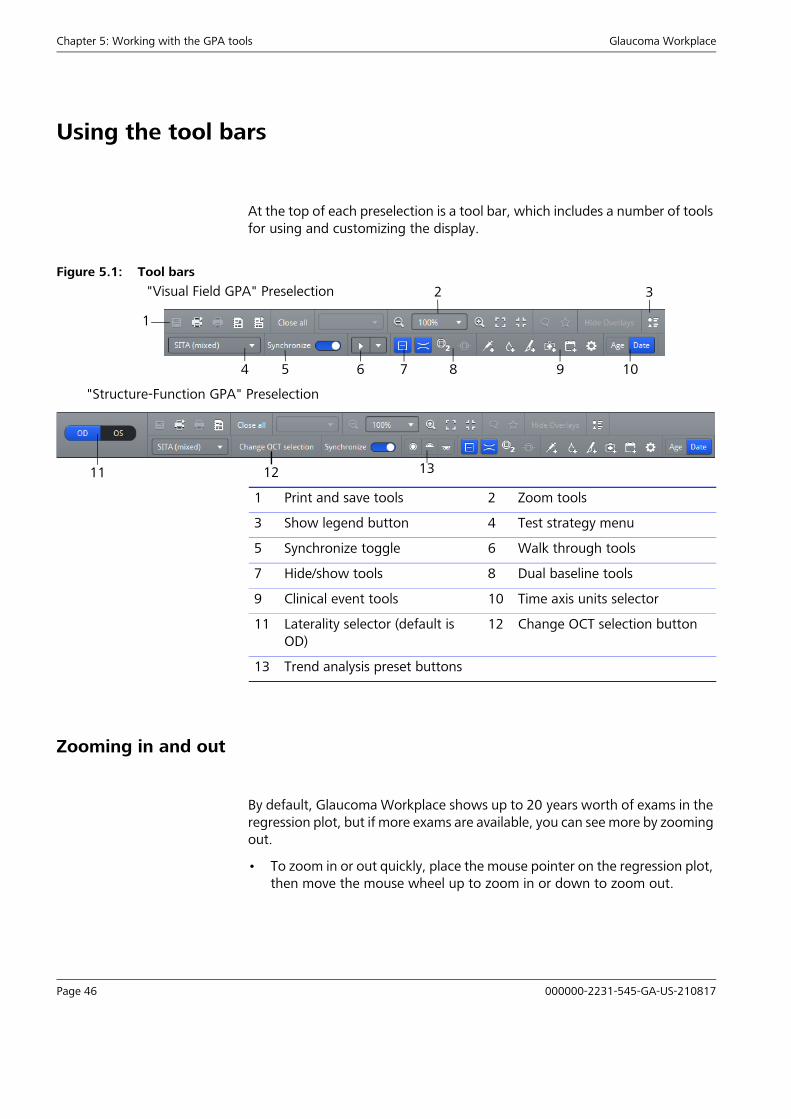
At the top of each preselection is a tool bar, which includes a number of tools for using and customizing the display.
Figure 5.1: Tool bars
Zooming in and out
By default, Glaucoma Workplace shows up to 20 years worth of exams in the regression plot, but if more exams are available, you can see more by zooming out.
• To zoom in or out quickly, place the mouse pointer on the regression plot, then move the mouse wheel up to zoom in or down to zoom out.
1 Print and save tools 2 Zoom tools
3 Show legend button 4 Test strategy menu
5 Synchronize toggle 6 Walk through tools
7 Hide/show tools 8 Dual baseline tools
9 Clinical event tools 10 Time axis units selector
11 Laterality selector (default is OD)
12 Change OCT selection button
13 Trend analysis preset buttons
1
2 3
54 6 8 9 107
"Visual Field GPA" Preselection
11 12 13
"Structure-Function GPA" Preselection
Page 46 000000-2231-545-GA-US-210817

Glaucoma Workplace Chapter 5: Working with the GPA tools
• For more fine-tuned zooming, select the plot you would like to change, then use the zoom tools in the tool bar.
Table 5.1: Zoom tools
Synchronizing the displays
Elements of the "Structure-Function GPA" preselection display are automati-cally synchronized; if you select a different follow-up exam in one regression plot, for example, the selection changes in all of the regression plots. How-ever, you can also synchronize the zoom function in the "Structure-Function GPA" preselection by selecting the <Synchronize> toggle in the tool bar.
In the "Visual Field GPA" preselection, selecting the <Synchronize> toggle synchronizes the test strategy selection across all regression plots for both eyes.
Selecting the time axis units
The regression plot time axes can be shown in units of time or patient age.
• To change the time axis between date and patient age, use the <Age> and <Date> buttons in the tool bar.
The timeline changes to reflect the new selection.
Zoom out
Zooms to a set percentage
Zoom in
Spreads the display out across the available space
Resets the display to the original size
000000-2231-545-GA-US-210817 Page 47

Chapter 5: Working with the GPA tools Glaucoma Workplace
Working with the Visual Field regression plot
A key part of the GPA preselections is the Visual Field (VF) regression plot, which can be in the form of a Visual Field Index (VFI) plot or one of three Mean Deviation (MD) plots. The "Structure-Function GPA" preselection has addi-tional regression plots available for analyzing OCT data; see "Selecting metrics for OCT Trend Analysis" on page 64 for more information.
Figure 5.2: VF regression plot area
1 Confidence bands Two gray bands indicate the statistical significance of the regression analysis. The edges of the top band represent 97.5% significance (upper edge) and 90% significance (lower edge).The edges of the bottom band represent 10% significance (upper edge) and 2.5% significance (lower edge).
2 Linear regression line A blue line indicates the calculated regression of the visual field, based on the two baseline exams and all included follow-up exams. A minimum of three follow-up exams must be included. The dashed portion of the line shows the projected future progression for the same amount of time as past data is avail-able, up to five years. This line is not shown if less than two years of data is available, if the slope is positive because of the learning effect, or because of statistical uncertainty.
3 Baseline exam Two baseline exams are used as the starting point for the progression analysis. Details for these exams are displayed in the baseline exam area at the bottom of the "Visual Field GPA" preselection.
4 VF regression plot type menu
Changes the display to VFI, MD, MD Superior, or MD Inferior.
5 Event marker Clinical events, such as medication or surgery, can be noted on the plot to highlight their potential impact on the patient’s progression.
123
4 5
7
89
6
Page 48 000000-2231-545-GA-US-210817

Glaucoma Workplace Chapter 5: Working with the GPA tools
If you hover over any exam in the VF regression plot, you can see summary details about the exam. Table 5.2 explains the meaning of the exam symbols in the VF regression plot.
Table 5.2: Symbols for exams in the VF regression plot
6 Rate of progression Indicates the rate at which visual field index is declining each year. The confi-dence interval for the calculated rate is also noted.
7 VFI bar The vertical bar at the end of the plot shows the patient’s current remaining vision in that eye and the projected remaining vision at the end of the analysis period, based on the current rate of progression.
8 Future projection The blue shaded area shows the patient’s expected progression in that eye, based on the current rate of progression. The width of the shaded area depends on the amount of data available (maximum width of five years).
9 Selected follow-up exam
Details for the selected follow-up exam, which is highlighted with a blue bor-der, are displayed in the follow-up exam area of the "Visual Field GPA" preselection.
Symbol by test strategy Meaning
Full Threshold SITA Standard, SITA Fast or SITA Faster
Test defined as baseline exam for the progression analysis.
Test defined as baseline for the progression analysis (baseline exam).
The red shading indicates that a learning effect has occurred. If a test is designated to be the first baseline test, but its VFI value is so low that it falls below the p < 2.5% level of a linear regression analysis of subsequent tests not including the test in question, then the software will flag the test with a red color coding. This test is therefore not suitable as a baseline test; another exam should be used as the baseline test.
Follow-up test included in the progression analysis.
The blue indicates that this test is currently selected.
This test has been deselected by the user and is not taken into consideration for the progression analysis.
Glaucoma Workplace automatically excluded this test and does not use it in progression analysis for one of the following reasons:
– It is older than the newest baseline test.
– 100 tests have already been included in the analysis.
– In the event that the baseline tests are SITA tests, Full Threshold tests are not taken into consideration.
At least 15% of the patient’s responses were false positives, and therefore the exam is automatically excluded from analysis.
000000-2231-545-GA-US-210817 Page 49

Chapter 5: Working with the GPA tools Glaucoma Workplace
Selecting the VF regression plot type
Four options are available for the VF regression plot display: VFI, MD, MD Superior, and MD Inferior. By default, the VFI is displayed. However, the default can be changed to MD (see "Configuring display settings" on page 27). In addition, you can manually change the display, or view both the VFI and the MD.
To change the plot type
• Select the desired plot type from the drop down menu above each plot display.
To view both the VFI and the MD in the "Visual Field GPA" preselection
• Select the button ("MD/VFI and IOP chart") to the left of the baseline exams for the right eye or to the right of baseline exams for the left eye.
The baseline and follow-up exam areas change for both eyes to show an MD plot and intraocular pressure (IOP) chart.
Page 50 000000-2231-545-GA-US-210817

Glaucoma Workplace Chapter 5: Working with the GPA tools
Figure 5.3: MD and IOP display area
• Select the desired plot type from the menu above each display area. To revert to the baseline and follow-up exam display, select the button ("GPA").
Hiding and showing the confidence bands
• Click the button ("Show or hide confidence bands (2.5, 10, 90, 97.5 percentile)") to hide the shaded bands around the linear regression line.
• Click the button again to show confidence bands.
1 IOP chart 2 Plot type menu
3 MD plot 4 MD/VFI and IOP chart button
5 GPA button 6 Plot type menu
1
2
345
6
000000-2231-545-GA-US-210817 Page 51

Chapter 5: Working with the GPA tools Glaucoma Workplace
Selecting the test strategy
Visual field tests that used the Full Threshold or SITA test strategies can be included in Glaucoma Workplace’s GPA analysis. By default, the analyses in the GPA preselections include all available tests, but you can also filter the GPA analysis to include only selected test strategies.
The default of including SITA and Full Threshold exams enables trend and pro-gression analysis based on a patient’s complete history. However, mixing the strategies does add a small amount of uncertainty, which is reflected in the rate of progression and progression probability analysis. To exclude Full Threshold exams, refer to "Excluding and including HFA exams" on page 57.
For more information about test strategies, refer to the HFA user documenta-tion.
• Select a regression plot.
• Use the test strategy pull-down menu in the GPA tool bar to select one of the following options:
– SITA Standard: all Full Threshold and SITA Standard exams with 24-2 or 30-2 test patterns
– SITA Fast: all Full Threshold and SITA Fast exams with 24-2 or 30-2 test patterns
– SITA Faster: all Full Threshold and SITA Faster exams with 24-2 or 24-2C test patterns
– SITA (mixed): all Full Threshold, SITA Standard, SITA Fast and SITA Faster exams with 24-2, 24-2C or 30-2 test patterns
– SITA (mixed) 10-2: all SITA Standard, and SITA Fast exams with 10-2 test patterns (only available in the "Visual Field GPA" preselection)
The display changes to reflect the new selection.
Page 52 000000-2231-545-GA-US-210817

Glaucoma Workplace Chapter 5: Working with the GPA tools
Working with baseline and follow-up exams
For the VF regression plot, by default, the first two exams are selected as the baseline. The baseline exams are indicated with a circle in the VF regression plot and displayed in more detail in the baseline exam area of the "Visual Field GPA" preselection.
You can change the baseline if the default baseline is not representative, or to monitor the effect on the rate of progression following treatment intervention.
As with baseline exams, Glaucoma Workplace automatically selects which follow-up exams are displayed and included in GPA calculations. By default, the most recent exam is highlighted in blue in the VF regression plot and displayed in more detail in the follow-up exam area of the "Visual Field GPA" preselection. All the follow-up exams for each patient are available for display, excluding only the following:
– Follow-up exams that are older than the selected baseline tests
– Follow-up exams identified as having more than 15% false positives
– Follow-up exams older than the 98th one
Each time a new test is saved for a patient in FORUM, Glaucoma Workplace displays it as another follow-up exam.
In the "Structure-Function GPA" preselection, you can also select which OCT exams are used as the baseline and follow-up exams for RNFL and ONH trend analyses. Changing the visual field baseline or follow-up exams does not affect RNFL and IOP trend analyses, and vice versa.
Selecting baseline and follow-up exams
To change the baseline visual field exam
• Right-click on the desired exam in the VF regression plot and select "Set as baseline".
• Alternatively, drag the circle from a currently selected baseline to the desired exam.
The progression is recalculated using the new set of baseline exams.
000000-2231-545-GA-US-210817 Page 53

Chapter 5: Working with the GPA tools Glaucoma Workplace
To change the selected follow-up visual field exam
• Select the desired exam in the VF regression plot. The follow-up exam area of the "Visual Field GPA" preselection changes to display details of the selected exam.
To change the baseline or include/exclude OCT exams from GPA
• In the "Structure-Function GPA" preselection, select the <Change OCT selection> button.
The "Select baselines and follow-ups for OCT GPA" window opens.
Figure 5.4: Select OCT baseline and follow-ups
• Select two baseline exams and up to the configured maximum number of follow-up exams to include in OCT progression analysis.Perform these steps for the ONH series and for the GCL+IPL series.
• Click <Apply>.
All OCT trend and event analyses in the display are updated to reflect the new selections.
Page 54 000000-2231-545-GA-US-210817

Glaucoma Workplace Chapter 5: Working with the GPA tools
Setting a dual baseline
Setting a dual baseline is the best way to assess the rate of progression before and after a clinical intervention, such as after prescribing drops or performing surgery.
Set a dual baseline one of two ways:
• In the VF regression plot, right-click the exam you want to set as the first baseline exam for the second linear regression line, and select "Set as dual baseline".
• Alternatively, select the button ("Add dual baseline") in the tool bar. When your cursor changes to a circle, select the exam you want to estab-lish as the first baseline exam for the second linear regression line.
Two linear regression lines are now displayed in the VF regression plot; their arrangement is dependent on the default configured in the settings (see "Configuring user-specific settings" on page 29):
– Continuous: One line starts at the first pair of baseline exams. The sec-ond line starts at the second pair of baseline exams.
– Consecutive: Two shorter line segments that connect at the second pair of baseline exams.
000000-2231-545-GA-US-210817 Page 55

Chapter 5: Working with the GPA tools Glaucoma Workplace
Figure 5.5: Dual baseline example - Continuous
Figure 5.6: Dual baseline example - Consecutive
• To change the dual baseline mode, select the button ("Switch to con-secutive dual baseline mode")/button ("Switch to continuous dual baseline mode") in the tool bar.
• To remove the second baseline, select the button ("Remove dual baseline") in the tool bar.
Changing to a dual baseline is persistent across users. The last edit entered is the one that will be carried over to the next session, independent of the user who entered the edit.
Page 56 000000-2231-545-GA-US-210817

Glaucoma Workplace Chapter 5: Working with the GPA tools
Excluding and including HFA exams
Sometimes you may want to exclude an HFA exam from the GPA analysis—for example, a statistical outlier where the patient had obvious difficulties per-forming or finishing the test. The "excluded" exam is then grayed out in the VF regression plot, and the exam is not used in GPA calculations. You can re-include the exam at any time.
• In the VF regression plot, right-click the exam you want to exclude from GPA and select "Deselect".
The progression is recalculated, and the exam symbol changes to indicate that the exam is no longer included in the GPA calculations.
If the exam disappears from the VF regression plot, "hide removed exams" may be enabled. To show excluded exams, select the "Show or hide dese-lected exams" button.
• To re-include an exam you have excluded, right-click the deselected exam, then choose "Select as Follow-up". You cannot include exams that were automatically excluded.
The progression is recalculated, and the exam symbol changes to indicate that the symbol is included in the GPA calculations.
To hide excluded exams
• Click the button ("Show or hide deselected exams") to hide excluded exams in the VF regression plot.
Any exams that have been excluded are no longer visible in the VF regres-sion plot.
• Click the button again to show the excluded exams.
Deselecting exams is persistent across users. The last edit entered is the one that will be carried over to the next session, independent of the user who entered the edit. However, the state of the "Show or hide deselected exams" button is not persistent—that is, every time a user accesses the GPA screen, the deselected exams are shown.
000000-2231-545-GA-US-210817 Page 57

Chapter 5: Working with the GPA tools Glaucoma Workplace
Working with clinical events
You can add markers to any regression plot for relevant clinical events, such as surgery or medication, to present a more complete picture of the patient’s history. Clinical events that are common can be saved as templates to be added in the future to other patients as well.
To add a clinical event to a regression plot
• Right-click in the regression plot, either on a specific exam or near the applicable point in the timeline. Alternatively, use the clinical event tools in the tool bar.
Table 5.3: Clinical event tools
The "Add new clinical event" window opens.
Tool bar button
Drop-down menu selection
Add injection
Add medication
Add surgery
Add clinical
Add other
Manage clinical event templates
Page 58 000000-2231-545-GA-US-210817

Glaucoma Workplace Chapter 5: Working with the GPA tools
Figure 5.7: "Add new clinical event" window
• If you have already created a template for the desired type of event, select the template from the "Template" menu. Otherwise, enter a title for the event.
• Modify the default settings for the event date, event type (see Table 5.3), event icon and line color, and laterality as needed.
• Optionally, enter a note about the event.
• If you would like to save the event as a template, check the "Add as new template" checkbox.
• Select <Add>.
The new event appears in all regression plots for the patient, in both the "Visual Field GPA" preselection and the "Structure-Function GPA" preselection.
000000-2231-545-GA-US-210817 Page 59

Chapter 5: Working with the GPA tools Glaucoma Workplace
To copy an existing event
• Select the event in the regression plot.
• Select <Copy>.
• Make changes as needed and select <Add>.
To edit an event
• Select the event in the regression plot.
• Select <Edit>.
• Make changes as needed and select <Save>.
To delete an event
• Select the event in the regression plot.
• Select <Edit>.
• Select <Delete>.
Working with event templates
If a clinical event is common in your practice, you can create a template for it to save time in the future.
To create an event template
• Select the button ("Manage clinical event templates") or menu item.
• Enter the event details.
• Select <Save as new>.
• Select <Close>.
To modify an event template
• Select the button ("Manage clinical event templates") or menu item.
• Select the relevant template.
• Modify the event details.
• Select <Save>.
• Select <Close>.
Page 60 000000-2231-545-GA-US-210817

Glaucoma Workplace Chapter 5: Working with the GPA tools
To delete an event template
• Select the button ("Manage clinical event templates") or menu item.
• Select the relevant template.
• Select <Delete>.
• Select <Close>.
000000-2231-545-GA-US-210817 Page 61

Chapter 5: Working with the GPA tools Glaucoma Workplace
Additional tools for the "Visual Field GPA" Preselection
Working with IOP and CCT values
If you’ve imported intraocular pressure (IOP) values from the HFA or VISUPLAN® into FORUM, they are automatically displayed in the IOP chart in the "Visual Field GPA" preselection. IOP values are also visible when you hover over an exam on a regression plot. You can also manually enter or add IOP values.
In addition, you can add a target range for IOP, which appears as a blue band on the IOP chart.
Central Corneal Thickness (CCT) values that were imported from CIRRUS into FORUM are also automatically displayed above the IOP chart. Alternatively, you can manually enter a CCT value.
To display IOP and CCT values
• Select the button ("MD/VFI and IOP chart").
The baseline and follow-up exam areas change to Mean Deviation and intraocular pressure plots.
• To return the "Visual Field GPA" preselection to its default display, click the button "GPA".
You can also see IOP values associated with individual exam dates by hovering over the exam in the VF regression plot.
To add an IOP value
• Select the button ("MD/VFI and IOP chart").
• Select the button ("Add IOP").
• Alternatively, right-click on the exam in the VF regression plot on either the "Visual Field GPA" preselection or the "Structure-Function GPA" pre-selection and select "Add IOP".
• Enter the date and the IOP value, then select <Save>.
Page 62 000000-2231-545-GA-US-210817

Glaucoma Workplace Chapter 5: Working with the GPA tools
To add or edit the target range for IOP values
• Select the button ("Enter or remove target IOP range").
• Enter a lower limit and an upper limit, then select <Save>.
A blue horizontal band is added to the IOP chart indicating the target range.
Figure 5.8: IOP Chart with target range
• To remove the target range, select the "Enter or remove target IOP range" button again.
To add a CCT value
• To manually add a CCT value, enter it in the "CCT (manual):" field above the IOP plot.
Walking through the follow-up exams
You can use the "Visual Field GPA" preselection to get a quick impression of how the patient’s visual status is developing by displaying the follow-up exams in quick succession. The exams are displayed one after another at a speed that you control.
• To start the walk through, select the eye you would like to see, then click the button ("Walk through exams") in the tool bar.
• To change the speed of the walk through, use the drop-down slider bar .
• Click the button ("Stop walk through exams") to stop the walk through.
000000-2231-545-GA-US-210817 Page 63

Chapter 5: Working with the GPA tools Glaucoma Workplace
Additional tools for the "Structure-Function GPA" Preselection
A number of metrics are available for trend analysis in the "Structure-Function GPA" preselection, which displays both OCT and visual field data, side-by-side, to present a more comprehensive picture of a patient’s progression.
For a number of the display options in the "Structure-Function GPA" preselec-tion, the selections you make persist to the next time you log in. This includes the following settings:
– Regression plot selections (see "Selecting metrics for OCT Trend Analysis" on page 64)
– Time axis units (see "Selecting the time axis units" on page 47)
– Dual baseline type - continuous or consecutive (see "Setting a dual base-line" on page 55)
Selecting metrics for OCT Trend Analysis
The following trend analysis metrics are available:
– For RNFL Thickness: Average, Average Superior, Average Inferior
– For GCL+IPL thickness: Average, Total Superior, Total Inferior
– Average Cup-to-Disc Ratio
Refer to the CIRRUS user documentation for more information about RNFL and ONH analyses.
Page 64 000000-2231-545-GA-US-210817
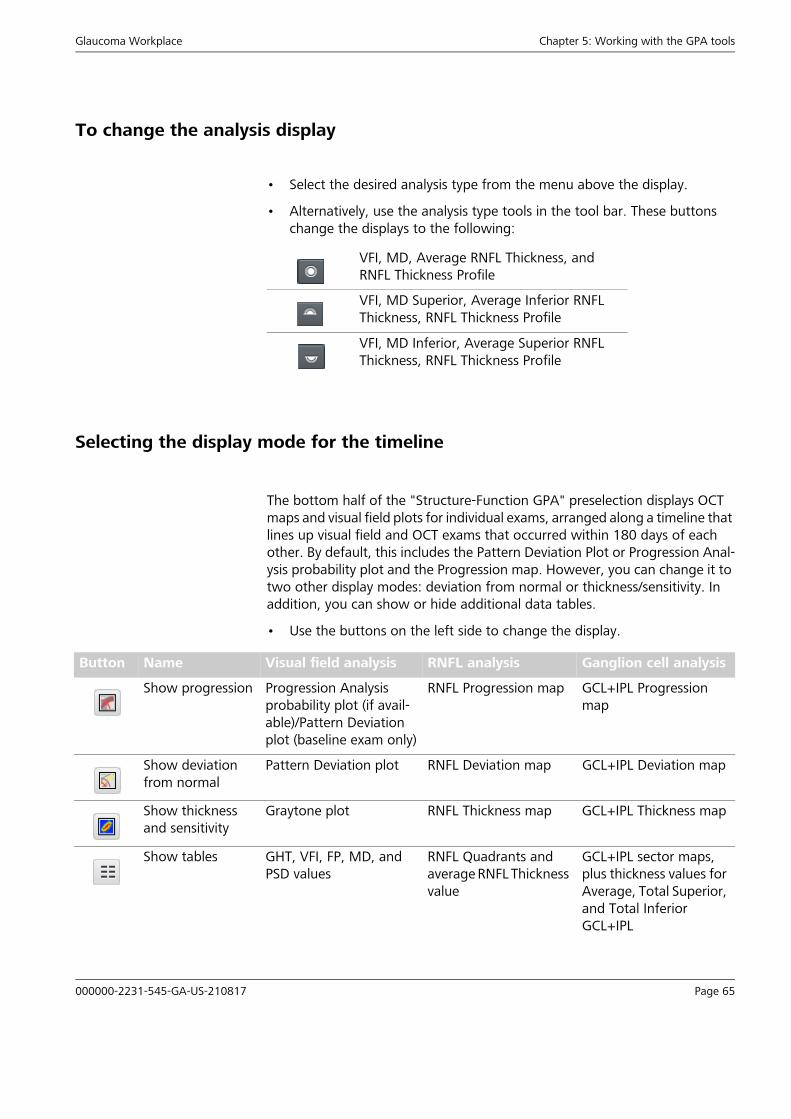
Glaucoma Workplace Chapter 5: Working with the GPA tools
To change the analysis display
• Select the desired analysis type from the menu above the display.
• Alternatively, use the analysis type tools in the tool bar. These buttons change the displays to the following:
Selecting the display mode for the timeline
The bottom half of the "Structure-Function GPA" preselection displays OCT maps and visual field plots for individual exams, arranged along a timeline that lines up visual field and OCT exams that occurred within 180 days of each other. By default, this includes the Pattern Deviation Plot or Progression Anal-ysis probability plot and the Progression map. However, you can change it to two other display modes: deviation from normal or thickness/sensitivity. In addition, you can show or hide additional data tables.
• Use the buttons on the left side to change the display.
VFI, MD, Average RNFL Thickness, and RNFL Thickness Profile
VFI, MD Superior, Average Inferior RNFL Thickness, RNFL Thickness Profile
VFI, MD Inferior, Average Superior RNFL Thickness, RNFL Thickness Profile
Button Name Visual field analysis RNFL analysis Ganglion cell analysis
Show progression Progression Analysis probability plot (if avail-able)/Pattern Deviation plot (baseline exam only)
RNFL Progression map GCL+IPL Progression map
Show deviation from normal
Pattern Deviation plot RNFL Deviation map GCL+IPL Deviation map
Show thickness and sensitivity
Graytone plot RNFL Thickness map GCL+IPL Thickness map
Show tables GHT, VFI, FP, MD, and PSD values
RNFL Quadrants and average RNFL Thickness value
GCL+IPL sector maps, plus thickness values for Average, Total Superior, and Total Inferior GCL+IPL
000000-2231-545-GA-US-210817 Page 65

Chapter 5: Working with the GPA tools Glaucoma Workplace
Refer to the HFA and CIRRUS user documentation for more information about these plots and maps.
Figure 5.9 shows the timeline with "Show tables" expanded.
Figure 5.9: Expanded "Show tables"
In "Progression" mode, basic OCT thickness values are displayed in tabular format.
In "Deviation" or "Thickness and Sensitivity" mode, the RNFL Quadrants and Macula Sector maps are displayed. The color coding of the RNFL quadrants and Macula sector maps correspond to the distribution of normals as described in the CIRRUS user manual.
In the timeline, all OCT scans, including the second Baseline, are registered to the first Baseline in order to ensure accurate correspondence from the first scan to the last scan.
Page 66 000000-2231-545-GA-US-210817

Glaucoma Workplace Chapter 5: Working with the GPA tools
Connecting to CIRRUS Review Software
If you want to see more details about an OCT exam that is displayed in the timeline, you can launch the CIRRUS Review Software directly from Glaucoma Workplace. The following prerequisites are required:
– The CIRRUS Review Software must be installed on the same computer as Glaucoma Workplace.
– The CIRRUS instrument and review software must be connected to FORUM.
– The user’s login must be the same for FORUM and the CIRRUS Review Software.
If Retina Workplace software is installed on the same computer as Glaucoma Workplace, macular scans are opened in Retina Workplace instead of the CIRRUS Review Software.
Refer to the CIRRUS instrument user manual for more information about review software installation and connection to FORUM.
• To open an exam in the CIRRUS Review Software, double-click on an image from the exam, such as the RNFL Progression map, in the timeline at the bottom of the "Structure-Function GPA" preselection.
This CIRRUS Review Software opens with the selected patient record for the selected date.
Importing updated CIRRUS data
Changes made in the CIRRUS software to a macular OCT scan after the data was imported into FORUM, such as changing the position of the ETDRS grid, can be subsequently imported into Glaucoma Workplace as well.
• In the timeline section of the "Structure-Function GPA" preselection, right-click on a macular scan.
• Select "Import manual OCT correction from CIRRUS".
All of the macular scans are updated with any changes that were made.
In macular cube scans, if the fovea has been set manually to the outer rim, analysis cannot be done in Glaucoma Workplace. In this case, either use the CIRRUS software to correct the placement of the fovea or choose another scan to use for analysis.
000000-2231-545-GA-US-210817 Page 67

Chapter 6: Creating and printing reports Glaucoma Workplace
Chapter 6: Creating and printing reports
Each window in Glaucoma Workplace offers options for saving and printing reports.
– In the "Visual Fields - Browser" preselection, you can save or print a single exam report, such as an SFA report or a kinetic exam report.
– In the "Visual Fields - Overview" preselection, you can save or print the Overview report.
– In the "Visual Field GPA" preselection, you can save several different GPA reports or print a GPA summary report.
– In the "Structure-Function GPA" preselection, you can save or print a Structure-Function GPA report.
– In the "Create Reports" preselection, you can save or print single exam reports, including SFA reports, kinetic reports, and suprathreshold reports, as well as create a custom Structure-Function OU report.
To configure Glaucoma Workplace to create specific types of reports automatically, see "Configuring automatic reports" on page 27.
Page 68 000000-2231-545-GA-US-210817

Glaucoma Workplace Chapter 6: Creating and printing reports
Creating and customizing reports
Reports that are created in Glaucoma Workplace are stored in FORUM, where they can viewed and printed. Several reports can also be printed directly from Glaucoma Workplace (see "Printing reports" on page 76).
Creating GPA reports
The "Visual Field GPA" preselection offers options for saving several types of GPA reports. Any changes made to the VF regression plot display, such as adding a dual baseline, are also reflected in the report.
To create a GPA Summary report
• Select the applicable eye and click the button ("Create report") in the toolbar.
The GPA Summary report is created and displayed. From this preview page, you can save the report to another location or print it. Otherwise, select <Close>; the report is saved to FORUM. Any previous versions of the report are overwritten.
For more information about GPA Summary reports, see "GPA Summary report" on page 81.
To create a Full GPA, SFA GPA, or GPA Last Three Follow-up report
• Select the applicable eye and click the button ("Create report as") in the toolbar.
• Select the applicable report type and click <Save>.
The selected GPA report is created and displayed. From this preview page, you can save the report to another location or print it. Otherwise, select <Close>; the report is saved to FORUM.
For more information about Full GPA, SFA GPA, or GPA Last Three Follow-up reports, see "Full GPA report" on page 85, "Single Field Analysis with GPA" on page 83, and "Last Three GPA Follow-up report" on page 88.
000000-2231-545-GA-US-210817 Page 69
Chapter 6: Creating and printing reports Glaucoma Workplace
Creating SFA reports
You can create an SFA report for a 10-2, 24-2, 24-2C or 30-2 threshold exam one of three ways.
• In the "Visual Fields - Browser" preselection, select the applicable eye and
the applicable exam, then select the button ("Create report") in the
toolbar at the top of the screen.
• Alternatively, double-click in the exam details for the applicable exam in either the "Visual Field GPA" preselection, the "Visual Fields - Overview" preselection or the "Visual Fields - Browser" preselection. Select <Save> in the "Report" window that opens.
• The third option is to use the "Create Reports" preselection, as described in "Creating a report for an individual visual field exam" on page 70.
The report is created and displayed. From the preview page, you can save the report to another location or print it. Otherwise, select <Close>; the report is saved to FORUM.
For more information about SFA reports, see "Single Field Analysis report" on page 79.
Creating a report for an individual visual field exam
The "Create Reports" preselection offers options for viewing, saving, and printing the following types of reports: SFA, Three in one, Numeric, Kinetic 30, Kinetic 90, Kinetic Table, Suprathreshold, and Suprathreshold OU.
• Select the "Create Reports" preselection.
The "Create Reports" preselection opens.
Page 70 000000-2231-545-GA-US-210817

Glaucoma Workplace Chapter 6: Creating and printing reports
Figure 6.1: "Create Reports" Preselection
• Select a report type.
• Select one or more exams.
The selected report is displayed on the right side of the screen. You can zoom in or out using the zoom buttons to the left of the report.
• Click the <Create reports> button.
Refer to the HFA Instructions for Use for more information about these reports.
000000-2231-545-GA-US-210817 Page 71

Chapter 6: Creating and printing reports Glaucoma Workplace
Creating Structure-Function reports
Two types of Structure-Function reports are available in Glaucoma Workplace. The Structure-Function GPA report displays the trend and progression analysis information available in the "Structure-Function GPA" preselection in report form. See "Structure-Function GPA report" on page 89 for more information. The Structure-Function OU (Single Exam) report presents data from one OCT exam and one visual field test that were performed within 180 days of each other. See "Structure-Function OU (Single Exam) reports" on page 92 for more information.
To configure Glaucoma Workplace to automatically create a Structure-Function OU (Single Exam) report every time OCT and HFA exams completed on the same date are imported, see "Configuring automatic reports" on page 27. This section explains how to manually create a Structure-Function OU (Single Exam) report or a Structure-Function GPA report.
The type of Structure-Function OU (Single Exam) report you can generate depends on the OCT test data and HFA test data available in FORUM.
To include normative data details in the report, "Create normative data details page for Structure-Function OU (Single Exam) reports" must be enabled on the "Glaucoma Workplace Configuration" page. See "Configuring general settings" on page 26.
To create a Structure-Function GPA report
• Select the button "Create report" in the toolbar in the "Structure-Function GPA" preselection.
The Structure-Function GPA Summary report is created and displayed. From this preview page, you can save the report to another location or print it. Otherwise, select <Close>; the report is saved to FORUM. Any pre-vious versions of the report are overwritten.
For more information about Structure-Function GPA reports, see "Structure-Function GPA report" on page 89.
Report Required HFA exam
Required OCT exam
Optional OCT exam
24-2/24-2C/30-2 and RNFL
24-2, 24-2C or 30-2 Threshold
Optic Disc Cube Macular Cube
10-2 and GCA 10-2 Threshold Macular Cube Optic Disc Cube
Page 72 000000-2231-545-GA-US-210817

Glaucoma Workplace Chapter 6: Creating and printing reports
To create a Structure-Function OU (Single Exam) report manually
• Double-click on the applicable patient in the Patient Directory.
• Select the "Create Reports" preselection.
• Select "Structure-Function OU (Single Exam)" from the list of reports.
The "Structure-Function OU (Single Exam)" wizard opens.
Figure 6.2: "Structure-Function OU (Single Exam)" selection window
At any step, you can select the <Previous> button to change your selections. Once you have selected at least one HFA exam and one OCT exam, you can also select the <Create report> button at any step to create the report without adding any more exams.
• Select an HFA test for at least one eye, then click <Next>.
If you select tests for both eyes, they must "match" by meeting one of the following conditions:
– Both tests are Central 10-2 Threshold tests
– Both tests are either Central 24-2, Central 24-2C or Central 30-2 Thresholds tests
• Select an OCT exam for at least one eye, then click <Next>.
• If you like to include the optional OCT exam for either or both eyes, select the exam(s) and click <Next>. Otherwise, click <Next> without selecting any exams.
000000-2231-545-GA-US-210817 Page 73

Chapter 6: Creating and printing reports Glaucoma Workplace
• If you would like to include fundus images, select them and click <Create report>. Otherwise, click <Create report> without selecting any images.
Glaucoma Workplace displays the report and stores it in FORUM under the date of the most recent exam included in the report.
For more information about Structure-Function (Single Exam) reports, see "Structure-Function OU (Single Exam) reports" on page 92 and "Structure-Function report: 10-2 Threshold and GCA" on page 96.
Page 74 000000-2231-545-GA-US-210817

Glaucoma Workplace Chapter 6: Creating and printing reports
Viewing and printing reports
Viewing reports
Reports created in Glaucoma Workplace are immediately displayed as a full-screen preview, as well as being stored in FORUM. They appear as thumbnails in the Document Display, and can be opened from there. However, you can also view reports without closing the preselection you are on.
• Select the arrow on the far right side of the screen to show the exam list and thumbnails.
Figure 6.3: Exam list and report thumbnails
• If the report thumbnail has not yet appeared, click ("Refresh").
• If you would like to see a report from a different date, select the exam date on the right.
• Double-click the report thumbnail to open it.
• Select <Close> to return to the preselection you were on.
1 Refresh button 2 Report thumbnails
1
2
000000-2231-545-GA-US-210817 Page 75

Chapter 6: Creating and printing reports Glaucoma Workplace
Printing reports
The "Visual Field GPA" preselection, "Visual Fields - Overview", "Visual Fields - Browser", and "Structure-Function GPA" preselections all offer an option for printing a report.
All four of these reports can be printed following the same steps:
• Select the applicable eye.
• Select the button ("Print") in the toolbar at the top of the screen.
• Set the parameters for the page setup in the "Page Setup" window and select <OK>.
• Set the printing parameters in the "Print" window and select <OK>.
Reports created in the "Create Reports" preselection can also be printed by selecting the <Print reports> button.
Printing a previously created report
• Select the arrow on the far right side of the screen to show the exam list and thumbnails.
• Select the exam date from the list on the right.
• Right-click on the report and select "Document Display".
• Select the button ("Print") in the toolbar at the top of the screen.
• Set the parameters for the page setup in the "Page Setup" window and select <OK>.
• Set the printing parameters in the "Print" window and select <OK>.
Preselection Report
Visual Field GPA GPA Summary report (configurable)
Visual Fields - Overview Overview report
Visual Fields - Browser SFA report
Structure-Function GPA Structure-Function GPA report
Page 76 000000-2231-545-GA-US-210817

Glaucoma Workplace Chapter 6: Creating and printing reports
Overview of reports
This section provides an overview of the different reports that are available. For more information about the individual elements of each report, refer to the HFA and CIRRUS user documentation.
Overview report
The Overview report consists of results from up to 200 threshold tests that used the selected test pattern. Exams are shown in chronological order, with the dates and test pattern indicated above each test summary.
As shown in Figure 6.4, the Overview report shows the following plots for each available visual field test: Graytone plot, Threshold plot, Total Deviation probability plot, and Pattern Deviation probability plot. Also included are reliability indices and global indices, including GHT results, the VFI, MD, PSD, and (for Full Threshold tests only) SF and CPSD.
The results of 24-2, 24-2C and 30-2 threshold exams can be shown in the same report, but 10-2 threshold exams cannot be combined with other test patterns. If non-STATPAC stimulus size V or non-STATPAC color Blue were used, graytone, numeric thresholds, and defect depth are printed, but no probability plots are available. You can also generate overview displays for SITA-SWAP tests.
000000-2231-545-GA-US-210817 Page 77

Chapter 6: Creating and printing reports Glaucoma Workplace
Figure 6.4: Overview report
1
2
3
4
5
6
1 Global indices 2 Laterality indicator
3 Patient data 4 Test pattern
5 Reliability indices 6 Probability legend
Page 78 000000-2231-545-GA-US-210817

Glaucoma Workplace Chapter 6: Creating and printing reports
Single Field Analysis report
The Single Field Analysis (SFA) Report provides in-depth information on a sin-gle central threshold test.
As shown in Figure 6.5, the top of the page lists out the details of the exam, such as the type of fixation monitoring, the type of stimulus, the test pattern, and the date and time of the test. Also included in the top section are the numeric reliability indices, while the gaze graph is shown at the bottom of the report. The main part of the report displays the test results in six formats: Graytone, Threshold, Total Deviation (probability and numeric formats), and Pattern Deviation (probability and numeric formats) plots. Next to the deviation plots are the global indices: GHT, VFI, MD, PSD, and (for Full Threshold tests only) SF and CPSD.
000000-2231-545-GA-US-210817 Page 79

Chapter 6: Creating and printing reports Glaucoma Workplace
Figure 6.5: Single Field Analysis report (SFA)
1
2
3
4
5
6
7
8
9
10
11
12
13
14
Page 80 000000-2231-545-GA-US-210817

Glaucoma Workplace Chapter 6: Creating and printing reports
GPA Summary report
The "GPA Summary" report provides a summary of the patient’s entire visual field history. The report summarizes key information available in the "Visual Field GPA" preselection of Glaucoma Workplace, including some detail for the baseline and selected follow-up exams, as well as a graphic representation of the visual field progression analysis.
As shown in Figure 6.6, at the top of the report, Graytone and Pattern Deviation plots are shown for the two baseline exams, along with key indices for these exams, such as VFI, MD, and PSD. In the center of the page is the VFI plot, with the VFI bar. Results for the selected follow-up exam are shown at the bottom of the report, including the Graytone plot, Pattern Deviation plot, Deviation from baseline plot and the Progression Analysis probability plot. The GPA alert appears here as well, if applicable.
1 Gaze graph 2 Total Deviation plot - probability
3 Total Deviation plot - numeric 4 Threshold plot
5 Reliability indices 6 Laterality indicator
7 Patient data 8 Test pattern
9 Exam details 10 Graytone plot
11 Pattern Deviation plot - numeric 12 Global indices
13 Pattern Deviation plot - probability
14 Probability legend
000000-2231-545-GA-US-210817 Page 81

Chapter 6: Creating and printing reports Glaucoma Workplace
Figure 6.6: GPA Summary report
1
2
3
4
5
6
7
8
9
10
11
12
13
14
15
17
16
Page 82 000000-2231-545-GA-US-210817

Glaucoma Workplace Chapter 6: Creating and printing reports
Single Field Analysis with GPA
"SFA GPA" is a Single Field Analysis report with a GPA Summary. It includes all of the same information that is included in an SFA report, with the addition of progression analysis.
As shown in Figure 6.7, the GPA information box includes the Progression Analysis probability plot for the selected follow-up exam, along with the exam dates for the baseline exams and the two previous follow-up exams. The GPA alert (if applicable) is also included.
1 Follow-up exam - Global indices and reliability indices
2 Follow-up exam - Pattern Deviation plot
3 Follow-up exam - Graytone plot 4 VFI plot with VFI bar
5 Baseline exam 1 - Reliability indices and global indices
6 Baseline exam 1 - Pattern Deviation plot
7 Baseline exam 1 - Graytone plot 8 Laterality indicator
9 Patient data 10 Test pattern
11 Baseline exam 2 - Graytone plot 12 Baseline exam 2 - Pattern Deviation plot
13 Baseline exam 2 - Reliability indices and global indices
14 Follow-up exam - Deviation from baseline plot
15 Follow-up exam - Progression Analysis probability plot
16 GPA alert message
17 Probability legends
000000-2231-545-GA-US-210817 Page 83

Chapter 6: Creating and printing reports Glaucoma Workplace
Figure 6.7: Single Field Analysis with GPA report
1
2
3
4
5
6
7
8
9
10
11
13
14
15
16
12
Page 84 000000-2231-545-GA-US-210817

Glaucoma Workplace Chapter 6: Creating and printing reports
Full GPA report
The "Full GPA" report (also known as "GPA_COMPLETE" in FORUM) is a multi-page overview of the patient’s entire visual field history for the selected test pattern. It combines the information available in an Overview report with the information available in a GPA Summary report.
As shown in Figure 6.8, the baseline page provides detailed information on the two baseline exams, including Graytone plot, Threshold plot, Total Deviation plot, Pattern Deviation plot, and key indices including VFI, MD, and PSD. The VFI plot and VFI bar are shown at the bottom of the first page.
As shown in Figure 6.9, the follow-up pages of the Full GPA report present a Graytone plot, Deviation from baseline plot, Pattern Deviation plot, and Progression Analysis probability plot for each follow-up exam.
1 Gaze graph 2 Total Deviation plot - probability
3 Pattern Deviation plot - probability
4 Total Deviation plot - numeric
5 Pattern Deviation plot - numeric 6 Threshold plot
7 Graytone plot 8 Reliability indices
9 Laterality indicator 10 Patient data
11 Test pattern 12 Exam details
13 Global indices 14 Progression Analysis probability plot
15 Baseline and follow-up exam dates
16 Probability legends
000000-2231-545-GA-US-210817 Page 85

Chapter 6: Creating and printing reports Glaucoma Workplace
Figure 6.8: Full GPA report baseline page
1
2
3
4
5
6
7
8
9
10
11
12
13
14
15
16
17
Page 86 000000-2231-545-GA-US-210817

Glaucoma Workplace Chapter 6: Creating and printing reports
Figure 6.9: Full GPA report follow-up pages
000000-2231-545-GA-US-210817 Page 87

Chapter 6: Creating and printing reports Glaucoma Workplace
Last Three GPA Follow-up report
The "GPA Last Three Follow-up" report follows the same format as the Full GPA report, but includes data from only the three most recent follow-up exams. This report is always two pages long.
1 VFI plot with VFI bar 2 Baseline exam 2 - Global indices
3 Baseline exam 2 - Graytone plot 4 Baseline exam 2 - Threshold plot
5 Baseline exam 1 - Global indices 6 Basline exam 1 - Graytone plot
7 Baseline exam 1 - Threshold plot
8 Laterality indicator
9 Patient data 10 Test pattern
11 Baseline exam 1- Total Deviation plot
12 Baseline exam 1- Pattern Deviation plot
13 Baseline exam 1 - Reliability indices
14 Baseline exam 2 - Total Deviation plot
15 Baseline exam 2 - Pattern Deviation plot
16 Baseline exam 2 - Reliability indices
17 Probability legend
Page 88 000000-2231-545-GA-US-210817

Glaucoma Workplace Chapter 6: Creating and printing reports
Structure-Function GPA report
The Structure-Function GPA report is a representation of the important information available in the "Structure-Function GPA" preselection. It includes both the overall visual field and/or OCT trend analyses and the plots and maps from individual HFA and OCT exams.
As shown in Figure 6.10, the top of the report displays the trend analyses selected in the "Structure-Function GPA" preselection, such as the regression plots and RNFL Thickness plots. The remainder of the report displays summary information for individual visual field and OCT exams: the baseline exams and the most recent follow-up exam are on the first page, and the three most recent follow-up exams are on the second page. Visual field data includes the Graytone plot, Total Deviation plot, Pattern Deviation plot or Progression Analysis probability plot, and the global indices. OCT data includes the Thickness, Deviation from normal, and Progression maps. The bottom of the report summarizes the progression suggested by the OCT trend analysis.
000000-2231-545-GA-US-210817 Page 89

Chapter 6: Creating and printing reports Glaucoma Workplace
Figure 6.10: Structure-Function GPA report
1
2
3
4
5
Page 90 000000-2231-545-GA-US-210817

Glaucoma Workplace Chapter 6: Creating and printing reports
76
000000-2231-545-GA-US-210817 Page 91

Chapter 6: Creating and printing reports Glaucoma Workplace
Structure-Function OU (Single Exam) reports
Structure-Function analyses present data from an HFA perimetry test and a CIRRUS OCT scan in one place.
Structure-Function report: 24-2/24-2C/30-2 Threshold and RNFL analysis
The Structure-Function report with 24-2, 24-2C or 30-2 Threshold test results and RNFL analysis maps presents information about visual field defects along-side RNFL parameters. Fundus images, if available, can also be added to this report.
As shown in Figure 6.11, for the selected visual field tests, the Graytone plot, Total Deviation plot, and Pattern Deviation plot are displayed at the top of the report, along with reliability indices and global indices for each exam. For the selected OCT exams, the RNFL thickness analysis is always included. Depend-ing on which exams you select for the report, fundus images, the RNFL quad-rants and clock hours, the Ganglion Cell Deviation map and the GCL+IPL parameter table may be included as well.
The normative data details pages, which are also optional, include two normative data tables for each eye: one for the ONH parameters and one for the RNFL parameters.
To create the normative data details pages, you must enable the "Create normative data details page for Structure-Function OU (Single Exam) reports" option on the "Glaucoma Workplace Configuration" page. For details, see "Configuring general settings" on page 26.
1 HFA plots 2 Regression plots and graphs
3 Laterality indicator 4 Patient data
5 OCT maps 6 Legends
7 OCT progression analysis summary
Page 92 000000-2231-545-GA-US-210817

Glaucoma Workplace Chapter 6: Creating and printing reports
Figure 6.11: Structure-Function report: 24-2/24-2C/30-2 Threshold and RNFL analysis
1 Patient data 2 Total Deviation plot
3 Pattern Deviation plot 4 Probability legend
5 RNFL thickness profile 6 Graytone plot
7 HFA test pattern 8 Laterality
9 Key to distribution of normals 10 RNFL and ONH parameters table
11 RNFL average thickness - clock hours
12 GCL+IPL Deviation from normal map (optional)
13 RNFL average thickness - TSNIT quadrants
14 RNFL Thickness map
15 RNFL Thickness Deviation from normal map
1 2 3 4 5 6 7 8
9101112131415
000000-2231-545-GA-US-210817 Page 93

Chapter 6: Creating and printing reports Glaucoma Workplace
Figure 6.12: Structure-Function report: 24-2/24-2C/30-2 Threshold and RNFL analysis (Normative data details pages)
1 Patient data 2 Exam details
3 Measured thickness value 4 Measured thickness value as compared with "normal" patient values, expressed as percentile
5 Measured thickness value minus reproducibility limit
6 Signal strength
7 Measured thickness value plus reproducibility limit
8 Laterality indicator
9 Key to distribution of normals
1 2 3 4 5 6 7 8
9
Page 94 000000-2231-545-GA-US-210817

Glaucoma Workplace Chapter 6: Creating and printing reports
000000-2231-545-GA-US-210817 Page 95

Chapter 6: Creating and printing reports Glaucoma Workplace
Structure-Function report: 10-2 Threshold and GCA
The structure-function report with 10-2 Threshold test results and GCA maps presents information from 10-2 Threshold test results and Macula Ganglion Cell Analysis (GCA). Fundus images, if available, can also be added to this report.
As shown in Figure 6.13, for the selected visual field tests, the Graytone plot, Total Deviation plot, and Pattern Deviation plot are displayed at the top of the report, along with reliability indices and global indices for each exam. For the selected OCT exams, the GCL+IPL parameter table, GCA sectors and GCL+IPL Deviation map are always included. Depending on which exams you select for the report, fundus images, the RNFL and ONH parameter table, RNFL Thick-ness map, and RNFL Thickness Deviation map may be included as well.
The normative data details pages, which are also optional, include three OCT normative data tables for each eye: one for the GCA parameters, one for ONH parameters, and one for the RNFL parameters. For information about enabling the normative data details pages, see "Configuring general settings" on page 26.
Page 96 000000-2231-545-GA-US-210817

Glaucoma Workplace Chapter 6: Creating and printing reports
Figure 6.13: Structure-Function report: 10-2 Threshold and GCA
1 Patient data 2 Total Deviation plot
3 Pattern Deviation plot 4 Probability legend
5 GCA sector map 6 Graytone plot
7 HFA test pattern 8 Laterality
9 Signal strength 10 RNFL Thickness map (optional)
11 Key to distribution of normals 12 ONH and GCL + IPL parameters table
13 RNFL Thickness Deviation from normal map (optional)
14 GCL+IPL Deviation from normal map
15 Fundus image (optional)
1 2 3 4 5 6 7 8
9101112131415
000000-2231-545-GA-US-210817 Page 97

Chapter 6: Creating and printing reports Glaucoma Workplace
Figure 6.14: Structure-Function report: 10-2 Threshold and GCA (Normative data details pages)
1 2 3 4 5 6 7 8
910
1 Patient data 2 Exam details
3 Measured thickness value 4 Measured thickness value as compared with "normal" patient data, expressed as percentile
5 Measured thickness value minus reproducibility limit
6 Signal strength
7 Measured thickness value plus reproducibility limit
8 Laterality indicator
9 GCA sector map 10 Key to distribution of normals
Page 98 000000-2231-545-GA-US-210817

Glaucoma Workplace Chapter 6: Creating and printing reports
000000-2231-545-GA-US-210817 Page 99

Index Glaucoma Workplace
Index
A
Abbreviations ........................................................................................... 30Automatic reports
10-2 threshold exam Overview report ........................................... 2724-2/24-2C/30-2 threshold exam Overview report ........................ 27GPA report ................................................................................... 28Single exam report ....................................................................... 27Structure-Function OU (Single Exam) report .................................. 28
Automatically creating reports ................................................................. 27Average Cup-to-Disc Ratio trend analysis ................................................. 64Average Inferior RNFL Thickness trend analysis ......................................... 64Average RNFL Thickness trend analysis ..................................................... 64Average Superior RNFL Thickness trend analysis ....................................... 64
B
Baseline exams ......................................................................................... 53OCT .............................................................................................. 53Selecting ....................................................................................... 53Set dual ........................................................................................ 55VF regression plot ......................................................................... 48
C
Cache location ......................................................................................... 29Cache size ................................................................................................ 29Caching ................................................................................................... 29
Proactive for scheduled patients ................................................... 29Caching window ...................................................................................... 29CCT values ............................................................................................... 62CE conformity ............................................................................................ 8Central 10-2 Threshold and GCA Structure-Function report ...................... 96CIRRUS Review Software .......................................................................... 67Clinical events .......................................................................................... 58
Marker ......................................................................................... 48Templates ..................................................................................... 60
Comments ............................................................................................... 39Add for an exam ........................................................................... 39Display for an exam ...................................................................... 41
Page 100 000000-2231-545-GA-US-210817

Glaucoma Workplace Index
Confidence bands .................................................................................... 48Configuration
Automatic report language ........................................................... 27Automatic reports ......................................................................... 27Cache location .............................................................................. 29Caching window ........................................................................... 29Data caching ................................................................................. 29Data export .................................................................................. 28Default dual baseline mode ........................................................... 29Default GPA report ....................................................................... 26Default perimetry trend analysis .................................................... 26Default time axis units ................................................................... 29Display .......................................................................................... 27Display settings ............................................................................. 27Firewall ......................................................................................... 20General ......................................................................................... 26Laterality display ........................................................................... 26Maximum cache size ..................................................................... 29Maximum number of OCT follow-up exams .................................. 27Normative data details page ......................................................... 26Normative database ...................................................................... 26Order of visual field exams ............................................................ 27Patient name display ..................................................................... 26RNFL Thickness Profile orientation ................................................ 28User-specific settings .................................................................... 29Visual acuity data format .............................................................. 26
Configuration window ............................................................................. 25Configuring Glaucoma Workplace ............................................................ 25Create Reports window ............................................................................ 71
D
Data exportConfiguration ............................................................................... 28DICOM OPV .................................................................................. 28
Data networks .......................................................................................... 11Data protection ........................................................................................ 10DICOM OPV format .................................................................................. 28Display
Abbreviations ................................................................................ 30Configuration ............................................................................... 27Document thumbnails ................................................................... 23Laterality orientation ..................................................................... 26Order of exams ............................................................................. 27Show exam list ............................................................................. 23Show Presets ................................................................................ 23
000000-2231-545-GA-US-210817 Page 101

Index Glaucoma Workplace
Time axis ...................................................................................... 47Timeline ........................................................................................ 65
Display configuration ............................................................................... 27Document Display window .......................................................... 23, 24, 75Dual baseline ........................................................................................... 55
Default setting .............................................................................. 29Types ............................................................................................ 55
E
Error handling .......................................................................................... 21Error messages ......................................................................................... 22Event analysis ........................................................................................... 33Exam list .................................................................................................. 23Exams
Adding comments ........................................................................ 39Automatically selected for GPA ..................................................... 53Baseline ........................................................................................ 53Displaying comments .................................................................... 41Excluding from GPA ...................................................................... 57Follow-up ..................................................................................... 53Including excluded ........................................................................ 57Reliability ...................................................................................... 41
Gaze Tracker ..................................................................... 41Symbols ........................................................................................ 49
F
False negatives ......................................................................................... 41False positives .............................................................................. 41, 49, 53Firewall configuration .............................................................................. 20Fixation losses .......................................................................................... 41Follow-up exams ...................................................................................... 53
Automatically selected/excluded ................................................... 53Exclude from GPA ......................................................................... 57Including excluded ........................................................................ 57Maximum number ........................................................................ 53Maximum number of OCT follow-up exams .................................. 27OCT .............................................................................................. 53Selecting ....................................................................................... 53VF regression plot ......................................................................... 49Walk through ............................................................................... 63
Full GPA report ........................................................................................ 85Full Threshold exams ................................................................................ 52
Page 102 000000-2231-545-GA-US-210817

Glaucoma Workplace Index
G
Gaze graph .............................................................................................. 41Gaze Tracking .......................................................................................... 41GCL+IPL Deviation map ............................................................................ 65GCL+IPL Progression map ........................................................................ 65GCL+IPL Thickness map ............................................................................ 65General configuration ............................................................................... 26Generating reports ................................................................................... 68Getting started ......................................................................................... 23Glaucoma Workplace
Configuration ............................................................................... 25Installing server software .............................................................. 18
GPAExclude follow-up exams .............................................................. 57Include excluded follow-up exams ................................................ 57Minimum number of exams .................................................... 33, 37Regression line .............................................................................. 48Selecting baseline exams ............................................................... 53Selecting the visual field test strategy ............................................ 52Tools ............................................................................................. 45VF regression plot ......................................................................... 48
GPA report type default ........................................................................... 26GPA reports
Configuration ............................................................................... 26Creating automatically .................................................................. 28Full GPA report ............................................................................. 85GPA SFA report ............................................................................. 83GPA Summary report .................................................................... 81Last Three Follow-up report .......................................................... 88Printing ......................................................................................... 76Structure-Function GPA report ...................................................... 89
GPA SFA report ........................................................................................ 83GPA Summary report ................................................................................ 81GPA tool bar ............................................................................................ 46Graytone plot ........................................................................................... 65
H
Hardware platform requirements ............................................................. 16Hazard symbols .......................................................................................... 7
I
Indications for Use ................................................................................... 13Information security ................................................................................. 10
000000-2231-545-GA-US-210817 Page 103

Index Glaucoma Workplace
Installation ............................................................................................... 18Requirements ............................................................................... 15Server software ............................................................................ 18
Intended Use ........................................................................................... 13IOP .......................................................................................................... 50
Adding IOP values ........................................................................ 62Target range ................................................................................. 63Viewing IOP values ....................................................................... 62
K
Kinetic 30 report ...................................................................................... 70Kinetic 90 report ...................................................................................... 70Kinetic Table report .................................................................................. 70
L
Label Symbols ............................................................................................ 8Last Three Follow-up report ..................................................................... 88Laterality
Display orientation ........................................................................ 26Licenses ................................................................................................... 18Linear regression line ............................................................................... 48
M
Main screens ............................................................................................ 30Malfunctions ............................................................................................ 21Manufacturer's address .............................................................................. 2MD plot ................................................................................................... 48Mean Deviation Inferior plot .................................................................... 50Mean Deviation plot .......................................................................... 48, 50Mean Deviation Superior plot ................................................................... 50
N
Normal Use .............................................................................................. 14Normative data compatibility ................................................................... 26Normative data details pages ............................................................. 26, 92Normative database configuration ........................................................... 26Numeric report ........................................................................................ 70
O
OCT examsOpening in CIRRUS Review Software ............................................ 67
OCT Trend analysisSelecting ....................................................................................... 64
Page 104 000000-2231-545-GA-US-210817

Glaucoma Workplace Index
OCT Trend analysis metrics ....................................................................... 64Opening Glaucoma Workplace ................................................................. 23Overview
Glaucoma Workplace .................................................................... 30Reports ......................................................................................... 77
Overview report ....................................................................................... 77Automatically creating 10-2 threshold exam Overview reports ...... 27Automatically creating 24-2/24-2C/30-2 threshold exam Overview reports .......................................................................... 27Printing ......................................................................................... 76
P
Patient Directory ...................................................................................... 23Patient name character types ................................................................... 26Patient records ......................................................................................... 23Pattern Deviation plots ............................................................................. 65Plots
IOP ............................................................................................... 62VF regression ................................................................................ 48
Preselection .............................................................................................. 30Structure-Function GPA .......................................................... 37, 64Visual Field GPA ............................................................................ 33Visual Fields - Browser .................................................................. 36
PresetsShow ............................................................................................ 23
Progression analysis .................................................................................. 33Progression Analysis probability plot ......................................................... 65Progression map ...................................................................................... 65
R
Rate of progression .................................................................................. 49Regression plots ....................................................................................... 48RelEYE ...................................................................................................... 42Reliability
Gaze Tracker ................................................................................. 41RelEYE .......................................................................................... 42
Reliability indices ...................................................................................... 41Reports .............................................................................................. 68, 77
Abbreviations ................................................................................ 30Configuration ............................................................................... 27Existing exams .............................................................................. 28Full GPA report ............................................................................. 85GPA Summary report .................................................................... 81
000000-2231-545-GA-US-210817 Page 105

Index Glaucoma Workplace
Kinetic 30 report ........................................................................... 70Kinetic 90 report ........................................................................... 70Kinetic Table report ...................................................................... 70Language setting .......................................................................... 27Last Three Follow-up report .......................................................... 88Numeric report ............................................................................. 70Overview report ............................................................................ 77Printing ......................................................................................... 76SFA report .............................................................................. 70, 79Single Field Analysis with GPA (SFA GPA) report ........................... 83Single visual field exam report ...................................................... 70Structure-Function GPA report ...................................................... 89Structure-Function OU (Single Exam) - Threshold and RNFL analysis ......................................................................................... 92Structure-Function OU (Single Exam) report .................................. 92Structure-Function reports ............................................................ 72Suprathreshold OU report ............................................................. 70Suprathreshold report ................................................................... 70Three in one report ....................................................................... 70
Requirements ........................................................................................... 15Hardware ..................................................................................... 16Software ....................................................................................... 17System configuration .................................................................... 16
RNFL Deviation map ................................................................................. 65RNFL Thickness
Average ........................................................................................ 64Average Inferior ............................................................................ 64Average Superior .......................................................................... 64
RNFL Thickness map ................................................................................ 65RNFL Thickness Profile
Orientation ................................................................................... 28RNFL Thickness profile orientation ............................................................ 29
S
Safety measures ......................................................................................... 9Server software, installing ........................................................................ 18SFA report .......................................................................................... 70, 79
Example ........................................................................................ 80Manually creating ......................................................................... 70Printing ......................................................................................... 76
Significance bands ................................................................................... 51Single exam report
Automatically creating a single exam report ................................. 27Retroactively creating ................................................................... 28
SITA (mixed) ............................................................................................. 52SITA (mixed) 10-2 ..................................................................................... 52
Page 106 000000-2231-545-GA-US-210817

Glaucoma Workplace Index
SITA Fast .................................................................................................. 52SITA Faster ............................................................................................... 52SITA Standard .......................................................................................... 52Software
Platform requirements .................................................................. 17Server ........................................................................................... 18
Structure-Function GPA preselection .................................................. 37, 64Synchronizing the displays ............................................................ 47Tool bar ........................................................................................ 46VF regression plot ......................................................................... 48
Structure-Function GPA report ........................................................... 72, 89Printing ......................................................................................... 76
Structure-Function OU (Single Exam) report ........................................ 72, 9224-2/24-2C/30-2 Threshold and RNFL analysis report .................... 92Automatically creating .................................................................. 28Normative data details .................................................................. 26
Structure-Function reports10-2 Threshold and GCA ............................................................... 96Manually creating ......................................................................... 72Structure-Function GPA report ...................................................... 89Structure-Function OU (Single Exam) report .................................. 92
Suprathreshold OU report ........................................................................ 70Suprathreshold report .............................................................................. 70Symbols ..................................................................................................... 8
Hazard ............................................................................................ 7Label ............................................................................................... 8VF regression plot ......................................................................... 49
Synchronize .............................................................................................. 47System configuration requirements .......................................................... 16
T
Tabs ......................................................................................................... 30Test strategy ............................................................................................ 52Three in one report .................................................................................. 70Time axis
Changing the units ....................................................................... 47Default setting .............................................................................. 29
Timeline ................................................................................................... 65Tool bars .................................................................................................. 46Tools
Show and hide significance bands ................................................ 51Structure-Function GPA preselection ............................................. 64Synchronize .................................................................................. 47Walk through follow-up exams ..................................................... 63Zoom ............................................................................................ 46
000000-2231-545-GA-US-210817 Page 107

Index Glaucoma Workplace
Trend analysis .......................................................................................... 33Average Cup-to-Disc Ratio ............................................................ 64Average Inferior RNFL Thickness ................................................... 64Average RNFL Thickness ............................................................... 64Average Superior RNFL Thickness ................................................. 64Default ......................................................................................... 26
Troubleshooting ....................................................................................... 21Error messages ............................................................................. 22Malfunctions ................................................................................ 21
U
Updating CIRRUS data ............................................................................. 67User settings ............................................................................................ 29
V
VF regression plot .................................................................................... 48Baseline exams ............................................................................. 48Confidence bands ......................................................................... 48Future projection .......................................................................... 49Rate of progression ...................................................................... 49Selecting baseline exams .............................................................. 53Selecting follow-up exams ............................................................ 53Selecting the plot type .................................................................. 48Significance bands ........................................................................ 51Symbols ........................................................................................ 49
VFI plot .................................................................................................... 50Virus protection software ......................................................................... 20Visual acuity format ................................................................................. 26Visual Field GPA preselection ................................................................... 33
Synchronize .................................................................................. 47Tool bar ........................................................................................ 46VF regression plot ......................................................................... 48VF regression plot type ................................................................. 50Walk through follow-up exams ..................................................... 63
Visual Field Index plot .............................................................................. 48Visual field test strategy ........................................................................... 52Visual Fields - Browser preselection .......................................................... 36
Create SFA report ......................................................................... 70
W
Walk through follow-up exams ................................................................ 63
Page 108 000000-2231-545-GA-US-210817

Glaucoma Workplace Index
Z
Zoom ....................................................................................................... 46
000000-2231-545-GA-US-210817 Page 109

Index Glaucoma Workplace
Page 110 000000-2231-545-GA-US-210817

Glaucoma Workplace
000000-2231-545-GA-US-210817 Page 111

Goeschwitzer Str. 51–5207745 JenaGermany
E-mail: [email protected]: www.zeiss.com/med
Carl Zeiss Meditec AG
5160 Hacienda DriveDublin, CA 94568USA
Toll-free: 800-341-6968Phone: 925 557-4100Fax: [email protected]/med
Carl Zeiss Meditec, Inc.


000000-2231-545-DokS-US-210817
Carl Zeiss Meditec AGGoeschwitzer Str. 51-5207745 JenaGermany
Email: [email protected]: www.zeiss.com/med
Glaucoma Workplace 3.1Specifications subject to change


