Glass-ceramics for photonic applications: an example
22
Glass-ceramics for photonic applications: an example (Reference based optical characterization of glass- ceramic converter for high power white LEDs) Authors: A. Engel a , M. Letz a , T. Zachau a , E. Pawlowski a , K. Seneschal-Merz a , T. Korb a , D. Enseling a , B. Hoppe a , U. Peuchert a , J.S. Hayden b Presented by: U. Fotheringham a a SCHOTT AG, Hattenbergstr. 10, 55014 Mainz, Germany b SCHOTT North America, RDD, 400 York Avenue, Duryea, PA 18642 USA
description
Glass-ceramics for photonic applications
Transcript of Glass-ceramics for photonic applications: an example

Glass-ceramics for photonic applications: an example
(Reference based optical characterization of glass-ceramic converter for high power white LEDs)
Authors: A. Engela, M. Letza, T. Zachaua, E. Pawlowskia, K. Seneschal-Merza, T. Korba,
D. Enselinga, B. Hoppea, U. Peucherta, J.S. Haydenb
Presented by: U. Fotheringhama
aSCHOTT AG, Hattenbergstr. 10, 55014 Mainz, GermanybSCHOTT North America, RDD, 400 York Avenue, Duryea, PA 18642 USA

� motivation
� glass ceramic at Schott (definition of glass ceramics)
� glass ceramic converter materials
� description of fluorescence measurements together with the corresponding scattering regimes
� used metrology for lifetime determination
� lifetime measurements on our glass ceramics
� conclusion
Outline

Goal: development of converter materials for HB-WLEDs
blue LED + yellow converter = white LED
Standard White LED light generation: conversion using YAG:Ce
wavelength in nm

Usually this phosphor is applied as a powder which is embedded in a polymer or
silicone matrix.
This solution has besides some processing steps two major drawbacks.
1)
large refractive index of n=1.836 (YAG crystals) are embedded in a material
with a much lower refractive index in the order of 1.45 – 1.55.
���� Large difference in refractive index leads to high amount of scattering light
���� decreasing by strongly reducing the size of the crystallites recommended
���� leading to the development of nano-YAG.
2)
Organics materials involved suffer from thermal and radiation stabilty
- strong radiation
- high temperature and
- non negleglible part of UV radiation
� Therefore glass ceramics with small ∆∆∆∆n as solely solid state solutions for converter materials can be promising candidates for color conversion.
Motivation
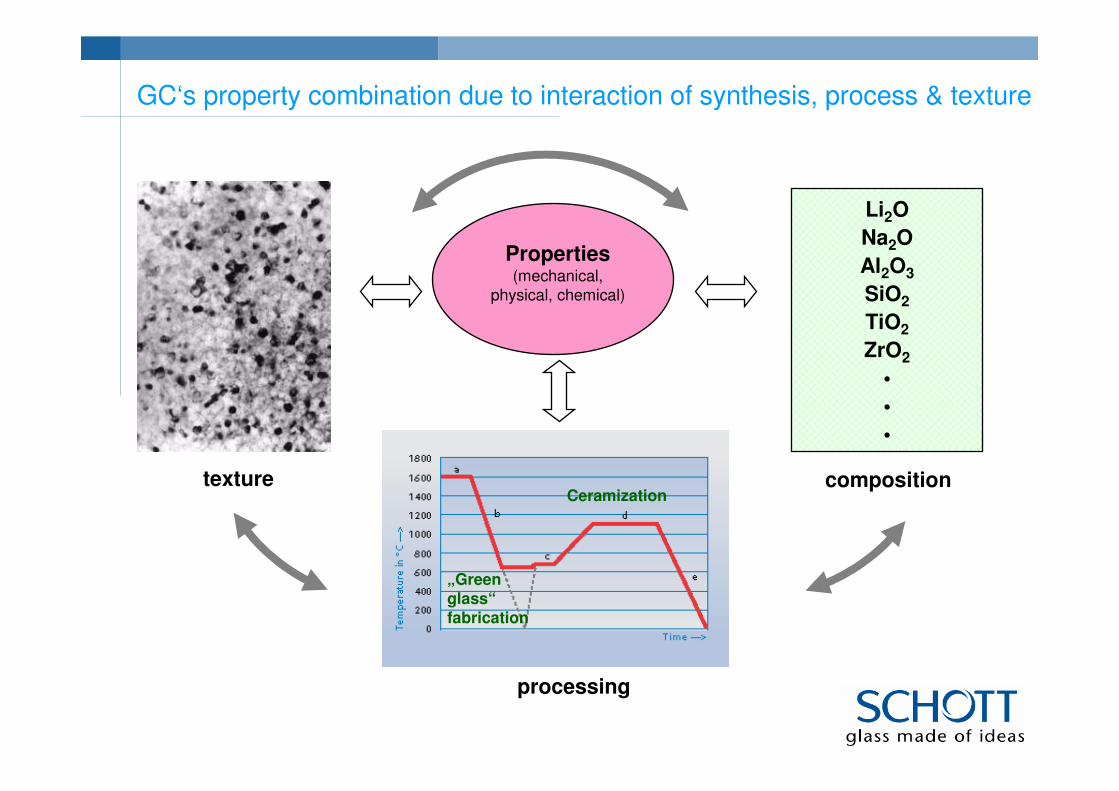
Li2O
Na2O
Al2O3
SiO2
TiO2
ZrO2
•
•
•
compositiontexture
Properties (mechanical,
physical, chemical)
„Greenglass“fabrication
Ceramization
processing
GC‘s property combination due to interaction of synthesis, process & texture
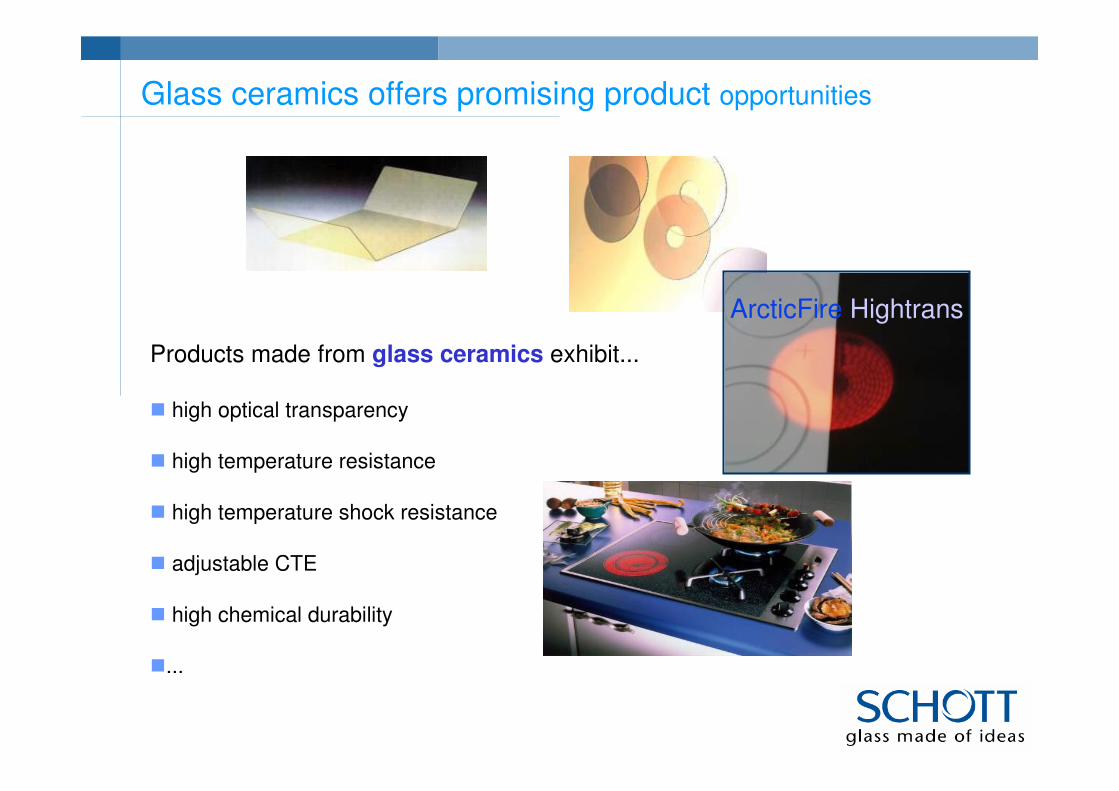
ArcticFire Hightrans
Products made from glass ceramics exhibit...
� high optical transparency
� high temperature resistance
� high temperature shock resistance
� adjustable CTE
� high chemical durability
�...
Glass ceramics offers promising product opportunities
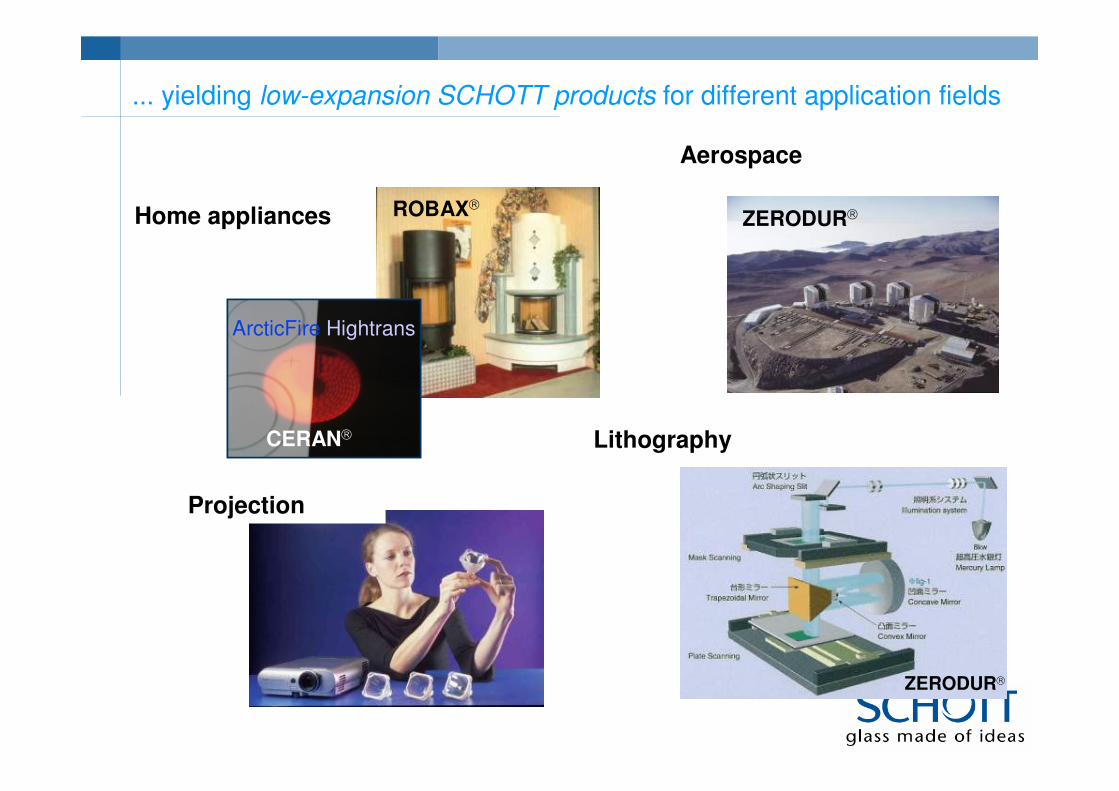
... yielding low-expansion SCHOTT products for different application fields
Home appliances
Aerospace
ArcticFire HightransArcticFire Hightrans
CERAN
ROBAX
Projection
ZERODUR
Lithography
ZERODUR

500 600 700 800 900 1000 1100 1200 1300 1400 1500500 600 700 800 900 1000 1100 1200 1300 1400 1500
130
140
150
160
170
180
T / °C
DT
A [@
5 K
min
-1; a
rb. u
n.]
E / G
Pa
CTE30-300 ~5 ppm/K
CTE30-300 ~6,5 ppm/K
CTE30-300 ~6 ppm/K
The Core: Crystallization and Crystal Phases ( MgO-Al2O3-SiO2-GK)
spinel → sapphirine → cordierite
type and amount determines:
� mechanical properties
� thermal expansion
� thermal stability
� chemical stability
� toughness
� transparency

Glass ceramics from the Y2O3-Al2O3-SiO2-system
Yttriumpyrosilicate(Keiviite) Mullite
Yttrium Aluminium Garnet
� �

We realize a pure YAG phase in our YAS-glass ceramic
electron microscopy
shows crystallites
and residual glass
example:
X-ray diffraction proves
pure YAG as crystalline
phase!!
samples turn yellow

Light conversion on 0.1-0.5mm thick samples possible:
0.0
0.1
0.2
0.3
0.4
0.5
0.6
0.7
0.8
0.9
1.0
250 300 350 400 450 500 550 600 650 700 750 800 850
Wavelength (nm)
Re
mis
sio
n
3% YAC:Ce in Silicone phosphor powder Schott 5 0.328 mm
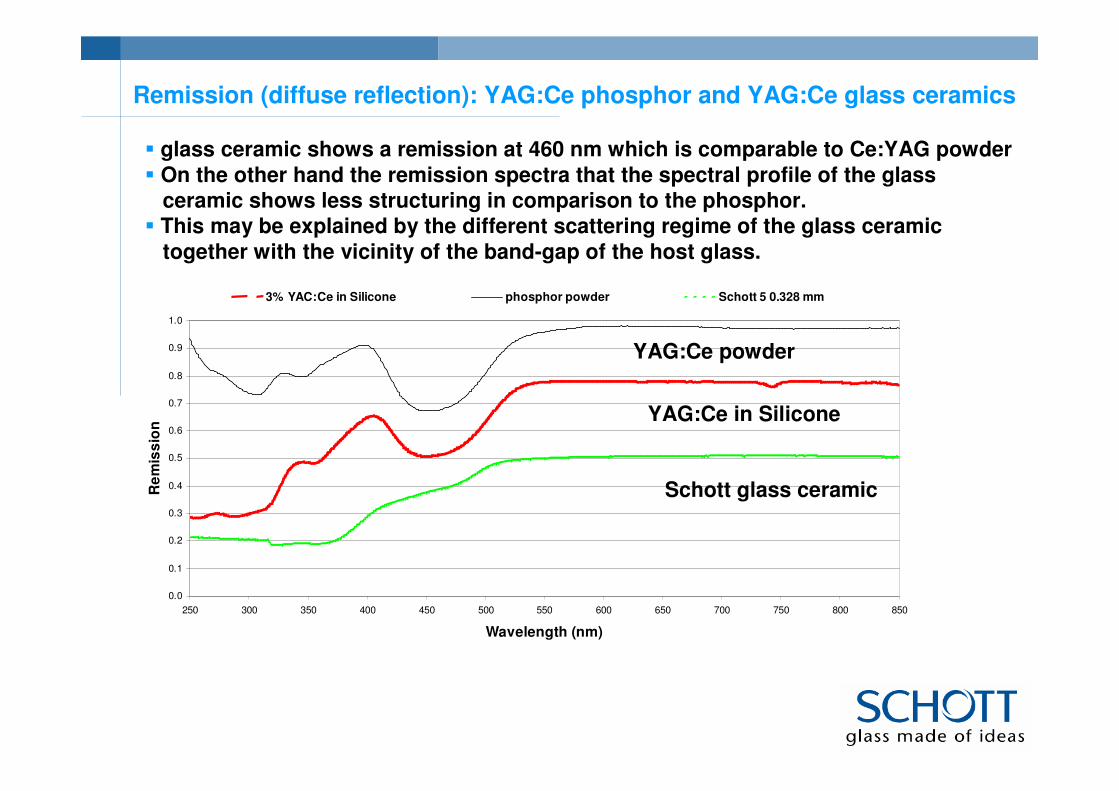
Remission (diffuse reflection): YAG:Ce phosphor and YAG:Ce glass ceramics
� glass ceramic shows a remission at 460 nm which is comparable to Ce:YAG powder
� On the other hand the remission spectra that the spectral profile of the glass
ceramic shows less structuring in comparison to the phosphor.
� This may be explained by the different scattering regime of the glass ceramic
together with the vicinity of the band-gap of the host glass.
Schott glass ceramic
YAG:Ce in Silicone
YAG:Ce powder

0
500000
1000000
1500000
2000000
2500000
3000000
3500000
4000000
4500000
290 390 490 590 690 790Wavelength in nm
Inte
nsit
y
in c
ps
1% YAG:Ce in Silicone emissio em 460 nm
1% YAG:Ce in Silicone emissio ex 545 nm
Schott 5 em 460 nm
Schott 5 ex 545 nm
Excitation & emission spectra of YAG:Ce phosphor & glass ceramics
� We observe the expected spectral absorption and emission profiles.
� For the phosphor we find absorption and excitation for maximum at 350
and 450 nm, whereas for the glass ceramics we see mainly the 450 nm
absorption.
� This reduction of the 350 nm excitation is determined by the band-
gap absorption of the host glass system.

The lifetime ττττl of the Ce3+ fluorescence level is completely independent on the scattering regime !
ττττl : measured lifetime,
ττττid : lifetime of YAG:Ce in a perfect single crystal, approximately 67ns
ττττNR : originates from non radiative processes, which are e.g. coupling to phonon modes or coupling to impurities in the material.
Lifetime measures internal quantum efficiency !
NRidlτττ
111+=
FLUOLOG 3 with IBH lifetime module with Time correlated single photon counting TCSPC

FLUOLOG 3 with lifetime module
� detection performed using identical double monochromators of the FLUOLOG 3.
� Synchronization of pulsed ignition and detection performed via a controller, which
determines the timing of excitation and that of emitted photons and
calculates the respective time of delay.
� decay time of a fluorescent state is defined as the time interval after which the
initial intensity has decreased to 27 % (= 1/e part).
fluorescence signal
scattering
fitting accuracy
fluorescence signal
scattering
fitting accuracy
Cts
Std
. D
ev.
Au
to-c
orr
.
Channels (1 Ch = 0.28 ns)
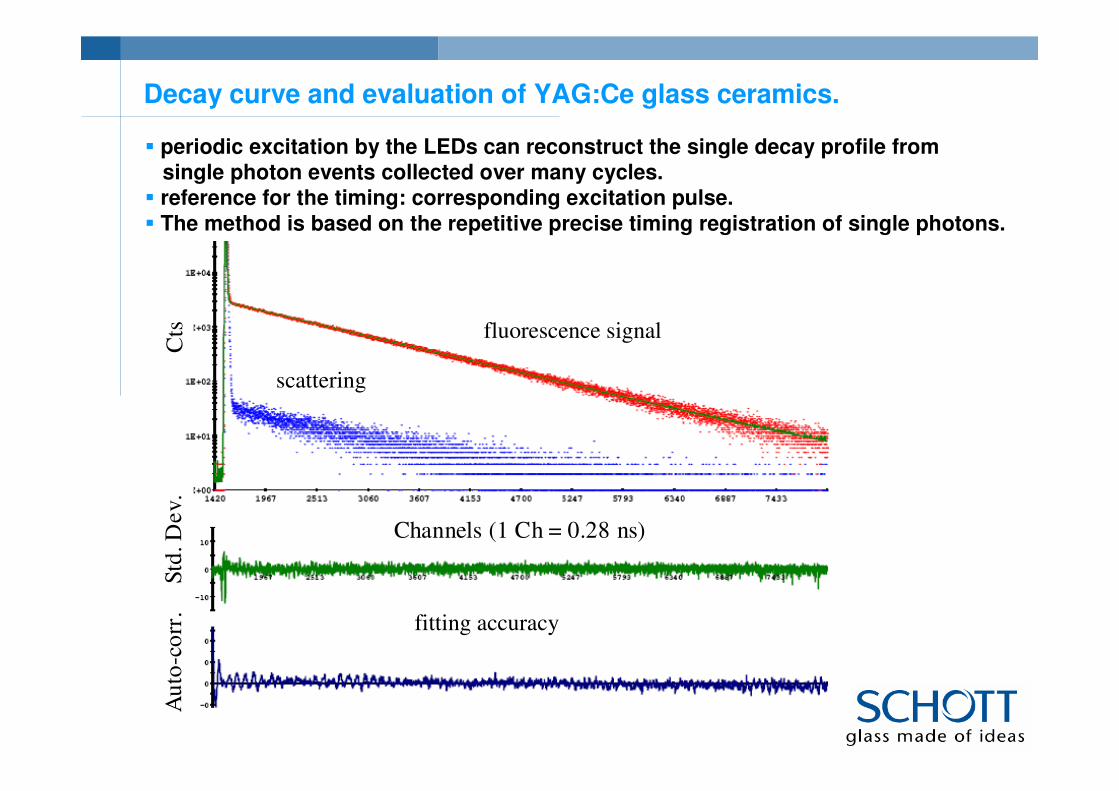
Decay curve and evaluation of YAG:Ce glass ceramics.
� periodic excitation by the LEDs can reconstruct the single decay profile from
single photon events collected over many cycles.
� reference for the timing: corresponding excitation pulse.
� The method is based on the repetitive precise timing registration of single photons.

0 10 20 30 40 50 60 70 80
0
500
1000
1500
2000
2500
3000
3500
Cts
Delay in ns
CaF2:Pb; em: 540 nm
ExpDec fit
Decay curve of CaF2:Pb for the emission of 540 nm
� Testing procedure for the fluorescence decay measurement using a doped CaF2:Pb
crystal. The sample itself is transparent in the visible range.
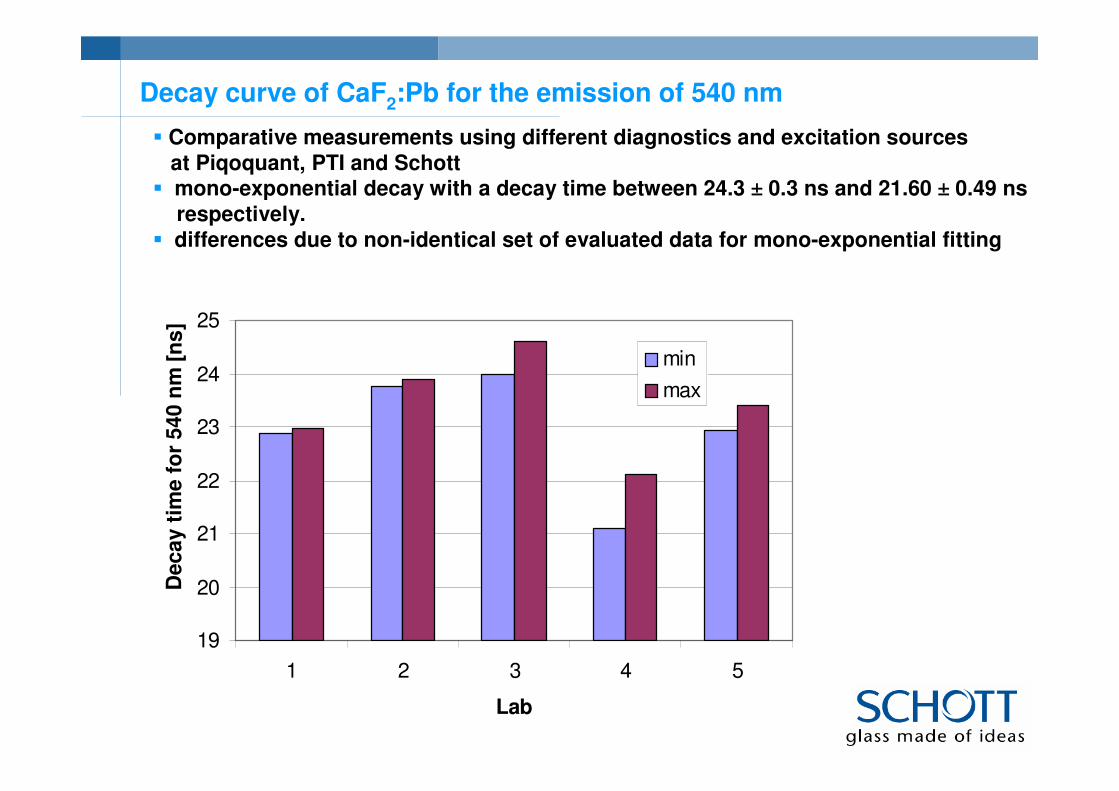
� Comparative measurements using different diagnostics and excitation sources
at Piqoquant, PTI and Schott� mono-exponential decay with a decay time between 24.3 ± 0.3 ns and 21.60 ± 0.49 ns
respectively.
� differences due to non-identical set of evaluated data for mono-exponential fitting
Decay curve of CaF2:Pb for the emission of 540 nm
19
20
21
22
23
24
25
1 2 3 4 5
Lab
Decay t
ime f
or
540 n
m
min
max
[ns
]

Lifetime evaluation using mono exponential fitting procedures
� A mono-exponential fit is very sufficient to determine the lifetime of the
observed emission
� The shape of the decay curves is very similar, but the intensity is different
between the phosphor and the glass ceramic material.
� This may be explained by the different absorption mechanism, but nevertheless
the observed samples show the same decay characteristics.

45
50
55
60
65
70
-50 0 20 60 100 130 150
Temperature in °C
De
ca
y t
ime
in
ns
Schott 5 Schott 1 Schott 1 repro 3 % in Silicone
Lifetime dependency versus temperature
� The temperature dependency shows no significant changes within the accuracy
� In order to check how temperature dependent effects occur, as already reported for
different types of phosphors, we have to improve the accuracy of our
measurements for these types of material.
Single crystal
lifetime at RT
67 +/- 6 nsE.Zych et al.J. Lum. 75, 193 (1997)
60 - 65 nsE. Mihokova et al.J. Lum. (2006)

� The lifetime measurement of the Ce3+ fluorescence in our glass ceramic has
been performed for the first time.
� Accurate lifetime measurements in our glass ceramic show a lifetime of
62 +/- 6 ns and suggest that our material is at least comparable to existing
YAG:Ce phosphors (67 +/- 5 ns) with respect to internal conversion efficiency.
� We believe to reach an accuracy below ± 10 %.
� In the nearest future round robin tests have to be performed in order to check
the consistency of the fitting procedures.
� Next steps will be further temperature dependent measurements in order to
prove the observed shifts of the life time
Conclusion Lifetime measurements

Conclusion
� A glass ceramic material shows large potential as a converter material for
blue-white light conversion in a white LED.
� Our glass ceramic is a moderate scattering, translucent material.
� it allows freedom of design to adjust the scattering level
� it offers a challenging regime for measuring and quantifying fluorescence.
� As a first step we showed fluorescence as well as excitation spectra and
measurements of the life time for the Ce3+ fluorescence.
� We conclude from lifetime measurements that our material has practically no
additional channels for non radiative decay.
� There is no principle reason that this glass ceramic material will not reach
best conversion efficencies know today from phosphor powders.