GKHAtlas 2019 168pp withColourLinks.qxp 8.25x10
172
2019
Transcript of GKHAtlas 2019 168pp withColourLinks.qxp 8.25x10

2019

www.theisn.org
Online version of ISN Global Kidney Health Atlas: www.theisn.org/global-atlas
© International Society of Nephrology, 2019
No part of this publication may be reproduced, translated, or transmitted in any form or by any meanswithout the prior written permission of the International Society of Nephrology.
Design and layout: John Labots Graphic Design Inc.Cover design: Stacey RichardsonEditing and proofreading: Kara Stephenson Gehman
Citation: Bello AK, Levin A, Lunney M, Osman MA, Ye F, Ashuntantang G, Bellorin-Font E, Benghanem Gharbi M, Ghnaimat M, Harden P, Jha V, Kalantar-Zadeh K, Kazancioglu R,Kerr P, Ossareh S, Perl J, Rondeau E, Solá L, Tesar V, Tchokhonelidze I, Tungsanga K, Rashid HU, Yang CW, Zemchenkov A, Zhao MH, Jager KJ, Caskey F, Perkovic V, Okpechi IG, Tonelli M, Feehally J, Harris D, Johnson DW (2019). Global Kidney Health Atlas: A report by the International Society of Nephrology on the Global Burden of End-stage Kidney Disease and Capacity for Kidney Replacement Therapy and Conservative Care across World Countries and Regions. International Society of Nephrology, Brussels, Belgium.

ISN Global Kidney Health Atlas | 2019 Table of contents
TABLE OF
CONTENTS
1 FOREWORD
3 EXECUTIVE SUMMARY
5 ACKNOWLEDGEMENTS
11 ABBREVIATIONS
12 KEY TERMS
13 ABSTRACTBackgroundMethods
15 Results17 Conclusion
19 SECTION 1 INTRODUCTION1.1 CKD
20 1.2 Burden of ESKD21 1.3 Treatment for ESKD 1.3.1 KRT22 1.3.2 Conservative care23 1.3.3 Essential medications in ESKD care
1.4 Access to and quality of ESKD care worldwide
24 1.5 AKI1.6 Health information systems
25 1.7 National health policies1.8 A global ESKD strategy
27 SECTION 2 METHODS2.1 Overview2.2 Scope and timeline
28 2.3 Desk research31 2.3.1 Scoping review of health systems
characteristics 2.3.2 Systematic review of relevant CKD
epidemiological data34 2.3.3 Scoping review of KRT cost estimates
35 2.4 Survey 2.4.1 Development and validation 2.4.2 Structure
36 2.4.3 Sampling 2.4.4 Data handling 2.4.5 Analysis
37 DESK RESEARCH FINDINGS39 SECTION 3 DESK RESEARCH FINDINGS
3.1 Treated ESKD41 3.2 Chronic dialysis43 3.3 Chronic HD45 3.4 Chronic PD47 3.5 Kidney transplantation52 3.6 Costs of KRT 3.6.1 Maintenance HD 3.6.2 Maintenance PD53 3.6.3 Kidney transplantation 3.6.4 Comparing costs of maintenance HD with
maintenance PD
55 SURVEY FINDINGS57 SURVEY RESPONSE
59 SECTION 4 HEALTH FINANCE ANDSERVICE DELIVERY4.1 Healthcare system and funding mechanism
64 4.2 Within-country variation65 4.3 Oversight
67 SECTION 5 HEALTH WORKFORCE FORNEPHROLOGY CARE5.1 Clinical responsibility5.2 Workforce
71 SECTION 6 ACCESS TO ESSENTIALMEDICATIONS AND HEALTH PRODUCTS6.1 Capacity for KRT service provision
75 6.2 Preparation for KRT78 6.3 Accessibility of KRT 81 6.4 Affordability of KRT 83 6.5 Medication funding in patients on KRT84 6.6 Vascular access for KRT 85 6.7 Quality of KRT services88 6.8 Availability of nutritional services90 6.9 Availability of conservative care
Page Page

Table of contents ISN Global Kidney Health Atlas | 2019
93 SECTION 7 HEALTH INFORMATIONSYSTEMS 7.1 Registries
101 7.2 Identification of disease (AKI and CKD)
105 SECTION 8 LEADERSHIP, ADVOCACY,AND BARRIERS TO ESKD CARE8.1 Policy and strategy
109 8.2 Advocacy111 8.3 Barriers to optimal ESKD care
113 SECTION 9 DISCUSSION 9.1 Gaps in services and resources
115 9.2 Implications 9.2.1 Health finance and service delivery
116 9.2.2 Health workforce for nephrology care 9.2.3 Access to essential medications, health
products, and technologies for ESKD care118 9.2.4 Health information systems119 9.2.5 Leadership, advocacy, and barriers to
ESKD care
120 9.3 Limitations in national and regional capacity
121 9.4 Recommendations 9.4.1 Increase health care financing for ESKD
prevention and management 9.4.2 Address workforce shortages through
multidisciplinary teams and telemedicine122 9.4.3 Incorporate the collection and reporting of
quality indicators in ESKD care 9.4.4 Expand health information systems to
prevent and manage ESKD 9.4.5 Promote ESKD prevention and treatment
by implementing policies, strategies, andadvocacy, and mitigating barriers
123 9.5 Opportunities to build capacity124 9.6 Conclusion125 9.7 Future work
127 REFERENCES
131 LIST OF ILLUSTRATIONS Tables
Figures
133 Maps
135 APPENDICES137 APPENDIX 1: Survey response
139 APPENDIX 2: List of countries by ISN regionand World Bank income group
145 APPENDIX 3: Global Kidney Health Atlas(GKHA) questionnaire
163 APPENDIX 4: Survey respondents
Page Page

ISN Global Kidney Health Atlas | 2019 Foreword | 1
End-stage kidney disease (ESKD) is a major public healthproblem due to associated adverse health consequences andcosts of treatment. People with ESKD require frequent andintensive care that is burdensome to their lifestyles andexpensive. In many countries where ESKD care is not publiclyfunded, people with ESKD are unable to receive treatment,resulting in poor health outcomes and often death. It isprojected that in 2030, 14.5 million people will have ESKD andneed treatment, yet only 5.4 million will actually receive it dueto economic, social, and political factors. There are severaloptions for ESKD treatment. Kidney replacement therapy (KRT)can be delivered through hemodialysis (HD), peritoneal dialysis(PD), or transplantation; alternatively patients can be offerednon-dialytic comprehensive conservative care. Understandingthe benefits and limitations of each option requiresconsideration of the individual patient, local context, andcapacity. The high cost of HD is a key barrier for manycountries. According to recent estimates, the cost of HD forone patient is approximately USD 100,000 per year. Using lesscostly alternatives such as PD or comprehensive conservativecare may be a more suitable option in resource-limitedsettings. Moreover, HD may not always be the mostappropriate treatment option for ESKD. Therefore selecting thebest route of care is imperative from a financial, clinical, andpatient-centered perspective.
Efforts to prevent ESKD through appropriate acute kidneyinjury (AKI) and chronic kidney disease (CKD) detectionstrategies are needed to reduce the burden the disease.Health information systems are essential for collectinginformation to guide surveillance programs and furthersupport decision making with respect to policies andresource allocation. Identifying key barriers to the preventionand appropriate management of ESKD is important ifsolutions are to be developed. It is necessary to understandthe global status of kidney care to inform governmentalpolicies and strategies aimed at improving ESKD care.
FOREWORD
David Harris AM, MD (USyd), BS, FRACP
Professor of Medicine,University of Sydney
Director of Nephrology andDialysis, Western SydneyRenal Service
President International Societyof Nephrology (2017-19)

2 | Foreword ISN Global Kidney Health Atlas | 2019
On behalf of the International Society ofNephrology (ISN), I am delighted to present thesecond iteration of the Global Kidney HealthAtlas (GKHA). This version is a topical survey thatfocuses on understanding the global burden ofESKD and capacity for care delivery acrosscountries and regions. The GKHA project is amultinational, cross-sectional survey designed toassess the current capacity for kidney careacross all world regions, as part of the ISN'sClosing the Gaps initiative. The 160 participatingcountries (out of 182 approached), account forover 98% of the world's population.
The survey results provide an overview of thecurrent capacity for ESKD care, focusing ondisease prevention and management. Thefindings will be applied to engage relevantstakeholders across countries and regions toadvocate for improved access to and quality ofkidney care. The data have appreciable policyimplications, as they provide a platform forholding governments accountable by measuringcountry and region progress over time.
We synthesized the various approaches toESKD care across all world regions; identifiedopportunities to strengthen relevant healthsystems; and explored potential mechanisms tocapitalize on these opportunities. We found
several common barriers to optimal ESKD caredelivery across countries and regions: poorfunding for ESKD care (dialysis andtransplantation), particularly in low incomenations; limited workforce capacity; andsignificant variations in the development andorganization of care structures. Most of thesechallenges reflect economic differences, as wellas political and socio-cultural factors.
These common challenges should beaddressed to strengthen health systems andpolicies for optimal kidney care. We suggestpotential strategies to address thesechallenges, and discuss them for low andlower-middle income settings where KRT isunavailable or unaffordable. This work isimportant, as it provides benchmarks formonitoring ESKD care capacity over time;moreover, we provide organizational andcountry-level recommendations on how gapsin care may be addressed.
David Harris

ISN Global Kidney Health Atlas | 2019 Executive summary | 3
This work aims to improve understandings of inter-and intra-national variability around the globe withrespect to the capacity to deliver care for end-stage kidney disease (ESKD). Using the domainsof health services defined by the World HealthOrganization (WHO), this survey summarizes andcompares the availability, accessibility, andaffordability of high-quality care for patients withkidney failure.
A total of 160 countries (out of 182 countriescontacted) representing over 98% of the world’spopulation responded to the survey. The resultsreveal several pertinent findings. Nearly half of allcountries provide public funding for non-dialysisCKD care, and 64% provide public funding fordialysis and transplantation. The provision ofpublic funding for ESKD care is less common inlow income countries. Nephrologists are primarilyresponsible for ESKD care in 92% of countriessurveyed. Worldwide, the median number ofnephrologists is 9.95 per million population (pmp);low income countries have the fewestnephrologists (0.2 pmp), followed by lower-middle(1.6 pmp), upper-middle (10.8), and high (23.2pmp) income countries.
Chronic hemodialysis (HD) services are availablein all countries that completed the survey.Chronic peritoneal dialysis (PD) and kidneytransplantation services are available in 76% and74% of countries, respectively. Availability ofchronic PD and transplantation servicesincreases with country income. Only 23% of lowincome countries offer either chronic PD orkidney transplantation. Overall, in 72% ofcountries with available dialysis services, at least
half of patients with ESKD are able to accessdialysis at the onset of kidney failure. However,access in low income countries is quite low (5%).Overall, 30% of countries reported within-countrydifferences in how ESKD care is deliveredbetween children and adults. This discrepancy ismore pronounced in low income countries (61%).Similarly, 24% of countries reported differences inhow KRT is delivered between children andadults. Variation is highest in low incomecountries (57%), and reduces with increasingcountry income. Among countries with PDavailable, only 4% report PD as the initialtreatment for most ESKD patients.
Only 13 registries for acute kidney injury (AKI) and19 registries for non-dialysis chronic kidneydisease (CKD) exist. Among the countriessurveyed, 66% have dialysis registries and 57%have transplantation registries. Overall, 73countries have current national strategies for non-communicable diseases (NCDs) and 21 countrieshave strategies under development; 69 countrieshave national strategies for improving CKD care.No low income countries have specific CKD carepolicies, whereas 29% of lower-middle, 29% ofupper-middle, and 55% of high income countrieshave policies. Worldwide, AKI, CKD, and ESKDare recognized as health priorities by only 13%,51%, and 58% of governments, respectively.Governmental recognition of CKD and ESKD ashealth priorities is more common in high andupper-middle income countries.
The top barriers to optimal ESKD care areeconomic factors (reported by 64% ofcountries); patient knowledge or attitude (in 63%
EXECUTIVE SUMMARY

4 | Executive summary ISN Global Kidney Health Atlas | 2019
of countries); nephrologist availability (in 60% ofcountries); physician availability, access,knowledge, and/or attitude (in 58% ofcountries); distance from care or prolongedtravel time (in 55% of countries); and availability,access, and capability of the healthcare system(in 55% of countries).
Overall, the results reveal significant disparitiesrelated to key components of high-qualitykidney care. Key recommendations for closingthese gaps are as follows:
® Increase health care financing for ESKDprevention and management;
® Address workforce shortages by developingeffective multidisciplinary teams, task shifting(e.g., allowing primary care practitioners to playa greater role in treatment) and harnessing thepotential of telemedicine;
® Develop and implement context-specificsurveillance systems based on availablecapacity and resources;
® Promote ESKD prevention and treatment byimplementing policies, incorporating CKD intoglobal NCD strategies, supporting advocacygroups, and mitigating barriers to care;
® Promote PD as the initial mode of treatmentand remove barriers to practical, cost-effectivesupplies of PD solutions;
® Support the development of innovative, cost-effective dialysis methodologies;
® Develop appropriate legislative and policyframeworks to support kidney transplantationin all countries; and
® Increase access to conservative care deliverywhere appropriate.
The initial iteration of the GKHA demonstratedvariability in global kidney care, with significantgaps in kidney care across all of the WHO healthdomains, particularly in low and lower-middleincome countries. The key focus of the initialexercise was to broadly collect informationacross the full spectrum of CKD. Due to the largescope, there was lack of granularity in theinformation collated and limited data on otherfacets of optimal kidney care delivery such asquality, affordability, and accessibility. Therefore,the aim of this second iteration of the GKHA is tospecifically define the current global status ofESKD care structures and organization using amore robust and comprehensive approach. This information is helpful for identifyinginconsistencies of care around the globe toguide strategic development and to furtherdocument the current status of ESKD care as ameans to monitor future progress. The nextsteps to enhance kidney care delivery aremultifactorial. Preventing ESKD throughappropriate AKI and CKD detection programs isessential. Furthermore, supporting non-dialysisCKD through enhanced public funding will slowthe progression of kidney disease, therebyreducing the use of expensive and resource-intensive kidney replacement therapies and theburden of ESKD on patients and their families.

ISN Global Kidney Health Atlas | 2019 Acknowledgements | 5
ACKNOWLEDGEMENTS
Support and financial disclosure declaration
This work was funded by the International Societyof Nephrology (ISN).
The GKHA Co-chairs would like to extend our profoundgratitude to all the people that contributed to making thisproject another great success. We relied on our keystakeholders (leaders of the national nephrology societies andISN regional board members) to provide and vet informationfrom individual countries and regions. Several individuals havecontributed in different ways to make this exercise fruitfuldespite the complexity of work and tight timeline. In particular,we would like to thank Meaghan Lunney who operationallyled the project, drafted the report, and contributed to theanalysis plan. We also thank Mohamed Osman for his greatcontribution and leadership with the desk research. We thankKara Stephenson Gehman (Academe Partners Limited;academepartners.com) for her help in clarifying the report,and John Labots (John Labots Graphic Design Inc.;johnlabots.com) for presenting our analyses so appealingly.We thank Sandrine Damster, Senior Research ProjectManager at the International Society of Nephrology (ISN), forher support in organizing and conducting the survey and herproject management expertise. We thank the Alberta KidneyDisease Network (Sue Szigety, Sophanny Tiv) and ISN staff(Luca Segantini, Jo-Ann Donner, Luisa Strani, and Claire VanDer Linden) for their support. The leadership and support ofthe executive committee of the ISN towards the success ofthis initiative is greatly appreciated.

6 | Acknowledgements ISN Global Kidney Health Atlas | 2019
Gloria Ashuntantang (Cameroon) Presidential Appointee
John Feehally (United Kingdom)ISN Programs Chair
David Harris (Australia) President
Vivekanand Jha (India)President-Elect
Adeera Levin (Canada)Past President
Valerie Luyckx (Switzerland)Presidential Appointee
Masaomi Nangaku (Japan)Representative of the Council
Roberto Pecoits-Filho (Brazil)Representative of the Council
Stuart Shankland (USA)Treasurer
Charu Malik (Belgium)ISN Executive Director, ex officio
ISN Executive Committee (2017-2019)
Africa Regional BoardMohammed Benghanem Gharbi (Morocco) Gloria Ashuntantang (Cameroon)
Eastern and Central Europe Regional BoardRümeyza Kazancioglu (Turkey)Vladimir Tesar (Czech Republic)
Latin America and the Caribbean Regional BoardEzequiel Bellorin-Font (Venezuela)Laura Solá (Uruguay)
Middle East Regional Board Mohammed Ghnaimat (Jordan)Shahrzad Ossareh (Iran)
NIS and Russia Regional BoardIrma Tchokhonelidze (Georgia)Alexander Zemchenkov (Russia)
North America and the CaribbeanRegional Board Jeffrey Perl (Canada)Kamyar Kalantar-Zadeh (USA)
North and East Asia Regional BoardMing-Hui Zhao (China)Chih-Wei Yang (Taiwan)
OSEA Regional Board Peter Kerr (Australia)Kriang Tungsanga (Thailand)
South Asia Regional BoardVivekanand Jha (India)Harun Ur Rashid (Bangladesh)
Western Europe Regional BoardEric Rondeau (France)Paul Harden (United Kingdom)
ISN Regional Board Chairs
Project Team

ISN Global Kidney Health Atlas | 2019 Acknowledgements | 7
Dr. Adeera LevinFounder and Lead, Global Kidney Health Atlas, ISN
ISN regional leadership team representatives One board chair or designate from each of the 10regional teams
Dr. Marcello Tonelli Chair, Research Portfolio, ISN
Dr. Vivekanand JhaThe George Institute for Global Health India, Postgraduate Institute for Medical Education andResearch, Chandigarh, India
Dr. Kitty JagerManaging Director, ERA-EDTA Registry,Amsterdam, The Netherlands
Dr. Fergus CaskeyMedical Director, UK Renal Registry
Dr. Vlado PerkovicChair, Advancing Clinical Trials (ISN-ACT), ISN
Dr. John FeehallyChair, Programs, ISN
Prof. David Johnson, PSM – Co-ChairDepartment of Nephrology, University ofQueensland, Brisbane, Australia
Dr. Aminu Bello, PhD – Co-Chair Department of Medicine, University of Alberta,Edmonton, Canada
Meaghan Lunney, MSc – Project ManagerDepartment of Community Health Sciences,University of Calgary, Calgary, Canada
Phoebe Ye, MSci – Data AnalystKidney Health Research Group, Department ofMedicine, University of Alberta, Edmonton, Canada
Dr. Adeera Levin, FRCPC Division of Nephrology, University of BritishColumbia, Vancouver, Canada
Dr. Marcello Tonelli, SM, FRCPCDepartment of Medicine, University of Calgary,Calgary, Canada
Dr. Ikechi G. Okpechi, PhDDivision of Nephrology and Hypertension,University of Cape Town, South Africa
Prof. John Feehally, FRCPJohn Walls Renal Unit, Leicester General Hospital,University of Leicester, United Kingdom
Prof. David Harris, FRACPCentre for Transplantation and Renal Research,University of Sydney at Westmead Hospital,Sydney, Australia
Dr. Kailash Jindal, FRCPCDepartment of Medicine, University of Alberta,Edmonton, Canada
Dr. Mohamed A. Osman, MDDepartment of Medicine, University of Alberta,Edmonton, Canada
Syed Saad, BSciDepartment of Medicine, University of Alberta,Edmonton, Canada
Dr. Vivekanand Jha, PhDGeorge Institute for Global Health, New Delhi,Postgraduate Institute for Medical Education andResearch, Chandigarh, India
Dr. Boris Bikvov, PhDMoscow State University of Medicine andDentistry, Moscow, Russia
Natasha Wiebe, MMathAlberta Kidney Disease Network, University ofAlberta, Edmonton, Canada
Dr. Angela Yee-Moon Wang, PhDDepartment of Medicine, University of Hong Kong,Hong Kong
Dr. Csaba Kovesdy, PhDUniversity of Tennessee Health Science Center, Memphis, United States
GKHA Steering Committee
GKHA Working Group

8 | Acknowledgements ISN Global Kidney Health Atlas | 2019
Professor David Johnson PSM, MB, BS (Hons, Univ Medal), FRACP,DMed (Res), FASN, PhD (Syd)
Director, Metro South and Ipswich Nephrologyand Transplant Services (MINTS)Medical Director, Queensland Renal TransplantServices
ARTS BuildingPrincess Alexandra Hospital199 Ipswich RoadWoolloongabba Qld 4102 Australia
Dr. David Johnson is full-time Director of the MetroSouth and Ipswich Nephrology and TransplantService (MINTS) and Medical Director of theQueensland Renal Transplant Service at PrincessAlexandra Hospital, Brisbane, Australia; Professorof Medicine and Professor of Population Health atUniversity of Queensland; and Director of theCentre for Kidney Disease Research, Brisbane,Australia. He has a number of internationalleadership responsibilities, including President ofthe International Society for Peritoneal Dialysis,Councillor of the International Society ofNephrology (ISN), Co-Chair of the ISN GlobalKidney Health Atlas, Co-Chair of the GlobalPDOPPS Steering Committee and Chair of SONG-PD. He is currently a chair or member of 10national and 6 international guideline groups andhas influenced policy and practice through his
leadership as Deputy Chair of the AustralianNHMRC Better Evidence and Translation inChronic Kidney Disease (BEAT-CKD) program,Deputy Chair of the Australasian Kidney TrialsNetwork (AKTN), Chair of the Primary HealthcareEducation Advisory Committee to Kidney HealthAustralia (PEAK), Co-Chair of the AustralasianCreatinine and eGFR Consensus Working Party,Co-Chair of the Australasian ProteinuriaConsensus Working Party, Member and Past-Chair of the ANZDATA Registry Peritoneal DialysisWorking Group, and Past-Chair of the QueenslandStatewide Renal Clinical Network.
Having published over 800 original manuscripts inpeer-reviewed journals and presented over 470abstracts at national and international scientificmeetings, he brings critical expertise in designingand conducting multi-center, multi-nationalrandomized controlled trials (RCTs), developingnational and international registries, and usinginnovative research methodologies (such as registry-based RCTs). He has held lead roles in over 40recent clinical studies, including high-impact, large,multi-center RCTs that have informed global clinicalpractice (e.g., IDEAL, balANZ, HONEYPOT,TESTING, HERO, IMPENDIA), and is currentlyprincipal investigator of the CKD-FIX trial.
He has won numerous awards for both his basicscience and clinical research studies, including theAustralian and New Zealand Society of NephrologyTJ Neale Award for “outstanding contributions tonephrologic science” (2005), the U.S. NationalKidney Foundation International DistinguishedMedal (2014) and the Canadian Society ofNephrology Dimitrios Oreopoulos Award (2017).He was a Queensland finalist for the Australian ofthe Year Award in 2009 and was awarded a PublicService Medal by the Governor-General ofAustralia in 2011 for outstanding public service,particularly for research into the early detection andmanagement of kidney disease.
GKHA Co-Chairs

ISN Global Kidney Health Atlas | 2019 Acknowledgements | 9
Dr. Aminu K BelloMD, PhD, FRCP, FACP, FASN
Associate Professor/Consultant Nephrologist, Division of Nephrology & Immunology, Faculty of Medicine, University of Alberta
11-107 Clinical Sciences BuildingFaculty of Medicine & DentistryUniversity of AlbertaEdmonton, AB T6G 2G3 Canada
Dr. Aminu Bello qualified as MD in Nigeria andunderwent specialist clinical training in internalmedicine and nephrology in Nigeria, the UnitedKingdom, and Canada. He obtained the Membershipof the Royal College of Physicians (MRCP), andcompleted his Masters and PhD degrees inNephrology/Epidemiology at the University of Sheffieldin the United Kingdom (under the supervision of ProfMeguid El-Nahas). After completing his PhD, he wenton to complete a post-doctoral clinical and researchfellowship in nephrology at the University of Alberta,Canada (under the supervision of Dr. Marcello Tonelli).
Dr. Bello is a physician-scientist with major researchinterests in improving outcomes of patients withCKD. He is a member of the Alberta KidneyDisease Network (AKDN): a team of scientists,policymakers, clinical leaders, educators, andknowledge translation experts who study healthservices solutions to reduce the burden of CKD andother chronic diseases.
His work is funded by provincial and nationalresearch organizations including the CanadianInstitutes of Health Research (CIHR). He reviewsregularly for the major general medical andnephrology journals, including The Lancet, JAMA,BMJ, and Kidney International. He has over 100peer-reviewed scientific publications.
A major substantive contribution he has madeinvolved translating clinical research into practiceand facilitating understanding of clinical practiceguidelines. Dr. Bello was a co-author of the 2015Canadian Society of Nephrology commentary onthe KDIGO [Kidney Disease: Improving GlobalOutcomes] clinical practice guideline for CKDevaluation and management that contextualizes theglobal CKD management guideline for theCanadian health system. One issue that aroseduring the development of the commentary wasthe lack of an effective mechanism to monitoruptake of guidelines in primary care, where > 90%of patients with CKD are managed. Dr. Bellosubsequently partnered with the Canadian PrimaryCare Sentinel Surveillance Network (CPCSSN) toestablish a CKD surveillance system in Canadianprimary care in collaboration with existing platforms(CDC CKD Surveillance in the United States andNational CKD Audit teams in the United Kingdom)and national networks such as the CanadianSociety of Nephrology, CANN-NET (CanadianKidney Knowledge Translation and GenerationNetwork), and Can-SOLVE CKD (CanadiansSeeking Solutions and Innovations to OvercomeChronic Kidney Disease).
He is keenly interested in global health initiatives toimprove nephrology practice and education inemerging nations. He is currently a Co-Chair for theInternational Society of Nephrology (ISN) GlobalKidney Health Atlas Project; an initiative for capturingthe kidney health care status across all regions andcountries of the world to facilitate the developmentand implementation of strategies to enhance globalequity in kidney care.

10 | Acknowledgements ISN Global Kidney Health Atlas | 2019
Charu MalikISN Executive Director, ex officio
Sandrine DamsterISN Senior Research Project Manager
Jo-Ann DonnerISN Awards and Endorsements Coordinator
Kelly HendricksISN Project Manager
Luisa StraniISN Advocacy Director
Dominique TudorISN Governance and Executive Affairs Manager
Claire Van Der LindenISN Marketing Manager
Aminu SakajikiDepartment of Medicine, Usmanu DanfodiyoUniversity, Sokoto, Nigeria
Andrea ViecelliDepartment of Nephrology, University ofQueensland at Princess Alexandra Hospital,Brisbane, Australia
Brendon NeuenThe George Institute for Global Health,Sydney, Australia
Emily See School of Medicine, University of Melbourne,Melbourne, Australia
Htay HtayDepartment of Renal Medicine, Singapore GeneralHospital, Singapore
Meaghan LunneyDepartment of Community Health Sciences,University of Calgary, Calgary, Alberta
Mohamed OsmanDepartment of Medicine, University of Alberta,Edmonton, Alberta
Rowena LaljiDepartment of Nephrology, University ofQueensland at Princess Alexandra Hospital,Brisbane, Australia
Salihu KwaifaGarki Hospital, Zone 3, Abuja, Nigeria
Syed SaadDepartment of Medicine, University of Alberta,Edmonton, Alberta
Udeme Ekrikpo Department of Medicine, College of Medicine,University of Uyo, Nigeria
Yeoungjee Cho Department of Nephrology, University ofQueensland at Princess Alexandra Hospital,Brisbane, Australia
ISN GKHA Fellows
ISN Headquarters Team

ISN Global Kidney Health Atlas | 2019 Abbreviations | 11
ACE Angiotensin-converting enzyme
AKI Acute kidney injury
ARB Angiotensin II receptor blocker
CKD Chronic kidney disease
CVC Central venous catheter
ESKD End-stage kidney disease
GFR Glomerular filtration rate
GKHA Global Kidney Health Atlas
HD Hemodialysis
ISN International Society of Nephrology
KDIGO Kidney Disease: Improving Global
Outcomes
KRT Kidney replacement therapy
NCD Non-communicable disease
NGO Non-governmental organization
NIS Newly Independent States [of the
former Soviet Union]
OECD Organisation for Economic
Co-operation and Development
OSEA Oceania and South East Asia
PCP Primary care physician
PD Peritoneal dialysis
PMP Per million population
PPP Purchasing power parity
PROMS Patient-reported outcome measures
UHC Universal health coverage
UN United Nations
USD United States Dollar
WHO World Health Organization
ABBREVIATIONS
Note: This list is not comprehensive, but covers frequently used abbreviations.

12 | Key terms ISN Global Kidney Health Atlas | 2019
Appropriate referral and management:Availability of an organized system and/orstructures to ensure that people with CKD whomay benefit from specialist care are properlyreferred for specialist assessment.
Capacity: The ability to perform appropriate taskseffectively, efficiently, and sustainably.
Conservative (non-dialytic) kidney care:Comprehensive conservative care is defined asplanned, holistic, patient-centered care for patientswith CKD stage 5, according to Kidney Disease:Improving Global Outcomes (KDIGO).
Identification and early detection: Availability ofan organized system and/or structures foridentification of people with risk factors for CKD:hypertension, diabetes, cardiovascular diseases(e.g., ischemic heart disease, heart failure,peripheral vascular disease, and stroke), urologicalproblems (e.g., structural urinary tract disease,kidney stones, prostatic disorders), multisystemdiseases (e.g., systemic lupus erythematosus,rheumatoid arthritis, infective endocarditis, etc.), ora family history of kidney disease.
Identification: Measures performed among at-risk populations to identify individuals with riskfactors or early stages of disease who do not yethave symptoms.
International dollar: Based on a standardexchange rate (purchasing power parity [ppp]), aninternational dollar would buy in a given country acomparable amount of goods and services that aU.S. dollar would buy in the United States.
KRT availability: Availability of an organizedsystem and/or structures to deliver dialysis and/orkidney transplantation when and where needed.
Monitoring of complications, risk factor control,and disease progression: Availability of anorganized system and/or structures to ensure thatpeople with established CKD are receivingguideline-concordant clinical care.
Non-communicable diseases: Diseases thatcannot be transmitted from person to person,notably, cardiovascular diseases (e.g., heart attack,stroke), cancer, chronic respiratory disease (e.g.,chronic obstructive pulmonary disease, asthma),and diabetes.
Policy: An official decision or set of decisionsdesigned to carry out a course of action endorsedby a government body, including a set of goals,priorities, and general directions for attaining thesegoals. A policy document may include a strategy toimplement the policy.
Program: A planned set of activities or proceduresdirected at a specific purpose.
Registry: A systematic collection of data toevaluate specified outcomes for a definedpopulation to serve one or more predeterminedscientific, clinical, or policy purposes.
Strategy: A long-term plan designed to achieve aparticular goal for AKI or CKD care.
Under development: Still being created orfinalized; not yet in the implementation phase.
KEY TERMS

ISN Global Kidney Health Atlas | 2019 Abstract | 13
End-stage kidney disease (ESKD) represents anadvanced stage of CKD with an irreversible loss ofkidney function, leading to a need for kidneyreplacement therapy (KRT). The global burden ofESKD is significant due to high treatment costs andextensive impacts on patient health and well-being.While a variety of treatment options exist, little isknown about how access to treatment andcharacteristics of treatment delivery (e.g., qualityindicators, funding mechanisms) vary around theglobe. Additionally, the current scope of kidney-specific health information systems (i.e., registries,electronic health records) is unknown. Lastly, in lightof multiple competing health priorities worldwide, itis important to understand variations in governmentprioritization and strategic planning processes tobridge policies and opportunities whereappropriate. This Global Kidney Health Atlas(GKHA) is the outcome of an ISN initiative aimed atclosing these knowledge gaps and coordinating
efforts to facilitate the delivery of optimal ESKDcare worldwide.
Objectives:
1. To provide a high-level overview of the burdenof ESKD as well as the current state of ESKDcare and how it is organized and structuredaround the world.
2. To conduct a comparative analysis of thecapacity to deliver care across countries andregions in order to identify key strengths andweaknesses of various systems and exploreopportunities for regional networking andcollaboration to improve ESKD care.
3. To provide an advocacy tool to engage majorstakeholders (e.g.,WHO, World Bank, UN,OECD, European Union, individual countrygovernments) to support the expansion ofavailable services for ESKD care.
ABSTRACT
Background
Desk Research
In collaboration with an expert librarian, weconducted a two-part comprehensive search ofgovernment reports, academic research, andgray literature to synthesize the most currentepidemiological data on the burden andtreatment of ESKD. This literature search setthe context for a groundbreaking detailedsurvey of key stakeholders.
GKHA Survey
To facilitate an understanding of how capacity forkidney care varies over time and betweencountries, the GKHA provides concise, relevant,and synthesized information on the delivery of careacross different health systems. Together, thesecomponents of the GKHA provide a globalperspective of the prevalence and incidence oftreated ESKD, such as hemodialysis (HD),
Methods

14 | Abstract ISN Global Kidney Health Atlas | 2019
ObjectiveMethods/approach
Coverage/elements
Primary data sources
Secondary data sources
To obtain a snapshotof individual countryand regional health systemcharacteristics, and specificelements relevant to ESKD care
n Survey n WHO UHCDomains1
n Survey data
n Interviews
n WHO GlobalObservatory
n UN, World Bankand OECD reportson NCDs
n Publisheddata/reports
To obtain data on relevant ESKD treatmentepidemiology (HD,PD, transplantation)across countries and regions
n Scoping review n Estimates for ESKDincidence andprevalence
n Estimates for KRTcost
n Survey data
n Interviews
n Systematic reviewsand consortiapublications
n World HealthReport
n World HealthIndicators
n Global NCDRepository
n IDF Diabetes Atlas
n WHF WorldCardiovascularDisease Atlas
n Kidney registries
Table A | Methods and data sources
1 Health finance and service delivery, health workforce, medicines and medical products, information systems, and governance and leadership.
ESKD = end-stage kidney disease, GBD = global burden of disease, HD = hemodialysis, IDF = International Diabetes Federation, KRT = kidney replacement therapy,NCDs = non-communicable diseases, OECD = Organisation for Economic Co-operation and Development, PD = peritoneal dialysis, UHC = universal health coverage,UN = United Nations, WHF = World Heart Federation, WHO = World Health Organization
peritoneal dialysis (PD), and transplantation. In
addition, the GKHA summarizes the costs
associated with delivering KRT and compares cost
ratios of different treatment modalities across
countries and regions. Moreover, it provides an
overview of existing healthcare system structures
for ESKD care, including: funding models for CKD
and ESKD care; workforce capacity; availability
and quality of KRT; health information systems;and leadership, advocacy, and barriers to optimalESKD care. Finally, a synthesis, comparison, andanalysis of country and regional data are providedto inform the efforts of policymakers, practitioners,and researchers to enhance access to and qualityof care for patients with ESKD.
The overall approach is summarized in Table A.

ISN Global Kidney Health Atlas | 2019 Abstract | 15
A total of 160 countries (out of 182 countriescontacted) responded to the survey. The countriesthat responded to the survey account for 98% ofthe world’s population. Service delivery practices,funding mechanisms, and available technologiesvary widely across countries and regions. Keyfindings for each domain are as follows.
Health finance and service delivery
Nearly half of all countries (48%) provide publicfunding for non-dialysis CKD care, with 28%charging patients no fees and 20% charging somefees at the point of delivery. Public funding for non-dialysis CKD care is more prevalent in high incomecountries. Low income countries report the highestuse of private funding for CKD care.
In total, 64% of countries provide public fundingfor KRT (dialysis and transplantation), with 43%charging no fees at the point of delivery and 21%charging some fees. Public funding for KRT ismore prevalent in high income countries. Lowincome countries report the highest use of privatefunding for KRT. Over half of all countries providepublic funding (either completely free or withsome fees at the point of care delivery) forsurgery to create vascular access for HD: 58%cover central venous catheter insertion, and 54%cover fistula or graft creation. Kidneytransplantation surgery is publicly funded (eithercompletely free or with some fees at the point ofcare delivery) in 53% of countries.
Health workforce for kidney care
Nephrologists are primarily responsible for ESKDin 92% of countries. Worldwide, the mediannumber of nephrologists is 9.95 per millionpopulation (pmp). The density of nephrologistsincreases with income, with low income countriesreporting the lowest prevalence (0.2 pmp),followed by lower-middle (1.6 pmp), upper-middle(10.8), and high (23.2 pmp) income countries.Similarly, the prevalence of nephrology traineesincreases with income, with low income countries
reporting the lowest prevalence (0.1 pmp),followed by lower-middle (0.6 pmp), upper-middle(1.2 pmp), and high (3.7 pmp) income countries.
Over 70% of countries reported a shortage ofnephrologists. Low income countries reportedthe greatest shortages: over 90% reportedworkforce shortages of nephrologists,interventional radiologists, surgeons, andtransplant coordinators.
Essential medicines and technologies
Chronic HD services are available in all countriesthat completed the survey. Chronic PD and kidneytransplantation services are available in 76% and74% of countries, respectively. Availability ofchronic PD and transplantation services increaseswith income. Only 23% of low income countriesoffer either chronic PD or kidney transplantation.
Most countries, irrespective of income, reportedthe capacity to manage anemia and bloodpressure. Similarly, in most countries, tests,facilities and treatments to manage electrolytedisorders and chronic metabolic acidosis are highlyavailable, except for oral sodium bicarbonate orpotassium exchange resins, which are available injust 72% and 62% of countries, respectively. Theability to manage renal bone disease varies. Mostcountries have the capacity to measure serumcalcium and phosphorous and to administercalcium-phosphate binders. However, fewercountries have the capacity to administer non-calcium-based phosphate binders or cinacalcet.Serum parathyroid hormone measurement servicesare available in 65% of countries, and surgicalservices for parathyroidectomy are generallyavailable in only 56% of countries.
Overall, in 72% of countries with available dialysisservices, at least half of patients with ESKD areable to access dialysis at the onset of kidneyfailure. However, access in low income countriesis quite low (5%). Among countries with PDavailable, only 4% report PD as the initialtreatment for most ESKD patients.
Results

16 | Abstract ISN Global Kidney Health Atlas | 2019
Although 74% of countries offer kidneytransplantation, accessibility to these services islow, particularly in lower-middle and low incomecountries. Among countries with kidneytransplantation available, 64% of high incomecountries reported high access to care for mostpatients, compared to 30% of upper-middle, 13%of lower-middle, and 0% of low income countries.
Quality indicators for HD and PD are similarlymeasured and reported. Blood pressure ismeasured and reported most of the time (HD:86%; PD: 85%), as is hemoglobin (HD: 88%; PD:84%). Patient survival and bone mineral markersfor both HD and PD patients are measured andreported in approximately 70% of countries.Technique survival is routinely measured andreported for HD patients in 51% of countries andfor PD patients in 61% of countries. Small soluteclearance and patient-reported outcome measures(PROMS) are only measured and reported inapproximately 60% and 30% of countries,respectively. More countries measure and reportquality indicators for kidney transplant recipients.
Conservative care is delivered in 81% of countriessurveyed. The availability of conservative caredoes not appear to be associated with incomelevel. However, access to chosen or medically-advised conservative care increases with countryincome level: 87% of high income countries offerchosen conservative care, compared to 64% ofupper-middle, 43% of lower-middle and 33% oflow income countries. The provision of non-medical components of conservative care such aspsychological, cultural, and spiritual support forpatients receiving conservative care also increaseswith country income, but remains low, beingprovided in just 52% of high, 30% of upper-middle, 31% of lower-middle, and 19% of lowincome countries.
Health information systems
Only 13 AKI registries and 19 non-dialysis CKDregistries exist. Among the countries surveyed,66% have dialysis registries (59% of whichrequire provider participation) and 57% have
transplantation registries (65% of which requireprovider participation).
Irrespective of income level, most countries screenpeople with hypertension, diabetes, or urologicalconditions for CKD. Chronic users of nephrotoxicmedications, people with a family history of CKD,and high-risk ethnic groups are screened for CKDin few countries, regardless of country incomelevel. Screening of patients with cardiovasculardiseases, autoimmune or multisystem disorders,or those over 65 years of age is less common,and increases with country income level.
Leadership and governance
Overall, 73 (46%) countries have current nationalstrategies for NCDs, and 21 (13%) countries havestrategies under development. National strategiesfor improving CKD care exist in 69 (43%) countries.Among these, 32 (20%) are standalone strategiesfor CKD care and 37 (23%) are incorporated ingeneral NCD management strategies. Overall, 53(33%) countries have CKD-specific policies. No lowincome countries have policies, whereas 29% oflower-middle, 29% of upper-middle, and 55% ofhigh income countries have policies.
Worldwide, AKI, CKD, and ESKD are recognizedby governments as health priorities in only 13%,51%, and 58% of countries, respectively.Governments of high and upper-middle incomecountries tend to recognize CKD and ESKD ashealth priorities more often. Similarly, there are fewadvocacy groups for AKI, CKD, and ESKD; theyexist in only 14%, 63%, and 39% of countriesworldwide. Both CKD and ESKD advocacygroups are more common in high, upper-middle,and lower-middle income countries than in lowincome countries.
The top barriers to optimal ESKD care are:economic factors (64% of countries), patientknowledge or attitude (63%); nephrologistavailability (60%); physician availability, access,knowledge, and/or attitude (58%); distance fromcare or prolonged travel time (55%); andavailability, access, and capability of thehealthcare system (55%).

ISN Global Kidney Health Atlas | 2019 Abstract | 17
This second iteration of the GKHA focusesspecifically on ESKD care. The survey resultsdemonstrate significant inter- and intra-regionalvariability in current capacity to deliver ESKDcare. Important gaps exist in the availability andaffordability of services, workforce capacity,characteristics of ESKD care delivery, adoptionof health information systems, and strategiesand policies for CKD and ESKD care.
The findings have implications for the developmentof policies to promote optimal ESKD care delivery.Specifically, efforts should be directed towardpreventing ESKD by providing affordable andappropriate AKI and CKD care. Detectionprograms targeted at high-risk individuals areneeded, particularly for AKI. Increasing universalhealth coverage for medications in early-stage
CKD is important to slow disease progression andprevent the need for costly ESKD therapies.Promoting PD and conservative care as treatmentoptions in situations where HD may not beappropriate or too expensive may enable optimaland feasible ESKD care.
Overall, ESKD treatment strategies are complex,as they involve multiple key health systemfactors; characteristics of local contexts, such ascompeting priorities and resource limitations,must be considered. The aim of the GKHAinitiative is to summarize the current global stateof ESKD care. By sharing these findings, wehope to guide policy and advocacy efforts topromote optimal and universal ESKD care, and toprovide benchmarks that will help countries tracktheir progress over time.
Conclusion

18 | ISN Global Kidney Health Atlas | 2019

ISN Global Kidney Health Atlas | 2019 Introduction | 19
Chronic kidney disease (CKD) is an immensepublic health problem; the already high burden ofdisease is increasing relentlessly worldwide, andthe cost of providing adequate care for all CKDpatients is overwhelming in many countries.1-6
Previously known as chronic renal failure, CKD isa condition characterized by a gradual loss ofkidney function. Because the kidneys play acritical role in filtering waste and excess fluid fromthe body, impaired kidney function can havedetrimental effects to health. This can also lead
to the development of other conditions, such asheart failure or cardiovascular problems.Approximately 10% of the world’s population isliving with CKD; however, CKD incidence andprevalence differ significantly across countriesand world regions.7,8 Although people of everyage and race are affected by CKD, people fromdisadvantaged populations may be at higher riskfor the condition (and associated morbidity andmortality) due to socio-economic factors andlimited access to care.7-11
SECTION 1
INTRODUCTION
1.1 CKD
Figure 1.1 | Classification of CKD
A1 A2 A3
Normal to mildlyincreased
Moderatelyincreased
Severely increased
<30 mg/g<3 mg/mmol
30–300 mg/g3–30 mg/mmol
>300 mg/g>30 mg/mmol
G1 Normal or high>_90 ml/minper 1.73 m2
G2 Mildly decreased 60–89 ml/minper 1.73 m2
G3a Mildly to moderatelydecreased
45–59 ml/minper 1.73 m2
G3b Moderately to severelydecreased
30–44 ml/minper 1.73 m2
G4 Severely decreased 15–29 ml/minper 1.73 m2
G5 Kidney failure <15 ml/minper 1.73 m2
Persistent albuminuria categoriesDescription and range
GFR categories Description and range
n Low risk (if no other markers of kidney disease, no CKD) n Moderately increased risk n High riskn Very high risk
Levin A, Stevens PE, Bilous RW, et al. Kidney Disease: Improving Global Outcomes (KDIGO) CKD Work Group. KDIGO 2012 clinical practice guideline for the evaluationand management of chronic kidney disease. Kidney Int Supp. 2013;3(1):1-150. Reproduced with permission.

20 | Introduction ISN Global Kidney Health Atlas | 2019
CKD can progress to ESKD in a number of ways.High blood pressure, or hypertension, is one ofthe leading causes of worsening kidney function.Hypertension can be managed in a variety ofways, including through medications, diet, andphysical activity. Signs of worsening kidneyfunction are increased protein in the urine(proteinuria) or increased creatinine in the blood. Itis important to monitor these markers over timeand to use therapies to delay progression in orderto manage CKD and prevent further kidneydamage. Medications such as angiotensin-converting enzyme (ACE) inhibitors andangiotensin receptor blockers (ARBs) may helpprotect kidney function by reducing proteinuriaand blood pressure.13 Dietary changes such asreduced sodium intake may also reduce bloodpressure and proteinuria,14 thereby slowing orpreventing disease progression to ESKD. Dietslower in protein may also lighten the workload onthe kidneys, thereby reducing proteinuria andslowing the development of ESKD.15
Despite these well-established preventivestrategies, many people are living with ESKD.Approximately 0.1% of the world’s population hasESKD, and estimates suggest a higherprevalence in upper-middle (0.1%) and high(0.2%) income countries, compared to low
(0.05%) or lower-middle (0.07%) incomecountries.7 However, the proportion of peoplewith ESKD who are not receiving treatment in theform of dialysis or transplantation is much higherin low (96%) and lower-middle (90%) incomecountries than in upper-middle (70%) and high(40%) income countries (Figures 1.2, 1.3).7 Thislimited access to KRT in low and lower-middleincome countries warrants attention, asassociated ESKD morbidity and mortality ratesare high in these nations.
Although data on the incidence of ESKD aresparse, estimates suggest a number ofcontributory factors. These include a greaterburden of ESKD risk factors (age, diabetes,hypertension, and obesity), a larger percentageof gross domestic product spent on health care,improving survival rates among those living withCKD, and increased access to KRT.16 Theincidence of diabetes-related ESKD is risingfaster than the overall incidence of ESKD,16
suggesting the importance of appropriatediabetes management practices to reduce theburden of ESKD.
ESKD morbidity and mortality depend greatly onthe quality of treatment received. Limited accessto dialysis is common in low and lower-middleincome countries, resulting in a high number ofpreventable deaths. Kidney transplantationresults in lower mortality and risk ofcardiovascular events and improved quality of lifecompared with dialysis.17 Regardless, access totransplantation is limited in many countries dueto a number of health system (e.g., personnel,infrastructure, system coordination, and
1.2 The burden of ESKD
In 2012, a nonprofit organization, KidneyDisease: Improving Global Outcomes (KDIGO),12
updated the clinical definition of CKD topersistent (> 3 months) abnormal kidneyfunction, as measured by a glomerular filtrationrate (GFR) consistently below 60 ml/min/1.73m2.
CKD is divided into six stages of worseningprogression based on GFR (see Figure 1.1).5
End-stage kidney disease (ESKD), or kidneyfailure, occurs when the estimated GFR is lessthan 15 ml/min/1.73m2, at which point kidneyreplacement therapy (KRT) typically is required.
Over 90% of people with ESKD inlow and lower-middle incomecountries are not receiving KRT.

ISN Global Kidney Health Atlas | 2019 Introduction | 21
financing) and cultural (e.g., public andprofessional attitudes, legal environment)factors.18 Worldwide, patients are increasinglyopting for conservative care as an alternative toKRT;16 however, optimal delivery may not bepossible in countries where palliative or end-of-
life care is limited by resources.19 Ensuringappropriate treatment for ESKD, whetherdialysis, transplantation, or conservative care, isan important public health focus for majorstakeholders around the world (i.e., the ISN,governments, patients, and care providers).
1.3.1 KRT
KRT involves either dialysis or kidneytransplantation. There are two modalities of dialysis:peritoneal dialysis (PD) and hemodialysis (HD). InPD, a catheter is placed into the patient’s abdomenand fluid is added to collect and remove waste fromthe body. PD is administered either continuously orintermittently. For patients with very low kidneyfunction, continuous PD is recommended.20
Typically, patients perform PD in their own homes.
In HD, blood is removed from the body and
cleaned by a machine which uses a filter to remove
waste and excess fluid. The duration and
frequency of HD are important factors that
influence treatment quality. A longer treatment time
may be advantageous, particularly among those
with significant volume overload.21 While standard
care practices involve dialysis three times per
week, the potential benefits of more frequent
treatments are currently being studied.21 During
1.3 Treatment for ESKD
Low income countries
Lower-middle income countries
Upper-middle income countries
High income countries
Figure 1.2 | The state of KRT need, access,and projections into the future
n Number of people needing KRT n Number of people receiving KRT
Figure 1.3 | Income-related variability inaccess to KRT
n Access to KRT n No access to KRT
Estimated number of people needing and receiving KRT worldwide and by World Bank income groups in 2010 and 2030.7
* Calculated based on Liyanage et al.’s7 projections of future KRT received.
Need defined as all patients with ESKD who require KRT (maintenance dialysis or kidney transplant) for survival.Access defined as ESKD patients receiving KRT.Regional variability depicted by World Bank income groups based on 2017 country classification. Available at:https://datahelpdesk.worldbank.org/knowledgebase/articles/906519-world-bank-country-and-lending-groups.
9.7 million
14.5 million*
5.4 million
2.6 million
2010 2030
4% 10%
60%30%

22 | Introduction ISN Global Kidney Health Atlas | 2019
HD, blood is collected by the machine through oneof three types of vascular access: fistula, graft, orcatheter. HD can be performed at a hospital, adialysis center, or a patient’s home.
Deciding which modality is appropriate for eachpatient is a complex process. Often, availableresources, expertise, and the patient’s condition(i.e., stability, other health problems), guide themodality choice.22 The decision also may dependon other factors, such as a patient’s educationlevel or desire for independence, wait time fortransplantation, and distance to a dialysis center,among others.23 The age of the patient at the timeof treatment initiation may also be an importantconsideration.24 The long-term effect of modalitychoice is unclear. Although some researcherscompare the outcomes of PD and HD in registrystudies,23,25 they cannot consider differences inpatients’ health at the time of treatment initiation,which likely affects treatment outcomes.Additionally, because HD is more resource-intensive, PD may be more feasible than HD inlower income countries.26
Kidney transplantation is the other (perhapspreferable) KRT method whereby a recipientreceives a kidney from either a live or a deceaseddonor. Prospective recipients are examined, and ifeligible for surgery, are placed on a waiting listuntil an appropriate match is available. Followingthe transplantation surgery, patients aremonitored and given anti-rejection medications orimmunosuppressive agents to prevent theirbodies from attacking their new kidneys. Thereare a number of barriers to kidney transplantation,especially a patient’s socio-economic status.27
Kidney transplantation also is highly resource-intensive, and many low and lower-middle incomecountries lack the human and financial resourcesto perform the surgery. Additionally, cultural, legal,and political barriers may impede organ donation,thereby limiting the benefit of this treatmentoption in some countries.28
The costs of KRT are exceedingly high andconsume a significant proportion of health carebudgets in developed countries. Many developed
countries spend 2–3% of their health care budgetson treatment for patients with ESKD, even thoughthese patients comprise just 0.1–0.2% of the totalpopulation. KRT remains unattainable in mostdeveloping countries due to associated costs.3,5,10
It is estimated that more than 80% of all patientsreceiving treatment for ESKD reside in developedcountries, which have relatively larger elderlypopulations and universal access to care for kidneydisease. Developing countries have similar CKDincidence rates, but much lower prevalence oftreated kidney failure than the developed world.7,8
Many estimates place the reported prevalence oftreated ESKD in sub-Saharan Africa at less thanone-tenth that of the United States. Althoughcomprehensive data are not readily available fromless developed countries, it appears thatproportionately fewer patients in these regionsreceive treatment for ESKD.7,8
1.3.2 Conservative care
Conservative care refers to the management ofhealth conditions using non-invasive practices,whereby the intent is to maintain health as muchas possible and mitigate adverse events. Theconcept of conservative care in ESKD is relativelynew.29 In this context, conservative care is themanagement of ESKD without the use of KRT. In2013, the definition of conservative care for ESKDmanagement was established as “planned holisticpatient-centered care for patients with G5CKD,”29 which can include a number ofcomponents such as interventions to delayworsening renal function or minimize adverseevents; shared decision-making; active symptommanagement; communication plans;
Many developed countries spend 2–3% of their health care budgets on treatment for patients with ESKD, even though these patientscomprise just 0.1–0.2% of the total population.

ISN Global Kidney Health Atlas | 2019 Introduction | 23
psychological, social, and family support; andcultural or spiritual care.29 Patients who receiveconservative care are likely to experiencesymptoms, and therefore should supplementtreatment with appropriate palliative care.30,31
Deciding whether to manage ESKD throughtraditional methods (dialysis or kidneytransplantation) or conservative care requirescareful consideration of each patient’s healthstatus and wishes. The initiation of dialysis in theelderly may actually result in increased frailty, lossof independence, and decreased cognitivefunctioning.32 The burden of dialysis is substantial,and many patients prefer conservative care dueto the impact of dialysis on quality of life.33
Furthermore, dialysis, when compared toconservative care, does not appear to prolong lifeor improve physical and mental health outcomesamong patients over 80 years of age or thosewith multiple other health problems.34 Thebenefits of conservative care on patient quality oflife, combined with a lack of evidence that dialysisleads to better outcomes in some settings andlower costs of conservative care35 suggest thatconservative care may be a more appropriateoption for some patients with ESKD.
Conservative care may be optimal in resource-limited countries where dialysis is not available.While not a deliberate action intended to limit
access to KRT, KDIGO refers to this as “choice-restricted conservative care.”29 Efforts to increaseinternational awareness and standardization ofconservative care, particularly in this setting, isimportant to optimize care for people with ESKD,and importantly, improve their quality of life.
1.3.3 Essential medications inESKD care
The kidneys perform a number of important life functions. For example, they produce vitamin D, control blood pressure, and promotered blood cell production. As a result, people withESKD take many medications, typically 10–12 a day,36 to replace these functions. These often include phosphate binders, vitamin Dpreparations, calcimimetics, antihypertensives,antidiabetics, erythropoiesis-stimulating agents,and iron supplements.36
Not surprisingly, the high cost of medication is amajor barrier to patients with ESKD. Among HDpatients, those with lower incomes tend to exhibitlower adherence to medication regimens,37
presumably due to the associated expense.Studies have shown that lower co-payments (i.e.,lower out-of-pocket expenses for patients) areassociated with better medication adherenceamong patients with chronic conditions such asdiabetes and heart failure.38
Despite therapies such as PD, HD, and kidneytransplantation, many people in the world sufferfrom untreated ESKD. It has been estimated thatover 2 million people die each year due to limitedaccess to KRT, most of whom live in low andlower-middle income countries.7 Dialysis isexpensive in low and lower-middle income
countries, and can cost nearly USD 1,500 perpatient each year.39 Even in countries where KRTis accessible, the quality of care may varyconsiderably, both within and between countries.Variation in dialysis practices may contribute todifferences in KRT outcomes observedworldwide.16 International guidelines may helpnarrow the gaps in care delivery, where possible.Additionally, government support andprioritization may improve both access to andquality of dialysis. However, it is important toconsider other interventions that may be more
1.4 Access to and quality of ESKD care worldwide
Over 2 million people die each yeardue to limited access to KRT.

24 | Introduction ISN Global Kidney Health Atlas | 2019
Acute kidney injury (AKI) is a sudden reduction inkidney function (usually within a timeframe rangingfrom hours to days) and manifests clinically as areversible acute increase of nitrogen wasteproducts (serum urea and creatinine levels). In thepast, AKI was referred to as acute renal failure(ARF).42,43 AKI is a common condition associatedwith hospitalization and is especially commonamong critically ill patients, up to 40% of patients atICU admission and 60% of patients duringhospitalization. Common causes of AKI include fluid
losses, infections, drugs, or toxins.44,45 Indeveloping countries, diarrheal illnesses andnephrotoxins (usually herbal medications) contributesignificantly to the development of AKI.43,44,46
AKI and CKD are closely related; CKD is a knownrisk factor for AKI and vice versa. Both AKI andCKD increase the risk for cardiovascular disease,47-
49 among other adverse outcomes. Appropriate,timely treatment of AKI is critical, as it can reversekidney damage; untreated, AKI can lead to CKDprogression and ultimately, ESKD.
cost-effective and pragmatic in settings wherethe costs of dialysis are a substantial burden.39
For example, conservative care may be moreappropriate in such settings, allowing patients toreceive the best possible care when dialysis isnot achievable.
Kidney transplantation often is the preferred typeof KRT. However, gaps exist with respect to bothorgan availability and system-level resourcesrequired for the operation. Transplantation is highlyresource-intensive, and shortages in deceased
donor organs further limit access.40 Limitationsassociated with infrastructure, the workforce, andlegal frameworks as well as religious, cultural, andsocial constraints may contribute to lowtransplantation rates in some countries, amongother factors.41 Due to the success of kidneytransplantation and limited organ supply,vulnerable people are at risk of organ traffickingand transplant tourism. Policies to protect donorand recipient safety, enforce standards, andprohibit unethical practices are needed.
1.5 AKI
Health information systems are used to collectand manage health-related data. According tothe World Health Organization (WHO), a healthinformation system is critical for decision-making;its main functions include data generation andcompilation, analysis and synthesis, andcommunication and use.50
Well-designed health information systems areimperative for health care. Proper informationmanagement helps ensure patient safety andquality of care by reducing mistakes, improvingclinical decision-making, and enabling access toinformation in real time.51 In addition to healthinformation systems that collect and store individualpatient health information (e.g., electronic medicalrecords), databases or registries of populationhealth information are important tools for achievingquality health care. Patient registries can providehospital administrators with information on currentand future resource demands. Registries also helpresearchers learn more about health conditions,
1.6 Health information systems
Despite their importance, renalregistries are lacking, particularlyin lower income countries.

ISN Global Kidney Health Atlas | 2019 Introduction | 25
Appropriate leadership and governance areessential healthcare system components50 thatfacilitate priority setting, strategy development,and policymaking activities.56 A policy is a specific official decision or set of decisionsdesigned to carry out a course of actionendorsed by a government body. In addition topriorities, goals, and general guidelines for theirattainment, a policy document may include adetailed implementation strategy.57 A healthpolicy includes decisions, plans, and actionsintended to achieve a specific health caregoal.58 Health policies create standardized
approaches to promote equitable delivery ofhigh-quality care, and can increase awarenessand promote advocacy around important healthmatters. Advocacy groups or nonprofits mayurge the creation of policies, or vice versa, bydemonstrating need, importance, and interest.Despite the worldwide commitment toimplementing noncommunicable disease (NCD)prevention and control strategies,59 kidneydisease policies often are lacking. Due to theburden of CKD and its association with otherNCDs, its inclusion in these strategies may yieldsignificant global benefits.60
1.7 National health policies
thereby identifying ways to prevent or managethem. Moreover, the Agency for HealthcareResearch and Quality (AHRQ) suggests that patientregistries may facilitate the delivery of patient-centered care.52 Collecting data on populationhealth statistics over time also enables programstargeted at reducing the prevalence or incidence ofa specific health condition to be evaluated.
Health information systems are critical tools in themanagement of kidney disease. Early diagnosis isimportant to slow progression; registries not onlyhelp primary care physicians manage people inthese early stages, but also provide patients withtools to monitor and manage their health.53
Registries of people with ESKD are importantmechanisms for monitoring trends in disease
burden and outcomes, and for policy planning(e.g., to estimate transplantation needs and planappropriately for organ procurement systems).Despite their importance, renal registries arelacking, particularly in lower income countries.54
Monitoring population health data may beparticularly important in low and lower-middleincome countries. Current status must bedocumented to assess the impacts of futureprograms and predict future resource needs.Organizational, behavioral, and economic barriers,limited access to information systems, and a lackof capacity building may impede the creation andfunctionality of robust health information systems inthese settings.55 Future efforts to determine how tobest operate these systems may be beneficial.
The International Society of Nephrology (ISN) isdedicated to ensuring that all people haveequitable access to sustainable kidney health. The ISN has developed several programs(www.theisn.org/programs) and initiatives(www.theisn.org/research) focused on education,training and research, and improving kidneydisease awareness and detection.
The ISN recognizes the global challengesassociated with diagnosis and treatment of CKD,especially in low and lower-middle incomecountries where other challenges abound. The ISNfacilitates kidney care by providing educationalassistance and guidance, training caregivers, andsetting up facilities. When individual countries areunable to meet targets, support can be provided to
1.8 A global ESKD strategy

26 | Introduction ISN Global Kidney Health Atlas | 2019
intergovernmental organizations through existingregional nephrology associations, e.g., AFRAN(African Association of Nephrology), SLANH(Society of Nephrology and Hypertension), andAPSN (Asian Pacific Society of Nephrology).
Universal health care coverage for the preventionand early management of kidney disease greatlyreduces disease burden and saves lives. AKI isreversible and early treatment can preventprogression to CKD. By increasing funding forAKI detection and treatment, various affiliatedbodies can help prevent progression to moresevere and costly conditions. Similarly, includingthe targeting of associated risk factors as part ofthe global health agenda may result in asignificant reduction of CKD worldwide. Nationaland regional governments can play an importantrole in this effort by improving legislation andincreasing funding for treatment of kidneydiseases. Increasing access to adequatetreatment for risk factors, dialysis therapies, andkidney transplantation may further contribute to areduction in the burden of kidney disease. Abetter understanding of the global capacity forkidney care and how that capacity varies aroundthe world is essential to combatting kidneydisease. Knowing which policies and healthcaresystems currently facilitate or impede kidney carehelps set benchmarks and opportunities forimprovement. Furthermore, understanding howthese capacities vary across regions or countriescould inform recommendations and help identifyareas where knowledge or resource sharing mayyield great benefits.
A central goal of the ISN is its Closing the Gapsinitiative (https://www.theisn.org/focus/ckd). This program provides a comprehensive strategy
to address issues related to the delivery of CKDcare worldwide by defining global needs and thecurrent state of CKD care, and closing identifiedgaps through ISN research, education, andadvocacy activities.61 GKHA is part of this Closingthe Gaps initiative and focuses on documentingthe current capacity of care worldwide.62 TheGKHA is a multinational, cross-sectional surveydesigned to assess the current capacity forkidney care across all world regions. Published in2017, the first iteration of the GKHA exploredinter- and intra-national variability around theglobe with respect to capacity for kidney caredelivery, as defined by the WHO’s domains ofhealth services. The 2017 GKHA demonstratedsignificant inter- and intra-regional variability inglobal kidney care, with significant gaps related tothe kidney health workforce, health servicedelivery, essential medicines and technologies,health financing, leadership and governance,health information systems, strategies and policyframeworks, and research capacity anddevelopment, particularly in low and middleincome countries. These findings provided thefoundation for a global CKD surveillance andbenchmarking network.
Prevention of ESKD and improving access to care is a significant focus of the ISN(https://www.theisn.org/focus/eskd-focus); its programs are designed to improveunderstandings of ESKD and its determinants,highlight the necessary standards of ESKD care,and enhance the ability to treat ESKD inresource-constrained settings. This seconditeration of the GKHA survey is aimed at definingthe current global status of the structures andorganization of ESKD care. It focuses on thecapacity and readiness of nations to achieveuniversal access to equitable integrated ESKDcare, including KRT and conservative care. Byunderstanding and potentially helping to shaperelevant health policies, practices, andinfrastructure, the ISN aims to facilitate theimplementation of equitable and ethical care forkidney patients in all regions and countries ofthe world.
The ISN’s Closing the Gaps initiativeprovides a comprehensive strategyfor CKD care worldwide.

ISN Global Kidney Health Atlas | 2019 Methods | 27
This iteration of the GKHA is the product ofcollaborative efforts with regional and nationalproject leaders. Two key methods were used toproduce the atlas: a desk research component,which involved searching literature and other datasources to calculate estimates; and a key opinionleader survey, whereby three leaders from eachcountry (a nephrology society leader, a leader ofa consumer representative organization, and apolicymaker) submitted details on national kidneycare capacity and practices with a specific focuson KRT.
Assistance from international contacts,collaborators, ISN leaders, and regional boardmembers was sought to facilitate both
approaches during the development of theGKHA. Project leaders at the regional andnational levels ensured the inclusion of localnephrology association leaders, consumerrepresentatives, policymakers, and other opinionleaders across regions and countries. Projectleaders organized and followed up on responsesfor all countries within a specific world region;played a liaison role between the steeringcommittee, ISN, and regional stakeholders;helped gain access to additional data sourcesand contacts for surveys; identified or served asopinion leaders on the project for each specificworld region; and identified or served as resourcepersons to vet and review regional data.
SECTION 2
METHODS
2.1 Overview
This report pertains to 218 countriesrecognized by the World Bank and specificallyfocuses on countries with ISN affiliate societies.Regional boards for the 10 ISN regionscoordinated the work performed in each of thecountries. Each region’s work was led by asteering committee and working group withinthe stipulated timeline (Figure 2.1). The 10 ISNregions are:
1. Africa2. Eastern & Central Europe3. Latin America & the Caribbean*4. Middle East5. North America & the Caribbean* 6. North & East Asia7. Oceania & South East Asia8. Newly Independent States & Russia9. South Asia10. Western Europe
2.2 Scope and timeline
* Within the ISN, the islands of the Caribbean are affiliated with either North America & the Caribbean or Latin America & the Caribbean (see Appendix Table A2.1).For simplicity, the main body of the Atlas refers to these regions as North America and Latin America.

Desk research efforts included a review ofpublished scientific literature, government reports,and other relevant data sources on the variousaspects of ESKD epidemiology and health systemcharacteristics corresponding to each of the WHOuniversal health coverage (UHC) domains (i.e.,service delivery, health workforce, informationsystems, medicines and medical products,financing, and leadership) (Tables 2.1 and 2.2).Although published literature is important toconsider, much of the available evidence wasexpected to be found in gray literature, includingwebsites and reports with limited circulation. Thenational and regional project leaders helped identifythese sources and conducted a detailed grayliterature search by following a strategy designedby an expert research librarian. To gatherinformation on current kidney care practices andthe burden and costs of ESKD, three literaturereviews were performed:
1. A broad literature review of national healthsystem characteristics associated with each ofthe WHO UHC domains with an emphasis onimportant elements relevant to the organizationand delivery of ESKD care.
2. A systematic review of relevant ESKDepidemiology data on disease burden andoutcomes across countries and regions,including:
® Prevalence and incidence of overallESKD (treated);
® Dialysis (HD and PD) incidence andprevalence;
® HD incidence and prevalence;
® PD incidence and prevalence;
® Kidney transplantation incidence andprevalence;
® Kidney transplantation by donor type(living or deceased).
2.3 Desk research
28 | Methods ISN Global Kidney Health Atlas | 2019
Figure 2.1 | Timeline of the GKHA project
Dec 2017
Jan 2018
Feb 2018
Mar 2018
Apr 2018
May 2018
Jun 2018
Jul 2018
Aug 2018
Sep2018
Oct 2018
Nov 2018
Dec 2018
Jan 2019
Feb 2019
Mar 2019
Apr 2019
May 2019
Milestones / action items:n Database development and testingn Pilot test questionnairen Analyze pilot data and identify
potential logistical and feasibilityissues
n Develop a knowledge transfer plan
Milestones / action items:n Analyze survey data and generate reportsn Analyze systematic review and generate reportsn Write technical reportn Subject reports to internal peer review (steering committee)n Subject reports to external peer review (steering committee)n Prepare and submit a scientific papern Edit and publish technical report
Milestones / action items:n Identify key stakeholders and
partners; establish steeringcommittee
n Contact specific national andregional stakeholders
n Finish reviewing questionnairesn Finalize protocol and translationsn Begin desk research phase
Milestones / action items:n Administer main surveyn Send out reminders and follow up with key contactsn Develop database and analyze survey datan Perform follow-up interviews with ISN regional leadersn Complete literature search and data extraction for the desk
research phasen Perform an internal review of the collated data (steering
committee and ISN leadership)

ISN Global Kidney Health Atlas | 2019 Methods | 29
Buildingblocks Indicators/metrics Data sources Essential elements
Countryprofile
®Total population (millions)®Gross national income per capita
®Literature reviews ®Demographic andeconomiccharacteristics
Healthservicedelivery
®Description of healthcare system: public/privatehealth insurance funded by national taxation/incomecontributions covering all/a proportion of thepopulation; ratio of public/private MDs, renal carecenters and/or HD centers.
®Literature reviews®Surveys® Interviews
®Comprehensiveness®Accessibility®Coverage®Quality®Coordination®Efficiency®Accountability
Healthworkforce
®Density of physicians (per 10,000 population)®Density of nursing and midwifery personnel (per
10,000 population)®Density of pharmaceutical personnel (per 10,000
population)
®Literature reviews®Surveys® Interviews®WHO Global
Observatory
®Reach anddistribution
®Accessibility
Healthinformationsystems
®Health information system performance index ®Literature reviews®Surveys® Interviews
®Reach®Scope®Comprehensiveness
Essentialmedicinesandtechnologies
®Median availability of selected generic medicines inpublic and private sectors (%)
®Median consumer price ratio of selected genericmedicines in public and private sectors
®Literature reviews®Surveys® Interviews®WHO Global
Observatory
®Equitable access®Quality and safety ®Cost-effectiveness
Healthfinancing
®Total expenditure on health as a percentage of GDP®General government expenditure on health as a
percentage of total expenditure on health®Private expenditure on health as a percentage of total
expenditure on health®General government expenditure on health as a
percentage of total government expenditure®Out-of-pocket expenditure as a percentage of private
expenditure on health®Private prepaid plans as a percentage of private
expenditure on health
®Literature reviews®WHO Global
Observatory ®Database
®Availability of funds®Extent of financial risk
protection
Leadershipandgovernance(nationalpolicies andframeworks)
®National non-communicable chronic disease policy(where it exists): overarching disease policy targetinglong term conditions including CVD, diabetes, cancer,CKD, etc.
®Literature reviews®Surveys® Interviews®WHO Global
Observatory®WHO NCD Strategy
®Existence ofappropriate policiesand strategies
®Adoption of policiesand strategies
Table 2.1 | General health system characteristics: WHO UHC domain and relevant data sources
CKD = chronic kidney disease, CVD = cardiovascular disease, GDP = gross domestic product, HD = hemodialysis, MD = medical doctor,NCD = non-communicable disease, WHO = World Health Organization

30 | Methods ISN Global Kidney Health Atlas | 2019
Table 2.2 | CKD-centric health system characteristics: WHO UHC domains and relevant data sources
ACEi = angiotensin-converting enzyme inhibitor, ARB = angiotensin receptor blocker, AKI = acute kidney injury, CKD = chronic kidney disease,eGFR = estimated glomerular filtration rate, EPO = erythropoietin, GN = glomerulonephritis, GP = general practitioner, HD = hemodialysis, KRT = kidney replacement therapy, MBD = mineral bone disorder, MDT = multidisciplinary team, NCD = non-communicable disease, PD = peritoneal dialysis, WHO = World Health Organization
Domain Indicators/metrics Data sources Essential elements
Healthservicedelivery
®Number of health facilities for general CKDcare
®KRT services (e.g., number of healthfacilities offering HD, PD, transplantationservices per country)
®Public vs. private®Non-dialysis CKD care structure®KRT care structure
®Literaturereviews
®Surveys® Interviews
®Accessibility of dialysis and kidneytransplant units to all residents within acountry
®Access to medications®Reimbursement of treatment and care®Kidney transplant waiting list®Access to psycho-social counseling
and support®Existence, strength, role of patient
organizations in each country
Healthworkforce
®Number of nephrologists (per millionpopulation)
®Number of general physicians (per 10,000population)
®Number of community health workers (per10,000 population)
®Number of nurses (per 10,000 population)®Regional distribution®Nephrology trainees/graduates per year®Availability of multidisciplinary teams
®Literaturereviews
®Surveys® Interviews®WHO Global
Observatory
®Professionals (GPs, nephrologists,diabetologists, endocrinologists,cardiologists, other related disciplines):total and as a ratio to wholepopulation/ or dialysis population
®Financial resources, remuneration andincentives (including those forGPs/specialists to identify andmanage CKD patients)
®Presence of other credentialed healthcare providers (e.g., nephrologynurses, dieticians)
Healthinformationsystems
®CKD (non-dialysis) registry®KRT registry
®Literaturereviews
®Surveys® Interviews
®Reach®Scope
Essentialmedicinesandtechnologies
®ACEi/ARBs®Statins®Aspirin®Other blood pressure medications®Anemia medications (EPO/iron)®CKD-MBD (calcium binders, renagel,
cinacalcet)®Specific (GN and transplant)®Dialysis availability, access and coverage®Transplant availability, access and coverage
®Literaturereviews
®Surveys® Interviews®WHO Global
Observatory(for someessentialmedicines)
®Access to medications that managerisk factors to prevent thedevelopment or progression of AKI orCKD
Healthfinancing
®Total expenditure for CKD and ESKD®Public and private contributions®Out-of-pocket payments for essential
medicines®Out-of-pocket payments for non-dialysis
CKD care®Out-of-pocket payments for dialysis®Out-of-pocket payments for transplant
®Literaturereviews
®Surveys® Interviews®WHO Global
Observatory
®Fund medications to prevent thedevelopment or progression of AKI orCKD
Leadershipandgovernance(nationalpolicies andframeworks)
®Guidelines/frameworks on CKD and ESKDcare
®Advocacy efforts and initiatives®Early detection and prevention programs®eGFR reporting
®Literaturereviews
®Surveys® Interviews®WHO Global
Observatory ®WHO NCD
Strategy
®Availability, awareness, and adoptionof policies and guidelines targetedtoward kidney care

ISN Global Kidney Health Atlas | 2019 Methods | 31
3. A scoping review of KRT cost estimates acrosscountries and regions, including:
® Cost of maintenance HD;
® Cost of maintenance PD;
® Cost of kidney transplantation (thefirst year); and
® Cost ratio of maintenance HD tomaintenance PD.
2.3.1 Scoping review of health systemcharacteristics
The objective of the broad review was to obtain asnapshot of individual country and regional healthsystem characteristics and specific elementsrelevant to ESKD care, focused on the generalWHO UHC domains (Table 2.1) and specificdomains related to kidney disease (Table 2.2). Thecomprehensive search strategy was developed inconjunction with an expert medical librarian.
Data sources included:
® Data and reports published by the WHOGlobal Observatory, UN, World Bank,and OECD;
® Both published and unpublished documentsfrom international organizations/bodies (i.e., OECD, WHO, UN, CommonwealthFund, World Bank, EU and its affiliates, etc.),and reports published by nationalgovernments (and occasionally regionalgovernments within countries) on theorganization and delivery of ESKD care; and
® Additional literature identified by keystakeholders (i.e., opinion leaders, nationalnephrology society leaders, ISN leaders) andthrough consultation with national nephrologysocieties and ISN regional boards.
2.3.2 Systematic review of relevantESKD epidemiological data
The objective of the systematic review was tocollect epidemiological data on the incidence and
prevalence of KRT. Health system featuresacross countries and regions with implications forESKD care were also reviewed.
Data on key estimates of KRT were defined bythe incidence and prevalence of ESKD (overall)and by different dialysis modalities (HD and PD)and kidney transplantation. These data wereextracted from key reports, including annualreports of the ESKD renal registries anddatabases such as the Global Observatory onDonation and Transplantation (GODT), as well asidentified relevant published and gray literature.
Data sources included:
® Statistics/published reports from national andregional government agencies (whereavailable) identified during our gray literaturesearch and by experts;
® Reports published by internationalorganizations (WHO, World Bank, UN, andOECD), including world health statistics andhealth system reports;
® Leaders of national and regional nephrologyassociations and key opinion leaders whohelped us gather data relevant to all aspectsof the inventory;
® Published scientific literature on the variousaspects of KRT epidemiology, economics,and organization of care according tostandard guidelines63,64 which, as in ourprevious work, provided additionalcomplementary data for the atlas;65,66
® A gray literature search based on a strategydeveloped with assistance from an expertresearch librarian and tailored to the sixUHC domains and the taxonomy developedby the WHO; and
® Renal registries that collect data on patientswith ESKD who receive KRT, which wereidentified through a rapid review ofpublications and annual reports producedby governments and renal professionalassociations (Table 2.3).

32 | Methods ISN Global Kidney Health Atlas | 2019
Table 2.3 | Renal registries from the 10 ISN regions used as data sources54
Africa South Africa 2012 Yes Yes Yes Yes
Eastern & Romanian Renal Registry 1993 Yes* Yes* Yes* Yes*Central Europe Turkish National Registry 1990 Yes Yes Yes Yes
Latin America Brazilian Registry of Dialysis 1998 Yes Yes Yes -
Colombia Healthcare Database 2008 - - Yes Yes
Latin American Dialysis and Transplantation Registry 1991 Yes Yes Yes Yes
Sociedad Argentina de Nefrologia (SAN) 2004 Yes Yes Yes Yes
Uruguayan Registry of Dialysis 1981 Yes Yes Yes Yes
Middle East & United Arab Emirates Renal North Africa Diseases Registry 1980 Yes Yes - -
NIS & Russia Russian Registry 1998 Yes* Yes* Yes* Yes*
North America British Columbia Renal Database 2008 - - - -
Canadian Organ Replacement Registry (CORR) 1994 Yes Yes Yes Yes
Canadian Pediatric End-Stage Renal Disease Database 2010 Yes Yes Yes Yes
Database of the Renal Research Institute (MONDO) 2000 - - - -
North American Pediatric Renal Trials and Collaborative Studies 1992 No No Yes Yes
The Renal Disease Registry (Ontario Renal Network) 1981 Yes Yes Yes Yes
US Renal Data System (USRDS) 1988 Yes Yes Yes Yes
North & East Asia Hong Kong Renal Registry 1985 Yes Yes Yes Yes
Korean Renal Registry 1985 Yes Yes Yes Yes
Malaysian National Renal Registry 1993 Yes Yes Yes Yes
Shanghai Dialysis Registry 1996 - - Yes No
Singapore Renal Registry 2001 Yes Yes Yes Yes
Taiwan Renal Registry Data System 1987 Yes Yes Yes No
Thailand Renal Replacement Therapy Registry 1997 Yes Yes Yes Yes
OSEA Australia and New Zealand Dialysis and Transplant Registry (ANZDATA) 1963 Yes Yes Yes Yes
South Asia None - - - - -
ISN region Renal registryYear
establishedIncidence of ESKD
Prevalenceof ESKD Dialysis Transplant
continued* Covered in ERA-EDTA registry

ISN Global Kidney Health Atlas | 2019 Methods | 33
Table 2.3 | continued
ISN region Renal registryYear
establishedIncidence of ESKD
Prevalenceof ESKD Dialysis Transplant
Western Europe Austrian Dialysis and Transplant Registry (OEDTR) 1990 - - - -
Belgian Society of Nephrology (NBVN) 1996 - - - -
Catalan Renal Registry (RMRC) 1984 Yes* Yes* Yes* Yes*
Danish Registry on Regular Dialysis and Transplantation (DNSL) 1990 Yes* Yes* Yes* Yes*
Dutch Renal Registry (RENIN) 1986 Yes* Yes* Yes* Yes*
European Renal Association – European Dialysis and Transplant Association (ERA-EDTA)
1963 Yes Yes Yes Yes
Finnish Registry for Kidney Diseases 1964 Yes* Yes* Yes* Yes*
Greek Registry (Hellenic Society of Nephrology) 2000 Yes* Yes* Yes* Yes*
Groupement des Nephrologues Francophones de Belgique (GNFB) 1995 - - - -
Italian Dialysis and Transplant Registry (RIDT) 1996 Yes Yes Yes Yes
Norwegian Renal Registry 1994 Yes Yes Yes Yes
Portuguese Society of Nephrology 1997 Yes* Yes* Yes* Yes*
Scottish Renal Registry (SRR) 1991 Yes Yes Yes Yes
Spanish Society of Nephrology Register 1997 Yes Yes Yes Yes
Swedish Renal Registry 2007 Yes* Yes* Yes* Yes*
Swiss Registry 2013 Yes* Yes* Yes* Yes*
United Kingdom Renal Registry (UKRR) 1997 Yes Yes Yes Yes
Valencian Renal Registry 1992 Yes* Yes* Yes* Yes*
Source: A global overview of renal registries: a systematic review, 2015.54 Adapted with permission.
* Covered in ERA-EDTA registry
ERA-EDTA = European Renal Association: European Dialysis and Transplant Association, ISN = International Society of Nephrology, NIS = Newly Independent States

34 | Methods ISN Global Kidney Health Atlas | 2019
EUR = euro, KRT = kidney replacement therapy, PPP = purchasing power parity, USD = United States Dollar
Framework was adopted from a previously published economic study comparing diabetes treatment costs across countries. Reference: Seuring T, Archangelidi O, andSuhrcke M. The economic costs of type 2 diabetes: a global systematic review. Pharmacoeconomics 33.8 (2015): 811-831.
Adjustment using PPP estimates: PPP refers to a standard price index (exchange rate) by the International Comparison Program that enables currency and price levelstandardization between countries. Reference: World Bank Group. Purchasing Power Parities and the Real Size of World Economies. 2014. Available at:http://siteresources.worldbank.org/ICPEXT/Resources/2011-ICP-Global-Report.pdf
Historical exchange rate: The exchange rate between the local study currency and international dollars in the year of study conduct (or one year prior to publication ifstudy year not stated).
Figure 2.2 | KRT cost adjustments and standardization
KRT cost in local currencye.g., 2004 EUR
KRT cost in 2016 USD
KRT cost convertede.g., 2012 USD
KRT cost in 2016 USD
Adjusted using PPP estimates
Converted back usingaverage historicalexchange rate
Adjusted using PPP estimates
KRT cost in local currencye.g., 2004 EUR
A B
€
€
$
$$
2.3.3 Scoping review of KRT costestimates
To obtain data on KRT costs with implications forESKD care, we conducted a scoping review ofpublished articles and gray literature in whichestimates for any of the different KRT modalitiesat the country level were reported. Since most ofthe included studies were from countries usingdifferent currencies and from different years, weused international cost comparison techniques(Figure 2.2).
The annual cost of KRT was extracted directly from
a study if the average cost over a one-year period
was provided. When KRT costs were reported per
session, week, or month, we calculated annual
costs using techniques similar to those in
previously published studies. We also compared
the average cost of maintenance HD with that of
maintenance PD using an estimated cost ratio. If
the ratio of the two means was greater than 1
(HD/PD>1), the PD cost was less than the HD
cost, and vice versa (Figure 2.2).

2.4 Survey
ISN Global Kidney Health Atlas | 2019 Methods | 35
2.4.1 Development and validation
The GKHA project was a multinational, cross-sectional survey conducted by the ISN to assesscurrent capacity for KRT around the world.Through our international contacts, collaborators,ISN leaders, and regional boards, we identifiedproject leaders at the regional and national levels,including national nephrology association leadersand opinion leaders.
Duties for regional project leaders included:
® To organize and follow up on responses for allcountries within the region;
® To serve as a liaison between the steeringcommittee, ISN, and regional stakeholders;
® To provide access to additional data sourcesand contacts for surveys;
® To identify or serve as an opinion leader on theproject for the region; and
® To identify or serve as a resource person to vetand review regional data.
Duties for national project leaders included:
® To organize and follow up on responses withinthe country;
® To serve as a liaison between the steeringcommittee, ISN, and national stakeholders;
® To provide access to additional data sourcesand contacts for surveys;
® To identify or serve as an opinion leader on theproject for the country; and
® To identify or serve as a resource person to vetand review data for the country.
The GKHA questionnaire, which was designed tocollect information about national capacities andresponses to NCD prevention and control, wasbased on a framework informed by a number ofdocuments, including WHO UHC: SupportingCountry Needs, the ISN AKI “0 by 25” initiative,WHO NCD Surveys (2000, 2005, 2010, 2013), theWorld Heart Federation “25 by 25” initiative, theInternational Diabetes Federation Global Diabetes
Atlas, the WHO Global Atlas on CardiovascularDisease Prevention and Control, Lancetcommissions in other chronic disease domains,as well as multiple UN policy documents onstrategies and policy for NCDs.69-72
The initial survey questions were furtherdeveloped through a series of reviews withrelevant experts, the ISN Executive Committee,and regional leadership. The questionnaire waspeer reviewed for content validity andcomprehensiveness before it was piloted with the10 ISN regional boards to identify any logisticaland feasibility issues (e.g., translation needs). Theformat and content of the questionnaire werefinalized based on feedback and identified issues,including translating the original English languagesurvey instrument into French and Spanish.
2.4.2 Structure
The questionnaire was designed in five modulesthat assessed the national and regional profiles forreadiness, capacity, and response to ESKDcorresponding to each of the six UHC domains.50
Specifically, the modules focused on:
® Health finance and service delivery (UHCdomains 1 and 2), with questionsevaluating funding mechanisms (CKD andKRT) and intra-national variations in ESKDcare delivery and oversight;
® Health workforce for nephrology care (UHCdomain 3), with questions evaluating clinicalresponsibility and availability of health careproviders essential for ESKD care delivery;
® Essential medications and health productaccess for ESKD care (UHC domain 4), withquestions evaluating the capacity for KRTservice provision, preparation for KRT, andnutritional services; access to dialysis andtransplant options and the quality of thoseoptions; access to conservative care; KRTaccessibility and affordability, and costreimbursement plans;

® Health information systems and statistics(UHC domain 5), with questions evaluatingthe availability of registries and/or othersurveillance systems for AKI or CKD; and
® Leadership and governance (UHC domain6), with questions evaluating national healthpolicies and strategies, advocacy (AKI,CKD, ESKD), and barriers to optimal ESKDcare delivery.
The questionnaire was accompanied by adetailed information sheet about the GKHA,detailed instructions for completion, and aglossary defining key terms used in the survey.
2.4.3 Sampling
A non-probability, purposive sampling approachwas employed to identify potential surveyrespondents. Specifically, national and regionalnephrology leaders identified key stakeholdersthrough the ISN, including representatives ofnational nephrology societies, policymakers(including those directly responsible for theorganization of kidney care and those with moregeneral responsibilities), patient organizations,foundations, and other advocacy groups.
Key stakeholders were sent invitations toparticipate that included a link to the survey’sonline portal (an electronic questionnaire viaREDCap Cloud, www.redcapcloud.com).Respondents were asked specifically aboutimportant within-country heterogeneity and wereasked to identify other potential keyrespondents, thereby increasing the likelihoodthat relevant information would be widelycaptured. The survey was conducted from Julyto September 2018. During this period, intensivefollow-ups were conducted by email andtelephone with ISN regional and national leadersto ensure complete and timely responses.
2.4.4 Data handling
To facilitate data collation, responses to the Frenchand Spanish surveys were first converted toEnglish by certified translators. Then, data from allindividual questionnaires were automaticallyextracted and cleaned using Microsoft Excel andmerged into a single file to create the globaldatabase. This was housed in a securedcentralized computer system with automatedbackups. ISN regional leaders were consulted toensure that collated data were consistent withtheir understandings and were of high quality.Each regional board reviewed their output to clarifyany ambiguity or inconsistencies. Any majorinconsistencies that remained after the reviewswere systematically addressed during follow-upinquiries with the stakeholders involved with thesurvey. Further validation was carried out at thenational and regional levels by triangulating thefindings with published literature and gray sourcesof information (i.e., government reports and othersources provided by the survey respondents).
2.4.5 Analysis
A framework developed by the WHO, AssessingNational Capacity for the Prevention and Control ofNCDs was leveraged during statistical analysis ofthe collated data.73 The analysis was conductedusing STATA 15 software (Stata Corporation,2017). Using country as the unit of analysis,responses were summarized based on the keyquestionnaire domains using a descriptivestatistical approach and reported as counts andpercentages. Results were stratified by ISN regionand by World Bank income group. Results wereexamined with a focus on identifying key gaps andchallenges across the various domains based onthe pre-existing protocol, and reported accordingto the Guidelines for Accurate and TransparentHealth Estimates Reporting (GATHER) statement.74
36 | Methods ISN Global Kidney Health Atlas | 2019

ISN Global Kidney Health Atlas | 2019 | 37
DESK RESEARCHFINDINGS

38 | ISN Global Kidney Health Atlas | 2019

ISN Global Kidney Health Atlas | 2019 Desk research findings | 39
Information on the prevalence of treated ESKD (i.e.,the number of dialysis patients or kidney transplantrecipients) is available in 42% (n = 91) of countriesworldwide (Map 3.1.1). The majority of these arehigh or upper-middle income countries. Only onelow income country (Rwanda) and less than 10% ofAfrican countries have data available on the
prevalence of treated ESKD. The average numberof people receiving ESKD globally is 759 per millionpopulation (pmp); prevalence ranges greatly from 4pmp in Rwanda to 3392 pmp in Taiwan. Theprevalence of treated ESKD increases with incomelevel. The rate of treated ESKD is 966 pmp in highincome countries compared to 550.2 pmp in
SECTION 3
DESK RESEARCH FINDINGS
3.1 Treated ESKD
Map 3.1.1 | Global prevalence of treated ESKDRate per million population (pmp), age ≥ 18 years
<433.0 pmp 433.0–759.0 pmp 759.1–1048.0 pmp >1048.0 pmp Data not reported

40 | Desk research findings ISN Global Kidney Health Atlas | 2019
upper-middle, 321 pmp in lower-middle, and 4.4pmp in low income countries. Prevalence rates arebelow the global average in Africa, Latin America,the Middle East, North America, NIS and Russia,
and South Asia, and above or equal to the globalaverage in Eastern and Central Europe, North andEast Asia, Oceania and South East Asia (OSEA),and Western Europe.
Map 3.1.2 | Global incidence of treated ESKDRate per million population (pmp), age ≥ 18 years
<103.1 pmp 103.1–144.0 pmp 144.1–200.2 pmp >200.2 pmp Data not reported
Information on the incidence of treated ESKD (i.e.,new dialysis patients or kidney transplant recipients)is available in 36% (n = 79) of countries worldwide(Map 3.1.2). No low income countries, and lessthan 10% of African countries have data available.The average number of new ESKD diagnosesworldwide is 144 pmp, ranging greatly from 20.2pmp in Paraguay to 493 pmp in Taiwan. Incidenceof treated ESKD increases with income level. In
high income countries, the incidence of ESKDtreatment is 149 pmp, compared to 126 pmp inupper-middle and 129.9 pmp in lower-middleincome countries. The incidence of treated ESKD isbelow the global average in Africa, the Middle East,NIS and Russia, South Asia, and Western Europe,and above the global average in Eastern andCentral Europe, Latin America, North America,North and East Asia, and OSEA.

Information on the prevalence of chronic dialysis,(either HD or PD) is available in 61% (n = 133) ofcountries worldwide (Map 3.2.1). The averageprevalence of chronic dialysis globally is 343 pmp,ranging greatly from 0.5 pmp in Tanzania to 3251pmp in Taiwan. The prevalence of chronic dialysisincreases with income level. In high incomecountries, the prevalence of chronic dialysis is 620
pmp compared to 339 pmp in upper-middle, 94.5pmp in lower-middle, and 3.4 pmp in low incomecountries. Prevalence rates are below the globalaverage in Africa, NIS and Russia, and South Asia,and above the global average in Eastern andCentral Europe, Latin America, the Middle East,North America, North and East Asia, OSEA, andWestern Europe.
3.2 Chronic dialysis
ISN Global Kidney Health Atlas | 2019 Desk research findings | 41
Map 3.2.1 | Global prevalence of chronic dialysisRate per million population (pmp), age ≥ 18 years
<108.4 pmp 108.4–343.0 pmp 343.1–632.0 pmp >632.0 pmp Data not reported

42 | Desk research findings ISN Global Kidney Health Atlas | 2019
Information on the incidence of chronic dialysis(either HD or PD) is limited (Map 3.2.2). Only 12%of countries worldwide (n = 26), all of which areupper-middle (n = 5) or high (n = 21) income,have data available. Countries in Africa, LatinAmerica, the Middle East, North and East Asia,NIS and Russia, and South Asia do not have anydata available on the incidence of chronic dialysis.Globally, the average number of people initiating
chronic dialysis is 116 pmp, ranging from 83.5pmp in Iceland to 374.1 pmp in the UnitedStates. The incidence rate of chronic dialysis ishigher in the 5 upper-middle income countries(175.9 pmp) than in the 21 high income countries(114.5 pmp). Incidence rates are below the globalaverage in Eastern and Central Europe, andWestern Europe, and above the global average inNorth America and OSEA.
Map 3.2.2 | Global incidence of chronic dialysisRate per million population (pmp), age ≥ 18 years
<101.5 pmp 101.5–115.8 pmp 115.9–194.9 pmp >194.9 pmp Data not reported

ISN Global Kidney Health Atlas | 2019 Desk research findings | 43
Information on the prevalence of chronic HD isavailable in 58% (n = 126) of countries worldwide(Map 3.3.1). Globally, the average prevalence ofchronic HD is 298.4 pmp, ranging greatly from 0.4pmp in the Congo to 2148.4 pmp in Japan.Prevalence of chronic HD increases with incomelevel. In high income countries, the number ofpeople receiving chronic HD is 513.7 pmp,
compared to 334.1 pmp in upper-middle, 67.9pmp in lower-middle, and 3.9 pmp in low incomecountries. Average prevalence of chronic HD isbelow the global average in Africa, the Middle East,NIS and Russia, and South Asia, and above theglobal average in Eastern and Central Europe, LatinAmerica, North America, North and East Asia,OSEA, and Western Europe.
3.3 Chronic HD
Map 3.3.1 | Global prevalence of chronic HDRate per million population (pmp), age ≥ 18 years
<80.5 pmp 80.5–298.3 pmp 298.4–599.4 pmp >599.4 Data not reported

44 | Desk research findings ISN Global Kidney Health Atlas | 2019
Information on the incidence of chronic HD isavailable in 12% (n = 26) of countries worldwide,all of which are upper-middle (n = 7) or highincome (n = 19) (Map 3.3.2). Data are notavailable for countries in Africa, Latin America,Middle East, NIS and Russia, or South Asia.Globally, the average number of people initiatingchronic HD treatment is 108.8 pmp, ranging from
65.3 pmp in Norway to 336.7 pmp in the UnitedStates. Incidence rates are higher in upper-middleincome countries (122.5 pmp) than in highincome countries (101.5 pmp). Average incidencerates are below the global average in Eastern andCentral Europe, North and East Asia, andWestern Europe, and above the global average inNorth America and OSEA.
Map 3.3.2 | Global incidence of chronic HDRate per million population (pmp), age ≥ 18 years
<81.5 pmp 81.5–108.8 pmp 108.8–150.1 pmp >150.1 Data not reported

ISN Global Kidney Health Atlas | 2019 Desk research findings | 45
Half of all countries worldwide (n = 110) haveinformation available on the prevalence of chronicPD (Map 3.4.1). Globally, the average number ofpeople receiving chronic PD treatment is 38.1pmp, ranging from 0.1 pmp in Egypt to 486.7pmp in Mexico. Prevalence of chronic PDincreases with income. In high income countries,prevalence is 53 pmp, compared to 26.5 pmp in
upper-middle, 5.8 pmp in lower-middle, and 0.9pmp in low income countries. Prevalence ofchronic PD is below the global average in Africa,Eastern and Central Europe, the Middle East, NISand Russia, and South Asia, and above the globalaverage in Latin America, North America, Northand East Asia, OSEA, and Western Europe.
3.4 Chronic PD
Map 3.4.1 | Global prevalence of chronic PDRate per million population (pmp), age ≥ 18 years
<10.9 pmp 10.9–38.0 pmp 38.1–68.3 pmp >68.3 pmp Data not reported

46 | Desk research findings ISN Global Kidney Health Atlas | 2019
Information on the incidence of chronic PD isavailable in 11% (n = 24) of countries worldwide,all of which are upper-middle (n = 5) or highincome (n = 19) (Map 3.4.2). No countries inAfrica, Latin America, Middle East, North andEast Asia, NIS and Russia, or South Asia havedata on the incidence of chronic PD. Globally, theaverage number of people initiating chronic PDtreatment is 20.8 pmp, ranging from 2.4 pmp inRomania to 140.6 pmp in Thailand. In high
income countries, the average number of patientsinitiating chronic PD treatment is 23.5 pmp.Although average incidence of chronic PD inupper-middle income countries is 5 pmp, valuesranged widely from 2.4 pmp in Romania to 140.6pmp in Thailand. Average incidence of chronicPD is below the global average in Eastern andCentral Europe, and Western Europe, and abovethe global average in North America (specifically,Canada and the United States).
Map 3.4.2 | Global incidence of chronic PDRate per million population (pmp), age ≥ 18 years
<13.8 pmp 13.8–20.7 pmp 20.8–38.3 pmp >38.3 pmp Data not reported

ISN Global Kidney Health Atlas | 2019 Desk research findings | 47
Information available on the prevalence of kidneytransplantation is available in 34% (n = 75) ofcountries worldwide (Map 3.5.1). No low incomecountries or countries in South Asia have dataavailable. Globally, the average number ofpeople who have received kidney transplants is255 pmp, ranging from 3.1 pmp in the Bahamasto 693 pmp in Portugal. On average, highincome countries have a much higher
prevalence of kidney transplantation (363 pmp)than upper-middle (80 pmp) or lower-middle (27pmp) income countries. The prevalence ofkidney transplantation is below the globalaverage in Africa, Latin America, North America,North and East Asia, OSEA, and NIS andRussia, and above the global average in Easternand Central Europe, the Middle East, andWestern Europe.
3.5 Kidney transplantation
Map 3.5.1 | Global prevalence of kidney transplantationRate per million population (pmp), age ≥ 18 years
<58.0 pmp 58.0–255.0 pmp 255.1–432.0 pmp >432.0 pmp Data not reported

48 | Desk research findings ISN Global Kidney Health Atlas | 2019
Information on the incidence of kidneytransplantation is available in 45% (n = 98) ofcountries (Map 3.5.2). Globally, the average numberof new kidney transplantations is 13.6 pmp, rangingfrom 0.04 pmp in Myanmar to 70.5 pmp in Spain.Incidence of transplantation increases with incomelevel. In high income countries, the incidence rate is38.6 pmp compared to 9.4 pmp in upper-middleand 4.3 pmp in lower-middle income countries.
Nepal is the only low income country with dataavailable, reporting an incidence rate of 3.5 pmp.Incidence rates for kidney transplantation are belowthe global average in Africa, Latin America, theMiddle East, North and East Asia, OSEA, NIS andRussia, and South Asia, and above the globalaverage in Eastern and Central Europe, NorthAmerica (specifically, Canada and the UnitedStates), and Western Europe.
Map 3.5.2 | Global incidence of kidney transplantationRate per million population (pmp), age ≥ 18 years
<5.2 pmp 5.2–13.5 pmp 13.6–37.8 pmp >37.8 pmp Data not reported

ISN Global Kidney Health Atlas | 2019 Desk research findings | 49
Information on the incidence rate for kidneytransplantation using organs from deceaseddonors is available in 45% (n = 98) of countriesworldwide (Map 3.5.3). Among these 98countries, 23 report a rate of 0 surgeries pmp,meaning only kidneys from living donors are usedin transplantation. No low income countriesreported kidney transplantation using organs fromdeceased donors. Among the 75 countries thatoffer kidney transplantation using organs fromdeceased donors, the average incidence is 15.1pmp. Incidence rates increased with income
level. High income countries have much higherrates for transplantation using organs fromdeceased donors (27.1 pmp) than upper-middle(5.2 pmp) and lower-middle (0.2) incomecountries. Overall, the incidence of kidneytransplantation using organs from deceaseddonors is below the global average in Africa, LatinAmerica, the Middle East, North and East Asia,and NIS and Russia, and above the globalaverage in Eastern and Central Europe, NorthAmerica (specifically, Canada and the UnitedStates), and Western Europe.
Map 3.5.3 | Global incidence of deceased donor kidney transplantationRate per million population (pmp), age ≥ 18 years
<2.9 pmp 2.9–15.1 pmp 15.2–29.4 pmp >29.4 pmp
Deceased donation N/A (not available) Data not reported

50 | Desk research findings ISN Global Kidney Health Atlas | 2019
Information on the incidence rate for kidneytransplantation using organs from living donors isavailable in 42% (n = 97) of countries worldwide(Map 3.5.4). Globally, the average rate fortransplants using organs from living donors is 5.3pmp, ranging from 0.4 pmp in Myanmar to 33.2pmp in Turkey. Nepal is the only low incomecountry with data available, reporting anincidence rate of 3.5 pmp. High income countrieshave the highest incidence rate (7.5 pmp),
followed by upper-middle income countries (2.9pmp), and lower-middle income countries (4pmp). Overall, the incidence of kidneytransplantation using organs from living donors isbelow the global average in Africa, Eastern andCentral Europe, Latin America, OSEA, NIS andRussia, and South Asia, and above the globalaverage in the Middle East, North America(specifically, Canada and the United States), andWestern Europe.
Map 3.5.4 | Global incidence of living donor kidney transplantationRate per million population (pmp), age ≥ 18 years
<2.6 pmp 2.6–5.3 pmp 5.4–10.8 pmp >10.8 pmp Data not reported

ISN Global Kidney Health Atlas | 2019 Desk research findings | 51
Information on the incidence of pre-emptive kidneytransplantation performed before dialysis is requiredis available in 10% (n = 20) of countries worldwide(Map 3.5.5). No data are available from low orlower-middle income countries or countries inAfrica, Latin America, the Middle East, North andEast Asia, NIS and Russia, or South Asia. Amongthe 20 countries with available data, the averagenumber of pre-emptive kidney transplantation
surgeries worldwide is 5.2 pmp, ranging from 0.3pmp in Bosnia and Herzegovina to 12.4 pmp inNorway. The rate is higher in high income countries(5.8 pmp) than in upper-middle income countries(0.7 pmp). Overall, the incidence of pre-emptivekidney transplantation is below the global averagein Eastern and Central Europe and OSEA, andabove the global average in North America(specifically, Canada and the United States).
Map 3.5.5 | Global incidence of pre-emptive kidney transplantationRate per million population (pmp), age ≥ 18 years
<1.5 pmp 1.5–5.1 pmp 5.2–6.9 pmp >6.9 pmp Data not reported

52 | Desk research findings ISN Global Kidney Health Atlas | 2019
3.6.1 Maintenance HD
Nearly half of all countries (44%; n = 97) have dataavailable on the annual cost of maintenance HD—specifically, in-center HD. Nearly half (46%, n = 45)of these are high income countries. Only 5 lowincome countries (Cambodia, Burundi, DemocraticRepublic of Congo, Nepal, and Tanzania) have dataavailable. Overall, the global average annual cost ofmaintenance HD is 22,617 international dollars(equivalent to the USD value in 2016) per person,ranging from 1,560 international dollars inCameroon to 103,187 international dollars in theNetherlands. The average cost of maintenance HDincreases with country income level, except for lowincome countries, where the average cost is higherthan in lower-middle income countries. Highincome countries have the highest average cost ofmaintenance HD (49,720 international dollars),
followed by upper-middle income countries(17,990 international dollars), low income countries(12,480 international dollars) and lower-middleincome countries (10,140 international dollars).Only high income countries have an average costabove the global average (Figure 3.1).
3.6.2 Maintenance PD
Overall, 40% (n = 87) of countries have dataavailable on the annual cost of maintenance PD,mainly continuous ambulatory PD. The majority(49%, n = 43) of these are high-income countries.Only 1 low-income country (Democratic Republicof Congo) have data available. Overall, the globalaverage annual cost of maintenance PD is 20,524international dollars per person. This ranges from5,520 international dollars in Tunisia to 99,280international dollars in the United Arab Emirates.
3.6 Costs of KRT
Figure 3.1 | Annual cost of KRT, by World Bank income group
Minimum Q1 Median Q3 Maximum |
HD Low income Lower-middle income Upper-middle income High income
PD
Low income Lower-middle income Upper-middle income High income
Transplantation1
Low income Lower-middle income Upper-middle income High income International Dollars2 0 25,000 50,000 75,000 100,000 $125,000
1 Transplantation costs are for the first year only. Data from low income countries are only available for HD.
2 Equivalent to the USD value in 2016
|
|
|
|
|
|
|
|
|
|

ISN Global Kidney Health Atlas | 2019 Desk research findings | 53
The average cost of maintenance PD increaseswith country income level. High income countrieshave the highest average cost of maintenance PD(32,109 international dollars), followed by upper-middle income countries (16,919 internationaldollars), and lower-middle income countries(11,633 international dollars). Only high incomecountries have an average cost above the globalaverage (Figure 3.1).
3.6.3 Kidney transplantation
Among all countries, 24% (n = 51) have dataavailable on the first-year costs of kidneytransplantation, most of which relate to transplantsurgery. Nearly half (49%, n = 25) of these arehigh-income countries. No low-income countrieshave data available. Overall, the global averagefirst-year cost of kidney transplantation is 25,356international dollars. Costs range from 3,285international dollars in Bangladesh to 114,220international dollars in France. The average first-year cost of kidney transplantation increases withcountry income level. High-income countries havethe highest average first-year cost of kidneytransplantation (43,901 international dollars),followed by upper-middle income countries(17,870 international dollars), and lower-middleincome countries (9,238 international dollars). Only
high income countries have an average cost abovethe global average (Figure 3.1).
3.6.4 Comparing costs of maintenanceHD with maintenance PD
In 59% of countries (n = 51), the annual perpatient cost ratio of maintenance HD tomaintenance PD exceeds 1, meaning PD is lessexpensive. Conversely, in 40% of countries (n =35), the annual per patient cost ratio is less than1, meaning HD is less expensive. The cost ratioequals 1 in only one country (Namibia), wherecosts of both treatments are similar. The costratio of maintenance HD to maintenance PDranges greatly from 0.43 in Bosnia andHerzegovina to 4.27 in Iceland. Data on HDand/or are not available for 11 countries, thus thecost ratio cannot be estimated. No low incomecountries have data to compare cost ratios.Among high income countries, 65% (n = 28)have HD to PD cost ratios greater than 1, and35% (n = 15) have cost ratios less than 1.Among upper-middle income countries, 62% (n =15) have cost ratios greater than 1, and 38% (n =9) have cost ratios less than 1. Among lower-middle income countries, 39% (n = 7) have costratios greater than 1, and 61% (n = 11) have costratios less than 1.

54 | ISN Global Kidney Health Atlas | 2019

ISN Global Kidney Health Atlas | 2019 | 55
SURVEY FINDINGS

56 | ISN Global Kidney Health Atlas | 2019

ISN Global Kidney Health Atlas | 2019 Survey response | 57
SURVEY RESPONSE
There was adequate representation based onnumber of countries and population size acrossregions (Appendix 1: Table A1.1). The affiliations ofsurvey respondents were: nephrologists (82%),non-nephrologist physicians (7%), health care
professionals (non-physician) (2%), administrators/policymakers (5%), and others affiliated with kidneydisease patient advocacy (3%) (Appendix 1: TableA1.2). The complete list of countries is provided inAppendix 2: Table A2.1.
A total of 160 countries responded to the survey, comprising 98% of the world’s population.
Participated in survey Did not participate in survey

58 | ISN Global Kidney Health Atlas | 2019

ISN Global Kidney Health Atlas | 2019 Health care finance and service delivery | 59
Nearly half (48%; n = 77) of all countries providepublic funding for non-dialysis CKD care, with28% charging patients no fees and 20%charging some fees (Table 4.1) at the point ofdelivery. Care is funded through a combination ofpublic and private systems in 48 countries(30%), and through multiple systems (i.e.,
government, NGOs, and communities) in 14countries (9%). Fees for CKD care are coveredby private systems and out-of-pocketexpenditures in 12 countries, and solely byprivate systems through health insurance in just1 country (Liechtenstein). Other funding modelsare used in 7 countries (4%).
SECTION 4
HEALTH CARE FINANCE AND SERVICE DELIVERY
Publicly funded by
government and free at the point of delivery
N (%)
Publicly funded by
government with some fees
at the point of delivery
N (%)
Mix of public and private
funding systems
N (%)
Solely private and
out-of-pocketN (%)
Solely privatethrough health
insuranceproviders
N (%)
Multiple systemsprograms
provided by government,NGOs, and
communitiesN (%)
OtherN (%)
Table 4.1 | Funding models for non-dialysis CKD
Overall 45 (28) 32 (20) 48 (30) 12 (8) 1 (1) 14 (9) 7 (4)
ISN region
Africa 6 (14) 9 (21) 13 (31) 6 (14) 0 (0) 5 (12) 3 (7)
Eastern & Central Europe 11 (58) 4 (21) 3 (16) 0 (0) 0 (0) 0 (0) 1 (5)
Latin America 1 (6) 1 (6) 11 (61) 1 (6) 0 (0) 3 (17) 1 (6)
Middle East 7 (64) 1 (9) 3 (27) 0 (0) 0 (0) 0 (0) 0 (0)
NIS & Russia 4 (44) 1 (11) 1 (11) 2 (22) 0 (0) 1 (11) 0 (0)
North America 2 (20) 1 (10) 6 (60) 1 (10) 0 (0) 0 (0) 0 (0)
North & East Asia 2 (29) 2 (29) 2 (29) 0 (0) 0 (0) 1 (14) 0 (0)
OSEA 3 (20) 2 (13) 6 (40) 1 (7) 0 (0) 2 (13) 1 (7)
South Asia 1 (14) 1 (14) 2 (29) 1 (14) 0 (0) 2 (29) 0 (0)
Western Europe 8 (38) 10 (48) 1 (5) 0 (0) 1 (5) 0 (0) 1 (5)
World Bank income group
Low income 3 (13) 2 (9) 6 (26) 5 (22) 0 (0) 4 (17) 3 (13)
Lower-middle income 7 (19) 9 (24) 8 (22) 6 (16) 0 (0) 5 (14) 2 (5)
Upper-middle income 12 (29) 5 (12) 20 (49) 0 (0) 0 (0) 4 (10) 0 (0)
High income 23 (40) 16 (28) 14 (24) 1 (2) 1 (2) 1 (2) 2 (3)
4.1 Healthcare system and funding mechanism
Rows may not total to 100% due to rounding.

Compared to the global average, countries inEastern and Central Europe, the Middle East, NISand Russia, North and East Asia, and WesternEurope provide more public funding, whereascountries in Africa, Latin America, North America,OSEA, and South Asia provide less public funding(Table 4.1).
Public funding for non-dialysis CKD care is moreprevalent in high income countries (68%) than inupper-middle (41%), lower-middle (43%) and lowincome countries (22%) (Table 4.1). Low incomecountries report the highest use of private funding(22%), followed by lower-middle (16%), high (1%),and upper-middle (0%) income countries.
Public funding for KRT (i.e., dialysis andtransplantation) is more common than for non-dialysis CKD care (Table 4.2). Overall, 64% (n =102) of countries provide public funding for KRT,with 43% charging no fees at the point of delivery
and 21% charging some fees. Care is fundedthrough a mix of public and private systems in 34countries (21%) and through multiple systems(government, NGOs, and communities) in 10countries (6%). Fees for KRT are covered byprivate systems and/or out-of-pocket expendituresin 7 countries, and exclusively by health insuranceproviders in just 1 country (Liechtenstein). Otherfunding models are used in 4 countries (3%).
Compared to the global average, countries inEastern and Central Europe, the Middle East, NISand Russia, North and East Asia, and WesternEurope provide more public funding, whereascountries in Africa, Latin America, North America,OSEA, and South Asia provide less public funding(Table 4.2). Overall, public funding for KRT is moreprevalent in high income countries (78%) than inupper-middle (61%), lower-middle (57%) or low(48%) income countries (Table 4.2).
60 | Health care finance and service delivery ISN Global Kidney Health Atlas | 2019
Publicly funded by
government and free at the point of delivery
N (%)
Publicly funded by
government with some fees
at the point of delivery
N (%)
Mix of public and private
funding systemsN (%)
Solely private and
out-of-pocketN (%)
Solely privatethrough health
insuranceproviders
N (%)
Multiple systemsprograms
provided by government,NGOs, and
communitiesN (%)
OtherN (%)
Table 4.2 | Funding models for KRT
Overall 68 (43) 34 (21) 34 (21) 7 (4) 1 (1) 10 (6) 4 (3)
ISN region
Africa 11 (26) 11 (26) 12 (29) 3 (7) 0 (0) 3 (7) 1 (2)
Eastern & Central Europe 15 (79) 1 (5) 2 (11) 0 (0) 0 (0) 0 (0) 1 (5)
Latin America 4 (22) 3 (17) 9 (50) 1 (6) 0 (0) 1 (6) 0 (0)
Middle East 10 (91) 1 (9) 0 (0) 0 (0) 0 (0) 0 (0) 0 (0)
NIS & Russia 6 (67) 2 (22) 0 (0) 0 (0) 0 (0) 0 (0) 1 (11)
North America 2 (20) 0 (0) 7 (70) 1 (10) 0 (0) 0 (0) 0 (0)
North & East Asia 1 (14) 5 (71) 1 (14) 0 (0) 0 (0) 0 (0) 0 (0)
OSEA 4 (27) 5 (33) 2 (13) 1 (7) 0 (0) 3 (20) 0 (0)
South Asia 1 (14) 1 (14) 1 (14) 1 (14) 0 (0) 3 (43) 0 (0)
Western Europe 14 (67) 5 (24) 0 (0) 0 (0) 1 (5) 0 (0) 1 (5)
World Bank income group
Low income 5 (22) 6 (26) 5 (22) 4 (17) 0 (0) 1 (4) 1 (4)
Lower-middle income 11 (30) 10 (27) 6 (16) 2 (5) 0 (0) 7 (19) 1 (3)
Upper-middle income 18 (44) 7 (17) 15 (37) 0 (0) 0 (0) 1 (2) 0 (0)
High income 34 (59) 11 (19) 8 (14) 1 (2) 1 (2) 1 (2) 2 (3)
Rows may not total to 100% due to rounding.

ISN Global Kidney Health Atlas | 2019 Health care finance and service delivery | 61
Among the 142 countries that provide at leastpartial public funding for KRT, 75% cover allresidents (Table 4.3). Universal coverage is morecommon in countries located in Eastern andCentral Europe, Latin America, NIS and Russia,North and East Asia, OSEA, and Western Europethan in countries located in Africa, the MiddleEast, North America, and South Asia.
In public funding models, universal coverage forKRT increases with income level (Table 4.3).Among high income countries, 87% provideuniversal coverage, compared to 75% of upper-middle, 70% of lower-middle, and 50% of lowincome countries.
Among countries that provide at least partialpublic funding for KRT, 45% cover all aspectsof treatment. Other countries exclude specificaspects of care from coverage, including:management of associated complications suchas anemia, bone disease, and malnutrition(20%); conservative kidney care (19%);transplantation (17%); dialysis (3%); and otheraspects of care (8%).
All countries with public funding systems coverdialysis except for 25% of countries in NIS andRussia, 8% of countries in OSEA, and 3% ofcountries in Africa (Figure 4.1). Countries inSouth Asia, North America, Africa, and NIS andRussia are more likely to exclude transplantationfrom publicly funded services compared tothose in Latin America, OSEA, Eastern andCentral Europe, the Middle East, and North andEast Asia. Conservative care is more commonlyexcluded from publicly funded services incountries in South Asia, NIS and Russia, Africa,OSEA, and Latin America, compared tocountries in Eastern and Central Europe, NorthAmerica, the Middle East, North and East Asia,and Western Europe. Management ofassociated complications (i.e., anemia, bonedisease, malnutrition) is excluded from publiccoverage more often in countries in South Asia,NIS and Russia, Africa, and North America, thanin North and East Asia, OSEA, Latin America,Eastern and Central Europe, Western Europe,
and the Middle East. Countries in Eastern andCentral Europe, the Middle East, North and EastAsia, and Western Europe are more likely toinclude all elements of kidney care in publiccoverage, compared to countries in OSEA,Latin America, South Asia, Africa, NIS andRussia, and North America (Figure 4.1).
High income countries are more likely toprovide public funding for all elements of KRT(75%) compared to upper-middle (43%),lower-middle (19%), and low (0%) incomecountries (Figure 4.2). Dialysis is covered in allhigh and low income countries and isexcluded from coverage in 10% of lower-middle and 3% of upper-middle incomecountries. Transplantation is excluded in just2% of high income countries, compared to15% of upper-middle, 26% of lower-middle,and 50% of low income countries (Figure 4.2).
Table 4.3 | Extent of universal coverage for KRTin countries with publicly funded systems
Countriescovering
all residents N (%)
Countries not covering all residents
N (%)
Overall 107 (75) 35 (25)
ISN region
Africa 20 (56) 16 (44)
Eastern & Central Europe 18 (100) 0 (0)
Latin America 14 (88) 2 (13)
Middle East 3 (27) 8 (73)
NIS & Russia 8 (100) 0 (0)
North America 5 (56) 4 (44)
North & East Asia 6 (86) 1 (14)
OSEA 11 (92) 1 (8)
South Asia 3 (50) 3 (50)
Western Europe 19 (100) 0 (0)
World Bank income group
Low income 8 (50) 8 (50)
Lower-middle income 23 (70) 10 (30)
Upper-middle income 30 (75) 10 (25)
High income 46 (87) 7 (13)
Rows may not total to 100% due to rounding.

62 | Health care finance and service delivery ISN Global Kidney Health Atlas | 2019
n African Eastern & Central Europen Latin America n Middle Eastn NIS & Russian North American North & East Asian OSEA n South Asian Western Europe
Dialysis
3%0%0%0%
25%0%0%
8%0%0%
Transplantation
37%0%0%0%
25%44%
0%8%
50%0%
Conservative kidney care1
23%12%
19%11%
50%11%
0%23%
83%0%
Management of associated complications2
37%0%
13%0%
50%22%
14%8%
67%5%
Other
6%0%
6%0%
25%22%
0%15%
0%11%
None – all aspects funded
14%82%
31%89%
13%0%
86%38%
17%89%
Figure 4.1 | Aspects of KRT excluded from public funding, by ISN region
1 Renal palliative supportive services.2 Anemia, bone disease, malnutrition.
n Low income n Lower-middle income n Upper-middle income n High income
Dialysis
0%10%
3%0%
Transplantation
50%26%
15%2%
Conservative kidney care1
25%45%
15%6%
Management of associated complications2
50%42%
13%4%
Other
0%6%
13%8%
None – all aspects funded
0%19%
43%75%
Figure 4.2 | Aspects of KRT excluded from public funding, by World Bank income group
1 Renal palliative supportive services.2 Anemia, bone disease, malnutrition.

ISN Global Kidney Health Atlas | 2019 Health care finance and service delivery | 63
Figure 4.3 | Funding models for KRT-related surgical services, by ISN region
n Publicly funded by government and free at the point of delivery (%)n Publicly funded by government with some fees at the point of delivery (%)n Mix of public and private funding systems (%) n Soley private and out-of-pocket (%)n Soley private through health insurance providers (%)n Multiple systems – programs provided by government, NGOs, and communities (%)n Not applicable (KRT not available in my country) (%)n Other (%)
Vascular access for HD (central venous catheter)
Africa Eastern & Central Europe Latin America Middle East NIS & Russia North America North & East Asia OSEA South Asia Western Europe
Vascular access for HD (fistula or graft creation)
Africa Eastern & Central Europe Latin America Middle East NIS & Russia North America North & East Asia OSEA South Asia Western Europe
Access surgery for PD (catheter insertion)
Africa Eastern & Central Europe Latin America Middle East NIS & Russia North America North & East Asia OSEA South Asia Western Europe
Surgery for kidney transplantation
Africa Eastern & Central Europe Latin America Middle East NIS & Russia North America North & East Asia OSEA South Asia Western Europe
1.45

64 | Health care finance and service delivery ISN Global Kidney Health Atlas | 2019
Worldwide, 60% of countries report no regionalvariation in how ESKD care is delivered (Table4.4). Within-country variation is highest in OSEA,Africa, South Asia, and North America. Regionalvariation in care delivery is more likely in lowincome countries (65%) than in lower-middle(49%), upper-middle (46%), and high (18%)income countries (Figure 4.4).
Similarly, variation in the ESKD care delivered tochildren vs. that delivered to adults is morecommon in low income countries (61%) comparedto lower-middle (39%), upper-middle (20%) andhigh (19%) income countries (Figure 4.5). Accessto KRT varies between children and adults in 57%of low, 39% of lower-middle, 12% of upper-middle,and 9% of high income countries (Figure 4.6).
Coverage for surgical services for KRT, includingcreation of fistulas, grafts, and central venouscatheters (CVCs) for HD, catheter insertion for PD,and kidney transplantation varies worldwide. Overhalf of all countries provide public funding (eithercompletely free or with some fees at the point ofcare delivery) for surgery to create vascular accessfor HD: 58% cover CVC insertion, and 54% coverfistula or graft creation. Countries in Eastern andCentral Europe, the Middle East, NIS and Russia,North and East Asia, and Western Europe havehigher coverage rates for these services thancountries in Africa, Latin America, North America,OSEA, and South Asia (Figure 4.3).
Surgery to create access for PD (i.e., catheterinsertion) is publicly funded (either completely
free or with some fees at the point of caredelivery) in 54% of countries. Countries inEastern and Central Europe, the Middle East,NIS and Russia, North and East Asia, OSEA,and Western Europe have higher coverage ratesthan countries in Africa, Latin America, NorthAmerica, and South Asia (Figure 4.3).
Kidney transplantation surgery is publiclyfunded (either completely free or with somefees at the point of care delivery) in 53% ofcountries. Countries in Eastern and CentralEurope, the Middle East, NIS and Russia, Northand East Asia, and Western Europe havehigher coverage rates compared to countries inAfrica, Latin America, North America, OSEA,and South Asia.
4.2 Within-country variation in ESKD care delivery
Table 4.4 | Within country variation inESKD care delivery
Reportedvariation
N (%)
Reportedno
variation N (%)
Overall 62 (40) 95 (60)
ISN region
Africa 26 (62) 16 (38)
Eastern & Central Europe 4 (21) 15 (79)
Latin America 6 (33) 12 (67)
Middle East 1 (9) 10 (91)
NIS & Russia 2 (22) 7 (78)
North America 4 (44) 5 (56)
North & East Asia 1 (14) 6 (86)
OSEA 10 (67) 5 (33)
South Asia 4 (57) 2 (29)
Western Europe 4 (19) 17 (81)
World Bank income group
Low income 15 (65) 7 (30)
Lower-middle income 18 (49) 19 (51)
Upper-middle income 19 (46) 22 (54)
High income 10 (18) 47 (82)
Totals for South Asia and low income rows do not total 100% as data areunknown for one country (Afghanistan).
Figure 4.4 | Within-country variation in ESKDcare delivery, by World Bank income group
n Yes (%) n No (%) n Unknown (%)
Low income Lower-middle income Upper-middle income High income
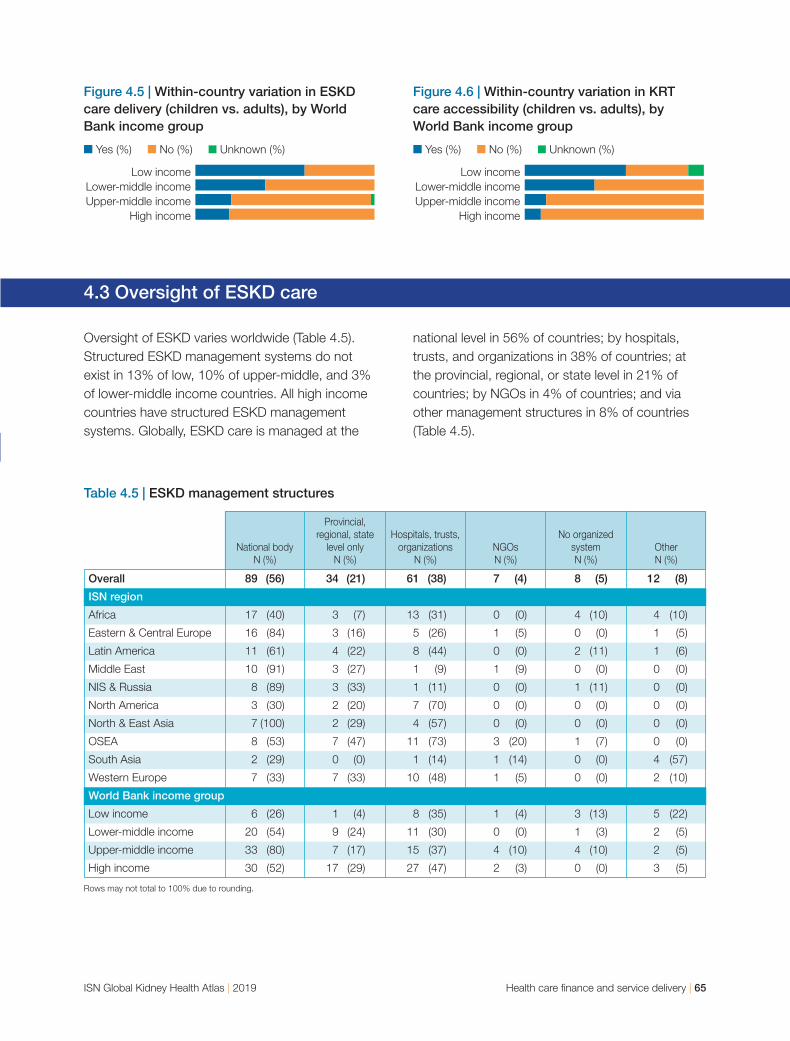
ISN Global Kidney Health Atlas | 2019 Health care finance and service delivery | 65
Figure 4.6 | Within-country variation in KRTcare accessibility (children vs. adults), byWorld Bank income group
n Yes (%) n No (%) n Unknown (%)
Low income Lower-middle income Upper-middle income High income
Figure 4.5 | Within-country variation in ESKDcare delivery (children vs. adults), by WorldBank income group
n Yes (%) n No (%) n Unknown (%)
Low income Lower-middle income Upper-middle income High income
4.3 Oversight of ESKD care
Oversight of ESKD varies worldwide (Table 4.5).Structured ESKD management systems do notexist in 13% of low, 10% of upper-middle, and 3%of lower-middle income countries. All high incomecountries have structured ESKD managementsystems. Globally, ESKD care is managed at the
national level in 56% of countries; by hospitals,trusts, and organizations in 38% of countries; atthe provincial, regional, or state level in 21% ofcountries; by NGOs in 4% of countries; and viaother management structures in 8% of countries(Table 4.5).
National bodyN (%)
Provincial,regional, state
level onlyN (%)
Hospitals, trusts,organizations
N (%)NGOsN (%)
No organizedsystemN (%)
Other N (%)
Table 4.5 | ESKD management structures
Overall 89 (56) 34 (21) 61 (38) 7 (4) 8 (5) 12 (8)
ISN region
Africa 17 (40) 3 (7) 13 (31) 0 (0) 4 (10) 4 (10)
Eastern & Central Europe 16 (84) 3 (16) 5 (26) 1 (5) 0 (0) 1 (5)
Latin America 11 (61) 4 (22) 8 (44) 0 (0) 2 (11) 1 (6)
Middle East 10 (91) 3 (27) 1 (9) 1 (9) 0 (0) 0 (0)
NIS & Russia 8 (89) 3 (33) 1 (11) 0 (0) 1 (11) 0 (0)
North America 3 (30) 2 (20) 7 (70) 0 (0) 0 (0) 0 (0)
North & East Asia 7 (100) 2 (29) 4 (57) 0 (0) 0 (0) 0 (0)
OSEA 8 (53) 7 (47) 11 (73) 3 (20) 1 (7) 0 (0)
South Asia 2 (29) 0 (0) 1 (14) 1 (14) 0 (0) 4 (57)
Western Europe 7 (33) 7 (33) 10 (48) 1 (5) 0 (0) 2 (10)
World Bank income group
Low income 6 (26) 1 (4) 8 (35) 1 (4) 3 (13) 5 (22)
Lower-middle income 20 (54) 9 (24) 11 (30) 0 (0) 1 (3) 2 (5)
Upper-middle income 33 (80) 7 (17) 15 (37) 4 (10) 4 (10) 2 (5)
High income 30 (52) 17 (29) 27 (47) 2 (3) 0 (0) 3 (5)
Rows may not total to 100% due to rounding.

66 | ISN Global Kidney Health Atlas | 2019

ISN Global Kidney Health Atlas | 2019 Health workforce for nephrology care | 67
Nephrologists are primarily responsible forESKD care delivery in 92% of countries; inrelatively few countries ESKD care also isprovided by primary care physicians (in 22% ofcountries), multidisciplinary teams (19%), nursepractitioners (15%), health care extensionworkers (1%; 2 countries: Lao PDR andTajikistan), and other providers (2%; 3 countries:Eritrea, Fiji, and Pakistan) (Figure 5.1).
Worldwide, the median number of nephrologistsis 9.95 pmp (Map 5.1). Nephrologists are moreprevalent in Western Europe (24.4 pmp),Eastern and Central Europe (25.6 pmp), Northand East Asia (19.5 pmp), North America (18.1pmp), and NIS and Russia (14.4 pmp) than inLatin America (9.8 pmp), the Middle East (8.1pmp), OSEA (5.7 pmp), South Asia (1.2 pmp),and Africa (0.6 pmp). The prevalence ofnephrologists increases with country income,with low income countries reporting the lowestprevalence (0.2 pmp), followed by lower-middle(1.6 pmp), upper-middle (10.8), and high (23.2pmp) income countries.
The median number of nephrology trainees is 1.4pmp (Map 5.2). Nephrology trainees are moreprevalent in Western Europe (5.8 pmp), Easternand Central Europe (3.3 pmp), North and EastAsia (3.2 pmp), the Middle East (1.8 pmp), NISand Russia (1.6 pmp), and Latin America (1.4pmp) than in North America (Canada and theUnited States only) (1.7 pmp), OSEA (1.0 pmp),Africa (0.4 pmp), and South Asia (0.3 pmp). Theprevalence of nephrology trainees increases withcountry income, with low income countriesreporting the lowest prevalence (0.1 pmp),followed by lower-middle (0.6 pmp), upper-middle(1.2 pmp), and high (3.7 pmp) income countries.
SECTION 5
HEALTH WORKFORCE FORNEPHROLOGY CARE
5.1 Clinical responsibility
5.2 Workforce
Figure 5.1 | Health care providers primarilyresponsible for ESKD care
Nephrologists
92%
Primary care physicians
22%
Nurse practitioners or specialized nurses
15%
Health officers or extension workers
1%
Other
2%

68 | Health workforce for nephrology care ISN Global Kidney Health Atlas | 2019
Most countries have critical shortages of healthcare providers essential for ESKD care. Manycountries do not have enough nephrologists(70%); interventional radiologists for HD access(66%) or PD access (53%); surgeons fortransplantation (65%), HD access (65%), and PDaccess (53%); vascular access coordinators(63%); counselors or psychologists (57%); dialysisnurses (57%); laboratory technicians (55%);transplant coordinators (54%); dialysis technicians(49%); radiologists (ultrasound technicians) (20%);and dietitians (19%) (Figure 5.2). Only sevencountries (Cuba, Cyprus, Finland, Kenya,Liechtenstein, New Caledonia, and Spain) reportno shortages of any provider type. Over 90% of
low income countries have shortages ofnephrologists, interventional radiologists,surgeons, and transplant coordinators (Figure5.3). Over 80% of lower-middle income countrieshave shortages of nephrologists, interventionalradiologists (HD access only), and vascularaccess coordinators. In upper-middle incomecountries, the most common shortages are forinterventional radiologists (HD access only) (80%),transplant surgeons (76%), vascular accesscoordinators (71%), surgeons (HD access) (68%),and nephrologists (66%). In high incomecountries, the most common shortages are fornephrologists (53%), surgeons (HD access)(46%), and dialysis nurses (44%) (Figure 5.3).
Map 5.1 | Global prevalence of nephrologistsRate per million population (pmp)
<1.2 pmp 1.2–10.0 pmp 10.1–22.9 pmp >22.9 pmp Data not reported

ISN Global Kidney Health Atlas | 2019 Health workforce for nephrology care | 69
Figure 5.2 | Shortages of health care providers essential for ESKD care
Nephrologists
70%
Interventional radiologists (HD access)
66%
Surgeons (HD access)
65%
Transplant surgeons
65%
Vascular access coordinators
63%
Dialysis nurses
57%
Counselors, psychologists
57%
Map 5.2 | Global prevalence of nephrology traineesRate per million population (pmp)
<0.3 pmp 0.3–1.4 pmp 1.5–3.7 pmp >3.7 pmp Data not reported
Laboratory technicians
55%
Transplant coordinators
54%
Interventional radiologists (PD access)
53%
Surgeons (PD access)
51%
Dialysis technicians
49%
Radiologists
20%
Dietitians
19%

70 | Health workforce for nephrology care ISN Global Kidney Health Atlas | 2019
Figure 5.3 | Shortages of health care providers essential for ESKD care, by World Bank income group
n Low income n Lower-middle income n Upper-middle income n High income
Nephrologists
95%86%
66%53%
Transplant surgeons
95%78%
76%39%
Surgeons (HD access)
91%75%
68%46%
Surgeons (PD access)
95%61%
51%26%
Interventional radiologists (HD access)
95%81%80%
35%
Interventional radiologists (PD access)
91%72%
61%21%
Laboratory technicians
86%67%
54%37%
Dietitians
45%33%
20%0%
Radiologists (ultrasound)
36%31%
27%2%
Vascular access coordinators
82%81%
71%39%
Counselors, psychologists
86%75%
54%37%
Transplant coordinators
91%78%
61%21%
Dialysis nurses
68%72%
56%44%
Dialysis technicians
73%75%
54%19%

Chronic HD services are available in all countriesthat completed the survey (Figures 6.1, 6.2), andchronic PD services are available in 119 countries(76%), including all countries in North and EastAsia and Western Europe, and most countries inEastern and Central Europe (95%), Latin America(89%), South Asia (86%), the Middle East (82%),OSEA (80%), North America (78%), and NIS and
Russia (75%) (Figure 6.1). Chronic PD servicesare available in less than half of the countries inAfrica (41%). Access to chronic PD increaseswith country income (Figure 6.2); chronic PD isaccessible in just 23% of low income countries,compared to 61% of lower-middle, 90% ofupper-middle, and 96% of high income countries(Figure 6.2).
SECTION 6
ACCESS TO ESSENTIALMEDICATIONS AND HEALTH PRODUCTS
6.1. Capacity for KRT service provision
ISN Global Kidney Health Atlas | 2019 Access to essential medications and health products | 71
Figure 6.1 | Availability of chronic dialysis and kidney transplantation services, by ISN region
n Available (%) n Not available (%)
Chronic HD Chronic PD Kidney transplantation
Africa Eastern & Central Europe Latin America Middle East NIS & Russia North America North & East Asia OSEA South Asia Western Europe
.2p1.4
Figure 6.2 | Availability of chronic dialysis and kidney transplantation services,by World Bank income group
n Available (%) n Not available (%)
Chronic HD Chronic PD Kidney transplantation
Low income Lower-middle income Upper-middle income High income

72 | Access to essential medications and health products ISN Global Kidney Health Atlas | 2019
Kidney transplantation services are available in114 countries (74%), including all countries in theMiddle East, NIS and Russia, and North andEast Asia, and most countries in Eastern andCentral Europe (95%), Latin America (94%),Western Europe (90%), South Asia (86%), OSEA(67%), and North America (56%). Only 34% ofcountries in Africa offer kidney transplantationservices (Figure 6.1). Similarly, accessibility ofkidney transplantation services increases withincome level (Figure 6.2); kidney transplantationis accessible in only 23% of low incomecountries, compared to 69% of lower-middle,83% of upper-middle, and 89% of high incomecountries (Figure 6.2).
Among the countries with chronic HD services,the global average is 4.5 centers pmp (Map 6.1).Countries with the highest HD center densityinclude New Caledonia (47.7 pmp), Liechtenstein(35.9 pmp), Taiwan (35.4 pmp), Japan (34.8pmp), the Cayman Islands (33.6 pmp), and theBritish Virgin Islands (27.9 pmp). Countries withthe lowest density include Mozambique (0.1pmp), Chad (0.1 pmp), and Burundi, the Congo,Ethiopia, Guinea, Madagascar, Niger, andUganda (all 0.2 pmp) (Map 6.1).
Among the countries with chronic PD services, theglobal average is 1.3 centers pmp (Map 6.2).Countries with the highest PD center densityinclude New Caledonia (26.5 pmp), Liechtenstein
Map 6.1 | Availability of centers that provide chronic HDRate per million population (pmp)
<1.2 pmp 1.2–4.5 pmp 4.6–9.9 pmp >9.9 pmp Data not reported

(25.9 pmp), Nevis (18.8 pmp), and the Cayman
Islands (16.8 pmp). Countries with the lowest
density include Pakistan (0.01 pmp), the Congo
(0.02 pmp), Angola (0.03 pmp), Bangladesh (0.04
pmp), Cote d’Ivoire (0.04 pmp), Mozambique
(0.04 pmp), and Malawi (0.05 pmp) (Map 6.2).
Among the countries with kidney transplantation
services, the global average is 0.4 centers pmp
(Map 6.3). Countries with the highest densities
include: Antigua and Barbuda (10.4 centers pmp);
Iceland (5.8 centers pmp); Malta (2.2 centers
pmp); Brunei Darussalam (2.22 centers pmp);
Macau SAR, China (1.7 centers pmp); and Mexico
(1.4 centers pmp) (Map 6.3).
Among the countries where kidneytransplantation is available, sources of donatedkidneys vary: kidneys from a combination ofdeceased and living donors are used in 82countries (72%); kidneys only from living donorsare used in 32 countries (28%). No countriesuse kidneys only from deceased donors.Among countries with transplantation services,all 5 low income countries (Afghanistan,Ethiopia, Haiti, Nepal, Tanzania) only usekidneys from living donors, compared to 62%of lower-middle, 24% of upper-middle, and 8%of high income countries. Kidneys from acombination of living and deceased donors areused in 92% of high, 76% of upper-middle, and
ISN Global Kidney Health Atlas | 2019 Access to essential medications and health products | 73
Map 6.2 | Availability of centers that provide chronic PDRate per million population (pmp)
Chronic PD not provided <0.4 pmp 0.4–1.3 pmp 1.4–2.5 pmp >2.5 pmp Data not reported

74 | Access to essential medications and health products ISN Global Kidney Health Atlas | 2019
38% of lower-middle income countries withthese services (Figure 6.3).
Among the countries that offer kidneytransplantation, 62% have nationaltransplantation waitlists, 19% only have regionalwaitlists, and 19% have no waitlist. Among the 5low income countries with kidney transplantationservices, 1 country (Afghanistan) has a regionalwaitlist and the other 4 have no waitlist (Figure6.4). National waitlists are most common in highincome (90%) and upper-middle (68%) incomecountries. Among lower-middle incomecountries, only 2 (8%) have national waitlists,and more than half do not have any type ofwaitlist (Figure 6.4).
Map 6.3 | Availability of centers that perform kidney transplantationRate per million population (pmp)
Kidney transplantation not provided <0.2 pmp 0.2–0.4 pmp 0.5–0.7 pmp >0.7 pmpData not reported
Figure 6.4 | Type of kidney transplantationwaitlist, by World Bank income group
n National (%) n Regional only (%) n None (%)
Low income Lower-middle income Upper-middle income High income
Figure 6.3 | Source of donated kidneys, byWorld Bank income group
n Living donor kidney transplant only (%)n A combination of deceased and living donor kidney transplant (%)
Low income Lower-middle income Upper-middle income High income

ISN Global Kidney Health Atlas | 2019 Access to essential medications and health products | 75
Availability of services for ESKD care variesglobally. Hemoglobin measurement services aregenerally available in most countries. All countries(100%) have the capacity to measure serumhemoglobin, 98% have the capacity to provideoral iron supplementation, 85% have the capacityto measure inflammatory markers (e.g., serum C-reactive protein [CRP]), 84% have the capacity toadminister erythropoietin, 83% have the capacityto administer parenteral (intravenous) iron, and74% have the capacity to monitor ironparameters (Figure 6.5).
The capacity to manage renal bone disease alsovaries. Among the countries participating in thesurvey, the vast majority have the capacity tomeasure serum calcium (92%) and serumphosphorous (86%) and to administer calcium-phosphate binders (85%), whereas relatively fewercountries have the capacity to administer non-calcium-based phosphate binders (47%) andcinacalcet (37%). Overall, 65% of countries havethe capacity to measure serum parathyroidhormone and 56% are able to provide surgicalservices for parathyroidectomy (Figure 6.5).
6.2 Availability of services for ESKD care
Figure 6.5 | Availability of services for ESKD care
n Generally available1 (%) n Generally not available2 (%) n Never available (%) n Unknown (%)
Management of hemoglobin level
Measurement of serum hemoglobin Measurement of iron parameters3 Measurement of inflammatory markers4 Oral iron Parenteral iron Erythropoietin
Management of renal bone disease
Measurement of serum calcium Measurement of serum phosphorus Measurement of serum parathyroid hormone Calcium-based phosphate binders Non-calcium-based phosphate binders5 Cinacalcet Surgical services for parathyroidectomy
Management of electrolyte disorders and chronic metabolic acidosis
Measurement of serum electrolytes6 Measurement of serum bicarbonate Potassium exchange resins7 Oral sodium bicarbonate
Management of blood pressure
Analog monitoring Automated monitoring
1 Generally available: in 50% or more centers (hospitals or clinics)2 Generally not available: in less than 50% of centers (hospitals or clinics)3 Iron, ferritin, transferrin saturation4 e.g., serum C-reactive protein5 e.g., sevelamer6 e.g., sodium, potassium, chloride7 e.g., kayexalate

The capacity to manage electrolyte disorders andchronic metabolic acidosis is high in most countries(Figure 6.5). Nearly all countries (95%) have thecapacity to measure serum electrolytes and 83%have the capacity to measure serum bicarbonate.Nearly three-quarters (72%) of countries have thecapacity to administer oral sodium bicarbonate andnearly two-thirds (62%) of countries have thecapacity to administer potassium exchange resins(for example, Kayexalate).
In most countries (93%), blood pressure ismonitored through analog techniques (Figure 6.5).Management of blood pressure through automatedblood pressure monitoring is less common, but stillgenerally available in 79% of countries.
Irrespective of income level, all countries have thecapacity to measure serum hemoglobin levelsand nearly all administer oral iron (Figure 6.6.1).The capacity to measure iron parametersincreases with income level: this service is offeredin 41% of low income countries, compared to49% of lower-middle, 83% of upper-middle and96% of high income countries (Figure 6.6.1). Thecapacities to administer parenteral iron anderythropoietin are also lower in low incomecountries; these services are generally available injust 41% and 45% of countries, respectively(Figure 6.6.1).
The capacity to measure serum parathyroidhormone for renal bone disease management istied to country income level; these services aregenerally available in just 27% of low and 31% oflower-middle income countries. Similarly, surgicalservices for parathyroidectomy are generallyavailable in only 27% of low and 23% of lower-middle income countries. Cinacalcet is lessavailable in low, lower-middle, and upper-middleincome countries compared to high incomecountries, as are non-calcium-based phosphatebinders (Figure 6.6.2).
Measurement of serum electrolytes to manageelectrolyte disorders and chronic metabolicacidosis is commonly available in most countries,irrespective of income (Figure 6.6.3). Thecapacity to measure serum bicarbonate exists in95% of high, 85% of upper-middle, 69% oflower-middle, and 59% of low income countries.Potassium exchange resins are less available inlow income countries, as is oral sodiumbicarbonate (Figure 6.6.3).
Analog blood pressure monitoring is available inmost countries, irrespective of income (Figure6.6.4). Automated blood pressure monitoring isgenerally available in 98% of high, 73% of low,71% of upper-middle, and 60% of lower-middleincome countries (Figure 6.6.4).
76 | Access to essential medications and health products ISN Global Kidney Health Atlas | 2019
Figure 6.6.1 | Management of hemoglobin level, by World Bank income group
n Generally available1 (%) n Generally not available2 (%) n Never available (%) n Unknown (%)
Measurement of Measurement of Measurement of serum hemoglobin iron parameters3 inflammatory markers4
Low income Lower-middle income Upper-middle income High income
Oral iron Parenteral iron Erythropoietin
Low income Lower-middle income Upper-middle income High income
1 Generally available: in 50% or more centers (hospitals or clinics)2 Generally not available: in less than 50% of centers (hospitals or clinics)3 Iron, ferritin, transferrin saturation4 e.g., serum C-reactive protein

ISN Global Kidney Health Atlas | 2019 Access to essential medications and health products | 77
Figure 6.6.2 | Management of renal bone disease, by World Bank income group
n Generally available1 (%) n Generally not available2 (%) n Never available (%) n Unknown (%)
Measurement of Measurement of Measurement of serum calcium serum phosphorus serum parathyroid hormone
Low income Lower-middle income Upper-middle income High income
Calcium-based Non-calcium-based phosphate binders phosphate binders3 Cinacalcet
Low income Lower-middle income Upper-middle income High income
Surgical services for parathyroidectomy
Low income Lower-middle income Upper-middle income High income
Figure 6.6.3 | Management of electrolyte disorders and chronic metabolic acidosis,by World Bank income group
n Generally available1 (%) n Generally not available2 (%) n Never available (%) n Unknown (%)
Measurement of Measurement of serum electrolytes4 serum bicarbonate Potassium exchange resins5
Low income Lower-middle income Upper-middle income High income
Oral sodium bicarbonate
Low income Lower-middle income Upper-middle income High income
Figure 6.6.4 | Management of blood pressure, by World Bank income group
n Generally available1 (%) n Generally not available2 (%) n Never available (%) n Unknown (%)
Analog monitoring Automated monitoring
Low income Lower-middle income Upper-middle income High income
1 Generally available: in 50% or more centers (hospitals or clinics)2 Generally not available: in less than 50% of centers (hospitals or clinics)3 e.g., sevelamer4 e.g., sodium, potassium, chloride5 e.g., kayexalate

78 | Access to essential medications and health products ISN Global Kidney Health Atlas | 2019
Overall, in 72% of countries with available dialysisservices, at least half of patients with ESKD areable to access dialysis at the onset of kidneyfailure. Accessibility is highest in Eastern andCentral Europe, Latin America, the Middle East,NIS and Russia, North America, North and EastAsia, and Western Europe (Figure 6.7).Accessibility is lowest in South Asia, Africa, andOSEA, where less than half of patients withESKD in 83%, 65%, and 33% of countries,respectively, are able to access dialysis at theonset of kidney failure (Figure 6.7).
Accessibility to dialysis at the onset of kidneyfailure increases with income level (Figure 6.8).Among countries with dialysis services available,accessibility in high (96%) and upper-middle(83%) income countries is higher than in lower-middle (61%) and low (5%) income countries.Low access to dialysis, defined as less than 10%of patients having access to dialysis at the onset
of kidney failure, exists in 76% of low incomecountries, compared to only 4% of high incomecountries (Figure 6.8).
Among countries with PD available, only 5countries (4%) reported PD as the initial treatmentfor more than half of ESKD patients: Eastern andCentral Europe (1 country: Croatia), Latin America(2 countries: El Salvador, Mexico), NIS and Russia(1 country: Azerbaijan), and North and East Asia(1 country: Hong Kong SAR) (Figure 6.9). Fivecountries (4%) reported that PD is never the initialtreatment: Africa (3 countries: Angola, Egypt,Zimbabwe), Latin America (1 country: Bolivia),and South Asia (1 country: Pakistan).
6.3 Accessibility of KRT
Figure 6.7 | Accessibility of KRT at the onsetof ESKD, by ISN region
n 1–10% n 11–25% n 26–50% n >50%
Africa Eastern & Central Europe Latin America Middle East NIS & Russia North America North & East Asia OSEA South Asia Western Europe
Figure 6.8 | Accessibility of KRT at the onsetof ESKD, by World Bank income group
n 1–10% n 11–25% n 26–50% n >50%
Low income Lower-middle income Upper-middle income High income
Figure 6.9 | Proportion of patients typicallyinitiating treatment with PD, by ISN region
n 0% n 1–10% n 11–25% n 26–50% n >50%
Africa Eastern & Central Europe Latin America Middle East NIS & Russia North America North & East Asia OSEA South Asia Western Europe

Irrespective of income level, the proportion ofESKD patients who initiate treatment with PD islow (typically < 50%). Among the 5 countriesreporting that ESKD treatment is never initiatedwith PD, 1 is low-income, 3 are lower-middleincome and 1 is upper-middle income (Figure6.10). Among the 5 countries reporting PD as theinitial treatment for more than half of ESKDpatients, 2 are high income, 2 are upper-middle,and 1 is lower-middle income (Figure 6.10).
Overall, accessibility to kidney transplantationservices is low. In 36% of countries that offerkidney transplantation, less than 11% of patientswho have ESKD and are suitable candidates fortransplants are able to access services. Access toexisting services is lowest in North and East Asia,South Asia, Africa, and OSEA (Figure 6.11). Access
is highest in Western Europe, Eastern and CentralEurope, and the Middle East (Figure 6.11).
Access to transplantation increases with acountry income level (Figure 6.12). In countrieswith available transplantation services, access islow (i.e., fewer than 11% of patients are able toaccess transplantation services in all low incomecountries), compared to 65% of lower-middle,36% of upper-middle, and 16% of high incomecountries. More than half (64%) of high incomecountries reports high access to care (i.e., atleast half of patients eligible for transplants areable to access services), compared to 30% ofupper-middle and 13% of lower-middle incomecountries. No low income countries reports highaccess to transplantation services (Figure 6.12).
Among countries with KRT available, accessto KRT services varies. The level of within-country variation due to geographiccharacteristics decreases with income level(Figure 6.13). In most high income countries,geographic variation is less common for HDand transplantation, and moderate for accessto PD services (Figure 6.13).
Figure 6.10 | Proportion of patients typicallyinitiating treatment with PD, by World Bankincome group
n 0% n 1–10% n 11–25% n 26–50% n >50%
Low income Lower-middle income Upper-middle income High income
Figure 6.11 | Accessibility1 of kidneytransplantation, by ISN region
n 1–10% n 11–25% n 26–50% n >50%
Africa Eastern & Central Europe Latin America Middle East NIS & Russia North America North & East Asia OSEA South Asia Western Europe
1 The proportion of ESKD patients suitable for transplant who are able toaccess it.
Figure 6.12 | Accessibility1 of kidneytransplantation, by World Bank income group
n 1–10% n 11–25% n 26–50% n >50%
Low income Lower-middle income Upper-middle income High income
1 The proportion of ESKD patients suitable for transplant who are able toaccess it.
ISN Global Kidney Health Atlas | 2019 Access to essential medications and health products | 79

80 | Access to essential medications and health products ISN Global Kidney Health Atlas | 2019
Access to KRT also varies depending on patientcharacteristics (e.g., gender, employment status).The level of within-country variation due topatient characteristics varies, but generally is
lowest in high income countries (Figure 6.14).Overall, variation due to patient characteristics(Figure 6.14) is lower than variation due togeographic characteristics (Figure 6.13).
Figure 6.13 | Within-country geographic variation in access to KRT, by World Bank income group
n Yes (%) n No (%) n Other (%)
HD PD Transplantation
Low income Lower-middle income Upper-middle income High income
Figure 6.14 | Variation in access to KRT based on patient characteristics, by World Bank income group
n Yes (%) n No (%) n Other (%)
HD PD Transplantation
Low income Lower-middle income Upper-middle income High income

ISN Global Kidney Health Atlas | 2019 Access to essential medications and health products | 81
Among the countries with HD available, 29%cover all treatment costs, including medications.Only 8% of countries require patients to pay forall costs out-of-pocket. Regions with the highestproportions of countries that exclusively cover allHD-related costs are Western Europe, NIS andRussia, Eastern and Central Europe, LatinAmerica, and South Asia (Figure 6.15). Treatmentcost coverage varies globally, and increases withincome level. Nearly half (41%) of high incomecountries cover all HD-related costs, comparedto 21% of upper-middle, 19% of lower-middle,and 28% of low income countries (Figure 6.16).
Among the countries with PD available, 29%cover all treatment costs, including medications.Only 7% of countries require patients to pay forall costs out-of-pocket. Regions with the highestproportions of countries that exclusively cover all
costs related to PD treatment are Africa, Easternand Central Europe, the Middle East, NIS andRussia, and Western Europe (Figure 6.15).Similarly, coverage of PD-related costs increaseswith income level (Figure 6.16). Among highincome countries, 38% exclusively cover costs,compared to 29% of upper-middle, 24% oflower-middle, and 0% of low income countries(Figure 6.16).
Among the countries with kidney transplantationavailable, 31% cover all treatment costsassociated with transplantation. Only 9% ofcountries require patients to pay for all costs out-of-pocket. Regions with the highest proportionsof countries that exclusively cover all costsrelated to transplantation are Eastern and CentralEurope, NIS and Russia, and Western Europe(Figure 6.15). Coverage of transplantation is
6.4 Affordability of KRT
Figure 6.15 | Proportion of treatment costs (including medications) paid directly by patients,by ISN region
n 0% n 1–25% n 26–50% n 51–75% n >75% n 100%
HD PD Transplantation
Africa Eastern & Central Europe Latin America Middle East NIS & Russia North America North & East Asia OSEA South Asia Western Europe
Figure 6.16 | Proportion of treatment costs (including medications) paid directly by patients,by World Bank income group
n 0% n 1–25% n 26–50% n 51–75% n >75% n 100%
HD PD Transplantation
Low income Lower-middle income Upper-middle income High income

82 | Access to essential medications and health products ISN Global Kidney Health Atlas | 2019
highest in high income countries, among which44% exclusively cover transplant-related costs,compared to 24% of upper-middle, 17% oflower-middle, and 20% of low income countries(Figure 6.16).
Co-payment levels (i.e., the proportion oftreatment costs covered by patients) varyworldwide across all three types of KRT. Within-country geographic variation in HD-relatedco-payment levels decreases as country incomelevel increases (Figure 6.17). For PD-related costs,within-country geographic variation is minimal,with no low income countries reporting geographicvariation and only 4% (n = 2) of high incomecountries reporting variation (Figure 6.17).Transplantation-related co-payment levels varygeographically within just 4% of high incomecountries, compared to 14% of upper-middle,
21% of lower-middle, and 14% of low incomecountries (Figure 6.17).
Co-payment levels also vary due to patientcharacteristics (e.g., age, gender, employmentstatus) but appear to be less associated with acountry’s income level than within-countrygeographic variation. HD-related co-paymentlevels vary due to patient characteristics in 26%of high, 29% of upper-middle, 40% of lower-middle, and 12% of low income countries (Figure6.18). PD-related co-payment levels vary due topatient characteristics in 19% of high, 15% ofupper-middle, 28% of lower-middle, and 13% oflow income countries (Figure 6.18). Similarly,transplant co-payment levels vary due to patientcharacteristics in 16% of high, 14% of upper-middle, 24% of lower-middle, and 13% of lowincome countries (Figure 6.18).
Figure 6.18 | Variation in co-payments for KRT based on patient characteristics,by World Bank income group
n Yes (%) n No (%) n Other (%)
HD PD Transplantation
Low income Lower-middle income Upper-middle income High income
Figure 6.17 | Within-country geographic variation in co-payments forKRT, by World Bank income group
n Yes (%) n No (%) n Other (%)
HD PD Transplantation
Low income Lower-middle income Upper-middle income High income

ISN Global Kidney Health Atlas | 2019 Access to essential medications and health products | 83
Among the countries that offer dialysis, 61% providegovernmental funding for patients’ medications; ofthese countries, 41% charge patients no fees at thepoint of delivery and 21% charge some fees at thepoint of delivery. In contrast, 11% fund medicationsfor dialysis patients exclusively though privatesources. Funding models vary globally. All countriesin Eastern and Central Europe cover dialysispatients’ medications exclusively throughgovernment funding, as do 91% of countries in theMiddle East, 86% of countries in North and EastAsia, 85% of countries in Western Europe, and 72%of countries in NIS and Russia (Figure 6.19). Nearlyhalf of the countries in OSEA (53%) and LatinAmerica (45%) cover dialysis patients’ medicationsexclusively through government funding; relativelyfewer countries in South Asia (43%), Africa (38%),and North America (33%) do so. (Figure 6.19).Among the 17 countries that fund dialysis patients’medications exclusively through private sources, 11are in Africa (28% of the region). No countries inEastern and Central Europe, the Middle East, or NISand Russia fund dialysis patients’ medications solelythrough private sources (Figure 6.19).
Among the countries that offer kidneytransplantation, 75% cover patients’ medicationcosts through government funding; 57% ofthese countries charge patients no fees at thepoint of delivery and 18% charge some fees. Incontrast, 5% fund transplant patients’medications exclusively though private sources.Funding models vary globally. All countries inEastern and Central Europe and North and EastAsia cover transplant patients’ medication costsexclusively through government funding, as do91% of countries in the Middle East and 89% ofcountries in Western Europe. Only 34% ofcountries in South Asia (n = 2) cover transplantpatients’ medication costs through governmentfunding (Figure 6.19). Among the 6 countriesthat fund transplant patients’ medicationsexclusively through private sources, 3 are inAfrica (21% of the region). No countries inEastern and Central Europe, the Middle East,North America, North and East Asia, OSEA, orWestern Europe fund transplant patients’medications solely through private or out of out-of-pocket sources (Figure 6.19).
6.5 Medication funding models for patients on KRT
Figure 6.19 | Funding models for KRT patients, by ISN region
n Publicly funded by government and free at the point of delivery (%)n Publicly funded by government with some fees at the point of delivery (%)n Mix of public and private funding systems (%)n Solely private and out-of-pocket (%)n Solely private through health insurance providers (%)n Multiple systems – programs provided by government, NGOs, and communities (%)n Other (%)
Dialysis
Africa Eastern & Central Europe Latin America Middle East NIS & Russia North America North & East Asia OSEA South Asia Western Europe
Transplant

84 | Access to essential medications and health products ISN Global Kidney Health Atlas | 2019
Over 50% of patients initiate HD treatment withfunctioning vascular access (i.e., an arteriovenousfistula or graft), a tunneled dialysis catheter, or atemporary dialysis catheter in 18%, 13% and46% of countries, respectively (Figure 6.20).
Moreover, patient education on the best meansof access and the optimal timing for surgery(e.g., 6 months and 1 month prior to theinitiation of HD and PD, respectively) is lacking.Only 19% of countries reported that patientsreceive education almost all (i.e., more than75%) of the time, and 60% of countriesreported that patients receive education lessthan 50% of the time (Figure 6.20).
Methods of access at the initiation of HD alsovary by country income (Figure 6.21). Patients inlow income countries are less likely to start HD
with functioning vascular access or a tunneleddialysis catheter than countries in other incomegroups and are more likely to initiate treatmentwith a temporary dialysis catheter. Patientsinitiate HD with a temporary catheter almost allof the time in more than half (57%) of lowincome countries, compared to patients in 21%of lower-middle, 23% of upper-middle, and 5%of high income countries (Figure 6.21). Similarly,it is less common to receive education onaccess types and timely surgery in low incomecountries; 15% of low income countries reportedthat patients never receive education or undergosurgery within an appropriate time period prior tostarting treatment. In contrast, 30% of highincome countries provide patients witheducation and timely surgery almost all of thetime (Figure 6.21).
6.6 Vascular access for KRT
Figure 6.21 | Types of vascular access for KRT, by World Bank income group
n None (%) n Few (%) n Some (%) n Most (%) n Almost all (%)
Start dialysis with functioning vascular access
Low income Lower-middle income Upper-middle income High income
Start dialysis with a temporary dialysis catheter
Low income Lower-middle income Upper-middle income High income
Start dialysis with a tunneled dialysis catheter
Receive education for the best means of access and timely surgery
Figure 6.20 | Types of vascular access for KRT
n None (%) n Few (%) n Some (%) n Most (%) n Almost all (%)
Start dialysis with functioning vascular access Start dialysis with a tunneled dialysis catheter Start dialysis with a temporary dialysis catheter Receive education for the best means of access and timely surgery

ISN Global Kidney Health Atlas | 2019 Access to essential medications and health products | 85
Respondents were asked to disclose how often
their countries measure and report key quality
indicators for HD service delivery. Among the
countries in which patients have access to HD
services, 32% measure patient-reported outcome
measures (PROMS) almost all of the time (Figure
6.22). Indicators that are commonly measured and
reported almost all of the time include blood
pressure (86%), hemoglobin/hematocrit (88%),
small solute clearance (61%), bone mineralmarkers (60%), and patient survival (70%).Technique survival is measured and reported nearlyall of the time in 51% of countries worldwide(Figure 6.22).
Measuring and reporting of quality HD indicatorsgenerally increases with country income level:17% of low income countries never measurePROMS, compared to 9% of high income
6.7 Quality of KRT services
Figure 6.22 | Proportion of centers that measure and report quality indicators for HD service delivery
n None (%) n Few (%) n Some (%) n Most (%) n Almost all (%)
Patient-reported outcome measures Blood pressure Small solute clearance Hemoglobin, hematocrit Bone mineral markers Technique survival Patient survival
Figure 6.23 | Proportion of centers that measure and report quality indicators for HD service delivery,by World Bank income group
n None (%) n Few (%) n Some (%) n Most (%) n Almost all (%)
Patient-reported outcome measures
Low income Lower-middle income Upper-middle income High income
Blood pressure
Low income Lower-middle income Upper-middle income High income
Small solute clearance
Low income Lower-middle income Upper-middle income High income
Hemoglobin, hematocrit
Low income Lower-middle income Upper-middle income High income
Bone mineral markers
Technique survival
Patient survival

86 | Access to essential medications and health products ISN Global Kidney Health Atlas | 2019
countries (Figure 6.23). Nearly all high incomecountries (87%) measure and report small soluteclearance almost all of the time, compared to 68%of upper-middle, 29% of lower-middle, and 28%of low income countries. Similarly, 85% of highincome countries measure bone mineral markersin HD patients almost all of the time, compared to68% of upper-middle, 32% of lower-middle, and17% of low income countries (Figure 6.23).Technique and patient survival are reported,respectively, in 81% and 93% of high incomecountries, compared to only 49% and 61% ofupper-middle, 24% and 48% of lower-middle, and17% and 14% of low income countries,respectively. Most countries, irrespective ofincome, measure blood pressure andhemoglobin/hematocrit (Figure 6.23).
Among the countries in which PD services aredelivered, 32% of countries measure PROMSalmost all of the time (Figure 6.24). Indicatorsthat are commonly measured and reportedalmost all of the time include blood pressure(85%) and hemoglobin/hematocrit (84%). Smallsolute clearance, bone mineral markers, andtechnique survival are almost always measuredin 58%, 68%, and 61% of countries, respectively.Patient survival is measured and reported nearlyall of the time in 73% of countries worldwide(Figure 6.24).
Measuring and reporting of PD quality indicatorsgenerally increases with increasing income level:40% of low income countries never measure
PROMS, compared to just 7% of high incomecountries (Figure 6.25). Nearly all high incomecountries (85%) measure and report small soluteclearance almost all of the time, compared to45% of upper-middle, 17% of lower-middle, and0% of low income countries. Similarly, techniquesurvival is almost always reported in 89% ofhigh, 45% of upper-middle, 28% of lower-middleand 0% of low income countries (Figure 6.25).Bone mineral markers are almost alwaysmeasured in PD patients in 85% of high incomecountries, compared to 70% of upper-middle,22% of lower-middle, and 40% of low incomecountries. Patient survival is reported in 93% ofhigh income countries, but just 20% of lowincome countries. Blood pressure andhemoglobin/hematocrit are commonly measuredin almost all countries, irrespective of income:96% of high income, 82% of upper-middleincome, and 80% of low income countries reporton both measurements. Measuring of bloodpressure and hemoglobin/hematocrit is lesscommon in lower-middle income countries: 56%and 50% of countries report blood pressure andhemoglobin/hematocrit measurements,respectively (Figure 6.25)
Among the countries in which kidneytransplantation services are delivered, 45%measure PROMS almost all of the time (Figure6.26). A large proportion of countries reportpatient survival (77%), kidney allograft function(73%), and graft survival (72%) almost all of the
Figure 6.24 | Proportion of centers that measure and report quality indicators for PD service delivery
n None (%) n Few (%) n Some (%) n Most (%) n Almost all (%)
Patient-reported outcome measures Blood pressure Small solute clearance Hemoglobin, hematocrit Bone mineral markers Technique survival Patient survival

ISN Global Kidney Health Atlas | 2019 Access to essential medications and health products | 87
time. The majority of countries also report delayed
graft function (65%) and rejection rates (59%)
almost all of the time (Figure 6.26).
As with PD and HD, measuring and reporting of
kidney transplantation quality indicators increases
with increasing country income level. More than
half (60%) of low income countries never report
on PROMS, compared to just 14% of highincome countries (Figure 6.27). Delayed graftfunction and rejection rates are almost alwaysmeasured, respectively, in 90% and 84% of highincome countries, compared to 56% and 47% ofupper-middle, and 40% and 36% of lower-middleincome countries. No low income countries (0%)measure these indicators almost all of the time
Figure 6.26 | Proportion of centers that measure and report quality indicators for kidneytransplantation service delivery
n None (%) n Few (%) n Some (%) n Most (%) n Almost all (%)
Patient-reported outcome measures Delayed graft function Rejection rates Kidney allograft function Graft survival Patient survival
Figure 6.25 | Proportion of centers that measure and report quality indicators for PD service delivery,by World Bank income group
n None (%) n Few (%) n Some (%) n Most (%) n Almost all (%)
Patient-reported outcome measures
Low income Lower-middle income Upper-middle income High income
Blood pressure
Low income Lower-middle income Upper-middle income High income
Small solute clearance
Low income Lower-middle income Upper-middle income High income
Hemoglobin, hematocrit
Low income Lower-middle income Upper-middle income High income
Bone mineral markers
Technique survival
Patient survival

Nutritional services for kidney care are generallyavailable worldwide. Measurement of serumalbumin is generally available in 92% of countries,and oral nutrition supplements are generallyavailable in 81% of countries. Body mass indexand changes in body weight are generally
measured in 79% and 77% of countries,respectively. Skin fold assessments are lesscommon, being generally available in just 41% ofcountries. Services for dietary counseling aregenerally available in 59% of countries worldwide(Figure 6.28).
6.8 Availability of nutritional services
88 | Access to essential medications and health products ISN Global Kidney Health Atlas | 2019
Figure 6.28 | Availability of nutritional services for kidney care
n Generally available (%) n Generally not available (%) n Never available (%) n Unknown (%)
Dietary counseling1 Measurement of serum albumin Anthropometry: changes in body weight Anthropometry: skin fold assessment Anthropometry: body mass index Oral nutrition supplements
1 By a person trained in nutrition.
(Figure 6.27). Kidney graft allocation, graftsurvival, and patient survival are measured in 94%of high income countries; in contrast, theseindicators are measured, respectively, in just 20%,
40%, and 40% low income countries. Just overhalf of upper-middle and lower-middle incomecountries measure these indicators nearly all ofthe time (Figure 6.27).
Figure 6.27 | Proportion of centers that measure and report quality indicators for PD service delivery, byWorld Bank income group
n None (%) n Few (%) n Some (%) n Most (%) n Almost all (%)
Patient-reported outcome measures
Low income Lower-middle income Upper-middle income High income
Delayed graft function
Low income Lower-middle income Upper-middle income High income
Rejection rates
Low income Lower-middle income Upper-middle income High income
Kidney allograft function
Graft survival
Patient survival

ISN Global Kidney Health Atlas | 2019 Access to essential medications and health products | 89
The availability of nutritional services increaseswith country income level. Oral nutritionsupplements are generally available in 95% ofhigh income countries, compared to 78% ofupper-middle, 74% of lower-middle, and 64% oflow income countries (Figure 6.29). Dietarycounseling is generally available in 84% of highand 71% of upper-middle income countries, butonly 31% of lower-middle and 14% of lowincome countries. Measurement of serumalbumin is generally available worldwide, butavailability increases with increasing country
income level; serum albumin is measured in 68%of low, 86% of lower-middle, 98% of upper-middle, and 100% of high income countries.Anthropometric measurements (body massindex and changes in body weight) also aregenerally available in most countries, but again,availability increases with increasing countryincome level; body mass index and changes inbody weight are measured, respectively, in 68%and 59% of low, 71% and 69% of lower-middle,78% and 80% of upper-middle, and 88% and86% of high income countries (Figure 6.29).
Figure 6.29 | Availability of nutritional services for kidney care, by World Bank income group
n Generally available (%) n Generally not available (%) n Never available (%) n Unknown (%)
Dietary counseling1
Low income Lower-middle income Upper-middle income High income
Measurement of serum albumin
Low income Lower-middle income Upper-middle income High income
Changes in body weight
Low income Lower-middle income Upper-middle income High income
1 By a person trained in nutrition.
Skin fold assessment
Body mass index
Oral nutrition supplements

90 | Access to essential medications and health products ISN Global Kidney Health Atlas | 2019
Conservative care, defined by KDIGO29 as planned,holistic, patient-centered care for patients withstage 5 CKD, is delivered in 81% (n = 124) ofcountries. All countries in North and East Asia andSouth Asia, and the vast majority of countries inAfrica (80%), Eastern and Central Europe (95%),the Middle East (82%), OSEA (93%), and WesternEurope (90%) offer conservative care (Figure 6.30).In contrast, less than half of the countries in LatinAmerica (44%), and just over half of the countriesin NIS and Russia (57%) and North America (67%)deliver conservative care (Figure 6.30). Theavailability of conservative care does not appear tobe associated with country income level: 84% ofhigh, 80% of upper-middle, 74% of lower-middle,and 82% of low income countries provideconservative care (Figure 6.31).
Among the countries that provide conservativecare, 55% have choice-restricted conservative caregenerally available for patients with resourceconstraints that prevent or limit access to KRT, and64% have chosen or medically-advisedconservative care generally available for patientswho opt out of available dialysis services.
Moreover, 48% of countries with conservative careadopt a multidisciplinary team approach to careand 33% use shared decision-making tools (e.g.,practice guidelines for providers and patientdecision aids). Systematic active recognition andmanagement of symptoms associated withadvanced kidney failure are generally available in66% of countries offering conservative care.Psychological, cultural, and spiritual support aresystematically provided to people receivingconservative care in 37% of countries offering thisservice. Additional training in conservative care isgenerally available for health care providers in 26%of countries that offer conservative care. Lastly,conservative care is easily accessible in differentsettings (e.g., homes, hospitals, hospice care,nursing homes) in 41% of countries offering thisservice (Figure 6.32).
Availability of choice-restricted conservative careincreases slightly with country income level: 41% oflow, 56% of lower-middle, 58% of upper-middle,and 58% of high income countries offer choice-restricted conservative care in at least 50% ofclinics and hospitals (Figure 6.33). Access tochosen or medically-advised conservative carediffers more by country income level: 87% of highincome countries offer chosen conservative care,compared to 64% of upper-middle, 43% of lower-middle, and 33% of low income countries.
The use of a multidisciplinary team in conservativecare delivery is more common in high incomecountries: multidisciplinary teams deliverconservative care in 67% of high incomecountries, compared to 48% of upper-middle,25% of lower-middle, and 25% of low incomecountries. Similarly, the adoption of shareddecision making practices increases with country
6.9 Availability of conservative care
Figure 6.31 | Availability of conservative care,by World Bank income group
n Yes (%) n No (%) n Unknown (%)
Low income Lower-middle income Upper-middle income High income
Unknown in two countries (Western Europe: Finland and Germany)
Figure 6.30 | Availability of conservative care,by ISN region
n Yes (%) n No (%) n Unknown (%)
Africa Eastern & Central Europe Latin America Middle East NIS & Russia North America North & East Asia OSEA South Asia Western Europe
Unknown in two countries (Western Europe: Finland and Germany)

ISN Global Kidney Health Atlas | 2019 Access to essential medications and health products | 91
income level, but is generally available in only half(50%) of high income countries, and just 24% ofupper-middle, 29% of lower-middle, and 12% oflow income countries. The provision ofpsychological, cultural, and spiritual support alsoincreases with country income, but remains low,being provided in just 52% of high, 30% of upper-middle, 31% of lower-middle, and 19% of lowincome countries. Approximately half of low (50%),
lower-middle (48%), and upper-middle (55%)income countries systematically managesymptoms, as do 89% of high income countries.Furthermore, additional training for health careproviders and accessible conservative careservices are available, respectively, in 0% of low,24% and 27% of lower-middle, 21% and 28% ofupper-middle, and 39% and 70% of high incomecountries (Figure 6.33).
Figure 6.32 | Characteristics of available conservative care
n Generally available (%) n Generally not available (%) n Never available (%) n Unknown (%)
Choice-restricted Chosen or medically-advised Multidisciplinary team approach Shared decision-making tools Management of symptoms Psychological, cultural and spiritual support Additional training to care providers Easy access to conservative care
Figure 6.33 | Characteristics of available conservative care, by World Bank income group
n Generally available (%) n Generally not available (%) n Never available (%) n Unknown (%)
Choice-restricted
Low income Lower-middle income Upper-middle income High income
Chosen or medically-advised
Low income Lower-middle income Upper-middle income High income
Multidisciplinary team approach
Low income Lower-middle income Upper-middle income High income
Shared decision-making tools
Low income Lower-middle income Upper-middle income High income
Management of symptoms
Psychological, cultural, and spiritual support
Additional training to care providers
Easy access to conservative care

92 | ISN Global Kidney Health Atlas | 2019

SECTION 7
HEALTH INFORMATION SYSTEMS
ISN Global Kidney Health Atlas | 2019 Health information systems | 93
Worldwide, just 13 countries have registries forAKI and 19 have registries for non-dialysis CKD(Table 7.1). Registries for dialysis (n = 101, 66%)and kidney transplantation (n = 88, 57%) aremore common.
Registries for AKI are more common in NIS andRussia (14%), North and East Asia (14%), Easternand Central Europe (11%), Africa (10%), WesternEurope (10%), and the Middle East (9%) than in
OSEA (7%), Latin America (6%), North America(0%) and South Asia (0%) (Figure 7.1).
Non-dialysis CKD registries are more common inNIS and Russia (29%), North and East Asia(29%), Latin America (28%), and OSEA (13%)than in Western Europe (15%), the Middle East(9%), Africa (7%), Eastern and Central Europe(5%), North America (0%), and South Asia (0%)(Figure 7.1).
7.1 Registries
AKIN (%)
Non-dialysis CKDN (%)
DialysisN (%)
TransplantationN (%)
Table 7.1 | Prevalence of renal registries
Overall 13 (8) 19 (12) 101 (66) 88 (57)
ISN region
Africa 4 (10) 3 (7) 18 (44) 6 (15)
Eastern & Central Europe 2 (11) 1 (5) 17 (89) 17 (89)
Latin America 1 (6) 5 (28) 14 (78) 13 (72)
Middle East 1 (9) 1 (9) 6 (55) 8 (73)
NIS & Russia 1 (14) 2 (29) 5 (71) 6 (86)
North America 0 (0) 0 (0) 4 (44) 3 (33)
North & East Asia 1 (14) 2 (29) 7 (100) 7 (100)
OSEA 1 (7) 2 (13) 10 (67) 8 (53)
South Asia 0 (0) 0 (0) 2 (29) 1 (14)
Western Europe 2 (10) 3 (15) 18 (90) 19 (95)
World Bank income group
Low income 2 (9) 2 (9) 4 (18) 0 (0)
Lower-middle income 4 (11) 4 (11) 18 (51) 10 (29)
Upper-middle income 2 (5) 2 (5) 31 (76) 27 (66)
High income 5 (9) 11 (20) 48 (86) 51 (91)

94 | Health information systems ISN Global Kidney Health Atlas | 2019
Dialysis registries are more common in North andEast Asia (100%), Western Europe (90%), Easternand Central Europe (89%), Latin America (78%),NIS and Russia (71%), and OSEA (67%) than in theMiddle East (55%), Africa (44%), North America(44%), and South Asia (29%) (Figure 7.1).
Registries for transplantation are more commonin North and East Asia (100%), Western Europe(95%), Eastern and Central Europe (89%), NISand Russia (86%), the Middle East (73%), andLatin America (72%) than in OSEA (53%), North
America (33%), Africa (15%), and South Asia(14%) (Figure 7.1).
AKI registries exist in 2 low, 4 lower-middle, 2upper-middle, and 5 high income countries(Figure 7.2). Similarly, non-dialysis CKD registriesexist in 2 low, 4 lower-middle, 2 upper-middle,and 11 high income countries. High incomecountries are more likely to have registries fordialysis and transplantation (86% and 91%,respectively), than upper-middle (76% and 66%,respectively), lower-middle (51% and 29%,
Figure 7.1 | Prevalence of renal registries, by ISN region
n Yes (%) n No (%) n Unknown (%)
AKI Non-dialysis CKD
Africa Eastern & Central Europe Latin America Middle East NIS & Russia North America North & East Asia OSEA South Asia Western Europe
Dialysis Transplantation
Africa Eastern & Central Europe Latin America Middle East NIS & Russia North America North & East Asia OSEA South Asia Western Europe
Figure 7.2 | Prevalence of renal registries, by World Bank income group
n Yes (%) n No (%) n Unknown (%)
AKI Non-dialysis CKD
Low income Lower-middle income Upper-middle income High income
Dialysis Transplantation
Low income Lower-middle income Upper-middle income High income

ISN Global Kidney Health Atlas | 2019 Health information systems | 95
respectively), and low (18% and 0%, respectively)
income countries (Figure 7.2).
Among the 13 countries with AKI registries,
provider participation is mandatory in 8 (62%)
countries and voluntary in 5 (38%) countries.
Participation varies by region and income. Both
registries in Western Europe require provider
participation. Latin America and the Middle East
each have 1 country with an AKI registry that
requires provider participation (Table 7.2).
Likewise, NIS and Russia, North and East Asia,and OSEA each have 1 country with an AKIregistry, but provider participation is voluntary.Participation in nearly all registries in Africa ismandatory and participation in 1 of the 2registries in Eastern and Central Europe ismandatory (Table 7.2). Both AKI registries in lowincome countries require participation,compared to half of the registries in lower-middleand 80% of the registries in high incomecountries (Table 7.2).
Country ISN region World Bank group Mandatory Voluntary
Table 7.2 | Provider participation in AKI and CKD registries
AKI registry
Azerbaijan NIS & Russia Upper-middle income l
British Virgin Islands Latin America High income l
Congo, Rep. Africa Lower-middle income l
Eritrea Africa Low income l
Guinea Africa Low income l
Lao PDR OSEA Lower-middle income l
Malta Western Europe High income l
Moldova Eastern & Central Europe Lower-middle income l
Mongolia North & East Asia Upper-middle income l
Oman Middle East High income l
Slovenia Eastern & Central Europe High income l
United Kingdom Western Europe High income l
Zambia Africa Lower-middle income l
CKD registry
Argentina Latin America High income l
Azerbaijan NIS & Russia Upper-middle income l
Bolivia Latin America Lower-middle income l
Brunei Darussalam OSEA High income l
Colombia Latin America Upper-middle income l
Congo, Rep. Africa Lower-middle income l
Eritrea Africa Low income l
Guinea Africa Low income l
Japan North & East Asia High income l
Lao PDR OSEA Lower-middle income l
Malta Western Europe High income l
Oman Middle East High income l
Puerto Rico Latin America High income l
Slovak Republic Eastern & Central Europe High income l
Sweden Western Europe High income l
Taiwan, China North & East Asia High income l
United Kingdom Western Europe High income l
Uruguay Latin America High income l

96 | Health information systems ISN Global Kidney Health Atlas | 2019
Among the 19 countries with non-dialysis CKDregistries, participation is mandatory in 10 (53%)countries and voluntary in 8 countries (42%);participation type was not reported in 1 country(5%) (Tajikistan) (Table 7.2). Similarly, participation innon-dialysis CKD registries varies by region andincome. Registries in all 3 countries in Africa requireparticipation, as do the registries in 1 country inEastern and Central Europe and 2 countries inOSEA (Table 7.2). All CKD registries in the MiddleEast (n = 1), and North and East Asia (n = 2) havevoluntary participation. Among the 5 countries inLatin America with CKD registries, participation ismandatory in 3 and voluntary in 2. Among the 3countries in Western Europe, participation isvoluntary in 2 and mandatory in 1. Two CKDregistries exist in NIS and Russia: participation isvoluntary in 1 country and was not reported in theother. Both low income countries and the 3 lower-middle income countries reporting data requireprovider participation in CKD registries (Table 7.2).In the 2 upper-middle income countries withregistries, participation is mandatory in 1 country
and voluntary in the other. Among the 11 highincome countries with CKD registries, participationis mandatory in 4 (36%) countries and voluntary in7 (64%) countries (Table 7.2).
Among the countries with dialysis registries,participation is mandatory in 59%, voluntary in36%, and unknown or not reported in 5%.Mandatory participation in dialysis registries ishighest in the Middle East (83%), Latin America(79%), and OSEA (70%) (Figure 7.3). Among the 88countries with transplantation registries,participation is mandatory in 57 (65%), voluntary in26 (30%), and unknown or not reported in 5 (6%).Mandatory participation in transplantation registriesis highest in Latin America (92%), the Middle East(88%), and Western Europe (74%) (Figure 7.3).
Participation is mandatory in 100% of the 4 lowincome countries with dialysis registries, comparedto 59% of lower-middle, 57% of upper-middle, and63% of high income countries (Figure 7.4). Amongcountries with transplantation registries,participation is mandatory in 63% of lower-middle,58% of upper-middle, and 73% of high income
Figure 7.4 | Provider participation in dialysis and transplantation registries,by World Bank income group
n Mandatory (%) n Voluntary (%) n Unknown (%)
Dialysis Transplantation1
Low income Lower-middle income Upper-middle income High income
1 No low income countries reported a transplant registry
Figure 7.3 | Provider participation in dialysis and transplantation registries, by ISN region
n Mandatory (%) n Voluntary (%) n Unknown (%)
Dialysis Transplantation
Africa Eastern & Central Europe Latin America Middle East NIS & Russia North America North & East Asia OSEA South Asia Western Europe

ISN Global Kidney Health Atlas | 2019 Health information systems | 97
countries. No low income countries reportedtransplantation registries (Figure 7.4).
Among the 13 countries with AKI registries, 6 havenational registries, 4 have local (e.g., hospital-run)registries, and 2 have regional (e.g., state- orprovince-level) registries (Table 7.3). Respondentsfrom 1 country (Azerbaijan) did not reportgeographic coverage. Both of the AKI registries inlow income countries are national. Among the 4
registries in lower-middle income countries, half areregional and half are local. One of the 2 registries inupper-middle income countries is local andcoverage was not reported for the other. Amongthe 5 AKI registries in high income countries, 4 arenational and 1 is local (Table 7.3).
Geographic coverage also varies among the 19non-dialysis CKD registries. There are 13 nationalregistries, 7 local registries, and 4 regional
Country ISN region World Bank group National
Regional, state,
provincial
Local, hospital,
community
Table 7.3 | Geographic coverage of AKI and CKD registries
AKI registry
British Virgin Islands Latin America High income l
Congo, Rep. Africa Lower-middle income l
Eritrea Africa Low income l
Guinea Africa Low income l
Lao PDR OSEA Lower-middle income l
Malta Western Europe High income l
Moldova Eastern & Central Europe Lower-middle income l
Mongolia North & East Asia Upper-middle income l
Oman Middle East High income l
Slovenia Eastern & Central Europe High income l
United Kingdom Western Europe High income l
Zambia Africa Lower-middle income l
CKD registry
Argentina Latin America High income l
Azerbaijan NIS & Russia Upper-middle income l
Bolivia Latin America Lower-middle income l
Brunei Darussalam OSEA High income l
Colombia Latin America Upper-middle income l
Congo, Rep. Africa Lower-middle income l
Eritrea Africa Low income l
Guinea Africa Low income l
Japan North & East Asia High income l l l
Lao PDR OSEA Lower-middle income l
Malta Western Europe High income l
Oman Middle East High income l
Puerto Rico Latin America High income l
Slovak Republic Eastern & Central Europe High income l
Sweden Western Europe High income l
Taiwan, China North & East Asia High income l l
Tajikistan NIS & Russia Lower-middle income l l l
United Kingdom Western Europe High income l
Uruguay Latin America High income l

98 | Health information systems ISN Global Kidney Health Atlas | 2019
registries. Two CKD registries exist in low incomecountries: 1 is national and the other is local.Among the 4 registries in lower-middle incomecountries, 1 is national only, 1 is regional only, 1 islocal only, and 1 is available at all levels (national,regional, local). Two registries exist in upper-middle income countries: 1 is national and theother is local. Among the 11 registries in highincome countries, 7 are national, 1 is regional, 1 islocal, 1 is available across all levels (national,regional, and local), and 1 is both national andlocal (Table 7.3).
Nearly all (89%) dialysis registries are national.Regional and local registries are available in 15%and 13% of countries, respectively. Higher incomecountries are more likely to have national dialysisregistries: 50% of low, 72% of lower-middle, 90%of upper-middle, and 98% of high incomecountries have national dialysis registries. Regionaldialysis registries exist in 4 lower-middle, 2 upper-middle, and 9 high income countries. Local dialysisregistries exist in 1 low, 4 lower-middle, 2 upper-middle, and 6 high income countries (Figure 7.5).
Among countries with transplant registries, 85%are national. Regional and local registries exist in10% and 13% of countries, respectively. No lowincome countries reported transplant registries.Transplant registries are national in most upper-middle (96%) and high income (84%) countries,and in just over half (60%) of lower-middle incomecountries. Regional transplant registries exist in 7high and 2 lower-middle income countries; localtransplant registries exist in 7 high, 1 upper-middle,and 3 lower-middle income countries (Figure 7.5).
Among the 13 countries with AKI registries, datacollected include the etiology of AKI (10 countries),the incidence of AKI (9 countries), requirements forKRT (9 countries), mortality (9 countries),hospitalizations (7 countries), and risk factors forAKI (6 countries) (Table 7.4). Two low incomecountries have AKI registries; both capture all dataexcept for the incidence of AKI, which is capturedonly in 1 of the 2 countries. Among the 4 lower-middle income countries with AKI registries: riskfactors for AKI are covered in 2 countries; theetiology of AKI is covered in all 4 countries;incidence of AKI, hospitalizations, and requirementsfor KRT are covered in 3 countries; and patientmortality is covered in 2 countries (Table 7.4).Among the 2 upper-middle income countries withAKI registries, 1 covers risk factors, both cover theetiology and incidence of AKI, 1 coversrequirements for KRT, 1 covers mortality, and nonecover hospitalizations (Table 7.4). Five high incomecountries have AKI registries: 4 cover mortality, 3cover the incidence of AKI and requirement forKRT, 2 cover etiology of AKI and hospitalizations,and 1 covers risk factors for AKI (Table 7.4).
Figure 7.5 | Geographic coverage of dialysisand transplantation registries, by World Bankincome group
n Low income n Lower-middle income n Upper-middle incomen High income
Dialysis
National
50%72%
90%98%
Regional, state, provincial
22%5%
19%
Local, hospital, community
25%22%
6%13%
Transplantation
National
60%96%
84%
Regional, state, provincial
20%14%
Local, hospital, community
30%4%
14%

ISN Global Kidney Health Atlas | 2019 Health information systems | 99
Among the 19 non-dialysis CKD registries, 12cover the whole spectrum of CKD (i.e., stages 1-5) and 5 cover advanced CKD only (stages 4/5);stage coverage was not reported for registries in2 countries (Azerbaijan and Sweden) (Table 7.5).Both of the registries in low income countries
cover all stages, as do 3 of the registries inlower-middle countries and 7 of the registries inhigh income countries (Table 7.4). Registries in 1lower-middle, 1 upper-middle, and 3 highincome countries cover advanced stages only(Table 7.5).
Table 7.4 | Content coverage of AKI registries, by World Bank income group
Azerbaijan NIS & Russia Upper-middle income l l l l
British Virgin Islands Latin America High income l l l
Congo, Rep. Africa Lower-middle income l l l l l l
Eritrea Africa Low income l l l l l
Guinea Africa Low income l l l l l l
Lao PDR OSEA Lower-middle income l l l l l
Malta Western Europe High income l l l l l l
Moldova Eastern & Central Europe Lower-middle income l l l l l
Mongolia North & East Asia Upper-middle income l l l
Oman Middle East High income l
Slovenia Eastern & Central Europe High income l
United Kingdom Western Europe High income l l l l
Zambia Africa Lower-middle income l
Country ISN region World Bank groupWhole spectrum
(stages 1-5)Advanced CKDonly (stages 4/5)
Table 7.5 | Content coverage of CKD registries, by World Bank income group
Argentina Latin America High income l
Bolivia Latin America Lower-middle income l
Brunei Darussalam OSEA High income l
Colombia Latin America Upper-middle income l
Congo, Rep. Africa Lower-middle income l
Eritrea Africa Low income l
Guinea Africa Low income l
Japan North & East Asia High income l
Lao PDR OSEA Lower-middle income l
Malta Western Europe High income l
Oman Middle East High income l
Puerto Rico Latin America High income l
Slovak Republic Eastern & Central Europe High income l
Taiwan, China North and East Asia High income l
Tajikistan NIS & Russia Lower-middle income l
United Kingdom Western Europe High income l
Uruguay Latin America High income l
Country ISN region World Bank groupRisk factors
for AKIEtiology of AKI
Incidenceof AKI Hospitalizations
Requirementfor KRT Mortality

100 | Health information systems ISN Global Kidney Health Atlas | 2019
In dialysis registries, modality is covered mostoften (95%), followed by the etiology of ESKD(90%), patient mortality (82%), process measures(65%), hospitalizations (43%), and patient-reported outcome measures (24%). Dialysisregistries exist in 4 low, 18 lower-middle, 31upper-middle, and 48 high income countries, andthe etiology of ESKD is captured in 75%, 94%,81%, and 96% of registries in those countries,respectively (Figure 7.6). Similarly, the modality ofdialysis is covered in 75%, 94%, 90%, and 100%
of the registries in low, lower-middle, upper-middle, and high income countries, respectively.Process-based measures are captured in 50% ofthe registries in low, 44% of the registries inlower-middle, 52% of the registries in upper-middle, and 83% of the registries in high incomecountries. Hospitalizations are captured in 50%of the registries in low, 33% of the registries inlower-middle, 35% of the registries in upper-middle, and 50% of the registries in high incomecountries (Figure 7.8). PROMS are included in50% of the registries in low, 22% of the registriesin lower-middle, 19% of the registries in upper-middle, and 25% of the registries in high incomecountries. Lastly, nearly all registries in high
Figure 7.6 | Content coverage of registries fordialysis, by World Bank income group
n Low income n Lower-middle income n Upper-middle incomen High income
Etiology of ESKD
75%94%
81%96%
Modality of dialysis
75%94%
90%100%
Process-based measures
50%44%
52%83%
Hospitalizations
50%33%35%
50%
PROMS
50%22%
19%25%
Mortality
75%78%
61%98%
Figure 7.7 | Content coverage of registries fortransplantation, by World Bank income group
n Low income n Lower-middle income n Upper-middle incomen High income
Etiology of ESKD
70%78%
94%
Transplant source
80%96%
100%
Process-based measures
50%41%41%
Hospitalizations
50%26%
47%
PROMS
20%19%
22%
Mortality
80%67%
100%

ISN Global Kidney Health Atlas | 2019 Health information systems | 101
Overall, practices to identify CKD in high-riskgroups are common. Patients with diabetes andhypertension are screened for CKD in 93% and89% of countries, respectively. People withautoimmune or multisystem disorders, orcardiovascular diseases are screened in 75% ofcountries. People in other high-risk groups arealso are screened for CKD: patients withurological disorders are screened in 72% ofcountries, people with a family history of CKD arescreened in 48% of countries, people aged 65years or older are screened in 45% of countries,chronic users of nephrotoxic medications arescreened in 43% of countries, and high-riskethnic groups are screened in 10% of countries.Routine testing for CKD is not offered in 12countries (Afghanistan, Angola, Gambia, Georgia,Germany, Kenya, Kosovo, Libya, Mauritania,Poland, Senegal, and Turkey).
At least 90% of countries in all regions screenpatients with hypertension for CKD except forEastern and Central Europe, where 82% ofcountries screen, and South Asia, where 14% ofcountries screen (Figure 7.8). Similarly, at least90% of countries screen diabetes patients for
CKD in all regions except for South Asia, whereonly 14% of countries screen. Routine CKDscreening of other high-risk patients (e.g., peoplewith cardiovascular diseases, autoimmunedisorders, urological disorders, etc.) is lesscommon in Africa, Eastern and Central Europe,OSEA, and South Asia (Figure 7.8).
CKD screening of people with hypertension ordiabetes is common, irrespective of income level(Figure 7.9). Patients with cardiovascular diseasesare screened in 64%, 65%, 76%, and 85% of low,lower-middle, upper-middle, and high incomecountries, respectively. Similarly, 50%, 78%, 76%,and 81% of low, lower-middle, upper-middle, andhigh income countries screen for CKD amongpeople with autoimmune or multisystem disorders.People over 65 years of age are screened for CKDin 36%, 22%, 50%, and 59% of countries in low,lower-middle, upper-middle, and high incomecountries, respectively. Likewise, the prevalence ofCKD screening for people with urological conditionssimilarly is moderate across all income levels (73%of low, 70% of lower-middle, 71% of upper-middle,and 73% of high income countries). CKD screeningamong chronic users of nephrotoxic medications is
7.2 Identification of disease (AKI and CKD)
income countries (98%), and most registries inlow (75%), lower-middle (78%) and upper-middle(61%) income countries include patient mortalitydata (Figure 7.6).
The majority (97%) of countries with transplantregistries capture the donor source (living ordeceased), and most collect data on patientmortality (86%) and the etiology of ESKD (85%).Less than half collect data on process-basedmeasures (42%) or hospitalizations (41%), and few(20%) collect PROMS. Nearly all (98%) registries inhigh income countries capture the etiology of ESKD,as do 78% of registries in upper-middle and 70% ofregistries in lower-middle income countries (Figure7.7). Donor type (living or deceased) and patientmortality are reported in all registries in high income
countries and most registries in upper-middle (96%
and 67%, respectively) and lower-middle (80% for
each measure) income countries. Less than half of
the registries in high (41%) and upper-middle (41%)
income countries capture process-based
measures, whereas half (50%) of the registries in
lower-middle income countries capture these data.
Similarly, hospitalizations are reported in fewer than
half of the registries in high (47%) and upper-
middle (26%) income countries, and half (50%) of
the registries in lower-middle income countries.
Irrespective of income level, few transplant
registries collect PROMS: 22% of registries in high,
19% of registries in upper-middle, and 20% of
registries in lower-middle income countries collect
these data (Figure 7.7).

low, irrespective of income level, and occurs in
45% of low, 30% of lower-middle, 38% of upper-
middle, and 54% of high income countries.
Patients with a family history of CKD are screened
in nearly half of all countries, irrespective of income
level (50% of low, 41% of lower-middle, 45% of
upper-middle, and 54% of high income countries).
Few countries (5% of low, 8% of lower-middle, 2%of upper-middle, and 19% of high incomecountries) reported screening high-risk ethnicgroups for CKD (Figure 7.9).
Among all countries, ethnic groups are at higherrisk for AKI and CKD in 31% and 23% of countries,respectively. For AKI, ethnic groups are at higher
102 | Health information systems ISN Global Kidney Health Atlas | 2019
Figure 7.8 | Adoption of practices to identify CKD in high-risk groups, by ISN region
n Africa n Eastern & Central Europe n Latin America n Middle East n NIS & Russia n North America n North & East Asia n OSEA n South Asia n Western Europe
Hypertension
90%82%
100%100%100%100%100%
93%14%
90%
Diabetes mellitus
90%100%100%100%100%100%100%100%
14%95%
Cardiovascular diseases
66%73%
90%92%
75%80%
100%80%
14%80%
Autoimmune/multisystem disorders
66%64%
89%92%
100%90%
100%73%
14%80%
Age ≥ 65 years old
34%45%
67%75%
38%20%
86%33%
0%55%
Urological disorders
76%59%
94%83%
88%70%
86%67%
14%65%
Chronic users of nephrotoxic medications
41%50%
39%42%
38%50%
57%40%
14%50%
High-risk ethnic groups
10%0%
6%8%
13%50%
0%13%
0%10%
Family history of CKD
49%59%
44%33%
13%60%
43%53%
0%70%

ISN Global Kidney Health Atlas | 2019 Health information systems | 103
risk in 14% of low, 31% of lower-middle, 32% ofupper-middle, and 38% of high income countries(Figure 7.10). Ethnic groups are at higher risk forCKD in 6% of lower-middle, 32% of upper-middle,and 36% of high income countries. No low incomecountries reported ethnic groups being at a higherrisk for CKD (Figure 7.10).
Only 6 countries currently have AKI detectionprograms: 1 lower-middle (Congo), 3 upper-middle(Albania, Iran, Thailand), and 2 high (Oman, UnitedKingdom) income countries (Figure 7.11). Systemsto detect CKD are much more common: 35countries (23%) have existing programs. CKDdetection programs are more common in high
Figure 7.9 | Adoption of practices to identify CKD in high-risk groups, by World Bank income group
Figure 7.10 | Proportion of countries that report an ethnic group at a higher risk for kidney diseasethan the general population, by World Bank income group
n Yes (%) n No (%)
Ethnic group at for risk for AKI Ethnic group at risk for CKD
Low income Lower-middle income Upper-middle income High income
n Low income n Lower-middle income n Upper-middle incomen High income
Hypertension
86%86%
93%90%
Diabetes mellitus
86%86%
95%98%
Cardiovascular diseases
64%65%
76%85%
Autoimmune/multisystem disorders
50% 78%76%
81%
Age ≥ 65 years old
36%22%
50%59%
Urological disorders
73%70%71%73%
Chronic users of nephrotoxicmedications
45%30%
38%54%
High-risk ethnic groups
5%8%
2%19%
Family history of CKD
50%41%45%
54%
Figure 7.11 | Existence of current AKI and CKD detection programs, by World Bank income group
n Yes (%) n No (%)
AKI detection program CKD detection program
Low income Lower-middle income Upper-middle income High income

Country ISN region World Bank group
Etiology reactive
approach
Active screening(routine healthencounters)
Active screening(specific screening
processes) OtherNot
reported
104 | Health information systems ISN Global Kidney Health Atlas | 2019
(30%; n = 17), upper-middle (24%; n = 10), andlower-middle (20%; n = 7) income countries than inlow income countries (5%; n = 1) (Figure 7.11).
Implementation approaches vary among the 6countries with current AKI detection programs: 1country adopts only a reactive approach, 1country uses only active screening through routinehealth encounters, 2 countries use both methodsof active screening (routine health encounters andspecific screening processes), and 1 country usesall 3 types as well as other methods (Table 7.6).Implementation approaches also vary among the35 countries with current CKD detectionprograms: 17 countries adopt reactiveapproaches, 17 countries implement activescreening through routine health encounters, 12countries actively screen through specificprocesses, and 4 adopt other approaches(Australia, Egypt, Kenya, and Samoa). The 1 lowincome country implements active screeningthrough routine health encounters, and the 7lower-middle income countries use a mix ofreactive approaches (n = 3), routine healthencounters (n = 3), specific screening processes(n = 2), and other implementation approaches (n= 2) (Figure 7.12). Among the 10 upper-middleincome countries with current CKD detectionprograms, 6 adopt reactive approaches, 6actively screen during routine health encounters,4 use specific screening processes, and one
screens through other means. Lastly, among the17 high income countries with current CKDdetection programs, 8 use reactive approaches,7 screen during routine health encounters, 6 usespecific screening processes, and 1 uses otherapproaches (Figure 7.12).
Figure 7.12 | Methods of implementingCKD detection programs, by World Bankincome group
n Low income n Lower-middle income n Upper-middle incomen High income
Reactive approach
43%60%
47%
Active screening (routine health encounters)
100%43%
60%41%
Active screening (specific screening processes)
29%40%
35%
Other
29%10%
6%
Table 7.6 | Methods of implementing AKI detection programs
Albania Eastern & Central Europe Upper-middle income l l
Congo, Rep. Africa Lower-middle income l
Iran, Islamic Rep. Middle East Upper-middle income l
Oman Middle East High income l l
Thailand OSEA Upper-middle income l l l l
United Kingdom Western Europe High income l

ISN Global Kidney Health Atlas | 2019 Leadership, advocacy, and barriers to ESKD care | 105
Nearly half (47%) of the countries surveyed havecurrent national strategies for non-communicablediseases (NCDs) (Figure 8.1): 63% of high, 44% ofupper-middle, 37% of lower-middle, and 32% oflow income countries (Table 8.1, Figure 8.2). Anadditional 21 countries (14% overall) have strategiesunder development. Almost half (41%) of lowincome countries do not have existing strategies orstrategies under development, compared to 26%of lower-middle, 32% of upper-middle, and 20% ofhigh income countries.
SECTION 8
LEADERSHIP, ADVOCACY, AND BARRIERS TOESKD CARE
8.1 Policy and strategy
Figure 8.1 | Existence of a national strategyfor NCDs
n Strategy in place (47%) n Strategy under development (14%) n No strategy (27%) n Unknown (12%)
YesN (%)
Yes, under developmentN (%)
NoN (%)
UnknownN (%)
Table 8.1 | Existence of a national strategy for NCDs
Overall 73 (47) 21 (14) 42 (27) 18 (12)
ISN region
Africa 14 (34) 5 (12) 16 (39) 6 (15)
Eastern & Central Europe 9 (47) 4 (21) 5 (26) 1 (5)
Latin America 10 (56) 3 (17) 4 (22) 1 (6)
Middle East 3 (27) 1 (9) 6 (55) 1 (9)
NIS & Russia 2 (29) 2 (29) 2 (29) 1 (14)
North America 6 (67) 1 (11) 1 (11) 1 (11)
North & East Asia 5 (71) 0 (0) 1 (14) 1 (14)
OSEA 12 (80) 1 (7) 1 (7) 1 (7)
South Asia 2 (29) 3 (43) 2 (29) 0 (0)
Western Europe 10 (50) 1 (5) 4 (20) 5 (25)
World Bank income group
Low income 7 (32) 3 (14) 9 (41) 3 (14)
Lower-middle income 13 (37) 9 (26) 9 (26) 4 (11)
Upper-middle income 18 (44) 6 (15) 13 (32) 4 (10)
High income 35 (63) 3 (5) 11 (20) 7 (13)
Rows may not total to 100% due to rounding.

106 | Leadership, advocacy, and barriers to ESKD care ISN Global Kidney Health Atlas | 2019
Overall, 69 countries (44%) have a nationalstrategy for improving CKD care. Among these,32 (46%) have a standalone strategy for CKDcare and the remaining 37 (54%) have a strategythat is part of a general strategy for NCDmanagement. Over half (53%) of the countriessurveyed do not have a strategy for CKD care.While more than half of the countries in LatinAmerica, North and East Asia, OSEA, andWestern Europe have CKD strategies, suchstrategies are less common in North America(44%), Eastern and Central Europe (42%), Africa(34%), South Asia (29%), the Middle East (18%),and NIS and Russia (0%) (Figure 8.3).
Among the 32 CKD-specific strategies, 22(69%) cover non-dialysis dependent CKD, 24(75%) cover chronic dialysis, and 22 (69%)cover kidney transplantation.
Among the CKD-specific strategies, non-dialysisdependent CKD is covered in all 3 strategies inNorth and East Asia, both strategies in theMiddle East, and most strategies in LatinAmerica (7/8), Western Europe (4/5), Easternand Central Europe (3/4), and OSEA (3/5)(Figure 8.4). The CKD-specific strategy in SouthAsia (Sri Lanka) does not address non-dialysisdependent CKD.
Chronic dialysis is included in most CKD-specificstrategies. All strategies in Africa (4), North andEast Asia (3), and South Asia (1) cover dialysis, asdo most strategies in Latin America (7/8), Easternand Central Europe (3/4), and Western Europe(3/5) (Figure 8.4). One of the 2 strategies in theMiddle East and 2 of the 5 strategies in OSEAcover dialysis.
All 3 CKD-specific strategies in North and EastAsia and the 1 strategy in South Asia (Sri Lanka)cover kidney transplantation (Figure 8.4), as domost strategies in Latin America (7/8), Easternand Central Europe (3/4), and Western Europe(3/5). One of the 2 strategies in the Middle Eastand 2 of the 5 strategies in OSEA cover kidneytransplantation. (Figure 8.4).
Among the 37 general NCD strategies thatinclude CKD, 19 (51%) cover non-dialysisdependent CKD, 20 (54%) cover chronic dialysis,and 13 (35%) cover kidney transplantation. Bothstrategies in North and East Asia and moststrategies in OSEA (3/4) and Africa (6/10) coverCKD (Figure 8.4). Only half of the strategies inLatin America (3/6) and North America (2/4)cover CKD; even fewer strategies in WesternEurope (2/6) and Eastern and Central Europe(1/4) include CKD. Both general NCD strategies
Figure 8.2 | Existence of a national strategy forNCDs, by World Bank income group
n Strategy in place (%) n Strategy under development (%) n No strategy (%) n Unknown (%)
Low income Lower-middle income Upper-middle income High income
Figure 8.3 | Existence of a national strategy forimproving CKD care, by ISN region
n Standalone CKD-specific strategy (%)n Part of a general NCD strategy (%)n No strategy (%)n Unknown (%)
Africa Eastern & Central Europe Latin America Middle East NIS & Russia North America North & East Asia OSEA South Asia Western Europe

ISN Global Kidney Health Atlas | 2019 Leadership, advocacy, and barriers to ESKD care | 107
in North and East Asia and the 1 strategy inSouth Asia (India) include chronic dialysis, as do5 of the 6 strategies in Latin America and 3 ofthe 4 in North America (Figure 8.4). Dialysis isincluded in general NCD strategies lessfrequently in Eastern and Central Europe (2/4),Africa (4/10), Western Europe (2/6), and OSEA(1/4). Both general NCD strategies in North andEast Asia cover kidney transplantation, as domost strategies in Latin America (4/6) (Figure8.4). Half of the strategies in Eastern and CentralEurope (2/4), Western Europe (3/6), NorthAmerica (1/4), and OSEA (1/4), and just 1 of the10 strategies in Africa cover transplantation. The1 general NCD strategy in South Asia (India)
does not include transplantation. No countries inthe Middle East or NIS and Russia have generalNCD strategies that cover any elements ofkidney care (Figure 8.4).
Overall, 34% of countries have CKD-specificpolicies (Table 8.2). The percentage of countrieswith policies exceeds the global average inEastern and Central Europe (58%), North andEast Asia (57%), OSEA (53%), Western Europe(45%), Latin America (39%), and the Middle East(36%), and falls below the global average inNorth America (33%), Africa (15%), South Asia(14%), and NIS and Russia (0%) (Table 8.2). Nolow income countries have CKD-specificpolicies, whereas 29% of lower-middle, 29% of
Figure 8.4 | Kidney conditions covered by CKD-specific and general NCD strategies, by ISN region
n CKD-specific strategy n General NCD strategy
Non-dialysis CKD Chronic dialysis Kidney transplantation
Africa 0% 100% 50% 60% 40% 10%
Eastern & Central Europe 75% 75% 75% 25% 50% 50%
Latin America 88% 88% 88% 50% 83% 67%
Middle East 100% 50% 50% 0% 0% 0%
NIS & Russia 0% 0% 0% 0% 0% 0%
North America 0% 0% 0% 50% 75% 25%
North & East Asia 100% 100% 100% 100% 100% 100%
OSEA 60% 40% 40% 75% 25% 25%
South Asia 0% 100% 100% 0% 100% 0%
Western Europe 80% 60% 60% 33% 33% 33% These data are only for countries that reported a strategy.

108 | Leadership, advocacy, and barriers to ESKD care ISN Global Kidney Health Atlas | 2019
upper-middle, and 55% of high incomecountries have such policies (Figure 8.5).
Among the countries with CKD policies, 38(83%) have national CKD policies only, 5 (11%)have regional policies only, and 3 (7%) haveboth national and regional CKD policies. No lowincome countries have CKD policies at any level(Figure 8.6). Among the lower-middle incomecountries with policies, 8 (89%) have nationalpolicies and 1 (11%) has a regional policy.Among the upper-middle income countries withpolicies, 11 (92%) have national policies onlyand 1 (8%) has both a national and regionalpolicies. Among the high income countries withCKD policies, 19 (76%) have national policiesonly, 4 (16%) have regional policies only, and 2(8%) have both national and regional policies(Figure 8.6).
Figure 8.5 | Existence of CKD-specific policies,by World Bank income group
n Have policy (%) n No policy (%) n Unknown (%)
Low income Lower-middle income Upper-middle income High income
Figure 8.6 | Existence of CKD policies, byWorld Bank income group
n National policies only (%) n Regional policies only (%) n Both national and regional policies (%)n No policy
Low income Lower-middle income Upper-middle income High income
Yes N (%)
NoN (%)
UnknownN (%)
Overall 53 (34) 94 (61) 7 (5)
ISN region
Africa 6 (15) 34 (83) 1 (2)
Eastern & Central Europe 11 (58) 8 (42) 0 (0)
Latin America 7 (39) 10 (56) 1 (6)
Middle East 4 (36) 7 (64) 0 (0)
NIS & Russia 0 (0) 6 (86) 1 (14)
North America 3 (33) 4 (44) 2 (22)
North & East Asia 4 (57) 3 (43) 0 (0)
OSEA 8 (53) 7 (47) 0 (0)
South Asia 1 (14) 6 (86) 0 (0)
Western Europe 9 (45) 9 (45) 2 (10)
World Bank income group
Low income 0 (0) 22 (100) 0 (0)
Lower-middle income 10 (29) 24 (69) 1 (3)
Upper-middle income 12 (29) 26 (63) 3 (7)
High income 31 (55) 22 (39) 3 (5)
Table 8.2 | Existence of CKD-specific policies
Rows may not total to 100% due to rounding.

ISN Global Kidney Health Atlas | 2019 Leadership, advocacy, and barriers to ESKD care | 109
Worldwide, 13% of governments recognize AKIas a health priority (Table 8.3, Figure 8.7). Thepercentage of countries recognizing AKI as ahealth priority exceeds the global average in theMiddle East (18%), Africa (17%), Eastern andCentral Europe (16%), NIS and Russia (14%),North and East Asia (14%), and OSEA (13%),and falls below the global average in LatinAmerica (11%), North America (11%), WesternEurope (5%), and South Asia (0%). Governmentalrecognition of AKI as a health priority is morecommon in lower-middle income countries (23%)than in high (11%), upper-middle (10%) and low(9%) income countries (Table 8.3).
AKI advocacy groups exist in only 14% ofcountries worldwide (Table 8.3, Figure 8.8). Thepercentage of countries with AKI advocacy
groups exceeds the global average in South Asia(29%), Western Europe (25%), Eastern andCentral Europe (16%), NIS and Russia (14%),and North and East Asia (14%), and falls belowthe global average in Africa (12%), Latin America(11%), North America (11%), OSEA (7%) and theMiddle East (0%). The existence of AKI advocacygroups does not appear to relate to countryincome; such groups are present in 9% of low,14% of lower-middle, 10% of upper-middle, and18% of high income countries (Table 8.3).
Overall, governmental support is greater for CKDthan for AKI. More than half (51%) of nationalgovernments worldwide recognize CKD as ahealth priority (Table 8.4, Figure 8.7). At least halfof the national governments in North America(78%), North and East Asia (71%), Latin America
8.2 Advocacy
Figure 8.7 | Government support for AKI, CKD,and ESKD treatment and prevention
n Governmental recognition as health priority (%) n No governmental recognition as health priority (%)
AKI CKD ESKD
Figure 8.8 | Advocacy for AKI, CKD, and ESKDtreatment and prevention
n Advocacy group (%) n No advocacy group (%) n Unknown (%)
AKI CKD ESKD
Table 8.3 | Advocacy and support for AKItreatment and prevention
Governmentalrecognition
of AKI as a health
priorityN (%)
Presence of advocacy
group for AKI
N (%)
Overall 20 (13) 21 (14)
ISN region
Africa 7 (17) 5 (12)
Eastern & Central Europe 3 (16) 3 (16)
Latin America 2 (11) 2 (11)
Middle East 2 (18) 0 (0)
NIS & Russia 1 (14) 1 (14)
North America 1 (11) 1 (11)
North & East Asia 1 (14) 1 (14)
OSEA 2 (13) 1 (7)
South Asia 0 (0) 2 (29)
Western Europe 1 (5) 5 (25)
World Bank income group
Low income 2 (9) 2 (9)
Lower-middle income 8 (23) 5 (14)
Upper-middle income 4 (10) 4 (10)
High income 6 (11) 10 (18)

110 | Leadership, advocacy, and barriers to ESKD care ISN Global Kidney Health Atlas | 2019
(67%), Eastern and Central Europe (53%), andWestern Europe (50%) recognize CKD as ahealth priority, whereas less than half of thegovernments in Africa (49%), OSEA (47%), theMiddle East (36%), NIS and Russia (29%), andSouth Asia (29%) recognize CKD as a healthpriority. More governments of high (57%) andupper-middle (63%) income countries tend torecognize CKD as a health priority thangovernments of lower-middle (43%) and low(27%) income countries (Table 8.4).
Similarly, advocacy for CKD is much greater thanfor AKI. CKD advocacy groups exist in 63 (41%)of countries (Table 8.4, Figure 8.8). CKDadvocacy groups are present in more than half ofthe countries in North and East Asia (71%), NorthAmerica (67%), OSEA (60%), South Asia (57%),and Latin America (56%), and in less than half ofthe countries in Eastern and Central Europe(47%), Africa (29%), the Middle East (27%),
Western Europe (20%), and NIS and Russia(14%). Advocacy groups for CKD are present in ahigher percentage of high (43%), upper-middle(49%), and lower-middle (40%) income countriesthan of low income countries (23%) (Table 8.4).
Governmental support for ESKD prevention andKRT is similar to that for CKD, and is prevalent in58% of countries (Table 8.5, Figure 8.7). Thepercentage of governments providing support forESKD prevention and KRT exceeds the globalaverage in North and East Asia (100%), NIS andRussia (86%), Eastern and Central Europe (74%),the Middle East (73%), North America (67%), andWestern Europe (65%), and falls below the globalaverage in South Asia (57%), OSEA (53%), LatinAmerica (44%), and Africa (37%). Governmentalsupport for ESKD increases with income level, withgovernments of 23% of low, 57% of lower-middle,61% of upper-middle, and 70% of high incomecountries providing support (Table 8.5).
Table 8.4 | Advocacy and support for CKDtreatment and prevention
Governmentalrecognition
of CKD as a health
priorityN (%)
Presence of advocacy
group for CKD N (%)
Overall 79 (51) 63 (41)
ISN region
Africa 20 (49) 12 (29)
Eastern & Central Europe 10 (53) 9 (47)
Latin America 12 (67) 10 (56)
Middle East 4 (36) 3 (27)
NIS & Russia 2 (29) 1 (14)
North America 7 (78) 6 (67)
North & East Asia 5 (71) 5 (71)
OSEA 7 (47) 9 (60)
South Asia 2 (29) 4 (57)
Western Europe 10 (50) 4 (20)
World Bank income group
Low income 6 (27) 5 (23)
Lower-middle income 15 (43) 14 (40)
Upper-middle income 26 (63) 20 (49)
High income 32 (57) 24 (43)
Table 8.5 | Advocacy and support for ESKDand KRT
Governmentalrecognition of ESKD/KRT as a health
priorityN (%)
Presence ofadvocacy
group for
ESKD/KRTN (%)
Overall 89 (58) 60 (39)
ISN region
Africa 15 (37) 12 (29)
Eastern & Central Europe 14 (74) 8 (42)
Latin America 8 (44) 9 (50)
Middle East 8 (73) 1 (9)
NIS & Russia 6 (86) 2 (29)
North America 6 (67) 5 (56)
North & East Asia 7 (100) 6 (86)
OSEA 8 (53) 6 (40)
South Asia 4 (57) 4 (57)
Western Europe 13 (65) 7 (35)
World Bank income group
Low income 5 (23) 4 (18)
Lower-middle income 20 (57) 12 (34)
Upper-middle income 25 (61) 20 (49)
High income 39 (70) 24 (43)

Geography1
N (%)Physician2
N (%)Patient3
N (%)Nephrologist4
N (%)
Healthcaresystem5
N (%)
Lack ofpolitical priorityN (%)
EconomicfactorsN (%)
OtherN (%)
NoneN (%)
ISN Global Kidney Health Atlas | 2019 Leadership, advocacy, and barriers to ESKD care | 111
The extent of advocacy for ESKD and KRT issimilar to CKD. Advocacy groups for ESKD arepresent in 39% of countries worldwide (Table 8.5,Figure 8.8). The percentage of countries with ESKDadvocacy groups exceeds the global average inNorth and East Asia (86%), South Asia (57%),North America (56%), Latin America (50%), Eastern
and Central Europe (42%), and OSEA (40%), andfalls below the global average in Western Europe(35%), Africa (29%), NIS and Russia (29%), and theMiddle East (9%). ESKD advocacy groups exist ina higher percentage of high (43%), upper-middle(49%), and lower-middle (34%) income countriesthan of low (18%) income countries (Table 8.5).
8.3 Barriers to optimal ESKD care
Many barriers to optimal ESKD care exist (Table8.6). More than half of countries worldwideexperience barriers related to economic factors(64%); patient knowledge or attitude (63%);nephrologist availability (60%), physician availability,access, knowledge, and/or attitude (58%);
distance from care or prolonged travel time (55%);or availability, access, and capability of the healthcare system (55%). Overall, 45% of countriesreported a lack of political priority and 10% ofcountries reported other barriers to optimal ESKDcare, while 8% of countries reported no barriers.
Table 8.6 | Barriers to optimal ESKD care
1 Distance from care or prolonged travel time2 Availability, access, knowledge, attitude3 Knowledge, attitude4 Availability5 Availability, access, capability
Overall 85 (55) 89 (58) 97 (63) 92 (60) 85 (55) 70 (45) 99 (64) 15 (10) 13 (8)
ISN region
Africa 32 (78) 32 (78) 30 (73) 34 (83) 34 (83) 23 (56) 39 (95) 5 (12) 1 (2)
Eastern & Central Europe 6 (32) 7 (37) 8 (42) 6 (32) 9 (47) 10 (53) 10 (53) 2 (11) 1 (5)
Latin America 14 (78) 12 (67) 15 (83) 14 (78) 13 (72) 10 (56) 12 (67) 3 (17) 0 (0)
Middle East 2 (18) 6 (55) 8 (73) 6 (55) 1 (9) 2 (18) 4 (36) 0 (0) 1 (9)
NIS & Russia 2 (29) 3 (43) 4 (57) 4 (57) 2 (29) 3 (43) 5 (71) 0 (0) 0 (0)
North America 3 (33) 4 (44) 6 (67) 4 (44) 5 (56) 3 (33) 7 (78) 0 (0) 0 (0)
North & East Asia 4 (57) 4 (57) 3 (43) 3 (43) 3 (43) 2 (29) 3 (43) 0 (0) 0 (0)
OSEA 12 (80) 13 (87) 13 (87) 12 (80) 11 (73) 8 (53) 11 (73) 4 (27) 0 (0)
South Asia 7 (100) 7 (100) 7 (100) 7 (100) 7 (100) 6 (86) 6 (86) 0 (0) 0 (0)
Western Europe 3 (15) 1 (5) 3 (15) 2 (10) 0 (0) 3 (15) 2 (10) 1 (5) 10 (50)
World Bank income group
Low income 19 (86) 19 (86) 19 (86) 20 (91) 21 (95) 15 (68) 20 (91) 2 (9) 0 (0)
Lower-middle income 25 (71) 24 (69) 23 (66) 26 (74) 24 (69) 17 (49) 32 (91) 3 (9) 1 (3)
Upper-middle income 27 (66) 26 (63) 32 (78) 29 (71) 26 (63) 26 (63) 32 (78) 4 (10) 0 (0)
High income 14 (25) 20 (36) 23 (41) 17 (30) 14 (25) 12 (21) 15 (27) 6 (11) 12 (21)

112 | Leadership, advocacy, and barriers to ESKD care ISN Global Kidney Health Atlas | 2019
Barriers vary across ISN regions. Geographicbarriers are high in Africa (78%), Latin America(78%), North and East Asia (57%), OSEA (80%),and South Asia (100%). Geographic barriers areless prevalent in Eastern and Central Europe(32%), the Middle East (18%), NIS and Russia(29%), North America (33%), and Western Europe(15%). Barriers due to limited availability ofnephrologists are most prevalent in South Asia(100% of countries), Africa (83%), OSEA (80%),and Latin America (78%). Nephrologist availabilityis a barrier in more than half of the countries inNIS and Russia (57%) and the Middle East (55%),and in a significant proportion of countries inNorth America (44%), North and East Asia (43%),and Eastern and Central Europe (32%).Healthcare system-level barriers are mostprevalent in South Asia (100%), Africa (83%),OSEA (73%), Latin America (72%), and North
America (56%). Healthcare system relatedbarriers exist in nearly half (47%) of the countriesin Eastern and Central Europe as well ascountries in North and East Asia (43%), NIS andRussia (29%), and the Middle East (9%).
In low income countries, barriers related to thehealthcare system (95%), nephrologist availability(91%), and lack of political priority (68%) are highlyprevalent (Table 8.6), whereas these barriers aremuch less prevalent in high income countries(25%, 30%, and 21%, respectively). Barriersrelated to nephrologist availability and healthcaresystems are prevalent in more than half of lower-middle (74% and 69%, respectively) andupper-middle (71% and 63%, respectively)income countries. Among the 13 countries withno reported barriers to optimal ESKD care, 12 arehigh income countries and 1 is a lower-middleincome country (Table 8.6).

ISN Global Kidney Health Atlas | 2019 Discussion | 113
The ISN has been working collaboratively withexisting organizations and initiatives at theinternational and national levels to promote earlydetection and effective treatment of kidney diseasein order to improve patient health and quality of life.By understanding and potentially helping to shaperelevant health policies, practices andinfrastructure, the ISN aims to facilitate theimplementation of equitable and ethical care forkidney patients in all regions and countries of theworld. Over the last few years, the ISN hasspecifically focused on facilitating the developmentand implementation of strategies to enhance ESKDcare in terms of availability, equity, and access.
The GKHA is a worldwide initiative aimed atidentifying and evaluating global capacity for kidneycare, using the WHO’s key building blocks of afunctional health system as a framework.50 The firstassessment in 201762 revealed variability in globalkidney care, with significant gaps in kidney careacross all domains, particularly in low and lower-middle income countries. This publicationdescribes the results of the second iteration of thesurvey aimed at specifically defining the currentglobal status of the burden of ESKD, and thestructures and organization of care delivery. Thisinformation helps reveal gaps in care structuresand delivery systems around the globe to guidestrategic development and to further document thecurrent status of ESKD care as a means to informadvocacy efforts and strategies, and to monitorprogress toward closing identified gaps.
A key finding of this survey is the immensevariability across countries in terms of funding forKRT. For instance, whilst most countries fund
dialysis and transplantation through public sources,fewer than half (48%) of low income countries andjust over half (57%) of lower-middle incomecountries provide public funding for KRT (with nocharge or some fees at the point of delivery). Thisobviously amplifies limitations associated with KRTaccessibility and equity of care across countries,thereby contributing to increased mortality andmorbidity risk associated with kidney disease.
However, it is apparent that countries have donewell in terms of providing the necessaryinfrastructure and technology for KRT, as allcountries offer HD and three-quarters offer PD andtransplantation. Unfortunately, availability is muchmore limited for chronic PD or transplantationservices, particularly in low income countries.Given the high costs of chronic HD facilities,increasing access to these other means of ESKDcare, specifically PD, may allow countries withlimited resources to improve access to care.However, very few countries reported initiatingESKD care with PD. Although this service istypically less expensive than HD, costs may be abarrier for some countries. Overall, accessibility ofkidney transplantation services is low, particularly inlow income countries. Irrespective of income level,conservative care is highly available. However,access to medically-advised (in contrast toresource-constrained) conservative care differsmore by country income level: the majority of highincome countries offer this service, compared tojust one-third of low income countries. Availabilityof services to appropriately manage ESKD also islimited in some areas. The capacity to manage (i.e.,test and treat) anemia, high blood pressure,electrolyte disorders, and chronic metabolic
SECTION 9
DISCUSSION
9.1 Gaps in services and resources

114 | Discussion ISN Global Kidney Health Atlas | 2019
acidosis is high in most countries surveyed,whereas the capacity to manage renal bonedisease is limited, particularly in low and lower-middle income countries. By ensuring adequateworkforce and funding levels, many countries caneasily advance and make meaningful progresstoward ensuring high quality ESKD care.
Our results confirm initial findings from the baselinesurvey for the GKHA regarding responsibility forkidney care delivery. In most of the countriessurveyed, nephrologists are primarily responsiblefor delivering ESKD care. In terms of distribution,the density of nephrologists in high incomecountries is over 60 times that of low incomecountries, and the majority of low income countriesreported key shortages of other health careprofessionals involved in kidney care, particularlyinterventional radiologists, surgeons, andtransplant coordinators.
The role of comprehensive health informationsystems (e.g., renal registries) in monitoring CKD toprevent progression to ESKD and as an essentialelement in optimal CKD delivery cannot beoveremphasized. Overall, few registries for AKI andnon-dialysis CKD management exist. Similarly, fewsystems to detect AKI exist in practice: only sixcountries reported having processes in place.
Fewer than half of the countries surveyed reporteda national strategy for improving CKD care andone-third reported CKD-specific policies.Government recognition of CKD (63% ofcountries) and ESKD (58% of countries) wasmuch higher than recognition of AKI (13% ofcountries). In addition to issues with financing,inadequate workforce, and lack of political will(i.e., government recognition), many barriers tooptimal ESKD care exist, including: patientknowledge or attitude; distance from care orprolonged travel time; and availability, access, andcapability of the healthcare system, particularly inlow income countries.
Compared to 125 countries in the initial survey, thissurvey covers 160 countries and over 98% of theworld’s population. In addition to the availability ofKRT, the current survey findings explore otherelements of care, such as accessibility, quality, and
affordability. In both surveys, all countries reportedchronic HD as an available service. In the previoussurvey, 95 out of 119 (80%) countries reportedchronic PD as an available service, compared to119 out of 156 (76%) countries in the currentsurvey, including 4 countries (Bolivia, Egypt, Fiji,and Swaziland) that had previously reported PD asunavailable. However, 4 countries (Armenia, Kenya,Syria, and Uganda) that had reported PD as anavailable service in the previous survey reported itas unavailable in the current survey. In the previoussurvey, 94 out of 119 (79%) countries reportedkidney transplantation as an available service,compared to 114 out of 155 (74%) countries in thecurrent survey. Tanzania is the only country thathad reported kidney transplantation as unavailablein the previous survey, yet reported it as available inthe current survey.
In the previous survey, registries for CKD and AKIwere reported in 9 and 8 out of 117 (8% and 7%)countries, respectively, compared to 18 and 13out of 154 (12% and 8%) countries in the currentsurvey. Seven countries that had reported no CKDregistry in the previous survey (Argentina,Colombia, Japan, Lao PDR, Oman, Slovakia, andTaiwan) reported the existence of a CKD registry inthe current survey. However, 3 countries (Albania,Norway, and West Bank and Gaza) that hadpreviously reported the existence of a CKD registryreported no registry in the current survey. Five ofthe countries that had reported no AKI registry inthe previous survey (Lao PDR, Mongolia, Oman,United Kingdom, and Zambia) reported one in thissurvey, and 4 countries (Albania, Pakistan, Poland,and West Bank and Gaza) that had previouslyreported the existence of an AKI registry reportedno registry in the current survey. More countriesare developing KRT registries. In the previoussurvey, 75 and 68 out of 117 countries reportedhaving registries for dialysis and transplantation,respectively; in the current survey, those figureshave increased to 101 and 88 out of 154countries, respectively.
Key implications of the findings from this surveyiteration are discussed in the sections that followrelative to the key domains covered in the survey.

ISN Global Kidney Health Atlas | 2019 Discussion | 115
9.2.1 Health finance andservice delivery
Nearly half (48%) of all countries provide publicfunding for non-dialysis CKD care. High incomecountries are more likely to cover non-dialysisCKD care (68% of countries) than upper-middle(41%), lower-middle (43%) and low (22%)income countries. Low income countriesreported the highest use of private funding(22%), followed by lower-middle (16%), high(1%), and upper-middle (0%) income countries.Non-dialysis CKD care is imperative forpreventing ESKD. Many elements of this care(medications and monitoring to reduce risk ofprogression and minimize disease complications)can be costly to patients. Countries that do notcover these care costs may bear a higher burdenof ESKD due to reduced capacity to preventprogression of CKD because patients may notbe able to afford appropriate care.
Public funding for dialysis and transplantation ismore common than for non-dialysis CKD careacross countries. Overall, 64% of countriesprovide public funding for KRT, with 43%charging no fees at the point of delivery and 21%charging some fees. High income countriesreported public funding for KRT more often (78%)than upper-middle (61%), lower-middle (57%)and low (48%) income countries. Governmentsof more than half of low income countries do notfund KRT, which may result in mortality that couldbe prevented through appropriate KRT care.Delivering appropriate KRT is expensive, andimplementing universal coverage for all patientsworldwide will be a challenging task. Other formsof treatment (PD or conservative care, forexample) may be suitable options in countrieswith limited capacity to provide universal fundingfor HD or transplantation.
Half of all countries provide public funding forsurgery to create vascular access for dialysis.
For HD, 58% of countries cover costs of surgeryto insert a central venous catheter, and 54%cover costs to insert a fistula or create a graft.Surgery to create access for PD (i.e., catheterinsertion) is publicly funded in 54% of countries.Appropriate and proper access to dialysis isessential for effective dialysis treatmentoutcomes. Just under half of countries, most ofwhich are in the low and lower-middle incomecategories, do not cover costs associated withaccess creation. Including this element of care ingovernment coverage (in places that funddialysis treatments) may result in improveddialysis outcomes for patients, reducingunnecessary complications that are costly.
Worldwide, 40% of countries reported regionalvariation in ESKD care delivery, in terms oforganization, structures, and service deliverypatterns. Variation in care delivery is more likely inlow income countries than in lower-middle,upper-middle, and high income countries.Variation in access to KRT between children andadults was also reported; variation is highest inlow income countries, followed by lower-middle,upper-middle, and high income countries.
The management of ESKD varies worldwide.Structured ESKD management systems do notexist in 13% of low, 10% of upper-middle, and3% of lower-middle income countries. All highincome countries have structured ESKDmanagement systems. ESKD care is managedby national governments in 56% of countries;hospitals, trusts, and organizations in 38% ofcountries; provincial, regional, or stategovernments in 21% of countries; NGOs in 4%of countries; and other management structuresin 8% of countries. The presence of a structuredsystem enables the standardized delivery ofESKD care as well as systematic monitoring ofprocess measures, which are important toensure high quality and equitable care.
9.2 Implications

116 | Discussion ISN Global Kidney Health Atlas | 2019
9.2.2 Health workforce fornephrology care
Nephrologists are primarily responsible for ESKDcare delivery and oversight in 92% of countries.Worldwide, the median number of nephrologists is9.95 pmp. The average density of nephrologistsincreases with income; it is 0.2 pmp in low incomecountries, followed by 1.6 pmp in lower-middle,10.8 pmp in upper-middle, and 23.2 pmp in highincome countries. The median number ofnephrology trainees is 1.4 pmp. Similarly, densityof trainees increases with income; it is 0.1 pmp inlow income, 0.6 pmp in lower-middle, 1.2 pmp inupper-middle, and 3.7 pmp in high incomecountries. While these densities do not considerfactors such as burden of CKD or ESKD, ordensities of other health care professionals whoshare the workload for ESKD care, morenephrologists are needed in low income countries.Task shifting, which involves training primary careproviders, nurses, or other appropriateprofessionals to provide ESKD care with remoteguidance from nephrologists and/or support fromstandard algorithms, may help improve capacityto deliver high quality ESKD care in countries withlimited nephrologist availability.
Most countries reported shortages of health careproviders essential for ESKD care. In addition tothe shortage of nephrologists reported by 70% ofcountries surveyed, other health careprofessionals are in limited supply, includinginterventional radiologists for HD access (66%) orPD access (53%); surgeons for transplantation(65%), HD access (65%), and PD access (53%);vascular access coordinators (63%); counselors orpsychologists (57%); dialysis nurses (57%);laboratory technicians (55%); transplantcoordinators (54%); dialysis technicians (49%);radiologists (ultrasound technicians) (20%); anddietitians (19%). Increasing the number of thesehealth care professionals to create multidisciplinaryteams is important, considering the complexity ofcare for ESKD patients. Furthermore, distributingthe workload for ESKD care across multipleproviders will increase the overall capacity of care,which is particularly important in areas withsignificant nephrologist shortages.
9.2.3 Access to essential medications,health products, and technologies forESKD care
All countries reported availability of chronic HDservices, and 76% of countries reportedavailability of chronic PD services. However, only23% of low income countries reported availabilityof chronic PD services, compared to 61% oflower-middle, 90% of upper-middle, and 96% ofhigh income countries. Increasing the use of PD,particularly in countries with limited resources,may help improve access to ESKD care. The lowPD uptake in low income nations reflects limitedinfrastructure (e.g., an inability to manufacture PDfluids and other consumables locally), limitedtraining and experience in delivering PD, and alack of patient motivation due to socio-culturaland economic factors.
Furthermore, variation in how both ESKD care ingeneral, and KRT specifically, are deliveredacross children and adults was reported. Nearly30% of countries reported within-countrydifferences in how ESKD care and KRT isdelivered between children and adults. Thisdiscrepancy is most common in low and lower-middle income countries.
Similarly, 74% of countries reported havingtransplantation services available; moreover,accessibility increases with income level. Only 23%of low income countries offer transplantation,compared to 69% of lower-middle, 83% of upper-middle, and 89% of high income countries. Kidneytransplantation is well-established as the preferredmethod of KRT. Access to transplantation can beimproved by promoting kidney donation andincreasing the number of facilities and surgeons,particularly in low income settings.
Due to the complexity of ESKD, services to detect,monitor, and manage anemia, bone disease,electrolyte disorders, and metabolic acidosis arecritical for optimal care delivery. Most countries,irrespective of income, reported the capacity tomeasure hemoglobin and blood pressure. Similarly,the capacity to manage electrolyte disorders andchronic metabolic acidosis is high in most

ISN Global Kidney Health Atlas | 2019 Discussion | 117
countries, with the exception of oral sodiumbicarbonate and potassium exchange resins,which are available in just 72% and 62% ofcountries, respectively. In contrast, the capacity tomanage renal bone disease varies. Most countrieshave the capacity to measure serum calcium andphosphorus and to administer calcium-phosphatebinders. However, fewer countries have thecapacity to administer non-calcium-basedphosphate binders or cinacalcet. Ability to measureserum parathyroid hormone is available in 65% ofcountries, and surgical services forparathyroidectomy are generally available in only56% of countries. Overall, capacity to monitorthese conditions is acceptable; however, treatmentoptions are limited. Increasing the availability ofmedications to manage electrolyte disorders andchronic metabolic acidosis (oral sodiumbicarbonate or potassium exchange resins) andbone mineral disease (non-calcium phosphatebinders or cinacalcet) is important to preventcomplications associated with ESKD.
Overall, in 72% of countries with available dialysisservices, at least half of patients with ESKD areable to access dialysis at the onset of kidneyfailure. However, access in low income countries isquite low (5%). Timely access to dialysis at theonset of ESKD is important to optimally preparepatients for treatment and reduce the risk ofadverse events, including heightened mortalityrisk.75 Among countries with PD available, only 4%report it as the initial treatment for most ESKDpatients. Initiating KRT with PD may improvesurvival during the first two years of treatment;moreover, it is less expensive and moreconvenient, as it can be performed in a patient’shome on a flexible schedule.76 Although theinitiation of KRT with PD should be promoted in allcountries, low income countries may particularlybenefit due to the lower associated costs.
Although 74% of countries have facilities availablefor kidney transplantation, accessibility to servicesis low, particularly in lower-middle and low incomesettings. Among countries with kidneytransplantation available, most patients have highaccess to care in 64% of high income countries,
compared to 30% of upper-middle, 13% of lower-middle, and 0% of low income countries.Increasing the capacity to perform kidneytransplantation services, particularly in lower-middle and low income countries, is challengingdue to cost constraints, limitations in the requisiteinfrastructure and expertise, as well as socio-cultural factors in some settings.
In nearly half (46%) of the countries surveyed,patients typically initiate HD with a temporarydialysis catheter. Patients in low income countriesare less likely to start HD with functioning vascularaccess or a tunneled dialysis catheter than patientsin other countries, and are more likely to initiatetreatment with a temporary dialysis catheter.Initiating treatment with functioning vascularaccess is important to ensure effective patientoutcomes and efficient dialysis treatment. However,in certain emergency situations, temporarycatheters are used as life-saving measures beforepermanent access is created or until kidneyfunction is recovered (in situations of AKI). Properlymonitoring early-stage CKD patients to sufficientlyprepare them for the initiation of dialysis ifprogression to ESKD occurs will help ensure timelyinsertion of permanent vascular access. Similarly,patient education on the best means of accessand the optimal timing for surgery is lacking. Only19% of countries reported that patients receiveeducation more than 75% of the time. Monitoringpatients with deteriorating kidney function isimportant to ensure they have sufficient time todecide on appropriate means of access if dialysisis eventually needed.
The proportion of centers that measure and reportquality indicators for dialysis service delivery varies.Quality indicators for HD and PD are similarlymeasured and reported. Blood pressure ismeasured and reported most of the time (HD:86%; PD: 85%), as is hemoglobin (HD: 88%; PD:84%). Patient survival and bone mineral markersfor both HD and PD patients are measured andreported in approximately 70% of countries.Technique survival is routinely measured andreported for HD patients in 51% of countries andfor PD patients in 61% of countries. Small solute

118 | Discussion ISN Global Kidney Health Atlas | 2019
clearance and PROMS are only measured andreported in approximately 60% and 30% ofcountries, respectively. Centers in more countriesmeasure and report quality indicators for kidneytransplant recipients. In most countries, centersreport patient survival (77%), kidney allograftfunction (73%), and graft survival (72%). In morethan half of the countries surveyed, centers reportdelayed graft (65%) and rejection rates (59%), andin nearly half of the countries (45%), centersroutinely measure and report on PROMS. Acrossall forms of KRT, measuring and reporting ofquality indicators increases with country incomelevel. Systematic and consistent monitoring ofprocess indicators is important to ensure allpatients within a country receive high quality andequitable care. Efforts to promote the use ofquality indicators in KRT care through access toguidelines, incentives, and feasible monitoringsystems (i.e., databases or registries) may improvethe quality of care provided.
Nutritional services for kidney care are generallyavailable worldwide. Measurement of serumalbumin is generally available in 92% of countries,and oral nutrition supplements are generallyavailable in 81% of countries. Anthropometricmeasurement services (BMI and body weight) areavailable in most countries, whereas skin foldassessments are only available in 41% ofcountries. Dietary counseling is generally availablein 59% of countries worldwide. Due to the complexdietary needs of ESKD patients, increasing accessto dietitians or other dietary counselors is importantto reduce risks of hyperkalemia and bone mineraldisease, among others.
Conservative care is delivered in 81% of countriesthat participated in the survey. The availability ofconservative care does not appear to beassociated with country income level. However,access to chosen or medically-advisedconservative care increases with country incomelevel: 87% of high income countries offer chosenconservative care, compared to 64% of upper-middle, 43% of lower-middle, and 33% of lowincome countries. Recognizing that dialysis ortransplantation may not always be the most
optimal or feasible KRT option is important toensure treatment is appropriate for patients.Conservative care is more than just the defaultoption when conventional KRT options such asdialysis or transplantation are unavailable orinaccessible (i.e., due to resource constraints orgeographic barriers); in appropriate circumstances,this mode of care leads to similar outcomes asconventional KRT. To ensure greater uptake andquality, guidelines and provider education andtraining about how to optimally deliver conservativecare are needed. The decision to chooseconservative care over other KRT approaches isimportant; providers and patients must collaborateduring the decision-making process to ensure themost optimal treatment option is delivered,considering factors such as lifestyle, healthoutcomes (comorbidity index, life expectancy), andresource availability.
Conservative care involves multiple health careproviders, a range of medical and psychologicaltreatments, and ongoing symptom monitoring. Theuse of a multidisciplinary team, the adoption ofshared decision-making practices, and theprovision of psychological, cultural, and spiritualsupport in conservative care delivery increases withcountry income level, but remains low overall.Additional training for health care providers islacking as well; it is offered in 0% of low, 24% oflower-middle, 21% of upper-middle, and 39% ofhigh income countries. Evidence-based guidelinesto increase awareness and education around howto deliver conservative care are needed.
9.2.4 Health information systems
Registries for AKI and non-dialysis CKD, which arenecessary to prevent ESKD, are lacking worldwide,irrespective of country income level. Only 13 AKIregistries and 19 non-dialysis CKD registries exist.Registries for managing ESKD are more common:66% of countries have dialysis registries (59% ofwhich require provider participation) and 57% havetransplantation registries (65% of which requireprovider participation). Registries to monitor AKI orearly stage CKD are critical for preventing orreducing disease progression to ESKD. Global

ISN Global Kidney Health Atlas | 2019 Discussion | 119
capacity to develop and implement these registriesmust be improved, along with datacomprehensiveness and quality. Furthermore,mandatory provider participation helps to ensureregistries are complete.
Overall, practices to identify CKD among high-riskgroups are common. Most countries, irrespectiveof income level, screen for CKD among peoplewith hypertension, diabetes, or urologicalconditions. Chronic users of nephrotoxicmedications, people with a family history of CKD,or high-risk ethnic groups are screened for CKD infew countries, regardless of country income level.Screening of patients with cardiovascular diseases,autoimmune or multisystem disorders, or thoseover 65 years of age is moderate, and increaseswith country income level. The prevalence of CKDdetection programs increases with country incomelevel; 35 countries have CKD detection programs,and most are implemented through activeapproaches to identify at-risk patients through theuse of pre-existing databases or electronicsystems. Only six countries currently have AKIdetection programs.
9.2.5 Leadership, advocacy, andbarriers to ESKD care
Overall, 47% of countries have current nationalstrategies for NCDs and 14% of countries aredeveloping them. Strategies are less common inlow income countries, whether current or underdevelopment. Among the countries surveyed, 44%have national strategies to improve CKD care: 46%are standalone strategies, and 54% are sub-strategies of general NCD management strategies.
Among the 32 CKD-specific strategies, 69% covernon-dialysis dependent CKD, 75% cover chronicdialysis, and 69% cover kidney transplantation.Among the 37 countries with general NCDstrategies that include CKD, 51% cover non-dialysis dependent CKD, 54% cover chronicdialysis, and 35% cover kidney transplantation.
Overall, 34% of countries have CKD-specificpolicies. Among the countries with CKD policies,83% have national CKD policies only, 11% have
regional policies only, and 7% have both nationaland regional CKD policies. No low incomecountries have policies, whereas 29% of lower-middle, 29% of upper-middle, and 55% of highincome countries have policies. It is important forlow income countries to develop CKD-specificpolicies to optimize the delivery of consistent andhigh quality ESKD care.
Worldwide, AKI, CKD, and ESKD are recognizedas health priorities by only 13%, 51%, and 58% ofgovernments, respectively. Only a fewgovernments recognize AKI as a health priority, andcountry income level does not appear to be afactor. However, more governments of high andupper-middle income countries tend to recognizeCKD and ESKD as health priorities thangovernments of lower-middle and low incomecountries. Governmental recognition of AKI, CKD,and ESKD as health priorities must increase tosupport the prioritization of policies and strategiesthat ensure adequate care for these conditions,which ultimately have great impacts on health carecosts and residents’ well-being.
Similarly, advocacy groups for AKI, CKD, andESKD exist in only 14%, 63%, and 39% ofcountries worldwide. The existence of AKIadvocacy groups does not appear to relate tocountry income level. Both CKD and ESKDadvocacy groups are more common in high,upper-middle, and lower-middle income countriesthan in low income countries. Advocacy groupsand government support may be closely linked,and increased advocacy through organizationsand institutions may help guide policymakers’decisions about how to prioritize competinghealth care needs. Increasing public awareness ofthe impacts of ESKD and prevention practicesthrough media and other resources may helppromote advocacy for CKD and persuade politicalleaders to take action.
Many barriers to optimal ESKD care exist,especially economic factors (reported by 64% ofcountries); patient knowledge or attitude (63%);nephrologist availability (60%); physician availability,access, knowledge, and/or attitude (58%);

120 | Discussion ISN Global Kidney Health Atlas | 2019
distance from care or prolonged travel time (55%);and availability, access, and capability of thehealthcare system (55%). In low income countries,barriers related to the healthcare system (95%),nephrologist availability (91%), and lack of politicalwill (68%) are highly prevalent, whereas thesebarriers are much less prevalent in high income
countries. Among the 13 (8%) countries with noreported barriers to optimal ESKD care, 12 are highincome countries and 1 is a lower-middle incomecountry. Efforts to understand why these barriersexist and importantly, how they can be reduced ormitigated, are crucial to increase global capacity todeliver kidney care.
Although approximately 0.1% of the world’spopulation has ESKD, many people who requireKRT do not receive treatment. The high cost ofKRT is limiting, particularly when countries do notprovide public funding for it. A much largerproportion of people with ESKD in low and lower-middle income countries are not receiving dialysisor transplantation services compared to those inupper-middle and high income countries. HD andtransplantation are expensive, and including theseservices in UHC plans may not be possible in allcountries. However, alternatives to these forms ofKRT exist that are less costly, and in some cases,more appropriate. For example, in patientsrequiring dialysis, PD may result in similar or betterhealth outcomes than HD, with more patientconvenience and fewer costs. For elderly patientsor those with limited financial resources,conservative care may be a more suitable KRToption than dialysis or transplantation.
Nevertheless, focusing on the prevention of ESKDis the most optimal approach, particularly insettings with limited resources. Strategies andpolicies that ensure appropriate screening toidentify CKD and monitoring of patients withdeclining kidney function to prevent progression toESKD are essential. Less than half (44%) of thecountries surveyed have national strategies forimproving CKD care, and among these strategies,only 46% specifically address CKD. Similarly, only
34% of countries have CKD-specific policies,none of which are low income countries.Promoting governmental recognition of CKD as ahealth priority and creating and strengtheningadvocacy groups may be appropriate strategiesto increase national awareness of CKD andinfluence policy development. Only 51% and 58%of governments recognize CKD and ESKD,respectively, as health priorities. Althoughadvocacy groups for CKD are more common thanthose for ESKD (they exist in 63% and 39% ofcountries, respectively), few advocacy groupsexist overall.
Increasing knowledge and resource sharingbetween countries with similarities is anotherapproach to reduce financial barriers. Guidelinesprovide benchmarks and best practice standardsfor capacity building (i.e., enhancement ofknowledge and skills amongst care providers).Similarly, delegating workloads amongst a varietyof health care professionals can not only helpaddress shortages of nephrologists or otherproviders, but also help create multidisciplinaryteams which are essential for delivering optimalkidney care.
Overall, competing priorities and limited resourcesare realities that hinder the optimization of ESKDprevention and treatment. However, solutions andopportunities exist to reduce the burden of kidneydisease across all countries.
9.3 Optimizing ESKD care in resource-limited countries

ISN Global Kidney Health Atlas | 2019 Discussion | 121
This edition of the GKHA, which focuses onESKD management, highlights key areas thatrequire attention to improve worldwide capacityfor kidney care. The desk research findingsillustrate the global burden of ESKD andparticularly, treatment needs that go unmet inmany low income countries. The survey resultsreveal the current global capacity for ESKD care.It is important to document where we are today,not only to evaluate progress over time, but alsoto provide benchmarks that enable countries toset priorities for capacity improvement. Publicfunding for KRT is limited, particularly in lowincome countries. Workforce shortages arenoteworthy across all country income levels, andnearly all low income countries reportedshortages of nephrologists, interventionalradiologists, surgeons, and transplantcoordinators. Although HD is available in mostcountries, fewer countries offer PD,transplantation, and chosen or medically-advisedconservative care. Few registries exist for AKI andCKD, and detection programs are rare; moreregistries and detection programs must beimplemented to help prevent ESKD. Lastly,policies, government support, and advocacyacross the spectrum of kidney care are needed.
In this section, we describe each of thesepriorities and suggest remedial strategies.
9.4.1 Increase health care financing forESKD prevention and management
Less than 30% of countries provide public fundingfor non-dialysis CKD care with no costs to patientsat the point of care delivery. Public funding fordialysis and transplantation is more common;however, less than half of countries surveyed fullycover all KRT costs, with no patient fees at thepoint of care delivery. In countries that do providepublic funding, coverage is not always equalacross all residents,77,78 particularly in low incomecountries. Affordability of chronic HD treatment is anon-medical barrier for patients,79 and other KRT
options, such as PD or home-administered HD,may address this gap in care.80 Furthermore, it isimportant to increase coverage for dialysis toreduce patient costs for KRT, where possible.However, the costs of dialysis and transplantationare high, and governments need to decide whereto best allocate funding. Priority-setting tools (e.g.,lists of essential medicines, health benefit plans,and health technology assessment agencies) mayhelp guide evidence-based priority-setting;81
however, the local context should be consideredwhen making such decisions.
9.4.2 Address workforce shortagesthrough multidisciplinary teams andtelemedicine
Most countries—particularly low income countries—experience a shortage of at least one healthcare professional essential for ESKD care delivery.While more nephrologists are needed, high costsof training are a barrier. Delegating tasks for ESKDcare delivery across a number of appropriatehealth care professionals is important, not only toincrease the availability of existing nephrologists,but also to promote the use of multidisciplinaryteams. Involving nurses, dietitians, pharmacists,and other professionals in decision-making andESKD care delivery will make services morecomprehensive and increase overall capacity torespond to patients’ needs.
There is also an opportunity for telemedicine toexpand the reach of nephrologists and otherhealth care professionals, both nationally andinternationally. For example, the Extension forCommunity Healthcare Outcomes (ECHO) modelimproves access to care for underservedpopulations with complex health problems82 andhas been used across a variety of disciplines. Theapplication of telemedicine in kidney care (i.e.,telenephrology) to increase the capacity of ESKDcare delivery in limited-resource settings is apromising direction.83
9.4 Recommendations

122 | Discussion ISN Global Kidney Health Atlas | 2019
9.4.3 Incorporate the collectionand reporting of quality indicatorsin ESKD care
While increased accessibility to KRT in general is agreat achievement, access to high-quality ESKDtreatment is important. Measurement and reportingof quality indicators for the delivery of HD, PD, andtransplantation vary globally. In dialysis care, bloodpressure and hemoglobin are measured often;however, small solute clearance, bone mineralmarkers, and technique survival are only measuredand reported in 50–70% of countries. Qualityindicators for kidney transplant recipients are morecommonly measured and reported. Irrespective ofKRT type, measuring and reporting of qualityindicators decrease with country income level.Furthermore, the use of PROMS in care deliveryand evaluation is low across all forms of KRT.Increasing the use of PROMS may help measureclinical effectiveness and promote the use ofpatient-centered care. Moreover, PROMS mayserve as potential prognostic markers to helpmonitor patients’ health status.84
Developing platforms to collect and evaluatequality indicators for KRT is important to optimizethe delivery of ESKD treatment. Monitoringquality indicators helps identify when the qualityof care is not ideal; such information can initiateand guide the development of appropriate qualityimprovement programs. Furthermore, theseglobal indicators provide benchmarks to helpguide practice for ESKD care delivery.
9.4.4 Expand health informationsystems to prevent and manage ESKD
Health information systems play a broad role in thehealthcare system. They can be used to trackindividual health data (e.g., electronic healthrecords) which can help guide care delivery, andpopulation data which can be used to researchhealth conditions and guide decisions aroundpriorities, policies, and resource allocation. Fewcountries have existing registries for AKI and non-dialysis CKD. These tools are essential formonitoring and preventing progression to ESKD.
Furthermore, information on the prevalence ofearly-stage CKD may help guide resourceallocation decisions by enabling future demand forESKD care to be predicted.
Similarly, systems for detecting AKI and CKDthrough active screening approaches areimportant. The use of electronic alert systems todetect AKI has had significant effects on improvingrecovery and reducing the severity of AKI events.85
Incorporating prompts into primary care electronicmedical records (EMRs) to detect patients at highrisk for CKD could be a cost-effective strategy toprevent ESKD.86 Decision aids integrated intoEMRs have been shown to significantly reduceeGFR loss,87 suggesting the potential of these toolsto help reduce the prevalence of ESKD.
9.4.5 Promote ESKD prevention andtreatment by implementing policies,strategies, and advocacy, andmitigating barriers
Lastly, delivering high quality kidney care requiresstrategies and policies. Increasing governmentalrecognition of CKD and ESKD as health prioritiesmay facilitate the development of strategies andpolicies to improve kidney care, althoughgovernments have competing priorities toconsider. Connecting CKD and ESKD care withexisting NCD strategies is practical, as CKD isassociated with significant increases incardiovascular mortality and multiplies risks ofother key NCDs, such as diabetes andhypertension.60 Strategies on how to incorporateCKD into existing NCD strategies have beenproposed.88 Increasing awareness about thehealth and cost consequences of kidney disease88
may help strengthen government support forkidney care policies and initiatives worldwide.
It is also critical to address the variability inaccess to care among marginalized populationgroups, particularly women and children. Thiswork has demonstrated inequities in kidney caredelivery amongst children, particularly in low andlower-middle income settings. Further, thissurvey highlights a need to address issues of

ISN Global Kidney Health Atlas | 2019 Discussion | 123
equitable treatment as a key policy-makingpriority for governments and internationalstakeholder organizations. Decisions about theseissues are complex due to competing demandsfor scarce resources available for health care andother social services. For instance, the costs todeliver and sustain KRT are generally high, and
may be out of reach for governments of manycountries. However, strategies such asincreasing awareness about the burden of kidneydisease and promoting ESKD-prevention (earlydetection and treatment) activities withappropriate cost-effective therapies would beaffordable in many settings.9
Tackling global kidney care is a challengingendeavor that requires joint efforts from multipleorganizations, health care professionals,government agencies, and researchers. During thefirst ISN Global Kidney Policy Forum in Mexico inApril 2018, the ISN identified 12 opportunities forglobal health and kidney care communities tocollaboratively challenge global kidney health:
1. Work within current frameworks promoted bythe WHO and the United Nations, such as theSustainable Development Goals, the 2030Agenda for Sustainable Development,89 UHC,90
and the life-course approach in the context ofHealth 2020,91 to develop and implementpolicies to ensure integration and synergies forkidney disease prevention and treatment withinexisting initiatives.
2. Develop and implement public health policies to prevent or reduce risk factors forCKD in adults and children. These includestrategies to promote maternal and childhealth and nutrition; reduce the burdens ofdiabetes, hypertension, obesity and tobacco consumption; promote safe workenvironments; and prevent infectious diseases.
3. Implement and support ongoing surveillancemechanisms to better understand and quantifythe burdens of AKI and CKD within andoutside the context of NCDs, specifically bydeveloping robust national and regionalregistries for AKI, CKD, and ESKD.
4. Educate the public and at risk populationsabout kidney disease within NCD educationcampaigns.
5. Improve awareness of kidney diseaseamong health care workers at all levels andensure appropriate access to essentialtools and medications required fordiagnosis and treatment.
6. Work towards UHC to permit sustainableaccess to effective and affordablemedication to treat risk factors for kidneydisease and delay kidney disease (e.g.,hypertension, diabetes, cardiovasculardisease) and its progression.
7. Support education for a skilled nephrologyworkforce to implement prevention andtreatment of kidney disease at all stages.
8. Implement early detection, prevention, andtreatment strategies for AKI.
9. Integrate early evidence-based treatment forCKD, acknowledging important synergieswith diabetes, hypertension, andcardiovascular disease.
10. Develop and implement transparent policiesgoverning just and equitable access to kidneydisease care, including dialysis andtransplantation, according to internationalstandards and to support, safe, ethical,affordable, and sustainable programs.
11. Promote and expand kidney transplantationprograms within countries and across regions.
12. Support local, regional, and transnationalresearch on kidney disease to advanceunderstandings of prevention and treatmentstrategies.
9.5 Opportunities to build capacity

124 | Discussion ISN Global Kidney Health Atlas | 2019
The GKHA aims to align with the objectives and activities of the WHO, World Bank, and otherstakeholder organizations which are already workingto close the identified gaps in health care. Examplesof where renal services could align include:
1. The WHO Triple Billion Target,92 which aims toenhance primary health care to improveaccess to and quality of essential services.Strategies include: sustainable financing andfinancial protection; improving access toessential medicines and health products;ensuring an adequate workforce and providingadvice on labor policies; refining national healthpolicies; and enhancing surveillance systemsto improve monitoring, data, and information.
2. The General Programme of Work (GPW) 13Impact Framework,93 which provides astrategic approach to tracking joint efforts by
Member States, the WHO Secretariat, and
partners to achieve the Sustainable
Development Goals. The proposed 13th GPW
is the WHO’s five-year strategy outlining the
mission, strategic priorities, and strategic and
organizational shifts to achieve the health-
related Sustainable Development Goals.
3. The Global Strategy on Human Resources for
Health: Workforce 2030;94
4. The WHO Framework on integrated people-
centered health care;95
5. The United Nations Sustainable Development
Goals;89
6. The United Nations Children’s Fund (UNICEF):
Inequities in children/variations in care;96 and
7. World Bank-led initiatives to support UHC.97
This iteration of the GKHA survey has revealed highvariability in the delivery of ESKD care globally.Chronic HD services are offered in most countries;however, PD services are less available, particularlyin low income countries. Similarly, transplantation isless available in low income countries and onlyone-third of countries in Africa offer transplantation.Among the 36% of countries that offer kidneytransplantation, fewer than 10% of ESKD patientswho are suitable candidates for transplants areable to access services. Overall, KRT is leastaccessible in South Asia, Africa, and OSEA.Ensuring adequate facilities and workforces todeliver high quality KRT is important, as is ensuringthat these services are affordable to patients.Patients in only 43% of countries worldwide are notcharged any fees at the point of KRT delivery.
The use of PD or conservative care for ESKDtreatment should be encouraged whereappropriate. PD is the preferred dialysis method interms of patient convenience and cost; yet, amongcountries with PD available, only five reported PD as the initial treatment for most patients.
Although conservative care is available in manycountries, such services are available in relativelyfew lower-middle or low income countries.Similarly, psychological, cultural, and spiritualsupport for patients receiving conservative care islimited in lower-middle and low income countriesand only available in half of high income countries.
Lastly, nearly all countries reported significantworkforce shortages, which dramatically impactthe availability and quality of KRT care. Over90% of low income countries have shortages ofnephrologists, interventional radiologists,surgeons, and transplant coordinators.
The findings reported in this atlas reveal whereefforts should be directed to improve globalcapacity to deliver high quality ESKD care; inparticular, efforts should focus on increasingaccess to PD and conservative care.Furthermore, it is necessary to increase advocacyand develop policies, health information systemsand detection programs to prevent ESKD.
Moving forward, efforts aimed at preventing
9.6 Conclusion

ISN Global Kidney Health Atlas | 2019 Discussion | 125
disease progression are critical to reducing theglobal burden of ESKD. Providing universalcoverage for medications to treat common riskfactors and manage complications is vital.Improving capacity for kidney transplantation byaddressing workforce shortages, low organsupplies, high service costs, legalization limitations,and a lack of infrastructure is also important andmay offset the costs of expensive KRT optionssuch as HD.
Incorporating elements of CKD into existingnational NCD strategies may help increaseawareness of ESKD and provide direction on howto prevent and manage ESKD in a locallyappropriate context. Policies around CKD andESKD care (dialysis, transplantation, and
conservative care) are necessary to drive thesestrategies, and governmental support may beachieved by demonstrating the devastating impactof ESKD on patients and the healthcare system.Lastly, utilizing effective and less costly treatmentoptions such as PD or conservative care may allowfor the provision of high-quality care for ESKDpatients, particularly in resource-limited settings.
Overall, these strategies aim to include CKD andESKD in worldwide initiatives to promote universalhealth care and chronic disease prevention. Due tothe close link between kidney health and manyother chronic NCDs, plenty of opportunities exist toensure universal and equitable access to highquality kidney care for all.
9.7 Future work

126 | ISN Global Kidney Health Atlas | 2019

ISN Global Kidney Health Atlas | 2019 References | 127
1. Murray CJ, Ortblad KF, Guinovart C, et al. Global,regional, and national incidence and mortality for HIV,tuberculosis, and malaria during 1990-2013: asystematic analysis for the Global Burden of DiseaseStudy 2013. Lancet. 2014;384(9947):1005-1070.
2. Global, regional, and national age-sex specific all-cause and cause-specific mortality for 240 causes ofdeath, 1990-2013: a systematic analysis for theGlobal Burden of Disease Study 2013. Lancet.2015;385(9963):117-171.
3. Eckardt KU, Coresh J, Devuyst O, et al. Evolvingimportance of kidney disease: from subspecialty toglobal health burden. Lancet. 2013;382(9887):158-169.
4. Webster AC, Nagler EV, Morton RL, et al. Chronickidney disease. Lancet. 2017;389(10075):1238-1252.
5. Levey AS, Coresh J. Chronic kidney disease. Lancet.2012;379(9811):165-180.
6. Matsushita K, van der Velde M, Astor BC, et al.Association of estimated glomerular filtration rate andalbuminuria with all-cause and cardiovascularmortality in general population cohorts: a collaborativemeta-analysis. Lancet. 2010;375(9731):2073-2081.
7. Liyanage T, Ninomiya T, Jha V, et al. Worldwideaccess to treatment for end-stage kidney disease: asystematic review. Lancet. 2015;385(9981):1975-1982.
8. Jha V, Garcia-Garcia G, Iseki K, et al. Chronic kidneydisease: global dimension and perspectives. Lancet.2013;382(9888):260-272.
9. Luyckx VA, Naicker S, McKee M. Equity andeconomics of kidney disease in sub-Saharan Africa.Lancet. 2013;382(9887):103-104.
10. Coresh J, Jafar TH. Disparities in worldwide treatmentof kidney failure. Lancet. 2015;385(9981):1926-1928.
11. Ene-Iordache B, Perico N, Bikbov B, et al. Chronickidney disease and cardiovascular risk in six regionsof the world (ISN-KDDC): a cross-sectional study.Lancet Global Health. 2016;4(5):e307-319.
12. Levin A, Stevens PE. Summary of KDIGO 2012 CKDGuideline: behind the scenes, need for guidance, anda framework for moving forward. Kidney International.2014;85(1):49-61.
13. Bolignano D, Palmer SC, Navaneethan SD, et al.Aldosterone antagonists for preventing theprogression of chronic kidney disease. CochraneDatabase of Systematic Reviews. 2014(4):Cd007004.
14. McMahon EJ, Campbell KL, Bauer JD, et al. Altereddietary salt intake for people with chronic kidneydisease. Cochrane Database of Systematic Reviews.2015(2):Cd010070.
15. Metzger M, Yuan WL, Haymann JP, et al. Associationof a low-protein diet with slower progression of CKD.Kidney International Reports. 2018;3(1):105-114.
16. Robinson BM, Akizawa T, Jager KJ, et al. Factorsaffecting outcomes in patients reaching end-stagekidney disease worldwide: differences in access torenal replacement therapy, modality use, andhaemodialysis practices. Lancet.2016;388(10041):294-306.
17. Tonelli M, Wiebe N, Knoll G, et al. Systematic review:kidney transplantation compared with dialysis inclinically relevant outcomes. American Journal ofTransplantation. 2011;11(10):2093-2109.
18. Muralidharan A, White S. The need for kidneytransplantation in low- and middle-income countries in2012: an epidemiological perspective.Transplantation. 2015;99(3):476-481.
19. Jha V, Martin DE, Bargman JM, et al. Ethical issues indialysis therapy. Lancet. 2017;389(10081):1851-1856.
20. Mehrotra R, Crabtree J, Kathuria P. Overview ofPeritoneal Dialysis. Modeling and Control of DialysisSystems. Vol. 405. Berlin: Springer; 2013.
21. Himmelfarb J, Ikizler TA. Hemodialysis. New EnglandJournal of Medicine. 2010;363(19):1833-1845.
22. James M, Pannu N. Management of Acute KidneyInjury. National Kidney Foundation’s Primer on KidneyDiseases. 6th ed. Philadelphia, PA: Elsevier;2014:320.
REFERENCES

128 | References ISN Global Kidney Health Atlas | 2019
23. van de Luijtgaarden MW, Jager KJ, Segelmark M, etal. Trends in dialysis modality choice and relatedpatient survival in the ERA-EDTA Registry over a 20-year period. Nephrology Dialysis Transplantation.2016;31(1):120-128.
24. Han SS, Park JY, Kang S, et al. Dialysis modality andmortality in the elderly: a meta-analysis. ClinicalJournal of the American Society of Nephrology.2015;10(6):983-993.
25. Thiery A, Severac F, Hannedouche T, et al. Survivaladvantage of planned haemodialysis over peritonealdialysis: a cohort study. Nephrology DialysisTransplantation. 2018;33(8):1411-1419.
26. Niang A, Iyengar A, Luyckx VA. Hemodialysis versusperitoneal dialysis in resource-limited settings. CurrentOpinion in Nephrology and Hypertension.2018;27(6):463-471.
27. Zhang Y, Gerdtham UG, Rydell H, et al.Socioeconomic inequalities in the kidneytransplantation process: a registry-based study inSweden. Transplantation Direct. 2018;4(2):e346.
28. Danovitch GM. Cultural barriers to kidneytransplantation: a new frontier. Transplantation.2007;84(4):462-463.
29. Davison SN, Levin A, Moss AH, et al. Executivesummary of the KDIGO Controversies Conference onSupportive Care in Chronic Kidney Disease:developing a roadmap to improving quality care.Kidney International. 2015;88(3):447-459.
30. O’Connor NR, Kumar P. Conservative management ofend-stage renal disease without dialysis: a systematicreview. Journal of Palliative Medicine. 2012;15(2):228-235.
31. Raghavan D, Holley JL. Conservative care of theelderly CKD patient: a practical guide. Advances inChronic Kidney Disease. 2016;23(1):51-56.
32. Jassal SV, Watson D. Dialysis in late life: benefit orburden. Clinical Journal of the American Society ofNephrology. 2009;4(12):2008-2012.
33. Morton RL, Snelling P, Webster AC, et al. Factorsinfluencing patient choice of dialysis versusconservative care to treat end-stage kidney disease.Canadian Medical Association Journal.2012;184(5):E277-283.
34. Verberne WR, Dijkers J, Kelder JC, et al. Value-basedevaluation of dialysis versus conservative care in olderpatients with advanced chronic kidney disease: acohort study. BMC Nephrology. 2018;19(1):205.
35. Morton RL, Kurella Tamura M, Coast J, et al.Supportive care: economic considerations inadvanced kidney disease. Clinical Journal of theAmerican Society of Nephrology. 2016;11(10):1915-1920.
36. Ghimire S, Castelino RL, Lioufas NM, et al.Nonadherence to medication therapy inhaemodialysis patients: a systematic review. PloS ne.2015;10(12):e0144119.
37. Browne T, Merighi JR. Barriers to adult hemodialysispatients' self-management of oral medications.American Journal of Kidney Diseases.2010;56(3):547-557.
38. Gourzoulidis G, Kourlaba G, Stafylas P, et al.Association between co-payment, medicationadherence and outcomes in the management ofpatients with diabetes and heart failure. Health Policy.2017;121(4):363-377.
39. Mushi L, Marschall P, Flessa S. The cost of dialysis inlow and middle-income countries: a systematicreview. BMC Health Services Research. 2015;15:506.
40. Wu DA, Watson CJ, Bradley JA, et al. Global trendsand challenges in deceased donor kidney allocation.Kidney International. 2017;91(6):1287-1299.
41. Chamsi-Pasha H, Albar MA. Kidney transplantation:ethical challenges in the Arab world. Saudi Journal ofKidney Diseases and Transplantation.2014;25(3):489-495.
42. Palevsky PM, Liu KD, Brophy PD, et al. KDOQI UScommentary on the 2012 KDIGO clinical practiceguideline for acute kidney injury. American Journal ofKidney Diseases. 2013;61(5):649-672.
43. Kellum JA, Lameire N. Diagnosis, evaluation, andmanagement of acute kidney injury: a KDIGOsummary (part 1). Critical Care. 2013;17(1):204.
44. Mehta RL, Burdmann EA, Cerda J, et al. Recognitionand management of acute kidney injury in theInternational Society of Nephrology 0by25 GlobalSnapshot: a multinational cross-sectional study.Lancet. 2016;387(10032):2017-2025.
45. Horton R, Berman P. Eliminating acute kidney injuryby 2025: an achievable goal. Lancet.2015;385(9987):2551-2552.
46. Perico N, Remuzzi G. Acute kidney injury in low-income and middle-income countries: no longer adeath sentence. Lancet Global Health.2016;4(4):e216-217.
47. Hsu RK, Hsu CY. The role of acute kidney injury inchronic kidney disease. Seminars in Nephrology.2016;36(4):283-292.
48. Pannu N. Bidirectional relationships between acutekidney injury and chronic kidney disease. CurrentOpinion in Nephrology and Hypertension.2013;22(3):351-356.
49. Chawla LS, Kimmel PL. Acute kidney injury andchronic kidney disease: an integrated clinicalsyndrome. Kidney International. 2012;82(5):516-524.

ISN Global Kidney Health Atlas | 2019 References | 129
50. World Health Organization. Monitoring the BuildingBlocks of Health Systems: A Handbook of Indicatorsand Their Measurement Strategies. Geneva,Switzerland; 2010. Available at:https://www.who.int/healthinfo/systems/WHO_MBHSS_2010_full_web.pdf
51. Harrison JP, Palacio C. The role of clinical informationsystems in health care quality improvement. HealthCare Manager. 2006;25(3):206-212.
52. Gliklich RE, Dreyer NA, Leavy MB, et al. 21st CenturyPatient Registries: Registries for Evaluating PatientOutcomes: A User's Guide. 3rd ed., addendum.Rockville (MD): Agency for Healthcare Research andQuality (AHRQ); 2018.
53. Tuot DS, Velasquez A, McCulloch CE, et al. TheKidney Awareness Registry and Education (KARE)study: protocol of a randomized controlled trial toenhance provider and patient engagement withchronic kidney disease. BMC Nephrology.2015;16:166.
54. Liu FX, Rutherford P, Smoyer-Tomic K, et al. A globaloverview of renal registries: a systematic review. BMCNephrology. 2015;16:31.
55. Kumar M, Gotz D, Nutley T, et al. Research gaps inroutine health information system design barriers todata quality and use in low- and middle-incomecountries: a literature review. International Journal ofHealth Planning and Management. 2018;33(1):e1-e9.
56. Lunney M; Alrukhaimi M; Ashuntantang GE et al.Guidelines, policies, and barriers to kidney care:findings from a global survey. Kidney InternationalSupplements. 2018;8:30-40.
57. The University of Sydney. What is policy? 2018.Available at:http://sydney.edu.au/legal/policy/what/index.shtml
58. World Health Organization. Health policy. 2018.Available at:http://www.who.int/topics/health_policy/en/
59. Pariyo GW, Wosu AC, Gibson DG, et al. Moving theagenda on noncommunicable diseases: policyimplications of mobile phone surveys in low andmiddle-income countries. Journal of Medical InternetResearch. 2017;19(5):e115.
60. Couser WG, Remuzzi G, Mendis S, et al. Thecontribution of chronic kidney disease to the globalburden of major noncommunicable diseases. KidneyInternational. 2011;80(12):1258-1270.
61. The International Society of Nephrology. Chronickidney disease. Available at:https://www.theisn.org/focus/ckd
62. Bello AK, Levin A, Tonelli M, et al. Global KidneyHealth Atlas: A Report by the International Society ofNephrology on the Current State of Organization andStructures for Kidney Care across the Globe.International Society of Nephrology, Brussels,Belgium; 2017.
63. Bello AK, Wiebe N, Garg AX, et al. Basics ofsystematic reviews and meta-analyses for thenephrologist. Nephron Clinical Practice.2011;119(1):c50-c60.
64. Tonelli M, Wiebe N, Culleton B, et al. Chronic kidneydisease and mortality risk: a systematic review.Journal of the American Society of Nephrology.2006;17(7):2034-2047.
65. Garg AX, Hackam D, Tonelli M. Systematic review andmeta-analysis: when one study is just not enough.Clinical Journal of the American Society ofNephrology. 2008;3(1):253-260.
66. Tonelli M, Hackam D, Garg AX. Primer on systematicreview and meta-analysis. Methods in MolecularBiology. 2009;473:217-233.
67. Shemilt I, Thomas J, Morciano M. A web-based toolfor adjusting costs to a specific target currency andprice year. Evidence & Policy. 2010;6:51-59.
68. OANDA. Historical currency converter. 2018. Availableat: https://www.oanda.com/fx-for-business/historical-rates
69. Huffman MD, Perel P, Beller GA, et al. World HeartFederation Emerging Leaders Program: an innovativecapacity building program to facilitate the 25 x 25goal. Global Heart. 2015;10(4):229-233.
70. Mehta RL, Cerda J, Burdmann EA, et al. InternationalSociety of Nephrology's 0by25 initiative for acutekidney injury (zero preventable deaths by 2025): ahuman rights case for nephrology. Lancet.2015;385(9987):2616-2643.
71. Guariguata L, Whiting D, Weil C, et al. TheInternational Diabetes Federation diabetes atlasmethodology for estimating global and nationalprevalence of diabetes in adults. Diabetes Researchand Clinical Practice. 2011;94(3):322-332.
72. Moran AE, Roth GA, Narula J, et al. 1990-2010 globalcardiovascular disease atlas. Global Heart.2014;9(1):3-16.
73. Leowski J, Krishnan A. Capacity to controlnoncommunicable diseases in the countries of South-East Asia. Health Policy. 2009;92(1):43-48.
74. Stevens GA, Alkema L, Black RE, et al. Guidelines forAccurate and Transparent Health EstimatesReporting: the GATHER statement. Lancet.2016;388(10062):e19-e23.

130 | References ISN Global Kidney Health Atlas | 2019
75. Saggi SJ, Allon M, Bernardini J, et al. Considerationsin the optimal preparation of patients for dialysis.Nature Reviews Nephrology. 2012;8(7):381-389.
76. Chaudhary K, Sangha H, Khanna R. Peritonealdialysis first: rationale. Clinical Journal of the AmericanSociety of Nephrology. 2011;6(2):447-456.
77. Bello AK, Levin A, Tonelli M, et al. Assessment ofglobal kidney health care status. Journal of theAmerican Medical Association. 2017;317(18):1864-1881.
78. Just PM, de Charro FT, Tschosik EA, et al.Reimbursement and economic factors influencingdialysis modality choice around the world. NephrologyDialysis Transplantation. 2008;23(7):2365-2373.
79. Pancras G, Shayo J, Anaeli A. Non-medical facilitatorsand barriers towards accessing haemodialysisservices: an exploration of ethical challenges. BMCNephrology. 2018;19(1):342.
80. Vanholder R, Annemans L, Brown E, et al. Reducingthe costs of chronic kidney disease while deliveringquality health care: a call to action. Nature ReviewsNephrology. 2017;13(7):393-409.
81. Sakuma Y, Glassman A, Vaca C. Priority-SettingProcesses for Expensive Treatments for ChronicDiseases. Cardiovascular, Respiratory, and RelatedDisorders. 3rd ed. Washington (DC): The InternationalBank for Reconstruction and Development. TheWorld Bank; 2017: Chapter 21.
82. Arora S, Thornton K, Murata G, et al. Outcomes oftreatment for hepatitis C virus infection by primarycare providers. New England Journal of Medicine.2011;364(23):2199-2207.
83. Osman MA, Okel J, Okpechi IG, et al. Potentialapplications of telenephrology to enhance globalkidney care. BMJ Global Health. 2017;2(2):e000292.
84. Aiyegbusi OL, Kyte D, Cockwell P, et al. A patient-centred approach to measuring quality in kidney care:patient-reported outcome measures and patient-reported experience measures. Current Opinion inNephrology and Hypertension. 2017;26(6):442-449.
85. Park S, Baek SH, Ahn S, et al. Impact of electronicacute kidney injury (AKI) alerts with automatednephrologist consultation on detection and severity ofAKI: a quality improvement study. American Journal ofKidney Diseases. 2018;71(1):9-19.
86. Nash DM, Ivers NM, Young J, et al. Improving care forpatients with or at risk for chronic kidney diseaseusing electronic medical record interventions: apragmatic cluster-randomized trial protocol. CanadianJournal of Kidney Health and Disease.2017;4:2054358117699833.
87. Carroll JK, Pulver G, Dickinson LM, et al. Effect of 2clinical decision support strategies on chronic kidneydisease outcomes in primary care: a clusterrandomized trial. Journal of the American MedicalAssociation Network Open. 2018;1(6):e183377.
88. Tonelli M, Agarwal S, Cass A, et al. How to advocatefor the inclusion of chronic kidney disease in a nationalnoncommunicable chronic disease program. KidneyInternational. 2014;85(6):1269-1274.
89. United Nations. Sustainable Development Goals.Available at:https://sustainabledevelopment.un.org/hlpf
90. World Health Organization. Universal health coverage.Available at: https://www.who.int/who-un/about/uhc/en/
91. World Health Orgaization. WHO European MinisterialConference on the Life-course Approach in theContext of Health 2020. Available at:http://www.euro.who.int/en/media-centre/events/events/2015/10/WHO-European-Ministerial-Conference-on-the-Life-course-Approach-in-the-Context-of-Health-2020
92. World Health Organization. WHO 13th GeneralProgramme of Work (GPW) Impact Framework:Targets and Indicators. 2018. Available at:https://www.who.int/about/what-we-do/GPW13_WIF_Targets_and_Indicators_English.pdf
93. World Health Organization Reference Group. DraftGPW 13 WHO Impact Framework 2019-2023.Available at: https://www.who.int/about/what-we-do/gpw13-expert-group/tor-gpw13-expert-group.pdf
94. World Health Organization. Global strategy on humanresources for health: Workforce 2030. Available at:https://www.who.int/hrh/resources/globstrathrh-2030/en/
95. World Health Organization. Framework on integratedpeople-centred health services. Available at:https://www.who.int/servicedeliverysafety/areas/people-centred-care/en/
96. UNICEF. Equity: a fair chance for every child. 2015.Available at:https://www.unicef.org/health/files/161201_Strategy_for_health_2016-30_report.pdf
97. Kieny M-P, Evans TG, Scarpetta S et al. Deliveringquality health services: a global imperative foruniversal health coverage. 2018. Available at:https://www.worldbank.org/en/topic/universalhealthcoverage/publication/delivering-quality-health-services-a-global-imperative-for-universal-health-coverage

ISN Global Kidney Health Atlas | 2019 List of illustrations | 131
Page Table
14 A Methods and data sources
29 2.1 General health system characteristics:WHO UHC domain and relevant datasources
30 2.2 CKD-centric health systemcharacteristics: WHO UHC domainsand relevant data sources
32-33 2.3 Renal registries from the 10 ISN regionsused as data sources
59 4.1 Funding models for non-dialysis CKD
60 4.2 Funding models for KRT
61 4.3 Extent of universal coverage for KRT incountries with publicly funded systems
64 4.4 Within country variation in ESKD caredelivery
65 4.5 ESKD management structures
93 7.1 Prevalence of renal registries
95 7.2 Provider participation in AKI and CKDregistries
97 7.3 Geographic coverage of AKI and CKDregistries
99 7.4 Content coverage of AKI registries, byWorld Bank income group
Page Table
99 7.5 Content coverage of CKD registries, byWorld Bank income group
104 7.6 Methods of implementing AKI detectionprograms
105 8.1 Existence of a national strategy forNCDs
108 8.2 Existence of CKD-specific policies
109 8.3 Advocacy and support for AKItreatment and prevention
110 8.4 Advocacy and support for CKDtreatment and prevention
110 8.5 Advocacy and support for ESKD andKRT
111 8.6 Barriers to optimal ESKD care
137 A1.1 Countries and population covered bysurvey responses
138 A1.2 Disciplinary affiliation of surveyrespondents
139-143 A2.1 List of countries by ISN region andWorld Bank income group
163-166 A4.1 Survey respondents, by ISN region
LIST OF ILLUSTRATIONS
Tables
Page Figure
19 1.1 Classification of CKD
21 1.2 The state of KRT need, access andprojections into the future
21 1.3 Income-related variability in accessto KRT
28 2.1 Timeline of the GKHA project
34 2.2 KRT cost adjustments andstandardization
Page Figure
52 3.1 Annual cost of KRT, by World Bankincome group
62 4.1 Aspects of KRT excluded from publicfunding, by ISN region
62 4.2 Aspects of KRT excluded from publicfunding, by World Bank income group
63 4.3 Funding models for KRT-relatedsurgical services, by ISN region
Figures

132 | List of illustrations ISN Global Kidney Health Atlas | 2019
Page Figure
64 4.4 Within-country variation in ESKD caredelivery, by World Bank income group
65 4.5 Within-country variation in ESKD caredelivery (children vs adults), by WorldBank income group
65 4.6 Within-country variation in KRT careaccessibility (children vs adults), byWorld Bank income group
67 5.1 Health care providers primarilyresponsible for ESKD care
69 5.2 Shortages of health care providersessential for ESKD care
70 5.3 Shortages of health care providersessential for ESKD care, by World Bankincome group
71 6.1 Availability of chronic dialysis andkidney transplantation services, by ISNregion
71 6.2 Availability of chronic dialysis andkidney transplantation services, byWorld Bank income group
74 6.3 Source of donated kidneys, by WorldBank income group
74 6.4 Type of kidney transplantation waitlist,by World Bank income group
75 6.5 Availability of services for ESKD care
76 6.6.1 Management of hemoglobin level, byWorld Bank income group
77 6.6.2 Management of renal bone disease, byWorld Bank income group
77 6.6.3 Management of electrolyte disordersand chronic metabolic acidosis, byWorld Bank income group
77 6.6.4 Management of blood pressure, byWorld Bank income group
78 6.7 Accessibility of KRT at the onset ofESKD, by ISN region
78 6.8 Accessibility of KRT at the onset ofESKD, by World Bank income group
78 6.9 Proportion of patients typically initiatingtreatment with PD, by ISN region
79 6.10 Proportion of patients typically initiatingtreatment with PD, by World Bankincome group
79 6.11 Accessibility of kidney transplantation,by ISN region
79 6.12 Accessibility of kidney transplantation,by World Bank income group
80 6.13 Within-country geographic variation inaccess to KRT, by World Bank incomegroup
Page Figure
80 6.14 Variation in access to KRT based onpatient characteristics, by World Bankincome group
81 6.15 Proportion of treatment costs (includingmedications) paid directly by patients,by ISN region
81 6.16 Proportion of treatment costs (includingmedications) paid directly by patients,by World Bank income group
82 6.17 Within-country geographic variation inco-payments for KRT, by World Bankincome group
82 6.18 Variation in co-payments for KRT basedon patient characteristics, by WorldBank income group
83 6.19 Funding models for KRT patients, byISN region
84 6.20 Types of vascular access for KRT
84 6.21 Types of vascular access for KRT, byWorld Bank income group
85 6.22 Proportion of centers that measure andreport quality indicators for HD servicedelivery
85 6.23 Proportion of centers that measure andreport quality indicators for HD servicedelivery, by World Bank income group
86 6.24 Proportion of centers that measure andreport quality indicators for PD servicedelivery
87 6.25 Proportion of centers that measure andreport quality indicators for PD servicedelivery, by World Bank income group
87 6.26 Proportion of centers that measure andreport quality indicators for kidneytransplantation service delivery
88 6.27 Proportion of centers that measure andreport quality indicators for PD servicedelivery, by World Bank income group
88 6.28 Availability of nutritional services forkidney care
89 6.29 Availability of nutritional services forkidney care, by World Bank incomegroup
90 6.30 Availability of conservative care, by ISNregion
90 6.31 Availability of conservative care, byWorld Bank income group
91 6.32 Characteristics of available conservativecare
91 6.33 Characteristics of available conservativecare, by World Bank income group

ISN Global Kidney Health Atlas | 2019 List of illustrations | 133
Page Figure
94 7.1 Prevalence of renal registries, by ISNregion
94 7.2 Prevalence of renal registries, by WorldBank income group
96 7.3 Provider participation in dialysis andtransplantation registries, by ISN region
96 7.4 Provider participation in dialysis andtransplantation registries, by WorldBank income group
98 7.5 Geographic coverage of dialysis andtransplantation registries, by WorldBank income group
100 7.6 Content coverage of registries fordialysis, by World Bank income group
100 7.7 Content coverage of registries fortransplantation, by World Bank incomegroup
102 7.8 Adoption of practices to identify CKD inhigh-risk groups, by ISN region
103 7.9 Adoption of practices to identify CKD inhigh-risk groups, by World Bankincome group
103 7.10 Proportion of countries that report anethnic group at a higher risk for kidneydisease than the general population, byWorld Bank income group
Page Figure
103 7.11 Existence of current AKI and CKDdetection programs, by World Bankincome group
104 7.12 Methods of implementing CKDdetection programs, by World Bankincome group
105 8.1 Existence of a national strategy forNCDs
106 8.2 Existence of a national strategy forNCDs, by World Bank income group
106 8.3 Existence of a national strategy forimproving CKD care, by ISN region
107 8.4 Kidney conditions covered by CKD-specific and general NCD strategies, byISN region
108 8.5 Existence of CKD-specific policies, byWorld Bank income group
108 8.6 Availability of CKD policies, by WorldBank income group
109 8.7 Government support for AKI, CKD, andESKD treatment and prevention
109 8.8 Advocacy for AKI, CKD, and ESKDtreatment and prevention
Page Map
39 3.1.1 Global prevalence of treated ESKD
40 3.1.2 Global incidence of treated ESKD
41 3.2.1 Global prevalence of chronic dialysis
42 3.2.2 Global incidence of chronic dialysis
43 3.3.1 Global prevalence of chronic HD
44 3.3.2 Global incidence of chronic HD
45 3.4.1 Global prevalence of chronic PD
46 3.4.2 Global incidence of chronic PD
47 3.5.1 Global prevalence of kidneytransplantation
48 3.5.2 Global incidence of kidneytransplantation
49 3.5.3 Global incidence of deceased donorkidney transplantation
Page Map
50 3.5.4 Global incidence of living donor kidneytransplantation
51 3.5.5 Global incidence of pre-emptivekidney transplantation
57 Survey Response
68 5.1 Global prevalence of nephrologists
69 5.2 Global prevalence of nephrologytrainees
72 6.1 Availability of centers that providechronic HD
73 6.2 Availability of centers that providechronic PD
74 6.3 Availability of centers that performkidney transplantation
Maps

134 | ISN Global Kidney Health Atlas | 2019

ISN Global Kidney Health Atlas | 2019 | 135
APPENDICES

136 | ISN Global Kidney Health Atlas | 2019

ISN Global Kidney Health Atlas | 2019 Appendix 1 | 137
APPENDIX 1
SURVEY RESPONSE
Number of countries
Total population (millions)
Number of countries that
completed survey
Total population of countries that
completed survey(millions)
Table A1.1 | Countries and population covered by survey responses
Overall 218 7501.3 160 7338.5
ISN region
Africa 54 1263.7 42 1213.2
Eastern & Central Europe 21 215.2 19 209.2
Latin America 31 631.4 18 592.4
Middle East 13 243.7 11 213.6
NIS & Russia 10 276.8 10 276.8
North America 14 370.5 10 370.0
North & East Asia 7 1596.7 7 1596.7
OSEA 31 717.0 15 681.3
South Asia 8 1752.5 7 1752.2
Western Europe 29 433.7 21 433.1
World Bank income group
Low income 30 655.9 23 585.3
Lower-middle income 50 2997.8 38 2941.3
Upper-middle income 58 2601.6 41 2569.3
High income 80 1246.0 58 1242.5

NephrologistsN (%)
Physicians (non-nephrologists)
N (%)
Health professionals(non-physician)
N (%)Policymakers
N (%)Other1
N (%)
138 | Appendix 1 ISN Global Kidney Health Atlas | 2019
Table A1.2 | Disciplinary affiliation of survey respondents
Overall 260 (82) 22 (7) 7 (2) 17 (5) 11 (3)
ISN region
Africa 48 (76) 8 (13) 3 (5) 2 (3) 2 (3)
Eastern & Central Europe 32 (89) 1 (3) 0 (0) 2 (6) 1 (3)
Latin America 33 (85) 3 (8) 0 (0) 2 (5) 1 (3)
Middle East 26 (90) 1 (3) 1 (3) 1 (3) 0 (0)
NIS & Russia 11 (79) 0 (0) 1 (7) 2 (14) 0 (0)
North America 12 (71) 3 (18) 0 (0) 0 (0) 2 (12)
North & East Asia 20 (95) 1 (5) 0 (0) 0 (0) 0 (0)
OSEA 20 (95) 1 (5) 0 (0) 0 (0) 0 (0)
South Asia 12 (71) 3 (18) 0 (0) 0 (0) 2 (12)
Western Europe 29 (81) 1 (3) 1 (3) 2 (6) 3 (8)
World Bank income group
Low income 24 (69) 8 (23) 2 (6) 1 (3) 0 (0)
Lower-middle income 62 (83) 3 (4) 3 (4) 4 (5) 3 (4)
Upper-middle income 70 (85) 5 (6) 0 (0) 5 (6) 2 (2)
High income 104 (83) 6 (5) 2 (2) 7 (6) 6 (5)
1 Other types of stakeholders (e.g., nurses, community health officers).

ISN Global Kidney Health Atlas | 2019 Appendix 2 | 139
APPENDIX 2
LIST OF COUNTRIES
Table A2.1 | List of countries by ISN region and World Bank income group
Countries that participated in the survey are highlighted .
Country ISN region Income group
Afghanistan South Asia Low income
Albania Eastern & Central Europe Upper-middle income
Algeria Africa Upper-middle income
American Samoa OSEA Upper-middle income
Andorra Western Europe High income
Angola Africa Upper-middle income
Antigua and Barbuda North America & the Caribbean High income
Argentina Latin America & the Caribbean High income
Armenia NIS & Russia Lower-middle income
Aruba Latin America & the Caribbean High income
Australia OSEA High income
Austria Western Europe High income
Azerbaijan NIS & Russia Upper-middle income
Bahamas, The North America & the Caribbean High income
Bahrain Middle East High income
Bangladesh South Asia Lower-middle income
Barbados North America & the Caribbean High income
Belarus NIS & Russia Upper-middle income
Belgium Western Europe High income
Belize Latin America & the Caribbean Upper-middle income
Benin Africa Low income
Bermuda North America & the Caribbean High income
Bhutan South Asia Lower-middle income
Bolivia Latin America & the Caribbean Lower-middle income
Bosnia and Herzegovina Eastern & Central Europe Upper-middle income
Botswana Africa Upper-middle income
Brazil Latin America & the Caribbean Upper-middle income
British Virgin Islands Latin America & the Caribbean High income
Brunei Darussalam OSEA High income
Bulgaria Eastern & Central Europe Upper-middle income
Burkina Faso Africa Low income
Burundi Africa Low income
Cabo Verde Africa Lower-middle income
Cambodia OSEA Lower-middle income

140 | Appendix 2 ISN Global Kidney Health Atlas | 2019
Country ISN region Income group
Cameroon Africa Lower-middle income
Canada North America & the Caribbean High income
Cayman Islands North America & the Caribbean High income
Central African Republic Africa Low income
Chad Africa Low income
Channel Islands Western Europe High income
Chile Latin America & the Caribbean High income
China North & East Asia Upper-middle income
Colombia Latin America & the Caribbean Upper-middle income
Comoros Africa Low income
Congo, Dem. Rep. Africa Low income
Congo, Rep. Africa Lower-middle income
Costa Rica Latin America & the Caribbean Upper-middle income
Cote d’Ivoire Africa Lower-middle income
Croatia Eastern & Central Europe High income
Cuba Latin America & the Caribbean Upper-middle income
Curaçao Latin America & the Caribbean High income
Cyprus Eastern & Central Europe High income
Czech Republic Eastern & Central Europe High income
Denmark Western Europe High income
Djibouti Africa Lower-middle income
Dominica Latin America & the Caribbean Upper-middle income
Dominican Republic Latin America & the Caribbean Upper-middle income
Ecuador Latin America & the Caribbean Upper-middle income
Egypt, Arab Rep. Africa Lower-middle income
El Salvador Latin America & the Caribbean Lower-middle income
Equatorial Guinea Africa Upper-middle income
Eritrea Africa Low income
Estonia Eastern & Central Europe High income
Ethiopia Africa Low income
Faroe Islands Western Europe High income
Fiji OSEA Upper-middle income
Finland Western Europe High income
France Western Europe High income
French Polynesia OSEA High income
Gabon Africa Upper-middle income
Gambia, The Africa Low income
Georgia NIS & Russia Lower-middle income
Germany Western Europe High income
Ghana Africa Lower-middle income
Gibraltar Western Europe High income
Greece Western Europe High income
Greenland Western Europe High income
Grenada Latin America & the Caribbean Upper-middle income
Guam OSEA High income
Guatemala Latin America & the Caribbean Lower-middle income
Guinea Africa Low income
Guinea-Bissau Africa Low income
Guyana Latin America & the Caribbean Upper-middle income

ISN Global Kidney Health Atlas | 2019 Appendix 2 | 141
Country ISN region Income group
Haiti Latin America & the Caribbean Low income
Honduras Latin America & the Caribbean Lower-middle income
Hong Kong SAR, China North & East Asia High income
Hungary Eastern & Central Europe High income
Iceland Western Europe High income
India South Asia Lower-middle income
Indonesia OSEA Lower-middle income
Iran, Islamic Rep. Middle East Upper-middle income
Iraq Middle East Upper-middle income
Ireland Western Europe High income
Isle of Man Western Europe High income
Israel Western Europe High income
Italy Western Europe High income
Jamaica North America & the Caribbean Upper-middle income
Japan North & East Asia High income
Jordan Middle East Upper-middle income
Kazakhstan NIS & Russia Upper-middle income
Kenya Africa Lower-middle income
Kiribati OSEA Lower-middle income
Korea, Dem. People’s Rep. OSEA Low income
Korea, Rep. North & East Asia High income
Kosovo Eastern & Central Europe Lower-middle income
Kuwait Middle East High income
Kyrgyz Republic NIS & Russia Lower-middle income
Lao PDR OSEA Lower-middle income
Latvia Eastern & Central Europe High income
Lebanon Middle East Upper-middle income
Lesotho Africa Lower-middle income
Liberia Africa Low income
Libya Africa Upper-middle income
Liechtenstein Western Europe High income
Lithuania Eastern & Central Europe High income
Luxembourg Western Europe High income
Macao SAR, China North & East Asia High income
Macedonia, FYR Eastern & Central Europe Upper-middle income
Madagascar Africa Low income
Malawi Africa Low income
Malaysia OSEA Upper-middle income
Maldives South Asia Upper-middle income
Mali Africa Low income
Malta Western Europe High income
Marshall Islands OSEA Upper-middle income
Mauritania Africa Lower-middle income
Mauritius Africa Upper-middle income
Mexico Latin America & the Caribbean Upper-middle income
Micronesia, Fed. Sts. OSEA Lower-middle income
Moldova Eastern & Central Europe Lower-middle income
Monaco Western Europe High income
Mongolia North & East Asia Upper-middle income

142 | Appendix 2 ISN Global Kidney Health Atlas | 2019
Country ISN region Income group
Montenegro Eastern & Central Europe Upper-middle income
Morocco Africa Lower-middle income
Mozambique Africa Low income
Myanmar OSEA Lower-middle income
Namibia Africa Upper-middle income
Nauru OSEA Upper-middle income
Nepal South Asia Low income
Netherlands Western Europe High income
New Caledonia OSEA High income
New Zealand OSEA High income
Nicaragua Latin America & the Caribbean Lower-middle income
Niger Africa Low income
Nigeria Africa Lower-middle income
Northern Mariana Islands OSEA High income
Norway Western Europe High income
Oman Middle East High income
Pakistan South Asia Lower-middle income
Palau OSEA High income
Panama Latin America & the Caribbean Upper-middle income
Papua New Guinea OSEA Lower-middle income
Paraguay Latin America & the Caribbean Upper-middle income
Peru Latin America & the Caribbean Upper-middle income
Philippines OSEA Lower-middle income
Poland Eastern & Central Europe High income
Portugal Western Europe High income
Puerto Rico Latin America & the Caribbean High income
Qatar Middle East High income
Romania Eastern & Central Europe Upper-middle income
Russian Federation NIS & Russia Upper-middle income
Rwanda Africa Low income
Samoa OSEA Upper-middle income
San Marino Western Europe High income
São Tomé and Principe Africa Lower-middle income
Saudi Arabia Middle East High income
Senegal Africa Lower-middle income
Serbia Eastern & Central Europe Upper-middle income
Seychelles Africa High income
Sierra Leone Africa Low income
Singapore OSEA High income
Saint Maarten (Dutch part) Latin America & the Caribbean High income
Slovak Republic Eastern & Central Europe High income
Slovenia Eastern & Central Europe High income
Solomon Islands OSEA Lower-middle income
Somalia Africa Low income
South Africa Africa Upper-middle income
South Sudan Africa Low income
Spain Western Europe High income
Sri Lanka South Asia Lower-middle income
St. Kitts and Nevis North America & the Caribbean High income

ISN Global Kidney Health Atlas | 2019 Appendix 2 | 143
Country ISN region Income group
St. Lucia North America & the Caribbean Upper-middle income
St. Martin (French part) Latin America & the Caribbean High income
St. Vincent and the Grenadines North America & the Caribbean Upper-middle income
Sudan Africa Lower-middle income
Suriname Latin America & the Caribbean Upper-middle income
Swaziland Africa Lower-middle income
Sweden Western Europe High income
Switzerland Western Europe High income
Syrian Arab Republic Middle East Lower-middle income
Taiwan, China North & East Asia High income
Tajikistan NIS & Russia Lower-middle income
Tanzania Africa Low income
Thailand OSEA Upper-middle income
Timor-Leste OSEA Lower-middle income
Togo Africa Low income
Tonga OSEA Upper-middle income
Trinidad and Tobago North America & the Caribbean High income
Tunisia Africa Upper-middle income
Turkey Eastern & Central Europe Upper-middle income
Turkmenistan Eastern & Central Europe Upper-middle income
Turks and Caicos Islands North America & the Caribbean High income
Tuvalu OSEA Upper-middle income
Uganda Africa Low income
Ukraine NIS & Russia Lower-middle income
United Arab Emirates Middle East High income
United Kingdom Western Europe High income
United States North America & the Caribbean High income
Uruguay Latin America & the Caribbean High income
Uzbekistan NIS & Russia Lower-middle income
Vanuatu OSEA Lower-middle income
Venezuela, RB Latin America & the Caribbean Upper-middle income
Vietnam OSEA Lower-middle income
Virgin Islands (U.S.) North America & the Caribbean High income
West Bank and Gaza Middle East Lower-middle income
Yemen Middle East Lower-middle income
Zambia Africa Lower-middle income
Zimbabwe Africa Low income

144 | ISN Global Kidney Health Atlas | 2019

Country profiles of capacity forESKD Care
The International Society of Nephrology (ISN) hasbeen working collaboratively with existingorganizations and initiatives at international andnational levels to promote early detection andeffective treatment of kidney diseases in order toimprove patient health and quality of life. Byunderstanding and potentially helping to shaperelevant health policies, practices and infrastructure,the ISN aims to facilitate the implementation ofequitable and ethical care for kidney patients in allregions and countries of the world.
The ISN has recently conducted a researchexercise on the status of care for kidneypatients across all countries of the worldpublished in its Global Kidney Health Atlas(https://www.theisn.org/images/ISN_advocacy/GKHAtlas_Linked_Compressed1.pdf).
The GKHA demonstrated significant inter- andintra-regional variability in global kidney care, withsignificant gaps in kidney health workforce, healthservice delivery, essential medicines andtechnologies, health financing, leadership andgovernance, health information systems,strategies and policy frameworks, and researchcapacity and development, particularly in low andmiddle income countries. This has provided aplatform for championing the cause of chronickidney disease (CKD) using the identified gaps inUniversal Healthcare domains, and has provideda foundation for a global CKD surveillance andbenchmarking network.
This second iteration of the survey by the ISN isaimed at defining specifically the current globalstatus of end-stage kidney disease (ESKD) carestructures and organization. It will determine thecapacity and readiness of nations towardsachieving universal access to equitableintegrated ESKD care (including kidneyreplacement therapy and conservative care).
This questionnaire is designed to address thecore areas which inform aspects of universalhealth coverage specific to integrated ESKDcare: health financing, workforce, essentialmedications and health products access, healthinformation systems and statistics, policies, andservice delivery. Using this framework, we will beable to develop an appropriate globalperspective on the state of access to and qualityof KRT and conservative care globally. Obtaininguniversal, complete and accurate responses iscritical to closing the gaps that exist in kidneycare globally.
Thank you for your involvement and readinessto participate.
Professor David HarrisPresident International Society of Nephrology
SECTION #
HEADING 1APPENDIX 3
GLOBAL KIDNEY HEALTH ATLAS(GKHA) QUESTIONNAIRETopical survey: Access to ESKD care
ISN Global Kidney Health Atlas | 2019 Appendix 3 | 145

146 | Appendix 3 ISN Global Kidney Health Atlas | 2019
Survey ID:
Status? Please tick all that apply.
NephrologistNon-nephrologist (physician)Health professional (non-physician)Administrator/policymaker/civil servant Other (please specify)
In which country do you reside?
In which city do you reside?
In which ISN region do you reside?
How did you gather the information to complete this questionnaire?Please check all that apply.
Personal opinion/knowledgeGathered knowledge from other sources (for example, published literature or reports)Consultation with other colleaguesOther (please specify)
Contact

ISN Global Kidney Health Atlas | 2019 Appendix 3 | 147
A1. Healthcare system and funding mechanism
A1.1. In general, what best describes your healthcare system funding structure for non-dialysis CKD (ChronicKidney Disease)? (please choose the most appropriate response)
A. Health finance and service delivery
Topical survey: Access to End-stage Kidney Disease (ESKD) Care
Publicly funded by government and free at thepoint of deliveryPublicly funded by government but with somefees at the point of deliveryA mix of publicly funded (whether or notpublicly funded component is free at point ofdelivery) and private systems (please explain)
Solely private and out-of-pocket Solely private through health insuranceproviders Multiple systems – programs provided bygovernment, NGOs, and communitiesOther (please specify)
Publicly funded by government and free at thepoint of deliveryPublicly funded by government but with somefees at the point of deliveryA mix of publicly funded (whether or notpublicly funded component is free at point ofdelivery) and private systems (please explain)
Solely private and out-of-pocket Solely private through health insuranceproviders Multiple systems – programs provided bygovernment, NGOs, and communitiesN/A (KRT is not available in my country)Other (please specify)
Yes, all residents are included in the coverage No, not all residents are included (pleaseprovide details)
A1.2. In general, what best describes your healthcare system funding structure for KRT (renal replacementtherapy)? (please choose the most appropriate response)
A1.2.1. If KRT is publicly funded (in whole or in part), is this coverage universal (that is, are all residents of yourcountry eligible to participate)?
DialysisTransplantationComprehensive conservative care (renalpalliative supportive services)
Management of associated complications(anaemia, bone disease, malnutrition)None – all aspects fundedOther (please specify)
A1.2.2. If KRT is publicly funded (in whole or in part), which aspects of care are not included in the coverage?Please check all that apply.

148 | Appendix 3 ISN Global Kidney Health Atlas | 2019
Managed/overseen by a national bodyManaged/overseen by provincial/regional/statelevel authorities onlyManaged by individualhospitals/trusts/organizations
Managed by NGOsOther (please specify) No organized system
Publiclyfunded by
governmentand free
at the point of delivery
Publicly fundedby government
but with some fees at the point of delivery
A mix of publicly funded(whether or not publiclyfunded component is
free at point of delivery)and private systems
(please explain)
Solely privateand
out-of-pocket
Solelyprivatethroughhealth
insuranceproviders
Multiple systems– programsprovided bygovernment,NGOs, and
communities
Other(pleasespecify)
N/A (KRT is
notavailable
in mycountry)
A1.3.1 Vascular access forhaemodialysis (central venouscatheters)
A1.3.2 Vascular access forhaemodialysis (fistula or graftcreation)
A1.3.3 Access surgery for peritonealdialysis (PD catheter insertion)
A1.3.4 Surgery for kidneytransplantation
A1.3. What best describes your healthcare system’s coverage for surgical services for KRT? (please choosethe most appropriate response for each row)
A2. Within-country variation
We are interested in understanding within-country variation in ESKD care delivery as well as between-country variation.
A2.1. Does organization or delivery of ESKD (End-stage Kidney Disease) care differ regionally within yourcountry?
Yes (if possible, please provide brief details) No Unknown
A2.2. Does organization or delivery of ESKD care differ between children and adults in your country? Yes (if possible, please provide brief details) No Unknown
A2.3. Does the access to KRT differ between children and adults in your country?Yes (if possible, please provide brief details) No Unknown
A2.3.1 If KRT services are not equal between adults and children, what is the difference in access tohaemodialysis?
A2.3.2 If KRT services are not equal between adults and children, what is the difference in access toperitoneal dialysis?
A2.3.3 If KRT services are not equal between adults and children, what is the difference in access tokidney transplant?
A3. Oversight
A3.1. What best describes the management/oversight of ESKD care in your country? Please check all thatapply.

ISN Global Kidney Health Atlas | 2019 Appendix 3 | 149
B. Health workforce for nephrology care
B1. Clinical responsibility
B1.1. Who bears primary clinical responsibility for the delivery of ESKD care in your country? Please check allthat apply.
NephrologistsPrimary care physiciansNurse practitioners or specialized nurses
Multidisciplinary teamsHealth officers/extension workersOther (please specify)
B2. Workforce
B2.1. Approximately how many nephrologists are there in your country? Please leave blank if unknown.
B2.2. Approximately how many nephrologist trainees are there in your country?Click or tap here to enter text.Please leave blank if unknown.
B2.3. In your opinion, is there a shortage of any of the following providers in your country for ESKD care?Please check all that apply.
NephrologistsTransplant surgeonsSurgeons (who can put in arteriovenoushaemodialysis access)Surgeons (who can put in peritoneal dialysisaccess)Interventional radiologists (who can put inarteriovenous haemodialysis access)Interventional radiologists (who can put inperitoneal dialysis access)Dietitians
Laboratory techniciansRadiologists to conduct and interpret renalultrasoundsVascular access coordinatorsCounsellors/psychologistsTransplant coordinatorsDialysis nursesDialysis technicians No shortage of any of the staff mentionedabove
C1.1. Is chronic haemodialysis (adult and paediatric) available in your country? Yes No
C1.1.1. If yes, how many centres in your country provide chronic haemodialysis (HD)? Number of centres:
C1.2. Is chronic peritoneal dialysis (PD) (adult and paediatric) available in your country? Yes No
C1.2.1 If yes, how many centres in your country provide chronic PD? Number of centres:
C1.3. Is kidney transplantation performed in your country? Yes No
C1.3.1. If yes, what is the source of donated kidneys? (please choose the most appropriate response)Deceased donors onlyLive donors onlyA combination of deceased and live donors
If kidneys for transplant come from both deceased and live donors, what percentage are live?
C1.3.2. If kidney transplantation is available in your country, what kind of kidney transplant waitlist or waitlists arethere?
National Regional only None
C. Essential medications and health product access for ESKD care

150 | Appendix 3 ISN Global Kidney Health Atlas | 2019
C1.3.3. If kidney transplantation is available in your country, how many centres perform kidney transplantation?
Number of centres:
C2. Preparation for KRT
Optimal ESKD care: In the context of the ISN Vision, Mission and Values, we believe all patients approachingESKD should receive timely preparation for KRT, so the complications and progression of their disease areminimized, and their choice of clinically appropriate treatment options is optimized. The answers to the followingquestions are important to improve our understanding of current service provision.
C2.1. Please indicate the availability of the following services (tests and treatments) for ESKD care in yourcountry, where ‘Generally available’ means: in 50% or more centers (hospitals or clinics) and ‘Generallynot available’ means: in less than 50% of centres (hospitals or clinics)
Generally available Generally not available Never Unknown
C2.1.1 Measurement of serum haemoglobin
C2.1.2 Measurement of iron parameters (iron, ferritin,transferrin saturation)
C2.1.3 Measurement of inflammatory markers (for example,serum C-reactive protein)
C2.1.4 Oral iron
C2.1.5 Parenteral iron
C2.1.6 Erythropoietin
C2.1.7 Measurement of serum calcium
C2.1.8 Measurement of serum phosphorus
C2.1.9 Measurement of serum parathyroid hormone
C2.1.10 Calcium-based phosphate binders
C2.1.11 Non-calcium-based phosphate binders (for example,sevelamer)
C2.1.12 Cinacalcet
C2.1.13 Surgical services for parathyroidectomy
C2.1.14 Measurement of serum electrolytes (sodium,potassium, chloride, etc.)
C2.1.15 Measurement of serum bicarbonate
C2.1.16 Potassium exchange resins (for example, Kayexalate)
C2.1.17 Oral sodium bicarbonate
C2.1.18 Analogue BP monitoring
C2.1.19 Automated BP monitoring
Management of haemoglobin level
Management of renal bone disease
Management of electrolyte disorders and chronic metabolic acidosis
Management of blood pressure

ISN Global Kidney Health Atlas | 2019 Appendix 3 | 151
C4. Dialysis treatment – Quality and Choice
C4.1. Please indicate the availability of the following services for dialysis care in your country, where ‘Generallyavailable’ means: in 50% or more centres (hospitals or clinics) and ‘Generally not available’ means: inless than 50% of centres (hospitals or clinics).
Generallyavailable
Generally not available Never Unknown
N/A (dialysisnot provided)
C4.1.1 Haemodialys
C4.1.2 Peritoneal dialysis
C4.1.3 Centre-based haemodialysis service ofadequate frequency (treatment threetimes a week for three or four hours)
C4.1.4 Home haemodialysis
C4.1.5 Peritoneal dialysis exchanges ofadequate frequency (3–4 per day orequivalent cycles on automated PD)
C4.1.6 Determination of the effectiveness ofperitoneal dialysis (that is, bymeasurement of urea reduction ratio[URR] and/or Kt/V)
C4.1.7 Affordable patient transport services
Modality choice
Quality
Generally available Generally not available Never Unknown
C.3.1.1 Dietary counselling by a person trained innutrition (for example, a dietitian)
C3.1.2 Measurement of serum albumin
C3.1.3 Use of anthropometry for nutritional assessment(changes in body weight)
C3.1.4 Use of anthropometry for nutritional assessment(skin fold assessment)
C3.1.5 Use of anthropometry for nutritional assessment(body mass index)
C3.1.6 Oral nutrition supplements (for example,vitamins, oral meal supplements)
Nutritional Services
C3. Nutritional services
C3.1. Please indicate the availability of the following nutritional services for kidney care in your country, where‘Generally available’ means: in 50% or more centers (hospitals or clinics) and ‘Generally not available’means: in less than 50% of centres (hospitals or clinics)

152 | Appendix 3 ISN Global Kidney Health Atlas | 2019
C5. Transplant – Quality & Choice
Transplant choice: In the context of the ISN Vision, Mission and Values, we believe all patients with kidneytransplant are to receive a high-quality service which supports them in managing their transplant and enables themto achieve the best possible quality of life. The answers to the following questions are important to improve ourunderstanding of current service provision.
C5.1 Please indicate the availability of the following services for transplantation services in your country, where‘Generally available’ means: in 50% or more centres (hospitals or clinics) and ‘Generally not available’means: in less than 50% of centres (hospitals or clinics).
If transplantation is NOT available in your country, select N/A.
C6. Conservative care
Conservative (non-dialytic) kidney care: Comprehensive conservative care is defined as planned, holistic,patient-centred care for patients with CKD stage 5, according to Kidney Disease: Improving Global Outcomes(KDIGO). This is appropriate for patients who choose not to initiate RRT or in whom resource constraints preventor limit access to RRT.
We would like to know more about the capacity to deliver conservative care in your country (that is, capacity tosupport/manage patients who will not receive RRT despite being in kidney failure).
The goals of conservative care are usually to optimize quality of life, manage symptoms of kidney failure, and whenappropriate, preserve residual renal function in patients with advanced CKD (CKD stage 5).
C6.1. Considering the definition above, is conservative care available in your country?Yes No Unknown
Generallyavailable
Generallynot
available Never Unknown
N/A(transplantationnot available)
C5.1.1 Early provision of culturally appropriate information topatients, relatives and caregivers about the risks andbenefits of transplantation with a clear explanation of tests,procedures and results
C5.1.2 Effective preventive therapy to control infections (forexample, antivirals, antifungals, etc.)
C5.1.3 Timely access to operating space for kidney transplantation
C5.1.4 Appropriate immunosuppression and anti-rejectiontreatment
C5.1.5 Appropriate facilities to monitor administration ofimmunosuppression drugs
C5.1.6 Multidisciplinary team to support patients with a renaltransplant
C5.1.7 Standard framework for organ procurement (for example,legislation around brain death)

ISN Global Kidney Health Atlas | 2019 Appendix 3 | 153
Generallyavailable
Generallynot
available Never Unknown
N/A(conservative
care notavailable)
C6.2.1 Established choice-restricted conservative care (conservativecare for patients in whom resource constraints prevent or limitaccess to KRT)
C6.2.2 Established conservative care that is chosen or medicallyadvised (conservative care program for patients who optednot to have dialysis, where it is readily available)
C6.2.3 Multidisciplinary team approach to care via shared decisionmaking
C6.2.4 Shared decision-making tools for patients and providers;for example, practice guidelines for providers, patientdecision aids
C6.2.5 Systematic active recognition and management of symptomsassociated with advanced kidney failure
C6.2.6 Systematic provision of psychological, cultural, and spiritualsupport
C6.2.7 Systematic provision to care providers of additional training inconservative care
C6.2.8 Easy access to conservative care across settings (forexample, home, hospital, hospice, and nursing home)
C7. Essential medications and technologies for KRT – Accessibility, affordability and reimbursementplans and quality
Medication funding and reimbursement plans in KRT patients
C7.1. For all dialysis patients, how are medications funded? (please choose most appropriate response). Ifdialysis is not available in your country, please do not answer this question.
Publicly funded by government and free at thepoint of deliveryPublicly funded by government but with somefees at the point of deliveryA mix of publicly funded (whether or notpublicly funded component is free at point ofdelivery) and private systems (please specify)
Solely private and out-of-pocket Solely private through health insuranceproviders Multiple systems – programs provided bygovernment, NGOs, and communitiesOther (please specify)
C6.2 Please indicate the availability of a system for conservative care (holistic patient-centred care forpatients with CKD stage 5) that includes all or any of the following:
‘Generally available’ means: in 50% or more centres (hospitals or clinics) and ‘Generally notavailable’ means: in less than 50% of centres (hospitals or clinics).
If conservative care is NOT available in your country, select N/A.

154 | Appendix 3 ISN Global Kidney Health Atlas | 2019
C7.2. For all transplant patients, how are medications funded? (please choose most appropriate response). Iftransplantation is not available in your country, please do not answer this question.
Publicly funded by government and free at thepoint of deliveryPublicly funded by government but with somefees at the point of deliveryA mix of publicly funded (whether or notpublicly funded component is free at point ofdelivery) and private systems (please specify)
Solely private and out-of-pocket Solely private through health insuranceproviders Multiple systems – programs provided bygovernment, NGOs, and communitiesOther (please specify)
C8. Affordability
C8.1. What is the national average co-payment (including medications but no other ancillaries) forhaemodialysis patients in your country (that is, the proportion of the treatment cost paid for directly (out-of-pocket) by the patient?
N/A (not available in my country)0%1–25%26–50%
51–75%>75%100%
C8.1.1 Does this proportion vary in different parts of the country?
Yes (please explain below) No
N/A (not available in my country)Other (please explain below)
C8.1.2. Does this proportion vary depending on patients’ characteristics (for example, age, gender, employmentstatus)?
C8.2. What is the national average co-payment (including medications but no other ancillaries) for peritonealdialysis patients in your country, that is, the proportion of the treatment cost paid for directly (out-of-pocket) by the patient?
Yes (please explain below)No
N/A (not available in my country)Other (please explain below)
N/A (not available in my country)0%1–25%26–50%
51–75%>75%100%
C8.2.1. Does this proportion vary in different parts of the country?
Yes (please explain below)No
N/A (not available in my country)Other (please explain below)
C8.2.2. Does this proportion vary depending on patients’ characteristics (for example, age, gender, employmentstatus)?
Yes (please explain below)No
N/A (not available in my country)Other (please explain below)
C8.3. What is the national average co-payment (including medications but no other ancillaries) for kidneytransplant patients in your country, that is, the proportion of the treatment cost paid for directly (out-of-pocket) by the patient?
N/A (not available in my country)0%1–25%26–50%
51–75%>75%100%

ISN Global Kidney Health Atlas | 2019 Appendix 3 | 155
C8.3.1. Does this proportion vary in different parts of the country?
Yes (please explain below)No
N/A (not available in my country)Other (please explain below)
C8.3.2. Does this proportion vary depending on patients’ characteristics (for example, age, gender,employment status)?
Yes (please explain below)No
N/A (not available in my country)Other (please explain below)
Accessibility
C8.4 What proportion (national average) of patients with ESKD are able to access dialysis in your country?
0% (not available in my country)1–10%11–25%
26–50%>50%
C8.4.1. Does this proportion vary in different parts of the country?
Yes (please explain below)No
N/A (not available in my country)Other (please explain below)
C8.4.2. Does this proportion vary depending on patients’ characteristics (for example, age, gender,employment status)?
Yes (please explain below)No
N/A (not available in my country)Other (please specify)
C8.5. Out of those patients in your country who have ESKD and are able to access dialysis, what proportionusually start with peritoneal dialysis?
N/A – dialysis (of any kind) is not available in mycountry0% (means that there are patients who are ableto access some form of dialysis, but none ofthem start with PD)
1–10%11–25%26–50%>50%
C8.5.1. Does this proportion vary in different parts of the country?
Yes (please explain below)No
N/A (not available in my country)Other (please specify)
C8.5.2. Does this proportion vary depending on patients’ characteristics (for example, age, gender, employmentstatus)?
Yes (please explain below)No
N/A (not available in my country)Other (please specify)
C8.6. Out of those patients in your country who have ESKD and are suitable for transplant, what proportionare able to access kidney transplantation?
0% (not available in my country)1–10%11–25%
26–50%>50%
C8.6.1. Does this proportion vary in different parts of the country?
Yes (please explain below)No
N/A (not available in my country)Other (please specify)

156 | Appendix 3 ISN Global Kidney Health Atlas | 2019
C10. Haemodialysis quality
If haemodialysis is available in your country, what proportion of centres routinely measure and report the following toassess the quality of the dialysis that is provided? If haemodialysis is not available in your country, skip this section.
C10.1. Patient-reported outcome measures (for example, fatigue, quality of life, satisfaction, pain, etc.):
0% (None)1–10% (Few)11–50% (Some)
51–75% (Most)>75% (Almost all)
C8.6.2. Does this proportion vary depending on patients’ characteristics (for example, age, gender, employmentstatus)?
Yes (please explain below)No
N/A (not available in my country)Other (please specify)
C9.2. Blood pressure:
0% (None)1–10% (Few)11–50% (Some)
51–75% (Most)>75% (Almost all)
C9.3. Small solute clearance (for example, Kt/V or creatinine clearance):
0% (None)1–10% (Few)11–50% (Some)
51–75% (Most)>75% (Almost all)
C9.4. Haemoglobin/haematocrit:
0% (None)1–10% (Few)11–50% (Some)
51–75% (Most)>75% (Almost all)
C9.5. Bone mineral markers (calcium, phosphate, parathyroid hormone [PTH]):
0% (None)1–10% (Few)11–50% (Some)
51–75% (Most)>75% (Almost all)
C9.6. Technique survival:
0% (None)1–10% (Few)11–50% (Some)
51–75% (Most)>75% (Almost all)
C9. Peritoneal Dialysis Quality
If peritoneal dialysis is available in your country, what proportion of centres routinely measure and report thefollowing to assess the quality of the dialysis that is provided? If peritoneal dialysis is not available in your country,skip this section.
C9.1. Patient-reported outcome measures (for example, fatigue, quality of life, satisfaction, pain):
0% (None)1–10% (Few)11–50% (Some)
51–75% (Most)>75% (Almost all)
C9.7. Patient survival:
0% (None)1–10% (Few)11–50% (Some)
51–75% (Most)>75% (Almost all)

ISN Global Kidney Health Atlas | 2019 Appendix 3 | 157
C10.2. Blood pressure:
0% (None)1–10% (Few)11–50% (Some)
51–75% (Most)>75% (Almost all)
C10.3. Small solute clearance (for example, Kt/V or creatinine clearance):
0% (None)1–10% (Few)11–50% (Some)
51–75% (Most)>75% (Almost all)
C10.4. Haemoglobin/haematocrit:
0% (None)1–10% (Few)11–50% (Some)
51–75% (Most)>75% (Almost all)
C10.5. Bone mineral markers (calcium, phosphate, PTH):
0% (None)1–10% (Few)11–50% (Some)
51–75% (Most)>75% (Almost all)
C10.6. Technique survival:
0% (None)1–10% (Few)11–50% (Some)
51–75% (Most)>75% (Almost all)
C10.7. Patient survival:
0% (None)1–10% (Few)11–50% (Some)
51–75% (Most)>75% (Almost all)
C11.2. Delayed graft function:
0% (None)1–10% (Few)11–50% (Some)
51–75% (Most)>75% (Almost all)
C11.3. Rejection rates:
0% (None)1–10% (Few)11–50% (Some)
51–75% (Most)>75% (Almost all)
C11. Kidney Transplantation Quality
If kidney transplantation is available in your country, what proportion of centres routinely measure and report thefollowing to assess the quality of the transplantation that is provided? If transplantation is not available in yourcountry, skip this section.
C11.1. Patient-reported outcome measures (for example, fatigue, quality of life, satisfaction, pain, etc.):
0% (None)1–10% (Few)11–50% (Some)
51–75% (Most)>75% (Almost all)
C11.4. Renal allograft function:
0% (None)1–10% (Few)11–50% (Some)
51–75% (Most)>75% (Almost all)

158 | Appendix 3 ISN Global Kidney Health Atlas | 2019
D. Health information systems and statistics
C12.3. For haemodialysis, what proportion of patients commonly start dialysis with a temporarydialysis catheter:
0% (None)1–10% (Few)11–50% (Some)
51–75% (Most)>75% (Almost all)
Access for all dialysis – answer only if haemodialysis or peritoneal dialysis is available in your country
C12.4. For either haemodialysis or peritoneal dialysis, what proportion of patients routinely receive educationabout the best means of access and timely surgery (for example, six months before start ofhaemodialysis, one month before start of peritoneal dialysis):
0% (None)1–10% (Few)11–50% (Some)
51–75% (Most)>75% (Almost all)
D1. Registries
Definitions/abbreviations:
Registry: A systematic collection of data to evaluate specified outcomes for a defined population in order to serveone or more predetermined scientific, clinical, or policy purposes.
AKI: Acute Kidney Injury
D1.1. For which conditions or treatments is there an ‘official’ registry in your country?D1.1.1 CKD (non-KRT) Yes No UnknownD1.1.2 Dialysis Yes No UnknownD1.1.3 Transplantation Yes No UnknownD1.1.4 AKI Yes No Unknown
C11.5. Graft survival:
0% (None)1–10% (Few)11–50% (Some)
51–75% (Most)>75% (Almost all)
C11.6. Patient survival:
0% (None)1–10% (Few)11–50% (Some)
51–75% (Most)>75% (Almost all)
C12. Access
Access for haemodialysis – answer only if haemodialysis is available in your country.
C12.1. For haemodialysis, what proportion of patients routinely start dialysis with a functioning vascular access(AV fistula or graft):
0% (None)1–10% (Few)11–50% (Some)
51–75% (Most)>75% (Almost all)
C12.2. For haemodialysis, what proportion of patients routinely start dialysis with a tunnelled dialysis catheter:
0% (None)1–10% (Few)11–50% (Some)
51–75% (Most)>75% (Almost all)

ISN Global Kidney Health Atlas | 2019 Appendix 3 | 159
D1.2. If there is a CKD registry for patients who do not require KRT, what is the basis of participation in theCKD registry?
Voluntary Mandatory Unknown
D1.3. If there is a CKD registry for patients who do not require KRT, what is the geographical coverage of theCKD registry? (please check all that apply)
National Regional/state/provincial Local/hospital/community
D1.4. If there is a CKD registry for patients who do not require KRT, what does it cover? (please check allthat apply)
The whole spectrum of CKD (stages 1–5) Advanced CKD only (stages 4/5)
D1.5. If there is a dialysis registry, what is the basis of participation in the dialysis registry? Voluntary Mandatory Unknown
D1.6. If there is a dialysis registry, what is the geographical coverage of the dialysis registry? (please check allthat apply)
National Regional/state/provincial Local/hospital/community
D1.7. If there is a dialysis registry, what information does the dialysis registry collate? (please check allthat apply)
D1.8. If there is a transplantation registry, what is the basis of participation in the transplant registry? Voluntary Mandatory Unknown
D1.9. If there is a transplantation registry, what is the geographical coverage of the transplant registry? (pleasecheck all that apply)
National Regional/state/provincial Local/hospital/community
D1.10. If there is a transplantation registry, what information does the transplant registry collate? (please checkall that apply)
Aetiology of ESKDTransplant source (deceased/live donor)Process-based measures (anaemia, bonedisease, BP control markers)
Patient outcome measures (hospitalizations)Patient outcome measures (for example,satisfaction, quality of life)Patient outcome measures (mortality)
Aetiology of ESKDModality of dialysisProcess-based measures (anaemia, bonedisease, BP control markers)
Patient outcome measures (hospitalizations)Patient outcome measures (for example,satisfaction, quality of life)Patient outcome measures (mortality)
D1.11. If there is an AKI registry, what is the basis of participation in the AKI registry? Voluntary Mandatory Unknown
D1.12. If there is an AKI registry, what is the geographical coverage of the AKI registry? (please check allthat apply)
National Regional/state/provincial Local/hospital/community
D1.13. If there is an AKI registry, what information does the AKI registry collate? (please check all that apply)
Risk factors for AKIAetiology of AKIIncidence of AKIPatient outcome measures (hospitalizations)
Patient outcome measures (requirement forKRT, for example, dialysis or slow dialysistherapies like CRRT)Patient outcome measures (mortality)

160 | Appendix 3 ISN Global Kidney Health Atlas | 2019
Reactive approach – cases managed asidentified through practiceActive screening of at-risk population throughroutine health encounters
Active screening of at-risk population throughspecific screening processesOther (please specify)
Those with hypertensionThose with diabetes Those with cardiovascular disease (ischaemicheart disease, stroke, peripheral vasculardisease, heart failure)Those with autoimmune/multisystem diseases(systemic lupus erythematosus, rheumatoidarthritis)The elderly
Those with urological disorders (structural,stone diseases)Chronic users of nephrotoxic medicationsMembers of high-risk ethnic groups (Aboriginal,African, Indo-Asian)Those with a family history of CKDN/A – routine testing for CKD not offered
D2. Identification of disease (AKI and CKD)
Definitions:
Guidelines: Evidence-based recommended courses of action for prevention or management of disease.
Identification: Measures performed in at-risk populations in order to diagnose individuals who have risk factors orearly stages of disease but may not yet have symptoms.
Policy: A specific official decision or set of decisions designed to carry out a course of action endorsed by agovernment body; including a set of goals, priorities and main directions for attaining these goals. The policydocument may include a strategy to give effect to the policy.
Program: A planned set of activities or procedures directed at a specific purpose.
D2.1. For which of the following high-risk groups do practitioners in your country routinely offer testing forCKD? (please check all that apply)
Reactive approach – cases managed asidentified through practiceActive screening of at-risk population throughroutine health encounters
Active screening of at-risk population throughspecific screening processesOther (please specify)
D2.2. In your country, are there ethnic groups considered to be at increased risk for CKD? Yes (please specify below) No Unknown
D2.3. In your country, is there a CKD detection program in use that is based on national policy or guidelines?Yes No Unknown
D2.3.1 If there is a program, how is it implemented (please check all that apply):
D2.4. In your country, are there specific groups considered to be at increased risk for AKI? Yes (please specify below) No Unknown
D2.5. In your country, is an AKI detection program in use that is based on national policy and/or guidelines? Yes No Unknown
D2.5.1 If there is a program, how is this program implemented? (please check all that apply):

ISN Global Kidney Health Atlas | 2019 Appendix 3 | 161
E1.2.2 Please select which populations are covered in the national general NCD strategy (check all that apply)
Non-dialysis dependent CKDChronic dialysisKidney transplantation
E1.3. Are CKD-specific policies available?Yes No Unknown
E1.3.1 If yes, please specify which type of CKD policies are available in your country (check all that apply)National policies Regional policies
E1.2.1 Please select which populations are covered in the national CKD-specific strategy (check all that apply)
Non-dialysis dependent CKDChronic dialysisKidney transplantation
Definitions:
Policy: A specific official decision or set of decisions designed to carry out a course of action endorsed by agovernment body; including a set of goals, priorities and main directions for attaining these goals. The policydocument may include a strategy to give effect to the policy.
Program: A planned set of activities or procedures directed at a specific purpose.
Strategy: A long-term plan designed to achieve a particular goal.
E1. Policy and strategy
Non-communicable diseases (NCDs): Diseases that cannot be transmitted from person to person, notablycardiovascular diseases (like heart attacks and stroke), cancers, chronic respiratory diseases (such as chronicobstructive pulmonary disease and asthma) and diabetes.
E1.1. Does your country have a national strategy for non-communicable diseases?
E. National health policy
Yes, in place (please provide details below) Under development but not yet beingimplemented (please provide details below)
NoUnknown
E1.2. Does your country have a national strategy for improving the care of CKD patients?
Yes, a national CKD-specific strategy exists Yes, but the CKD strategy is incorporated intoan NCD strategy that includes other diseases.
NoUnknown

162 | Appendix 3 ISN Global Kidney Health Atlas | 2019
E2. Advocacy
E2.1. In your opinion, is CKD recognized as a health priority by the government in your country?
Yes (please provide details below) No (please explain why not below)
E2.2. Is there an advocacy group at the higher levels of government (for example, a parliamentary committee)or an NGO to raise the profile of CKD and its prevention?
Yes (please provide details below) No (please explain why not below)
Unknown
E2.3. In your opinion, is AKI and/or its prevention recognized as a health priority by the government in yourcountry?
Yes (please provide details below) No (please explain why not below)
E2.4. Is there an advocacy group at the higher levels of government (for example, a parliamentary committee)or an NGO to raise the profile of AKI and its prevention?
Yes (please provide details below) No (please explain why not below)
Unknown
E2.5. In your opinion, is ESKD and/or its treatment by KRT recognized as a health priority by the governmentin your country?
Yes (please provide details below) No (please explain why not below)
E2.6. Is there an advocacy group at the higher levels of government (for example, a parliamentary committee)or an NGO to raise the profile of ESKD/KRT?
Yes (please provide details below) No (please explain why not below)
Unknown
E2.7. Are there existing national/regional physician-oriented organizations or patient organizations that provideresources for ESKD care?
Yes (please provide details below) No (please explain why not below)
Unknown
E3. Barriers to optimal ESKD care
E3.1. Are there specific barriers to optimal ESKD care in your country? Please check all that apply.
Geography (distance from care or prolongedtravel time)Physician (availability, access, knowledge,attitude)Patient (knowledge, attitude)Nephrologist (availability)Healthcare system (availability, access,capability)
Lack of political will and enabling policiesEconomic factors (limited funding, poorreimbursement mechanisms)Other (please specify) None

ISN Global Kidney Health Atlas | 2019 Appendix 4 | 163
APPENDIX 4
SURVEY RESPONDENTS
Table A4.1 | Survey respondents, by ISN region
The following list comprises the survey respondents who consented to have their details published in the Atlas.
ISN region Country Respondent
Africa Angola Matadi Daniel
Benin Francis Lalya
Botswana Gordana Cavric
Burkina Faso Gérard Coulibaly
Cameroon Gloria Ashuntantang
Cape Verde Helder Evora Tavares
Chad Hamat Ibrahim
Congo, Democratic Republic of Telesphore Nduba Kilima Ernest Sumaili Kiswaya
Congo, Republic of Pierre Éric Gandzali-ngabe
Egypt Zaghloul Gouda
Ethiopia Solomon Assefa Yibeltal M Feyissa Yewondwossen Tadessi
Ghana Dwomoa Adu
Kenya George Moturi
Liberia Ssentamu Vanglist
Libya Abdulhafid Shebani
Madagascar E.M. Ranivoharisoa
Morocco Tarik Sqalli Houssaini
Niger Hassane Moussa Diongole
Nigeria Ifeoma Ulasi Babatunde L. Salako
Senegal Abdou Niang
Somalia Mahad Hassan
South Africa Anthony Meyers Graham Paget
Sudan Hisham Abdelwahab
Swaziland Thandiwe Dlamini
Tanzania Francis Fredrick Kajiru Kilonzo
Uganda Anthony Batte

164 | Appendix 4 ISN Global Kidney Health Atlas | 2019
ISN region Country Respondent
Eastern & Central Europe Albania Myftar Barbullushi Alma Idrizi
Bosnia and Herzegovina Halima Resic
Bulgaria Velislava Dimitrova
Croatia Petar Kes
Czech Republic Vladimir Tesar
Poland Michal Nowicki Magdalena Durlik Andrzej Wiecek
Romania Liliana Tuta
Turkey Mustafa Arici Rümeyza Kazancioglu
Latin America & the Caribbean Bolivia Rolando Claure-Del Granado
Brazil Emmanuel Burdmann
Colombia Erica Yama
Dominican Republic Guillermo Alvarez Jose Castillos
Guatemala Carmen Hernandez Paredes Jose Vicente Sanchez Polo
Haiti Audie Metayer
Mexico Ricardo Correa Rotter Alfonso Cueto Manzano Guillermo Garcia Garcia
Panama Regulo Valdes Miranda
Paraguay Silvio Franco
Peru Cesar Loza Munarriz
Uruguay Mariz Gonzalez-Bedat Oscar Noboa Pablo Rios
Venezuela Raul Carlini Carmen Luisa Milanes
Middle East Iran, Islamic Republic of Shahrzad Ossareh
Jordan Riyad Said
Kuwait Ali AlSahow Anas Alyousef
Lebanon Ali AbuAlfa
Oman Issa Al Salmi
Qatar Abdullah Ibrahim Hamad
Saudi Arabia Saeed Al Ghamdi Faissal Shaheen
Syrian Arab Republic Bassam Saeed Hala Wannous
Newly Independent States & Russia Armenia Ashot Sarkissian
Georgia Irma Tchokhonelidze
Kazakhstan Abduzhappar Gaipov
Russian Federation Elena Zakharova Alexander Zemchenkov

ISN Global Kidney Health Atlas | 2019 Appendix 4 | 165
ISN region Country Respondent
North America & the Caribbean Canada Amit Garg Peter Blake Lydia Lauder
Cayman Islands Nelson Iheonunekwu
Jamaica Davlyn Dewar
Saint Lucia Merle Clarke
United States Susan Crowley Franklin Maddux Stephen Sozio
Virgin Islands, British Jomo James
North & East Asia China Chi Wa Ao Ieong Chiuleong Li Ming-Hui Zhao
Hong Kong Daniel Chan Philip Li
Japan Masaomi Nangaku
Korea, Republic of Seung Hyeok Han Chun Soo Lim
Mongolia Baigalmaa Evsanaa
Taiwan Chih-Hsiang Chang Chih-Wei Yang
Oceania & South East Asia Australia Marie Ludlow Alan Cass
Cambodia Toru Hyodo Niv Rathvirak Pen Samkol
Fiji Amrish Krishnan
Indonesia Aida Sutranto
Malaysia Bak Leong Goh Lai Seong Hooi Zaki Morad Mohamad Zaher
Myanmar Yeeyee Myint Khin Thwin
New Caledonia Jean-Michel Tivollier
New Zealand Murray Leikis Robert Walker
Singapore Adrian Liew Hui Lin Choong
Thailand Kriang Tungsanga
Vietnam Huong thi Bich Tran Hai An Ha Phan
South Asia Afghanistan Ahmad Baseer Kaihan
Bangladesh Harun Ur Rashid
India Narayan Prasad
India Bharat Shah
Nepal Rishi Kafle
Pakistan Syed Akhtar
Sri Lanka Chulani Herath

166 | Appendix 4 ISN Global Kidney Health Atlas | 2019
ISN region Country Respondent
Western Europe Belgium Stefaan Claus
Denmark Helle Charlotte Thiesson
Finland Per-Henrik Groop
Germany Andreas Kribben
Greece Gerasimos Bamichas Aikaterini Papagianni
Italy Rosanna Coppo Noberto Perico Giuseppe Remuzzi
Netherlands Marc Hemmelder
Portugal Bernardo Marques Da Costa
Spain Alberto Ortiz
Sweden Gregor Guron
Switzerland Uyen Huynh Do
United Kingdom Fiona Loud


www.theisn.org
Global Operations CenterAvenue des Arts 1-21210 BruxellesBelgiumTel: +32 2 808 04 20Fax: +32 2 808 44 [email protected]
Americas Operations Center340 North Ave 3rd FloorCranford, New Jersey 07016United States of AmericaTel: +1 567 248 9703Fax: +1 908 272 7101
Online version of ISN Global Kidney Health Atlas: www.theisn.org/global-atlas