GIVING IN CHICAGO - Lilly Family School of Philanthropy · Giving in Chicago report is the landmark...
92
GIVING IN CHICAGO Commissioned by Researched and Written by
Transcript of GIVING IN CHICAGO - Lilly Family School of Philanthropy · Giving in Chicago report is the landmark...
GIVING IN CHICAGO
Commissioned by
Researched and Written by

The Chicago Community Trust For the past 100 years, The Chicago Community Trust has connected the generosity of donors with the needs of our community. The Trust, together with its donors, awards grants in many areas that impact community, from arts and basic human needs to economic development and health. Since our founding in 1915, the Trust has awarded approximately $2.3 billion in grants to thousands of local and national nonprofits, including $164.5 million in 2014. The Trust also works to improve the quality of life in our region by convening key leaders and organizations to respond to important issues, and by developing initiatives to inspire civic engagement among Chicago-area residents. The Trust’s Centennial year begins on May 12, 2015. Starting on this date and for the entire year after, the Trust will celebrate how philanthropy in all its forms – time, treasure and talent – strengthens our region and impacts the lives of others in countless ways. As we pursue our Centennial vision of making Chicago the most philanthropic region in the country, this first-of-its-kind comprehensive study of individual, corporate and foundation philanthropy in the six-county metropolitan Chicago region sets a benchmark to show where we are today and help us plan for the future. To learn more, visit www.cct.org.
Indiana University Lilly Family School of Philanthropy The Indiana University Lilly Family School of Philanthropy is dedicated to improving philanthropy to improve the world by training and empowering students and professionals to be innovators and leaders who create positive and lasting change. The School offers a comprehensive approach to philanthropy through its academic, research and international programs, and through The Fund Raising School, Lake Institute on Faith & Giving, and the Women’s Philanthropy Institute.
Learn more at www.philanthropy.iupui.edu.
© 2015 The Indiana University Lilly Family School of Philanthropy. All rights reserved.
To download the full report, visit www.givinginchicago.com.
Indiana University Lilly Family School of Philanthropy550 West North Street, Suite 301Indianapolis, IN 46202317-274-4200www.philanthropy.iupui.edu
The Chicago Community Trust225 North Michigan Ave., Suite 2200Chicago, IL 60601312-616-8000www.cct.org
The Indiana University Lilly Family School of Philanthropy Project Team
Una Osili, Ph.D., Director of Research
Xiaonan Kou, Project Coordinator
Min Qi, Research Associate
Shichao Tang, Research Assistant
Yannan Li, Research Assistant
Michael Walz, Research Assistant
Amy N. Thayer, Ph.D., Associate Director of Research
Grace Baranowski, Research Associate
Cynthia Hyatte, Administrative Assistant
Adriene Davis Kalugyer, Manager of Public Affairs
Carolyn Woolf, Heng Qu, Le Yang, Ming Hu, Zhuang Hao, and Jonathan Bergdoll, Research Assistants
Mindy Schneiderman, Assistant Director, and the team at the Center for Governmental Studies at Northern Illinois University
The Chicago Community Trust Project Team
Jamie Phillippe, Vice President of Development and Donor Services
Veronica Vidal, Assistant Director of Development
Daniel Ash, Chief Marketing Officer
Cheryl Hughes, Senior Director of Strategic Initiatives
Kate Allgeier, Manager of Electronic Communications
Patrick Donnelly, Database Manager
Tom Irvine, Chief Information Officer
James H. Lewis, Ph.D., Senior Program Officer & Director of Research and Evaluation
Maya Norris, Manager of Publications & Marketing
Rachel Pate, Marketing Assistant
Holly Bartecki, Jasculca Terman Strategic Communicatons
Luke Galambos, Galambos + Associates
Carly Olsman, Jasculca Terman Strategic Communicatons
Katelyn Yoshimoto, Jasculca Terman Strategic Communicatons
Advisory Committee
Robin Berkson, Senior Vice President, Member Services, Donors ForumPenelope Burk (of Counsel), President, Cygnus Applied Research
Christopher Einolf, Assistant Professor, School for Public Service at DePaul University
Edith Falk, Co-founder and former Chair, Campbell & Company
Charles Katzenmeyer, Vice President, Institutional Advancement, The Field Museum
Min S. Lee
Nicole Mitchell, Associate Manager of Development, The Chicago Community Trust
Kathy Pope, Assistant Director of Donor Services, The Chicago Community Trust
Dr. Pier C. Rogers, Director, Axelson Center for Nonprofit Management
Joe Skvara, CFRE, President, JS Consulting
Chuck Van Hecke, Associate Vice President, Office of Institutional Advancement, School of the Art Institute of Chicago
Kristin Carlson Vogen, President and CEO, Oak Park-River Forest Community Foundation
Don Zeilstra, Director of Development, Global FoodBanking Network
With special thanks to:All individuals and companies that participated in this study, AFP Chicago, Chicagoland Chamber of Commerce, Corporate Responsibility Group of Chicago, Donors Forum; and Heidi Newman for her review and comments.

FORWARD
Chicagoans have long taken pride in our civic mindedness and generosity. This Chicago spirit–the steady determination to bring about the very best conditions for all people, as Daniel Burnham described it–can be traced back to our city’s response to the Great Fire and remains evident today by the powerful relationship we have with one another and this geography we share.
Despite the challenges we face in a world of accelerating change and increasing complexity, at the heart of our city is the fact that Chicagoans take care of their own. The Chicago Community Trust has always known this to be true. Every day, we witness firsthand this generosity. We’ve witnessed it for 100 years.
At the dawn of its second century, the Trust’s Executive Committee continues our commitment to serve this region. This service is defined by our mission to lead and inspire philanthropic efforts that improve the quality of life and the prosperity for everyone who resides here.
Giving in Chicago, conducted by the Indiana University Lilly Family School of Philanthropy, is the first-of-its-kind comprehensive study of individual, corporate and foundation giving in the six-county metropolitan Chicago region. This study examines patterns of charitable giving by households, corporations, as well as grant making by foundations and public charities in the region. From the Trust’s perspective, philanthropy isn’t just the headline-grabbing million dollar donations; more importantly, it is expressed in the individual acts of generosity, donating school supplies, serving the hungry in food pantries, shoveling snow from your neighbor’s driveway, mentoring kids and visiting those who are homebound. Defined this way, we believe that everyone is a philanthropist!
With this belief in mind, the Trust commissioned Giving in Chicago to benchmark giving in the region. Our aim is to encourage and inspire all of us to be more philanthropic by sharing our time, treasure and talent to make our communities safer, families stronger, and life rich with opportunity.
The good news is that this study confirms what we already know: Chicagoans are generous. Not only are we generous, we are significantly more generous than the national average–by some measures, more than 50% more!
The Chicago Community Trust, itself, is the embodiment of this generosity of spirit–we exist only because of the thousands of donors who have placed their trust in our institution. We will continue to do our part, and we are confident that countless others will join us by supporting those causes that make our city and region a great place to live, work and raise a family.
Terry MazanyPresident and CEO, The Chicago Community Trust

TABLE of CONTENTS
Key Findings . . . . . . . . . . . . . . . . . . . . . . . . . . . . . . . . . . . . . . . . . . . . . . . . . . . . . . . . . . . . . . . . . .6
Implications . . . . . . . . . . . . . . . . . . . . . . . . . . . . . . . . . . . . . . . . . . . . . . . . . . . . . . . . . . . . . . . . . .16
Introduction . . . . . . . . . . . . . . . . . . . . . . . . . . . . . . . . . . . . . . . . . . . . . . . . . . . . . . . . . . . . . . . . . 20
Study Background and Purposes . . . . . . . . . . . . . . . . . . . . . . . . . . . . . . . . . . . . . . . . .21
What is Covered in this Report . . . . . . . . . . . . . . . . . . . . . . . . . . . . . . . . . . . . . . . . . . .21
Chicago Metro Area Regional Background . . . . . . . . . . . . . . . . . . . . . . . . . . . . . . . 22
Household Giving in the Chicago Metro Area . . . . . . . . . . . . . . . . . . . . . . . . . . . . . . . . . . 28
Household Charitable Giving . . . . . . . . . . . . . . . . . . . . . . . . . . . . . . . . . . . . . . . . . . . . 29
Household Volunteering . . . . . . . . . . . . . . . . . . . . . . . . . . . . . . . . . . . . . . . . . . . . . . . . . .41
Profile of Surveyed General Households in the Chicago Metro Area . . . . . . . . 48
Grant making in the Chicago Metro Area . . . . . . . . . . . . . . . . . . . . . . . . . . . . . . . . . . . . . 50
Definitions of the Grant Makers in the Report . . . . . . . . . . . . . . . . . . . . . . . . . . . . 52
Grant making by Chicago Metro Area Grant Makers . . . . . . . . . . . . . . . . . . . . . . 52
Corporate Giving in the Chicago Metro Area . . . . . . . . . . . . . . . . . . . . . . . . . . . . . . . . . . 62
Giving by Corporations . . . . . . . . . . . . . . . . . . . . . . . . . . . . . . . . . . . . . . . . . . . . . . . . . . 64
Giving by Corporate Foundations . . . . . . . . . . . . . . . . . . . . . . . . . . . . . . . . . . . . . . . . .77
Methodology . . . . . . . . . . . . . . . . . . . . . . . . . . . . . . . . . . . . . . . . . . . . . . . . . . . . . . . . . . . . . . . . 80

KEY FINDINGS
Giving in Chicago 2014 : Key Findings 7
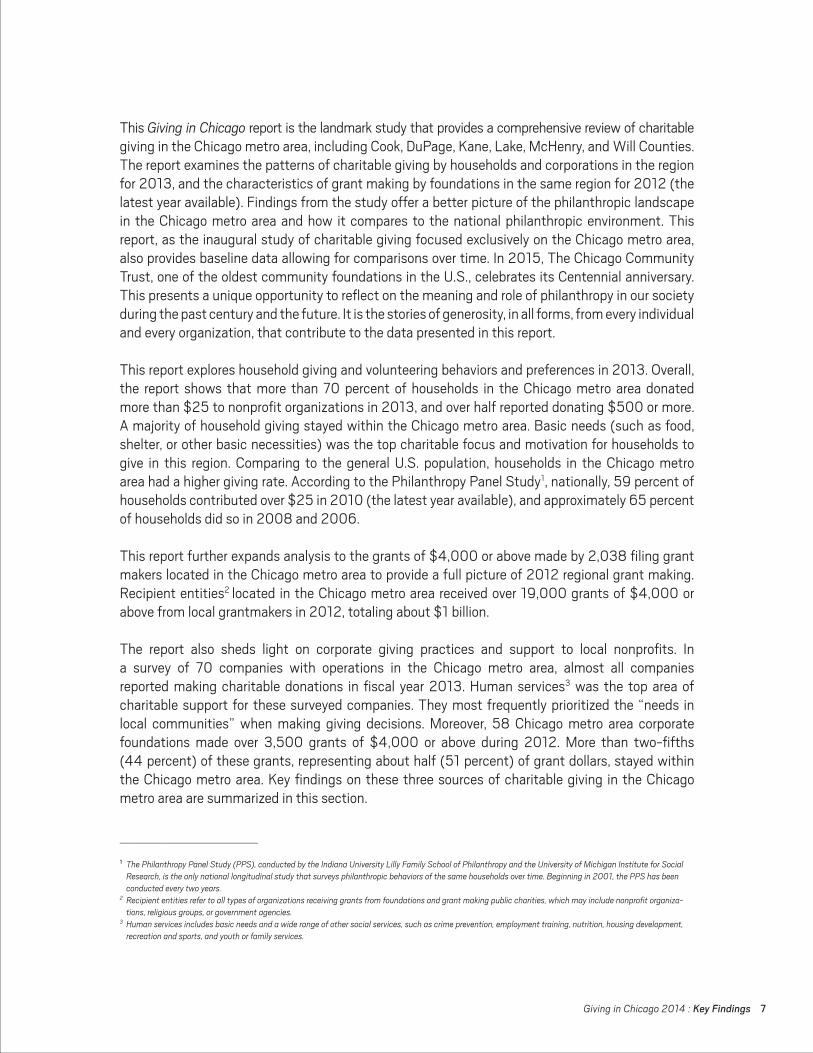
This Giving in Chicago report is the landmark study that provides a comprehensive review of charitable giving in the Chicago metro area, including Cook, DuPage, Kane, Lake, McHenry, and Will Counties. The report examines the patterns of charitable giving by households and corporations in the region for 2013, and the characteristics of grant making by foundations in the same region for 2012 (the latest year available). Findings from the study offer a better picture of the philanthropic landscape in the Chicago metro area and how it compares to the national philanthropic environment. This report, as the inaugural study of charitable giving focused exclusively on the Chicago metro area, also provides baseline data allowing for comparisons over time. In 2015, The Chicago Community Trust, one of the oldest community foundations in the U.S., celebrates its Centennial anniversary. This presents a unique opportunity to reflect on the meaning and role of philanthropy in our society during the past century and the future. It is the stories of generosity, in all forms, from every individual and every organization, that contribute to the data presented in this report.
This report explores household giving and volunteering behaviors and preferences in 2013. Overall, the report shows that more than 70 percent of households in the Chicago metro area donated more than $25 to nonprofit organizations in 2013, and over half reported donating $500 or more. A majority of household giving stayed within the Chicago metro area. Basic needs (such as food, shelter, or other basic necessities) was the top charitable focus and motivation for households to give in this region. Comparing to the general U.S. population, households in the Chicago metro area had a higher giving rate. According to the Philanthropy Panel Study1, nationally, 59 percent of households contributed over $25 in 2010 (the latest year available), and approximately 65 percent of households did so in 2008 and 2006.
This report further expands analysis to the grants of $4,000 or above made by 2,038 filing grant makers located in the Chicago metro area to provide a full picture of 2012 regional grant making. Recipient entities2 located in the Chicago metro area received over 19,000 grants of $4,000 or above from local grantmakers in 2012, totaling about $1 billion.
The report also sheds light on corporate giving practices and support to local nonprofits. In a survey of 70 companies with operations in the Chicago metro area, almost all companies reported making charitable donations in fiscal year 2013. Human services3 was the top area of charitable support for these surveyed companies. They most frequently prioritized the “needs in local communities” when making giving decisions. Moreover, 58 Chicago metro area corporate foundations made over 3,500 grants of $4,000 or above during 2012. More than two-fifths (44 percent) of these grants, representing about half (51 percent) of grant dollars, stayed within the Chicago metro area. Key findings on these three sources of charitable giving in the Chicago metro area are summarized in this section.
__________________________
1 The Philanthropy Panel Study (PPS), conducted by the Indiana University Lilly Family School of Philanthropy and the University of Michigan Institute for Social Research, is the only national longitudinal study that surveys philanthropic behaviors of the same households over time. Beginning in 2001, the PPS has been conducted every two years.
2 Recipient entities refer to all types of organizations receiving grants from foundations and grant making public charities, which may include nonprofit organiza-tions, religious groups, or government agencies.
3 Human services includes basic needs and a wide range of other social services, such as crime prevention, employment training, nutrition, housing development, recreation and sports, and youth or family services.

8 Giving in Chicago 2014 : Key Findings
TOTAL DONATIONS FROM THE CHICAGO METRO AREA
Chicago metro area households, grantmakers and corporations gave an estimated total of $10 billion to recipient entities in the region and elsewhere in 2013. The graph below shows the breakdown of total estimated giving from each type of donor (or source of contribution) in the Chicago metro area for 2013. Household donations accounted for 71 percent of the total. Grant dollars from foundations and grant making public charities (excluding corporate foundations) were 24 percent of the total. Estimated donations from corporations and corporate foundations in the region represented 5 percent of the total.
Compared to national percentages (excluding charitable bequests), the Chicago metro area has:• A lower share of household giving, at 71 percent, compared to the 78 percent estimated by
Giving USA 2014 for 2013;• A larger share of giving by foundations and grant making public charities, at 24 percent,
compared to the 16 percent by foundations in the U.S. in 2013, which, however, is partly attributed to the inclusion of grant dollars from grant making public charities in this study, accounting for approximately 5 percent of the total; and
• A comparable share of contributions from corporations and corporate foundations (5 percent compared to 6 percent in the U.S.).
DONATIONS FROM THE CHICAGO METRO AREABY SOURCE OF CONTRIBUTION, 2013
TOTAL = $10.0 BILLION ($ IN BILLIONS)
Households$7.171%
Foundations&GrantMakingPublicCharities
$2.424%
Corporations&CorporateFoundations
$0.55%
Giving in Chicago 2014 : Key Findings 9
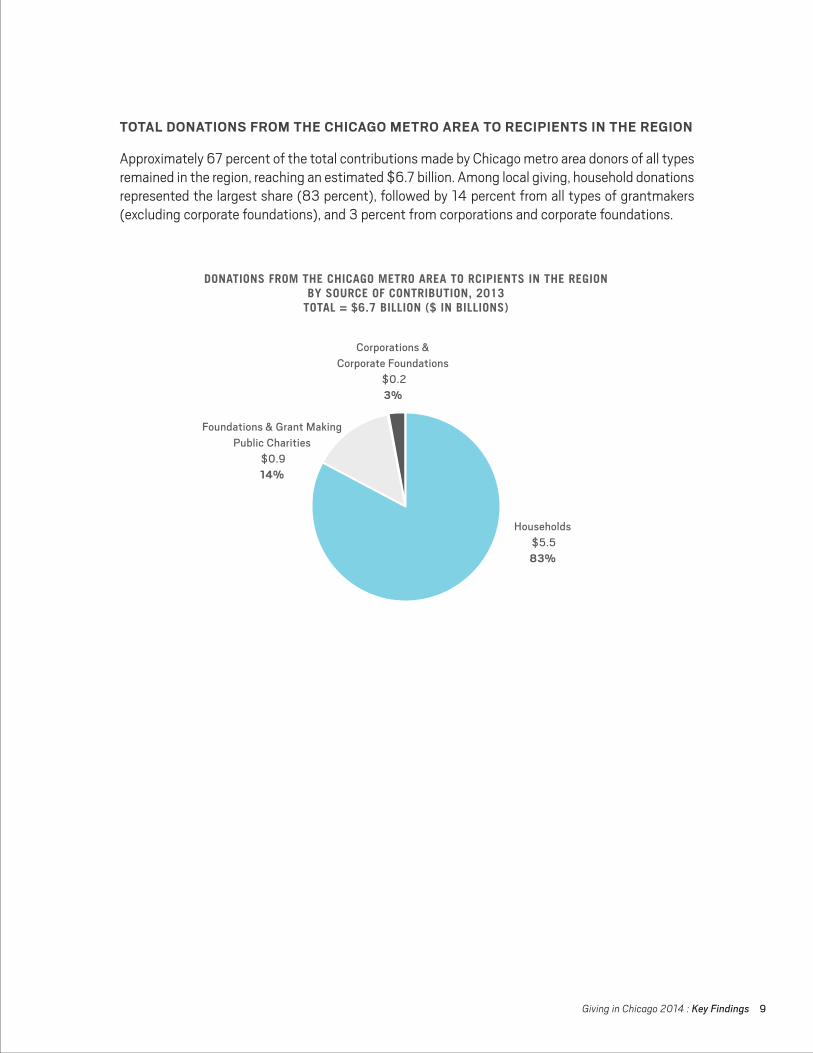
TOTAL DONATIONS FROM THE CHICAGO METRO AREA TO RECIPIENTS IN THE REGION
Approximately 67 percent of the total contributions made by Chicago metro area donors of all types remained in the region, reaching an estimated $6.7 billion. Among local giving, household donations represented the largest share (83 percent), followed by 14 percent from all types of grantmakers (excluding corporate foundations), and 3 percent from corporations and corporate foundations.
DONATIONS FROM THE CHICAGO METRO AREA TO RCIPIENTS IN THE REGIONBY SOURCE OF CONTRIBUTION, 2013
TOTAL = $6.7 BILLION ($ IN BILLIONS)
Households$5.583%
Foundations&GrantMakingPublicCharities
$0.914%
Corporations&CorporateFoundations
$0.23%
10 Giving in Chicago 2014 : Key Findings
HOUSEHOLD GIVING IN THE CHICAGO METRO AREA
Overview of household giving
Household donations accounted for an estimated $7.1 billion in the region and elsewhere in 2013. Nearly three-quarters of households reported donating $100 or more, and over half (54 percent) reported giving $500 or more. The total amount given, on average, was $2,327, with a median amount of $1,050 (both excluding high net worth households4 and outliers5 ). The largest share (72 percent) of donor households in the Chicago metro area donated to basic needs. Religion ranked second, supported by 60 percent of donor households, followed by health (44 percent).
Allocation of household giving
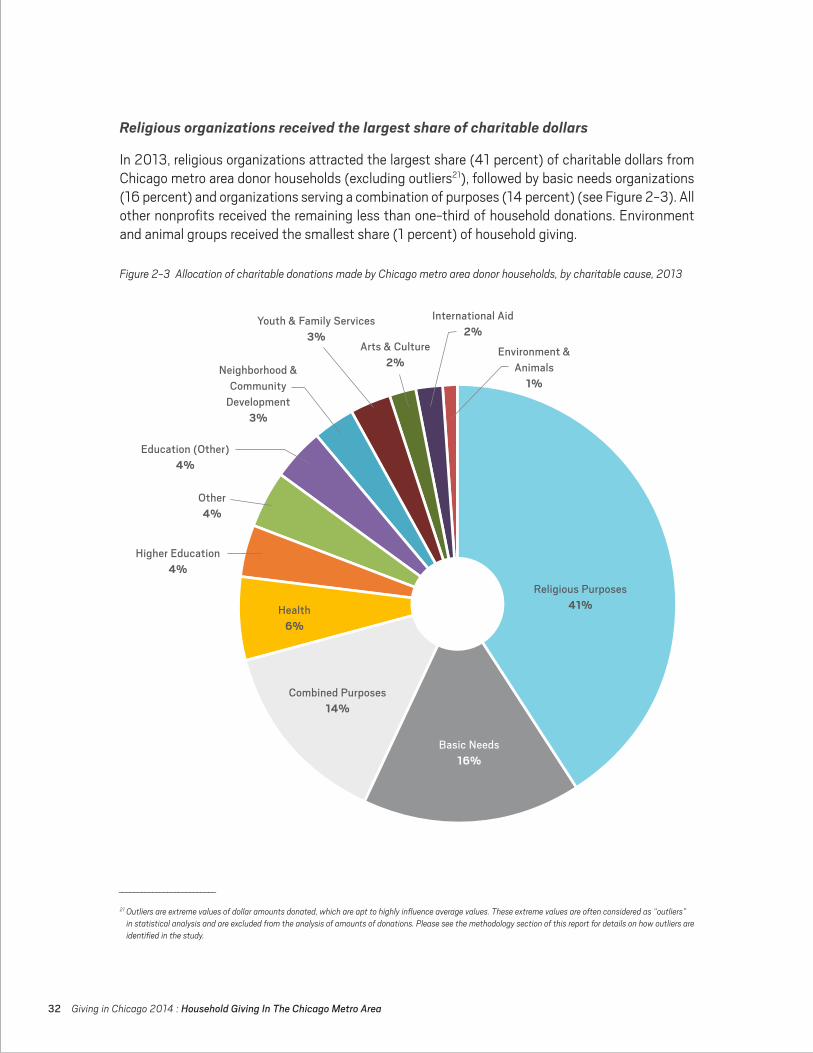
Religious organizations attracted the largest share (41 percent) of charitable dollars from donor households in the Chicago metro area (excluding outliers), followed by basic needs organizations (16 percent) and organizations serving a combination of purposes (such as United Way, United Jewish Appeal, or local community foundations) (14 percent).
Geographic distribution of household giving
Just over three-fourths (78 percent) of charitable dollars donated by Chicago metro area households stayed within the region in 2013. About one-tenth (13 percent) of household donations supported organizations located outside of Illinois or serving people primarily outside of Illinois. Nearly one-tenth (9 percent) of household donations went either to U.S. organizations primarily focusing on international issues or to overseas organizations.
Motivations for giving
The largest share of Chicago metro area donor households (76 percent) cited “helping individuals meet their basic needs” as a major motivation to donate. The other two most frequently reported major motives were “a feeling that those who have more should help those who have less” (70 percent) and “personal values or beliefs” (67 percent).
__________________________
4 High net worth households are defined in this study as households with an annual income of $200,000 or more and/or household net worth of $1,000,000 or more.5 Outliers are extreme values of dollar amounts donated, which are apt to highly influence average values. These extreme values are often considered as “outliers”
in statistical analysis and are excluded from the analysis of the amounts of donations. Please see the methodology section of this report for details on how outliers are identified in the study.
Giving in Chicago 2014 : Key Findings 11
Most prioritized policy issues
The largest share of Chicago metro area households prioritized basic needs as a top policy issue (52 percent). Health care, and K-12 education and other educational issues, also attracted considerable attention, selected by 39 percent and 20 percent of households, respectively.
Giving methods
Donor households in the Chicago metro area most frequently reported making donations in person by cash, check, or credit card (77 percent). About half of donor households gave by mail (50 percent) or online (48 percent); 10 percent made in-kind donations.
Informal giving
Approximately 65 percent of households in the Chicago metro area gave more than $25 to extended family members, friends, or community members in the U.S. who were in need of assis-tance. Nearly 20 percent gave more than $25 to such individuals outside of the U.S.
Bequest giving
Around one-third (34 percent) of households in the Chicago metro area had a will or a living trust, among which 14 percent had a charity named in their wills or living trusts, and 6 percent had made other provisions for charities in estate planning, such as creating a giving vehicle like a donor-advised fund or a private foundation.
Why donors stopped giving
About one-fifth (20 percent) of households in the Chicago metro area decided to stop supporting an organization to which they had repeatedly donated in the past. Religious and health organizations were most frequently reported by those who discontinued their donations (22 percent for each). Of those households that stopped their giving, the most often cited reason (66 percent) was discontinued involvement with the organization.
Snapshot of household volunteering
In 2013, nearly three-quarters (74 percent) of high net worth households in the Chicago metro area reported volunteering through organizations, and slightly less than half (47 percent) of other households reported the same. Among those who volunteered, nearly half (47 percent) reported volunteering at least once a week, about one-third (31 percent) volunteered once or twice each month, and around one-fifth (22 percent) volunteered several times a year or less often.
12 Giving in Chicago 2014 : Key Findings
Types of organizations benefiting from volunteering
Volunteer households in the Chicago metro area most frequently volunteered through religious organizations and educational organizations (excluding higher educational institutions). The top five types of organizations that attracted the most volunteering households include:
• Religious organizations (53 percent),• K-12 and other educational organizations (47 percent),• Organizations providing youth, senior, or family services6 (46 percent),• Social and community service groups7 (46 percent), and• Basic needs organizations (45 percent).
Volunteering activities
Volunteer households in the Chicago metro area most frequently offered their help through fundraising (71 percent). Nearly three-fifths (57 percent) of volunteer households contributed their time to “collect, prepare, distribute, or serve food,” while slightly over half (53 percent) volunteered by tutoring, teaching, or mentoring.
Motivations for volunteering
A majority (86 percent) of volunteer households indicated that “being concerned about those less fortunate than myself” was a major motivation for volunteering. The other two motives most often cited were “being concerned about a particular cause or group” (78 percent) and “personal values or beliefs” (69 percent).
GRANT MAKING IN THE CHICAGO METRO AREA
Overview of grant making
Nearly 39,000 grants of $4,000 or above were made by over 2,000 grant making organizations located in the Chicago metro area in 2012, with an estimate of $2.6 billion in total.
Grants made to recipient entities in the Chicago metro area
In 2012, recipient entities located in the Chicago metro area received more than 19,000 grants of $4,000 or above from over 1,300 Chicago metro area grantmakers. The total amount of these local grants was about $1 billion, accounting for 39 percent of total grant dollars made by Chicago metro area grantmakers. About 73 percent of these grants, or 55 percent of the dollar value, came from independent foundations. When looking at the purposes of the grants made to Chicago metro area
__________________________
6 Organizations providing youth, senior, or family services include organizations offering youth development, child day care, delinquency prevention or other youth services; family counseling, violence, or other services for parents and families; and housing, meals, transportation or other services focusing on the elderly.
7 Social and community service groups include organizations providing social services, addressing social problems, or improving general public benefits.
Giving in Chicago 2014 : Key Findings 13
recipient entities, human services and education were the top two causes supported by grantmakers in the region (in terms of both the number of grants and grant dollars).
Grants of $1 million or above
In 2012, Chicago metro area grantmakers made a total of 107 grants of $1 million or above to support recipient entities in the region. These grants represented over two-fifths (42 percent) of all grants at this level made by Chicago metro area grantmakers. Almost half (47 percent) of these grants came from independent foundations in the region, and one-third (33 percent) were contributed by grant making public charities.
Education received nearly one-fourth (23 percent) of these grants of $1 million or above, followed by health (19 percent). The largest share (31 percent) of dollar value was made to support community development, reaching about $101 million in total, followed by education (21 percent, or $69 million).
Grant making by county
Grantmakers in Cook County contributed the vast majority of grants made by Chicago metro area grantmakers in 2012, accounting for 85 percent of grants and 90 percent of grant dollars. Half of the grants made by Cook County grantmakers, accounting for over one-third (37 percent) of grant dollars, stayed within the Chicago metro area, a majority of which supported recipients in Cook County. Approximately half of the grants made by Cook County grantmakers that stayed within the Chicago metro area supported education and human services.
Grantmakers in Lake County and DuPage County contributed the second and third largest share of grant support among Chicago metro area grantmakers in 2012, together accounting for 14 percent of grants and 9 percent of grant dollars. The remaining 1 percent of grant making came from grant makers in Kane, McHenry, and Will Counties.
CORPORATE GIVING IN THE CHICAGO METRO AREA
Overview of corporate giving
The vast majority of surveyed companies (97 percent, or 68 of 70 companies) reported making charitable donations to nonprofit organizations in fiscal year 2013. Among surveyed companies that tracked charitable giving separately from other community investments8 (26 companies), the total amount given, on average, was $2,377,991, with a median amount of $100,000.
__________________________
8 In the survey, charitable giving refers to charitable donations of cash, products, or services made to nonprofit organizations. Besides charitable donations, other types of community investments include employee volunteerism, sponsorships, cause-related marketing, impact investing, and other initiatives to address social needs in communities.
14 Giving in Chicago 2014 : Key Findings
Primary areas of corporate giving
Human services organizations were the top focus for corporate charitable donations, supported by over three-quarters (76 percent) of surveyed companies that made donations in fiscal year 2013, followed by organizations that served a combination of purposes (59 percent), and educational organizations (43 percent). Slightly over half (54 percent) of surveyed donor companies focused their giving on three or fewer charitable areas.
In the survey, most donor companies (81 percent) donated to organizations in the Chicago metro area. Among them, three-fifths supported the same charitable areas across the six counties within the Chicago metro area, while nearly two-fifths supported different areas across the region.
Geographic distribution of corporate giving
Approximately two-thirds (63 percent) of donor companies supported nonprofits in the U.S. only. Another 16 percent also gave in a very geographically focused manner, supporting nonprofits located in only one or two regions worldwide. About 12 percent of donor companies donated globally without a specific geographic focus.
Goals for corporate giving
“Giving back to the communities where the company operates” was the top goal for corporate giving, reported by 76 percent of companies that made charitable donations in fiscal year 2013. “Supporting company’s mission and values” (68 percent) and “building and enhancing corporate reputation” (49 percent) were the second and third most frequently cited major goals.
Factors that influence corporate giving decisions
Corporate giving decisions were mostly impacted by the “needs in local communities,” reported by more than three-fifths (62 percent) of donor companies as the major influence in fiscal year 2013. Executives’ preferences (40 percent) and employees’ preferences (38 percent) also played an important role in the decision-making process.
Influencer of corporate-nonprofit partnerships
When establishing or maintaining relationships with nonprofit recipients, 65 percent of donor com-panies indicated the “alignment of recipient’s mission with the company’s philanthropic focus” as the top deciding factor. About 54 percent of donor companies considered the recipient’s geographic location as important and would prefer recipients be located in the same regions as the company.
Giving in Chicago 2014 : Key Findings 15
Corporations reported internal resources needed to improve charitable and social investments
One-third of surveyed companies indicated specific areas or resources that could help improve their charitable and social investments. These companies most often reported needing more financial resources and more staff dedicated to charitable efforts. The stronger emphasis of companies on the evaluation and sustainability of their charitable initiatives over the coming years calls for more financial and human resources that can be dedicated to such efforts.
Grant making by corporate foundations in the Chicago metro area
In 2012, corporate foundations in the Chicago metro area made approximately 3,500 grants of $4,000 or above, with a total of $158 million. The average amount of a single grant was $44,656, with a median amount of $10,000. More than two-fifths (44 percent) of grants, accounting for over half (51 percent) of grant dollars, stayed within the Chicago metro area. When looking at the purposes of the grants, Chicago metro area corporate foundations mostly supported human services, education, arts and culture, and community development. These four purposes together received a majority of foundation support (80 percent of grants and 88 percent of grant dollars).
METHODOLOGY
This study analyzed data from various sources to develop a comprehensive review of charitable giving in the Chicago metro area. Information for the estimate of household giving and volunteering was collected from telephone interviews of households in the Chicago metro area. A total of 760 households completed all interview questions. Survey weights were constructed and applied to ensure that the final sample of the study was representative of the general population living in the Chicago metro area.
Data on grant making were collected from IRS Forms 990-PF made available through several databases (including FoundationSearch.com, Foundation Center, GuideStar, and the National Center for Charitable Statistics at the Urban Institute). Grants of $4,000 or above made by all types of grantmakers located in the Chicago metro area for 2012 (the latest year available) were included in the analysis.
Information on corporate giving was collected through two sources. First, a selected sample of companies with operations in the Chicago metro area were invited to participate in a survey on corporate giving and community investments. A total of 70 companies completed the survey, representing organizations of all sizes and various industries. Second, information reported by corporate foundations on IRS Forms 990-PF was collected through several databases (including FoundationSearch.com, Foundation Center, GuideStar, and the National Center for Charitable Statistics at the Urban Institute) to provide detailed information on grants of $4,000 or above made in 2012 (the latest year available) by corporate foundations located in the Chicago metro area.
IMPLICATIONS
Giving in Chicago 2014 : Implications 17
This study examines philanthropic giving from households, corporations, and foundations in the Chicago metro area. Findings from the study provide a comprehensive view of the current philanthropic landscape in metropolitan Chicago. Key themes from the study are discussed below.
GENEROSITY OF CHICAGO METRO AREA HOUSEHOLDS
The study shows that Chicago metro area households were more likely to give, and gave more on average, to nonprofits in 2013, compared to the general U.S. population. Many major developments and landmarks in the Chicago metro area can be attributed to the generosity of Chicagoans past and present. This type of strong philanthropic commitment by donors in the region reflects a sense of trust and confidence in nonprofits to address community needs. This presents a great opportunity for nonprofits to review and enhance their donor recognition and stewardship practices, which could encourage continued support and deepen donor engagement. Incorporating approaches that strengthen donor relations can further inspire philanthropy and help address the challenges facing the metro area.
ROLE OF PHILANTHROPY IN MEETING BASIC NEEDS AND PROVIDING HUMAN SERVICES
Basic needs and human services were major charitable foci for all types of donors in the Chicago metro area. This reflects significant efforts of donors and nonprofits to recognize the importance of these issues in communities and their collective efforts to address them. Recent estimates show that household income inequality increased dramatically in the U.S. from the late 1960s, especially after 1980.9 The rising inequality across the country has led to important questions about the changing environment of charitable giving. Philanthropy has long played an important role in meeting basic needs of low-income families and communities in the U.S. and in the Chicago metro area. During the Great Recession, cuts in state and federal funding placed renewed emphasis on the role of philanthropy across communities. One recent example was the 2013 Lawyers Feeding Illinois Campaign, which provided 4.6 million meals for Illinois residents who suffered from food insecurity. This study consistently demonstrates Chicago metro area donors’ great focus on basic needs and other human services. The need for support of basic needs and other human services remains rather high in the Chicago metro area, which is shown clearly from the following statistics.
__________________________
9 Sommeiller, E., & Price, M. (2015). The increasingly unequal states of America. Retrieved from http://www.epi.org/publication/income-inequality-by-state-1917-to-2012/; U.S. Census Bureau. (2000). The changing shape of the nation’s income distribution. Retrieved from http://www.census.gov/prod/2000pubs/p60-204.pdf; U.S. Census Bureau. (n.d.) Narrative on income inequality (Middle class). Retrieved from http://www.census.gov/hhes/www/income/data/inequal-ity/middleclass.html
18 Giving in Chicago 2014 : Implications
• The poverty rate in Illinois was 14.5 percent in 2013, higher than 24 states across the country.10
The unemployment rate in Illinois was 6.4 percent in 2014, higher than 34 states across the country. The food insecurity rate in Illinois was 14.2 percent in 2012, higher than 17 U.S. states. These rates were even higher in Cook County, in particular.
• In Illinois, the top 1 percent of taxpayers, on average, earned 29.7 times as much as the other 99 percent in 2012.11 This income inequality rate was higher than 41 U.S. states.
• According to the 2014 Point-in-Time (PIT) count, more than 6,000 people were homeless in Chicago on a given night in January 2014, which remained unchanged from 2013.12 About one in ten of these individuals were chronically homeless—individuals who had been continuously homeless for one year or longer, or for at least four separate occasions over the past three years. Moreover, almost one-third of the individuals located in shelters were children under age 18, and over two-fifths were female.
While basic needs and human services are top of mind for donors, the statistics show there is still more work to be done. The issues of poverty and income inequality are closely linked with other societal problems local communities are facing. Nonprofit organizations and donors of all types are called upon to continue combating these issues collectively. Findings from this study show that helping others to meet basic needs is the most important factor motivating charitable support from individual donors. Needs in local communities similarly held the highest weight in corporate charitable funding decisions. Therefore, it is essential for nonprofits to continue building and raising public awareness of community needs to achieve sustainable changes.
COMMITMENT TO LOCAL COMMUNITIES
Donors in the Chicago metro area showed a strong commitment to their local communities. A substantial share of charitable giving stayed within the donor’s region. This localization emphasizes the importance of leveraging resources to address community issues, which can, in turn, fuel local economic growth and improve the quality of life in the region. Individuals, companies, and foundations that have roots in local communities are well aware of the history, culture, and societal problems of the communities. Thus, in the cultivation and stewardship of local donors, it is critical for nonprofits to demonstrate how they can work together to respond to local issues and show the impact of their collective efforts. Continuous stewardship can better inform donors on various ways they can make a difference in their own communities. It can also promote donor confidence in an organization’s capacity to address societal problems. Ensuring support of local communities also calls for nonprofits to maintain and improve the effectiveness and efficiency of their work. By continuing to build on this mutual trust, nonprofits are likely to sustain and possibly increase donor support to continue providing services to those in need.
__________________________
10 Social IMPACT Research Center. (2015). Poor by comparison: Report on Illinois Poverty. Retrieved from http://www.ilpovertyreport.org11 Sommeiller, E., & Price, M. (2015). The increasingly unequal states of America. Retrieved from http://www.epi.org/publication/income-inequality-by-state-
1917-to-2012/12 City of Chicago Department of Family and Support Services. (2014). 2014 Homeless point-in-time count & survey report. Retrieved from http://www.cityofchi-
cago.org/content/dam/city/depts/fss/supp_info/Homeless/2014PITReport.pdf
Giving in Chicago 2014 : Implications 19
A CALL FOR BETTER COMMUNICATION AND ENGAGEMENT
The study further provides insights into the factors that constrain charitable giving. About one in five households in the Chicago metro area stopped supporting an organization to which they had repeatedly donated. The reasons they stopped giving can be grouped into four broad categories, including donors’ discontinued involvement with the organization, changes in donors’ circumstances or charitable priorities, donors’ unfavorable perceptions of the organization, and the organization’s lack of proper communication with donors. This calls for more attention from nonprofits to address donor concerns and improve donor stewardship and communication. Greater transparency on internal policies and procedures and a clear demonstration of measurable outcomes can help nonprofits enhance donor confidence. In addition, as companies and foundations put more emphasis on measurement and evaluation, nonprofits similarly need to effectively communicate the impact of their work with grantmakers.
POTENTIAL OF ONLINE GIVING
Online giving has grown exponentially over the past decade. Although it is hard to estimate the total amount of online giving via various platforms, the trend is clear: online giving has emerged as a popular method of charitable giving. Online donations through Network for Good’s platform alone increased from $17.1 million in 2002 to $190 million in 2013.13 In this study, almost half of Chicago metro area households donated online in 2013, and nearly 70 percent of high net worth households donated online in the same year. Online giving surpassed the traditional method of giving by mail and ranked second as a primary method of giving among Chicago metro area donors, following giving in person as the method used most often. The rising popularity of online giving presents opportunities for nonprofits to more easily reach broader populations through multiple online channels and social media venues. These new tools can be powerful in helping nonprofits build and foster relationships. It is also important for nonprofits to understand the similarities and differences between their traditional donors and their new online donors, and to adapt cultivation and communication practices according to the preferences of different donor groups. By harnessing new online tools, nonprofits can help strengthen philanthropy in the Chicago metro area.
__________________________
13 Network for Good. (n.d.). The digital giving index: 2013 year in review. Retrieved from http://www1.networkforgood.org/digitalgivingindex; Network for Good. (2006). The young and the generous: A study of $100 million in online giving to 20,000 charities. Retrieved from http://www.guidestar.org/ViewCmsFile.aspx?ContentID=2308

INTRODUCTION
Giving in Chicago 2014 : Introduction 21
STUDY BACKGROUND AND PURPOSES
This Giving in Chicago report is the landmark study that provides a comprehensive review of charitable giving in the Chicago metro area, including Cook, DuPage, Kane, Lake, McHenry, and Will Counties. The report examines the patterns of charitable giving by households and corporations in the region for 2013 and the characteristics of grant making by foundations in the same region for 2012 (the latest year available). The purpose of this study is to report the sources and recipients of charitable giving in the Chicago metro area. Its findings offer the greater Chicago community a better picture of the philanthropic landscape in the Chicago metro area. Comparisons with national data are provided, when available, to offer context in order to better understand the similarities and differences of philanthropic engagement in the region. This report, as the inaugural study of charitable giving focused exclusively on the Chicago metro area, also provides baseline data allowing for comparisons over time.
The Chicago Community Trust’s Centennial year begins on May 12, 2015. Starting on this date and for the entire year after, the Trust will celebrate how philanthropy in all its forms—time, treasure and talent—strengthens the Chicago metro area and impacts the lives of others in countless ways. As the Trust pursues its Centennial vision of making Chicago the most philanthropic region in the country, this study sets a benchmark to show where we are today and helps us plan for the future.
WHAT IS COVERED IN THIS REPORT
This study focuses on charitable donations made by households, corporations, and foundations in the Chicago metro area, covering the six Illinois counties of Cook, DuPage, Lake, Kane, McHenry, and Will. The report examines giving by households and corporations made in 2013 and grant making by all types of grantmakers in 2012 (the latest year available).
Data on household giving were collected through telephone interviews with a random sample of households in the Chicago metro area, and the findings have been adjusted to be representative of the general households in the region by applying survey weights. Data on grant making by other types of foundations and grant making public charities were collected from IRS Forms 990-PF, and findings on the grants of $4,000 or above are presented in the report. Data on corporate giving were collected from two sources, including a survey of 70 companies with operations in the region and IRS Forms 990-PF filed by Chicago metro area corporate foundations. Findings from the survey and an analysis of corporate grants of $4,000 or above are discussed in the report.
22 Giving in Chicago 2014 : Introduction
CHICAGO METRO AREA REGIONAL BACKGROUND
The Chicago metro area is comprised of six Illinois counties: Cook, DuPage, Kane, Lake, McHenry, and Will. It is the third-most populated metropolitan area in the U.S.
Population
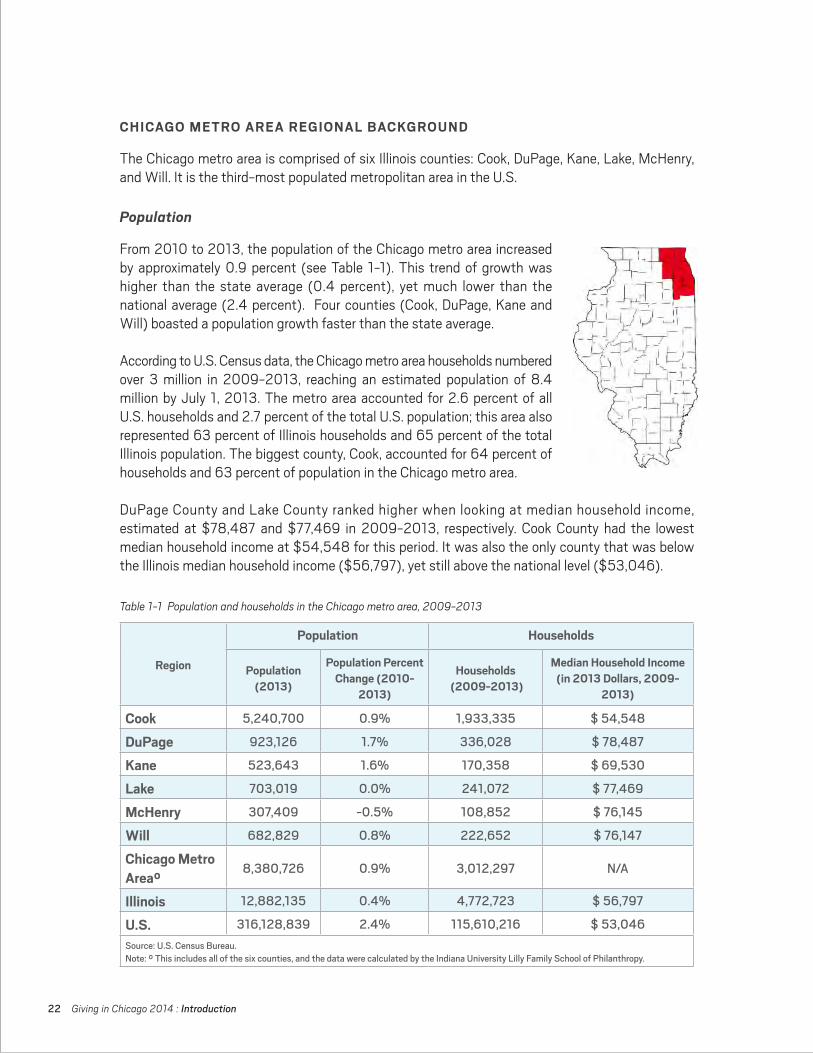
From 2010 to 2013, the population of the Chicago metro area increased by approximately 0.9 percent (see Table 1-1). This trend of growth was higher than the state average (0.4 percent), yet much lower than the national average (2.4 percent). Four counties (Cook, DuPage, Kane and Will) boasted a population growth faster than the state average.
According to U.S. Census data, the Chicago metro area households numbered over 3 million in 2009-2013, reaching an estimated population of 8.4 million by July 1, 2013. The metro area accounted for 2.6 percent of all U.S. households and 2.7 percent of the total U.S. population; this area also represented 63 percent of Illinois households and 65 percent of the total Illinois population. The biggest county, Cook, accounted for 64 percent of households and 63 percent of population in the Chicago metro area.
DuPage County and Lake County ranked higher when looking at median household income, estimated at $78,487 and $77,469 in 2009-2013, respectively. Cook County had the lowest median household income at $54,548 for this period. It was also the only county that was below the Illinois median household income ($56,797), yet still above the national level ($53,046).
Region
Population Households
Population (2013)
Population Percent Change (2010-
2013)
Households (2009-2013)
Median Household Income (in 2013 Dollars, 2009-
2013)
Cook 5,240,700 0.9% 1,933,335 $54,548
DuPage 923,126 1.7% 336,028 $78,487
Kane 523,643 1.6% 170,358 $69,530
Lake 703,019 0.0% 241,072 $77,469
McHenry 307,409 -0.5% 108,852 $76,145
Will 682,829 0.8% 222,652 $76,147
Chicago Metro Area°
8,380,726 0.9% 3,012,297 N/A
Illinois 12,882,135 0.4% 4,772,723 $56,797
U.S. 316,128,839 2.4% 115,610,216 $53,046Source:U.S.CensusBureau.Note:°Thisincludesallofthesixcounties,andthedatawerecalculatedbytheIndianaUniversityLillyFamilySchoolofPhilanthropy.
Table 1-1 Population and households in the Chicago metro area, 2009-2013
Giving in Chicago 2014 : Introduction 23
Region
Population Households
Population (2013)
Population Percent Change (2010-
2013)
Households (2009-2013)
Median Household Income (in 2013 Dollars, 2009-
2013)
Cook 5,240,700 0.9% 1,933,335 $54,548
DuPage 923,126 1.7% 336,028 $78,487
Kane 523,643 1.6% 170,358 $69,530
Lake 703,019 0.0% 241,072 $77,469
McHenry 307,409 -0.5% 108,852 $76,145
Will 682,829 0.8% 222,652 $76,147
Chicago Metro Area°
8,380,726 0.9% 3,012,297 N/A
Illinois 12,882,135 0.4% 4,772,723 $56,797
U.S. 316,128,839 2.4% 115,610,216 $53,046Source:U.S.CensusBureau.Note:°Thisincludesallofthesixcounties,andthedatawerecalculatedbytheIndianaUniversityLillyFamilySchoolofPhilanthropy.
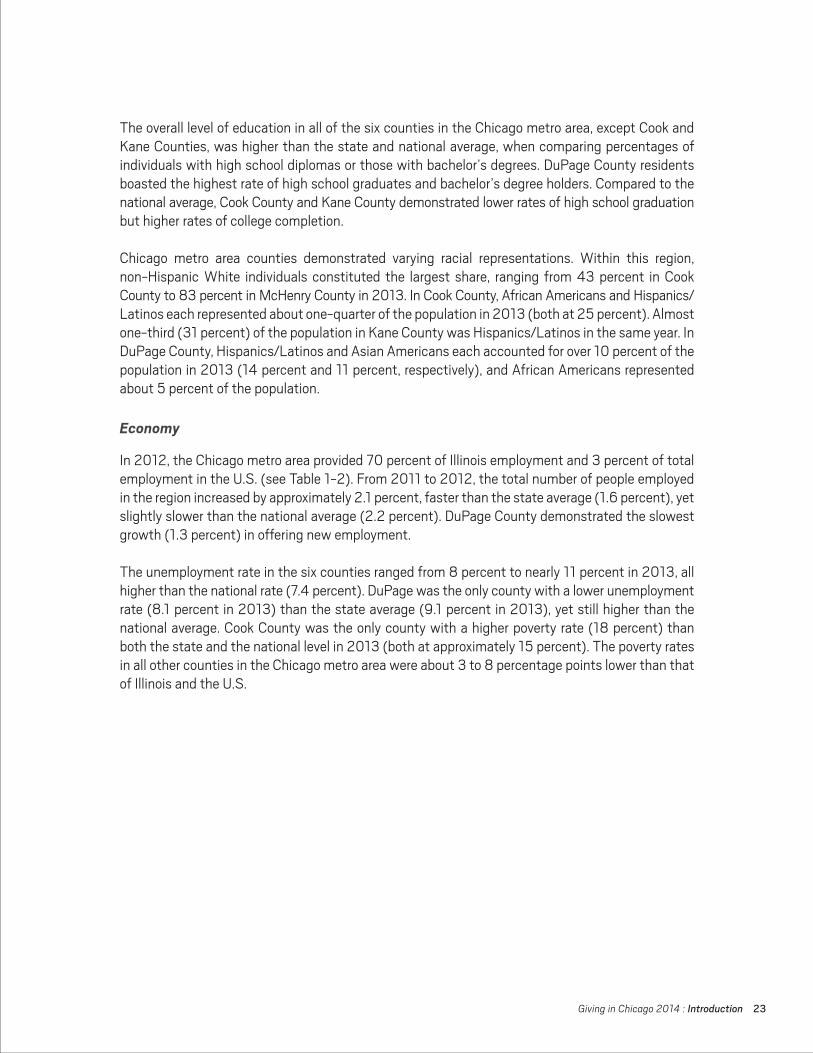
The overall level of education in all of the six counties in the Chicago metro area, except Cook and Kane Counties, was higher than the state and national average, when comparing percentages of individuals with high school diplomas or those with bachelor’s degrees. DuPage County residents boasted the highest rate of high school graduates and bachelor’s degree holders. Compared to the national average, Cook County and Kane County demonstrated lower rates of high school graduation but higher rates of college completion.
Chicago metro area counties demonstrated varying racial representations. Within this region, non-Hispanic White individuals constituted the largest share, ranging from 43 percent in Cook County to 83 percent in McHenry County in 2013. In Cook County, African Americans and Hispanics/Latinos each represented about one-quarter of the population in 2013 (both at 25 percent). Almost one-third (31 percent) of the population in Kane County was Hispanics/Latinos in the same year. In DuPage County, Hispanics/Latinos and Asian Americans each accounted for over 10 percent of the population in 2013 (14 percent and 11 percent, respectively), and African Americans represented about 5 percent of the population.
Economy
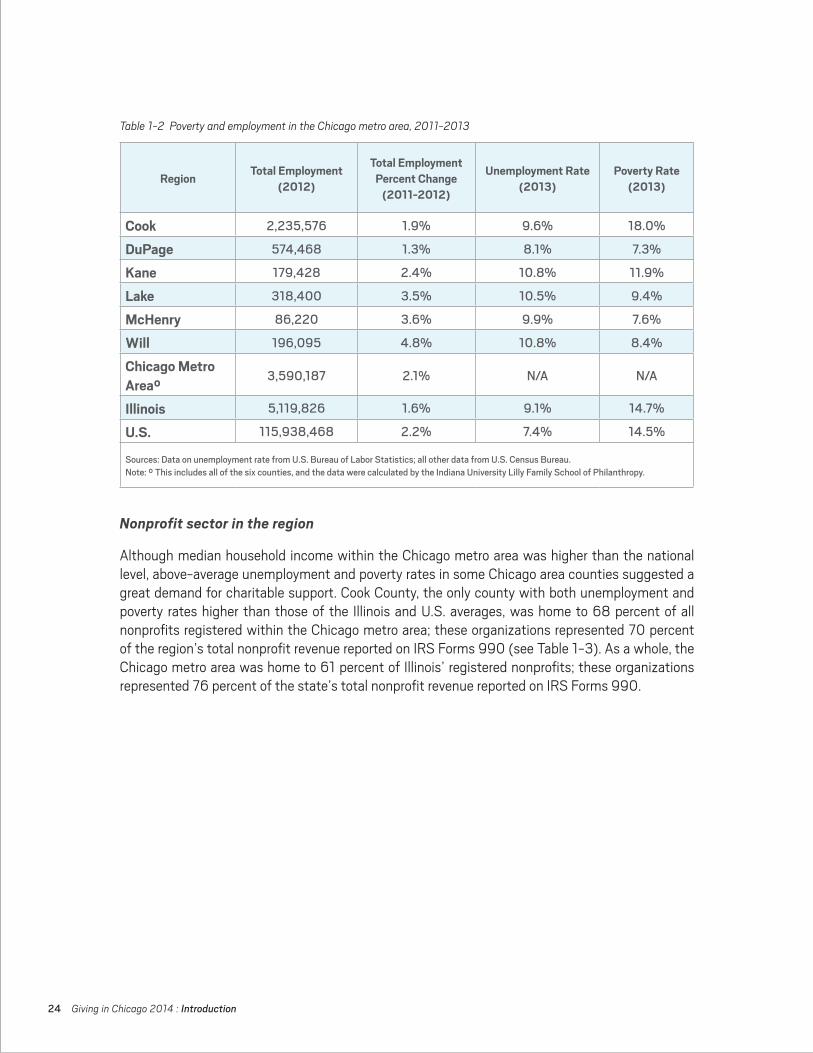
In 2012, the Chicago metro area provided 70 percent of Illinois employment and 3 percent of total employment in the U.S. (see Table 1-2). From 2011 to 2012, the total number of people employed in the region increased by approximately 2.1 percent, faster than the state average (1.6 percent), yet slightly slower than the national average (2.2 percent). DuPage County demonstrated the slowest growth (1.3 percent) in offering new employment.
The unemployment rate in the six counties ranged from 8 percent to nearly 11 percent in 2013, all higher than the national rate (7.4 percent). DuPage was the only county with a lower unemployment rate (8.1 percent in 2013) than the state average (9.1 percent in 2013), yet still higher than the national average. Cook County was the only county with a higher poverty rate (18 percent) than both the state and the national level in 2013 (both at approximately 15 percent). The poverty rates in all other counties in the Chicago metro area were about 3 to 8 percentage points lower than that of Illinois and the U.S.
24 Giving in Chicago 2014 : Introduction
Nonprofit sector in the region
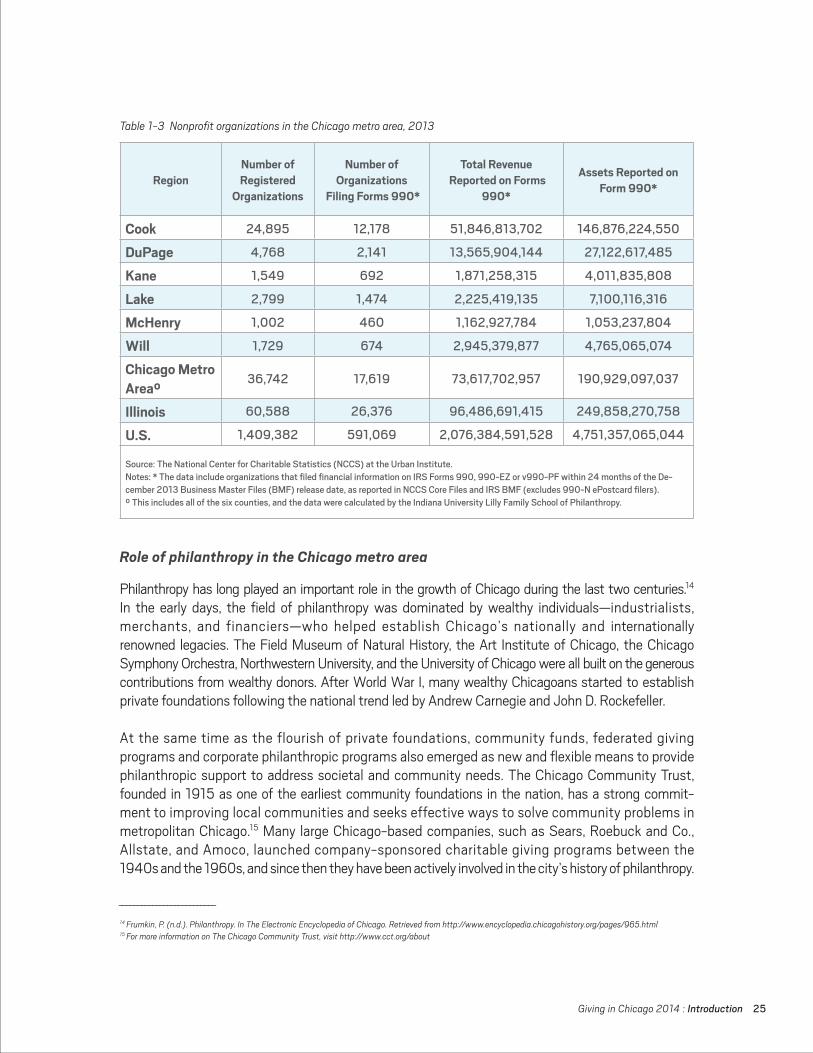
Although median household income within the Chicago metro area was higher than the national level, above-average unemployment and poverty rates in some Chicago area counties suggested a great demand for charitable support. Cook County, the only county with both unemployment and poverty rates higher than those of the Illinois and U.S. averages, was home to 68 percent of all nonprofits registered within the Chicago metro area; these organizations represented 70 percent of the region’s total nonprofit revenue reported on IRS Forms 990 (see Table 1-3). As a whole, the Chicago metro area was home to 61 percent of Illinois’ registered nonprofits; these organizations represented 76 percent of the state’s total nonprofit revenue reported on IRS Forms 990.
Region Total Employment (2012)
Total Employment Percent Change
(2011-2012)
Unemployment Rate(2013)
Poverty Rate (2013)
Cook 2,235,576 1.9% 9.6% 18.0%
DuPage 574,468 1.3% 8.1% 7.3%
Kane 179,428 2.4% 10.8% 11.9%
Lake 318,400 3.5% 10.5% 9.4%
McHenry 86,220 3.6% 9.9% 7.6%
Will 196,095 4.8% 10.8% 8.4%
Chicago Metro Area°
3,590,187 2.1% N/A N/A
Illinois 5,119,826 1.6% 9.1% 14.7%
U.S. 115,938,468 2.2% 7.4% 14.5%
Sources:DataonunemploymentratefromU.S.BureauofLaborStatistics;allotherdatafromU.S.CensusBureau.Note:°Thisincludesallofthesixcounties,andthedatawerecalculatedbytheIndianaUniversityLillyFamilySchoolofPhilanthropy.
Table 1-2 Poverty and employment in the Chicago metro area, 2011-2013
Giving in Chicago 2014 : Introduction 25
Role of philanthropy in the Chicago metro area
Philanthropy has long played an important role in the growth of Chicago during the last two centuries.14 In the early days, the field of philanthropy was dominated by wealthy individuals—industrialists, merchants, and financiers—who helped establish Chicago’s nationally and internationally renowned legacies. The Field Museum of Natural History, the Art Institute of Chicago, the Chicago Symphony Orchestra, Northwestern University, and the University of Chicago were all built on the generous contributions from wealthy donors. After World War I, many wealthy Chicagoans started to establish private foundations following the national trend led by Andrew Carnegie and John D. Rockefeller.
At the same time as the flourish of private foundations, community funds, federated giving programs and corporate philanthropic programs also emerged as new and flexible means to provide philanthropic support to address societal and community needs. The Chicago Community Trust, founded in 1915 as one of the earliest community foundations in the nation, has a strong commit-ment to improving local communities and seeks effective ways to solve community problems in metropolitan Chicago.15 Many large Chicago-based companies, such as Sears, Roebuck and Co., Allstate, and Amoco, launched company-sponsored charitable giving programs between the 1940s and the 1960s, and since then they have been actively involved in the city’s history of philanthropy.
Region Total Employment (2012)
Total Employment Percent Change
(2011-2012)
Unemployment Rate(2013)
Poverty Rate (2013)
Cook 2,235,576 1.9% 9.6% 18.0%
DuPage 574,468 1.3% 8.1% 7.3%
Kane 179,428 2.4% 10.8% 11.9%
Lake 318,400 3.5% 10.5% 9.4%
McHenry 86,220 3.6% 9.9% 7.6%
Will 196,095 4.8% 10.8% 8.4%
Chicago Metro Area°
3,590,187 2.1% N/A N/A
Illinois 5,119,826 1.6% 9.1% 14.7%
U.S. 115,938,468 2.2% 7.4% 14.5%
Sources:DataonunemploymentratefromU.S.BureauofLaborStatistics;allotherdatafromU.S.CensusBureau.Note:°Thisincludesallofthesixcounties,andthedatawerecalculatedbytheIndianaUniversityLillyFamilySchoolofPhilanthropy.
Table 1-3 Nonprofit organizations in the Chicago metro area, 2013
__________________________
14 Frumkin, P. (n.d.). Philanthropy. In The Electronic Encyclopedia of Chicago. Retrieved from http://www.encyclopedia.chicagohistory.org/pages/965.html15 For more information on The Chicago Community Trust, visit http://www.cct.org/about
RegionNumber of Registered
Organizations
Number of Organizations
Filing Forms 990*
Total Revenue Reported on Forms
990*
Assets Reported on Form 990*
Cook 24,895 12,178 51,846,813,702 146,876,224,550
DuPage 4,768 2,141 13,565,904,144 27,122,617,485
Kane 1,549 692 1,871,258,315 4,011,835,808
Lake 2,799 1,474 2,225,419,135 7,100,116,316
McHenry 1,002 460 1,162,927,784 1,053,237,804
Will 1,729 674 2,945,379,877 4,765,065,074
Chicago Metro Area°
36,742 17,619 73,617,702,957 190,929,097,037
Illinois 60,588 26,376 96,486,691,415 249,858,270,758
U.S. 1,409,382 591,069 2,076,384,591,528 4,751,357,065,044
Source:TheNationalCenterforCharitableStatistics(NCCS)attheUrbanInstitute.Notes:*ThedataincludeorganizationsthatfiledfinancialinformationonIRSForms990,990-EZorv990-PFwithin24monthsoftheDe-cember2013BusinessMasterFiles(BMF)releasedate,asreportedinNCCSCoreFilesandIRSBMF(excludes990-NePostcardfilers).°Thisincludesallofthesixcounties,andthedatawerecalculatedbytheIndianaUniversityLillyFamilySchoolofPhilanthropy.
26 Giving in Chicago 2014 : Introduction
In recent years, the tradition of fighting poverty and meeting basic human needs in Chicago’s disadvantaged communities has remained vibrant, especially in the face of the Great Recession. For example, in late 2012, the Illinois State Bar Association collaborated with Feeding Illinois to launch a food and fundraising drive among Illinois law firms and legal organizations to help 1.9 million Illinois residents suffering from food insecurity. Exceeding its goal of 1 million meals, the campaign provided a record number of over 4.6 million meals by March 1, 2013.16 This was only possible through the support of lawyer teams, bar associations, and more than 2,000 donors. Additionally, individuals and foundations, such as The John D. and Catherine T. MacArthur Foundation, have been testing and piloting new ideas and strategies, such as impact investing, to enhance the capacity of local nonprofits. Over the past two centuries, local philanthropic support from all sources promoted changes in diverse charitable areas and benefited millions of metropolitan area residents.
__________________________
16 For more information about this campaign, visit http://iln.isba.org/blog/lawyers-feeding-illinois

HOUSEHOLD GIVING in the
CHICAGO METRO AREA
Giving in Chicago 2014 : Household Giving In The Chicago Metro Area 29
HIGHLIGHTS
• Approximately three-quarters (73 percent) of Chicago metro area households reported donating more than $25 to charitable organizations in 2013, and over half (54 percent) reported giving $500 or more.
• Most (72 percent) donor households gave to basic needs (such as food, shelter, or other basic necessities).
• Among nonprofits supporting different charitable causes, religious organizations received the largest share (41 percent) of the dollar amount donated by Chicago metro area households and the highest average amount ($1,796) of household donations.
• Top motivation for Chicago metro area households to give was to “help individuals meet their basic needs” (76 percent).
• Nearly half (49 percent) of Chicago metro area households volunteered in 2013.
HOUSEHOLD CHARITABLE GIVING
In 2013, U.S. individuals and households donated an estimated $240.6 billion to nonprofit organizations, representing 72 percent of all charitable contributions made in the country, as reported in Giving USA 2014.17 Giving by bequest reached an estimated $27.7 billion in 2013, accounting for 8 percent of total giving. Together, individuals and households contributed 80 percent of total charitable giving in the country (which is even higher, reaching 87 percent, when their donations through family foundations are included). In addition, individuals and households often give money directly to help people in need or volunteer their time and talent to tackle various challenges in local communities and beyond.
In order to obtain a comprehensive picture of how individuals and households in the Chicago metro area participated in philanthropy, 760 households in the region were surveyed by the Northern Illinois University Center for Governmental Studies in late 2014 about their philanthropic engagement. These households were randomly selected using telephone numbers of residences in the six Chicago metro area counties. Survey weights were constructed and applied to ensure that households in the sample are representative of the general population living in the region. Therefore, findings reported in this section reflect the philanthropic behaviors and preferences of general Chicago metro area households. Please see the methodology section in this report for more detail.
__________________________
17 Giving USA: The Annual Report on Philanthropy is the seminal publication reporting on the sources and uses of charitable giving in the U.S. Its research, con-ducted by the Indiana University Lilly Family School of Philanthropy since 2000, estimates all giving to all charitable organizations across the U.S.
30 Giving in Chicago 2014 : Household Giving In The Chicago Metro Area
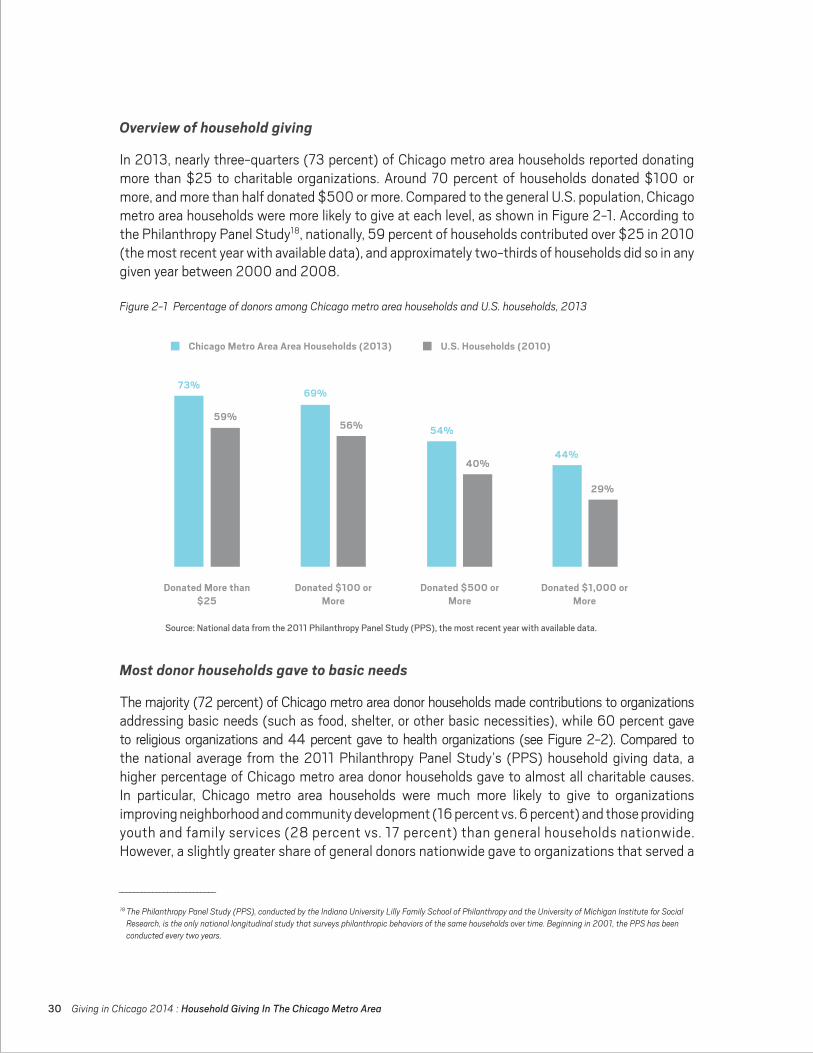
Overview of household giving
In 2013, nearly three-quarters (73 percent) of Chicago metro area households reported donating more than $25 to charitable organizations. Around 70 percent of households donated $100 or more, and more than half donated $500 or more. Compared to the general U.S. population, Chicago metro area households were more likely to give at each level, as shown in Figure 2-1. According to the Philanthropy Panel Study18, nationally, 59 percent of households contributed over $25 in 2010 (the most recent year with available data), and approximately two-thirds of households did so in any given year between 2000 and 2008.
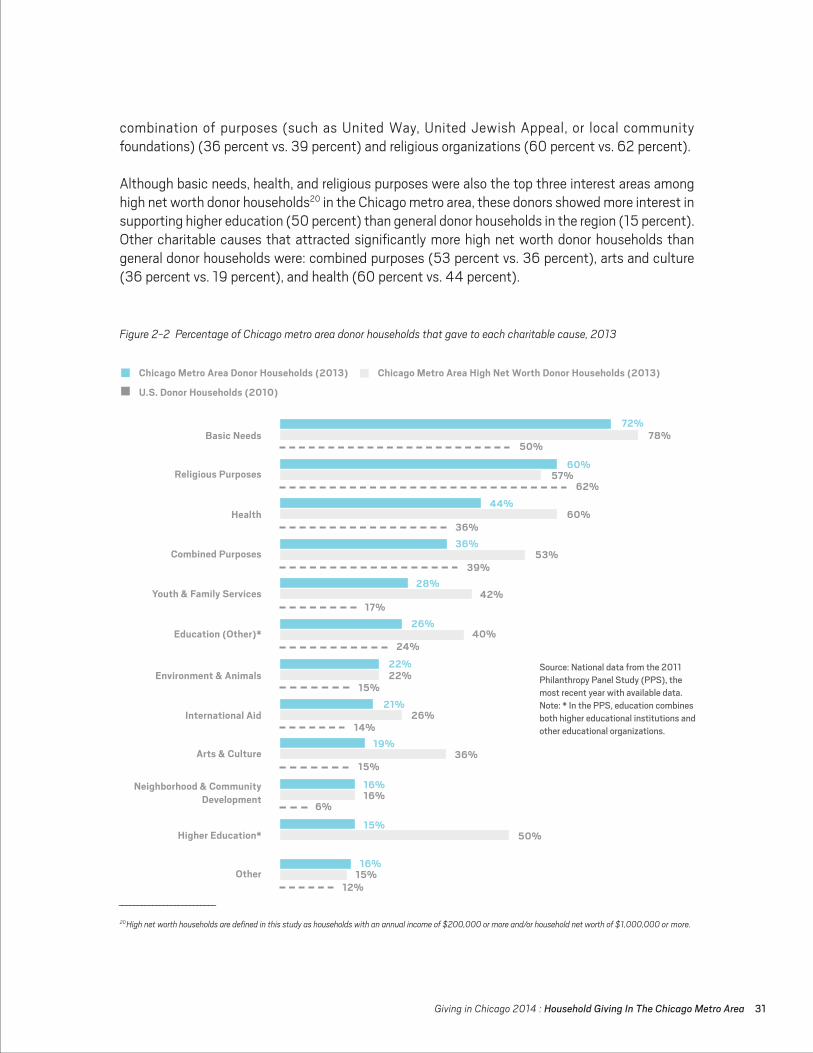
Most donor households gave to basic needs
The majority (72 percent) of Chicago metro area donor households made contributions to organizations addressing basic needs (such as food, shelter, or other basic necessities), while 60 percent gave to religious organizations and 44 percent gave to health organizations (see Figure 2-2). Compared to the national average from the 2011 Philanthropy Panel Study’s (PPS) household giving data, a higher percentage of Chicago metro area donor households gave to almost all charitable causes. In particular, Chicago metro area households were much more likely to give to organizations improving neighborhood and community development (16 percent vs. 6 percent) and those providing youth and family services (28 percent vs. 17 percent) than general households nationwide. However, a slightly greater share of general donors nationwide gave to organizations that served a
__________________________
18 The Philanthropy Panel Study (PPS), conducted by the Indiana University Lilly Family School of Philanthropy and the University of Michigan Institute for Social Research, is the only national longitudinal study that surveys philanthropic behaviors of the same households over time. Beginning in 2001, the PPS has been conducted every two years.
Chicago Metro Area Area Households (2013) U.S. Households (2010)
44%
69%
Donated More than$25
Donated $100 or More
Donated $500 or More
Donated $1,000 or More
73%
59%56% 54%
29%
40%
Source:Nationaldatafromthe2011PhilanthropyPanelStudy(PPS),themostrecentyearwithavailabledata.
Figure 2-1 Percentage of donors among Chicago metro area households and U.S. households, 2013
Giving in Chicago 2014 : Household Giving In The Chicago Metro Area 31
combination of purposes (such as United Way, United Jewish Appeal, or local community foundations) (36 percent vs. 39 percent) and religious organizations (60 percent vs. 62 percent).
Although basic needs, health, and religious purposes were also the top three interest areas among high net worth donor households20 in the Chicago metro area, these donors showed more interest in supporting higher education (50 percent) than general donor households in the region (15 percent). Other charitable causes that attracted significantly more high net worth donor households than general donor households were: combined purposes (53 percent vs. 36 percent), arts and culture (36 percent vs. 19 percent), and health (60 percent vs. 44 percent).
__________________________
20 High net worth households are defined in this study as households with an annual income of $200,000 or more and/or household net worth of $1,000,000 or more.
Figure 2-2 Percentage of Chicago metro area donor households that gave to each charitable cause, 2013
Chicago Metro Area Donor Households (2013) Chicago Metro Area High Net Worth Donor Households (2013)
U.S. Donor Households (2010)
72%Basic Needs
Religious Purposes
Health
Combined Purposes
Youth & Family Services
Education (Other)*
Environment & Animals
International Aid
Arts & Culture
Neighborhood & Community Development
Higher Education*
Other
60%
44%
36%
28%
26%
22%
21%
19%
16%
16%
15%
78%
57%
60%
53%
42%
40%
22%
26%
36%
16%
15%
50%
50%
62%
36%
39%
17%
24%
15%
14%
15%
6%
12%
Source:Nationaldatafromthe2011PhilanthropyPanelStudy(PPS),themostrecentyearwithavailabledata.Note:*InthePPS,educationcombinesbothhighereducationalinstitutionsandothereducationalorganizations.
32 Giving in Chicago 2014 : Household Giving In The Chicago Metro Area
Religious organizations received the largest share of charitable dollars
In 2013, religious organizations attracted the largest share (41 percent) of charitable dollars from Chicago metro area donor households (excluding outliers21), followed by basic needs organizations (16 percent) and organizations serving a combination of purposes (14 percent) (see Figure 2-3). All other nonprofits received the remaining less than one-third of household donations. Environment and animal groups received the smallest share (1 percent) of household giving.
ReligiousPurposes41%
BasicNeeds16%
CombinedPurposes14%
Health6%
HigherEducation4%
Other4%
Education(Other)4%
Neighborhood&Community
Development3%
Youth&FamilyServices3%
Arts&Culture2%
InternationalAid2%
Environment&Animals
1%
Figure 2-3 Allocation of charitable donations made by Chicago metro area donor households, by charitable cause, 2013
__________________________
21 Outliers are extreme values of dollar amounts donated, which are apt to highly influence average values. These extreme values are often considered as “outliers” in statistical analysis and are excluded from the analysis of amounts of donations. Please see the methodology section of this report for details on how outliers are identified in the study.
Giving in Chicago 2014 : Household Giving In The Chicago Metro Area 33
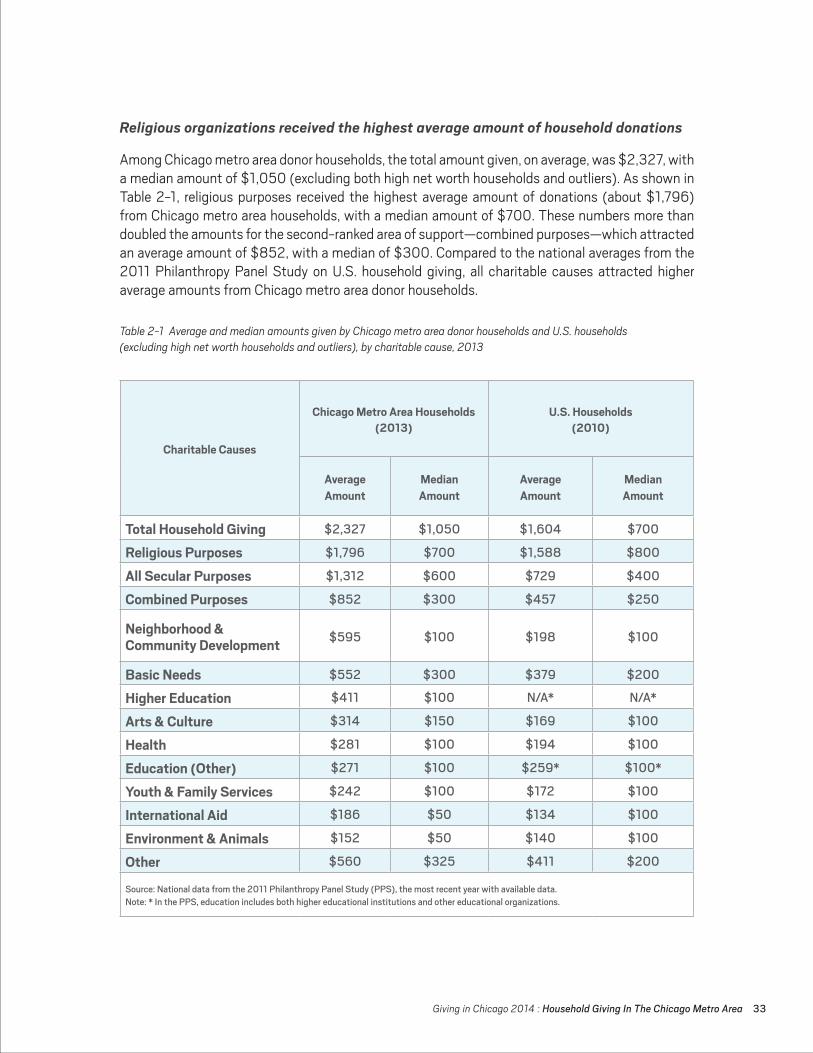
Religious organizations received the highest average amount of household donations
Among Chicago metro area donor households, the total amount given, on average, was $2,327, with a median amount of $1,050 (excluding both high net worth households and outliers). As shown in Table 2-1, religious purposes received the highest average amount of donations (about $1,796) from Chicago metro area households, with a median amount of $700. These numbers more than doubled the amounts for the second-ranked area of support—combined purposes—which attracted an average amount of $852, with a median of $300. Compared to the national averages from the 2011 Philanthropy Panel Study on U.S. household giving, all charitable causes attracted higher average amounts from Chicago metro area donor households.
Table 2-1 Average and median amounts given by Chicago metro area donor households and U.S. households (excluding high net worth households and outliers), by charitable cause, 2013
Charitable Causes
Chicago Metro Area Households (2013)
U.S. Households (2010)
Average Amount
Median Amount
Average Amount
Median Amount
Total Household Giving $2,327 $1,050 $1,604 $700
Religious Purposes $1,796 $700 $1,588 $800
All Secular Purposes $1,312 $600 $729 $400
Combined Purposes $852 $300 $457 $250
Neighborhood & Community Development $595 $100 $198 $100
Basic Needs $552 $300 $379 $200
Higher Education $411 $100 N/A* N/A*
Arts & Culture $314 $150 $169 $100
Health $281 $100 $194 $100
Education (Other) $271 $100 $259* $100*
Youth & Family Services $242 $100 $172 $100
International Aid $186 $50 $134 $100
Environment & Animals $152 $50 $140 $100
Other $560 $325 $411 $200
Source:Nationaldatafromthe2011PhilanthropyPanelStudy(PPS),themostrecentyearwithavailabledata.Note:*InthePPS,educationincludesbothhighereducationalinstitutionsandothereducationalorganizations.
34 Giving in Chicago 2014 : Household Giving In The Chicago Metro Area
Households with an annual income less than $50,000 donated the largest share of their income
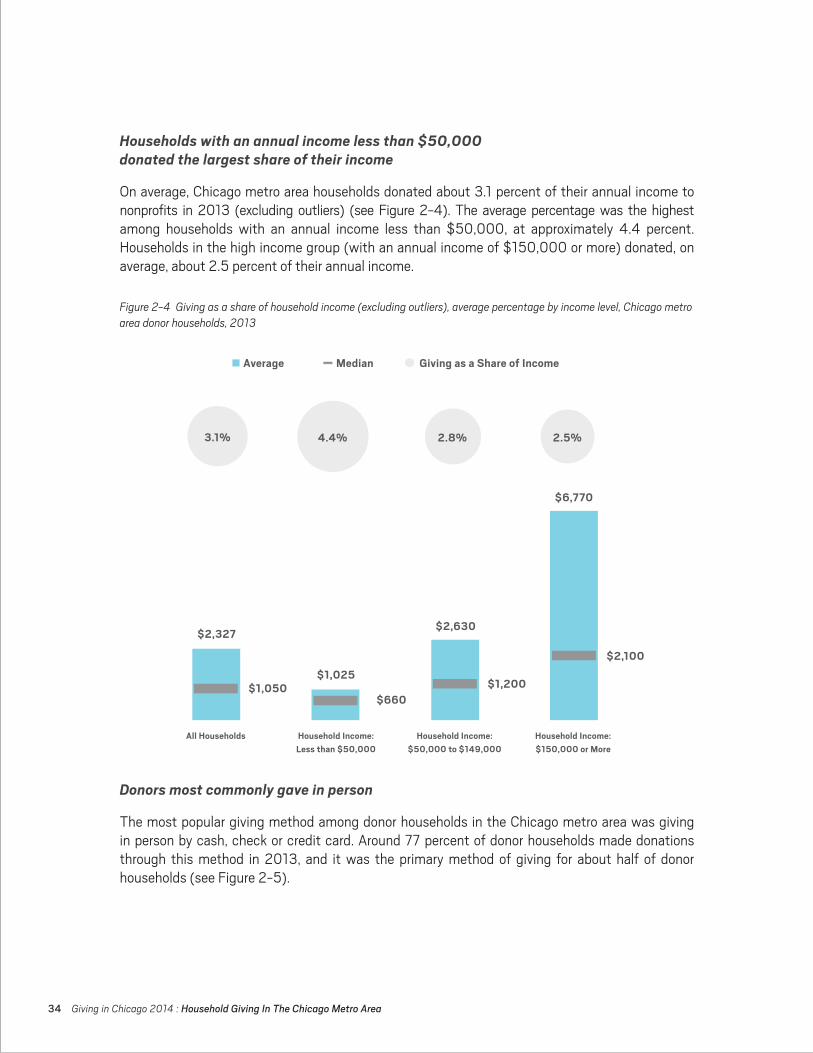
On average, Chicago metro area households donated about 3.1 percent of their annual income to nonprofits in 2013 (excluding outliers) (see Figure 2-4). The average percentage was the highest among households with an annual income less than $50,000, at approximately 4.4 percent. Households in the high income group (with an annual income of $150,000 or more) donated, on average, about 2.5 percent of their annual income.
Figure 2-4 Giving as a share of household income (excluding outliers), average percentage by income level, Chicago metro area donor households, 2013
Donors most commonly gave in person
The most popular giving method among donor households in the Chicago metro area was giving in person by cash, check or credit card. Around 77 percent of donor households made donations through this method in 2013, and it was the primary method of giving for about half of donor households (see Figure 2-5).
All Households Household Income: Less than $50,000
Household Income: $50,000 to $149,000
Household Income: $150,000 or More
$2,327
$1,050$660
$1,200
$2,100$1,025
$2,630
$6,770
3.1% 4.4% 2.8% 2.5%
Average Median Giving as a Share of Income
Giving in Chicago 2014 : Household Giving In The Chicago Metro Area 35
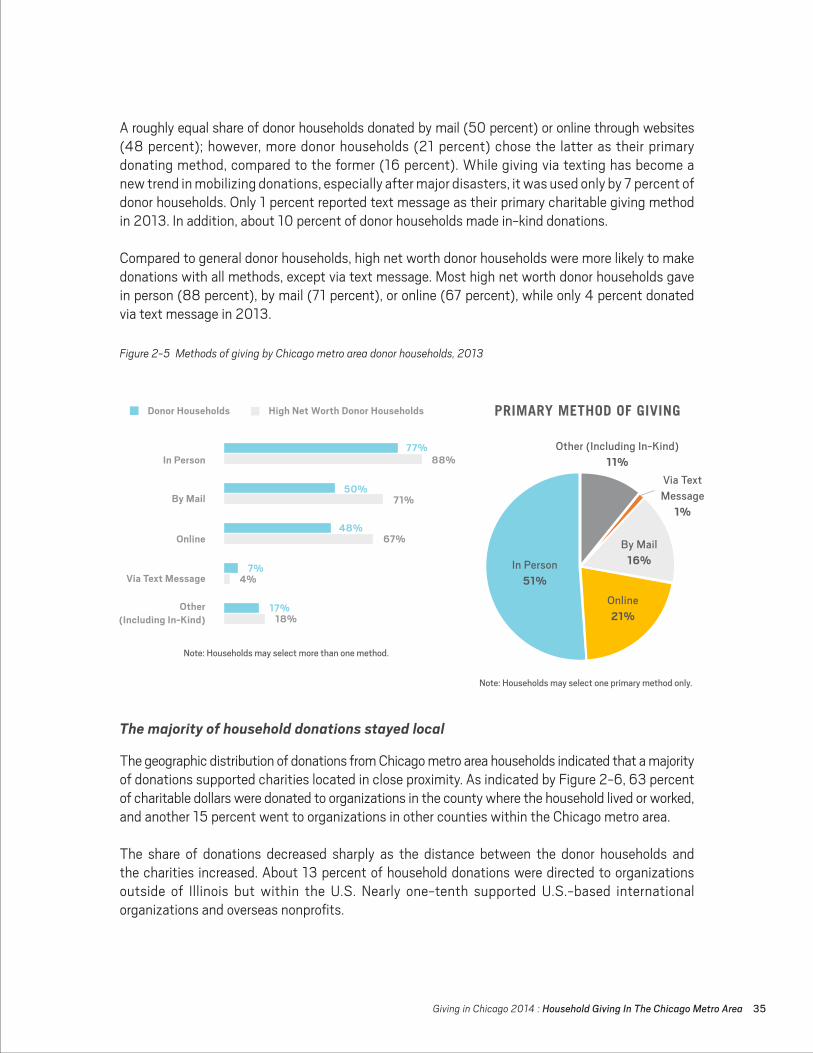
Figure 2-5 Methods of giving by Chicago metro area donor households, 2013
A roughly equal share of donor households donated by mail (50 percent) or online through websites (48 percent); however, more donor households (21 percent) chose the latter as their primary donating method, compared to the former (16 percent). While giving via texting has become a new trend in mobilizing donations, especially after major disasters, it was used only by 7 percent of donor households. Only 1 percent reported text message as their primary charitable giving method in 2013. In addition, about 10 percent of donor households made in-kind donations.
Compared to general donor households, high net worth donor households were more likely to make donations with all methods, except via text message. Most high net worth donor households gave in person (88 percent), by mail (71 percent), or online (67 percent), while only 4 percent donated via text message in 2013.
The majority of household donations stayed local
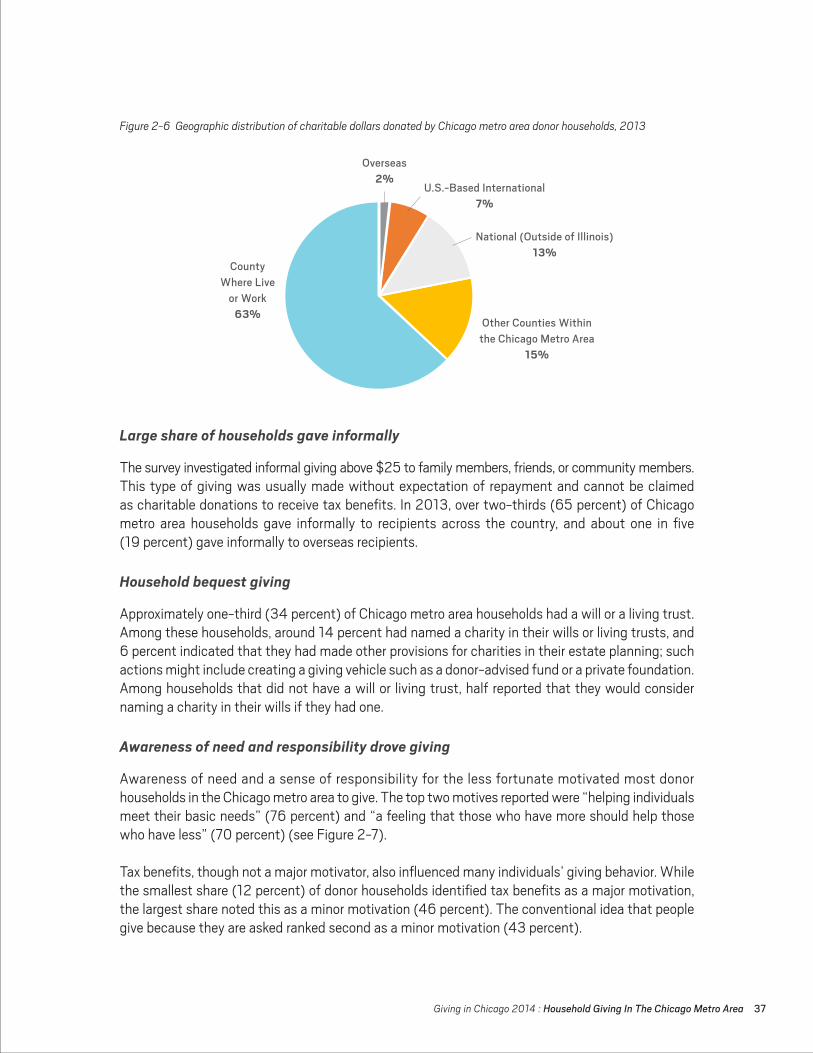
The geographic distribution of donations from Chicago metro area households indicated that a majority of donations supported charities located in close proximity. As indicated by Figure 2-6, 63 percent of charitable dollars were donated to organizations in the county where the household lived or worked, and another 15 percent went to organizations in other counties within the Chicago metro area. The share of donations decreased sharply as the distance between the donor households and the charities increased. About 13 percent of household donations were directed to organizations outside of Illinois but within the U.S. Nearly one-tenth supported U.S.-based international organizations and overseas nonprofits.
PRIMARY METHOD OF GIVING
Other(IncludingIn-Kind)11%
ViaTextMessage
1%
Note:Householdsmayselectoneprimarymethodonly.
InPerson51%
ByMail16%
Online21%
77%
Donor Households
In Person
By Mail
Online
Via Text Message
Other (Including In-Kind)
High Net Worth Donor Households
50%
48%
7%
17%
88%
71%
67%
4%
18%
Note:Householdsmayselectmorethanonemethod.
Giving in Chicago 2014 : Household Giving In The Chicago Metro Area 37
Large share of households gave informally
The survey investigated informal giving above $25 to family members, friends, or community members. This type of giving was usually made without expectation of repayment and cannot be claimed as charitable donations to receive tax benefits. In 2013, over two-thirds (65 percent) of Chicago metro area households gave informally to recipients across the country, and about one in five (19 percent) gave informally to overseas recipients.
Household bequest giving
Approximately one-third (34 percent) of Chicago metro area households had a will or a living trust. Among these households, around 14 percent had named a charity in their wills or living trusts, and 6 percent indicated that they had made other provisions for charities in their estate planning; such actions might include creating a giving vehicle such as a donor-advised fund or a private foundation. Among households that did not have a will or living trust, half reported that they would consider naming a charity in their wills if they had one.
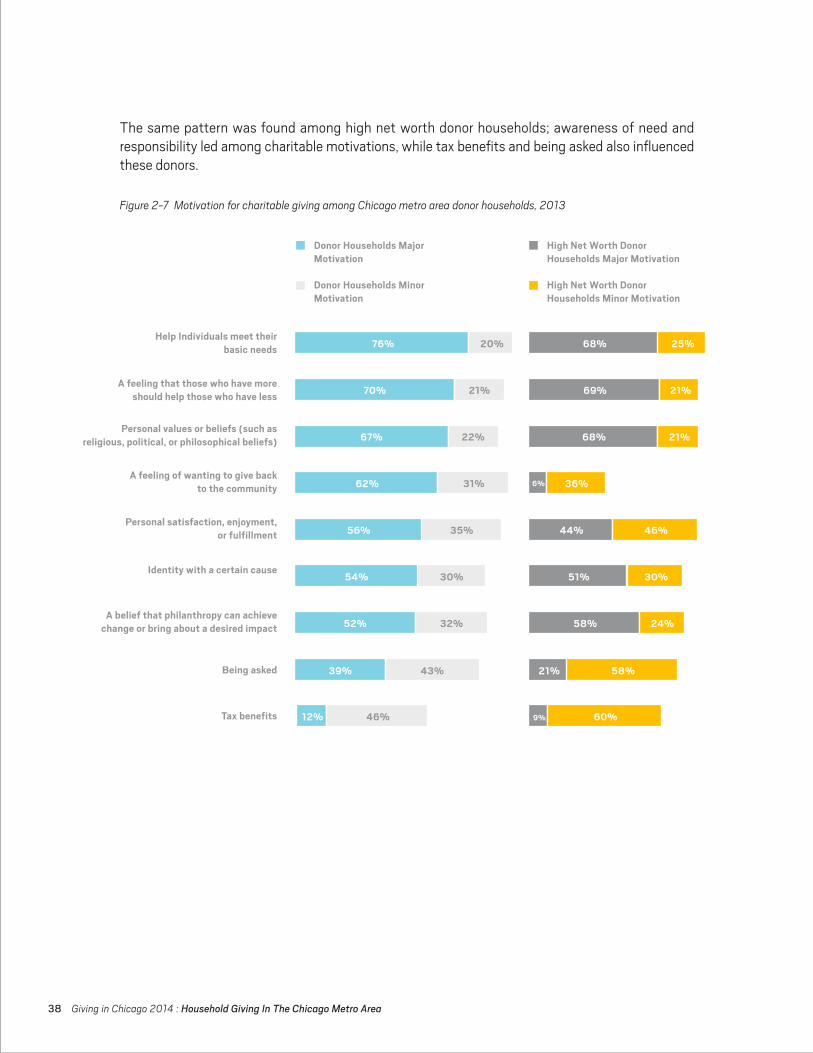
Awareness of need and responsibility drove giving
Awareness of need and a sense of responsibility for the less fortunate motivated most donor households in the Chicago metro area to give. The top two motives reported were “helping individuals meet their basic needs” (76 percent) and “a feeling that those who have more should help those who have less” (70 percent) (see Figure 2-7).
Tax benefits, though not a major motivator, also influenced many individuals’ giving behavior. While the smallest share (12 percent) of donor households identified tax benefits as a major motivation, the largest share noted this as a minor motivation (46 percent). The conventional idea that people give because they are asked ranked second as a minor motivation (43 percent).
Figure 2-6 Geographic distribution of charitable dollars donated by Chicago metro area donor households, 2013
Overseas2%
U.S.-BasedInternational7%
CountyWhereLive
orWork63%
National(OutsideofIllinois)13%
OtherCountiesWithintheChicagoMetroArea
15%
38 Giving in Chicago 2014 : Household Giving In The Chicago Metro Area
The same pattern was found among high net worth donor households; awareness of need and responsibility led among charitable motivations, while tax benefits and being asked also influenced these donors.
Figure 2-7 Motivation for charitable giving among Chicago metro area donor households, 2013
Help Individuals meet their basic needs
Being asked
Tax benefits
A feeling that those who have more should help those who have less
Personal values or beliefs (such as religious, political, or philosophical beliefs)
A feeling of wanting to give back to the community
Personal satisfaction, enjoyment, or fulfillment
Identity with a certain cause
A belief that philanthropy can achieve change or bring about a desired impact
Donor Households Major Motivation
High Net Worth Donor Households Major Motivation
Donor Households Minor Motivation
High Net Worth Donor Households Minor Motivation
76% 68% 25%
69% 21%
68% 21%
6% 36%
44% 46%
51% 30%
58% 24%
21% 58%
9% 60%
20%
70% 21%
67% 22%
62% 31%
56% 35%
54% 30%
52% 32%
39% 43%
12% 46%

Giving in Chicago 2014 : Household Giving In The Chicago Metro Area 39
Figure 2-8 Type of organizations to which Chicago metro area households stopped their giving, percentage of households who discontinued their donations, 2013
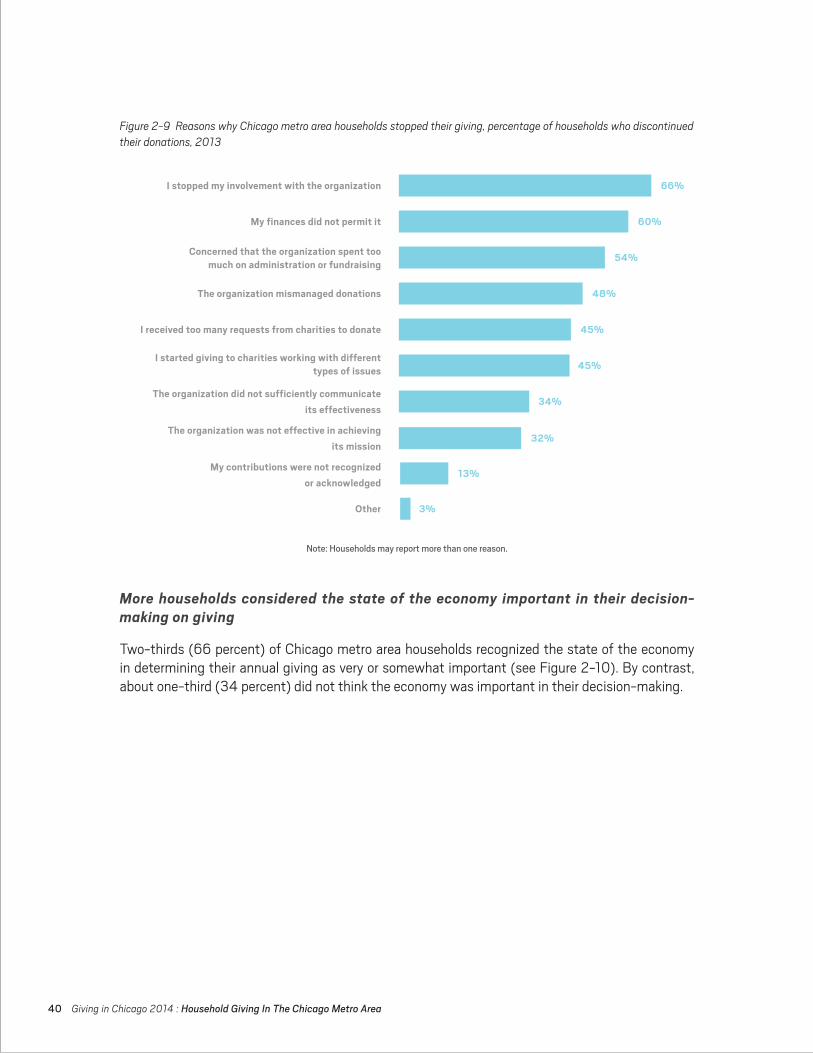
One-fifth of households stopped giving to an organization they supported in the past
While the majority of Chicago metro area households continued to donate to charities they cared about, 20 percent stopped giving to certain organizations. Religious and health organizations ranked the highest on the rejection list, each selected by 22 percent of those who stopped giving, as shown in Figure 2-8. Donating to higher educational institutions, other educational entities, and arts and culture organizations tended to be more consistent than donations to other types of organizations: only 2 percent of those who stopped giving did so to these types of organizations. Less than 20 percent of households who stopped giving identified other types of organizations (such as fraternal organizations or veterans’ groups) or mentioned nonprofits or local organizations without specifying the types of organizations.
Of the households who discontinued their donations, the most-often-cited reason (66 percent) was that they stopped their involvement with the organization, for example, volunteering or serving on the board (see Figure 2-9). About 60 percent of those who stopped giving mentioned their limited finances as a reason. Roughly about half cited a concern for high administrative or fundraising costs (54 percent), mismanagement of donations (48 percent), too many requests for donations (45 percent), or a change in their own philanthropic interest (45 percent) as a reason for why they stopped giving.
Health
Religious Purposes
Environment & Animals
Basic Needs
Combined Purposes
International Aid
Neighborhood & Community Development
Youth & Family Services
Arts & Culture
Education (Other)
Higher Education
Other
22%
22%
9%
5%
5%
5%
5%
3%
2%
2%
2%
18%
40 Giving in Chicago 2014 : Household Giving In The Chicago Metro Area
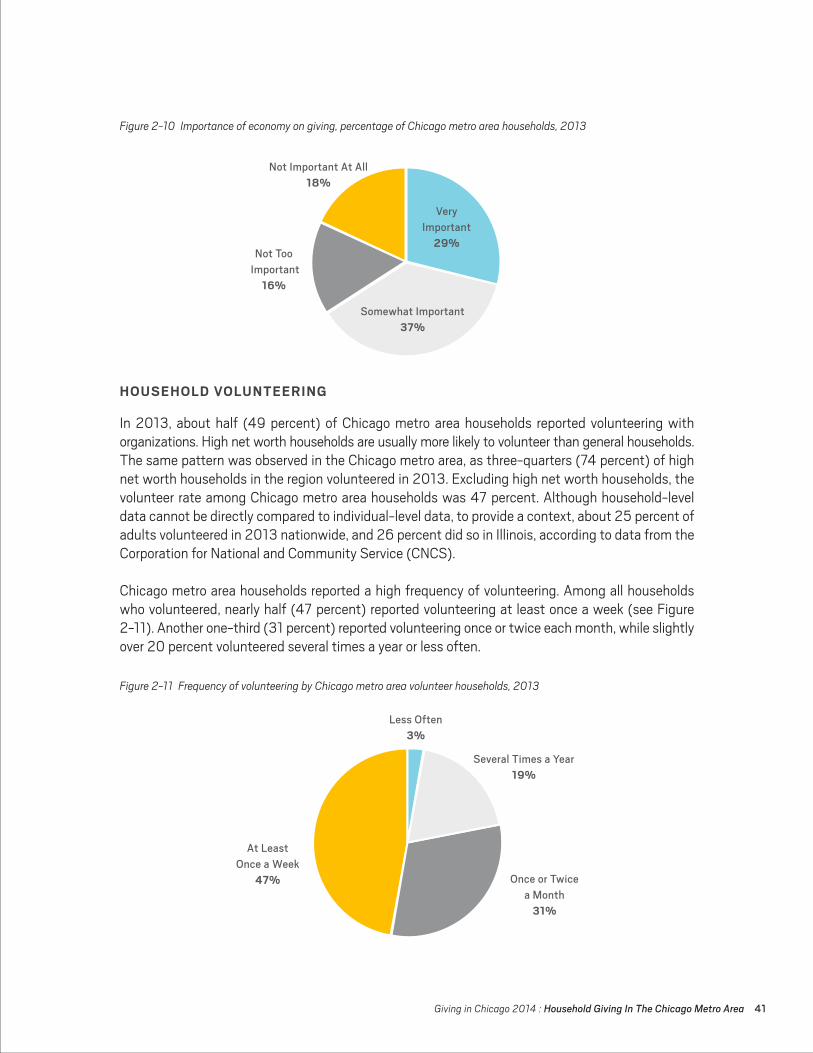
More households considered the state of the economy important in their decision- making on giving
Two-thirds (66 percent) of Chicago metro area households recognized the state of the economy in determining their annual giving as very or somewhat important (see Figure 2-10). By contrast, about one-third (34 percent) did not think the economy was important in their decision-making.
Figure 2-9 Reasons why Chicago metro area households stopped their giving, percentage of households who discontinued their donations, 2013
I stopped my involvement with the organization
My finances did not permit it
Concerned that the organization spent too much on administration or fundraising
I started giving to charities working with differenttypes of issues
The organization did not sufficiently communicateits effectiveness
The organization was not effective in achieving its mission
My contributions were not recognized or acknowledged
The organization mismanaged donations
I received too many requests from charities to donate
Other
66%
60%
54%
48%
45%
45%
34%
32%
13%
3%
Note:Householdsmayreportmorethanonereason.
Giving in Chicago 2014 : Household Giving In The Chicago Metro Area 41
Figure 2-10 Importance of economy on giving, percentage of Chicago metro area households, 2013
Figure 2-11 Frequency of volunteering by Chicago metro area volunteer households, 2013
HOUSEHOLD VOLUNTEERING
In 2013, about half (49 percent) of Chicago metro area households reported volunteering with organizations. High net worth households are usually more likely to volunteer than general households. The same pattern was observed in the Chicago metro area, as three-quarters (74 percent) of high net worth households in the region volunteered in 2013. Excluding high net worth households, the volunteer rate among Chicago metro area households was 47 percent. Although household-level data cannot be directly compared to individual-level data, to provide a context, about 25 percent of adults volunteered in 2013 nationwide, and 26 percent did so in Illinois, according to data from the Corporation for National and Community Service (CNCS).
Chicago metro area households reported a high frequency of volunteering. Among all households who volunteered, nearly half (47 percent) reported volunteering at least once a week (see Figure 2-11). Another one-third (31 percent) reported volunteering once or twice each month, while slightly over 20 percent volunteered several times a year or less often.
NotImportantAtAll18%
NotTooImportant
16%
SomewhatImportant37%
VeryImportant
29%
LessOften3%
SeveralTimesaYear19%
AtLeastOnceaWeek
47% OnceorTwiceaMonth
31%
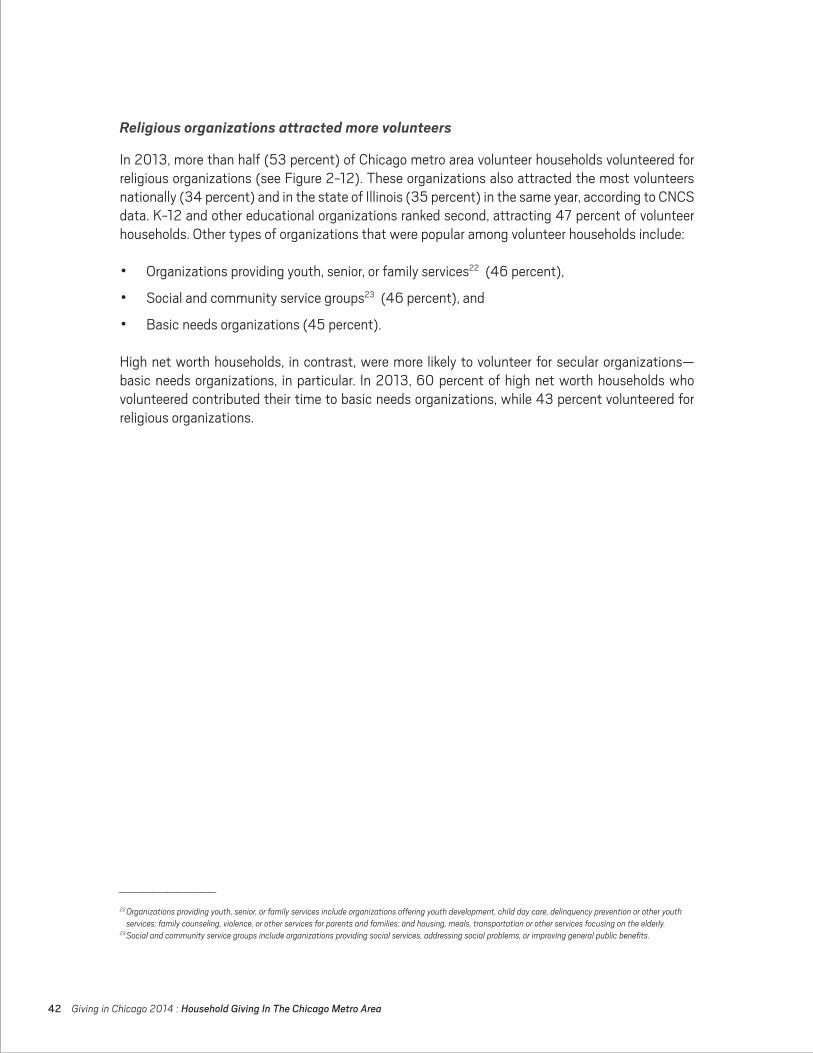
42 Giving in Chicago 2014 : Household Giving In The Chicago Metro Area
Religious organizations attracted more volunteers
In 2013, more than half (53 percent) of Chicago metro area volunteer households volunteered for religious organizations (see Figure 2-12). These organizations also attracted the most volunteers nationally (34 percent) and in the state of Illinois (35 percent) in the same year, according to CNCS data. K-12 and other educational organizations ranked second, attracting 47 percent of volunteer households. Other types of organizations that were popular among volunteer households include:
• Organizations providing youth, senior, or family services22 (46 percent),
• Social and community service groups23 (46 percent), and
• Basic needs organizations (45 percent).
High net worth households, in contrast, were more likely to volunteer for secular organizations—basic needs organizations, in particular. In 2013, 60 percent of high net worth households who volunteered contributed their time to basic needs organizations, while 43 percent volunteered for religious organizations.
__________________________
22 Organizations providing youth, senior, or family services include organizations offering youth development, child day care, delinquency prevention or other youth services; family counseling, violence, or other services for parents and families; and housing, meals, transportation or other services focusing on the elderly.
23 Social and community service groups include organizations providing social services, addressing social problems, or improving general public benefits.
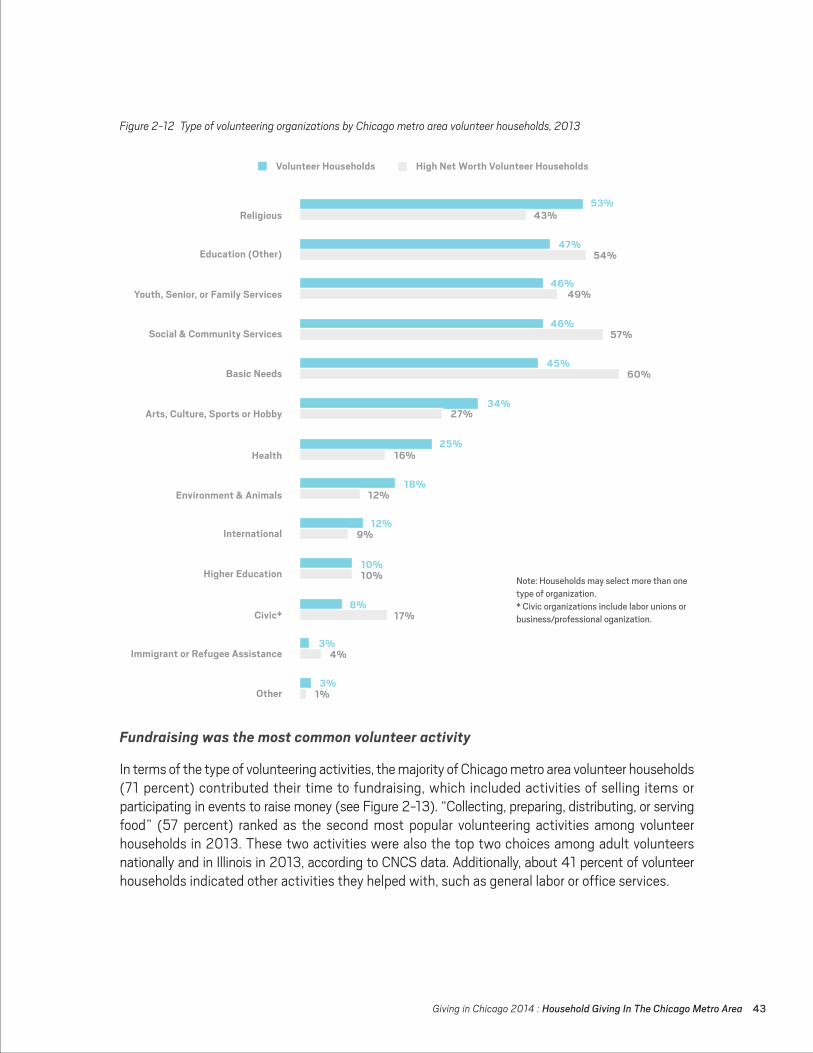
Giving in Chicago 2014 : Household Giving In The Chicago Metro Area 43
Fundraising was the most common volunteer activity
In terms of the type of volunteering activities, the majority of Chicago metro area volunteer households (71 percent) contributed their time to fundraising, which included activities of selling items or participating in events to raise money (see Figure 2-13). “Collecting, preparing, distributing, or serving food” (57 percent) ranked as the second most popular volunteering activities among volunteer households in 2013. These two activities were also the top two choices among adult volunteers nationally and in Illinois in 2013, according to CNCS data. Additionally, about 41 percent of volunteer households indicated other activities they helped with, such as general labor or office services.
Figure 2-12 Type of volunteering organizations by Chicago metro area volunteer households, 2013
53%
Volunteer Households
Religious
Education (Other)
Youth, Senior, or Family Services
Social & Community Services
Basic Needs
Arts, Culture, Sports or Hobby
Health
Environment & Animals
International
Higher Education
Civic*
Immigrant or Refugee Assistance
Other
High Net Worth Volunteer Households
47%
46%
46%
45%
34%
25%
18%
12%
10%
3%
3%
8%
43%
54%
49%
57%
60%
27%
16%
12%
9%
10%
4%
1%
17%
Note:Householdsmayselectmorethanonetypeoforganization.*Civicorganizationsincludelaborunionsorbusiness/professionaloganization.
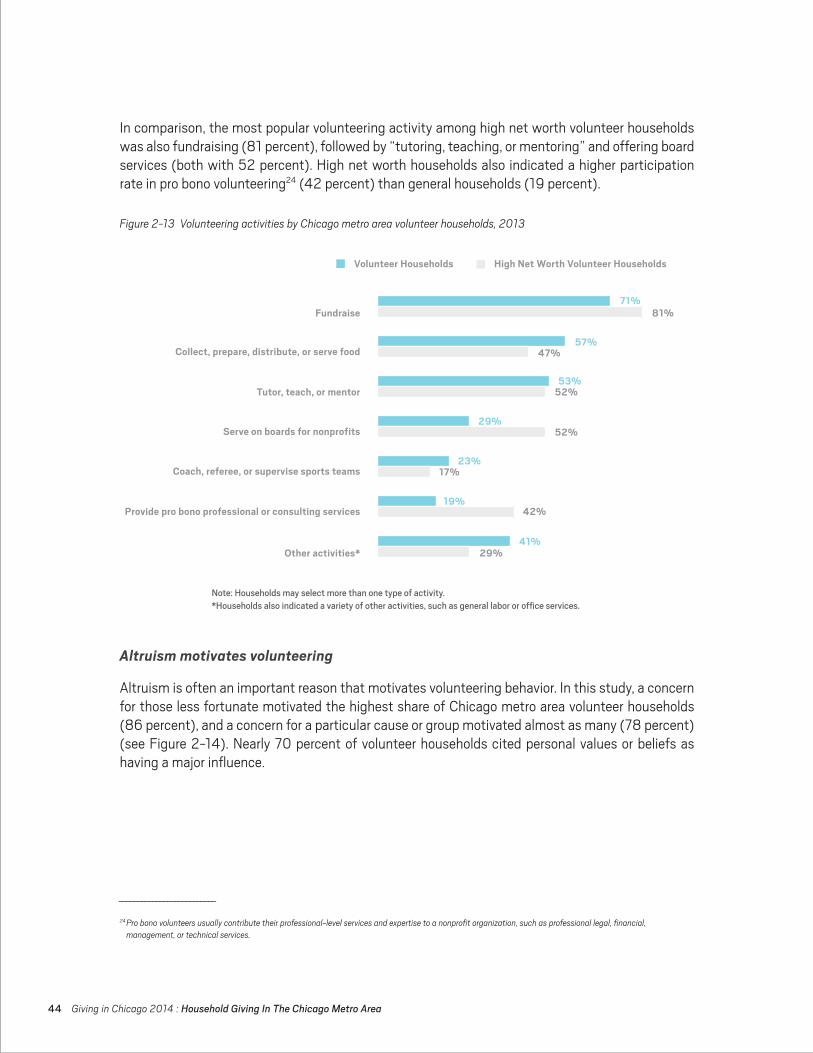
44 Giving in Chicago 2014 : Household Giving In The Chicago Metro Area
In comparison, the most popular volunteering activity among high net worth volunteer households was also fundraising (81 percent), followed by “tutoring, teaching, or mentoring” and offering board services (both with 52 percent). High net worth households also indicated a higher participation rate in pro bono volunteering24 (42 percent) than general households (19 percent).
Altruism motivates volunteering
Altruism is often an important reason that motivates volunteering behavior. In this study, a concern for those less fortunate motivated the highest share of Chicago metro area volunteer households (86 percent), and a concern for a particular cause or group motivated almost as many (78 percent) (see Figure 2-14). Nearly 70 percent of volunteer households cited personal values or beliefs as having a major influence.
__________________________
24 Pro bono volunteers usually contribute their professional-level services and expertise to a nonprofit organization, such as professional legal, financial, management, or technical services.
71%Fundraise
Collect, prepare, distribute, or serve food
Tutor, teach, or mentor
Serve on boards for nonprofits
Coach, referee, or supervise sports teams
Provide pro bono professional or consulting services
Other activities*
Volunteer Households High Net Worth Volunteer Households
57%
53%
29%
23%
19%
41%
81%
47%
52%
52%
17%
42%
29%
Note:Householdsmayselectmorethanonetypeofactivity.*Householdsalsoindicatedavarietyofotheractivities,suchasgenerallabororofficeservices.
Figure 2-13 Volunteering activities by Chicago metro area volunteer households, 2013
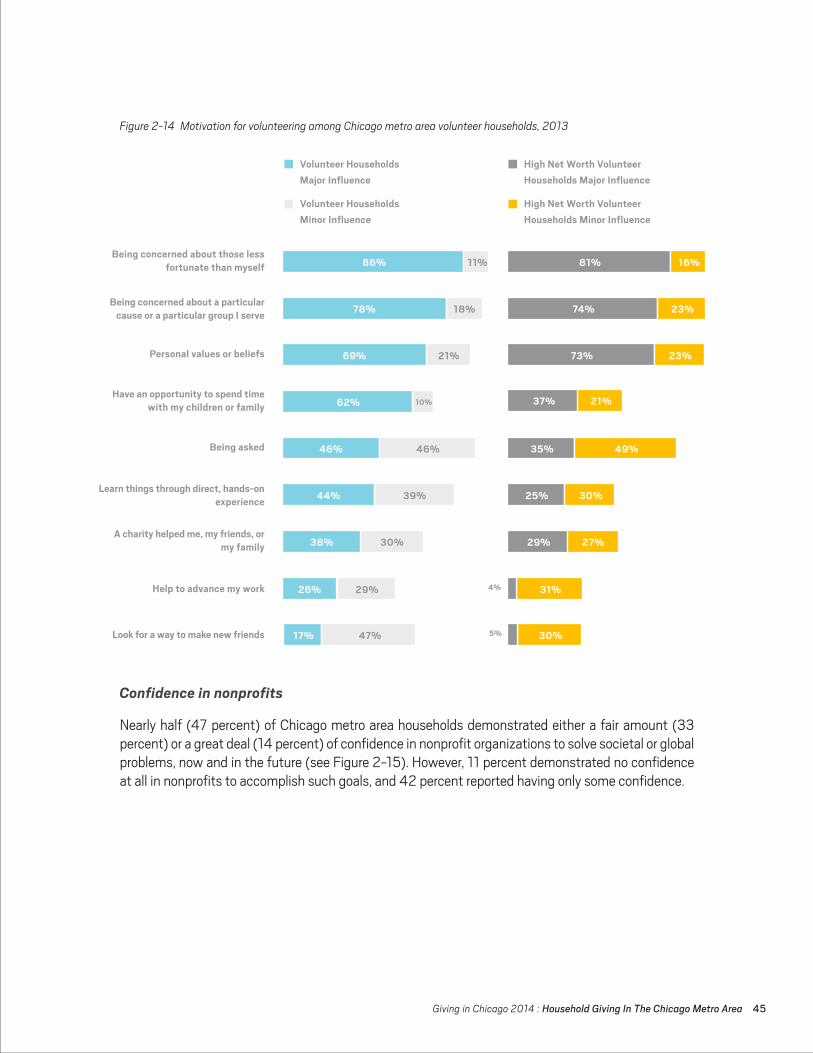
Giving in Chicago 2014 : Household Giving In The Chicago Metro Area 45
Confidence in nonprofits
Nearly half (47 percent) of Chicago metro area households demonstrated either a fair amount (33 percent) or a great deal (14 percent) of confidence in nonprofit organizations to solve societal or global problems, now and in the future (see Figure 2-15). However, 11 percent demonstrated no confidence at all in nonprofits to accomplish such goals, and 42 percent reported having only some confidence.
Figure 2-14 Motivation for volunteering among Chicago metro area volunteer households, 2013
Volunteer Households Major Influence
High Net Worth Volunteer Households Major Influence
Being concerned about those lessfortunate than myself
Help to advance my work
Look for a way to make new friends
Being concerned about a particularcause or a particular group I serve
Personal values or beliefs
Have an opportunity to spend timewith my children or family
Being asked
Learn things through direct, hands-onexperience
A charity helped me, my friends, ormy family
Volunteer Households Minor Influence
High Net Worth Volunteer Households Minor Influence
86% 81% 16%
74% 23%
73%
37%
23%
21%
35% 49%
25% 30%
29%
30%
31%
27%
11%
78% 18%
69% 21%
62% 10%
46% 46%
44% 39%
38% 30%
26% 29%
17% 47%
4%
5%

46 Giving in Chicago 2014 : Household Giving In The Chicago Metro Area
Figure 2-15 Confidence in nonprofit organizations to solve societal or global problems, percentage of Chicago metro area households, 2013
Basic needs ranked highest as a policy concern
More than half (52 percent) of Chicago metro area households prioritized basic needs as the issue that mattered the most, as displayed in Figure 2-16. Health care received the second-highest attention (39 percent), followed by pre-K to grade 12 education and other educational issues (20 percent). Households were least concerned with immigration, with only 2 percent prioritizing this issue. Slightly more than half of households identified other issues they cared about most, which include animal rights, religious issues, human services and other concerns.
AGreatDeal 14%
NoneAtAll11%
AFairAmount33% NotTooMuch/
OnlySome 42%
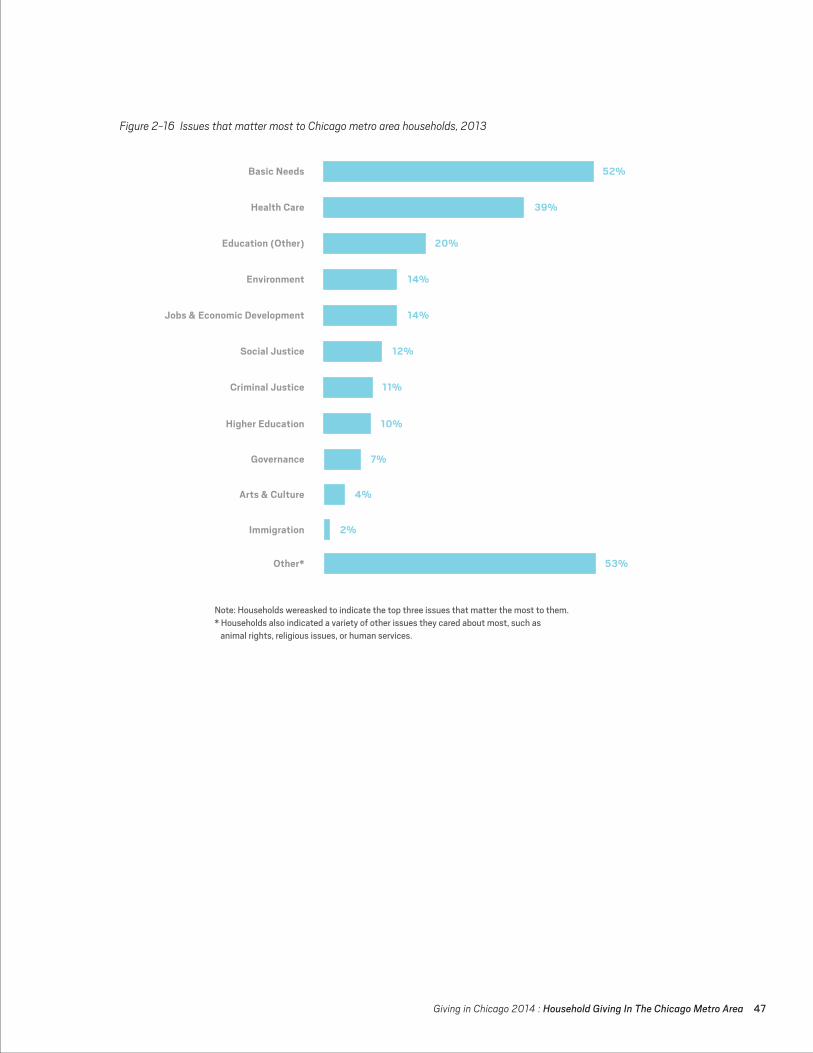
Giving in Chicago 2014 : Household Giving In The Chicago Metro Area 47
Figure 2-16 Issues that matter most to Chicago metro area households, 2013
Basic Needs
Health Care
Education (Other)
Environment
Jobs & Economic Development
Social Justice
Criminal Justice
Higher Education
Governance
Arts & Culture
Immigration
Other*
52%
39%
20%
14%
14%
12%
11%
10%
7%
4%
2%
53%
Note:Householdswereaskedtoindicatethetopthreeissuesthatmatterthemosttothem.*Householdsalsoindicatedavarietyofotherissuestheycaredaboutmost,suchasanimalrights,religiousissues,orhumanservices.
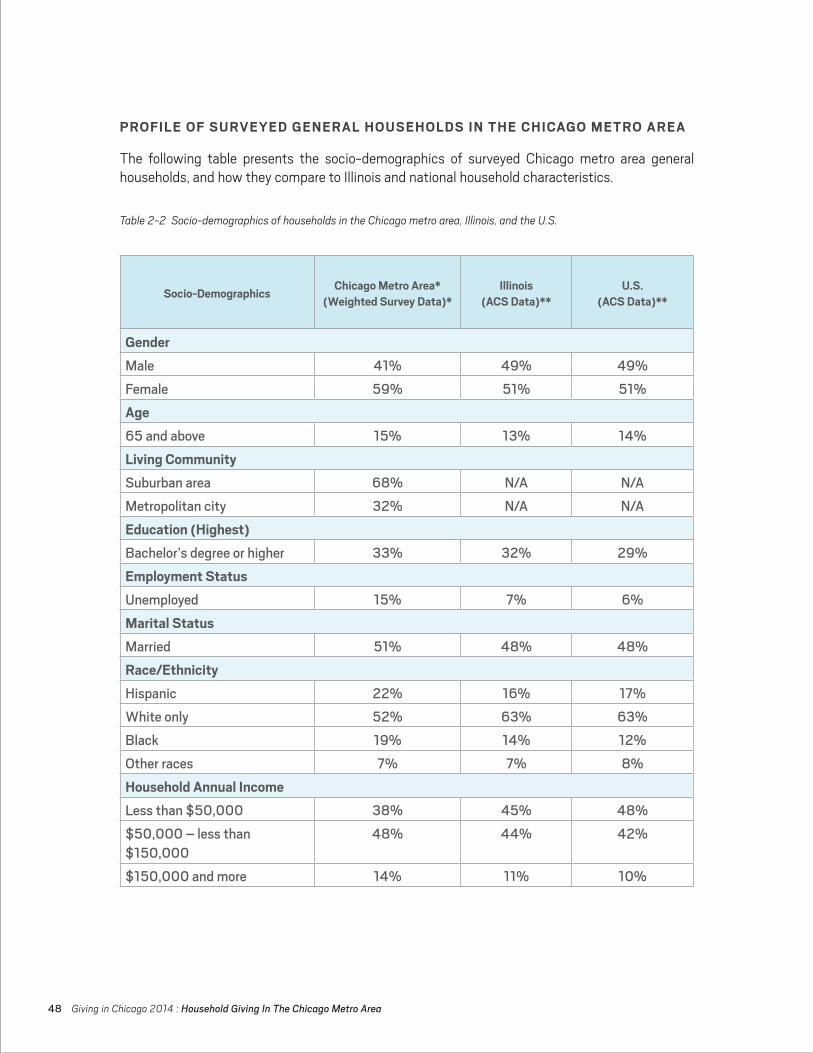
48 Giving in Chicago 2014 : Household Giving In The Chicago Metro Area
PROFILE OF SURVEYED GENERAL HOUSEHOLDS IN THE CHICAGO METRO AREA
The following table presents the socio-demographics of surveyed Chicago metro area general households, and how they compare to Illinois and national household characteristics.
Table 2-2 Socio-demographics of households in the Chicago metro area, Illinois, and the U.S.
Socio-Demographics Chicago Metro Area* (Weighted Survey Data)*
Illinois (ACS Data)**
U.S. (ACS Data)**
GenderMale 41% 49% 49%Female 59% 51% 51%Age65andabove 15% 13% 14%Living CommunitySuburbanarea 68% N/A N/AMetropolitancity 32% N/A N/AEducation (Highest)Bachelor’sdegreeorhigher 33% 32% 29%Employment StatusUnemployed 15% 7% 6%Marital StatusMarried 51% 48% 48%Race/EthnicityHispanic 22% 16% 17%Whiteonly 52% 63% 63%Black 19% 14% 12%Otherraces 7% 7% 8%Household Annual IncomeLessthan$50,000 38% 45% 48%$50,000–lessthan$150,000
48% 44% 42%
$150,000andmore 14% 11% 10%
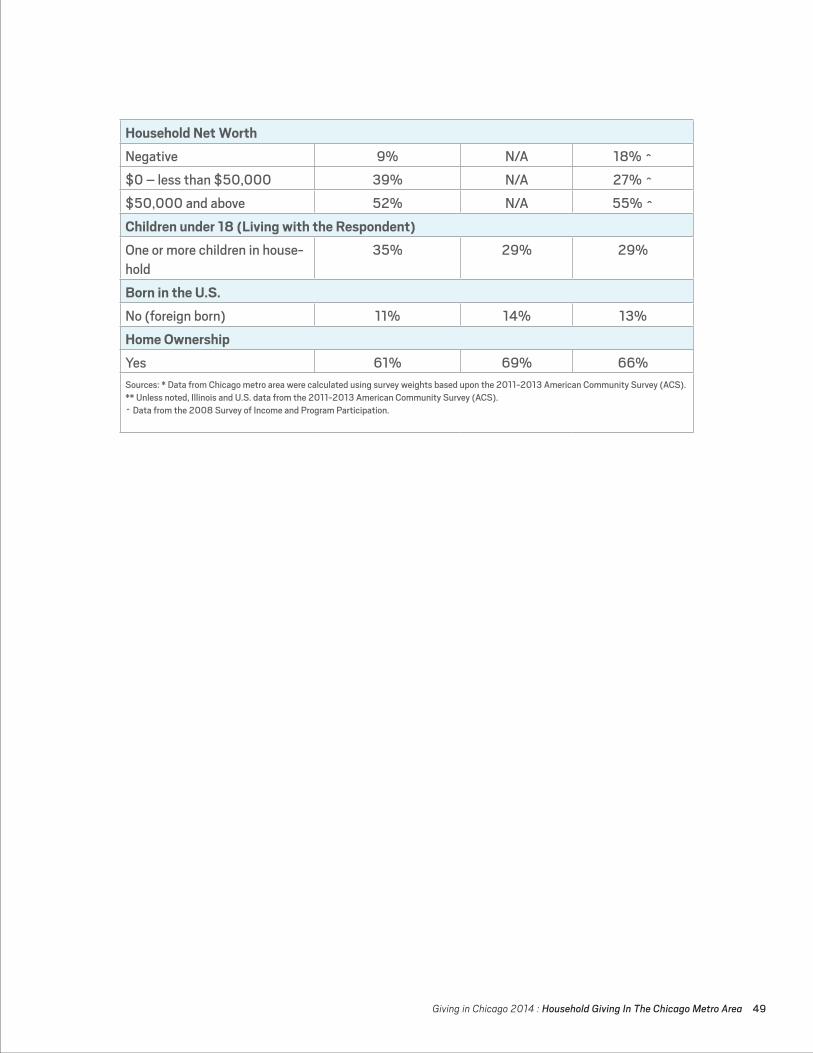
Giving in Chicago 2014 : Household Giving In The Chicago Metro Area 49
Household Net WorthNegative 9% N/A 18%^$0–lessthan$50,000 39% N/A 27%^$50,000andabove 52% N/A 55%^Children under 18 (Living with the Respondent)Oneormorechildreninhouse-hold
35% 29% 29%
Born in the U.S.No(foreignborn) 11% 14% 13%Home OwnershipYes 61% 69% 66%Sources:*DatafromChicagometroareawerecalculatedusingsurveyweightsbaseduponthe2011-2013AmericanCommunitySurvey(ACS).**Unlessnoted,IllinoisandU.S.datafromthe2011-2013AmericanCommunitySurvey(ACS).^Datafromthe2008SurveyofIncomeandProgramParticipation.
GRANT MAKING in the
CHICAGO METRO AREA
Giving in Chicago 2014 : Grant making In The Chicago Metro Area 51
HIGHLIGHTS
• In 2012, 2,038 grantmakers in the Chicago metro area made 38,969 grants of $4,000 or above, totaling approximately $2.6 billion.
• Nearly 50 percent of the grants awarded by Chicago metro area grantmakers stayed in the region, reaching about $1 billion.
• Of the grants that stayed within the region:
• More than 70 percent came from independent foundations, totaling $555 million, or 55 percent of grant dollars.
• Human services and education were the top two purposes supported by Chicago metro area grantmakers, accounting for half of grants and 46 percent of grant dollars.
• A total of 107 grants were at the $1 million level or above, totaling $328 million.
• A majority of grants from Chicago metro area grantmakers came from Cook County, followed by Lake County.
In 2013, U.S. foundations (including independent, operating, and community foundations) contributed an estimated $48.96 billion to nonprofit organizations, accounting for 15 percent of the total charitable giving in the U.S., as reported in Giving USA 2014. Giving by foundations increased by 4.2 percent from 2012 to 2013 (adjusted for inflation in 2013 dollars). In addition, corporate foundations contributed an estimated $5.7 billion in 2013.
This section of the report examines grant making from organizations located in the Chicago metro area, with a particular focus on those grants that stayed within the region. To provide a full picture of regional grant making, grants made by all types of grantmakers (including corporate foundations) are discussed in this section. However, an in-depth analysis of grants made by corporate foundations is included in the corporate giving section of the report. Data on grants of $4,000 or above made in 2012 (the latest year available) were collected from IRS Forms 990-PF made available through several databases (including FoundationSearch.com, Foundation Center, GuideStar, and the National Center for Charitable Statistics at the Urban Institute). Please see the methodology sec-tion of this report for more detail.

52 Giving in Chicago 2014 : Grant making In The Chicago Metro Area
DEFINITIONS OF THE GRANTMAKERS IN THE REPORT
This study generally follows the Foundation Center’s definition of grantmakers, and descriptions of each entity are as follows.
Independent foundationsIndependent foundations are primarily classified as private grant making foundations. Independent foundations encompass family foundations, special purpose foundations, and private nonoperating foundations.
Operating foundationsOperating foundations are classified by the IRS as private foundations with a primary purpose to fund their own activities and programs other than grant making. Operating foundations may make some grants to other organizations.
Corporate foundationsCorporate foundations (or company-sponsored foundations) derive their assets primarily from the contributions of for-profit companies and usually maintain close ties with the company. They are independent legal organizations with an endowment of their own and are subject to the same rules and regulations as applied to other private foundations.
Community foundationsCommunity foundations are classified by the IRS as 501(c)(3) organizations that fund general charitable purposes in geographically defined communities. Their grant making funds and assets are usually derived from many donors, including individuals, corporations, and other nonprofits. Most community foundations are public charities and the public contributions they receive are eligible for maximum tax deduction.
Grant making public charitiesGrant making public charities are 501(c)(3) public charities that also engage in grant making activities.
Family foundationsThere is no legal definition of family foundations, but they are independent, private foundations with funds and assets derived from members of a single family. Family members often play a significant role in governing and/or managing the foundation. Please see the methodology section of this report for more details on how family foundations are identified in this study.
GRANT MAKING BY CHICAGO METRO AREA GRANTMAKERS
In 2012, a total of 38,96v9 grants of $4,000 or above were made by 2,038 Chicago metro area grant makers. The total amount of these grants reached approximately $2.6 billion, with an average amount of $65,535 and a median amount of $13,139. Almost 30 percent of all grants fell in the range between $5,000 and $10,000, and nearly 60 percent in total were less than $20,000 (see Figure 3-1).
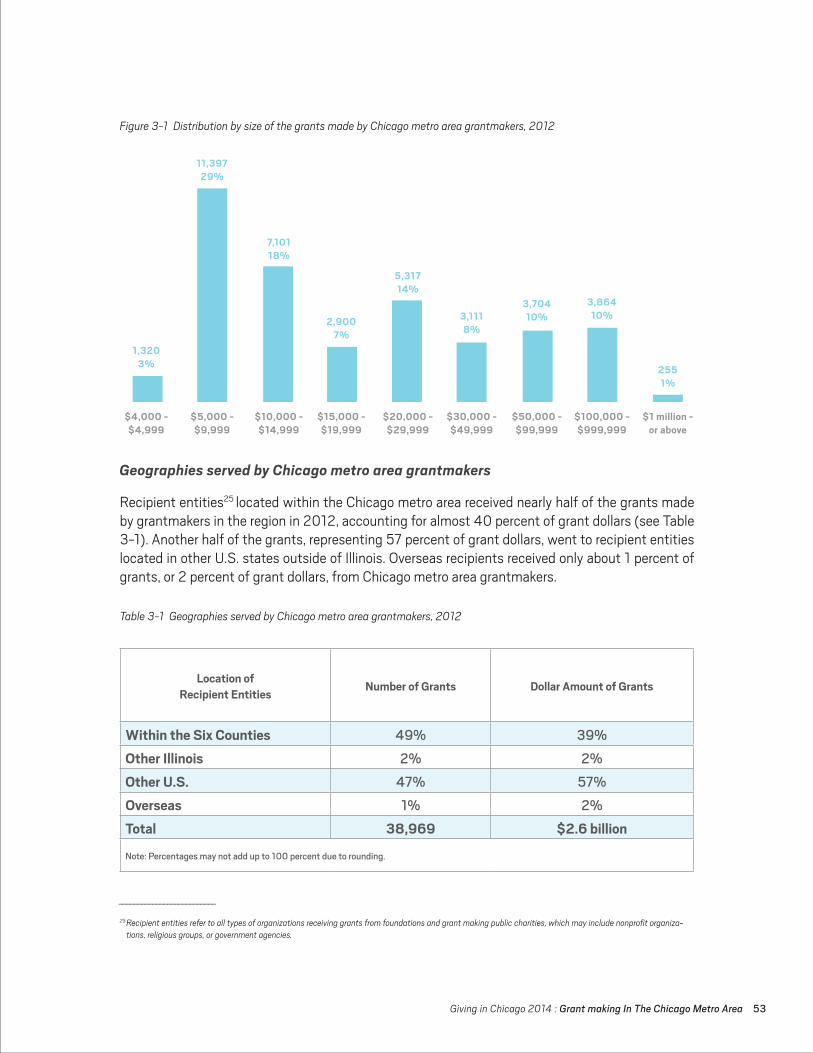
Giving in Chicago 2014 : Grant making In The Chicago Metro Area 53
Figure 3-1 Distribution by size of the grants made by Chicago metro area grantmakers, 2012
Table 3-1 Geographies served by Chicago metro area grantmakers, 2012
__________________________
25 Recipient entities refer to all types of organizations receiving grants from foundations and grant making public charities, which may include nonprofit organiza-tions, religious groups, or government agencies.
Geographies served by Chicago metro area grantmakers
Recipient entities25 located within the Chicago metro area received nearly half of the grants made by grantmakers in the region in 2012, accounting for almost 40 percent of grant dollars (see Table 3-1). Another half of the grants, representing 57 percent of grant dollars, went to recipient entities located in other U.S. states outside of Illinois. Overseas recipients received only about 1 percent of grants, or 2 percent of grant dollars, from Chicago metro area grantmakers.
1,320 3%
$4,000 - $4,999
$5,000 - $9,999
$10,000 - $14,999
$15,000 - $19,999
$20,000 - $29,999
$30,000 - $49,999
$50,000 - $99,999
$100,000 - $999,999
$1 million - or above
11,397 29%
7,101 18%
2,900 7%
5,317 14%
3,111 8%
3,704 10%
3,864 10%
255 1%
Location ofRecipient Entities Number of Grants Dollar Amount of Grants
Within the Six Counties 49% 39%Other Illinois 2% 2%Other U.S. 47% 57%Overseas 1% 2%Total 38,969 $2.6 billion
Note:Percentagesmaynotaddupto100percentduetorounding.
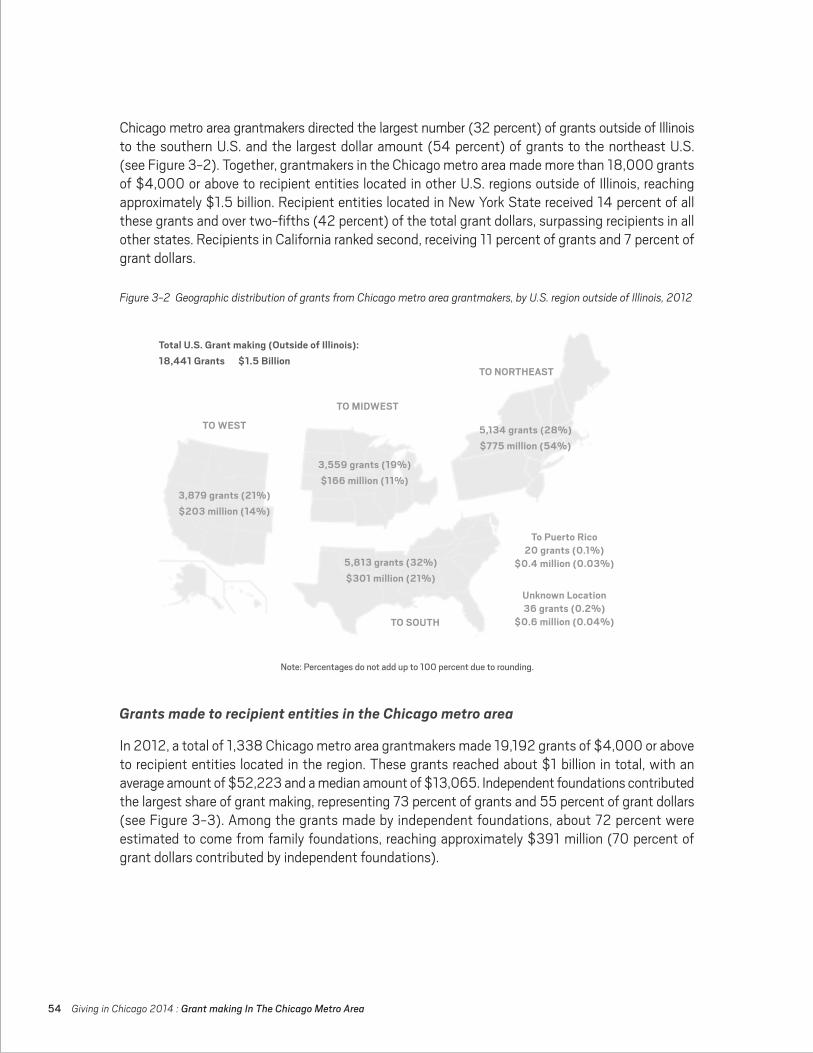
54 Giving in Chicago 2014 : Grant making In The Chicago Metro Area
Chicago metro area grantmakers directed the largest number (32 percent) of grants outside of Illinois to the southern U.S. and the largest dollar amount (54 percent) of grants to the northeast U.S. (see Figure 3-2). Together, grantmakers in the Chicago metro area made more than 18,000 grants of $4,000 or above to recipient entities located in other U.S. regions outside of Illinois, reaching approximately $1.5 billion. Recipient entities located in New York State received 14 percent of all these grants and over two-fifths (42 percent) of the total grant dollars, surpassing recipients in all other states. Recipients in California ranked second, receiving 11 percent of grants and 7 percent of grant dollars.
Grants made to recipient entities in the Chicago metro area
In 2012, a total of 1,338 Chicago metro area grantmakers made 19,192 grants of $4,000 or above to recipient entities located in the region. These grants reached about $1 billion in total, with an average amount of $52,223 and a median amount of $13,065. Independent foundations contributed the largest share of grant making, representing 73 percent of grants and 55 percent of grant dollars (see Figure 3-3). Among the grants made by independent foundations, about 72 percent were estimated to come from family foundations, reaching approximately $391 million (70 percent of grant dollars contributed by independent foundations).
Figure 3-2 Geographic distribution of grants from Chicago metro area grantmakers, by U.S. region outside of Illinois, 2012
TO WEST
3,879 grants (21%)$203 million (14%)
3,559 grants (19%)$166 million (11%)
5,134 grants (28%)$775 million (54%)
5,813 grants (32%)$301 million (21%)
To Puerto Rico20 grants (0.1%)
$0.4 million (0.03%)
Unknown Location36 grants (0.2%)
$0.6 million (0.04%)
TO MIDWEST
TO NORTHEAST
TO SOUTH
Total U.S. Grant making (Outside of Illinois):18,441 Grants $1.5 Billion
Note:Percentagesdonotaddupto100percentduetorounding.
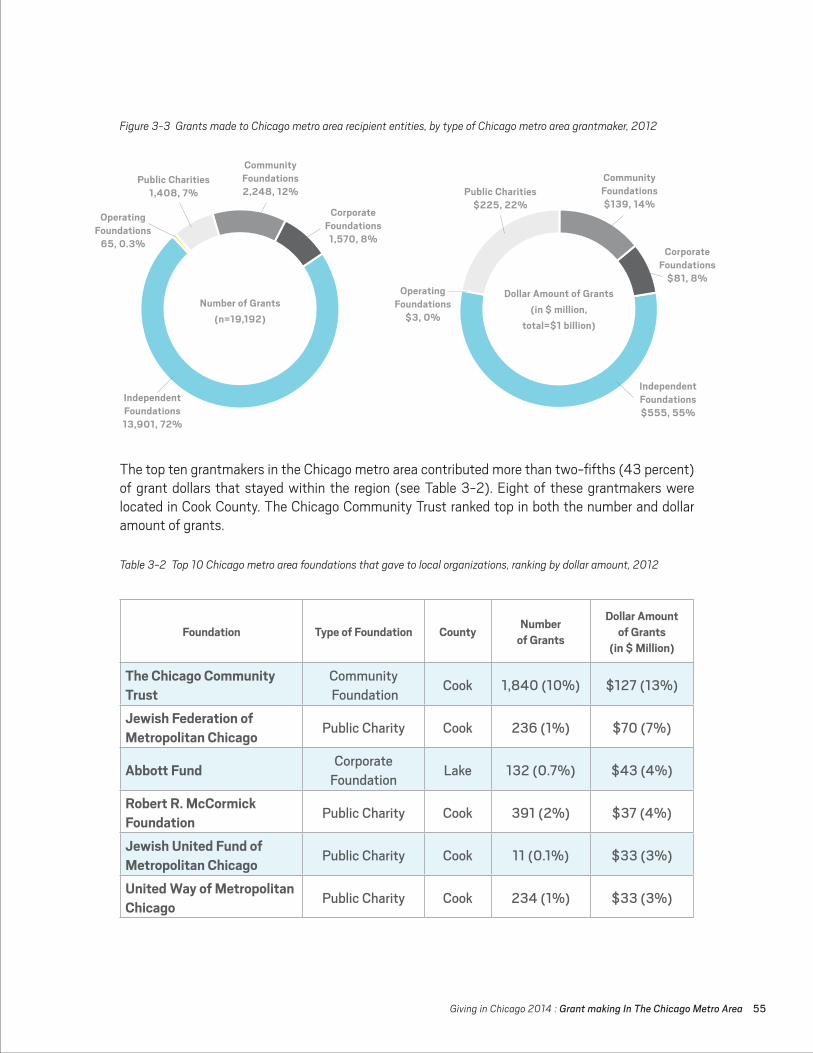
Giving in Chicago 2014 : Grant making In The Chicago Metro Area 55
The top ten grantmakers in the Chicago metro area contributed more than two-fifths (43 percent) of grant dollars that stayed within the region (see Table 3-2). Eight of these grantmakers were located in Cook County. The Chicago Community Trust ranked top in both the number and dollar amount of grants.
Figure 3-3 Grants made to Chicago metro area recipient entities, by type of Chicago metro area grantmaker, 2012
Table 3-2 Top 10 Chicago metro area foundations that gave to local organizations, ranking by dollar amount, 2012
Number of Grants (n=19,192)
IndependentFoundations13,901, 72%
OperatingFoundations
65, 0.3%
Public Charities1,408, 7%
CommunityFoundations2,248, 12% Public Charities
$225, 22%
CommunityFoundations$139, 14%
CorporateFoundations
$81, 8%
IndependentFoundations$555, 55%
OperatingFoundations
$3, 0%
CorporateFoundations
1,570, 8%
Dollar Amount of Grants(in $ million,
total=$1 billion)
Foundation Type of Foundation County Numberof Grants
Dollar Amount of Grants
(in $ Million)
The Chicago Community Trust
CommunityFoundation Cook 1,840(10%) $127(13%)
Jewish Federation of Metropolitan Chicago PublicCharity Cook 236(1%) $70(7%)
Abbott Fund CorporateFoundation Lake 132(0.7%) $43(4%)
Robert R. McCormick Foundation PublicCharity Cook 391(2%) $37(4%)
Jewish United Fund of Metropolitan Chicago PublicCharity Cook 11(0.1%) $33(3%)
United Way of Metropolitan Chicago PublicCharity Cook 234(1%) $33(3%)
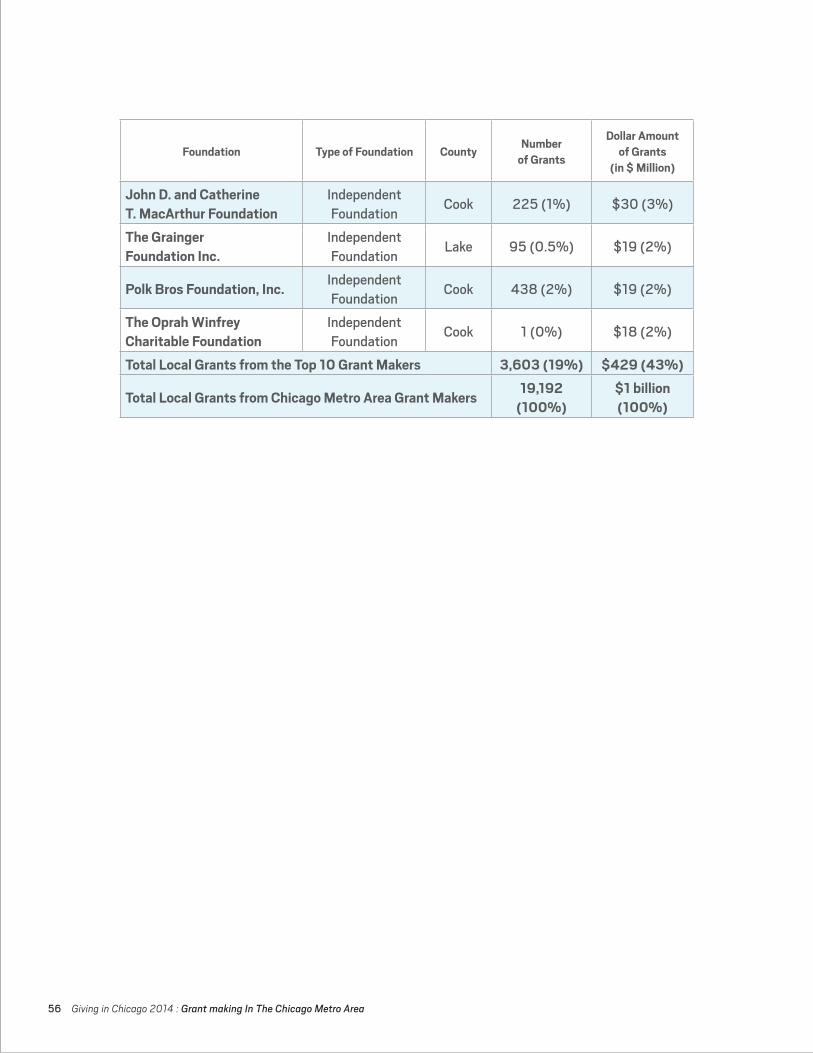
56 Giving in Chicago 2014 : Grant making In The Chicago Metro Area
Foundation Type of Foundation County Numberof Grants
Dollar Amount of Grants
(in $ Million)
John D. and Catherine T. MacArthur Foundation
IndependentFoundation
Cook 225(1%) $30(3%)
The Grainger Foundation Inc.
IndependentFoundation
Lake 95(0.5%) $19(2%)
Polk Bros Foundation, Inc.IndependentFoundation
Cook 438(2%) $19(2%)
The Oprah Winfrey Charitable Foundation
IndependentFoundation
Cook 1(0%) $18(2%)
Total Local Grants from the Top 10 Grant Makers 3,603 (19%) $429 (43%)
Total Local Grants from Chicago Metro Area Grant Makers 19,192 (100%)
$1 billion (100%)

Giving in Chicago 2014 : Grant making In The Chicago Metro Area 57
Figure 3-4 Grants made to Chicago metro area recipient entities by grantmakers in the region, by grant purpose, 2012
Human services26 and education were the top two purposes of the grants made by Chicago metro area grantmakers to recipient entities in the region (see Figure 3-4). These two purposes together received about half of grants and 46 percent of grant dollars. The other three grant purposes—arts and culture, health, and community development—received around two-fifths of grant making in total (in terms of both the number of grants and grant dollars).
__________________________
26 Following the definition by FoundationSearch.com, human services refer to activities or services to promote human welfare; to advance social work, social change, and social justice; to improve the quality of life; and to develop the potential of each individual, group, and community within a society. Please see the methodology section of this report for definitions of all grant purposes.
Human Services5,282, 28%
Education4,141, 22%
Arts & Culture3,426, 18%
Health2,123, 11%
Community Development2,002, 10%
Religion1,225, 6%
Environment & Animals762, 4%
Sports & Recreation129, 1%
Multiple Purposes66, 0%
Private Business (Program Expenses)
27, 0%
Education$235, 24%
Human Services$224, 22%
Community Development
$185, 19%
Arts & Culture$123, 12%
Health$122, 12%
Religion$42, 4%
Multiple Purposes$36, 4%
Environment & Animals$31, 3%
Sports & Recreation$3, 0%
Private Business (Program Expenses)
$1, 0%
NumberofGrants(total=19,192)
DollarAmountofGrants(in$million,total=$1billion)
Note:Ninegrantsthatdonothavespecifiedgrantpurposesarenotpresentedinthegraph,whichhaveatotalamountof$200,000.
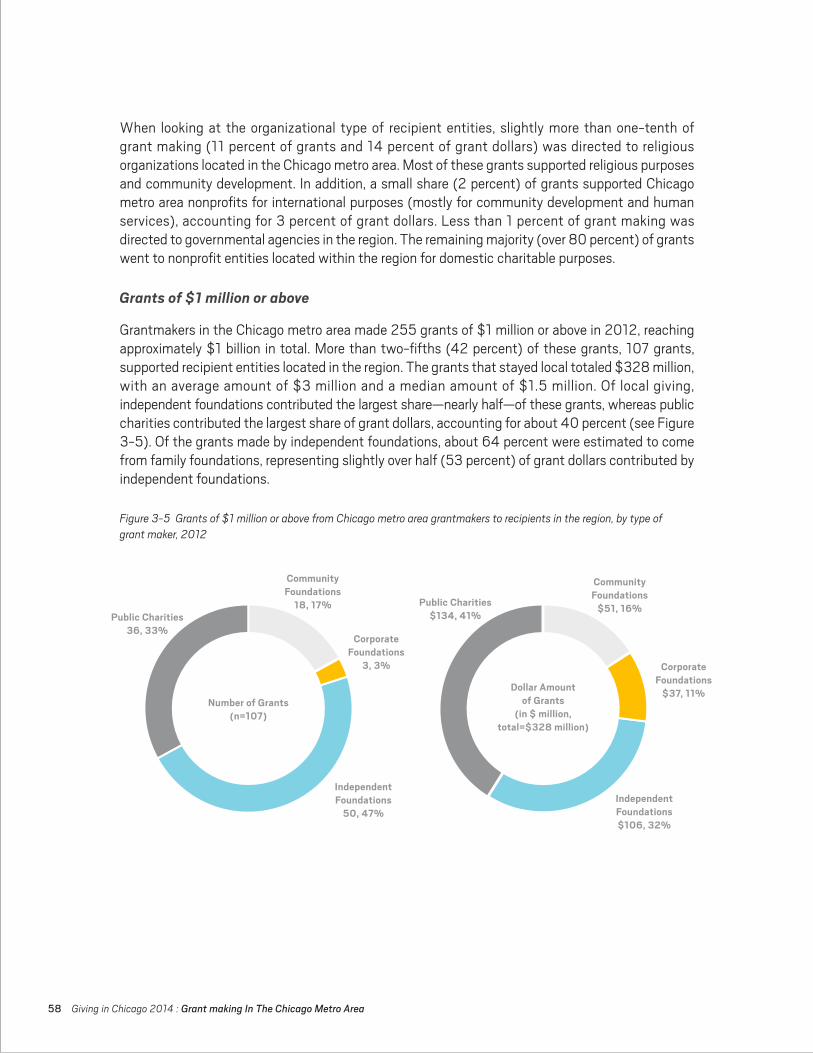
58 Giving in Chicago 2014 : Grant making In The Chicago Metro Area
When looking at the organizational type of recipient entities, slightly more than one-tenth of grant making (11 percent of grants and 14 percent of grant dollars) was directed to religious organizations located in the Chicago metro area. Most of these grants supported religious purposes and community development. In addition, a small share (2 percent) of grants supported Chicago metro area nonprofits for international purposes (mostly for community development and human services), accounting for 3 percent of grant dollars. Less than 1 percent of grant making was directed to governmental agencies in the region. The remaining majority (over 80 percent) of grants went to nonprofit entities located within the region for domestic charitable purposes.
Grants of $1 million or above
Grantmakers in the Chicago metro area made 255 grants of $1 million or above in 2012, reaching approximately $1 billion in total. More than two-fifths (42 percent) of these grants, 107 grants, supported recipient entities located in the region. The grants that stayed local totaled $328 million, with an average amount of $3 million and a median amount of $1.5 million. Of local giving, independent foundations contributed the largest share—nearly half—of these grants, whereas public charities contributed the largest share of grant dollars, accounting for about 40 percent (see Figure 3-5). Of the grants made by independent foundations, about 64 percent were estimated to come from family foundations, representing slightly over half (53 percent) of grant dollars contributed by independent foundations.
Figure 3-5 Grants of $1 million or above from Chicago metro area grantmakers to recipients in the region, by type of grant maker, 2012
Number of Grants(n=107)
Public Charities36, 33%
CommunityFoundations
18, 17%
CorporateFoundations
3, 3%
IndependentFoundations
50, 47%
Public Charities$134, 41%
CommunityFoundations
$51, 16%
CorporateFoundations
$37, 11%
IndependentFoundations$106, 32%
Dollar Amountof Grants
(in $ million,total=$328 million)
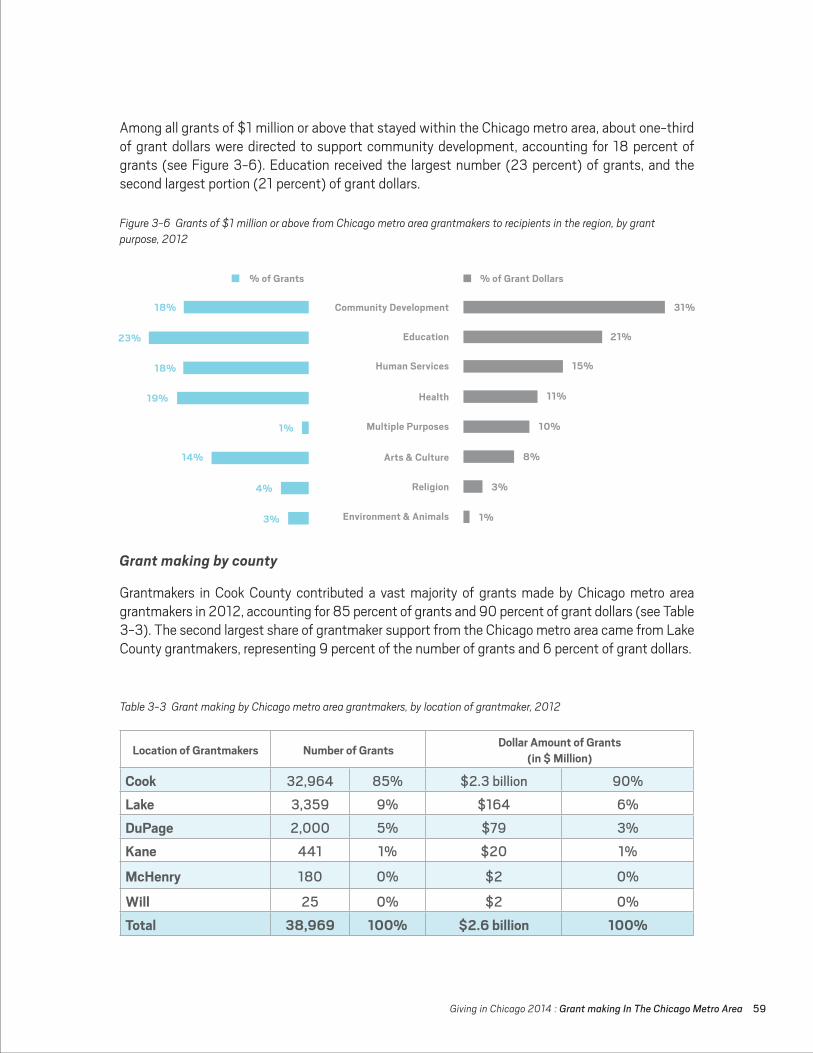
Giving in Chicago 2014 : Grant making In The Chicago Metro Area 59
Among all grants of $1 million or above that stayed within the Chicago metro area, about one-third of grant dollars were directed to support community development, accounting for 18 percent of grants (see Figure 3-6). Education received the largest number (23 percent) of grants, and the second largest portion (21 percent) of grant dollars.
Grant making by county
Grantmakers in Cook County contributed a vast majority of grants made by Chicago metro area grantmakers in 2012, accounting for 85 percent of grants and 90 percent of grant dollars (see Table 3-3). The second largest share of grantmaker support from the Chicago metro area came from Lake County grantmakers, representing 9 percent of the number of grants and 6 percent of grant dollars.
Figure 3-6 Grants of $1 million or above from Chicago metro area grantmakers to recipients in the region, by grant purpose, 2012
Table 3-3 Grant making by Chicago metro area grantmakers, by location of grantmaker, 2012
Community Development
Education
Human Services
Health
Multiple Purposes
Arts & Culture
Religion
Environment & Animals 1%
3%
8%
10%
11%
15%
21%
31%18%
23%
18%
19%
1%
14%
4%
3%
% of Grants % of Grant Dollars
Location of Grantmakers Number of Grants Dollar Amount of Grants(in $ Million)
Cook 32,964 85% $2.3billion 90%Lake 3,359 9% $164 6%DuPage 2,000 5% $79 3%Kane 441 1% $20 1%
McHenry 180 0% $2 0%
Will 25 0% $2 0%Total 38,969 100% $2.6 billion 100%

60 Giving in Chicago 2014 : Grant making In The Chicago Metro Area
Half (50 percent) of grants made by Cook County grantmakers, accounting for over one-third (37 percent) of grant dollars, stayed within the Chicago metro area, a majority of which supported recipients in Cook County (see Table 3-4). About 2 percent of grant making (in both the number and dollar amount of grants) supported recipients located in other Illinois counties. Less than half (47 percent) of grants and nearly three-fifths (59 percent) of grant dollars went to recipients in other states across the country. Another 1 percent of grants and 2 percent of grant dollars were made to overseas recipients. Approximately half of the grant support from Cook County grant makers that stayed within the Chicago metro area was directed to education (22 percent of grants and 25 percent of grant dollars) and human services (27 percent of grants and 24 percent of grant dollars).
Of the grants made by Lake County grantmakers, 44 percent, accounting for three-fifths (60 percent) of grant dollars, stayed within the Chicago metro area. Human services and education were the top two charitable purposes receiving nearly half (46 percent) of these grants, whereas community development and arts and culture together received the largest share (58 percent) of grant dollars.
Table 3-4 Geographies served by Cook County grant makers, 2012
Location ofRecipient Entities Number of Grants Dollar Amount of Grants
(in $ Million)
Cook 14,943 45% $801 35%Lake 593 2% $15 1%DuPage 500 2% $29 1%Kane 165 1% $4 0%
Will 73 0% $3 0%
McHenry 55 0% $2 0%Other Illinois 623 2% $36 2%Other U.S. 15,481 47% $1.3billion 59%Overseas 484 1% $54 2%Location Unknown 47 0% $3 0%Total 32,964 100% $2.3 billion 100%

CORPORATE GIVING in the
CHICAGO METRO AREA
Giving in Chicago 2014 : Corporate Giving In The Chicago Metro Area 63
HIGHLIGHTS
• About three-quarters (76 percent) of 68 surveyed donor companies made donations to human services in fiscal year 2013.
• Meeting local community needs ranked first among various external factors that impact companies’ charitable giving, followed by customer relations and the current economic state. Executives’ preferences and employees’ preferences were the most influential internal factors.
• Nearly two-thirds (63 percent) of surveyed donor companies supported only U.S. nonprofits in fiscal year 2013.
• In 2012, corporate foundations in the Chicago metro area made approximately 3,500 grants of $4,000 or above, for a total of $158 million. Nationwide, the amount of grants made by corporate foundations is usually estimated to account for approximately one-third of total estimated corporate giving, according to historical data from Giving USA.
• More than 40 percent (44 percent) of grants made by corporate foundations stayed within the Chicago metro area, accounting for about half (51 percent) of grant dollars.
In 2013, U.S. companies and corporate foundations donated an estimated $17.88 billion to nonprofit organizations, falling by approximately 3 percent from 2012 to 2013 (adjusted for inflation in 2013 dollars), as reported in Giving USA 2014. This decrease represents the first year that corporate giving has declined since the end of the Great Recession. This can be largely attributed to a slower growth in companies’ profits and the economy. Companies’ cost reductions and strategic shifts in charitable focus areas were also responsible for the decrease in corporate giving, according to the CECP’s 2014 Giving in Numbers report.27 In addition, large, one-time contributions given to Superstorm Sandy recovery efforts in 2012 depleted charitable resources. Despite the decline, optimism remains for a growth of corporate giving in the years to come, as indicated by the CEOs’ beliefs in the role of businesses in solving social problems and a stronger emphasis on the evaluation of short- and long-term impacts of corporate philanthropic engagement.28 Companies are exploring multiple avenues through which to increase their community impact, from giving more non-cash gifts, increasing pro bono services, and developing matching gift programs, to expanding employee volunteering opportunities and sponsorships. Corporate giving is developing into a deeply integrated component of corporate behavior, as companies seek to align grant making priorities with commu-nity needs, employee engagement, and their long-term business strategy.
This section of the report examines charitable giving and other types of philanthropic engagement by companies located in the Chicago metro area. It consists of two sub-sections: giving by corporations and giving by corporate foundations. The first sub-section reports findings from a survey on corporate giving and giving strategies. A total of 70 companies with operations in the Chicago metro area completed the survey, representing companies of all sizes and various industries.
__________________________
27 CECP, in association with The Conference Board. Giving in Numbers: 2014 Edition. The report provides an analysis of 2013 corporate giving data from 261 of the world’s leading companies.
28 CECP, in association with The Conference Board. Giving in Numbers: 2014 Edition.
64 Giving in Chicago 2014 : Corporate Giving In The Chicago Metro Area
The second sub-section presents findings on grant making by corporate foundations in the Chicago metro area, including the number and dollar amount of grants, grant purposes, and distribution of grant recipients. Data reported by corporate foundations on IRS Forms 990-PF were collected through several databases (including FoundationSearch.com, Foundation Center, GuideStar, and the National Center for Charitable Statistics at the Urban Institute) to provide detailed information on grants of $4,000 or above made in 2012 (the latest year available) by 57 Chicago metro area corporate foundations. Please see the methodology section of this report for more detail.
GIVING BY CORPORATIONS
In late 2014, a selected sample of companies with operations in the Chicago metro area were invited to participate in a survey on their charitable giving and other types of community investments.29 A total of 70 companies participated in the survey; 68 of these companies reported making charitable donations to nonprofit organizations in fiscal year 2013, and 57 companies reported making other types of community investments in the same year. About 66 percent of all surveyed companies had operations in Cook County, and a majority (94 percent) had been operating in the Chicago metro area for five years or more. Detailed findings from the survey are presented in this section, including an overview of corporate giving, primary areas of charitable support, geographic distribution of non-profit recipients, and corporate giving strategies.
Overview of corporate giving
In fiscal year 2013, 68 surveyed companies (97 percent) reported making charitable donations to nonprofit organizations. A majority (71 percent) reported the amount of their giving in the survey, as shown in Table 4-1 below. Among the 26 surveyed companies that tracked charitable giving separately from other community investments, the total amount given, on average, was over $2 million ($2,377,991), with a median amount of $100,000, ranging from $500 to $22 million. Among the other 22 surveyed companies that tracked all community investments together, the total amount donated was $377,300, on average, with a median of $40,000, ranging from $4,000 to $2 million.
__________________________
29 In the survey, charitable giving refers to charitable donations of cash, products, or services made to nonprofit organizations. Besides charitable donations, other types of community investments include employee volunteerism, sponsorships, cause-related marketing, impact investing, and other initiatives to address social needs in communities.
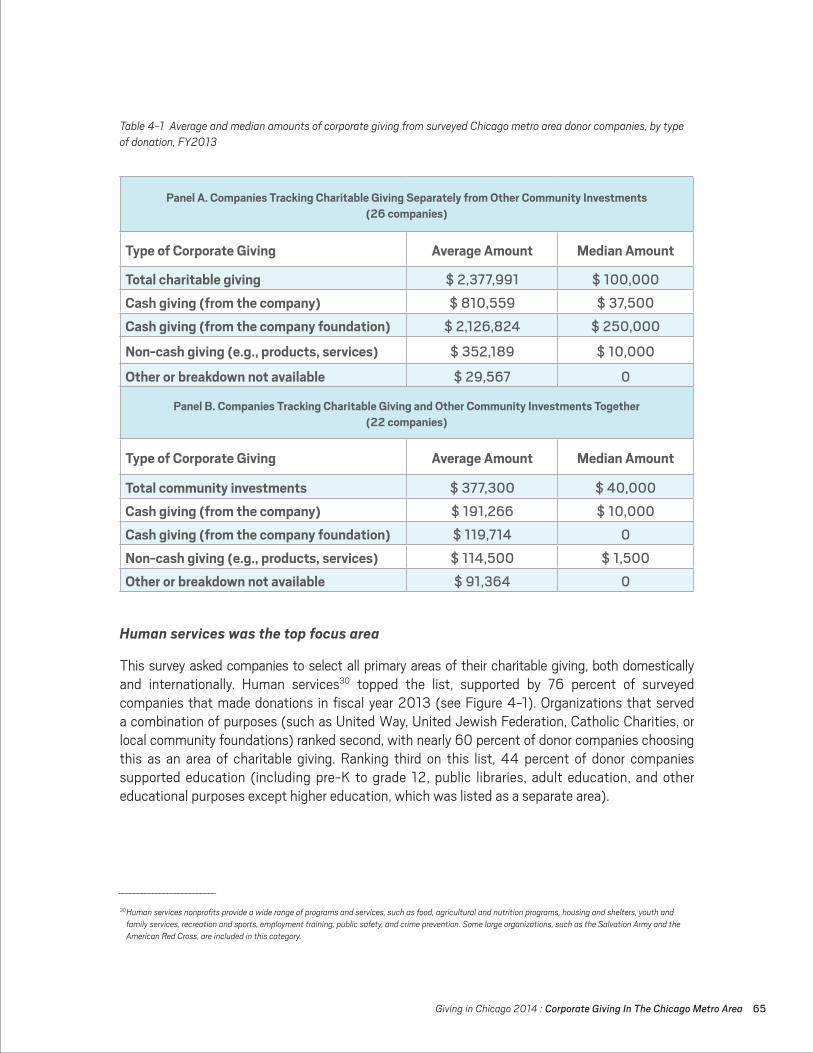
Giving in Chicago 2014 : Corporate Giving In The Chicago Metro Area 65
__________________________
30 Human services nonprofits provide a wide range of programs and services, such as food, agricultural and nutrition programs, housing and shelters, youth and family services, recreation and sports, employment training, public safety, and crime prevention. Some large organizations, such as the Salvation Army and the American Red Cross, are included in this category.
Table 4-1 Average and median amounts of corporate giving from surveyed Chicago metro area donor companies, by type of donation, FY2013
Human services was the top focus area
This survey asked companies to select all primary areas of their charitable giving, both domestically and internationally. Human services30 topped the list, supported by 76 percent of surveyed companies that made donations in fiscal year 2013 (see Figure 4-1). Organizations that served a combination of purposes (such as United Way, United Jewish Federation, Catholic Charities, or local community foundations) ranked second, with nearly 60 percent of donor companies choosing this as an area of charitable giving. Ranking third on this list, 44 percent of donor companies supported education (including pre-K to grade 12, public libraries, adult education, and other educational purposes except higher education, which was listed as a separate area).
Panel A. Companies Tracking Charitable Giving Separately from Other Community Investments (26 companies)
Type of Corporate Giving Average Amount Median Amount
Total charitable giving $2,377,991 $100,000Cash giving (from the company) $810,559 $37,500Cash giving (from the company foundation) $2,126,824 $250,000
Non-cash giving (e.g., products, services) $352,189 $10,000
Other or breakdown not available $29,567 0
Panel B. Companies Tracking Charitable Giving and Other Community Investments Together (22 companies)
Type of Corporate Giving Average Amount Median Amount
Total community investments $377,300 $40,000Cash giving (from the company) $191,266 $10,000Cash giving (from the company foundation) $119,714 0Non-cash giving (e.g., products, services) $114,500 $1,500Other or breakdown not available $91,364 0
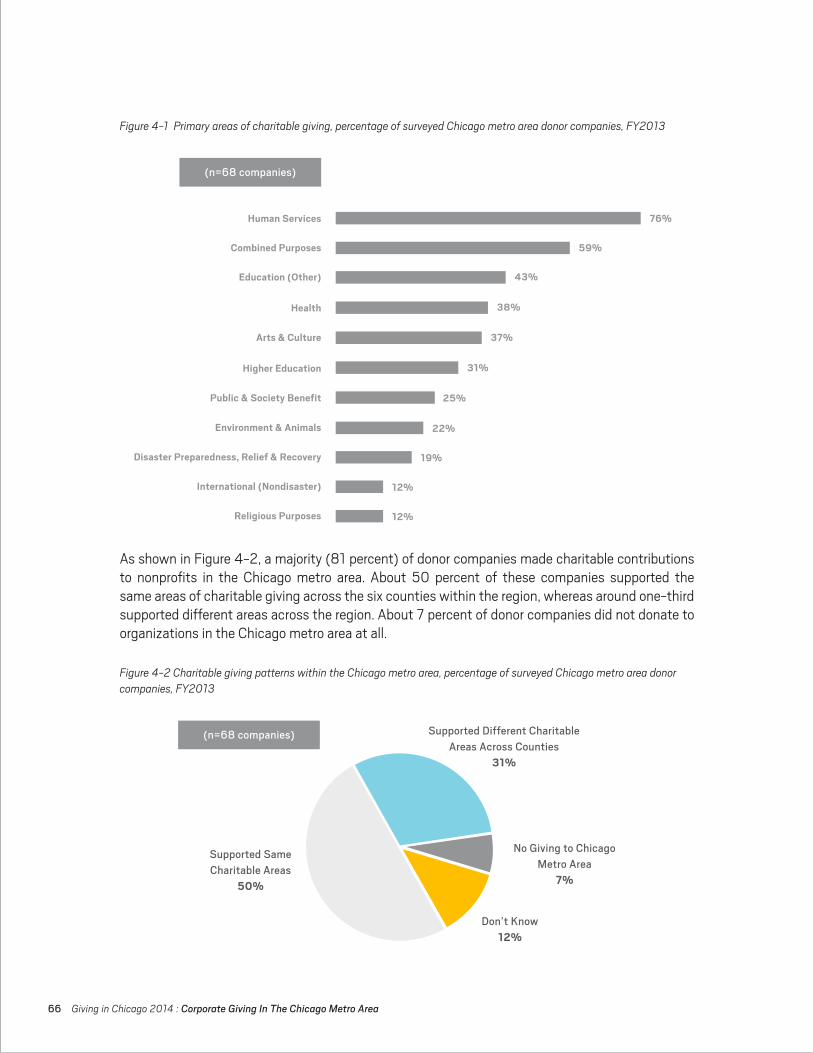
66 Giving in Chicago 2014 : Corporate Giving In The Chicago Metro Area
Figure 4-1 Primary areas of charitable giving, percentage of surveyed Chicago metro area donor companies, FY2013
Figure 4-2 Charitable giving patterns within the Chicago metro area, percentage of surveyed Chicago metro area donor companies, FY2013
As shown in Figure 4-2, a majority (81 percent) of donor companies made charitable contributions to nonprofits in the Chicago metro area. About 50 percent of these companies supported the same areas of charitable giving across the six counties within the region, whereas around one-third supported different areas across the region. About 7 percent of donor companies did not donate to organizations in the Chicago metro area at all.
(n=68companies)
Human Services
Combined Purposes
Education (Other)
Health
Arts & Culture
Higher Education
Public & Society Benefit
Environment & Animals
Disaster Preparedness, Relief & Recovery
International (Nondisaster)
Religious Purposes
22%
19%
12%
12%
25%
31%
37%
38%
43%
59%
76%
SupportedDifferentCharitableAreasAcrossCounties
31%
SupportedSameCharitableAreas
50%
NoGivingtoChicagoMetroArea
7%
Don’tKnow12%
(n=68companies)
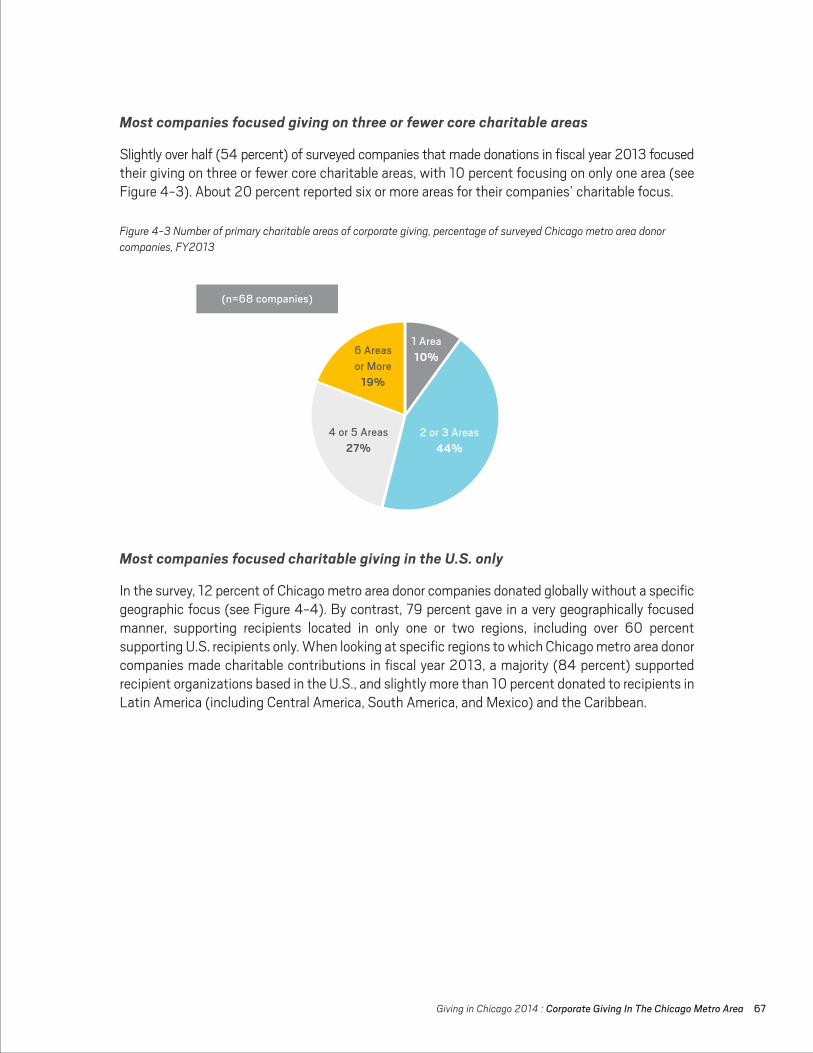
Giving in Chicago 2014 : Corporate Giving In The Chicago Metro Area 67
Figure 4-3 Number of primary charitable areas of corporate giving, percentage of surveyed Chicago metro area donor companies, FY2013
Most companies focused giving on three or fewer core charitable areas
Slightly over half (54 percent) of surveyed companies that made donations in fiscal year 2013 focused their giving on three or fewer core charitable areas, with 10 percent focusing on only one area (see Figure 4-3). About 20 percent reported six or more areas for their companies’ charitable focus.
Most companies focused charitable giving in the U.S. only
In the survey, 12 percent of Chicago metro area donor companies donated globally without a specific geographic focus (see Figure 4-4). By contrast, 79 percent gave in a very geographically focused manner, supporting recipients located in only one or two regions, including over 60 percent supporting U.S. recipients only. When looking at specific regions to which Chicago metro area donor companies made charitable contributions in fiscal year 2013, a majority (84 percent) supported recipient organizations based in the U.S., and slightly more than 10 percent donated to recipients in Latin America (including Central America, South America, and Mexico) and the Caribbean.
1Area 10%6Areas
orMore19%
4or5Areas27%
2or3Areas44%
(n=68companies)
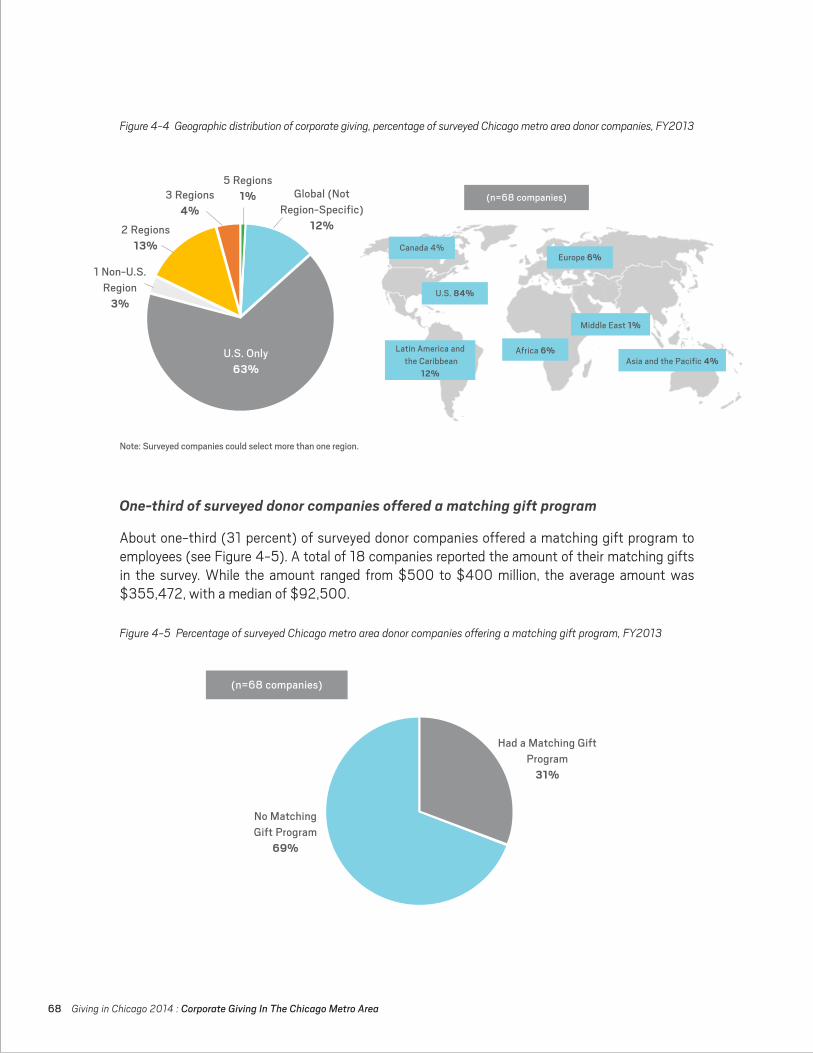
68 Giving in Chicago 2014 : Corporate Giving In The Chicago Metro Area
Figure 4-4 Geographic distribution of corporate giving, percentage of surveyed Chicago metro area donor companies, FY2013
Figure 4-5 Percentage of surveyed Chicago metro area donor companies offering a matching gift program, FY2013
One-third of surveyed donor companies offered a matching gift program
About one-third (31 percent) of surveyed donor companies offered a matching gift program to employees (see Figure 4-5). A total of 18 companies reported the amount of their matching gifts in the survey. While the amount ranged from $500 to $400 million, the average amount was $355,472, with a median of $92,500.
(n=68companies)
Canada4%
U.S.84%
LatinAmericaandtheCaribbean
12%
Africa6%
Europe6%
MiddleEast1%
AsiaandthePacific4%
Global(NotRegion-Specific)
12%
1Non-U.S.Region
3%
2Regions13%
3Regions4%
5Regions1%
U.S.Only63%
Note:Surveyedcompaniescouldselectmorethanoneregion.
NoMatchingGiftProgram
69%
HadaMatchingGiftProgram
31%
(n=68companies)
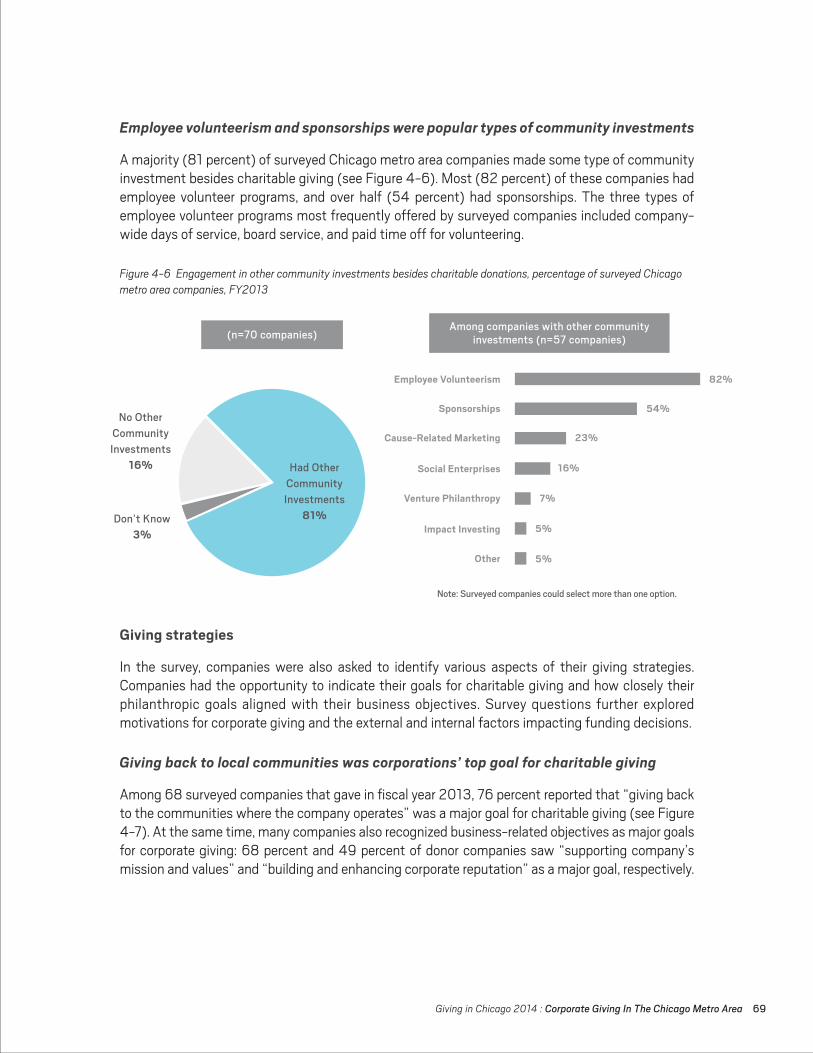
Giving in Chicago 2014 : Corporate Giving In The Chicago Metro Area 69
Figure 4-6 Engagement in other community investments besides charitable donations, percentage of surveyed Chicago metro area companies, FY2013
Employee volunteerism and sponsorships were popular types of community investments
A majority (81 percent) of surveyed Chicago metro area companies made some type of community investment besides charitable giving (see Figure 4-6). Most (82 percent) of these companies had employee volunteer programs, and over half (54 percent) had sponsorships. The three types of employee volunteer programs most frequently offered by surveyed companies included company-wide days of service, board service, and paid time off for volunteering.
Giving strategies
In the survey, companies were also asked to identify various aspects of their giving strategies. Companies had the opportunity to indicate their goals for charitable giving and how closely their philanthropic goals aligned with their business objectives. Survey questions further explored motivations for corporate giving and the external and internal factors impacting funding decisions.
Giving back to local communities was corporations’ top goal for charitable giving
Among 68 surveyed companies that gave in fiscal year 2013, 76 percent reported that “giving back to the communities where the company operates” was a major goal for charitable giving (see Figure 4-7). At the same time, many companies also recognized business-related objectives as major goals for corporate giving: 68 percent and 49 percent of donor companies saw “supporting company’s mission and values” and “building and enhancing corporate reputation” as a major goal, respectively.
NoOtherCommunityInvestments
16%
Don’tKnow3%
HadOtherCommunityInvestments
81%
(n=70companies)Amongcompanieswithothercommunity
investments(n=57companies)
Employee Volunteerism
Sponsorships
Cause-Related Marketing
Social Enterprises
Venture Philanthropy
Impact Investing
Other 5%
5%
7%
16%
23%
54%
82%
Note:Surveyedcompaniescouldselectmorethanoneoption.
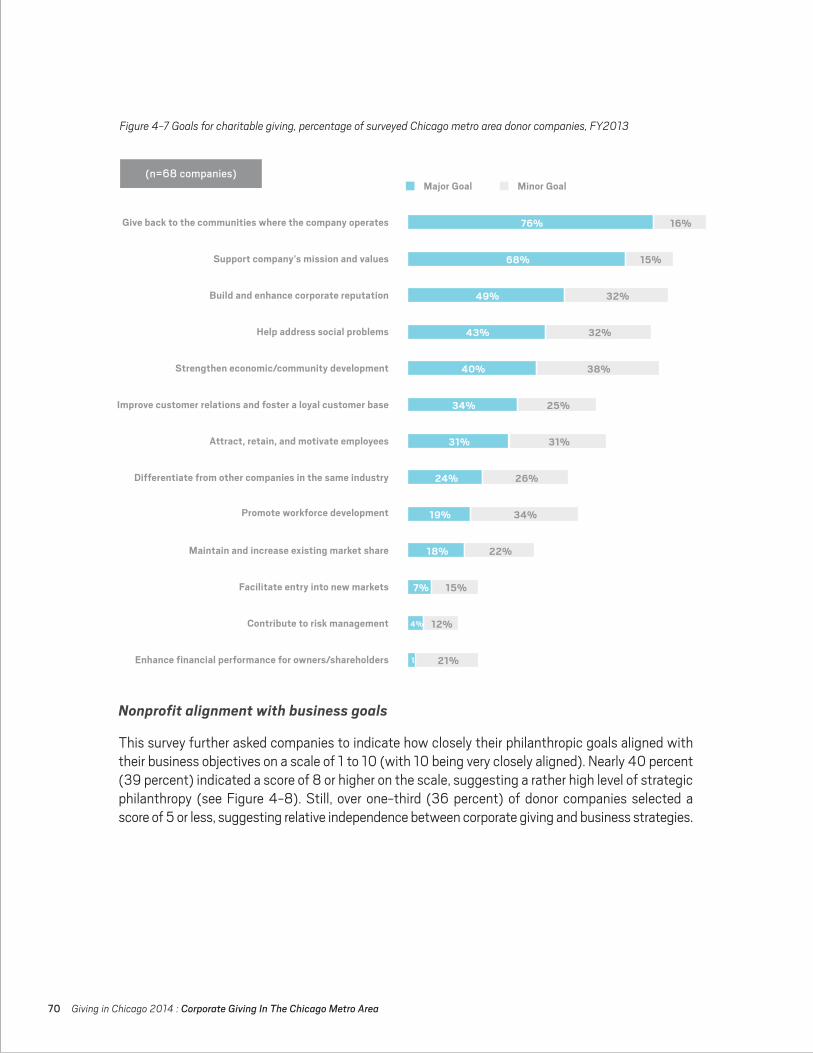
70 Giving in Chicago 2014 : Corporate Giving In The Chicago Metro Area
Figure 4-7 Goals for charitable giving, percentage of surveyed Chicago metro area donor companies, FY2013
Major Goal Minor Goal
Give back to the communities where the company operates
Support company’s mission and values
Build and enhance corporate reputation
Help address social problems
Strengthen economic/community development
Improve customer relations and foster a loyal customer base
Attract, retain, and motivate employees
Differentiate from other companies in the same industry
Promote workforce development
Maintain and increase existing market share
Facilitate entry into new markets
Contribute to risk management
Enhance financial performance for owners/shareholders
76% 16%
34% 25%
68% 15%
31% 31%
49% 32%
24% 26%
7% 15%
43% 32%
19% 34%
4% 12%
40% 38%
18% 22%
1 21%
(n=68companies)
Nonprofit alignment with business goals
This survey further asked companies to indicate how closely their philanthropic goals aligned with their business objectives on a scale of 1 to 10 (with 10 being very closely aligned). Nearly 40 percent (39 percent) indicated a score of 8 or higher on the scale, suggesting a rather high level of strategic philanthropy (see Figure 4-8). Still, over one-third (36 percent) of donor companies selected a score of 5 or less, suggesting relative independence between corporate giving and business strategies.

Giving in Chicago 2014 : Corporate Giving In The Chicago Metro Area 71
Figure 4-8 Level of alignment between philanthropic goals and business objectives, percentage of surveyed Chicago metro area donor companies, FY2013
Philanthropic mission alignment and shared geographic location led to sustainable business-nonprofit partnerships
In building or maintaining a relationship with nonprofit organizations, how do companies weigh different factors? The survey shows that the alignment between a company’s philanthropic focus and a nonprofit’s mission is the top deciding factor in initiating such a partnership. About two-thirds (65 percent) of surveyed donor companies identified this as one of the three most important factors (see Figure 4-9). Slightly over half (54 percent) of companies considered a shared geographic location important. The effectiveness and efficiency of a nonprofit in producing results ranked third, selected by 47 percent of surveyed donor companies.
1
3%
10%
5% 5%
13%
10%
15%
21%
13%
5%
Not Related
At All
AverageScore=6MedianScore=7
(n=67companies)
Very Closely Aligned
2 3 4 5 6 7 8 9 10
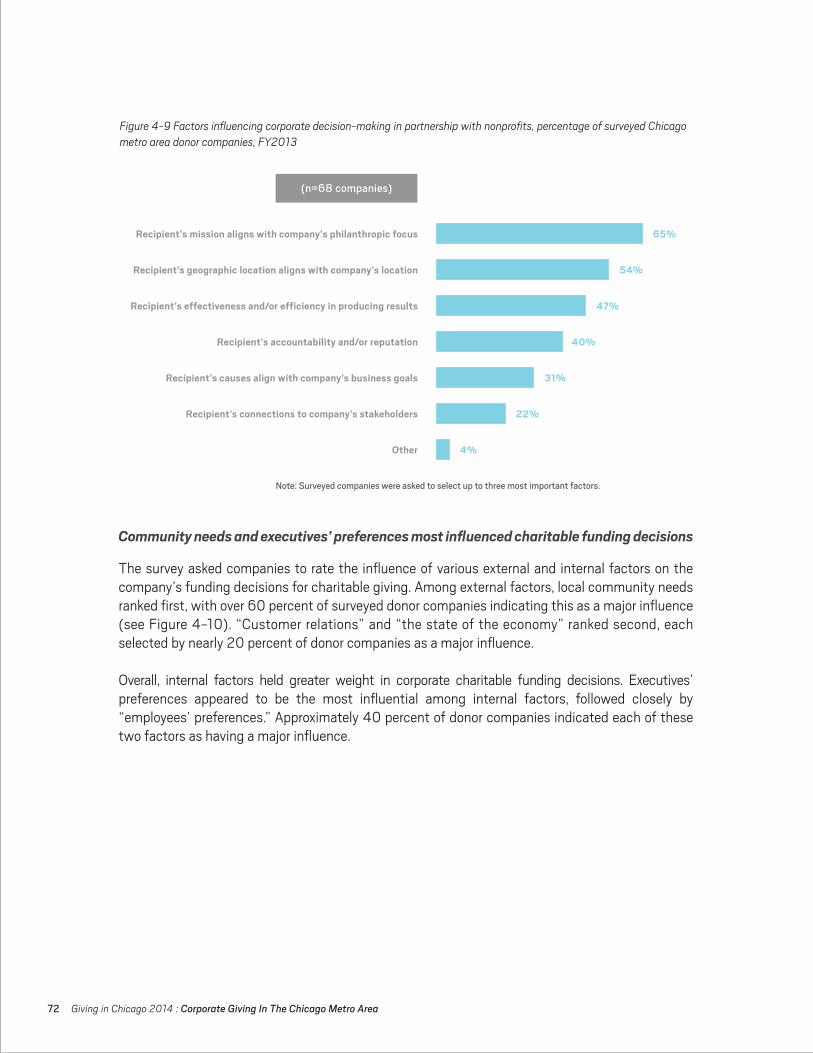
72 Giving in Chicago 2014 : Corporate Giving In The Chicago Metro Area
Figure 4-9 Factors influencing corporate decision-making in partnership with nonprofits, percentage of surveyed Chicago metro area donor companies, FY2013
Community needs and executives’ preferences most influenced charitable funding decisions
The survey asked companies to rate the influence of various external and internal factors on the company’s funding decisions for charitable giving. Among external factors, local community needs ranked first, with over 60 percent of surveyed donor companies indicating this as a major influence (see Figure 4-10). “Customer relations” and “the state of the economy” ranked second, each selected by nearly 20 percent of donor companies as a major influence.
Overall, internal factors held greater weight in corporate charitable funding decisions. Executives’ preferences appeared to be the most influential among internal factors, followed closely by “employees’ preferences.” Approximately 40 percent of donor companies indicated each of these two factors as having a major influence.
Recipient’s mission aligns with company’s philanthropic focus
Recipient’s geographic location aligns with company’s location
Recipient’s effectiveness and/or efficiency in producing results
Recipient’s accountability and/or reputation
Recipient’s causes align with company’s business goals
Recipient’s connections to company’s stakeholders
Other
65%
54%
47%
40%
31%
22%
4%
Note:Surveyedcompanieswereaskedtoselectuptothreemostimportantfactors.
(n=68companies)
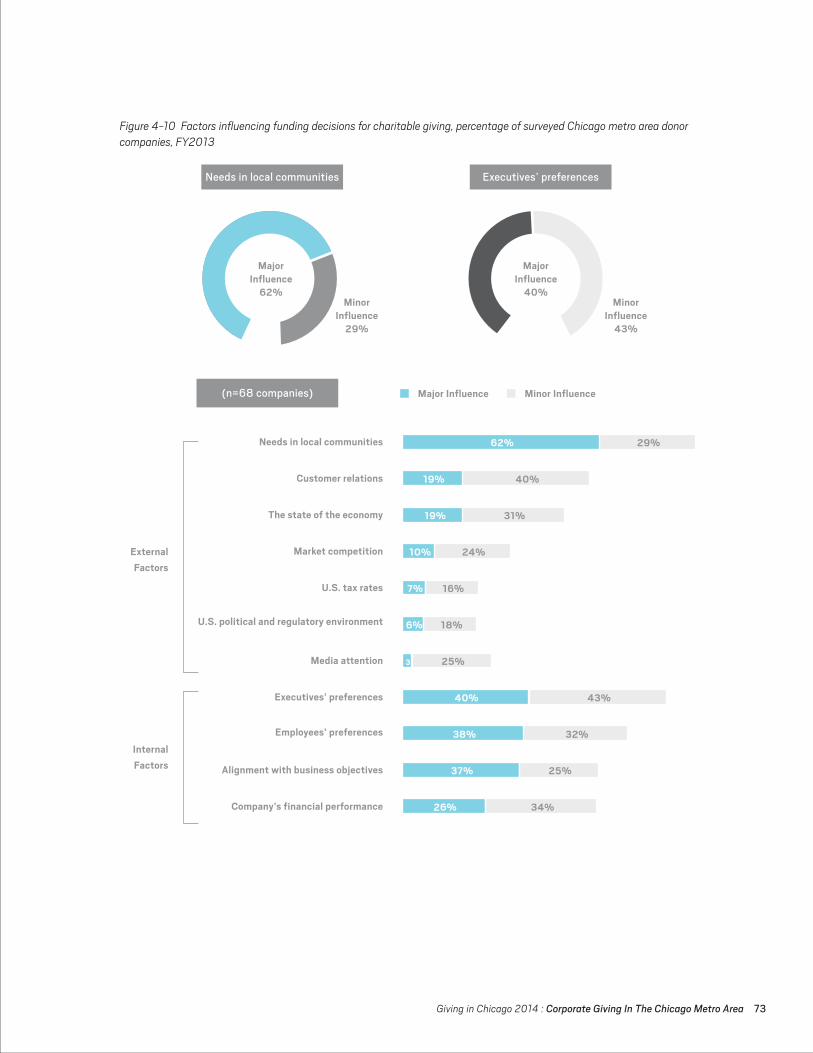
Giving in Chicago 2014 : Corporate Giving In The Chicago Metro Area 73
Figure 4-10 Factors influencing funding decisions for charitable giving, percentage of surveyed Chicago metro area donor companies, FY2013
Major Influence
62%
Major Influence
40%Minor
Influence 43%
Minor Influence
29%
Needsinlocalcommunities Executives’preferences
Major Influence Minor Influence
Needs in local communities
Customer relations
The state of the economy
Market competition
U.S. tax rates
U.S. political and regulatory environment
Media attention
Executives’ preferences
Employees’ preferences
Alignment with business objectives
Company’s financial performance
62% 29%
6% 18%
19% 40%
3 25%
19%
40% 43%
26% 34%
10% 24%
38% 32%
7% 16%
37% 25%
(n=68companies)
External Factors
Internal Factors
31%

74 Giving in Chicago 2014 : Corporate Giving In The Chicago Metro Area
Figure 4-11 Internal resources or assistance that would improve corporate charitable engagement, percentage of surveyed Chicago metro area companies, FY2013
Companies reported internal resources needed for improving charitable and social investments
The survey asked what internal resources or assistance would benefit companies the most in order to improve philanthropic engagement. Approximately 43 percent of surveyed companies answered this question (see Figure 4-11). Slightly more than 10 percent reported that they were satisfied with the company’s current charitable efforts. About one-third indicated specific resources or areas for improvement. These companies most often cited that it would be helpful to have more financial resources allocated by the company for charitable initiatives. Staff dedicated to charitable involvement and better corporate philanthropic culture were the other two frequently indicated areas for improvement. The stronger emphasis of companies on the evaluation and sustainability of their charitable initiatives calls for more financial and human resources that can be dedicated to such efforts.
Profile of surveyed companies
A total of 70 companies in the six counties of the Chicago metro area participated in the survey. About 66 percent of these companies had business operations in Cook County (Figure 4-12). Almost one-third (30 percent) were industrials, which includes businesses in the manufacture and distribution of capital goods and the provision of commercial and transportation services, as defined by the Global Industry Classification Standard (GICS) (Figure 4-13). Over half (51 percent) of surveyed companies had a total revenue of $50 million or more (Figure 4-14), and one-fifth received all of their total revenue from the Chicago metro area (Figure 4-15).
IndicatedAreasfor
Improvement31%
Satisfied12%
SkippedQuestion
57%
More financial resources allocated for charitable initiatives
Staff dedicated to charitable initiatives
Better corporate philanthropic culture
More information on best practices or nonprofits
Other
10%
7%
6%
4%
4%
(n=70companies)
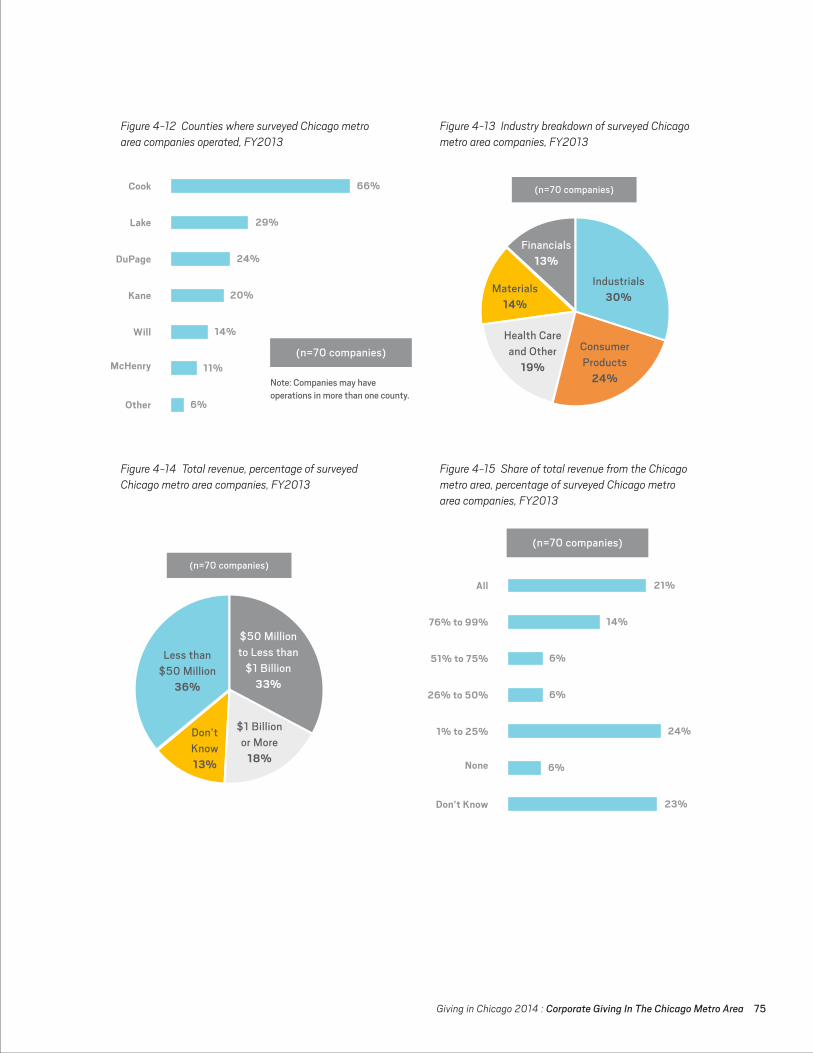
Giving in Chicago 2014 : Corporate Giving In The Chicago Metro Area 75
Figure 4-12 Counties where surveyed Chicago metro area companies operated, FY2013
Figure 4-14 Total revenue, percentage of surveyed Chicago metro area companies, FY2013
Figure 4-13 Industry breakdown of surveyed Chicago metro area companies, FY2013
Figure 4-15 Share of total revenue from the Chicago metro area, percentage of surveyed Chicago metro area companies, FY2013
(n=70companies)
Financials13%
Industrials30%
ConsumerProducts
24%
HealthCareandOther
19%
Materials14%
66%
29%
24%
20%
14%
11%
6%
Cook
Lake
DuPage
Kane
Will
McHenry
Other
(n=70companies)
Note:Companiesmayhaveoperationsinmorethanonecounty.
(n=70companies)
Lessthan$50Million
36%
$50MilliontoLessthan
$1Billion33%
Don’tKnow13%
$1BillionorMore
18%
21%
14%
6%
6%
24%
6%
23%
All
76% to 99%
51% to 75%
26% to 50%
1% to 25%
None
Don’t Know
(n=70companies)
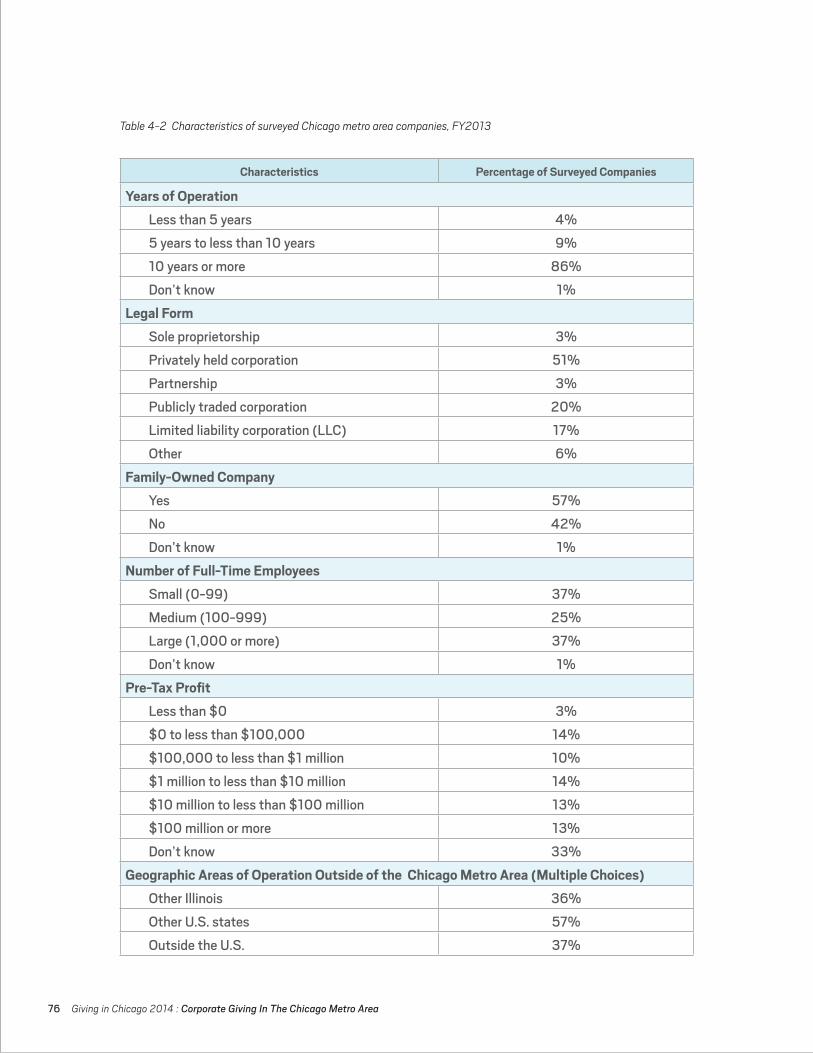
76 Giving in Chicago 2014 : Corporate Giving In The Chicago Metro Area
Table 4-2 Characteristics of surveyed Chicago metro area companies, FY2013
Characteristics Percentage of Surveyed Companies
Years of OperationLessthan5years 4%5yearstolessthan10years 9%10yearsormore 86%Don’tknow 1%Legal FormSoleproprietorship 3%Privatelyheldcorporation 51%Partnership 3%Publiclytradedcorporation 20%Limitedliabilitycorporation(LLC) 17%Other 6%Family-Owned CompanyYes 57%No 42%Don’tknow 1%Number of Full-Time EmployeesSmall(0-99) 37%Medium(100-999) 25%Large(1,000ormore) 37%Don’tknow 1%Pre-Tax ProfitLessthan$0 3%$0tolessthan$100,000 14%$100,000tolessthan$1million 10%$1milliontolessthan$10million 14%$10milliontolessthan$100million 13%$100millionormore 13%Don’tknow 33%Geographic Areas of Operation Outside of the Chicago Metro Area (Multiple Choices)OtherIllinois 36%OtherU.S.states 57%OutsidetheU.S. 37%
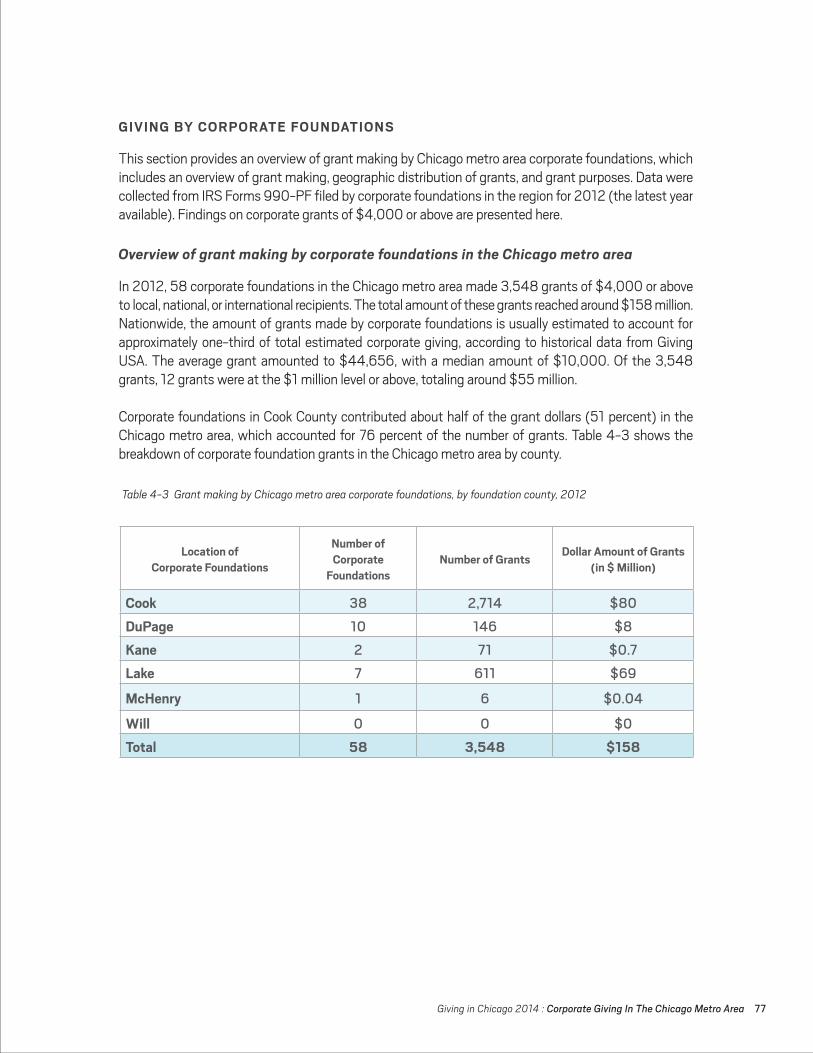
Giving in Chicago 2014 : Corporate Giving In The Chicago Metro Area 77
Table 4-3 Grant making by Chicago metro area corporate foundations, by foundation county, 2012
GIVING BY CORPORATE FOUNDATIONS
This section provides an overview of grant making by Chicago metro area corporate foundations, which includes an overview of grant making, geographic distribution of grants, and grant purposes. Data were collected from IRS Forms 990-PF filed by corporate foundations in the region for 2012 (the latest year available). Findings on corporate grants of $4,000 or above are presented here.
Overview of grant making by corporate foundations in the Chicago metro area
In 2012, 58 corporate foundations in the Chicago metro area made 3,548 grants of $4,000 or above to local, national, or international recipients. The total amount of these grants reached around $158 million. Nationwide, the amount of grants made by corporate foundations is usually estimated to account for approximately one-third of total estimated corporate giving, according to historical data from Giving USA. The average grant amounted to $44,656, with a median amount of $10,000. Of the 3,548 grants, 12 grants were at the $1 million level or above, totaling around $55 million.
Corporate foundations in Cook County contributed about half of the grant dollars (51 percent) in the Chicago metro area, which accounted for 76 percent of the number of grants. Table 4-3 shows the breakdown of corporate foundation grants in the Chicago metro area by county.
Location ofCorporate Foundations
Number ofCorporate
FoundationsNumber of Grants Dollar Amount of Grants
(in $ Million)
Cook 38 2,714 $80DuPage 10 146 $8Kane 2 71 $0.7Lake 7 611 $69
McHenry 1 6 $0.04
Will 0 0 $0Total 58 3,548 $158
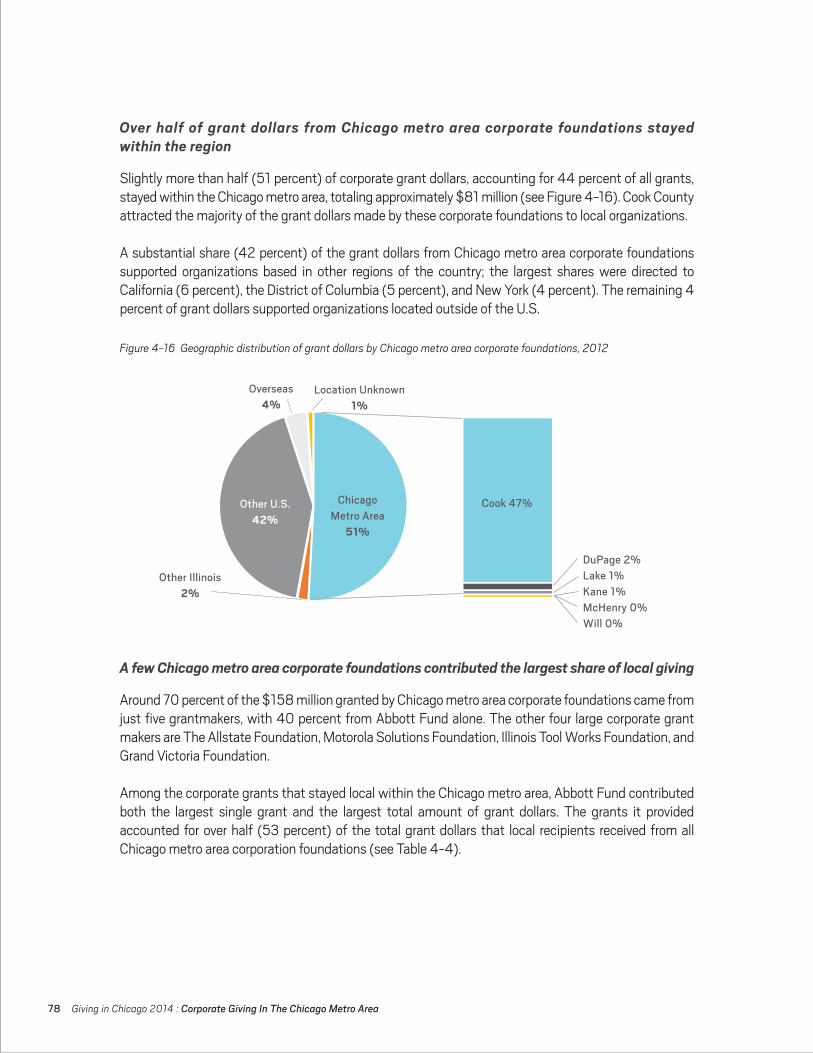
78 Giving in Chicago 2014 : Corporate Giving In The Chicago Metro Area
Over half of grant dollars from Chicago metro area corporate foundations stayed within the region
Slightly more than half (51 percent) of corporate grant dollars, accounting for 44 percent of all grants, stayed within the Chicago metro area, totaling approximately $81 million (see Figure 4-16). Cook County attracted the majority of the grant dollars made by these corporate foundations to local organizations.
A substantial share (42 percent) of the grant dollars from Chicago metro area corporate foundations supported organizations based in other regions of the country; the largest shares were directed to California (6 percent), the District of Columbia (5 percent), and New York (4 percent). The remaining 4 percent of grant dollars supported organizations located outside of the U.S.
A few Chicago metro area corporate foundations contributed the largest share of local giving
Around 70 percent of the $158 million granted by Chicago metro area corporate foundations came from just five grantmakers, with 40 percent from Abbott Fund alone. The other four large corporate grant makers are The Allstate Foundation, Motorola Solutions Foundation, Illinois Tool Works Foundation, and Grand Victoria Foundation.
Among the corporate grants that stayed local within the Chicago metro area, Abbott Fund contributed both the largest single grant and the largest total amount of grant dollars. The grants it provided accounted for over half (53 percent) of the total grant dollars that local recipients received from all Chicago metro area corporation foundations (see Table 4-4).
Figure 4-16 Geographic distribution of grant dollars by Chicago metro area corporate foundations, 2012
Overseas4%
LocationUnknown1%
OtherIllinois2%
DuPage2%Lake1%Kane1%McHenry0%Will0%
ChicagoMetroArea
51%
OtherU.S.42%
Cook47%

Giving in Chicago 2014 : Corporate Giving In The Chicago Metro Area 79
Corporate foundations prioritized community development, human services, and education among local issues
In local grant making, Chicago metro area corporate foundations directed the largest number of grants (31 percent of total number of grants) to human services, while community development received the largest share (50 percent) of grant dollars (see Figure 4-17). Community development, together with human services (16 percent) and education (12 percent), attracted over three-fourths (78 percent) of grant dollars from Chicago metro area corporate foundations’ local giving.
Table 4-4 Top 5 Chicago metro area corporate foundations that gave to local organizations, ranking by dollar amount, 2012
Figure 4-17 Grant dollars made by Chicago metro area corporate foundations to local recipient entities, by grant purpose, 2012 (in $ million)
Foundation County Number of Grants Dollar Amount of Grants (in $ Million)
Abbott Fund Lake 132(8%) $43(53%)Grand Victoria Foundation Cook 85(5%) $6(7%)The Allstate Foundation Cook 72(5%) $5(6%)Illinois Tool Works Foundation Cook 186(12%) $4(5%)The Northern Trust Company Charitable Trust
Cook 162(11%) $4(5%)
Total Local Grants fromthe Top 5 Corporate Foundations 637 (41%) $62 (76%)
Total Local Grants fromChicago Metro Area Corporate Foundations 1,570 (100%) $81 (100%)
Community Development
$41, 50%
Environment & Animals$3, 4%
Human Services$13, 16%
Private Business (Program Expenses)
$1, 1%
Education$10, 12%
Religion$1, 1%
Arts & Culture$8, 10%
Sports & Recreation$0.1, 0%
Health$4, 6%
Multiple Purposes$0.02, 0%
METHODOLOGY
Giving in Chicago 2014 : Methodology 81
The Giving in Chicago study used three different methods to collect data on charitable giving in the Chicago metro area. These included telephone interviews with households about their charitable giving and volunteering in 2013, an analysis of data from IRS Forms 990-PF filed by grantmakers for 2012, and a survey of companies on charitable donations and other community investments in 2013. These methods used to collect data on giving from each type of donors are discussed in the following sections.
HOUSEHOLD GIVING
The primary source of information for the estimate of household giving consisted of telephone interviews regarding household philanthropic activity. The questionnaire was developed by the Indiana University Lilly Family School of Philanthropy (School). Questions asking households about their donations made to each charitable cause were modeled after the Philanthropy Panel Study, which is a national study conducted in conjunction with the Institute for Social Research at the University of Michigan. The use of questions from a field-tested survey is important because it allows for the comparison of data on household charitable giving from the Chicago metro area to the U.S. as a whole.
All telephone interviews conducted in the Chicago metro area originated from random digit dialing, supplemented with a targeted oversample of high net worth households—households with an annual income of $200,000 or more and/or household net worth of $1,000,000 or more. When possible, advance letters introducing the study were mailed to households prior to telephone interviews. An Internet version of the questionnaire was also available to those respondents who preferred to complete the survey online.
The Northern Illinois University Center for Governmental Studies (CGS) conducted all household telephone interviews from August to December 2014. A total of 760 households in the Chicago metro area completed the interview over the phone or online. The effective response rate was 19.2 percent, based on the standard definition (Response Rate 3) developed by the American Association for Public Opinion Research. After data collection, the CGS processed interview data and constructed survey weights based on county, age, education, race, and income, as reported on the 2011-2013 American Community Survey conducted by the U.S. Census Bureau. Survey weights were applied in the analysis to ensure that the final sample of the study was representative of the general population in the Chicago metro area. The confidence interval is +/- 3.6 percentage points at the 95 percent confidence interval.
Data Analysis
Extreme values of dollar amounts donated, which are apt to highly influence average values, are considered as “outliers” in statistical analysis and are excluded from the analysis of amounts of

82 Giving in Chicago 2014 : Methodology
donations. In this study, outliers for giving amounts were identified by examining the distribution of total giving amounts donated by households within their respective income brackets (including less than $50,000, $50,000-$149,999, and $150,000 and above). The mean giving amount and standard deviation were calculated for each income bracket. Every amount that is greater than three standard deviations from the mean was flagged as an outlier. A total of 12 observations were flagged as outliers across the three income brackets—four from the “less than $50,000” income bracket, five from the “$50,000-149,999” income bracket, and three from the “$150,000 and above” income bracket.
Glossary
High net worth households are defined in this study as households with an annual income of $200,000 or more and/or household net worth of $1,000,000 or more.
Definitions of charitable causes
The household interviews asked households about their donations made to each charitable cause. These questions were modeled after the Philanthropy Panel Study, which defines each charitable cause as below.
• Arts and culture refers to organizations that support or promote the arts, culture, or ethnic awareness, such as museums, theatres, orchestras, public broadcasting, or organizations that promote ethnic cultural awareness.
• Basic needs refers to organizations that help people in need of food, shelter, or other basic necessities.
• Combined purposes refers to organizations that serve a combination of purposes, such as United Way, United Jewish Federation, Catholic Charities, or local community foundations.
• Education (other) refers to educational organizations pre-K through 12, after-school programs, public libraries, adult education, and organizations offering educational services.
• Environment and animals refers to organizations that preserve the environment, such as for conservation efforts, animal protection, or parks.
• Health refers to health care or medical research organizations, including those affiliated with universities, such as hospitals, nursing homes, mental health facilities, cancer, heart, and lung associations, or telethons for health purposes.
• Higher education refers to higher educational institutions or activities, such as colleges, universities, university libraries, or scholarship funds.
Giving in Chicago 2014 : Methodology 83
• Neighborhood and community development refers to organizations that improve neighborhoods and communities, such as community centers, Habitat for Humanity, or similar organizations.
• International aid refers to organizations that provide international aid or promote world peace, such as international children’s funds, international disaster relief, or international human rights.
• Religious purposes refers to organizations specifically serving religious purposes or promoting spiritual development, such as churches, synagogues, mosques, TV or radio ministries. Charities run by religious organizations, such as schools, hospitals, or food pantries in a church basement, are not included in this category.
• Youth and family services refers to organizations that cater to the needs of youth and families, such as Boys’ and Girls’ clubs, sports leagues, Big Brothers or Sisters, adoption services or foster care, family counseling, and family violence shelters.
GRANT MAKING
Data on grant making were collected from IRS Forms 990 or 990-PF filed by Chicago metro area foundations and grant making public charities for 2012 (the latest year available). Data on grants of $4,000 or above were obtained from FoundationSearch.com, and were supplemented with information from IRS-Forms 990 or 990-PF. Additional data on the type of grant makers, location of recipient entities, and grant purposes were collected by the Indiana University Lilly Family School of Philanthropy from several databases, including Foundation Center, GuideStar, and the National Center for Charitable Statistics (NCCS) at the Urban Institute, as well as the websites of recipient entities. There were a total of 38,969 grants of $4,000 or above made by 2,038 grant makers located in the Chicago metro area in 2012.
Pass-through grants are usually not considered a part of a foundation’s grant making priorities, but are sometimes reported on Forms 990-PF and thus may be included in the analysis. Additionally, on rare occasions, “double counting” may be included in the analysis. Double counting happens when funding from one foundation to another foundation is redistributed by the recipient foundation to a third party.
Data Coding
The study generally followed the Foundation Center’s definition of grant makers, and coded the type of grant maker based on Foundation Center data and IRS data made available through NCCS. The five types of grant makers included in the study are community foundations, corporate foundations, independent foundations, operating foundations, and public charities. In addition, the study identified family foundations following similar criteria used by the Foundation Center, as there is no legal definition of family foundations. The criteria used to identify family foundations in this study include: 1) independent foundations with “family” or “families” in their names,

84 Giving in Chicago 2014 : Methodology
and with at least one individual listed as trustee; 2) a living donor whose last name matches the foundation’s name; 3) at least two trustees’ last names that match a living or deceased donor’s name; 4) all donors with the same last name; or 5) independent foundations that self-identified as family foundations in Foundation Center’s Foundation Directory Online.
Some grants obtained from FoundationSearch.com did not contain location information for recipient entities. For these grants, the missing location of recipient entities was identified, when possible, through IRS Forms 990 or 990-PF, or the website of recipient entities.
Information on grant purposes in this study generally followed the granting categories of FoundationSearch.com, which includes ten categories: arts and culture, community development, education, environment, health, international giving, religion, social and human services, sports and recreation, and miscellaneous. However, three categories—international giving, religion, and miscellaneous—were recoded in this study based on the specific grant descriptions to better reflect the purposes of grants. When the grant description does not contain specific information, the mission of the recipient entity was used to identify the grant purpose.
In addition, the organizational type of recipient entities was identified through the granting categories of FoundationSearch.com and a keyword search in recipient entities’ names and grant description. Besides nonprofit organizations, three organizational types were coded, including religious groups, governmental agencies, and international organizations.
Glossary
Community foundations are classified by the IRS as 501(c)(3) organizations that fund general charitable purposes in geographically defined communities. Their grant making funds and assets are usually derived from many donors, including individuals, corporations, and other nonprofits. Most community foundations are public charities and the public contributions they receive are eligible for maximum tax deductions.
There is no legal definition of family foundations, but they are independent, private foundations with funds and assets derived from members of a single family. Family members often play a significant role in governing and/or managing the foundation.
Grant making public charities are 501(c)(3) public charities that also engage in grant making activities.
Independent foundations are primarily classified as private grant making foundations. Independent foundations encompass family foundations, special purpose foundations, and private nonoperating foundations.
Giving in Chicago 2014 : Methodology 85
Operating foundations are classified by the IRS as private foundations with a primary purpose to fund their own activities and programs other than grant making. Operating foundations may make some grants to other organizations.
Recipient entities refer to all types of organizations receiving grants from foundations and grant making public charities, which may include nonprofit organizations, religious groups, or government agencies.
Definitions of grant purposes
Mostly following the definitions of granting categories by FoundationSearch.com, the grant purposes in this study are defined below.
• Arts and culture refers to the processes or products that involve a wide range of human activities, and creations and modes of expression, including painting, music, literature, film, theater, museums, cultural exchanges, or historic society.
• Community development refers to practices, processes, or disciplines concerned with improving and developing both local and broader communities where people live, work and play, including civil rights, social change, economic development, homeland security, or political reform.
• Education refers to processes, products, and experiences involved with transmitting accumulated knowledge, skills and values from one group to another—for example, higher educational institutions, K-12 schools, libraries, tutoring programs, or student scholarships.
• Environment and animals refers to practices, processes, products or people concerned with the external conditions or surroundings where people live, work and play, including animal-related or ecological system-related activities.
• Health refers to practices, processes, disciplines, or individuals concerned with treating, maintaining, or improving the physical and mental well-being of people. Medical research is also included in this category.
• Human services refers to activities or services to promote human welfare; to advance social work, social change, and social justice; to improve quality of life; and to develop the potential of each individual, group, and community within a society.
• Multiple purposes refers to a single grant serving more than one purpose.
• Private business (program expenses) refers to expenses for program or service provision.
• Religion refers to practices, activities, disciplines, or people involved with specific faiths or belief systems.
• Sports and recreation refers to practices, activities, disciplines, services or people involved with specific physical activities, sports, or hobbies done for leisure or fun.
86 Giving in Chicago 2014 : Methodology
CORPORATE GIVING
Two methods were used to collect data on corporate giving in the Chicago metro area. First, the study collected data from a survey of companies with operations in the region. Second, the study examined data from IRS Forms 990-PF filed by Chicago metro area corporate foundations that made grants of $4,000 or above during 2012 (the latest year with available data).
The survey sought information on company’s charitable giving and other types of community investments. Questions on corporate giving strategies and business characteristics were also included in the survey. The questionnaire was developed by the Indiana University Lilly Family School of Philanthropy (School).
The Northern Illinois University Center for Governmental Studies (CGS) fielded the mail survey from September to December 2014. A total of three mailings were sent to companies. The first mailing included a letter of invitation, the survey questionnaire, and instructions for responding by mail in a postage-paid envelope, via fax, or via a web version of the survey. This questionnaire packet was sent to a stratified random sample of 3,000 companies with operations in the Chicago metro area by size (i.e., the number of employees), including an oversample of large public and private companies (i.e., companies with 500 or more employees). Approximately 4 percent of these mailings were undeliverable. The remaining two mailings included a postcard reminder. Three follow-up reminders were also sent via email to large companies in the sample. A total of 70 companies completed the survey by mail or online. A profile of these companies is presented in the Corporate Giving section of the report (see page 74).
The analysis of grant making by corporate foundations was based on data from IRS Forms 990-PF filed by Chicago metro area corporate foundations for 2012 (the latest year available). Data on grants of $4,000 or above were obtained from FoundationSearch.com, and were supplemented with information from IRS-Forms 990-PF. Additional data on the type of foundations, location of recipient entities, and grant purposes were collected by the School from several databases, including Foundation Center, GuideStar, and the National Center for Charitable Statistics at the Urban Institute, as well as the websites of recipient entities. The study included a total of 3,548 grants of $4,000 or above made by 58 corporate foundations located in the Chicago metro area in 2012.
Glossary
Corporate foundations (or company-sponsored foundations) derive their assets primarily from the contributions of for-profit companies and usually maintain close ties with the company. They are independent legal organizations with an endowment of their own and are subject to the same rules and regulations as applied to other private foundations.
Giving in Chicago 2014 : Methodology 87
Charitable giving refers to charitable donations of cash, products, or services made to nonprofit organizations as noted in the survey of corporate giving.
Community investments refers to charitable donations and other types of community investments including employee volunteerism, sponsorships, cause-related marketing, impact investing, and other initiatives to address social needs in communities.
Definitions of charitable areas
The corporate survey asked companies about the areas of their charitable giving. Most of these charitable areas share the same definitions of charitable causes as noted in the household interviews of the study. These areas include:
• Arts and culture• Combined purposes• Education (other)• Environment and animals• Health• Higher education• Religious purposes
The other charitable areas are defined mainly following the National Taxonomy of Exempt Entities-Core Codes (NTEE-CC) as below.
• Disaster preparedness, relief, and recovery refers to activities for disaster preparedness, relief, and recovery domestically or internationally.
• Human services includes organizations offering a broad range of programs and social services such as food, agriculture and nutrition programs, housing and shelters, youth and family services, recreation and sports, employment training, public safety, and crime prevention. Some large organizations, such as the Salvation Army and the American Red Cross, are included in this category.
• International (nondisaster) refers to organizations or activities focusing on international issues such as international development, promotion of international understanding or international peace, advocacy for international human rights, and research in foreign policy.
• Public and society benefit includes organizations working on several major types of causes, including civil rights, social action and advocacy, community improvement and capacity building, research in science and technology, public transportation and telecommunication services, public policy research, consumer protection, and other issues related to public benefits.
88 Giving in Chicago 2014 : Methodology
ESTIMATES OF TOTAL DONATIONS FROM THE CHICAGO METRO AREA
The estimate for total donations by Chicago metro area households was based on data from the household interviews conducted as a part of this study and the 2012 IRS individual income tax return data (the latest year with available data). For households with annual income less than $100,000, their total giving amount was estimated with data on household giving in 2013 collected from the household interviews, with survey weights applied (including outliers). For households with annual income of $100,000 or above (including high net worth households), the 2012 IRS data (inflation-adjusted for 2013 dollars) were used to estimate the total donation amount. IRS data were included to ensure that estimated giving by high-income households is representative of the metro area. The household interviews included a relatively small sample of households at this income level, compared to the general population in the Chicago metro area. IRS data from three ZIP Codes in the Chicago metro area were excluded from the analysis, because only a small portion (less than 10 percent) of these ZIP Codes falls in the six counties of the region.
The total grant dollars from foundations and grant making public charities (excluding corporate foundations) were estimated with data from IRS Forms 990 and 990-PF made available through several databases. Grants of $4,000 or above made by all types of grantmakers (excluding corporate foundations) in the Chicago metro area in 2012 (the latest year with available data) were included in the estimate.
The total amount of corporate giving was estimated with the grant dollars from Chicago metro area corporate foundations. The study collected data on corporate giving practices and strategies from a survey of 70 companies with operations in the region; however, this survey sample may not be representative of all companies in the region. Grants of $4,000 or above made by corporate foundations in 2012 were collected from IRS Forms 990-PF made available through several databases, which offers a more complete picture of grant making by corporate foundations. Nationwide, the dollar amount of grants made by corporate foundations is usually estimated to account for approximately one-third of total estimated corporate giving, according to historical data from Giving USA. Therefore, this method was used in the study to estimate the total corporate giving.


To download the full report, visit www.givinginchicago.com.
Indiana University Lilly Family School of Philanthropy550 West North Street, Suite 301Indianapolis, IN 46202317-274-4200www.philanthropy.iupui.edu
The Chicago Community Trust225 North Michigan Ave., Suite 2200Chicago, IL 60601312-616-8000www.cct.org