GitLab Prometheus
19
GitLab x Prometheus デプロイアプリのPerformance測定 Shingo.Kitayama 2017/11/17 GitLab Meetup Tokyo #5 https://gitlab-jp.connpass.com/event/69475/
-
Upload
shingo-kitayama -
Category
Technology
-
view
741 -
download
1
Transcript of GitLab Prometheus

GitLab x PrometheusデプロイアプリのPerformance測定Shingo.Kitayama 2017/11/17
GitLab Meetup Tokyo #5https://gitlab-jp.connpass.com/event/69475/

IntroductionGitLab x Prometheus
2
日本ヒューレット・パッカード株式会社
テクニカルアーキテクト・オープンソースソリューションの提案・コンサルティング、および構築デリバリーを担当
Now on Sale

IntroductionITmediaエンタープライズ 連載中
3
変化を拒むおっさんに喝をいれる連載執筆中!!
お仕事の息抜き&気分転換にご覧ください。
本日のIndexGitLab x Prometheus
4
1. とりあえず理解するPrometheus
2. GitLabとPrometheusの連携
3. アプリパフォーマンス監視
1. とりあえず理解するPrometheus
5
- What’s Prometheus -

Prometheusとはオープンソースの軽量サービス監視ツール
6https://qiita.com/tnir/items/7dd63b7baa4299135194
パフォーマンスデータの収集やグラフの表示、アラートなどの通常監視機能に加え、クエリを利用して、CPUの負荷やメモリ、ストレージの利用率、HTTPのレイテンシなどのメトリクスを計算しグラフ化することも可能。
- Pull型監視 -
監視対象Prometheus
管理サーバ側から管理対象に情報をリクエストし、ステータスを収集する方法。監視対象を完全にコントロールできる反面、監視対象ホストが増えるたびに管理サーバの設定ファイルを更新する必要があります。
情報収集
リクエスト

Prometheusの仕組みPrometheus Architecture
7
監視対象 Prometheus Server
Retrieval PromQL
ローカルストレージ
Storage
監視対象プロセス
Exporter
情報収集
リクエスト
ジョブプログラム PushGateway
リクエスト情報収集
情報送信
Alertmanager
Web UI
・ Grafana・ API Client
アラート送信
mailslackwebhook
ExpressionBrowser
『メトリクスの収集/格納』
『アラートの通知』
『クエリの返答』
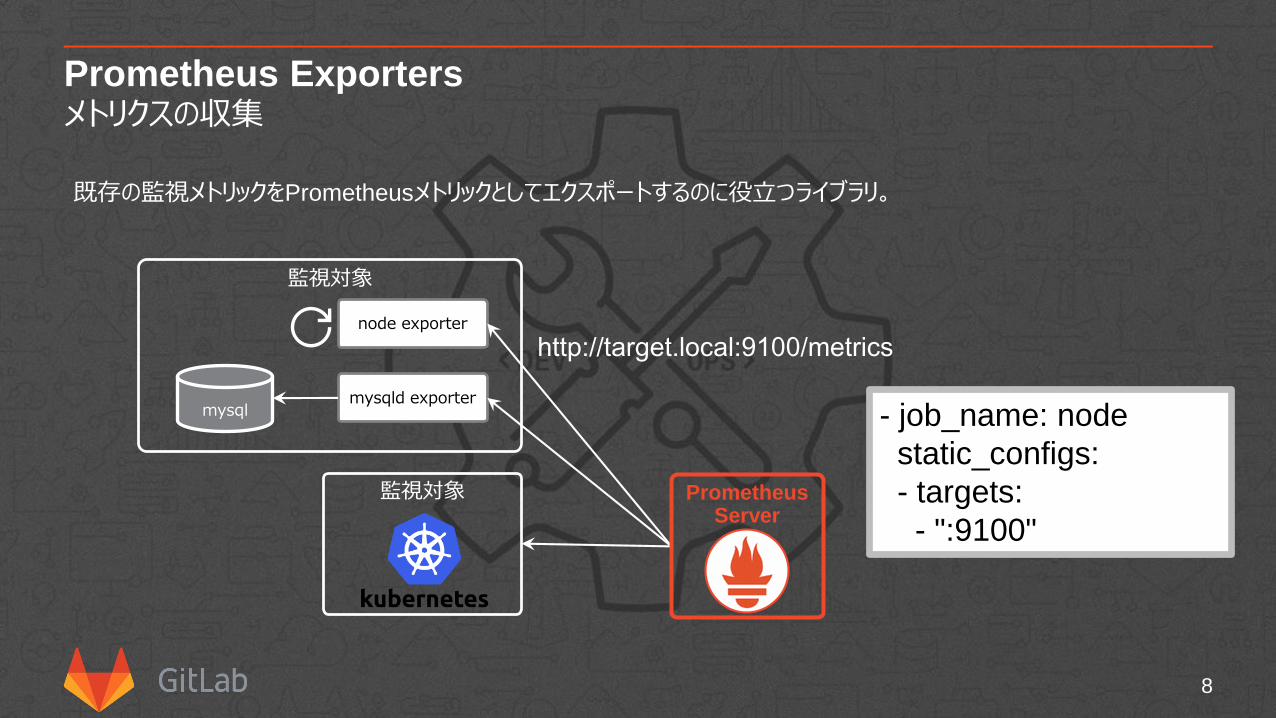
Prometheus Exportersメトリクスの収集
8
監視対象
node exporter
mysqld exportermysql
監視対象
既存の監視メトリックをPrometheusメトリックとしてエクスポートするのに役立つライブラリ。
http://target.local:9100/metrics
- job_name: node
static_configs:
- targets:
- ":9100"
PrometheusServer

2. GitLabとPrometheusの連携
9
- Prometheus within GitLab -
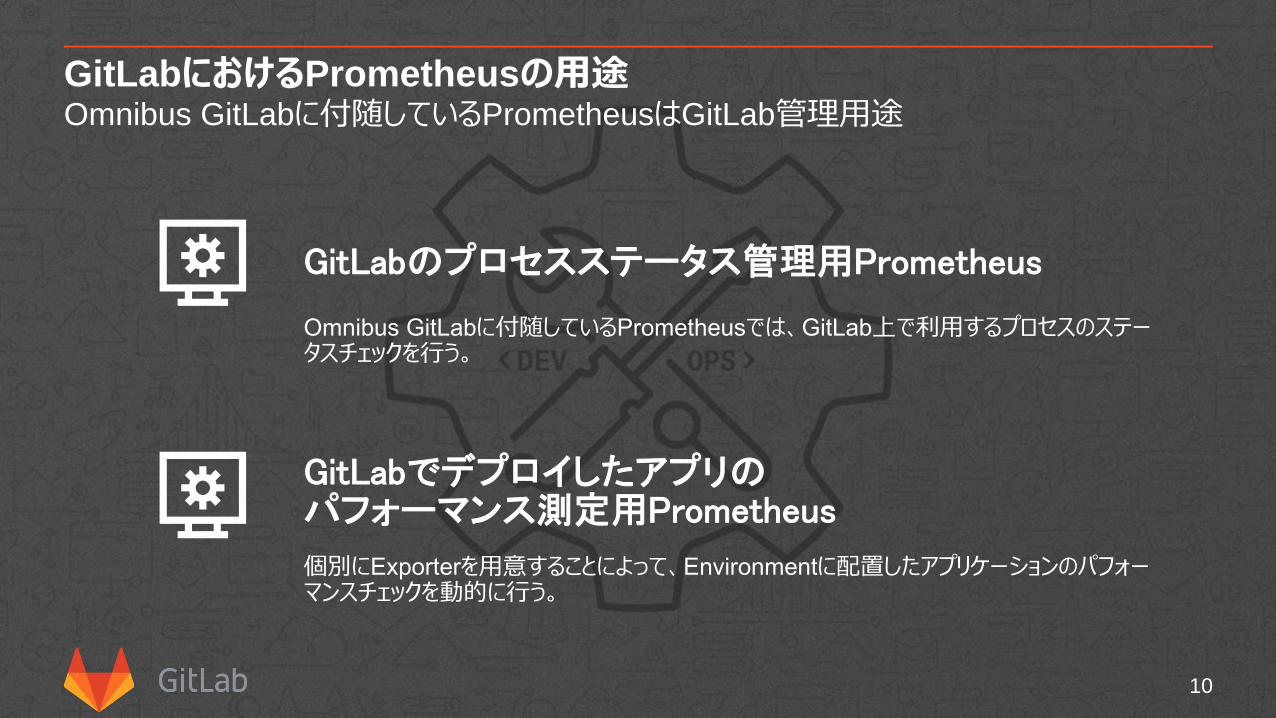
GitLabにおけるPrometheusの用途Omnibus GitLabに付随しているPrometheusはGitLab管理用途
10
GitLabのプロセスステータス管理用Prometheus
GitLabでデプロイしたアプリのパフォーマンス測定用Prometheus
Omnibus GitLabに付随しているPrometheusでは、GitLab上で利用するプロセスのステータスチェックを行う。
個別にExporterを用意することによって、Environmentに配置したアプリケーションのパフォーマンスチェックを動的に行う。
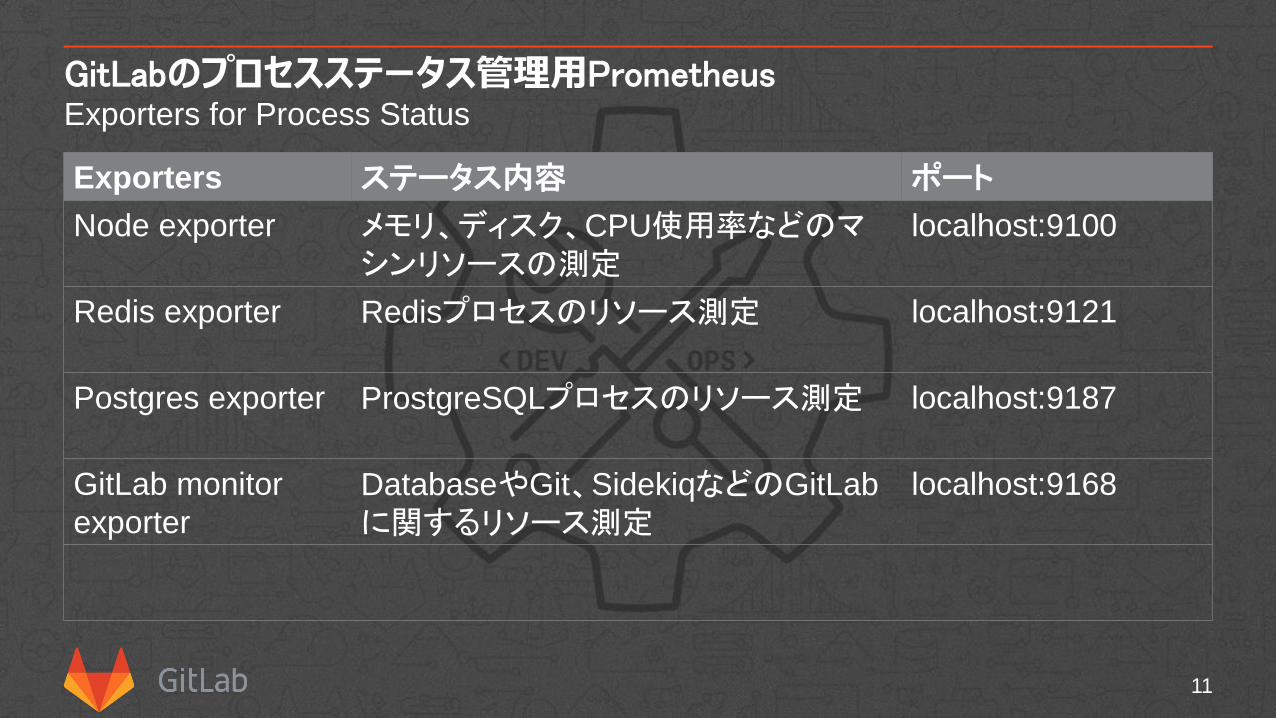
GitLabのプロセスステータス管理用PrometheusExporters for Process Status
11
Exporters ステータス内容 ポート
Node exporter メモリ、ディスク、CPU使用率などのマシンリソースの測定
localhost:9100
Redis exporter Redisプロセスのリソース測定 localhost:9121
Postgres exporter ProstgreSQLプロセスのリソース測定 localhost:9187
GitLab monitor
exporter
DatabaseやGit、SidekiqなどのGitLab
に関するリソース測定localhost:9168
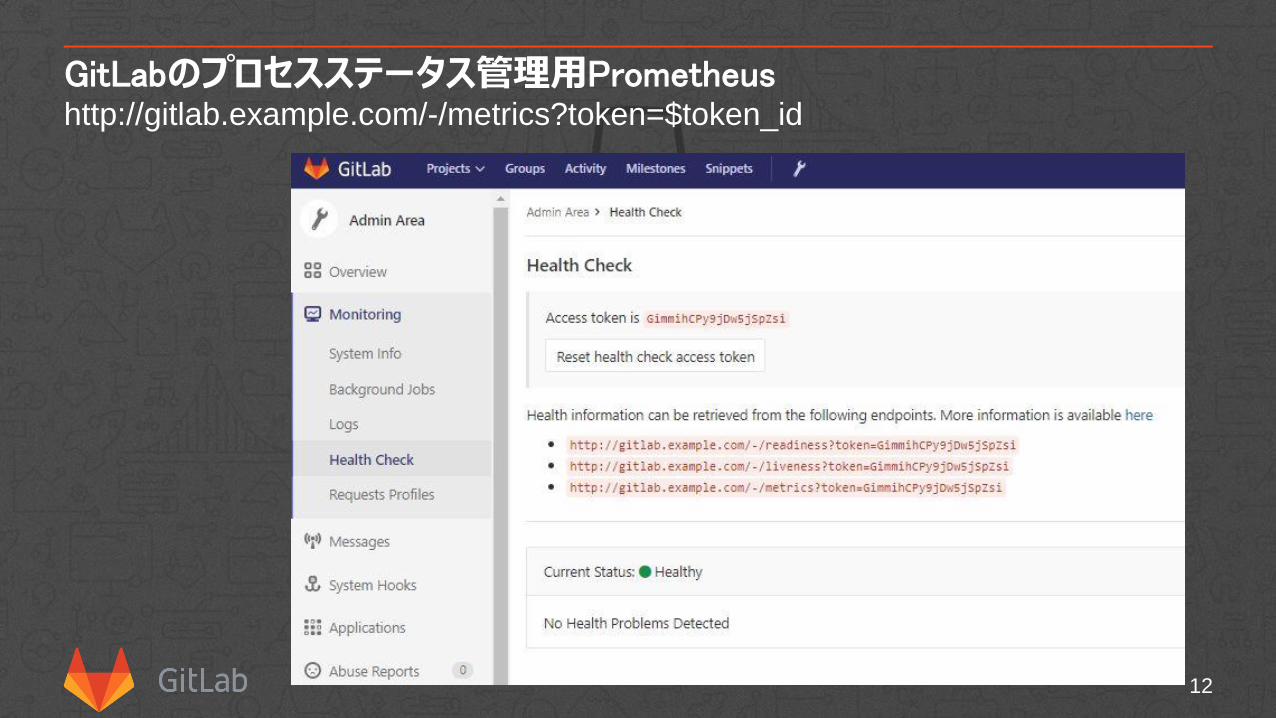
GitLabのプロセスステータス管理用Prometheushttp://gitlab.example.com/-/metrics?token=$token_id
12
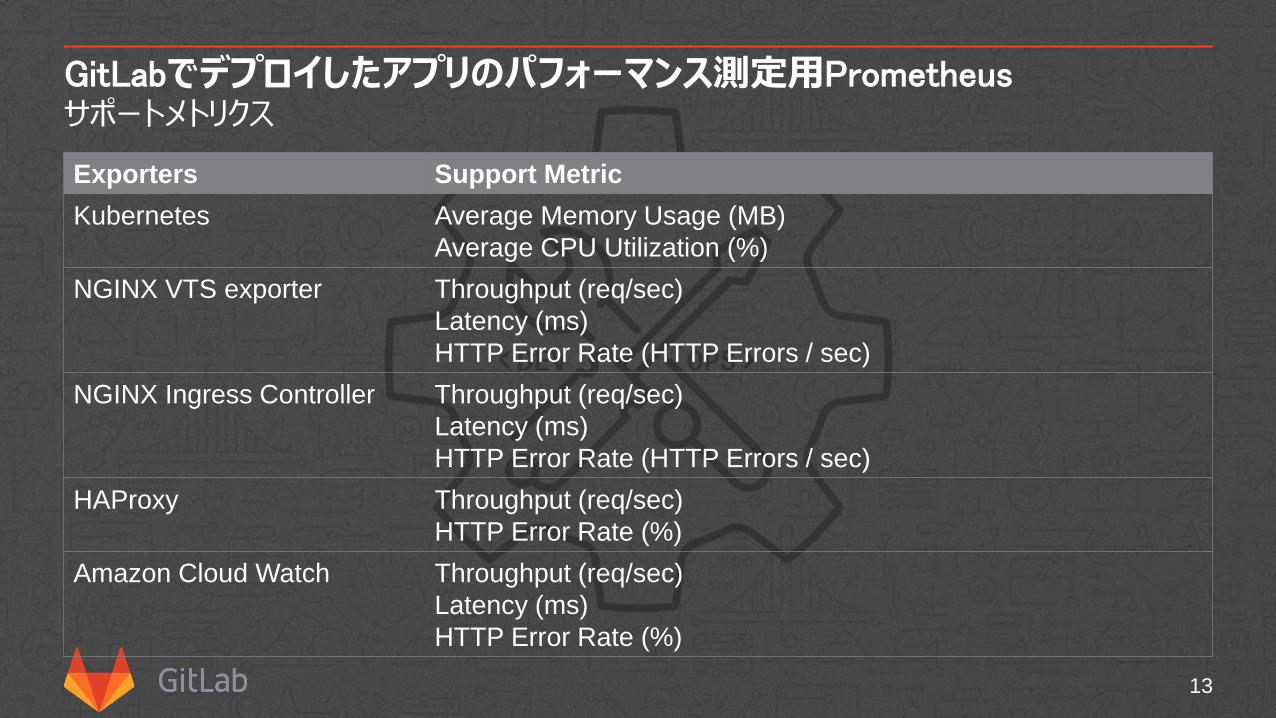
GitLabでデプロイしたアプリのパフォーマンス測定用Prometheusサポートメトリクス
13
Exporters Support Metric
Kubernetes Average Memory Usage (MB)
Average CPU Utilization (%)
NGINX VTS exporter Throughput (req/sec)
Latency (ms)
HTTP Error Rate (HTTP Errors / sec)
NGINX Ingress Controller Throughput (req/sec)
Latency (ms)
HTTP Error Rate (HTTP Errors / sec)
HAProxy Throughput (req/sec)
HTTP Error Rate (%)
Amazon Cloud Watch Throughput (req/sec)
Latency (ms)
HTTP Error Rate (%)
3. アプリパフォーマンス監視
14
- Performance Monitoring -
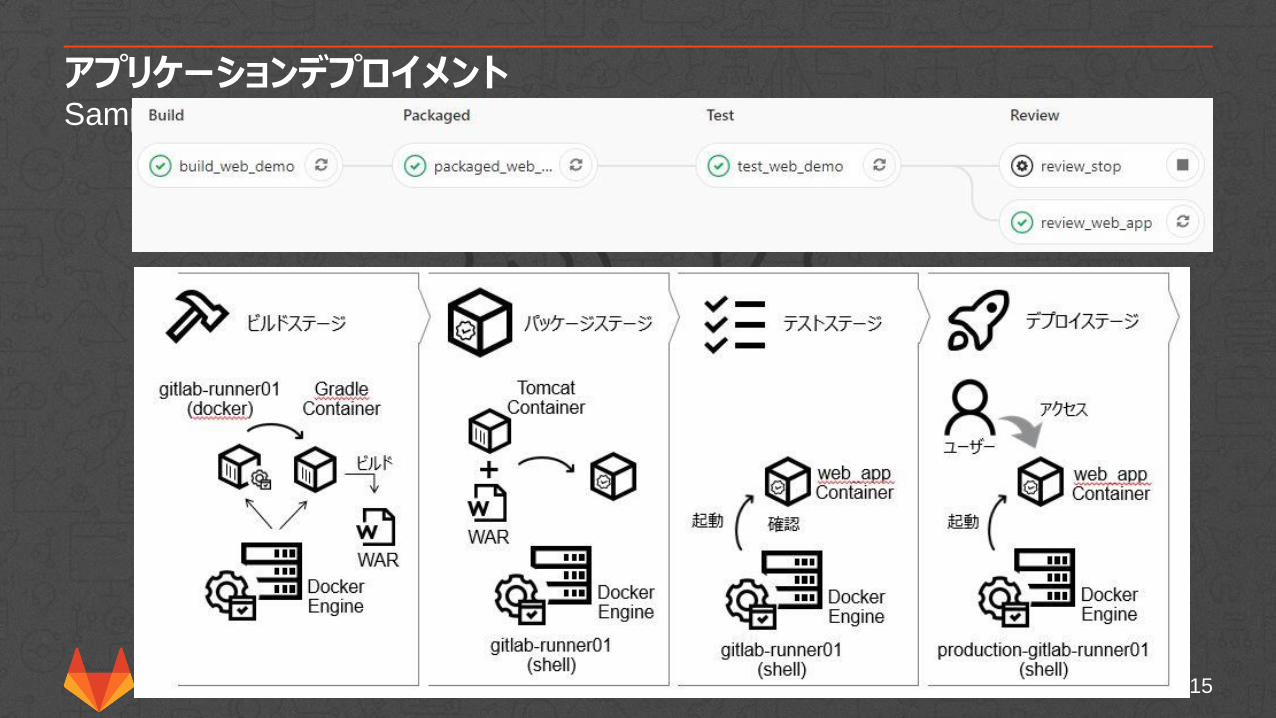
アプリケーションデプロイメントSample Application
15
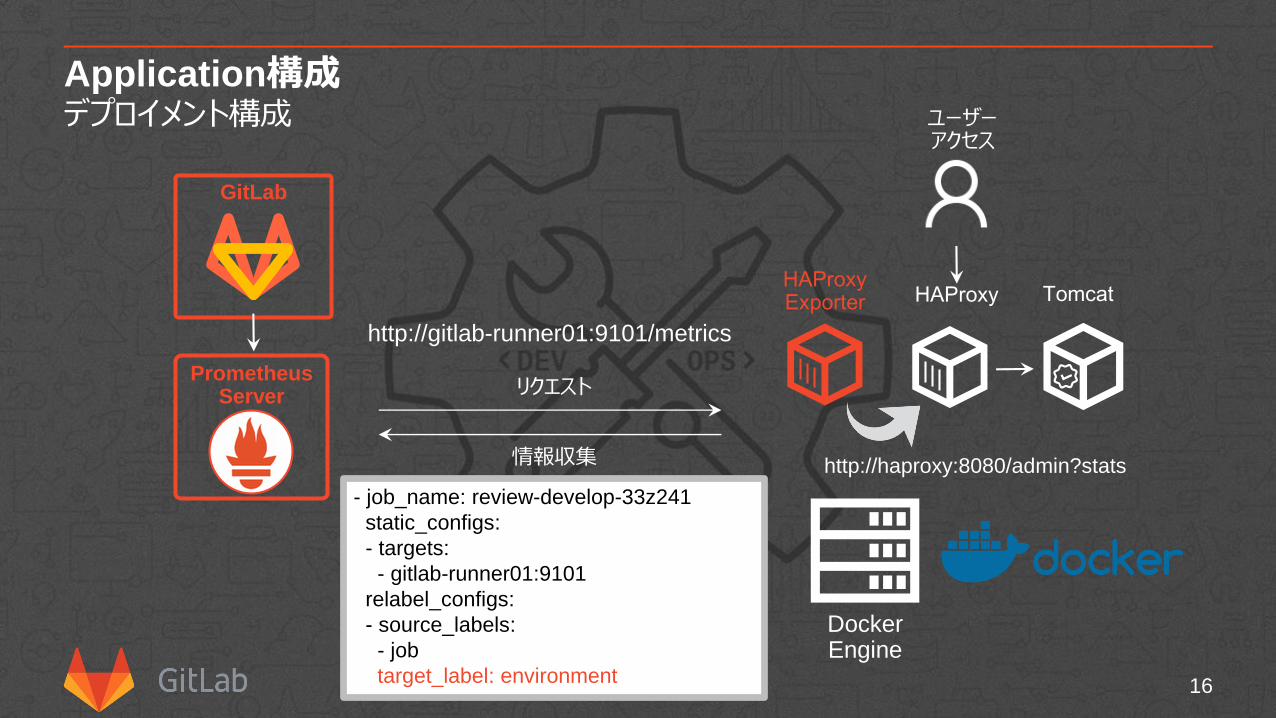
Application構成デプロイメント構成
16
DockerEngine
PrometheusServer
GitLab
情報収集
リクエスト
http://haproxy:8080/admin?stats
HAProxyExporter
http://gitlab-runner01:9101/metrics
HAProxy Tomcat
ユーザーアクセス
- job_name: review-develop-33z241
static_configs:
- targets:
- gitlab-runner01:9101
relabel_configs:
- source_labels:
- job
target_label: environment
Demo
17
でも(時間があったら

Environment Monitoring$CI_ENVIRONMENT_SLUG
18
Environment = $CI_ENVIRONMENT_SLUG
19
Thank you