GIS Based Risk Analysis – Simplifying the Risk Assessment...
34
GIS Based Risk Analysis – Simplifying the Risk Assessment Process David Adler Principal Engineer – System Integrity NiSource Gas Transmission and Storage John Beets Principal GIS Technologist Willbros Engineering
Transcript of GIS Based Risk Analysis – Simplifying the Risk Assessment...

GIS Based Risk Analysis – Simplifying the Risk Assessment Process
David Adler
Principal Engineer – System Integrity
NiSource Gas Transmission and Storage
John Beets
Principal GIS Technologist
Willbros Engineering

NiSource Gas Transmission and Storage • Serve 16 states
• Over 15,000 miles of natural gas pipeline from the Gulf Coast to New York
• One of the largest underground storage systems in North America
• Headquarters in Houston
• Significant presence in Charleston WV, including some engineering and most GIS personnel
2

Some of the System is Long-Haul
• Hundreds of miles of pipe that look just like the previous mile
• Multiple pipelines in a single right-of-way
• Common characteristics
and threats (e.g. age, material, coating)
• Close to 100% “piggable” –
probably the best data gathering method
3

Some of the System Looks More Like an Oversize Distribution Company
• Very little is standard
• Lots of single feeds to towns and small cities
• Unique characteristics and threats (e.g., age, material, coating)
• Most lines not piggable; reduced ability to directly gather information
• Greater challenge to manage risk
4

Assignment: Effectively Manage Risk
Likelihood of Failure
x Consequence of Failure
Risk
• Likelihood is a measure of threats to the pipeline
• Consequence could be Public Safety, Environmental, or Financial
“An effective program leads to
regulatory compliance”
5
Pig Island J Percy Priest Lake

“Effective” Risk Management: Ancient History
Resource Allocation: Who can do the best job of describing why their project is most important to the company’s future?
No definitive basis for objective, risk-based decision making.
6

Effective Risk Management: First Real Efforts (1990s)
Pre-determined, relevant questions, but still generic:
• Is the project required by regulation? • Does it improve public and/or employee safety? • Does it improve system reliability? • Does it improve the company’s bottom line?
This change broke up the “big story” into smaller parts that could be more easily examined. Represented the first shot at finding a common basis for evaluating large projects.
7

Effective Risk Management: Regulations Come Into Effect (2002 – 2003) • Set expectations for Integrity Management Program • Set timelines for certain activities • Required Pipeline Operators to Identify the threats
that applied to various portions of their system
• Required regular assessments of pipelines (in the highest consequence areas) using a method that ensures safety in light of the identified threats
External Corrosion Internal Corrosion Stress Corrosion Cracking
Mechanical Damage Manufacturing/Materials Construction
Weather / Outside Forces Equipment Malfunction Incorrect Operations
8

Effective Risk Management: Subject Matter Experts (SMEs) Develop
Data Element Spreadsheet (2003 - 2005)
Pros Cons • Time consuming – 100 man days
to run risk
• No dynamic segments - Risk based on “combined worst-case scenario” in each HCA
• Difficult to update
• No evaluation of facilities outside HCAs
• 104 Questions on threats to our facilities in the most highly developed areas
• For 1000 HCAs = 104,000 questions asked
• Risk team learned a lot about the system and our field employees
• Field employees learned a lot about risk concepts
• Data was gathered from front-line employees’ brains
• Data quality improvements were made to our GIS
But we finally had a uniform way to evaluate risk
across the “High Consequence” parts of our company! 9
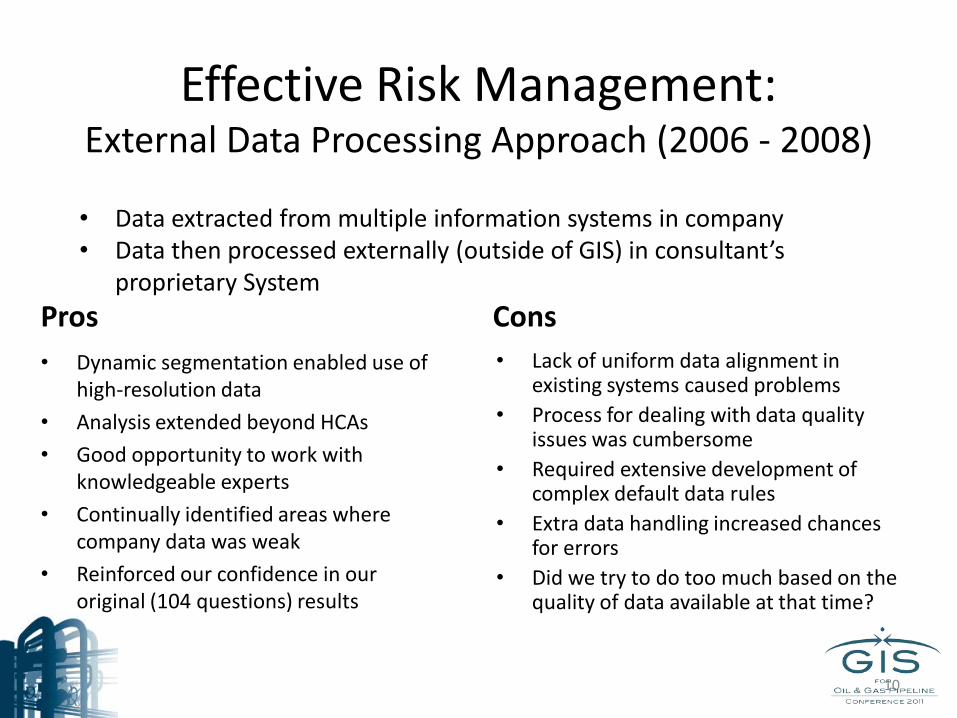
Effective Risk Management: External Data Processing Approach (2006 - 2008)
Pros Cons • Lack of uniform data alignment in
existing systems caused problems • Process for dealing with data quality
issues was cumbersome • Required extensive development of
complex default data rules • Extra data handling increased chances
for errors • Did we try to do too much based on the
quality of data available at that time?
• Data extracted from multiple information systems in company • Data then processed externally (outside of GIS) in consultant’s
proprietary System
• Dynamic segmentation enabled use of high-resolution data
• Analysis extended beyond HCAs
• Good opportunity to work with knowledgeable experts
• Continually identified areas where company data was weak
• Reinforced our confidence in our original (104 questions) results
10

GIS History
• Initial GIS development at NiSource was in an Intergraph FRAMME environment
• Migration to ESRI ArcGIS Pipeline Data Model (APDM) based solution in late 2004, completed in 2005
• Currently utilizing an APDM 5.0 Geodatabase
• Late 2009 decision – Risk solution to be tightly integrated with enterprise GIS

Risk Model
Risk = (Likelihood of Failure) x (Consequence of Failure)
or (D x R x I x P x Interactive) x (Consequence)
• D = Drivers (e.g., pipe age)
• R = Resistors (e.g., coating type)
• I = Indicators (e.g., pig (ILI) indications)
• P = Preventors (e.g., ILI year)

Current (GIS) Risk Solution
Most successful risk process to date • System designed from ground up around data available in the
enterprise GIS
• 80 + input variables
• GIS based tools for processing key datasets (such as ILI anomaly data and habitable structures)
• Dynamic segmentation
- GIS based tools readily available
- Provides results at highest resolution available
• Fast turn around (if no changes to algorithm)

Current (GIS) Risk Solution Risk Data Flow:

Current (GIS) Risk Solution
Pros of a GIS based solution: • Flexibility – NiSource controls software functions and resulting
solution capabilities • Requires no data translation – operates directly against APDM GIS
database • Readily available spatial analysis functions increase the processing
capabilities of the solution • Open solution provides flexible access to other data sources:
- Other company sources - Third-party data (RexTag, ESRI data appliance) - Public domain data sources (FEMA flood, National Highway
Performance Monitoring System)

Current (GIS) Risk Solution
Cons of a GIS based solution: • Flexibility – Easy to make changes, so the temptation to change must
be controlled – or the risk results will always be changing
• Suggest once a year updates to algorithm, with archiving
• ArcGIS expertise is required to work through issues that may arise
• Our set-up works well – an engineer familiar with pipeline threats plus a GIS expert (Company / Consultant / Both)
• End user tools not yet readily available within ArcGIS (custom reporting, web access, scenario development, etc.)
• We are using a third-party end user solution, with typical integration challenges – thankfully everyone works well together

Current (GIS) Risk Solution
System components – software processing tools 1. ArcGIS 9.3 – APDM 5.0
2. Geo-Processing Tools (GPT) – Eagle Information Mapping
3. Python scripting
System components – end user tools 1. Geonamic web-based dashboard, reporting and scenario
development (under implementation)
2. Alignment sheet generation
3. ArcGIS display and map generation
4. Export to Excel, Access (MS Office based tools)

Current (GIS) Risk Solution
System processing sequence:
1. Extract and generate feature classes
2. Process ILI and other survey data to obtain affected pipeline range and date of survey
3. Perform GIS based polygon overlay analysis (external data) – FEMA flood data
– Ground stability
– Ground acceleration (seismic)
– Lightning strikes
– Odorization (based on counties)

Current (GIS) Risk Solution
System processing sequence (continued)
4. Potential Impact Circle (PIC) calculations - Population (residential, limited mobility, 4 story building, etc.) - Railroads - Foreign pipelines - Refineries, chemical plants, power plants, etc. - High traffic areas
5. Application of point feature data to linear pipeline - Unauthorized encroachments - Leaks - Equipment counts - ILI anomalies - CP test results

Current (GIS) Risk Solution
System processing sequence (continued)
6. Off line features encroaching on pipeline – Foreign pipelines
– Electric transmission lines
– Transportation features (roads, railroads, navigable waterways)
7. Resolve linear feature overlap (timing) – Coating
– Strength tests
– Line cleaning and treating
– ILI
– ROW Maintenance

Current (GIS) Risk Solution
System processing sequence (continued)
8. Dynamic Segmentation – 47 linear features
9. Risk Algorithm Calculations – Weightings lookup
– Core calculations
– Interactive threats
10. Results upload to APDM

Structure Processing Structure unit counts within PIR
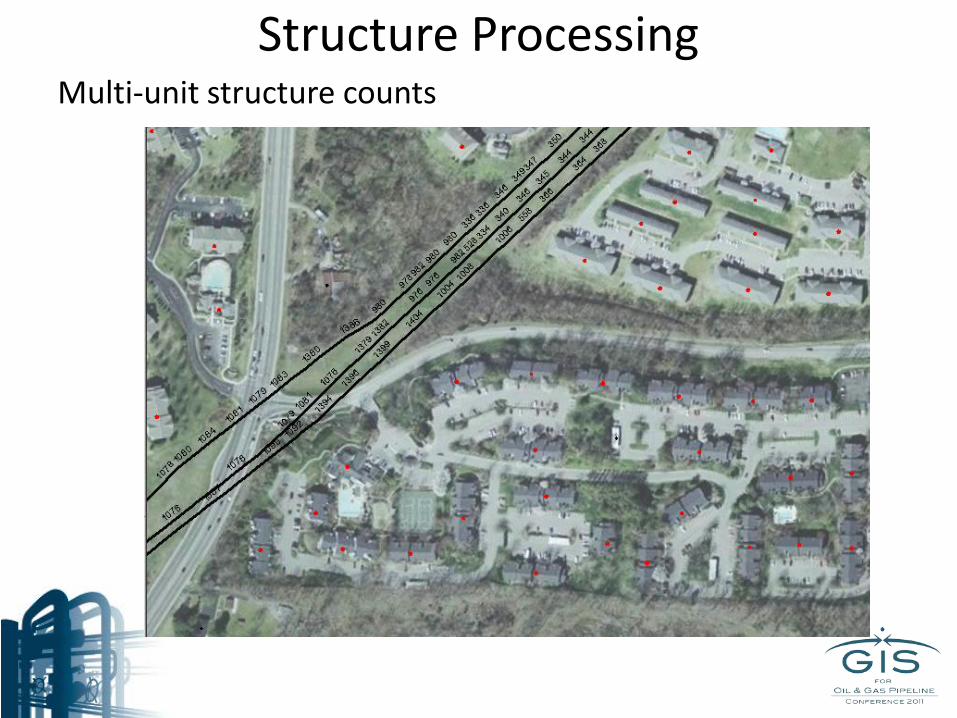
Structure Processing Multi-unit structure counts

Unauthorized Encroachments Within 1,000 feet of pipeline –
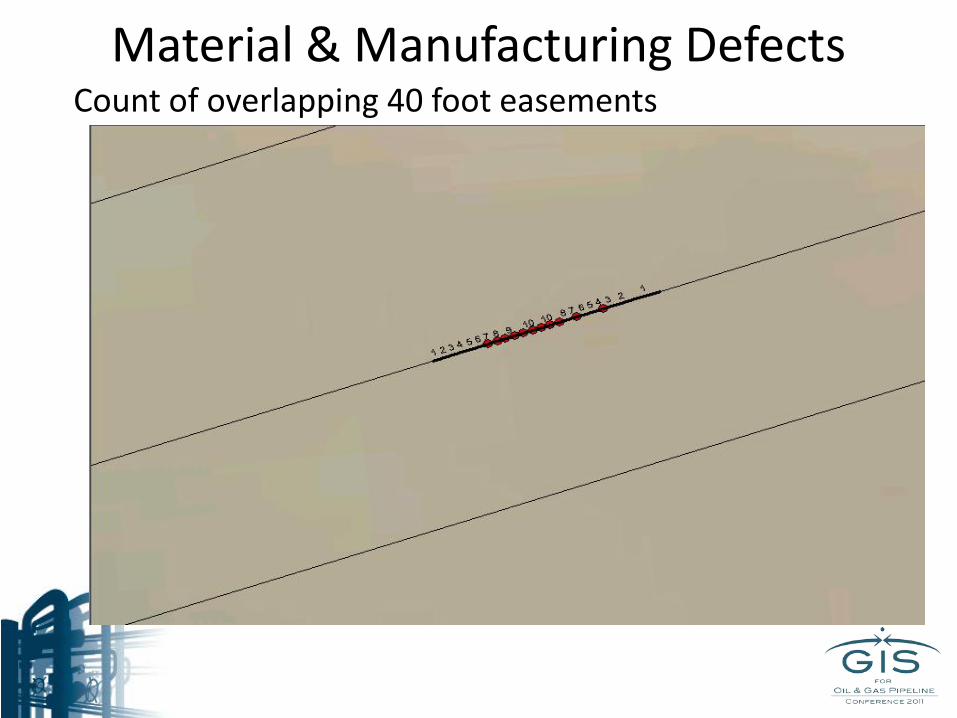
Material & Manufacturing Defects Count of overlapping 40 foot easements

3rd Party Crossings & Encroachments Within 100 foot buffer of pipeline

Highway Performance Monitoring System Highway segments within potential impact circle

Consequence Factor in Risk Results Structure density

Likelihood of Failure Factor - Risk Results External corrosion

Total Risk Results Main Drivers: Public safety, materials & manufacturing, internal corrosion

Total Risk Results Main Drivers: Public safety, materials & manufacturing, internal corrosion

Total Risk Results Main Drivers: Public safety, materials & manufacturing, internal corrosion

Total Risk Results Main Drivers: Public safety, materials & manufacturing, internal corrosion

GIS Based Risk Assessment Summary: 1. Risk integration with GIS makes sense
– Simplified data access – Powerful spatial analysis tools – Flexible map presentation tools – Flexibility to recognize and adapt to a changing environment:
• Ability to quickly adapt to changing risk factors across a dynamic system
• Ability to refresh risk results quickly as changes occur across the system
2. Lessons learned – Data availability & accuracy a primary constraint – Need readily available location information in other systems
(Maximo)