GIS-Based Preliminary Seismic Hazard Identification...
5
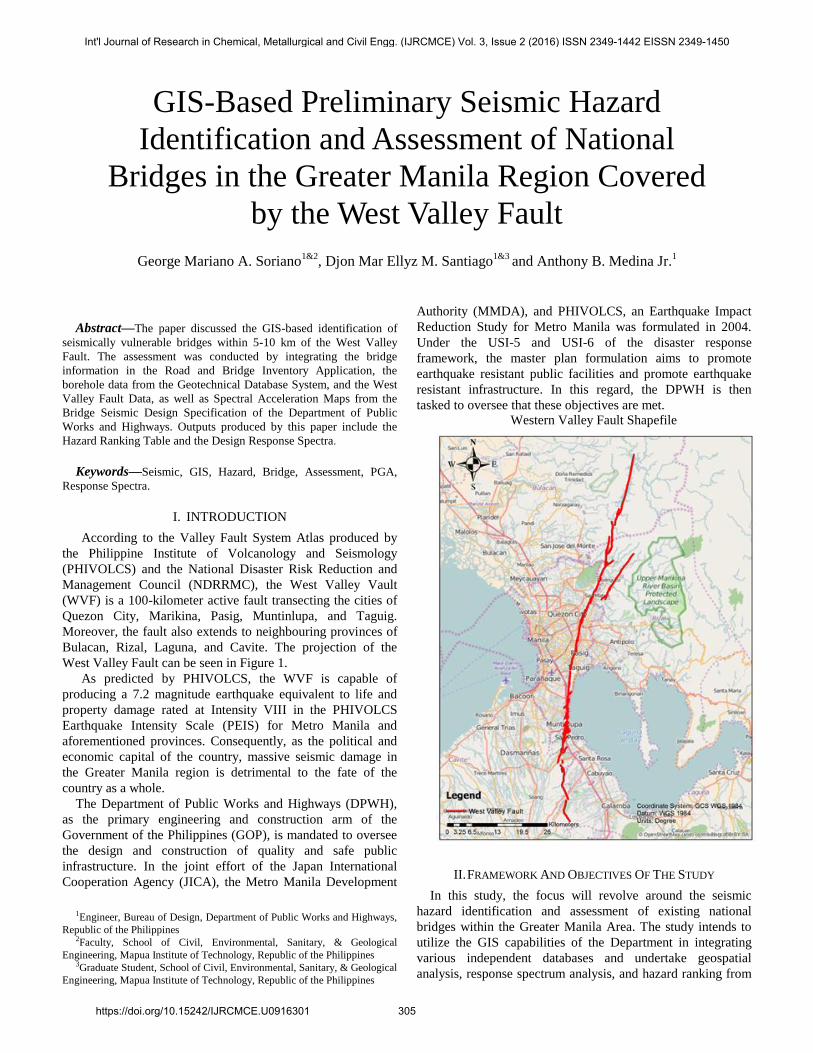
Abstract—The paper discussed the GIS-based identification of seismically vulnerable bridges within 5-10 km of the West Valley Fault. The assessment was conducted by integrating the bridge information in the Road and Bridge Inventory Application, the borehole data from the Geotechnical Database System, and the West Valley Fault Data, as well as Spectral Acceleration Maps from the Bridge Seismic Design Specification of the Department of Public Works and Highways. Outputs produced by this paper include the Hazard Ranking Table and the Design Response Spectra. Keywords—Seismic, GIS, Hazard, Bridge, Assessment, PGA, Response Spectra. I. INTRODUCTION According to the Valley Fault System Atlas produced by the Philippine Institute of Volcanology and Seismology (PHIVOLCS) and the National Disaster Risk Reduction and Management Council (NDRRMC), the West Valley Vault (WVF) is a 100-kilometer active fault transecting the cities of Quezon City, Marikina, Pasig, Muntinlupa, and Taguig. Moreover, the fault also extends to neighbouring provinces of Bulacan, Rizal, Laguna, and Cavite. The projection of the West Valley Fault can be seen in Figure 1. As predicted by PHIVOLCS, the WVF is capable of producing a 7.2 magnitude earthquake equivalent to life and property damage rated at Intensity VIII in the PHIVOLCS Earthquake Intensity Scale (PEIS) for Metro Manila and aforementioned provinces. Consequently, as the political and economic capital of the country, massive seismic damage in the Greater Manila region is detrimental to the fate of the country as a whole. The Department of Public Works and Highways (DPWH), as the primary engineering and construction arm of the Government of the Philippines (GOP), is mandated to oversee the design and construction of quality and safe public infrastructure. In the joint effort of the Japan International Cooperation Agency (JICA), the Metro Manila Development 1 Engineer, Bureau of Design, Department of Public Works and Highways, Republic of the Philippines 2 Faculty, School of Civil, Environmental, Sanitary, & Geological Engineering, Mapua Institute of Technology, Republic of the Philippines 3 Graduate Student, School of Civil, Environmental, Sanitary, & Geological Engineering, Mapua Institute of Technology, Republic of the Philippines Authority (MMDA), and PHIVOLCS, an Earthquake Impact Reduction Study for Metro Manila was formulated in 2004. Under the USI-5 and USI-6 of the disaster response framework, the master plan formulation aims to promote earthquake resistant public facilities and promote earthquake resistant infrastructure. In this regard, the DPWH is then tasked to oversee that these objectives are met. Western Valley Fault Shapefile II. FRAMEWORK AND OBJECTIVES OF THE STUDY In this study, the focus will revolve around the seismic hazard identification and assessment of existing national bridges within the Greater Manila Area. The study intends to utilize the GIS capabilities of the Department in integrating various independent databases and undertake geospatial analysis, response spectrum analysis, and hazard ranking from GIS-Based Preliminary Seismic Hazard Identification and Assessment of National Bridges in the Greater Manila Region Covered by the West Valley Fault George Mariano A. Soriano 1&2 , Djon Mar Ellyz M. Santiago 1&3 and Anthony B. Medina Jr. 1 Int'l Journal of Research in Chemical, Metallurgical and Civil Engg. (IJRCMCE) Vol. 3, Issue 2 (2016) ISSN 2349-1442 EISSN 2349-1450 https://doi.org/10.15242/IJRCMCE.U0916301 305
Transcript of GIS-Based Preliminary Seismic Hazard Identification...
Abstract—The paper discussed the GIS-based identification of
seismically vulnerable bridges within 5-10 km of the West Valley
Fault. The assessment was conducted by integrating the bridge
information in the Road and Bridge Inventory Application, the
borehole data from the Geotechnical Database System, and the West
Valley Fault Data, as well as Spectral Acceleration Maps from the
Bridge Seismic Design Specification of the Department of Public
Works and Highways. Outputs produced by this paper include the
Hazard Ranking Table and the Design Response Spectra.
Keywords—Seismic, GIS, Hazard, Bridge, Assessment, PGA,
Response Spectra.
I. INTRODUCTION
According to the Valley Fault System Atlas produced by
the Philippine Institute of Volcanology and Seismology
(PHIVOLCS) and the National Disaster Risk Reduction and
Management Council (NDRRMC), the West Valley Vault
(WVF) is a 100-kilometer active fault transecting the cities of
Quezon City, Marikina, Pasig, Muntinlupa, and Taguig.
Moreover, the fault also extends to neighbouring provinces of
Bulacan, Rizal, Laguna, and Cavite. The projection of the
West Valley Fault can be seen in Figure 1.
As predicted by PHIVOLCS, the WVF is capable of
producing a 7.2 magnitude earthquake equivalent to life and
property damage rated at Intensity VIII in the PHIVOLCS
Earthquake Intensity Scale (PEIS) for Metro Manila and
aforementioned provinces. Consequently, as the political and
economic capital of the country, massive seismic damage in
the Greater Manila region is detrimental to the fate of the
country as a whole.
The Department of Public Works and Highways (DPWH),
as the primary engineering and construction arm of the
Government of the Philippines (GOP), is mandated to oversee
the design and construction of quality and safe public
infrastructure. In the joint effort of the Japan International
Cooperation Agency (JICA), the Metro Manila Development
1Engineer, Bureau of Design, Department of Public Works and Highways,
Republic of the Philippines 2Faculty, School of Civil, Environmental, Sanitary, & Geological
Engineering, Mapua Institute of Technology, Republic of the Philippines 3Graduate Student, School of Civil, Environmental, Sanitary, & Geological
Engineering, Mapua Institute of Technology, Republic of the Philippines
Authority (MMDA), and PHIVOLCS, an Earthquake Impact
Reduction Study for Metro Manila was formulated in 2004.
Under the USI-5 and USI-6 of the disaster response
framework, the master plan formulation aims to promote
earthquake resistant public facilities and promote earthquake
resistant infrastructure. In this regard, the DPWH is then
tasked to oversee that these objectives are met. Western Valley Fault Shapefile
II. FRAMEWORK AND OBJECTIVES OF THE STUDY
In this study, the focus will revolve around the seismic
hazard identification and assessment of existing national
bridges within the Greater Manila Area. The study intends to
utilize the GIS capabilities of the Department in integrating
various independent databases and undertake geospatial
analysis, response spectrum analysis, and hazard ranking from
GIS-Based Preliminary Seismic Hazard
Identification and Assessment of National
Bridges in the Greater Manila Region Covered
by the West Valley Fault
George Mariano A. Soriano1&2
, Djon Mar Ellyz M. Santiago1&3
and Anthony B. Medina Jr.1
Int'l Journal of Research in Chemical, Metallurgical and Civil Engg. (IJRCMCE) Vol. 3, Issue 2 (2016) ISSN 2349-1442 EISSN 2349-1450
https://doi.org/10.15242/IJRCMCE.U0916301 305
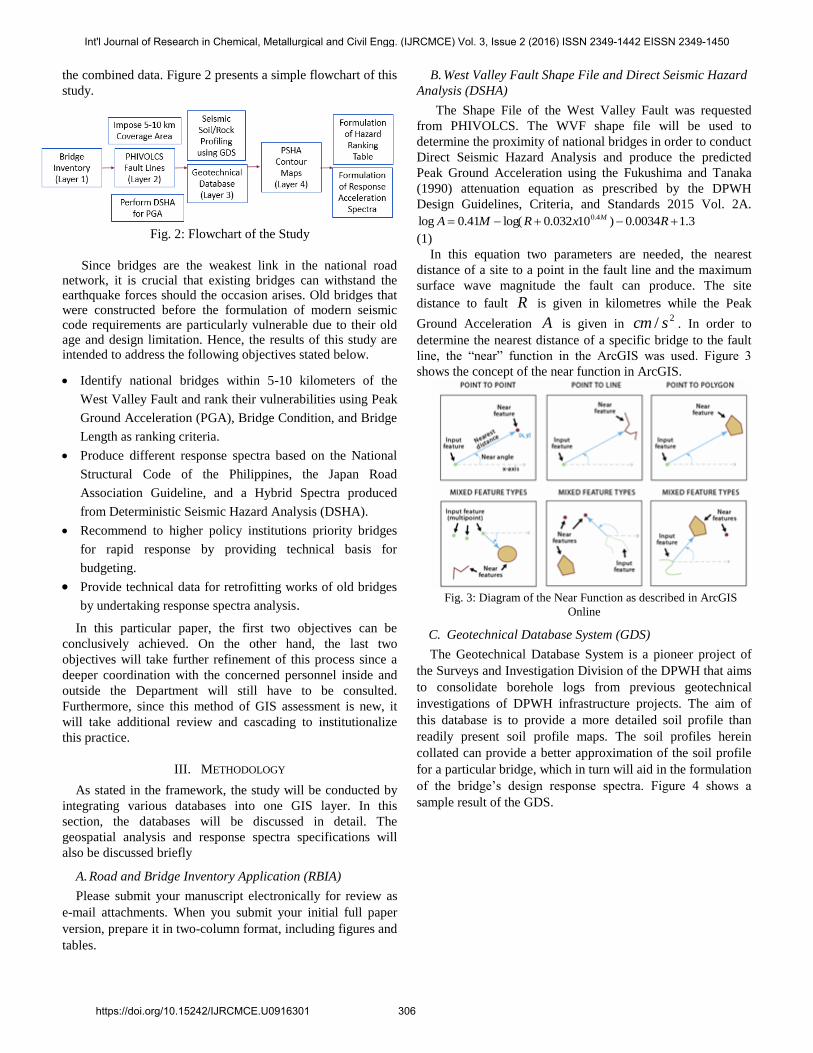
the combined data. Figure 2 presents a simple flowchart of this
study.
Fig. 2: Flowchart of the Study
Since bridges are the weakest link in the national road network, it is crucial that existing bridges can withstand the earthquake forces should the occasion arises. Old bridges that were constructed before the formulation of modern seismic code requirements are particularly vulnerable due to their old age and design limitation. Hence, the results of this study are intended to address the following objectives stated below.
Identify national bridges within 5-10 kilometers of the
West Valley Fault and rank their vulnerabilities using Peak
Ground Acceleration (PGA), Bridge Condition, and Bridge
Length as ranking criteria.
Produce different response spectra based on the National
Structural Code of the Philippines, the Japan Road
Association Guideline, and a Hybrid Spectra produced
from Deterministic Seismic Hazard Analysis (DSHA).
Recommend to higher policy institutions priority bridges
for rapid response by providing technical basis for
budgeting.
Provide technical data for retrofitting works of old bridges
by undertaking response spectra analysis.
In this particular paper, the first two objectives can be
conclusively achieved. On the other hand, the last two
objectives will take further refinement of this process since a
deeper coordination with the concerned personnel inside and
outside the Department will still have to be consulted.
Furthermore, since this method of GIS assessment is new, it
will take additional review and cascading to institutionalize
this practice.
III. METHODOLOGY
As stated in the framework, the study will be conducted by
integrating various databases into one GIS layer. In this
section, the databases will be discussed in detail. The
geospatial analysis and response spectra specifications will
also be discussed briefly
A. Road and Bridge Inventory Application (RBIA)
Please submit your manuscript electronically for review as
e-mail attachments. When you submit your initial full paper
version, prepare it in two-column format, including figures and
tables.
B. West Valley Fault Shape File and Direct Seismic Hazard
Analysis (DSHA)
The Shape File of the West Valley Fault was requested
from PHIVOLCS. The WVF shape file will be used to
determine the proximity of national bridges in order to conduct
Direct Seismic Hazard Analysis and produce the predicted
Peak Ground Acceleration using the Fukushima and Tanaka
(1990) attenuation equation as prescribed by the DPWH
Design Guidelines, Criteria, and Standards 2015 Vol. 2A.
3.10034.0)10032.0log(41.0log 4.0 RxRMA M
(1)
In this equation two parameters are needed, the nearest
distance of a site to a point in the fault line and the maximum
surface wave magnitude the fault can produce. The site
distance to fault R is given in kilometres while the Peak
Ground Acceleration A is given in 2/ scm . In order to
determine the nearest distance of a specific bridge to the fault
line, the “near” function in the ArcGIS was used. Figure 3
shows the concept of the near function in ArcGIS.
Fig. 3: Diagram of the Near Function as described in ArcGIS
Online
C. Geotechnical Database System (GDS)
The Geotechnical Database System is a pioneer project of
the Surveys and Investigation Division of the DPWH that aims
to consolidate borehole logs from previous geotechnical
investigations of DPWH infrastructure projects. The aim of
this database is to provide a more detailed soil profile than
readily present soil profile maps. The soil profiles herein
collated can provide a better approximation of the soil profile
for a particular bridge, which in turn will aid in the formulation
of the bridge’s design response spectra. Figure 4 shows a
sample result of the GDS.
Int'l Journal of Research in Chemical, Metallurgical and Civil Engg. (IJRCMCE) Vol. 3, Issue 2 (2016) ISSN 2349-1442 EISSN 2349-1450
https://doi.org/10.15242/IJRCMCE.U0916301 306
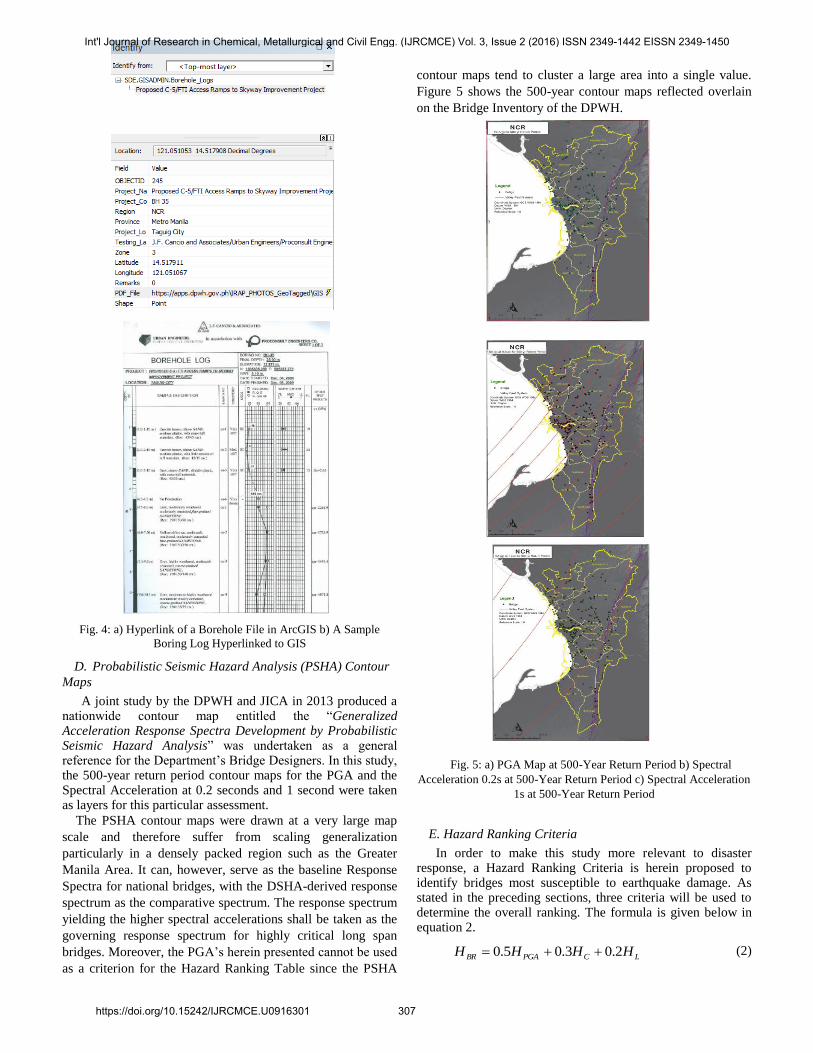
Fig. 4: a) Hyperlink of a Borehole File in ArcGIS b) A Sample
Boring Log Hyperlinked to GIS
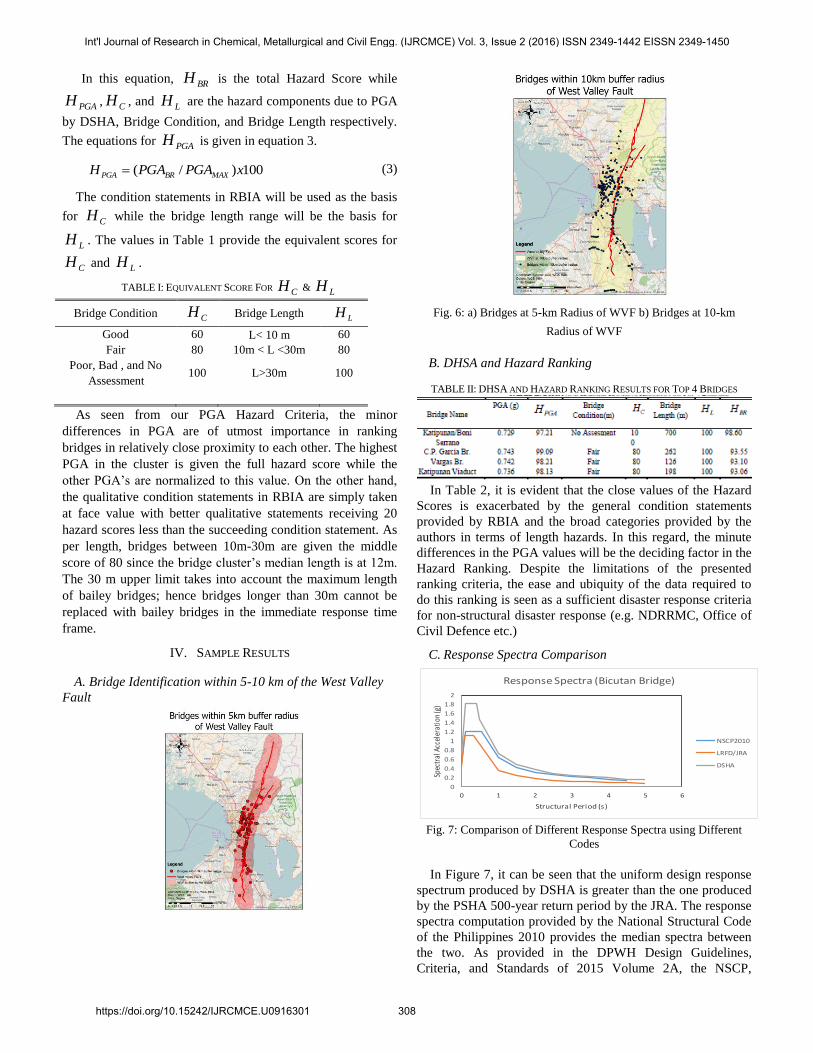
D. Probabilistic Seismic Hazard Analysis (PSHA) Contour
Maps
A joint study by the DPWH and JICA in 2013 produced a nationwide contour map entitled the “Generalized Acceleration Response Spectra Development by Probabilistic Seismic Hazard Analysis” was undertaken as a general reference for the Department’s Bridge Designers. In this study, the 500-year return period contour maps for the PGA and the Spectral Acceleration at 0.2 seconds and 1 second were taken as layers for this particular assessment.
The PSHA contour maps were drawn at a very large map
scale and therefore suffer from scaling generalization
particularly in a densely packed region such as the Greater
Manila Area. It can, however, serve as the baseline Response
Spectra for national bridges, with the DSHA-derived response
spectrum as the comparative spectrum. The response spectrum
yielding the higher spectral accelerations shall be taken as the
governing response spectrum for highly critical long span
bridges. Moreover, the PGA’s herein presented cannot be used
as a criterion for the Hazard Ranking Table since the PSHA
contour maps tend to cluster a large area into a single value.
Figure 5 shows the 500-year contour maps reflected overlain
on the Bridge Inventory of the DPWH.
Fig. 5: a) PGA Map at 500-Year Return Period b) Spectral
Acceleration 0.2s at 500-Year Return Period c) Spectral Acceleration
1s at 500-Year Return Period
E. Hazard Ranking Criteria
In order to make this study more relevant to disaster response, a Hazard Ranking Criteria is herein proposed to identify bridges most susceptible to earthquake damage. As stated in the preceding sections, three criteria will be used to determine the overall ranking. The formula is given below in equation 2.
LCPGABR HHHH 2.03.05.0 (2)
Int'l Journal of Research in Chemical, Metallurgical and Civil Engg. (IJRCMCE) Vol. 3, Issue 2 (2016) ISSN 2349-1442 EISSN 2349-1450
https://doi.org/10.15242/IJRCMCE.U0916301 307
In this equation, BRH is the total Hazard Score while
PGAH , CH , and LH are the hazard components due to PGA
by DSHA, Bridge Condition, and Bridge Length respectively.
The equations for PGAH is given in equation 3.
100)/( xPGAPGAH MAXBRPGA (3)
The condition statements in RBIA will be used as the basis
for CH while the bridge length range will be the basis for
LH . The values in Table 1 provide the equivalent scores for
CH and LH .
TABLE I: EQUIVALENT SCORE FOR CH & LH
Bridge Condition CH Bridge Length LH
Good 60 L< 10 m 60
Fair 80 10m < L <30m 80
Poor, Bad , and No
Assessment 100 L>30m 100
As seen from our PGA Hazard Criteria, the minor
differences in PGA are of utmost importance in ranking
bridges in relatively close proximity to each other. The highest
PGA in the cluster is given the full hazard score while the
other PGA’s are normalized to this value. On the other hand,
the qualitative condition statements in RBIA are simply taken
at face value with better qualitative statements receiving 20
hazard scores less than the succeeding condition statement. As
per length, bridges between 10m-30m are given the middle
score of 80 since the bridge cluster’s median length is at 12m.
The 30 m upper limit takes into account the maximum length
of bailey bridges; hence bridges longer than 30m cannot be
replaced with bailey bridges in the immediate response time
frame.
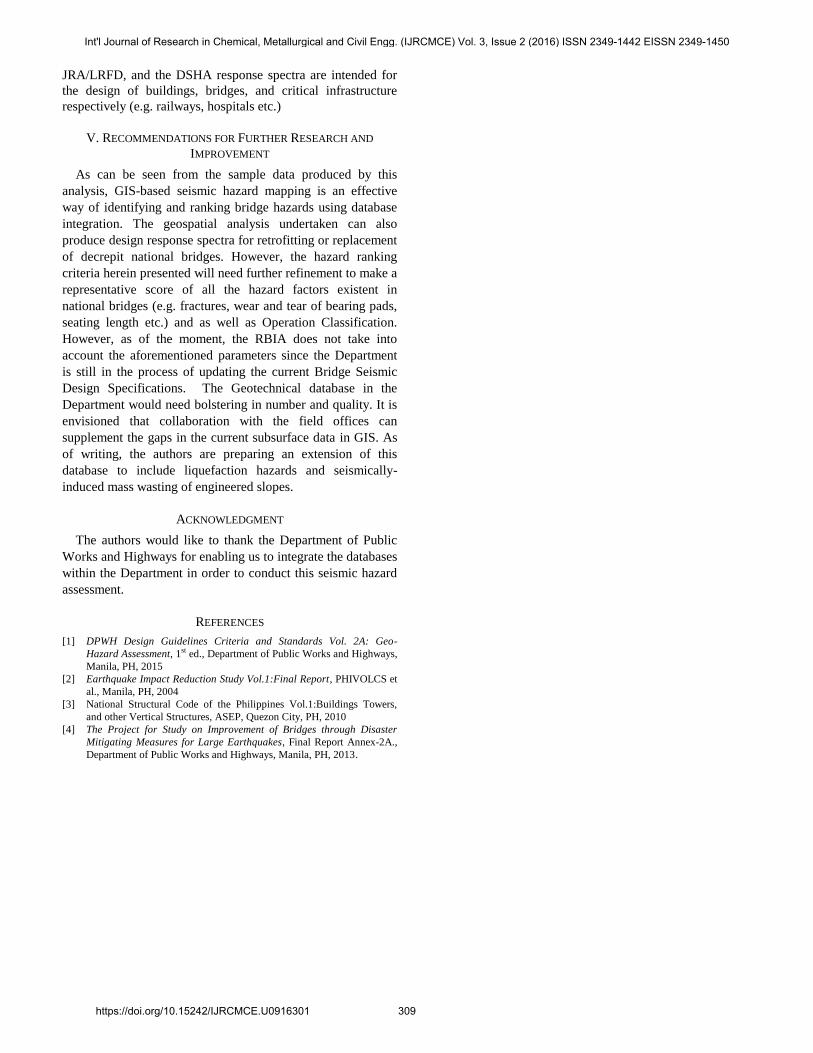
IV. SAMPLE RESULTS
A. Bridge Identification within 5-10 km of the West Valley
Fault
Fig. 6: a) Bridges at 5-km Radius of WVF b) Bridges at 10-km
Radius of WVF
B. DHSA and Hazard Ranking
TABLE II: DHSA AND HAZARD RANKING RESULTS FOR TOP 4 BRIDGES
In Table 2, it is evident that the close values of the Hazard
Scores is exacerbated by the general condition statements
provided by RBIA and the broad categories provided by the
authors in terms of length hazards. In this regard, the minute
differences in the PGA values will be the deciding factor in the
Hazard Ranking. Despite the limitations of the presented
ranking criteria, the ease and ubiquity of the data required to
do this ranking is seen as a sufficient disaster response criteria
for non-structural disaster response (e.g. NDRRMC, Office of
Civil Defence etc.)
C. Response Spectra Comparison
Fig. 7: Comparison of Different Response Spectra using Different
Codes
In Figure 7, it can be seen that the uniform design response
spectrum produced by DSHA is greater than the one produced
by the PSHA 500-year return period by the JRA. The response
spectra computation provided by the National Structural Code
of the Philippines 2010 provides the median spectra between
the two. As provided in the DPWH Design Guidelines,
Criteria, and Standards of 2015 Volume 2A, the NSCP,
0
0.2
0.4
0.6
0.8
1
1.2
1.4
1.6
1.8
2
0 1 2 3 4 5 6
Spec
tral
Acc
eler
atio
n (g
)
Structural Period (s)
Response Spectra (Bicutan Bridge)
NSCP2010
LRFD/JRA
DSHA
Int'l Journal of Research in Chemical, Metallurgical and Civil Engg. (IJRCMCE) Vol. 3, Issue 2 (2016) ISSN 2349-1442 EISSN 2349-1450
https://doi.org/10.15242/IJRCMCE.U0916301 308
JRA/LRFD, and the DSHA response spectra are intended for
the design of buildings, bridges, and critical infrastructure
respectively (e.g. railways, hospitals etc.)
V. RECOMMENDATIONS FOR FURTHER RESEARCH AND
IMPROVEMENT
As can be seen from the sample data produced by this
analysis, GIS-based seismic hazard mapping is an effective
way of identifying and ranking bridge hazards using database
integration. The geospatial analysis undertaken can also
produce design response spectra for retrofitting or replacement
of decrepit national bridges. However, the hazard ranking
criteria herein presented will need further refinement to make a
representative score of all the hazard factors existent in
national bridges (e.g. fractures, wear and tear of bearing pads,
seating length etc.) and as well as Operation Classification.
However, as of the moment, the RBIA does not take into
account the aforementioned parameters since the Department
is still in the process of updating the current Bridge Seismic
Design Specifications. The Geotechnical database in the
Department would need bolstering in number and quality. It is
envisioned that collaboration with the field offices can
supplement the gaps in the current subsurface data in GIS. As
of writing, the authors are preparing an extension of this
database to include liquefaction hazards and seismically-
induced mass wasting of engineered slopes.
ACKNOWLEDGMENT
The authors would like to thank the Department of Public
Works and Highways for enabling us to integrate the databases
within the Department in order to conduct this seismic hazard
assessment.
REFERENCES
[1] DPWH Design Guidelines Criteria and Standards Vol. 2A: Geo-
Hazard Assessment, 1st ed., Department of Public Works and Highways,
Manila, PH, 2015
[2] Earthquake Impact Reduction Study Vol.1:Final Report, PHIVOLCS et
al., Manila, PH, 2004
[3] National Structural Code of the Philippines Vol.1:Buildings Towers,
and other Vertical Structures, ASEP, Quezon City, PH, 2010
[4] The Project for Study on Improvement of Bridges through Disaster
Mitigating Measures for Large Earthquakes, Final Report Annex-2A.,
Department of Public Works and Highways, Manila, PH, 2013.
Int'l Journal of Research in Chemical, Metallurgical and Civil Engg. (IJRCMCE) Vol. 3, Issue 2 (2016) ISSN 2349-1442 EISSN 2349-1450
https://doi.org/10.15242/IJRCMCE.U0916301 309