
Girls in Canada: Perceptions of gender equality ...
192
Girls in Canada: Perceptions of gender equality, leadership and stereotypes Plan International Canada | Summary Conducted by Nanos for Plan International Canada, October 2019 Submission 2019-1488
Transcript of Girls in Canada: Perceptions of gender equality ...

Girls in Canada: Perceptions of gender equality, leadership and stereotypes Plan International Canada | Summary Conducted by Nanos for Plan International Canada, October 2019 Submission 2019-1488

© N
AN
OS
RES
EAR
CH
SUMMARY
Overall Canadian girls agree or somewhat agree that women and girls have the natural qualities to be good leaders and feel confident in their leadership abilities, although six in ten say they occasionally doubt they have what it takes to be a good leader. In terms of what makes a good leader, Canadian girls most often say the words confident and organized describe a good leader, and most often describe boys with the word strong, and girls with the words smart and caring.
Canadian girls feel more encouraged by their female peers than their male peers to pursue their leadership aspirations and are twice as likely to report they never, rather than regularly, talk about their leadership aspirations with family or trusted adults.
Canadian girls find women in positions of power more approachable than men in positions of power, and are three times more likely to picture a CEO as a man rather than a woman. Among those who report having a mentor, the majority of girls say their mentor is a woman, rather than a man.
The “what”: stereotypes, beliefs and perceptions
• Canadian girls say ‘confident’ and ‘organized’ are the adjectives that best describe a good leader – Asked to select which adjectives best describe a good leader, Canadian girls most often selected confident (76%) and organized (76%), followed by supportive (69%), smart (67%), patient (64%), passionate (62%), helpful (62%), caring (57%), strong (56%), decisive (53%), calm (51%), and empathetic (50%).
• Canadian girls say ‘smart’ and ‘caring’ are the adjectives that best describe girls – Asked to select which adjectives best describe girls, Canadian girls most often selected smart (62%), followed by caring (60%), passionate (57%), emotional (55%), strong (52%), confident (52%), supportive (52%), gentle (52%), and empathetic (50%).
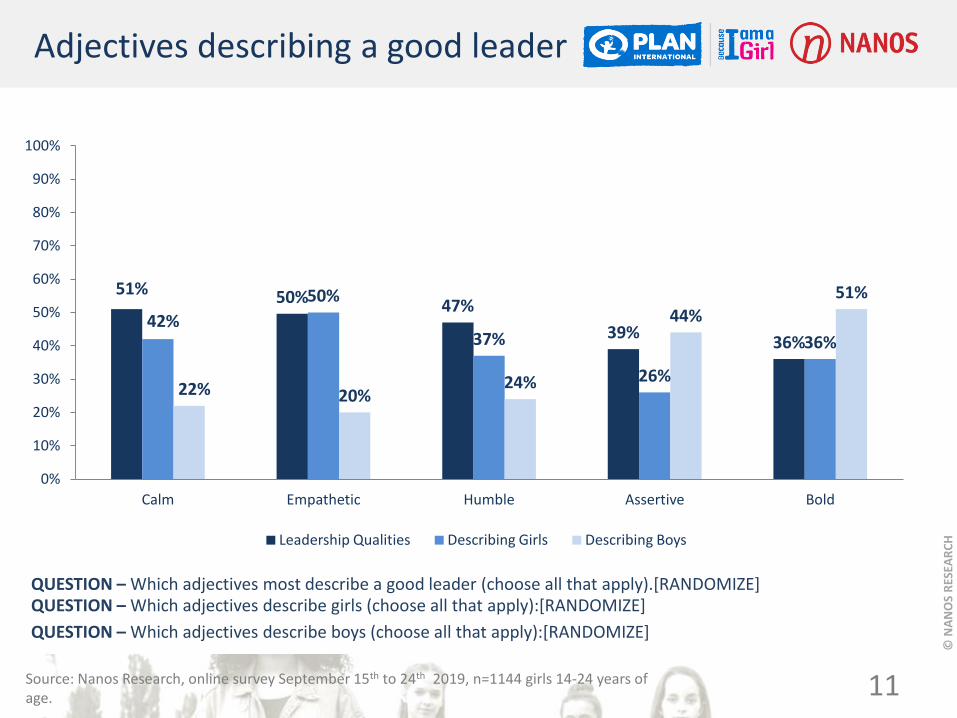
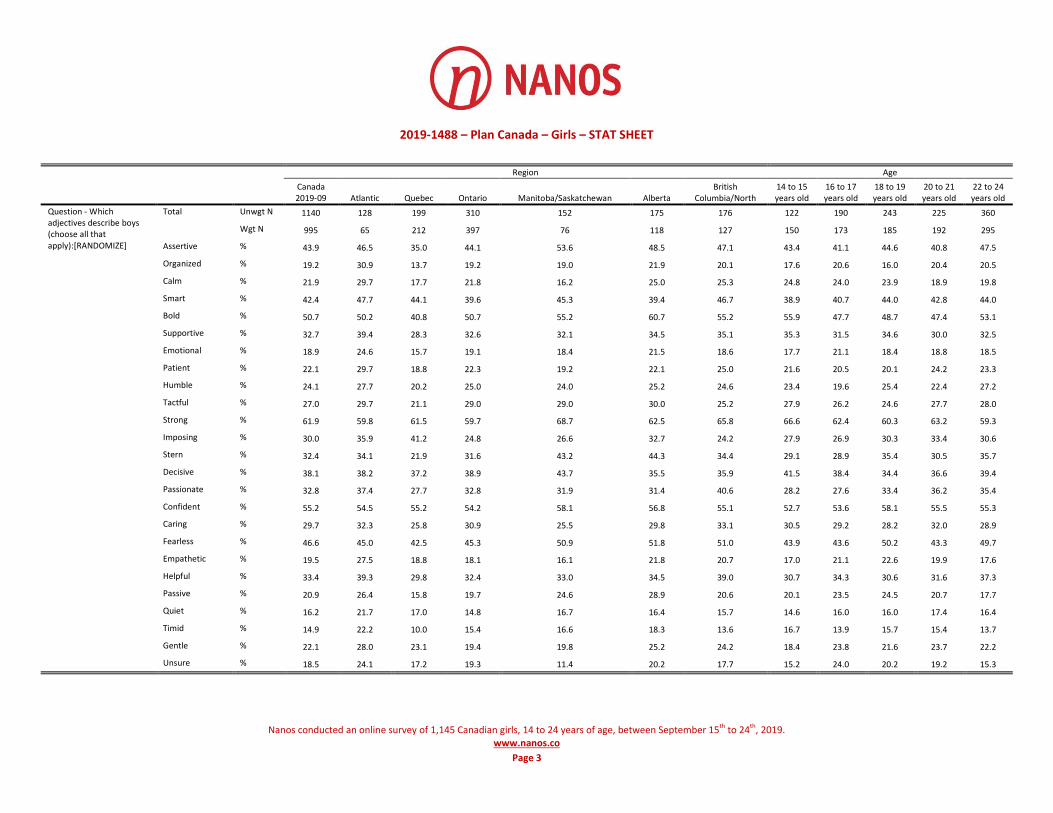
• Canadian girls say ‘strong’ is the adjective that best describes boys – Asked to select which adjectives best describe boys, Canadian girls most often selected strong (62%), followed by confident (55%), bold (51%), fearless (47%), assertive (44%), smart (42%), and decisive (38%).
• More than eight in ten Canadian girls believe achieving gender equality benefits all genders equally – Asked who they believe achieving gender equally benefits the most, a majority of Canadian girls say all genders equally (84%), while eight per cent say only/mostly women, and two per cent each say no one or only/mostly men. Five per cent are unsure.
2
More than eight in ten Canadian girls believe achieving gender equality benefits all genders equally

© N
AN
OS
RES
EAR
CH
SUMMARY
• Over seven in ten Canadian girls think the girls and women do more or somewhat more household chores than the boys and men in their home – A majority of Canadian girls say they think girls and women do more (36%) or somewhat more (36%) household chores than the boys and men in their home, while 21 per cent think they do the same amount, three per cent say somewhat less and one per cent say they do less household chores. Three per cent are unsure.
• Nearly six in ten Canadian girls say they occasionally feel pressure to change how they act in order to achieve their leadership aspirations – A majority of Canadian girls say they occasionally feel pressure to change how they act to achieve their leadership aspirations (57%), while 19 per cent say they have experienced this pressure regularly, and 16 per cent say never. Eight per cent are unsure.
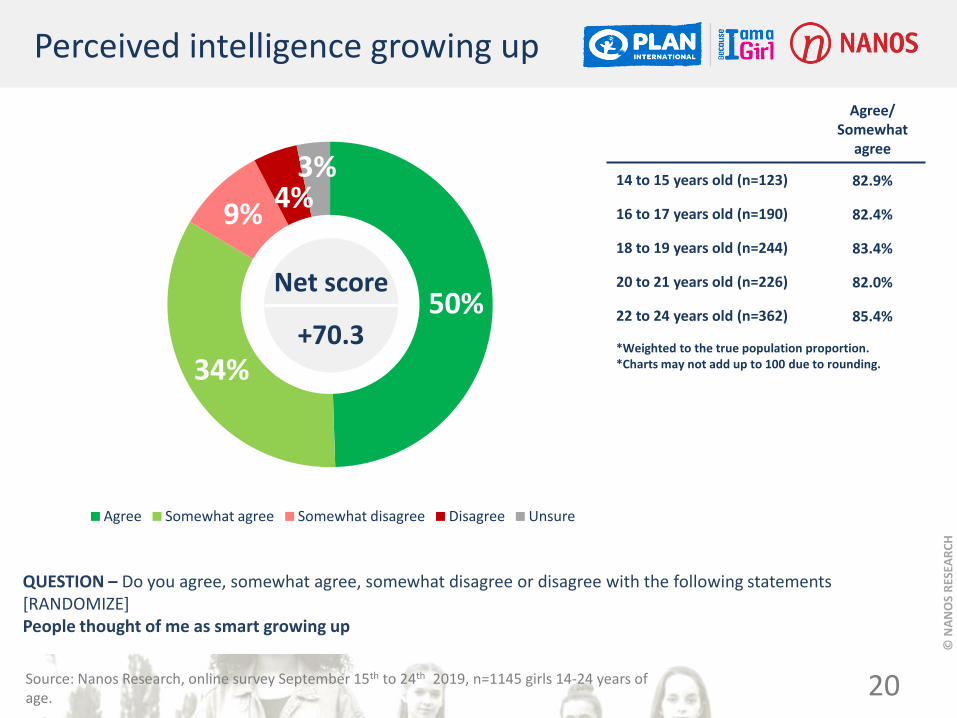
• More than eight in ten Canadian girls agree or somewhat agree that people thought of them as smart growing up – A majority of Canadian girls agree (50%) or somewhat agree (34%) that people thought of them as smart growing up, while nine per cent somewhat disagree and four per cent disagree. Three per cent are unsure.
• A majority of Canadians girls agree or somewhat agree that girls and women have the natural abilities needed to be good leaders – More than eight in ten Canadian girls agree (44%) or somewhat agree (37%) that girls and women have the natural abilities required to be good leaders, while nine per cent somewhat disagree and four per cent disagree. Five per cent are unsure.
• Over seven in ten Canadians girls agree or somewhat agree that their opinions are or were valued when they were in school – A majority of Canadian girls agree (28%) or somewhat agree (44%) that their opinions are/were valued when they were in school, while 16 per cent somewhat disagree and seven per cent disagree. Five per cent are unsure. Girls 14-17 years of age are more likely to agree (36%) with this than girls 18-24 years of age (25%).
• Seven in ten Canadians girls agree or somewhat agree that boys and men have the natural abilities required to be good leaders – Seven in ten Canadian girls agree (33%) or somewhat agree (37%) that boys and men have the natural abilities required to be good leaders, while 15 per cent somewhat disagree and 10 per cent disagree. Five per cent are unsure.
3
More Canadian girls agree or somewhat agree that girls and women have the natural abilities needed to be good leaders than agree or somewhat agree that boys and men do

© N
AN
OS
RES
EAR
CH
SUMMARY
• Nearly six in ten Canadians girls disagree or somewhat disagree that their gender holds back their ability to be a leader – More than half of Canadian girls disagree (41%) or somewhat disagree (17%) that their gender holds back their ability to be a leader, while 29 per cent somewhat agree and eight per cent agree. Six per cent are unsure.
The “why”: Barriers – knowledge, skills, context
• Three in four Canadian girls say they are confident or somewhat confident in their leadership abilities – A majority of Canadian girls say they are confident (27%) or somewhat confident (48%) in their leadership abilities, while over two in ten say they are somewhat not confident (15%) or not confident (seven per cent). Three per cent are unsure.
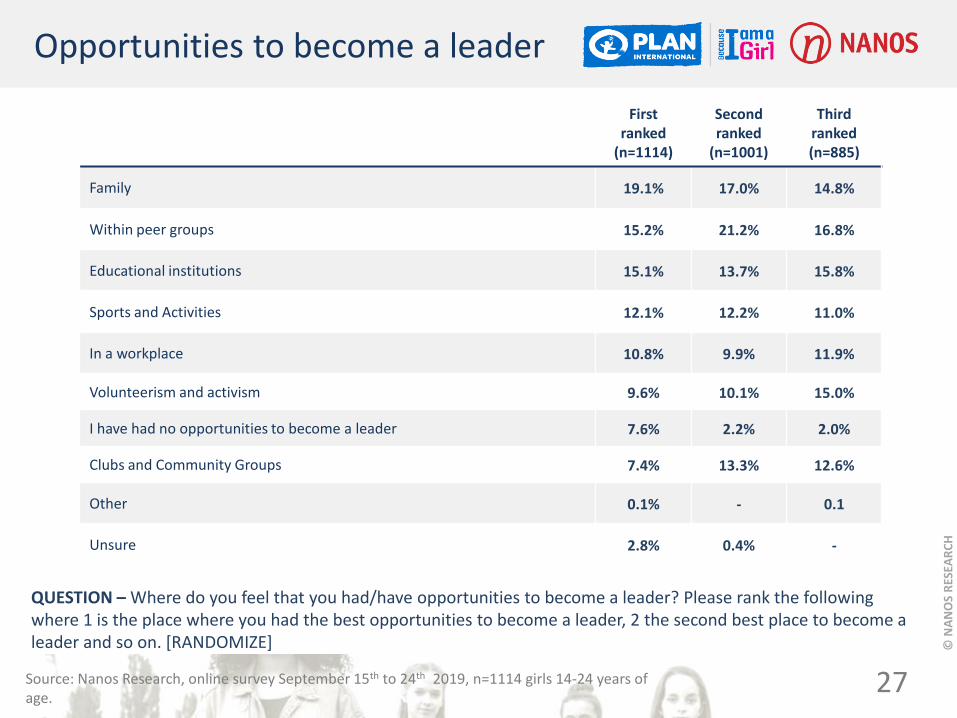
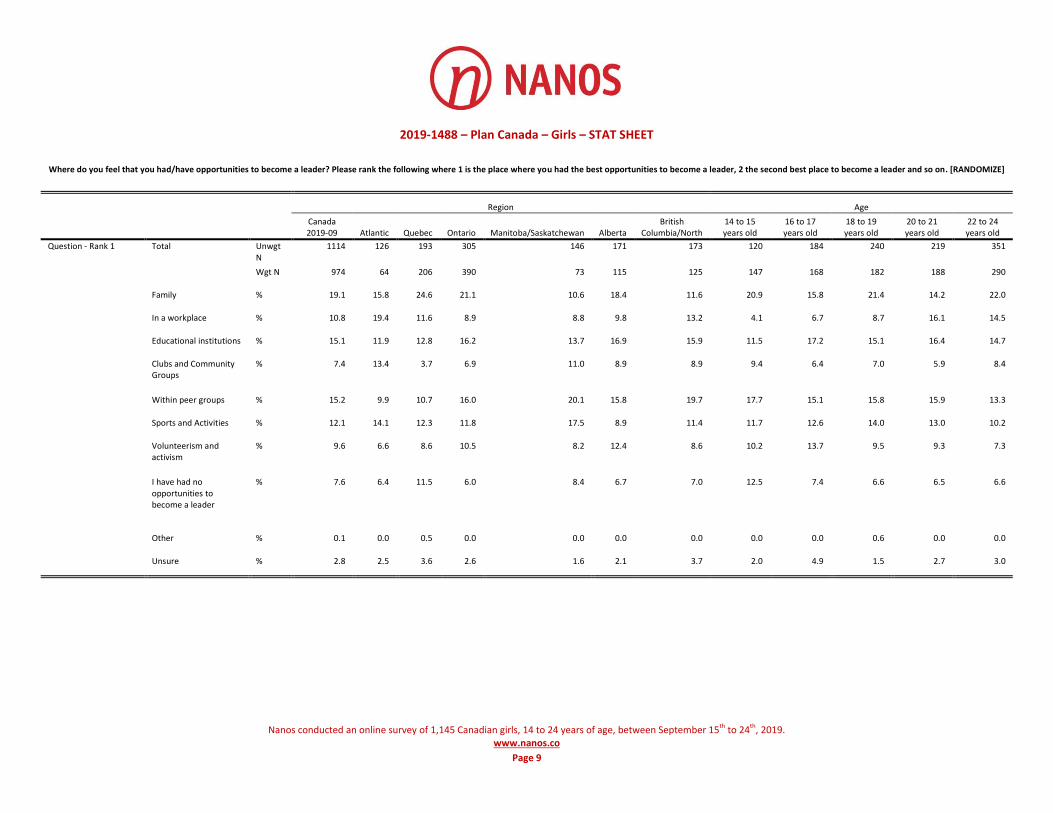
• Canadian girls most often rank family first as the place where they have had the best opportunities to become a leader – Asked to rank where they feel they have/have had the best opportunities to become a leader, Canadian girls most often rank family first (20%), followed by within peer groups (16%), educational institutions (16%), sports and activities (13%), in a workplace (11%), and clubs and community groups (eight per cent).
• Six in ten Canadian girls say they occasionally doubt they have what it takes to be a good leader – A majority of Canadian girls say they occasionally (61%) doubt that they have what it takes to be a good leader, while 20 per cent say they regularly doubt they have what it takes, and 14 per cent say they never do. Five per cent are unsure.
• Canadian girls most often say education is the tool they need their leadership goals – Asked which tools they think they need to achieve their leadership goals, Canadian girls most often select education (20%), followed by family support (18%), gender equality (14%), community support (14%), a mentor (13%), access to leadership courses (10%), and money (10%). One per cent are unsure.
• Canadian girls most often say they have access to education and family support as tools to achieve their leadership goals - Asked which tools they currently have access to what they need to achieve their leadership goals, Canadian girls most often select education (23%), followed by family support (22%), community support (11%), a mentor (nine per cent), access to leadership courses (nine per cent), and gender equality (eight per cent). Eight per cent select they have the tools they need.
4
Three in four Canadian girls say they are confident or somewhat confident in their leadership abilities; although eight in ten regularly or occasionally doubt they have what it takes to be a leader

© N
AN
OS
RES
EAR
CH
SUMMARY
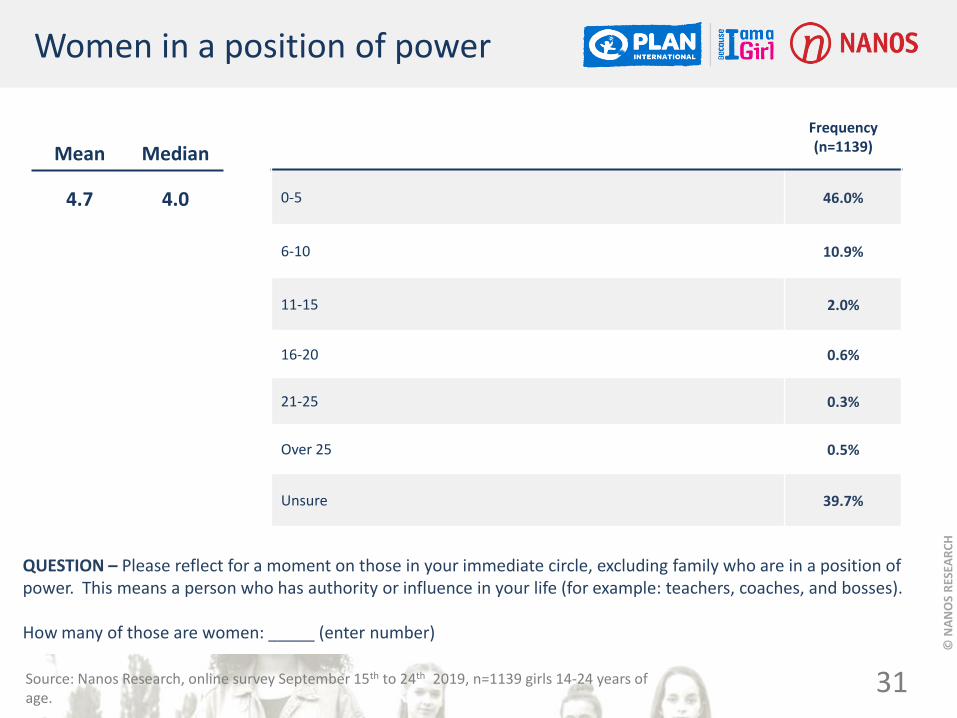
• Canadian girls say they have an average of 5 women in their lives who are in a position of power – Asked how many people in their immediate circle who are in a position of power are women, Canadian girls say an average of 4.7 of them are women, with a median of 4.0. Girls ages 14 to17 report a higher average of women in their immediate circle in positions of power (5.8) than girls 18 to 24 (mean of 4.3).
• Canadian girls say they have an average of 4 men in their lives who are in a position of power – Asked how many people in their immediate circle who are in a position of power are men, Canadian girls say an average of 4.2 of them are men, with a median of 3.0.
• Canadian girls are slightly more likely to report having a mentor than not having one – Asked if they have a mentor, 48 per cent of Canadian girls report they do, while 42 per cent report they do not. Ten per cent are unsure.
• A majority of Canadian girls who report having a mentor, report their mentor is female – Among those who report having a mentor, more than three in four report their mentor is female (76%), while 24 per cent report their mentor is male. One per cent report their mentor is another gender.
• More than eight in ten Canadian girls agree or somewhat agree that they expect to be given personally challenging and interesting work early in their career – A majority of Canadian girls agree (37%) or somewhat agree (45%) that they expect to be given personally challenging and interesting work early in their career/professional life, while over one in ten somewhat disagree (nine per cent) or disagree (three per cent). Seven per cent are unsure.
• Just under eight in ten Canadian girls agree or somewhat agree that they find women in positions of power to be approachable – A majority of Canadian girls agree (37%) or somewhat agree (42%) that they find women in positions of power to be approachable, while 13 per cent somewhat disagree and three per cent disagree. Five per cent are unsure.
• Less than six in ten Canadian girls agree or somewhat agree that they find men in positions of power to be approachable – A slight majority of Canadian girls agree (19%) or somewhat agree (38%) that they find men in positions of power to be approachable, while 27 per cent somewhat disagree and 10 per cent disagree. Six per cent are unsure.
5
Canadian girls find women in positions of power more approachable than men in positions of power

© N
AN
OS
RES
EAR
CH
SUMMARY
• Canadian girls are three times more likely to picture a CEO as a man than a woman – Asked what gender they think of when thinking of a CEO, over four in ten say they would not assume either gender (44%), while 40 per cent say they picture a man, and 12 per cent picture a woman. Four per cent are unsure.
How: Action (Use your power, talk about it, donate)
• Canadian girls are twice as likely to report they never talk about their leadership aspirations with family or trusted adults, rather than regularly – Just under one in two Canadian girls say they talk about their leadership aspirations with their family or trusted adults occasionally (49%), while 32 per cent say they never do this and 15 per cent say they do this regularly. Five per cent are unsure.
• Nearly eight in ten Canadian girls say their female peers encourage or somewhat encourage their leadership aspirations – A majority of Canadian girls say their female peers encourage (41%) or somewhat encourage (37%) their leadership aspirations, while over one in ten say their female peers do not encourage (four per cent) or somewhat do not encourage (eight per cent) this. Ten per cent are unsure.
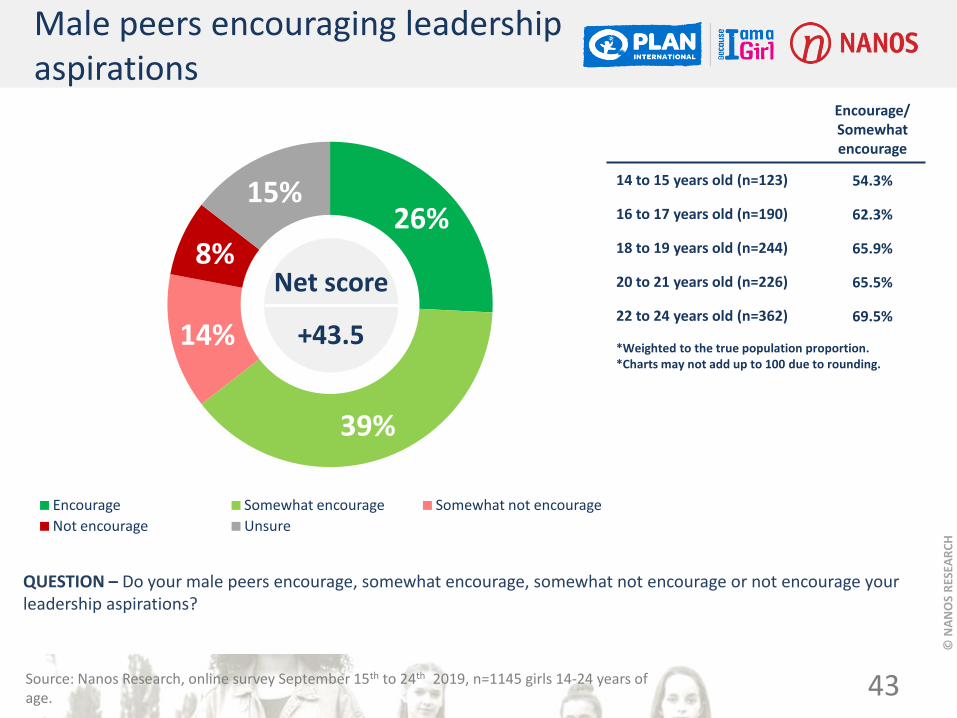
• Almost two in three Canadian girls say their male peers encourage or somewhat encourage their leadership aspirations – Over six in ten Canadian girls say their male peers encourage (26%) or somewhat encourage (39%) their leadership aspirations, while over two in ten say their male peers do not encourage (eight per cent) or somewhat do not encourage (14%) this. Fifteen per cent are unsure.
• Canadian girls most often say the boys’ sports teams at their current or previous high school were treated better and had a higher status than the girls’ teams – Just under half of Canadian girls say the boys’ teams are/were treated better and had a higher status than the girls’ teams (49%), while 35 per cent say they were both treated equally and have the same status. Six per cent say the girls’ teams are/were treated better and have a higher status, and 11 per cent are unsure.
Nanos conducted an online survey of 1,145 Canadian girls, between 14 and 24 years of age, between September 15th and 24th 2019. Participants were randomly administered a survey online. The results were statistically checked and weighted by age using the latest Census information and the sample is geographically stratified to be representative of Canada. No margin of error applies to this research. The research was commissioned by Plan International Canada and was conducted by Nanos Research.
6
Canadian girls are three times more likely to picture a CEO as a man than a woman

© N
AN
OS
RES
EAR
CH
TABLE OF CONTENTS
7
Executive Summary
The “what”: stereotypes, beliefs and perceptions
The “why”: Barriers – knowledge, skills, context.
How: Action (Use your power, talk about it, donate)
Methodology
Tabulations

© N
AN
OS
RES
EAR
CH
The “what”: stereotypes, beliefs and perceptions
More Canadian girls agree or somewhat agree that girls and women have the natural abilities needed to be good leaders than agree or somewhat agree
that boys and men do

© N
AN
OS
RES
EAR
CH
76% 76%
69% 67% 64%
52% 49%
52%
62%
48%
55%
19%
33%
42%
22%
0%
10%
20%
30%
40%
50%
60%
70%
80%
90%
100%
Confident Organized Supportive Smart Patient
Leadership Qualities Describing Girls Describing Boys
9 Source: Nanos Research, online survey September 15th to 24th 2019, n=1144 girls 14-24 years of age.
Adjectives describing a good leader
QUESTION – Which adjectives most describe a good leader (choose all that apply).[RANDOMIZE] QUESTION – Which adjectives describe girls (choose all that apply):[RANDOMIZE]
QUESTION – Which adjectives describe boys (choose all that apply):[RANDOMIZE]

© N
AN
OS
RES
EAR
CH
62% 62% 57% 56%
53% 57%
49%
60%
52%
27% 33% 33%
30%
62%
38%
0%
10%
20%
30%
40%
50%
60%
70%
80%
90%
100%
Passionate Helpful Caring Strong Decisive
Leadership Qualities Describing Girls Describing Boys
10 Source: Nanos Research, online survey September 15th to 24th 2019, n=1144 girls 14-24 years of age.
Adjectives describing a good leader
QUESTION – Which adjectives most describe a good leader (choose all that apply).[RANDOMIZE] QUESTION – Which adjectives describe girls (choose all that apply):[RANDOMIZE]
QUESTION – Which adjectives describe boys (choose all that apply):[RANDOMIZE]
© N
AN
OS
RES
EAR
CH
51% 50% 47%
39% 36%
42%
50%
37%
26%
36%
22% 20% 24%
44% 51%
0%
10%
20%
30%
40%
50%
60%
70%
80%
90%
100%
Calm Empathetic Humble Assertive Bold
Leadership Qualities Describing Girls Describing Boys
11 Source: Nanos Research, online survey September 15th to 24th 2019, n=1144 girls 14-24 years of age.
Adjectives describing a good leader
QUESTION – Which adjectives most describe a good leader (choose all that apply).[RANDOMIZE] QUESTION – Which adjectives describe girls (choose all that apply):[RANDOMIZE]
QUESTION – Which adjectives describe boys (choose all that apply):[RANDOMIZE]

© N
AN
OS
RES
EAR
CH
35% 31%
22%
13% 9%
21%
37%
52%
14%
55%
27%
47%
22%
32%
19%
0%
10%
20%
30%
40%
50%
60%
70%
80%
90%
100%
Tactful Fearless Gentle Stern Emotional
Leadership Qualities Describing Girls Describing Boys
12 Source: Nanos Research, online survey September 15th to 24th 2019, n=1144 girls 14-24 years of age.
Adjectives describing a good leader
QUESTION – Which adjectives most describe a good leader (choose all that apply).[RANDOMIZE] QUESTION – Which adjectives describe girls (choose all that apply):[RANDOMIZE]
QUESTION – Which adjectives describe boys (choose all that apply):[RANDOMIZE]

© N
AN
OS
RES
EAR
CH
7% 6% 4% 2% 1%
21%
11%
26% 22%
17% 21%
30%
16% 15% 19%
0%
10%
20%
30%
40%
50%
60%
70%
80%
90%
100%
Passive Imposing Quiet Timid Unsure
Leadership Qualities Describing Girls Describing Boys
13 Source: Nanos Research, online survey September 15th to 24th 2019, n=1144 girls 14-24 years of age.
Adjectives describing a good leader
QUESTION – Which adjectives most describe a good leader (choose all that apply).[RANDOMIZE] QUESTION – Which adjectives describe girls (choose all that apply):[RANDOMIZE]
QUESTION – Which adjectives describe boys (choose all that apply):[RANDOMIZE]

© N
AN
OS
RES
EAR
CH
14
QUESTION – Which adjectives most describe a good leader (choose all that apply).[RANDOMIZE]
Source: Nanos Research, online survey September 15th to 24th 2019, n=1144 girls 14-24 years of age.
Describing a good leader versus describing girls
Assertive
Organized Calm
Smart
Bold
Supportive
Emotional
Patient
Humble
Tactful
Strong
Imposing
Stern
Decisive
Passionate Confident
Caring
Fearless
Empathetic Helpful
Passive
Quiet
Timid
Gentle
0
10
20
30
40
50
60
70
80
90
100
0 10 20 30 40 50 60 70 80 90 100
Wo
rds
De
scri
bin
g G
irls
Words Describing a Good Leader
QUESTION – Which adjectives describe girls (choose all that apply):[RANDOMIZE]

© N
AN
OS
RES
EAR
CH
15
QUESTION – Which adjectives most describe a good leader (choose all that apply).[RANDOMIZE]
Source: Nanos Research, online survey September 15th to 24th 2019, n=1144 girls 14-24 years of age.
Describing a good leader versus describing boys
Assertive
Organized Calm
Smart
Bold
Supportive
Emotional
Patient
Humble Tactful
Strong
Imposing Stern
Decisive
Passionate
Confident
Caring
Fearless
Empathetic
Helpful
Passive Quiet
Timid
Gentle
0
10
20
30
40
50
60
70
80
90
100
0 10 20 30 40 50 60 70 80 90 100
Wo
rds
De
scri
bin
g B
oys
Words Describing a Good Leader
QUESTION – Which adjectives describe boys (choose all that apply):[RANDOMIZE]

© N
AN
OS
RES
EAR
CH
8%
84%
2% 2%
4%
Only/mostly women All genders equally Only/mostly men
No one Unsure
QUESTION – Do you believe that achieving gender equality benefits:
All genders equally
14 to 15 years old (n=123) 81.5%
16 to 17 years old (n=190) 85.8%
18 to 19 years old (n=244) 83.3%
20 to 21 years old (n=226) 82.3%
22 to 24 years old (n=362) 84.4%
*Weighted to the true population proportion. *Charts may not add up to 100 due to rounding.
16
Beneficiaries of gender equality
Source: Nanos Research, online survey September 15th to 24th 2019, n=1145 girls 14-24 years of age.

© N
AN
OS
RES
EAR
CH
36%
36%
21%
3% 1%
3%
More Somewhat more The same Less Somewhat less Unsure
Net score
+67.9
QUESTION – In general do you think girls/women do more, somewhat more, the same, somewhat less or less household chores as boys/men in your home?
More/ Somewhat
more
14 to 15 years old (n=123) 71.1%
16 to 17 years old (n=190) 74.4%
18 to 19 years old (n=244) 74.7%
20 to 21 years old (n=226) 71.7%
22 to 24 years old (n=362) 70.4%
*Weighted to the true population proportion. *Charts may not add up to 100 due to rounding.
17
Completing household chores
Source: Nanos Research, online survey September 15th to 24th 2019, n=1145 girls 14-24 years of age.

© N
AN
OS
RES
EAR
CH
19%
57%
16%
8%
Regularly Occasionally Never Unsure
Net score
+3.1
QUESTION – Do you regularly, occasionally or never feel pressure to change how you act in order to achieve your leadership aspirations?
Occasionally
14 to 15 years old (n=123) 55.8%
16 to 17 years old (n=190) 54.6%
18 to 19 years old (n=244) 60.2%
20 to 21 years old (n=226) 60.5%
22 to 24 years old (n=362) 54.8%
*Weighted to the true population proportion. *Charts may not add up to 100 due to rounding.
18
Pressure to change behaviour to achieve leadership aspirations
Source: Nanos Research, online survey September 15th to 24th 2019, n=1145 girls 14-24 years of age.

© N
AN
OS
RES
EAR
CH
*Charts may not add up to 100 due to rounding
8%
28%
33%
44%
49%
29%
44%
37%
37%
34%
17%
16%
15%
9%
9%
41%
7%
10%
4%
4%
6%
5%
5%
5%
3%
0% 20% 40% 60% 80% 100%
My gender holds back my ability to be a leader.
My opinions are/were valued when I was in school
Boys and men have the natural abilities required to
be good leaders
Girls and women have the natural abilities required to
be good leaders
People thought of me as smart growing up
Agree Somewhat agree Somewhat disagree Disagree Unsure
Net score
+70.3
+68.3
+44.6
+49.0
-20.8
QUESTION – Do you agree, somewhat agree, somewhat disagree or disagree with the following statements [RANDOMIZE]
Agreement with statements about leadership
19 Source: Nanos Research, online survey September 15th to 24th 2019, n=1145 girls 14-24 years of age.
© N
AN
OS
RES
EAR
CH
50%
34%
9% 4%
3%
Agree Somewhat agree Somewhat disagree Disagree Unsure
Net score
+70.3
Agree/ Somewhat
agree
14 to 15 years old (n=123) 82.9%
16 to 17 years old (n=190) 82.4%
18 to 19 years old (n=244) 83.4%
20 to 21 years old (n=226) 82.0%
22 to 24 years old (n=362) 85.4%
*Weighted to the true population proportion. *Charts may not add up to 100 due to rounding.
20
Perceived intelligence growing up
QUESTION – Do you agree, somewhat agree, somewhat disagree or disagree with the following statements [RANDOMIZE] People thought of me as smart growing up
Source: Nanos Research, online survey September 15th to 24th 2019, n=1145 girls 14-24 years of age.

© N
AN
OS
RES
EAR
CH
44%
37%
9% 4% 5%
Agree Somewhat agree Somewhat disagree Disagree Unsure
Net score
+68.3
Agree/ Somewhat
agree
14 to 15 years old (n=123) 80.3%
16 to 17 years old (n=190) 82.8%
18 to 19 years old (n=244) 84.0%
20 to 21 years old (n=226) 77.9%
22 to 24 years old (n=362) 83.3%
*Weighted to the true population proportion. *Charts may not add up to 100 due to rounding.
21
Women and girls as natural leaders
QUESTION – Do you agree, somewhat agree, somewhat disagree or disagree with the following statements [RANDOMIZE] Girls and women have the natural abilities required to be good leaders
Source: Nanos Research, online survey September 15th to 24th 2019, n=1145 girls 14-24 years of age.

© N
AN
OS
RES
EAR
CH
28%
44%
16%
7% 5%
Agree Somewhat agree Somewhat disagree Disagree Unsure
Net score
+49.0
Agree/ Somewhat
agree
14 to 15 years old (n=123) 78.2%
16 to 17 years old (n=190) 73.8%
18 to 19 years old (n=244) 68.5%
20 to 21 years old (n=226) 69.0%
22 to 24 years old (n=362) 72.4%
*Weighted to the true population proportion. *Charts may not add up to 100 due to rounding.
22
Opinions being valued in school
QUESTION – Do you agree, somewhat agree, somewhat disagree or disagree with the following statements [RANDOMIZE] My opinions are/were valued when I was in school
Source: Nanos Research, online survey September 15th to 24th 2019, n=1145 girls 14-24 years of age.

© N
AN
OS
RES
EAR
CH
33%
37%
15%
10% 5%
Agree Somewhat agree Somewhat disagree Disagree Unsure
Net score
+44.6
Agree/ Somewhat
agree
14 to 15 years old (n=123) 68.8%
16 to 17 years old (n=190) 69.5%
18 to 19 years old (n=244) 71.5%
20 to 21 years old (n=226) 68.7%
22 to 24 years old (n=362) 69.8%
*Weighted to the true population proportion. *Charts may not add up to 100 due to rounding.
23
Men and boys as natural leaders
QUESTION – Do you agree, somewhat agree, somewhat disagree or disagree with the following statements [RANDOMIZE] Boys and men have the natural abilities required to be good leaders
Source: Nanos Research, online survey September 15th to 24th 2019, n=1145 girls 14-24 years of age.

© N
AN
OS
RES
EAR
CH
8%
29%
17%
41%
6%
Agree Somewhat agree Somewhat disagree Disagree Unsure
Net score
-20.8
Disagree/ Somewhat
disagree
14 to 15 years old (n=123) 62.0%
16 to 17 years old (n=190) 62.2%
18 to 19 years old (n=244) 57.4%
20 to 21 years old (n=226) 51.0%
22 to 24 years old (n=362) 56.9%
*Weighted to the true population proportion. *Charts may not add up to 100 due to rounding.
24
Gender as a barrier to being a leader
QUESTION – Do you agree, somewhat agree, somewhat disagree or disagree with the following statements [RANDOMIZE] My gender holds back my ability to be a leader
Source: Nanos Research, online survey September 15th to 24th 2019, n=1145 girls 14-24 years of age.

© N
AN
OS
RES
EAR
CH
The “why”: Barriers – knowledge, skills, context
Three in four Canadian girls say they are confident or somewhat confident in their leadership abilities,
although eight in ten regularly or occasionally doubt they have what it takes to be a leader

© N
AN
OS
RES
EAR
CH
27%
48%
15%
7% 3%
Confident Somewhat confident Somewhat not confident
Not confident Unsure
Net score
+53.1
Confident/ Somewhat confident
14 to 15 years old (n=123) 73.4%
16 to 17 years old (n=190) 72.6%
18 to 19 years old (n=244) 74.4%
20 to 21 years old (n=226) 71.7%
22 to 24 years old (n=362) 79.9%
*Weighted to the true population proportion. *Charts may not add up to 100 due to rounding.
26
Confidence in leadership abilities
QUESTION – In general, are you confident, somewhat confident, somewhat not confident or not confident in your leadership abilities?
Source: Nanos Research, online survey September 15th to 24th 2019, n=1145 girls 14-24 years of age.
© N
AN
OS
RES
EAR
CH
First ranked
(n=1114)
Second ranked
(n=1001)
Third ranked (n=885)
Family 19.1% 17.0% 14.8%
Within peer groups 15.2% 21.2% 16.8%
Educational institutions 15.1% 13.7% 15.8%
Sports and Activities 12.1% 12.2% 11.0%
In a workplace 10.8% 9.9% 11.9%
Volunteerism and activism 9.6% 10.1% 15.0%
I have had no opportunities to become a leader 7.6% 2.2% 2.0%
Clubs and Community Groups 7.4% 13.3% 12.6%
Other 0.1% - 0.1
Unsure 2.8% 0.4% -
QUESTION – Where do you feel that you had/have opportunities to become a leader? Please rank the following where 1 is the place where you had the best opportunities to become a leader, 2 the second best place to become a leader and so on. [RANDOMIZE]
27
Opportunities to become a leader
Source: Nanos Research, online survey September 15th to 24th 2019, n=1114 girls 14-24 years of age.

© N
AN
OS
RES
EAR
CH
20%
61%
14% 5%
Regularly Occasionally Never Unsure
Net score
+6.3
QUESTION – Do you regularly, occasionally or never doubt that you have what it takes to be a good leader?
Occasionally
14 to 15 years old (n=123) 67.4%
16 to 17 years old (n=190) 57.9%
18 to 19 years old (n=244) 63.0%
20 to 21 years old (n=226) 58.9%
22 to 24 years old (n=362) 60.4%
*Weighted to the true population proportion. *Charts may not add up to 100 due to rounding.
28
Doubting capability to be a good leader
Source: Nanos Research, online survey September 15th to 24th 2019, n=1145 girls 14-24 years of age.

© N
AN
OS
RES
EAR
CH
20% 18%
14% 14% 13%
10% 10%
1% 0% 0% 0% 0%
5%
10%
15%
20%
25%
29
QUESTION – What tools do you think you need to achieve your leadership goals? (choose all that apply)
Tools needed to achieve leadership goals
Source: Nanos Research, online survey September 15th to 24th 2019, n=1145 girls 14-24 years of age.

© N
AN
OS
RES
EAR
CH
23.5% 22.1%
10.5% 8.6% 8.5% 8.4% 8.2%
6.3%
3.9%
0%
5%
10%
15%
20%
25%
Education Family support
Community support
A mentor Access to leadership
courses
I have the tools I need
Gender equality
Money Unsure
30
QUESTION – Do you have access to all the tools you need to achieve your leadership goals? (choose all the tools you currently have access to)
Access to tools needed to achieve leadership goals
Source: Nanos Research, online survey September 15th to 24th 2019, n=1145 girls 14-24 years of age.
© N
AN
OS
RES
EAR
CH
Frequency (n=1139)
0-5 46.0%
6-10 10.9%
11-15 2.0%
16-20 0.6%
21-25 0.3%
Over 25 0.5%
Unsure 39.7%
QUESTION – Please reflect for a moment on those in your immediate circle, excluding family who are in a position of power. This means a person who has authority or influence in your life (for example: teachers, coaches, and bosses). How many of those are women: _____ (enter number)
31
Women in a position of power
Mean Median
4.7 4.0
Source: Nanos Research, online survey September 15th to 24th 2019, n=1139 girls 14-24 years of age.

© N
AN
OS
RES
EAR
CH
Frequency (n=1120)
0-5 46.7%
6-10 10.1%
11-15 1.3%
16-20 0.2%
21-25 0.1%
Over 25 0.6%
Unsure 41.0%
QUESTION – Please reflect for a moment on those in your immediate circle, excluding family who are in a position of power. This means a person who has authority or influence in your life (for example: teachers, coaches, and bosses). How many of those are men: _____ (enter number)
32
Men in a position of power
Mean Median
4.2 3.0
Source: Nanos Research, online survey September 15th to 24th 2019, n=1120 girls 14-24 years of age.

© N
AN
OS
RES
EAR
CH
48%
42%
10%
Yes No Unsure
Net score
+5.9
QUESTION – Do you have a mentor(s)? (Examples of mentors can be people you consider leaders who have provided guidance, leadership, advice, inspiration, counselling, or personal or professional insight)
Yes
14 to 15 years old (n=123) 51.6%
16 to 17 years old (n=190) 50.4%
18 to 19 years old (n=244) 43.2%
20 to 21 years old (n=226) 46.4%
22 to 24 years old (n=362) 49.4%
*Weighted to the true population proportion. *Charts may not add up to 100 due to rounding.
33
Having a mentor
Source: Nanos Research, online survey September 15th to 24th 2019, n=1145 girls 14-24 years of age.

© N
AN
OS
RES
EAR
CH
23%
76%
1%
Male Female Other
QUESTION – If yes, what is the gender of your mentor?
Female
14 to 15 years old (n=59) 76.6%
16 to 17 years old (n=97) 71.8%
18 to 19 years old (n=113) 75.6%
20 to 21 years old (n=105) 77.2%
22 to 24 years old (n=172) 77.1%
*Weighted to the true population proportion. *Charts may not add up to 100 due to rounding.
34
Gender of mentor
Source: Nanos Research, online survey September 15th to 24th 2019, n=546 girls 14-24 years of age. Who report having a mentor.

© N
AN
OS
RES
EAR
CH
*Charts may not add up to 100 due to rounding
19%
37%
37%
38%
42%
45%
27%
13%
9%
10%
3%
3%
6%
5%
7%
0% 20% 40% 60% 80% 100%
I find men in positions of power approachable
I find women in positions of power approachable
I expect to be given personally challenging and
interesting work early in my career/professional life
Agree Somewhat agree Somewhat disagree Disagree Unsure
Net score
+69.4
+63.2
+20.1
QUESTION – Do you agree, somewhat agree, somewhat disagree or disagree with the following? [RANDOMIZE]
Professional life and positions of power
35 Source: Nanos Research, online survey September 15th to 24th 2019, n=1145 girls 14-24 years of age.

© N
AN
OS
RES
EAR
CH
37%
44%
9% 3% 7%
Agree Somewhat agree Somewhat disagree Disagree Unsure
Net score
+69.4
Agree/ Somewhat
agree
14 to 15 years old (n=123) 79.1%
16 to 17 years old (n=190) 85.0%
18 to 19 years old (n=244) 82.3%
20 to 21 years old (n=226) 79.6%
22 to 24 years old (n=362) 80.7%
*Weighted to the true population proportion. *Charts may not add up to 100 due to rounding.
36
Expectation of interesting work early in professional life
QUESTION – Do you agree, somewhat agree, somewhat disagree or disagree with the following? [RANDOMIZE] I expect to be given personally challenging and interesting work early in my career/professional life
Source: Nanos Research, online survey September 15th to 24th 2019, n=1145 girls 14-24 years of age.

© N
AN
OS
RES
EAR
CH
37%
42%
13% 3% 5%
Agree Somewhat agree Somewhat disagree Disagree Unsure
Net score
+63.2
Agree/ Somewhat
agree
14 to 15 years old (n=123) 75.0%
16 to 17 years old (n=190) 80.9%
18 to 19 years old (n=244) 78.9%
20 to 21 years old (n=226) 78.0%
22 to 24 years old (n=362) 80.5%
*Weighted to the true population proportion. *Charts may not add up to 100 due to rounding.
37
Approachability of women in positions of power
QUESTION – Do you agree, somewhat agree, somewhat disagree or disagree with the following? [RANDOMIZE] I find women in positions of power approachable
Source: Nanos Research, online survey September 15th to 24th 2019, n=1145 girls 14-24 years of age.

© N
AN
OS
RES
EAR
CH
19%
38%
27%
10% 6%
Agree Somewhat agree Somewhat disagree Disagree Unsure
Net score
+20.1
Agree/ Somewhat
agree
14 to 15 years old (n=123) 62.3%
16 to 17 years old (n=190) 59.4%
18 to 19 years old (n=244) 56.1%
20 to 21 years old (n=226) 48.3%
22 to 24 years old (n=362) 58.9%
*Weighted to the true population proportion. *Charts may not add up to 100 due to rounding.
38
Approachability of men in positions of power
QUESTION – Do you agree, somewhat agree, somewhat disagree or disagree with the following? [RANDOMIZE] I find men in positions of power approachable
Source: Nanos Research, online survey September 15th to 24th 2019, n=1145 girls 14-24 years of age.

© N
AN
OS
RES
EAR
CH
40%
12%
44%
4%
A man A woman I wouldn't assume either Unsure
QUESTION – Think of a CEO, did you picture:
I wouldn’t assume either
14 to 15 years old (n=123) 42.4%
16 to 17 years old (n=190) 40.2%
18 to 19 years old (n=244) 37.8%
20 to 21 years old (n=226) 49.8%
22 to 24 years old (n=362) 46.8%
*Weighted to the true population proportion. *Charts may not add up to 100 due to rounding.
39
Perceived gender of CEO
Source: Nanos Research, online survey September 15th to 24th 2019, n=1145 girls 14-24 years of age.

© N
AN
OS
RES
EAR
CH
How: Action (Use your power, talk about it, donate)
Canadian girls are more likely to say their female peers encourage or somewhat
encourage their leadership aspirations than their male peers

© N
AN
OS
RES
EAR
CH
15%
49%
32%
5%
Regularly Occasionally Never Unsure
Net score
-16.7
QUESTION – Do you talk about your leadership aspirations with your family or other trusted adults regularly, occasionally or never?
Occasionally
14 to 15 years old (n=123) 42.4%
16 to 17 years old (n=190) 47.1%
18 to 19 years old (n=244) 47.4%
20 to 21 years old (n=226) 53.2%
22 to 24 years old (n=362) 50.2%
*Weighted to the true population proportion. *Charts may not add up to 100 due to rounding.
41
Talking about leadership aspirations with family
Source: Nanos Research, online survey September 15th to 24th 2019, n=1145 girls 14-24 years of age.

© N
AN
OS
RES
EAR
CH
41%
37%
8% 4%
10%
Encourage Somewhat encourage Somewhat not encourage
Not encourage Unsure
Net score
+66.5
Encourage/ Somewhat encourage
14 to 15 years old (n=123) 77.2%
16 to 17 years old (n=190) 81.5%
18 to 19 years old (n=244) 80.1%
20 to 21 years old (n=226) 73.4%
22 to 24 years old (n=362) 79.1%
*Weighted to the true population proportion. *Charts may not add up to 100 due to rounding.
42
Female peers encouraging leadership aspirations
QUESTION – Do your female peers encourage, somewhat encourage, somewhat not encourage or not encourage your leadership aspirations?
Source: Nanos Research, online survey September 15th to 24th 2019, n=1145 girls 14-24 years of age.
© N
AN
OS
RES
EAR
CH
26%
39%
14%
8%
15%
Encourage Somewhat encourage Somewhat not encourage
Not encourage Unsure
Net score
+43.5
Encourage/ Somewhat encourage
14 to 15 years old (n=123) 54.3%
16 to 17 years old (n=190) 62.3%
18 to 19 years old (n=244) 65.9%
20 to 21 years old (n=226) 65.5%
22 to 24 years old (n=362) 69.5%
*Weighted to the true population proportion. *Charts may not add up to 100 due to rounding.
43
Male peers encouraging leadership aspirations
QUESTION – Do your male peers encourage, somewhat encourage, somewhat not encourage or not encourage your leadership aspirations?
Source: Nanos Research, online survey September 15th to 24th 2019, n=1145 girls 14-24 years of age.

© N
AN
OS
RES
EAR
CH
49%
6%
35%
11%
The boys’ teams are/were treated better and had a higher status
The girls’ teams are/were treated better and had a higher status
Both the girls and the boys are treated the same and have the same status
Unsure
QUESTION – When thinking of sports teams at your current or previous high school, are (or were) the girls’ teams treated the same and did they have the same status as the boys’ teams?
Boys’ teams are/were treated better
14 to 15 years old (n=123) 44.6%
16 to 17 years old (n=190) 50.7%
18 to 19 years old (n=244) 51.5%
20 to 21 years old (n=226) 47.3%
22 to 24 years old (n=362) 48.3%
*Weighted to the true population proportion. *Charts may not add up to 100 due to rounding.
44
Treatment of male versus female sports teams
Source: Nanos Research, online survey September 15th to 24th 2019, n=1145 girls 14-24 years of age.

© N
AN
OS
RES
EAR
CH
METHODOLOGY
Confidential 45

© N
AN
OS
RES
EAR
CH
METHODOLOGY
Nanos conducted an online survey of 1,145 Canadian girls, between 14 and 24 years of age, between September 15th to 24th 2019. Participants were administered a survey online. The results were statistically checked and weighted by age using the latest Census information and the sample is geographically stratified to be representative of Canada. No margin of error applies to this research. The research was commissioned by Plan International Canada and was conducted by Nanos Research. Note: Charts may not add up to 100 due to rounding.
46

© N
AN
OS
RES
EAR
CH
TECHNICAL NOTE
Element Description
Research sponsor Plan International Canada
Population and Final Sample Size
1145 Canadian girls 14 to 24 years of age.
Source of Sample QuestMindshare and Prodege
Type of Sample Non-probability
Margin of Error No margin of error applies to this research.
Mode of Survey Online survey
Sampling Method Base The sampling included Canadian girls from 14 to 24 years old.
Demographics (Captured)
Atlantic Canada, Quebec, Ontario, Prairies, British Columbia; Girls; between 14 and 24 years old. Six digit postal code was used to validate geography.
Fieldwork/Validation Not applicable.
Number of Calls Not applicable.
Time of Calls Participants were not called.
Field Dates September 15th to 24th, 2019.
Language of Survey The survey was conducted in both English and French.
Standards
Nanos Research is a member of the Canadian Research Insights Council (CRIC) and confirms that this research fully complies with all CRIC Standards including the CRIC Public Opinion Research Standards and Disclosure Requirements. https://canadianresearchinsightscouncil.ca/standards/
Element Description
Weighting of Data
The results were weighted by age using the latest Census information (2016) and the sample is geographically stratified to ensure a distribution across all regions of Canada. See tables for full weighting disclosure.
Screening Not applicable.
Excluded Demographics
Individuals younger than 14 years old or older than 24 years old; men; individuals without internet could not participate.
Stratification
By age using the latest Census information (2016) and the sample is geographically stratified to be representative of Canada. Smaller areas such as Atlantic Canada were marginally oversampled to allow for a minimum regional sample
Estimated Response Rate
Not applicable.
Question Order Question order in the preceding report reflects the order in which they appeared in the original questionnaire.
Question Content All questions asked are contained in the report.
Question Wording The questions in the preceding report are written exactly as they were asked to individuals.
Research/Data Collection Supplier
Nanos Research
Contact
Contact Nanos Research for more information or with any concerns or questions. http://www.nanos.co Telephone:(613) 234-4666 ext. 237 Email: [email protected].

© N
AN
OS
RES
EAR
CH
ABOUT NANOS
As one of North America’s premier market and public opinion research firms, we put strategic intelligence into the hands of decision makers. The majority of our work is for private sector and public facing organizations and ranges from market studies, managing reputation through to leveraging data intelligence. Nanos Research offers a vertically integrated full service quantitative and qualitative research practice to attain the highest standards and the greatest control over the research process. www.nanos.co
A public relations consultancy for executives and organizations with images to create, issues to manage, relationships to build, and reputations to protect in a digitally disrupted era. We serve senior leaders with PR counsel that is both strategic and social, informed by a deep understanding of analytics, content, communities, media, sustainability and technology. www.signaleadership.com
This international joint venture between dimap and Nanos brings together top research and data experts from North American and Europe to deliver exceptional data intelligence to clients. The team offers data intelligence services ranging from demographic and sentiment microtargeting; consumer sentiment identification and decision conversion; and, data analytics and profiling for consumer persuasion. www.nanosdimap.com
NRM is an affiliate of Nanos Research and Rutherford McKay Associates. Our service offerings are based on decades of professional experience and extensive research and include public acceptance and engagement, communications audits, and narrative development. www.nrmpublicaffairs.com
48

© N
AN
OS
RES
EAR
CH
TABULATIONS

2019-1488 – Plan Canada – Girls – STAT SHEET
Nanos conducted an online survey of 1,145 Canadian girls, 14 to 24 years of age, between September 15th to 24th, 2019.
www.nanos.co
Page 1
Region Age
Canada 2019-09 Atlantic Quebec Ontario Manitoba/Saskatchewan Alberta
British Columbia/North
14 to 15 years old
16 to 17 years old
18 to 19 years old
20 to 21 years old
22 to 24 years old
Question - Which adjectives most describe a good leader (choose all that apply).[RANDOMIZE]
Total Unwgt N 1144 129 199 312 152 175 177 123 190 244 226 361
Wgt N 999 65 212 399 76 118 128 151 173 185 194 296
Assertive % 39.4 47.6 25.3 42.4 44.7 40.5 45.1 33.5 37.6 41.7 39.6 41.9
Organized % 75.5 75.8 76.0 74.9 72.7 79.1 74.9 72.1 80.4 73.5 76.7 74.9
Calm % 51.4 55.7 45.4 49.0 54.7 55.9 60.6 56.2 56.3 48.7 52.9 46.9
Smart % 66.8 68.8 65.2 68.3 63.2 67.1 65.8 68.0 65.7 68.6 63.6 67.9
Bold % 36.0 27.8 29.2 38.0 36.5 39.9 41.3 36.8 35.4 41.2 32.7 34.7
Supportive % 69.3 75.5 62.0 69.5 73.6 74.7 70.1 65.3 70.4 73.1 68.4 68.9
Emotional % 8.5 6.7 4.4 11.0 5.7 6.9 11.8 12.3 5.6 12.8 7.4 6.4
Patient % 63.9 64.2 58.9 62.5 66.8 69.6 69.2 58.8 67.7 66.1 66.3 61.3
Humble % 46.9 42.9 41.2 45.9 49.9 52.2 54.6 39.6 46.4 52.4 45.0 48.6
Tactful % 34.6 33.4 31.4 34.1 33.3 34.6 42.8 28.0 30.8 30.4 31.9 44.7
Strong % 56.2 57.0 50.1 58.0 59.5 56.5 57.9 49.2 56.9 64.8 50.5 57.5
Imposing % 5.9 4.6 13.6 2.7 3.6 6.1 5.2 5.4 5.4 6.7 6.1 6.0
Stern % 12.9 13.6 8.5 15.2 15.3 12.0 11.7 19.2 9.6 12.9 10.0 13.3
Decisive % 53.2 65.4 53.2 51.7 48.1 56.1 52.2 45.6 57.1 53.5 49.5 57.1
Passionate % 62.2 67.5 56.4 64.2 59.2 62.7 63.9 57.4 64.0 69.5 61.7 59.3
Confident % 76.4 80.0 69.7 78.2 73.9 78.0 79.8 76.0 79.2 77.1 73.6 76.1
Caring % 57.3 55.7 51.4 55.8 60.3 64.9 64.0 62.2 58.4 59.3 52.4 56.1
Fearless % 31.2 29.9 24.9 34.6 31.0 29.4 33.1 32.0 29.5 38.9 24.1 31.5
Empathetic % 49.6 61.6 46.2 48.8 43.3 49.1 56.0 41.4 49.1 54.5 47.5 52.4
Helpful % 62.0 65.9 48.2 65.3 65.3 69.0 64.1 60.8 67.5 60.9 64.0 58.7
Passive % 7.0 2.2 8.9 6.0 6.6 9.2 7.3 8.9 8.1 9.2 2.1 7.1
Quiet % 3.7 3.9 3.6 3.9 3.2 2.8 4.0 4.4 2.2 3.5 2.1 5.3
Timid % 1.7 1.9 1.5 1.8 2.6 1.3 1.5 3.9 2.1 0.6 0.6 1.9
Gentle % 21.9 20.6 20.6 19.8 23.7 28.1 24.3 29.0 26.7 23.8 16.7 17.6
Unsure % 1.2 1.7 1.8 0.8 0.6 0.9 1.8 4.0 1.5 0.0 1.3 0.2

2019-1488 – Plan Canada – Girls – STAT SHEET
Nanos conducted an online survey of 1,145 Canadian girls, 14 to 24 years of age, between September 15th to 24th, 2019.
www.nanos.co
Page 2
Region Age
Canada 2019-09 Atlantic Quebec Ontario Manitoba/Saskatchewan Alberta
British Columbia/North
14 to 15 years old
16 to 17 years old
18 to 19 years old
20 to 21 years old
22 to 24 years old
Which adjectives describe girls (choose all that apply):[RANDOMIZE]
Total Unwgt N 1143 129 199 311 152 175 177 123 190 244 225 361
Wgt N 998 65 212 398 76 118 128 151 173 185 192 296
Assertive % 25.7 31.0 17.3 27.9 27.8 25.0 29.1 29.2 26.8 22.1 22.7 27.3
Organized % 49.4 51.8 46.9 51.6 46.7 45.4 51.0 52.7 51.7 47.3 49.2 47.8
Calm % 41.6 42.8 38.0 42.9 37.8 40.5 46.4 40.8 37.4 44.3 41.9 42.7
Smart % 61.6 59.6 57.3 63.8 59.3 64.6 61.5 64.4 58.1 62.4 58.8 63.5
Bold % 36.1 38.0 27.7 37.8 30.6 42.7 40.9 36.6 33.3 35.4 38.2 36.6
Supportive % 51.7 52.5 39.7 55.7 53.8 53.4 55.9 57.1 50.7 49.2 53.3 50.0
Emotional % 54.5 55.7 55.1 52.9 58.0 54.5 55.6 53.4 56.5 55.6 54.4 53.2
Patient % 47.7 53.4 39.0 51.5 46.4 47.7 48.3 48.3 45.5 41.2 49.0 51.9
Humble % 36.9 39.7 24.5 40.0 34.7 41.8 43.2 29.9 37.2 37.5 34.3 41.7
Tactful % 21.2 28.8 16.3 21.1 21.2 22.3 24.9 22.8 19.3 15.6 21.8 24.7
Strong % 52.0 55.8 43.6 55.5 54.2 49.0 54.6 50.3 50.3 52.2 52.7 53.4
Imposing % 11.4 16.3 9.8 10.6 8.9 12.7 14.4 11.0 9.8 9.5 13.1 12.8
Stern % 14.1 17.2 6.4 15.5 11.3 17.8 19.3 17.9 14.7 13.5 12.2 13.5
Decisive % 27.0 34.9 27.0 27.1 19.6 27.6 27.0 27.4 29.1 23.9 23.9 29.7
Passionate % 56.9 54.7 55.1 56.9 60.1 58.5 57.4 50.6 54.1 53.7 56.8 63.8
Confident % 51.8 56.5 43.5 55.4 53.8 50.7 51.6 50.5 47.2 53.7 49.3 55.5
Caring % 59.8 58.0 50.9 62.0 62.4 66.4 60.9 58.3 60.3 57.3 60.5 61.4
Fearless % 37.1 40.2 27.3 40.5 35.5 40.3 39.3 34.9 36.8 34.9 35.3 40.9
Empathetic % 50.4 48.2 41.0 54.1 51.0 53.6 51.7 51.6 44.8 46.0 51.2 55.2
Helpful % 49.3 52.5 41.4 49.5 49.1 56.1 54.0 49.7 51.4 46.1 49.2 49.9
Passive % 20.6 21.2 17.4 19.9 20.6 25.2 23.3 19.4 20.3 20.2 22.5 20.2
Quiet % 26.2 27.8 20.2 27.8 23.7 29.1 29.1 28.9 22.8 27.6 27.0 25.3
Timid % 22.1 22.3 26.4 20.2 23.5 18.6 23.0 26.1 20.3 23.3 20.5 21.3
Gentle % 51.6 47.7 48.8 52.8 50.7 51.3 54.9 47.0 51.3 50.4 53.6 53.4
Unsure % 16.7 22.5 18.2 14.1 15.9 22.1 15.0 15.8 19.5 20.7 16.5 13.2
2019-1488 – Plan Canada – Girls – STAT SHEET
Nanos conducted an online survey of 1,145 Canadian girls, 14 to 24 years of age, between September 15th to 24th, 2019.
www.nanos.co
Page 3
Region Age
Canada 2019-09 Atlantic Quebec Ontario Manitoba/Saskatchewan Alberta
British Columbia/North
14 to 15 years old
16 to 17 years old
18 to 19 years old
20 to 21 years old
22 to 24 years old
Question - Which adjectives describe boys (choose all that apply):[RANDOMIZE]
Total Unwgt N 1140 128 199 310 152 175 176 122 190 243 225 360
Wgt N 995 65 212 397 76 118 127 150 173 185 192 295
Assertive % 43.9 46.5 35.0 44.1 53.6 48.5 47.1 43.4 41.1 44.6 40.8 47.5
Organized % 19.2 30.9 13.7 19.2 19.0 21.9 20.1 17.6 20.6 16.0 20.4 20.5
Calm % 21.9 29.7 17.7 21.8 16.2 25.0 25.3 24.8 24.0 23.9 18.9 19.8
Smart % 42.4 47.7 44.1 39.6 45.3 39.4 46.7 38.9 40.7 44.0 42.8 44.0
Bold % 50.7 50.2 40.8 50.7 55.2 60.7 55.2 55.9 47.7 48.7 47.4 53.1
Supportive % 32.7 39.4 28.3 32.6 32.1 34.5 35.1 35.3 31.5 34.6 30.0 32.5
Emotional % 18.9 24.6 15.7 19.1 18.4 21.5 18.6 17.7 21.1 18.4 18.8 18.5
Patient % 22.1 29.7 18.8 22.3 19.2 22.1 25.0 21.6 20.5 20.1 24.2 23.3
Humble % 24.1 27.7 20.2 25.0 24.0 25.2 24.6 23.4 19.6 25.4 22.4 27.2
Tactful % 27.0 29.7 21.1 29.0 29.0 30.0 25.2 27.9 26.2 24.6 27.7 28.0
Strong % 61.9 59.8 61.5 59.7 68.7 62.5 65.8 66.6 62.4 60.3 63.2 59.3
Imposing % 30.0 35.9 41.2 24.8 26.6 32.7 24.2 27.9 26.9 30.3 33.4 30.6
Stern % 32.4 34.1 21.9 31.6 43.2 44.3 34.4 29.1 28.9 35.4 30.5 35.7
Decisive % 38.1 38.2 37.2 38.9 43.7 35.5 35.9 41.5 38.4 34.4 36.6 39.4
Passionate % 32.8 37.4 27.7 32.8 31.9 31.4 40.6 28.2 27.6 33.4 36.2 35.4
Confident % 55.2 54.5 55.2 54.2 58.1 56.8 55.1 52.7 53.6 58.1 55.5 55.3
Caring % 29.7 32.3 25.8 30.9 25.5 29.8 33.1 30.5 29.2 28.2 32.0 28.9
Fearless % 46.6 45.0 42.5 45.3 50.9 51.8 51.0 43.9 43.6 50.2 43.3 49.7
Empathetic % 19.5 27.5 18.8 18.1 16.1 21.8 20.7 17.0 21.1 22.6 19.9 17.6
Helpful % 33.4 39.3 29.8 32.4 33.0 34.5 39.0 30.7 34.3 30.6 31.6 37.3
Passive % 20.9 26.4 15.8 19.7 24.6 28.9 20.6 20.1 23.5 24.5 20.7 17.7
Quiet % 16.2 21.7 17.0 14.8 16.7 16.4 15.7 14.6 16.0 16.0 17.4 16.4
Timid % 14.9 22.2 10.0 15.4 16.6 18.3 13.6 16.7 13.9 15.7 15.4 13.7
Gentle % 22.1 28.0 23.1 19.4 19.8 25.2 24.2 18.4 23.8 21.6 23.7 22.2
Unsure % 18.5 24.1 17.2 19.3 11.4 20.2 17.7 15.2 24.0 20.2 19.2 15.3

2019-1488 – Plan Canada – Girls – STAT SHEET
Nanos conducted an online survey of 1,145 Canadian girls, 14 to 24 years of age, between September 15th to 24th, 2019.
www.nanos.co
Page 4
Region Age
Canada 2019-09 Atlantic Quebec Ontario Manitoba/Saskatchewan Alberta
British Columbia/North
14 to 15 years old
16 to 17 years old
18 to 19 years old
20 to 21 years old
22 to 24 years old
Question - Do you believe that achieving gender equality benefits:
Total Unwgt N
1145 129 199 312 152 175 178 123 190 244 226 362
Wgt N 1000 65 212 399 76 118 129 151 173 185 194 297
Only/mostly women % 7.9 3.4 8.0 6.5 8.5 9.8 12.3 10.7 6.4 8.2 7.3 7.6
All genders equally % 83.6 88.4 85.4 84.8 81.9 83.4 75.5 81.5 85.8 83.3 82.3 84.4
Only/mostly men % 1.9 0.0 0.9 2.7 2.0 1.3 2.1 1.2 3.0 1.9 4.1 0.1
No one % 2.0 3.2 1.0 2.5 3.3 0.5 2.2 1.9 1.6 2.4 2.3 2.0
Unsure % 4.6 4.9 4.6 3.4 4.2 5.0 7.9 4.8 3.2 4.1 4.0 5.9
Region Age
Canada 2019-09 Atlantic Quebec Ontario Manitoba/Saskatchewan Alberta
British Columbia/North
14 to 15 years old
16 to 17 years old
18 to 19 years old
20 to 21 years old
22 to 24 years old
Question - In general do you think girls/women do more, somewhat more, the same, somewhat less or less household chores as boys/men in your home?
Total Unwgt N
1145 129 199 312 152 175 178 123 190 244 226 362
Wgt N 1000 65 212 399 76 118 129 151 173 185 194 297
More % 36.1 28.3 25.0 42.3 44.4 40.3 30.0 35.4 37.0 34.4 36.7 36.5
Somewhat more % 36.2 40.9 39.9 34.0 30.9 33.9 39.5 35.7 37.4 40.3 35.0 33.9
The same % 20.6 24.6 19.4 19.1 19.8 22.1 24.3 21.7 18.4 17.6 20.6 23.2
Somewhat less % 3.1 2.3 8.4 1.5 1.7 0.0 3.3 3.2 3.1 2.2 2.8 3.7
Less % 1.3 0.9 2.4 0.5 2.1 2.1 1.2 1.3 1.9 2.0 0.2 1.4
Unsure % 2.7 3.0 4.9 2.5 1.1 1.6 1.8 2.7 2.3 3.4 4.7 1.3

2019-1488 – Plan Canada – Girls – STAT SHEET
Nanos conducted an online survey of 1,145 Canadian girls, 14 to 24 years of age, between September 15th to 24th, 2019.
www.nanos.co
Page 5
Region Age
Canada 2019-09 Atlantic Quebec Ontario Manitoba/Saskatchewan Alberta
British Columbia/North
14 to 15 years old
16 to 17 years old
18 to 19 years old
20 to 21 years old
22 to 24 years old
Question - Do you regularly, occasionally or never feel pressure to change how you act in order to achieve your leadership aspirations?
Total Unwgt N
1145 129 199 312 152 175 178 123 190 244 226 362
Wgt N 1000 65 212 399 76 118 129 151 173 185 194 297
Regularly % 19.0 13.6 18.4 22.3 12.9 20.3 14.6 16.6 20.4 16.1 17.6 22.0
Occasionally % 57.0 56.7 56.1 55.4 58.9 57.3 62.5 55.8 54.6 60.2 60.5 54.8
Never % 15.9 19.9 15.3 15.3 14.4 16.1 17.6 16.2 12.2 17.1 13.7 18.7
Unsure % 8.1 9.7 10.2 7.0 13.7 6.4 5.3 11.4 12.9 6.6 8.2 4.4
Do you agree, somewhat agree, somewhat disagree or disagree with the following statements [RANDOMIZE]
Region Age
Canada 2019-09 Atlantic Quebec Ontario Manitoba/Saskatchewan Alberta
British Columbia/North
14 to 15 years old
16 to 17 years old
18 to 19 years old
20 to 21 years old
22 to 24 years old
Question - People thought of me as smart growing up
Total Unwgt N
1145 129 199 312 152 175 178 123 190 244 226 362
Wgt N 1000 65 212 399 76 118 129 151 173 185 194 297
Agree % 49.5 61.2 52.5 48.3 47.1 49.7 43.4 48.7 48.7 50.7 43.1 53.8
Somewhat agree % 34.0 21.3 31.4 37.3 33.2 33.8 35.1 34.2 33.7 32.7 38.9 31.6
Somewhat disagree % 8.8 11.4 10.7 7.7 10.4 6.5 9.2 7.4 11.6 9.3 8.9 7.6
Disagree % 4.4 2.5 3.0 3.7 5.4 6.4 7.5 7.7 3.4 4.2 4.1 3.5
Unsure % 3.3 3.7 2.4 3.0 3.9 3.6 4.8 1.9 2.5 3.1 5.0 3.5

2019-1488 – Plan Canada – Girls – STAT SHEET
Nanos conducted an online survey of 1,145 Canadian girls, 14 to 24 years of age, between September 15th to 24th, 2019.
www.nanos.co
Page 6
Do you agree, somewhat agree, somewhat disagree or disagree with the following statements [RANDOMIZE]
Region Age
Canada 2019-09 Atlantic Quebec Ontario Manitoba/Saskatchewan Alberta
British Columbia/North
14 to 15 years old
16 to 17 years old
18 to 19 years old
20 to 21 years old
22 to 24 years old
Question - Girls and women have the natural abilities required to be good leaders
Total Unwgt N
1145 129 199 312 152 175 178 123 190 244 226 362
Wgt N 1000 65 212 399 76 118 129 151 173 185 194 297
Agree % 44.4 49.5 43.7 43.4 44.6 50.8 39.9 44.3 40.6 46.1 41.1 47.7
Somewhat agree % 37.4 35.4 36.5 39.1 36.3 33.6 39.3 36.0 42.2 37.9 36.8 35.6
Somewhat disagree % 9.2 5.9 8.8 9.6 12.2 7.6 10.1 12.0 8.9 9.0 10.7 7.2
Disagree % 4.3 2.2 4.5 3.5 3.3 4.2 8.5 5.1 3.3 3.0 3.4 6.0
Unsure % 4.6 7.0 6.5 4.4 3.7 3.8 2.2 2.6 5.1 4.0 8.0 3.5
Do you agree, somewhat agree, somewhat disagree or disagree with the following statements [RANDOMIZE]
Region Age
Canada 2019-09 Atlantic Quebec Ontario Manitoba/Saskatchewan Alberta
British Columbia/North
14 to 15 years old
16 to 17 years old
18 to 19 years old
20 to 21 years old
22 to 24 years old
Question - My opinions are/were valued when I was in school
Total Unwgt N
1145 129 199 312 152 175 178 123 190 244 226 362
Wgt N 1000 65 212 399 76 118 129 151 173 185 194 297
Agree % 28.4 30.6 27.9 28.3 25.7 27.8 30.5 33.3 37.7 26.7 22.3 25.4
Somewhat agree % 43.8 44.8 39.4 44.9 40.9 50.8 42.2 44.9 36.1 41.8 46.7 47.0
Somewhat disagree % 15.9 13.8 17.4 16.2 18.6 14.1 13.3 10.1 13.4 17.7 15.8 19.1
Disagree % 7.3 5.4 8.5 6.2 12.5 5.8 8.1 8.3 9.5 8.8 5.5 5.8
Unsure % 4.7 5.4 6.8 4.4 2.2 1.5 5.9 3.4 3.4 5.0 9.6 2.7

2019-1488 – Plan Canada – Girls – STAT SHEET
Nanos conducted an online survey of 1,145 Canadian girls, 14 to 24 years of age, between September 15th to 24th, 2019.
www.nanos.co
Page 7
Do you agree, somewhat agree, somewhat disagree or disagree with the following statements [RANDOMIZE]
Region Age
Canada 2019-09 Atlantic Quebec Ontario Manitoba/Saskatchewan Alberta
British Columbia/North
14 to 15 years old
16 to 17 years old
18 to 19 years old
20 to 21 years old
22 to 24 years old
Question - Boys and men have the natural abilities required to be good leaders
Total Unwgt N
1145 129 199 312 152 175 178 123 190 244 226 362
Wgt N 1000 65 212 399 76 118 129 151 173 185 194 297
Agree % 32.8 32.2 31.2 33.1 31.9 39.8 29.1 29.9 31.4 38.8 26.7 35.4
Somewhat agree % 36.9 44.1 40.4 37.0 39.4 32.0 30.1 38.9 38.1 32.7 42.0 34.4
Somewhat disagree % 14.7 11.8 13.4 14.2 14.2 13.1 21.7 15.8 14.5 14.9 14.1 14.5
Disagree % 10.4 7.8 9.0 10.4 7.8 10.9 15.1 10.9 10.6 7.9 8.4 12.9
Unsure % 5.2 4.1 5.9 5.3 6.8 4.1 4.1 4.4 5.4 5.7 8.7 2.7
Do you agree, somewhat agree, somewhat disagree or disagree with the following statements [RANDOMIZE]
Region Age
Canada 2019-09 Atlantic Quebec Ontario Manitoba/Saskatchewan Alberta
British Columbia/North
14 to 15 years old
16 to 17 years old
18 to 19 years old
20 to 21 years old
22 to 24 years old
Question - My gender holds back my ability to be a leader
Total Unwgt N
1145 129 199 312 152 175 178 123 190 244 226 362
Wgt N 1000 65 212 399 76 118 129 151 173 185 194 297
Agree % 7.9 9.1 9.2 8.3 10.8 6.2 3.9 5.8 4.2 10.0 8.2 9.6
Somewhat agree % 28.8 23.0 27.4 30.1 28.6 28.2 30.9 24.4 26.9 31.5 32.0 28.4
Somewhat disagree % 16.7 12.0 18.5 15.4 21.2 17.2 17.4 9.1 20.6 19.1 17.2 16.5
Disagree % 40.8 49.7 37.9 40.9 35.1 43.2 42.3 52.9 41.6 38.3 33.8 40.4
Unsure % 5.7 6.2 7.0 5.4 4.3 5.2 5.4 7.7 6.7 1.1 8.7 5.0

2019-1488 – Plan Canada – Girls – STAT SHEET
Nanos conducted an online survey of 1,145 Canadian girls, 14 to 24 years of age, between September 15th to 24th, 2019.
www.nanos.co
Page 8
Region Age
Canada 2019-09 Atlantic Quebec Ontario Manitoba/Saskatchewan Alberta
British Columbia/North
14 to 15 years old
16 to 17 years old
18 to 19 years old
20 to 21 years old
22 to 24 years old
Question - In general, are you confident, somewhat confident, somewhat not confident or not confident in your leadership abilities?
Total Unwgt N
1145 129 199 312 152 175 178 123 190 244 226 362
Wgt N 1000 65 212 399 76 118 129 151 173 185 194 297
Confident % 27.1 25.9 29.1 27.7 22.9 28.5 23.5 22.8 26.9 28.0 20.7 32.9
Somewhat confident % 48.0 45.2 48.3 48.0 50.6 46.8 48.5 50.6 45.7 46.4 51.0 47.0
Somewhat not confident
% 14.6 17.8 13.6 13.4 12.9 17.7 16.1 16.9 18.9 12.9 13.2 12.7
Not confident % 7.4 8.3 5.1 8.1 10.6 5.1 9.2 8.4 7.2 10.7 7.8 4.8
Unsure % 2.9 2.8 3.9 2.8 3.1 1.9 2.6 1.3 1.3 2.0 7.3 2.5
2019-1488 – Plan Canada – Girls – STAT SHEET
Nanos conducted an online survey of 1,145 Canadian girls, 14 to 24 years of age, between September 15th to 24th, 2019.
www.nanos.co
Page 9
Where do you feel that you had/have opportunities to become a leader? Please rank the following where 1 is the place where you had the best opportunities to become a leader, 2 the second best place to become a leader and so on. [RANDOMIZE]
Region Age
Canada 2019-09 Atlantic Quebec Ontario Manitoba/Saskatchewan Alberta
British Columbia/North
14 to 15 years old
16 to 17 years old
18 to 19 years old
20 to 21 years old
22 to 24 years old
Question - Rank 1 Total Unwgt N
1114 126 193 305 146 171 173 120 184 240 219 351
Wgt N 974 64 206 390 73 115 125 147 168 182 188 290
Family % 19.1 15.8 24.6 21.1 10.6 18.4 11.6 20.9 15.8 21.4 14.2 22.0
In a workplace % 10.8 19.4 11.6 8.9 8.8 9.8 13.2 4.1 6.7 8.7 16.1 14.5
Educational institutions % 15.1 11.9 12.8 16.2 13.7 16.9 15.9 11.5 17.2 15.1 16.4 14.7
Clubs and Community Groups
% 7.4 13.4 3.7 6.9 11.0 8.9 8.9 9.4 6.4 7.0 5.9 8.4
Within peer groups % 15.2 9.9 10.7 16.0 20.1 15.8 19.7 17.7 15.1 15.8 15.9 13.3
Sports and Activities % 12.1 14.1 12.3 11.8 17.5 8.9 11.4 11.7 12.6 14.0 13.0 10.2
Volunteerism and activism
% 9.6 6.6 8.6 10.5 8.2 12.4 8.6 10.2 13.7 9.5 9.3 7.3
I have had no opportunities to become a leader
% 7.6 6.4 11.5 6.0 8.4 6.7 7.0 12.5 7.4 6.6 6.5 6.6
Other % 0.1 0.0 0.5 0.0 0.0 0.0 0.0 0.0 0.0 0.6 0.0 0.0
Unsure % 2.8 2.5 3.6 2.6 1.6 2.1 3.7 2.0 4.9 1.5 2.7 3.0

2019-1488 – Plan Canada – Girls – STAT SHEET
Nanos conducted an online survey of 1,145 Canadian girls, 14 to 24 years of age, between September 15th to 24th, 2019.
www.nanos.co
Page 10
Where do you feel that you had/have opportunities to become a leader? Please rank the following where 1 is the place where you had the best opportunities to become a leader, 2 the second best place to become a leader and so on. [RANDOMIZE]
Region Age
Canada 2019-09 Atlantic Quebec Ontario Manitoba/Saskatchewan Alberta
British Columbia/North
14 to 15 years old
16 to 17 years old
18 to 19 years old
20 to 21 years old
22 to 24 years old
Question - Rank 2 Total Unwgt N
1001 107 160 278 136 158 162 103 168 222 196 312
Wgt N 875 56 171 354 69 107 117 128 152 168 169 258
Family % 17.0 11.8 19.6 16.1 19.6 15.5 18.3 28.2 7.7 12.9 19.3 18.2
In a workplace % 9.9 8.3 12.7 11.1 5.9 7.2 7.5 2.9 9.6 9.7 9.4 13.9
Educational institutions
% 13.7 16.6 11.5 14.8 14.3 14.4 11.4 14.5 14.0 8.7 14.9 15.6
Clubs and Community Groups
% 13.3 14.0 9.8 13.5 13.4 13.5 17.3 10.6 15.7 18.1 11.5 11.3
Within peer groups % 21.2 26.8 21.5 21.9 22.8 19.5 16.2 15.0 28.7 28.8 17.6 17.2
Sports and Activities % 12.2 7.4 14.4 10.8 12.9 13.6 13.9 16.6 12.2 8.4 13.7 11.6
Volunteerism and activism
% 10.1 13.3 7.4 9.4 7.9 13.8 12.4 11.1 8.2 10.1 11.0 10.1
I have had no opportunities to become a leader
% 2.2 0.5 1.8 2.4 1.9 2.4 2.9 1.1 3.3 3.0 2.0 1.6
Unsure % 0.4 1.3 1.3 0.0 1.4 0.0 0.0 0.0 0.5 0.3 0.6 0.6

2019-1488 – Plan Canada – Girls – STAT SHEET
Nanos conducted an online survey of 1,145 Canadian girls, 14 to 24 years of age, between September 15th to 24th, 2019.
www.nanos.co
Page 11
Where do you feel that you had/have opportunities to become a leader? Please rank the following where 1 is the place where you had the best opportunities to become a leader, 2 the second best place to become a leader and so on. [RANDOMIZE]
Region Age
Canada 2019-09 Atlantic Quebec Ontario Manitoba/Saskatchewan Alberta
British Columbia/North
14 to 15 years old
16 to 17 years old
18 to 19 years old
20 to 21 years old
22 to 24 years old
Question - Rank 3 Total Unwgt N
885 88 138 262 110 146 141 92 145 197 176 275
Wgt N 788 49 148 335 54 99 102 116 135 150 154 233
Family % 14.8 17.3 18.1 13.9 14.3 12.7 14.4 8.2 13.8 18.0 14.6 16.8
In a workplace % 11.9 4.9 16.2 8.1 15.4 17.2 14.5 1.7 8.2 10.0 19.8 15.2
Educational institutions % 15.8 13.2 11.0 19.0 17.0 16.4 12.1 15.7 14.4 13.3 19.2 16.0
Clubs and Community Groups
% 12.6 14.9 8.7 14.2 12.1 11.2 13.2 16.1 15.1 14.6 5.8 12.5
Within peer groups % 16.8 8.6 13.9 17.5 15.7 20.0 20.2 20.4 16.7 15.3 15.8 16.8
Sports and Activities % 11.0 14.5 14.1 10.2 6.5 13.0 8.3 16.6 10.8 12.0 10.8 7.9
Volunteerism and activism
% 15.0 24.5 17.3 14.4 16.7 7.9 15.2 18.8 18.5 14.4 13.3 12.6
I have had no opportunities to become a leader
% 2.0 2.1 0.7 2.7 2.3 1.2 2.1 2.5 2.5 2.0 0.7 2.3
Other % 0.1 0.0 0.0 0.0 0.0 0.6 0.0 0.0 0.0 0.4 0.0 0.0

2019-1488 – Plan Canada – Girls – STAT SHEET
Nanos conducted an online survey of 1,145 Canadian girls, 14 to 24 years of age, between September 15th to 24th, 2019.
www.nanos.co
Page 12
Where do you feel that you had/have opportunities to become a leader? Please rank the following where 1 is the place where you had the best opportunities to become a leader, 2 the second best place to become a leader and so on. [RANDOMIZE]
Region Age
Canada 2019-09 Atlantic Quebec Ontario Manitoba/Saskatchewan Alberta
British Columbia/North
14 to 15 years old
16 to 17 years old
18 to 19 years old
20 to 21 years old
22 to 24 years old
Question - Rank 4 Total Unwgt N
772 78 118 229 97 126 124 79 121 175 153 244
Wgt N 681 42 126 292 45 86 89 96 109 135 135 206
Family % 13.3 10.9 11.9 13.5 10.0 18.0 13.2 16.3 19.5 13.0 9.0 11.9
In a workplace % 11.2 24.3 8.6 8.8 16.8 10.6 14.7 5.6 9.9 14.5 10.1 13.2
Educational institutions
% 13.7 19.1 17.8 11.1 8.8 11.4 18.8 14.8 13.0 13.7 11.8 14.9
Clubs and Community Groups
% 17.9 8.4 20.2 20.9 11.2 17.3 13.2 24.3 18.5 15.0 19.7 15.2
Within peer groups % 15.0 12.9 19.5 12.3 19.3 16.5 15.2 20.3 15.9 10.9 18.1 12.8
Sports and Activities % 11.2 8.2 8.6 13.9 13.5 9.4 8.2 5.4 8.9 13.6 12.5 12.8
Volunteerism and activism
% 15.7 12.4 10.9 18.2 18.9 14.4 15.8 12.4 12.4 15.7 17.0 18.3
I have had no opportunities to become a leader
% 1.8 3.7 2.6 1.3 1.4 2.4 1.1 1.0 1.9 3.7 1.7 0.9
2019-1488 – Plan Canada – Girls – STAT SHEET
Nanos conducted an online survey of 1,145 Canadian girls, 14 to 24 years of age, between September 15th to 24th, 2019.
www.nanos.co
Page 13
Where do you feel that you had/have opportunities to become a leader? Please rank the following where 1 is the place where you had the best opportunities to become a leader, 2 the second best place to become a leader and so on. [RANDOMIZE]
Region Age
Canada 2019-09 Atlantic Quebec Ontario Manitoba/Saskatchewan Alberta
British Columbia/North
14 to 15 years old
16 to 17 years old
18 to 19 years old
20 to 21 years old
22 to 24 years old
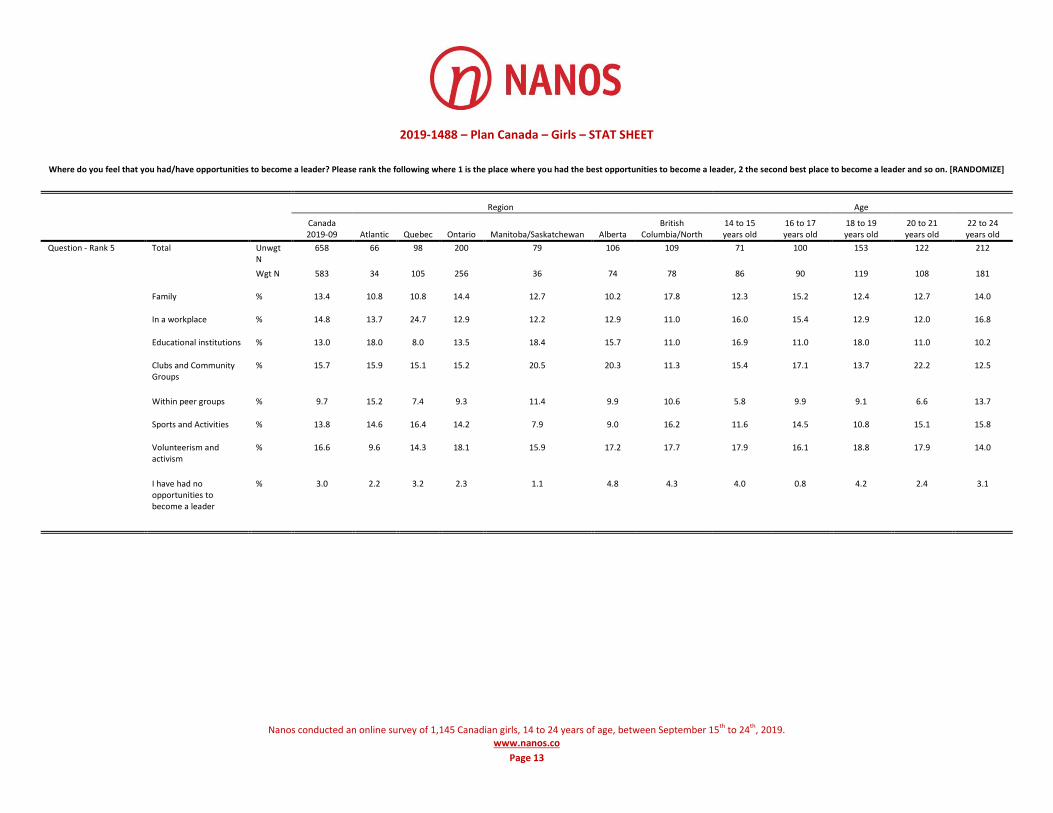
Question - Rank 5 Total Unwgt N
658 66 98 200 79 106 109 71 100 153 122 212
Wgt N 583 34 105 256 36 74 78 86 90 119 108 181
Family % 13.4 10.8 10.8 14.4 12.7 10.2 17.8 12.3 15.2 12.4 12.7 14.0
In a workplace % 14.8 13.7 24.7 12.9 12.2 12.9 11.0 16.0 15.4 12.9 12.0 16.8
Educational institutions % 13.0 18.0 8.0 13.5 18.4 15.7 11.0 16.9 11.0 18.0 11.0 10.2
Clubs and Community Groups
% 15.7 15.9 15.1 15.2 20.5 20.3 11.3 15.4 17.1 13.7 22.2 12.5
Within peer groups % 9.7 15.2 7.4 9.3 11.4 9.9 10.6 5.8 9.9 9.1 6.6 13.7
Sports and Activities % 13.8 14.6 16.4 14.2 7.9 9.0 16.2 11.6 14.5 10.8 15.1 15.8
Volunteerism and activism
% 16.6 9.6 14.3 18.1 15.9 17.2 17.7 17.9 16.1 18.8 17.9 14.0
I have had no opportunities to become a leader
% 3.0 2.2 3.2 2.3 1.1 4.8 4.3 4.0 0.8 4.2 2.4 3.1

2019-1488 – Plan Canada – Girls – STAT SHEET
Nanos conducted an online survey of 1,145 Canadian girls, 14 to 24 years of age, between September 15th to 24th, 2019.
www.nanos.co
Page 14
Where do you feel that you had/have opportunities to become a leader? Please rank the following where 1 is the place where you had the best opportunities to become a leader, 2 the second best place to become a leader and so on. [RANDOMIZE]
Region Age
Canada 2019-09 Atlantic Quebec Ontario Manitoba/Saskatchewan Alberta
British Columbia/North
14 to 15 years old
16 to 17 years old
18 to 19 years old
20 to 21 years old
22 to 24 years old
Question - Rank 6 Total Unwgt N
550 53 72 175 67 89 94 55 85 132 99 179
Wgt N 484 27 77 222 31 60 67 65 76 101 88 153
Family % 13.2 9.5 10.2 12.9 17.8 18.1 12.9 10.4 13.7 13.1 18.5 11.3
In a workplace % 18.2 20.2 20.8 18.1 25.7 15.2 13.8 23.7 16.0 20.0 14.5 17.9
Educational institutions % 11.4 7.0 19.2 9.7 6.1 8.8 14.5 9.1 12.5 16.4 12.8 7.6
Clubs and Community Groups
% 13.3 10.6 11.3 14.9 12.5 8.6 16.1 8.4 11.6 13.2 11.2 17.6
Within peer groups % 12.9 17.2 9.7 17.2 6.1 10.0 6.0 14.8 8.3 8.8 18.4 13.8
Sports and Activities % 15.9 17.3 12.6 13.0 17.3 27.0 17.9 21.8 20.6 13.2 10.1 16.1
Volunteerism and activism
% 13.3 14.7 16.3 11.5 14.5 12.3 15.9 11.8 12.9 14.4 13.4 13.4
I have had no opportunities to become a leader
% 1.8 3.5 0.0 2.6 0.0 0.0 3.0 0.0 4.4 0.9 1.1 2.3

2019-1488 – Plan Canada – Girls – STAT SHEET
Nanos conducted an online survey of 1,145 Canadian girls, 14 to 24 years of age, between September 15th to 24th, 2019.
www.nanos.co
Page 15
Where do you feel that you had/have opportunities to become a leader? Please rank the following where 1 is the place where you had the best opportunities to become a leader, 2 the second best place to become a leader and so on. [RANDOMIZE]
Region Age
Canada 2019-09 Atlantic Quebec Ontario Manitoba/Saskatchewan Alberta
British Columbia/North
14 to 15 years old
16 to 17 years old
18 to 19 years old
20 to 21 years old
22 to 24 years old
Question - Rank 7 Total Unwgt N
441 41 55 139 57 70 79 43 63 108 77 150
Wgt N 386 22 59 176 26 47 55 51 56 80 70 129
Family % 13.0 20.8 10.7 8.9 28.7 14.0 17.3 11.2 16.4 15.5 11.3 11.7
In a workplace % 18.4 5.0 18.0 20.5 16.9 19.5 17.4 32.2 16.7 13.9 24.0 13.5
Educational institutions % 10.7 18.5 5.2 11.1 12.7 12.0 10.5 9.6 8.4 8.3 11.8 13.1
Clubs and Community Groups
% 11.6 8.5 9.3 11.8 5.9 15.1 14.1 8.6 17.3 8.1 11.8 12.2
Within peer groups % 7.9 11.1 12.9 5.3 2.9 11.3 9.2 12.0 7.3 4.9 8.8 8.0
Sports and Activities % 21.6 25.0 18.7 24.5 22.0 15.3 19.2 11.0 19.2 30.3 22.8 20.8
Volunteerism and activism
% 12.4 7.5 23.5 12.1 9.4 10.2 6.7 9.2 10.2 14.1 7.6 16.2
I have had no opportunities to become a leader
% 4.1 3.6 1.7 5.2 1.7 2.6 5.6 6.2 4.4 3.7 1.9 4.5
Other % 0.2 0.0 0.0 0.5 0.0 0.0 0.0 0.0 0.0 1.2 0.0 0.0

2019-1488 – Plan Canada – Girls – STAT SHEET
Nanos conducted an online survey of 1,145 Canadian girls, 14 to 24 years of age, between September 15th to 24th, 2019.
www.nanos.co
Page 16
Where do you feel that you had/have opportunities to become a leader? Please rank the following where 1 is the place where you had the best opportunities to become a leader, 2 the second best place to become a leader and so on. [RANDOMIZE]
Region Age
Canada 2019-09 Atlantic Quebec Ontario Manitoba/Saskatchewan Alberta
British Columbia/North
14 to 15 years old
16 to 17 years old
18 to 19 years old
20 to 21 years old
22 to 24 years old
Question - Rank 8 Total Unwgt N
201 16 30 63 25 28 39 25 34 49 30 63
Wgt N 178 8 32 79 12 20 28 28 31 37 27 55
Family % 6.8 9.6 6.0 8.6 6.8 2.8 4.8 13.3 5.8 10.0 6.7 2.2
In a workplace % 8.0 4.2 3.1 12.6 3.7 5.8 4.8 1.2 17.9 6.3 6.7 7.5
Educational institutions % 9.3 10.5 6.2 11.1 3.0 2.8 14.7 17.7 1.1 11.1 5.6 10.3
Clubs and Community Groups
% 6.5 20.2 10.0 4.0 3.7 13.6 1.9 8.8 0.0 12.7 10.7 3.0
Within peer groups % 2.8 0.0 0.0 0.0 7.9 11.0 6.7 0.0 8.2 4.5 0.0 1.3
Sports and Activities % 6.6 10.9 9.7 6.4 6.5 0.0 6.8 0.0 6.4 6.8 12.3 6.9
Volunteerism and activism
% 8.9 11.7 6.7 7.6 7.8 7.3 16.0 19.6 8.0 4.7 4.6 9.0
I have had no opportunities to become a leader
% 50.6 32.8 55.2 49.6 60.7 56.8 44.1 36.1 52.6 43.8 53.4 59.8
Other % 0.5 0.0 2.9 0.0 0.0 0.0 0.0 3.4 0.0 0.0 0.0 0.0

2019-1488 – Plan Canada – Girls – STAT SHEET
Nanos conducted an online survey of 1,145 Canadian girls, 14 to 24 years of age, between September 15th to 24th, 2019.
www.nanos.co
Page 17
Where do you feel that you had/have opportunities to become a leader? Please rank the following where 1 is the place where you had the best opportunities to become a leader, 2 the second best place to become a leader and so on. [RANDOMIZE]
Region Age
Canada 2019-09 Atlantic Quebec Ontario Manitoba/Saskatchewan Alberta
British Columbia/North
14 to 15 years old
16 to 17 years old
18 to 19 years old
20 to 21 years old
22 to 24 years old
Question - Rank 9 Total Unwgt N
169 15 27 55 18 22 32 20 27 41 27 54
Wgt N 152 8 29 69 9 15 22 22 25 31 24 49
Family % 6.5 0.0 14.4 3.7 8.9 0.0 10.4 4.5 9.4 5.1 8.3 5.8
In a workplace % 5.0 4.4 3.5 8.3 0.0 0.0 2.4 10.4 5.0 4.9 5.3 2.5
Educational institutions
% 7.1 13.2 3.5 8.3 0.0 0.0 13.7 4.6 0.0 12.6 2.8 10.4
Clubs and Community Groups
% 7.9 7.9 7.7 6.5 3.9 23.3 3.6 13.0 7.5 6.0 12.2 5.0
Within peer groups % 2.4 0.0 0.0 1.7 0.0 4.5 8.0 4.4 2.7 0.0 0.0 4.0
Sports and Activities % 3.5 28.9 0.0 3.7 0.0 0.0 3.0 0.0 0.0 2.8 5.4 6.5
Volunteerism and activism
% 4.3 0.0 3.8 5.4 0.0 0.0 8.1 4.7 4.9 7.3 8.4 0.0
Other (specify below) % 20.6 0.0 21.9 22.3 15.6 25.9 19.1 30.2 23.1 20.0 18.3 16.6
Unsure % 19.1 30.3 11.4 12.7 41.0 35.5 24.5 4.5 16.5 22.2 18.6 25.1
I have had no opportunities to become a leader
% 23.6 15.3 33.8 27.4 30.5 10.9 7.0 23.8 30.9 19.0 20.7 24.0

2019-1488 – Plan Canada – Girls – STAT SHEET
Nanos conducted an online survey of 1,145 Canadian girls, 14 to 24 years of age, between September 15th to 24th, 2019.
www.nanos.co
Page 18
Where do you feel that you had/have opportunities to become a leader? Please rank the following where 1 is the place where you had the best opportunities to become a leader, 2 the second best place to become a leader and so on. [RANDOMIZE]
Region Age
Canada 2019-09 Atlantic Quebec Ontario Manitoba/Saskatchewan Alberta
British Columbia/North
14 to 15 years old
16 to 17 years old
18 to 19 years old
20 to 21 years old
22 to 24 years old
Question - Rank 9 - OTHERS
Total Unwgt N
9 0 2 2 0 3 2 3 0 4 1 1
Wgt N 8 0 2 2 0 3 2 3 0 3 1 1
Within peer groups % 19.3 0.0 0.0 0.0 0.0 21.2 60.7 29.7 0.0 0.0 100.0 0.0
Sports and Activities % 12.3 0.0 50.3 0.0 0.0 0.0 0.0 0.0 0.0 28.6 0.0 0.0
Volunteerism and activism
% 29.1 0.0 0.0 50.0 0.0 55.3 0.0 41.5 0.0 27.0 0.0 0.0
At home % 8.1 0.0 0.0 0.0 0.0 0.0 39.3 0.0 0.0 0.0 0.0 100.0
I have had no opportunities to become a leader
% 19.6 0.0 49.7 0.0 0.0 23.5 0.0 28.8 0.0 17.3 0.0 0.0
Other % 11.6 0.0 0.0 50.0 0.0 0.0 0.0 0.0 0.0 27.0 0.0 0.0

2019-1488 – Plan Canada – Girls – STAT SHEET
Nanos conducted an online survey of 1,145 Canadian girls, 14 to 24 years of age, between September 15th to 24th, 2019.
www.nanos.co
Page 19
Where do you feel that you had/have opportunities to become a leader? Please rank the following where 1 is the place where you had the best opportunities to become a leader, 2 the second best place to become a leader and so on. [RANDOMIZE]
Region Age
Canada 2019-09 Atlantic Quebec Ontario Manitoba/Saskatchewan Alberta
British Columbia/North
14 to 15 years old
16 to 17 years old
18 to 19 years old
20 to 21 years old
22 to 24 years old
Question - Rank 10 Total Unwgt N
131 11 18 40 17 19 26 13 22 34 22 40
Wgt N 114 6 19 50 8 14 17 15 19 25 20 34
Family % 5.4 0.0 0.0 11.1 0.0 4.0 0.0 12.8 0.0 9.6 9.1 0.0
In a workplace % 1.8 0.0 0.0 2.6 0.0 0.0 4.6 0.0 4.1 0.0 0.0 3.7
Educational institutions
% 3.9 14.8 0.0 4.8 4.3 0.0 4.7 0.0 1.8 4.8 4.2 5.9
Clubs and Community Groups
% 3.4 17.7 0.0 2.6 5.5 4.7 3.1 6.6 0.0 4.8 6.4 1.3
Within peer groups % 1.9 0.0 0.0 0.0 4.3 5.4 6.3 0.0 5.7 4.3 0.0 0.0
Sports and Activities % 6.9 0.0 11.2 7.6 0.0 0.0 11.0 0.0 5.2 6.7 16.7 5.3
Volunteerism and activism
% 5.3 8.6 11.4 1.9 0.0 10.5 5.6 22.3 0.0 3.8 2.4 3.4
Other (specify below) % 21.1 47.9 16.7 18.9 51.5 17.9 11.3 5.3 33.4 16.8 25.9 21.4
Unsure % 23.8 0.0 38.0 21.8 20.1 23.0 23.9 27.7 34.2 21.2 15.5 22.9
I have had no opportunities to become a leader
% 26.6 10.9 22.6 28.7 14.3 34.4 29.4 25.2 15.6 28.0 19.8 36.1

2019-1488 – Plan Canada – Girls – STAT SHEET
Nanos conducted an online survey of 1,145 Canadian girls, 14 to 24 years of age, between September 15th to 24th, 2019.
www.nanos.co
Page 20
Region Age
Canada 2019-09 Atlantic Quebec Ontario Manitoba/Saskatchewan Alberta
British Columbia/North
14 to 15 years old
16 to 17 years old
18 to 19 years old
20 to 21 years old
22 to 24 years old
Question - Do you regularly, occasionally or never doubt that you have what it takes to be a good leader?
Total Unwgt N
1145 129 199 312 152 175 178 123 190 244 226 362
Wgt N 1000 65 212 399 76 118 129 151 173 185 194 297
Regularly % 20.1 29.4 16.5 20.1 20.1 19.7 21.6 15.4 18.7 22.0 19.4 22.5
Occasionally % 61.2 53.3 60.2 63.9 63.0 63.5 55.5 67.4 57.9 63.0 58.9 60.4
Never % 13.8 14.0 17.0 12.3 12.0 11.9 16.1 9.8 20.6 10.0 15.4 13.3
Unsure % 4.9 3.3 6.3 3.8 4.9 4.9 6.8 7.5 2.9 5.0 6.2 3.9

2019-1488 – Plan Canada – Girls – STAT SHEET
Nanos conducted an online survey of 1,145 Canadian girls, 14 to 24 years of age, between September 15th to 24th, 2019.
www.nanos.co
Page 21
Region Age
Canada 2019-09 Atlantic Quebec Ontario Manitoba/Saskatchewan Alberta
British Columbia/North
14 to 15 years old
16 to 17 years old
18 to 19 years old
20 to 21 years old
22 to 24 years old
Question - What tools do you think you need to achieve your leadership goals? (choose all that apply)
Total Unwgt N
4062 461 631 1148 547 640 635 445 635 896 781 1305
Wgt N 3532 234 675 1465 269 433 456 535 593 668 675 1061
[Education] % 20.0 19.2 20.0 20.3 20.8 20.4 18.4 21.0 20.6 20.2 20.4 18.7
[A mentor ] % 12.6 11.5 11.4 12.4 12.6 13.0 15.4 11.8 10.6 12.0 13.1 14.3
[Family support] % 17.7 17.8 17.4 18.4 17.3 17.4 16.4 19.7 17.3 18.6 16.9 16.8
[Community support] % 13.9 12.9 12.2 14.1 16.5 14.6 14.3 14.6 13.5 13.8 14.4 13.6
[Access to leadership courses]
% 9.8 11.3 8.8 9.5 9.1 11.2 10.5 9.7 10.6 8.7 9.3 10.4
[Gender equality ] % 14.2 15.9 15.9 13.9 12.7 14.1 12.6 13.0 15.4 14.5 13.9 14.1
[Money] % 9.6 9.2 11.4 9.8 8.3 6.8 9.7 7.7 8.9 10.6 9.1 10.5
[Unsure] % 1.4 1.4 2.3 1.0 1.6 1.5 1.4 1.1 2.0 1.4 2.3 0.8
[Confidence/Ambition] % 0.4 0.5 0.0 0.3 0.5 0.6 1.1 0.8 0.8 0.1 0.3 0.3
[Mental capability] % 0.2 0.4 0.2 0.1 0.2 0.3 0.1 0.4 0.1 0.0 0.2 0.2
[Other] % 0.2 0.0 0.5 0.1 0.5 0.0 0.0 0.2 0.2 0.2 0.0 0.3
Region Age
Canada 2019-09 Atlantic Quebec Ontario Manitoba/Saskatchewan Alberta
British Columbia/North
14 to 15 years old
16 to 17 years old
18 to 19 years old
20 to 21 years old
22 to 24 years old
Question - Do you have access to all the tools you need to achieve your leadership goals? (choose all the tools you currently have access to)
Total Unwgt N
3130 338 468 842 406 524 552 387 595 641 570 937
Wgt N 2743 181 499 1077 208 374 405 463 534 497 477 773
[Education] % 23.4 22.9 25.5 23.9 23.2 22.7 20.6 23.1 23.5 24.9 24.9 21.7
[A mentor ] % 8.6 8.5 7.6 8.7 9.2 8.0 9.9 7.8 7.9 6.6 7.3 11.6
[Family support] % 22.1 22.1 22.2 22.0 22.0 22.9 21.2 20.4 21.0 22.4 23.3 22.8
[Community support] % 10.5 11.0 7.1 10.5 13.5 12.3 11.1 11.6 10.8 11.4 9.5 9.7
[Access to leadership courses]
% 8.5 7.7 6.3 9.3 8.6 8.2 9.8 8.4 8.9 7.8 8.6 8.7
[Gender equality ] % 8.2 9.7 8.3 7.6 6.4 9.0 9.1 9.1 8.2 8.3 7.4 8.0
[Money] % 6.3 5.9 7.2 6.2 6.7 5.2 6.4 4.8 7.6 6.6 6.4 6.0
[I have the tools I need] % 8.4 6.2 9.5 8.4 6.5 9.0 8.6 10.4 8.8 8.5 7.8 7.3
[Unsure] % 3.9 5.9 6.1 3.1 3.7 2.8 3.3 4.1 3.0 3.2 4.8 4.2
[Confidence/Ambition] % 0.1 0.0 0.2 0.1 0.0 0.0 0.0 0.2 0.0 0.2 0.0 0.0
[Other] % 0.1 0.0 0.0 0.1 0.2 0.0 0.0 0.0 0.2 0.1 0.0 0.0

2019-1488 – Plan Canada – Girls – STAT SHEET
Nanos conducted an online survey of 1,145 Canadian girls, 14 to 24 years of age, between September 15th to 24th, 2019.
www.nanos.co
Page 22
Region Age
Canada 2019-09 Atlantic Quebec Ontario Manitoba/Saskatchewan Alberta
British Columbia/North
14 to 15
years old
16 to 17
years old
18 to 19
years old
20 to 21
years old
22 to 24
years old
Question - Please reflect for a moment on those in your immediate circle, excluding family who are in a position of power. This means a person who has authority or influence in your life (for example: teachers, coaches, and bosses).How many of those are women? [Open]
Total Unwgt N
1139 128 198 312 151 173 177 122 190 243 224 360
Wgt N 995 65 211 399 76 116 128 150 173 185 192 296
Mean 4.7 5.0 4.4 4.5 4.2 4.4 6.4 6.7 4.9 4.7 4.4 3.9
Median 4.0 4.0 3.0 4.0 3.0 4.0 4.0 5.0 4.0 3.0 4.0 3.0
0 % 2.1 2.4 2.1 2.6 2.1 1.7 0.5 0.0 0.7 3.3 2.3 3.0
1 % 5.7 7.3 4.8 4.9 7.1 8.2 5.7 0.5 2.7 11.3 5.0 7.0
2 % 10.6 8.1 7.6 11.9 14.0 11.5 10.0 9.6 9.7 7.7 8.3 15.1
3 % 11.0 9.7 8.7 11.6 12.4 9.4 14.4 8.8 12.6 14.1 11.1 9.2
4 % 7.5 10.6 4.7 9.4 5.9 8.8 4.1 10.1 6.1 4.2 8.3 8.5
5 % 9.1 9.9 6.7 8.3 10.3 15.6 8.4 8.8 10.4 7.1 10.7 8.7
6 % 3.6 0.7 1.5 4.7 4.8 3.7 4.4 7.1 3.1 3.5 3.4 2.3
7 % 2.0 2.1 2.0 2.5 3.5 0.0 1.4 5.0 2.3 2.3 0.8 0.9
8 % 1.2 2.4 0.0 1.2 1.1 1.1 2.7 1.2 3.2 1.0 0.7 0.4
9 % 0.4 0.0 0.0 0.3 0.5 1.1 1.1 0.0 1.1 0.0 0.3 0.6
10 % 3.7 2.5 2.9 4.0 3.3 1.6 6.7 3.2 3.0 4.6 3.9 3.6
11 % 0.2 0.0 0.0 0.0 0.0 1.8 0.0 1.0 0.0 0.3 0.0 0.0
12 % 0.6 0.0 1.0 0.6 1.4 0.0 0.5 0.0 0.6 1.5 1.0 0.1
13 % 0.2 0.0 0.0 0.3 0.0 0.0 0.5 0.0 0.7 0.4 0.0 0.0
15 % 1.0 3.0 1.4 0.6 0.0 1.5 0.6 2.4 0.5 0.0 2.0 0.6
16 % 0.3 0.0 0.5 0.2 0.0 0.9 0.0 0.7 0.6 0.5 0.0 0.0
19 % 0.1 0.0 0.0 0.0 0.0 0.0 0.6 0.0 0.5 0.0 0.0 0.0
20 % 0.2 0.0 0.0 0.2 0.0 0.6 0.4 0.0 0.4 0.8 0.0 0.0
24 % 0.2 0.0 0.0 0.5 0.0 0.0 0.0 1.3 0.0 0.0 0.0 0.0
25 % 0.1 0.0 0.0 0.0 0.0 0.0 0.8 0.7 0.0 0.0 0.0 0.0
29 % 0.1 0.0 0.0 0.3 0.0 0.0 0.0 0.0 0.0 0.0 0.0 0.4
30 % 0.1 0.0 0.0 0.0 0.6 0.0 0.8 0.6 0.0 0.0 0.0 0.2
50 % 0.1 0.0 0.0 0.0 0.0 0.0 0.5 0.0 0.0 0.4 0.0 0.0
56 % 0.1 0.0 0.0 0.0 0.0 0.0 0.8 0.6 0.0 0.0 0.0 0.0
Unsure % 39.7 40.7 56.0 35.7 33.0 32.4 35.2 38.2 41.9 36.9 42.4 39.2
80 % 0.0 0.5 0.0 0.0 0.0 0.0 0.0 0.0 0.0 0.2 0.0 0.0
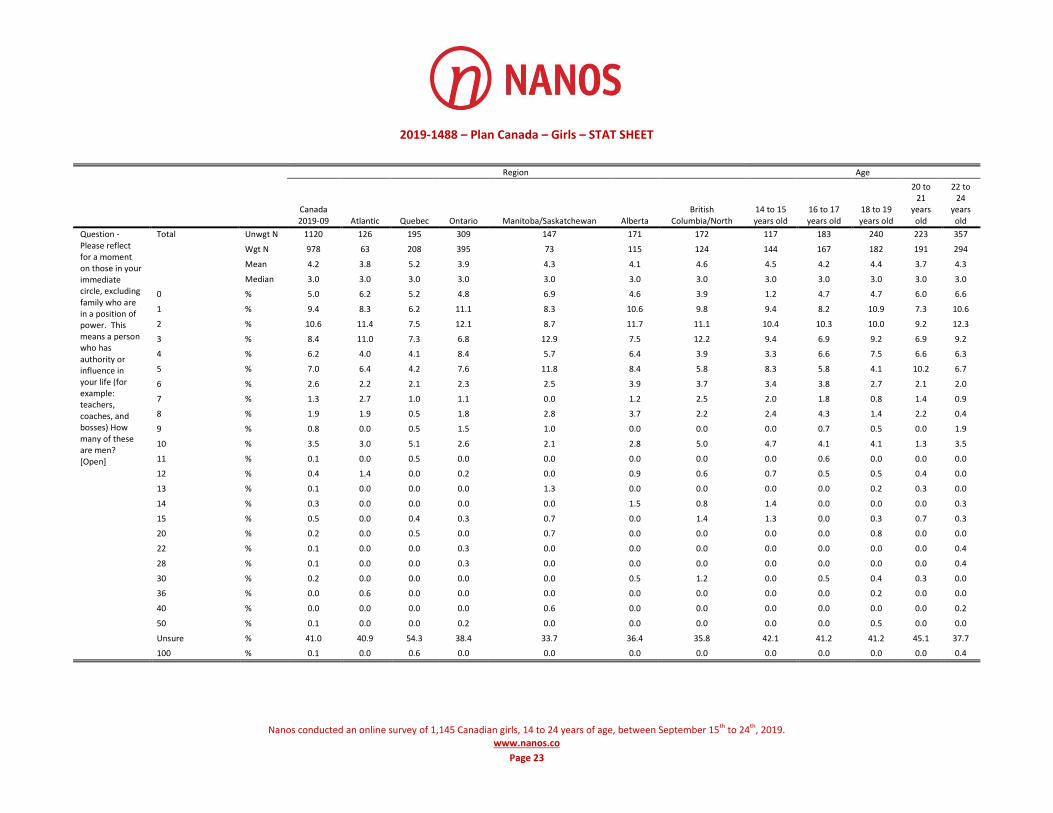
2019-1488 – Plan Canada – Girls – STAT SHEET
Nanos conducted an online survey of 1,145 Canadian girls, 14 to 24 years of age, between September 15th to 24th, 2019.
www.nanos.co
Page 23
Region Age
Canada 2019-09 Atlantic Quebec Ontario Manitoba/Saskatchewan Alberta
British Columbia/North
14 to 15 years old
16 to 17 years old
18 to 19 years old
20 to 21
years old
22 to 24
years old
Question - Please reflect for a moment on those in your immediate circle, excluding family who are in a position of power. This means a person who has authority or influence in your life (for example: teachers, coaches, and bosses) How many of these are men? [Open]
Total Unwgt N 1120 126 195 309 147 171 172 117 183 240 223 357
Wgt N 978 63 208 395 73 115 124 144 167 182 191 294
Mean 4.2 3.8 5.2 3.9 4.3 4.1 4.6 4.5 4.2 4.4 3.7 4.3
Median 3.0 3.0 3.0 3.0 3.0 3.0 3.0 3.0 3.0 3.0 3.0 3.0
0 % 5.0 6.2 5.2 4.8 6.9 4.6 3.9 1.2 4.7 4.7 6.0 6.6
1 % 9.4 8.3 6.2 11.1 8.3 10.6 9.8 9.4 8.2 10.9 7.3 10.6
2 % 10.6 11.4 7.5 12.1 8.7 11.7 11.1 10.4 10.3 10.0 9.2 12.3
3 % 8.4 11.0 7.3 6.8 12.9 7.5 12.2 9.4 6.9 9.2 6.9 9.2
4 % 6.2 4.0 4.1 8.4 5.7 6.4 3.9 3.3 6.6 7.5 6.6 6.3
5 % 7.0 6.4 4.2 7.6 11.8 8.4 5.8 8.3 5.8 4.1 10.2 6.7
6 % 2.6 2.2 2.1 2.3 2.5 3.9 3.7 3.4 3.8 2.7 2.1 2.0
7 % 1.3 2.7 1.0 1.1 0.0 1.2 2.5 2.0 1.8 0.8 1.4 0.9
8 % 1.9 1.9 0.5 1.8 2.8 3.7 2.2 2.4 4.3 1.4 2.2 0.4
9 % 0.8 0.0 0.5 1.5 1.0 0.0 0.0 0.0 0.7 0.5 0.0 1.9
10 % 3.5 3.0 5.1 2.6 2.1 2.8 5.0 4.7 4.1 4.1 1.3 3.5
11 % 0.1 0.0 0.5 0.0 0.0 0.0 0.0 0.0 0.6 0.0 0.0 0.0
12 % 0.4 1.4 0.0 0.2 0.0 0.9 0.6 0.7 0.5 0.5 0.4 0.0
13 % 0.1 0.0 0.0 0.0 1.3 0.0 0.0 0.0 0.0 0.2 0.3 0.0
14 % 0.3 0.0 0.0 0.0 0.0 1.5 0.8 1.4 0.0 0.0 0.0 0.3
15 % 0.5 0.0 0.4 0.3 0.7 0.0 1.4 1.3 0.0 0.3 0.7 0.3
20 % 0.2 0.0 0.5 0.0 0.7 0.0 0.0 0.0 0.0 0.8 0.0 0.0
22 % 0.1 0.0 0.0 0.3 0.0 0.0 0.0 0.0 0.0 0.0 0.0 0.4
28 % 0.1 0.0 0.0 0.3 0.0 0.0 0.0 0.0 0.0 0.0 0.0 0.4
30 % 0.2 0.0 0.0 0.0 0.0 0.5 1.2 0.0 0.5 0.4 0.3 0.0
36 % 0.0 0.6 0.0 0.0 0.0 0.0 0.0 0.0 0.0 0.2 0.0 0.0
40 % 0.0 0.0 0.0 0.0 0.6 0.0 0.0 0.0 0.0 0.0 0.0 0.2
50 % 0.1 0.0 0.0 0.2 0.0 0.0 0.0 0.0 0.0 0.5 0.0 0.0
Unsure % 41.0 40.9 54.3 38.4 33.7 36.4 35.8 42.1 41.2 41.2 45.1 37.7
100 % 0.1 0.0 0.6 0.0 0.0 0.0 0.0 0.0 0.0 0.0 0.0 0.4

2019-1488 – Plan Canada – Girls – STAT SHEET
Nanos conducted an online survey of 1,145 Canadian girls, 14 to 24 years of age, between September 15th to 24th, 2019.
www.nanos.co
Page 24
Region Age
Canada 2019-09 Atlantic Quebec Ontario Manitoba/Saskatchewan Alberta
British Columbia/North
14 to 15 years old
16 to 17 years old
18 to 19 years old
20 to 21 years old
22 to 24 years old
Question - Do you have a mentor(s)? (Examples of mentors can be people you consider leaders who have provided guidance, leadership, advice, inspiration, counselling, or personal or professional insight)
Total Unwgt N
1145 129 199 312 152 175 178 123 190 244 226 362
Wgt N 1000 65 212 399 76 118 129 151 173 185 194 297
Yes % 48.2 44.1 34.4 52.4 51.0 59.3 47.9 51.6 50.4 43.2 46.4 49.4
No % 42.3 47.3 53.0 41.0 38.6 30.2 39.6 33.7 40.1 46.1 45.4 43.6
Unsure % 9.5 8.6 12.6 6.6 10.4 10.5 12.5 14.7 9.5 10.7 8.2 7.0
Region Age
Canada 2019-09 Atlantic Quebec Ontario Manitoba/Saskatchewan Alberta
British Columbia/North
14 to 15 years old
16 to 17 years old
18 to 19 years old
20 to 21 years old
22 to 24 years old
Question – [IF THEY HAVE A MENTOR] If yes, what is the gender of your mentor?
Total Unwgt N
546 55 68 160 75 103 85 59 97 113 105 172
Wgt N 480 29 73 208 39 70 62 78 87 80 90 145
Male % 23.5 13.3 33.9 20.2 15.0 21.3 34.8 23.4 27.0 24.4 21.4 22.3
Female % 75.8 84.8 66.1 79.2 85.0 77.6 63.9 76.6 71.8 75.6 77.2 77.1
Other % 0.7 1.9 0.0 0.6 0.0 1.1 1.3 0.0 1.2 0.0 1.4 0.7
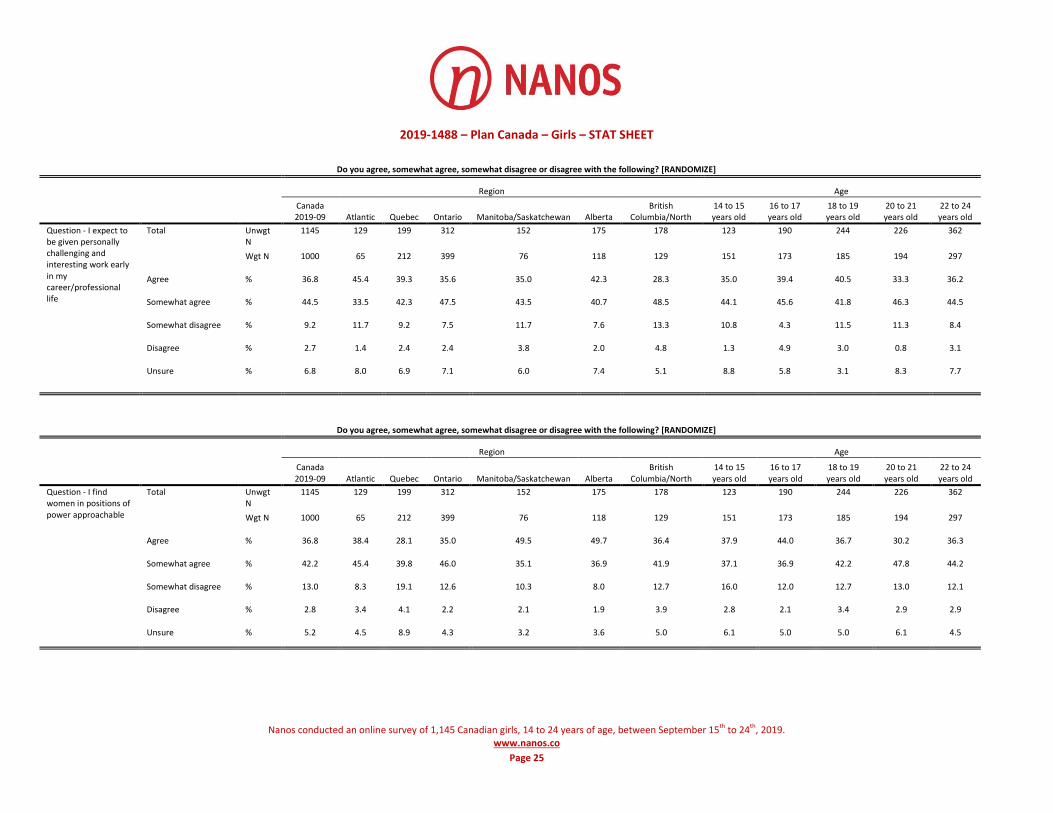
2019-1488 – Plan Canada – Girls – STAT SHEET
Nanos conducted an online survey of 1,145 Canadian girls, 14 to 24 years of age, between September 15th to 24th, 2019.
www.nanos.co
Page 25
Do you agree, somewhat agree, somewhat disagree or disagree with the following? [RANDOMIZE]
Region Age
Canada 2019-09 Atlantic Quebec Ontario Manitoba/Saskatchewan Alberta
British Columbia/North
14 to 15 years old
16 to 17 years old
18 to 19 years old
20 to 21 years old
22 to 24 years old
Question - I expect to be given personally challenging and interesting work early in my career/professional life
Total Unwgt N
1145 129 199 312 152 175 178 123 190 244 226 362
Wgt N 1000 65 212 399 76 118 129 151 173 185 194 297
Agree % 36.8 45.4 39.3 35.6 35.0 42.3 28.3 35.0 39.4 40.5 33.3 36.2
Somewhat agree % 44.5 33.5 42.3 47.5 43.5 40.7 48.5 44.1 45.6 41.8 46.3 44.5
Somewhat disagree % 9.2 11.7 9.2 7.5 11.7 7.6 13.3 10.8 4.3 11.5 11.3 8.4
Disagree % 2.7 1.4 2.4 2.4 3.8 2.0 4.8 1.3 4.9 3.0 0.8 3.1
Unsure % 6.8 8.0 6.9 7.1 6.0 7.4 5.1 8.8 5.8 3.1 8.3 7.7
Do you agree, somewhat agree, somewhat disagree or disagree with the following? [RANDOMIZE]
Region Age
Canada 2019-09 Atlantic Quebec Ontario Manitoba/Saskatchewan Alberta
British Columbia/North
14 to 15 years old
16 to 17 years old
18 to 19 years old
20 to 21 years old
22 to 24 years old
Question - I find women in positions of power approachable
Total Unwgt N
1145 129 199 312 152 175 178 123 190 244 226 362
Wgt N 1000 65 212 399 76 118 129 151 173 185 194 297
Agree % 36.8 38.4 28.1 35.0 49.5 49.7 36.4 37.9 44.0 36.7 30.2 36.3
Somewhat agree % 42.2 45.4 39.8 46.0 35.1 36.9 41.9 37.1 36.9 42.2 47.8 44.2
Somewhat disagree % 13.0 8.3 19.1 12.6 10.3 8.0 12.7 16.0 12.0 12.7 13.0 12.1
Disagree % 2.8 3.4 4.1 2.2 2.1 1.9 3.9 2.8 2.1 3.4 2.9 2.9
Unsure % 5.2 4.5 8.9 4.3 3.2 3.6 5.0 6.1 5.0 5.0 6.1 4.5

2019-1488 – Plan Canada – Girls – STAT SHEET
Nanos conducted an online survey of 1,145 Canadian girls, 14 to 24 years of age, between September 15th to 24th, 2019.
www.nanos.co
Page 26
Do you agree, somewhat agree, somewhat disagree or disagree with the following? [RANDOMIZE]
Region Age
Canada 2019-09 Atlantic Quebec Ontario Manitoba/Saskatchewan Alberta
British Columbia/North
14 to 15 years old
16 to 17 years old
18 to 19 years old
20 to 21 years old
22 to 24 years old
Question - I find men in positions of power approachable
Total Unwgt N
1145 129 199 312 152 175 178 123 190 244 226 362
Wgt N 1000 65 212 399 76 118 129 151 173 185 194 297
Agree % 18.8 23.7 18.0 17.3 18.6 21.6 19.4 24.6 22.2 19.5 9.6 19.3
Somewhat agree % 38.2 30.8 32.2 39.0 39.0 44.8 42.5 37.7 37.2 36.6 38.7 39.6
Somewhat disagree % 27.1 29.8 30.9 28.3 27.0 19.3 23.3 23.8 27.0 26.7 32.6 25.7
Disagree % 9.8 9.5 9.4 9.0 12.8 10.0 10.7 6.4 8.7 11.5 11.8 9.7
Unsure % 6.2 6.2 9.4 6.4 2.7 4.3 4.1 7.4 4.9 5.8 7.4 5.8
Region Age
Canada 2019-09 Atlantic Quebec Ontario Manitoba/Saskatchewan Alberta
British Columbia/North
14 to 15 years old
16 to 17 years old
18 to 19 years old
20 to 21 years old
22 to 24 years old
Question - Think of a CEO, did you picture:
Total Unwgt N
1145 129 199 312 152 175 178 123 190 244 226 362
Wgt N 1000 65 212 399 76 118 129 151 173 185 194 297
A Man % 39.9 38.2 41.1 39.5 42.5 42.6 35.9 41.7 45.4 43.3 32.5 38.4
A Woman % 11.8 7.3 16.2 10.8 9.0 10.8 12.6 11.2 11.5 12.4 12.6 11.4
I wouldn’t assume either
% 43.9 50.8 34.2 46.7 44.7 42.8 48.4 42.4 40.2 37.8 49.8 46.8
Unsure % 4.4 3.7 8.5 3.0 3.8 3.8 3.1 4.6 2.8 6.5 5.1 3.3

2019-1488 – Plan Canada – Girls – STAT SHEET
Nanos conducted an online survey of 1,145 Canadian girls, 14 to 24 years of age, between September 15th to 24th, 2019.
www.nanos.co
Page 27
Region Age
Canada 2019-09 Atlantic Quebec Ontario Manitoba/Saskatchewan Alberta
British Columbia/North
14 to 15 years old
16 to 17 years old
18 to 19 years old
20 to 21 years old
22 to 24 years old
Question - Do you talk about your leadership aspirations with your family or other trusted adults regularly, occasionally or never?
Total Unwgt N
1145 129 199 312 152 175 178 123 190 244 226 362
Wgt N 1000 65 212 399 76 118 129 151 173 185 194 297
Regularly % 14.8 11.4 12.0 16.2 11.0 20.1 13.8 15.6 11.1 12.9 11.4 19.8
Occasionally % 48.6 55.6 50.3 47.5 46.9 41.7 52.5 42.4 47.1 47.4 53.2 50.2
Never % 31.5 26.7 32.7 30.9 36.8 30.5 31.5 34.7 36.5 34.2 28.9 27.0
Unsure % 5.2 6.3 4.9 5.4 5.3 7.7 2.3 7.3 5.3 5.5 6.5 3.1
Region Age
Canada 2019-09 Atlantic Quebec Ontario Manitoba/Saskatchewan Alberta
British Columbia/North
14 to 15 years old
16 to 17 years old
18 to 19 years old
20 to 21 years old
22 to 24 years old
Question - Do your female peers encourage, somewhat encourage, somewhat not encourage or not encourage your leadership aspirations?
Total Unwgt N
1145 129 199 312 152 175 178 123 190 244 226 362
Wgt N 1000 65 212 399 76 118 129 151 173 185 194 297
Encourage % 40.9 40.2 34.6 39.6 45.1 51.2 43.5 38.1 38.7 41.7 42.4 42.0
Somewhat encourage % 37.4 29.3 39.1 40.9 44.0 28.1 32.7 39.1 42.8 38.4 31.0 37.1
Somewhat not encourage
% 8.2 7.0 11.7 7.4 4.8 7.8 7.7 9.9 9.4 7.0 9.0 6.7
Not encourage % 3.6 9.2 4.6 2.5 1.4 2.4 5.2 2.1 0.9 4.4 5.6 4.2
Unsure % 9.9 14.3 10.0 9.6 4.7 10.5 10.9 10.7 8.3 8.4 12.1 9.9
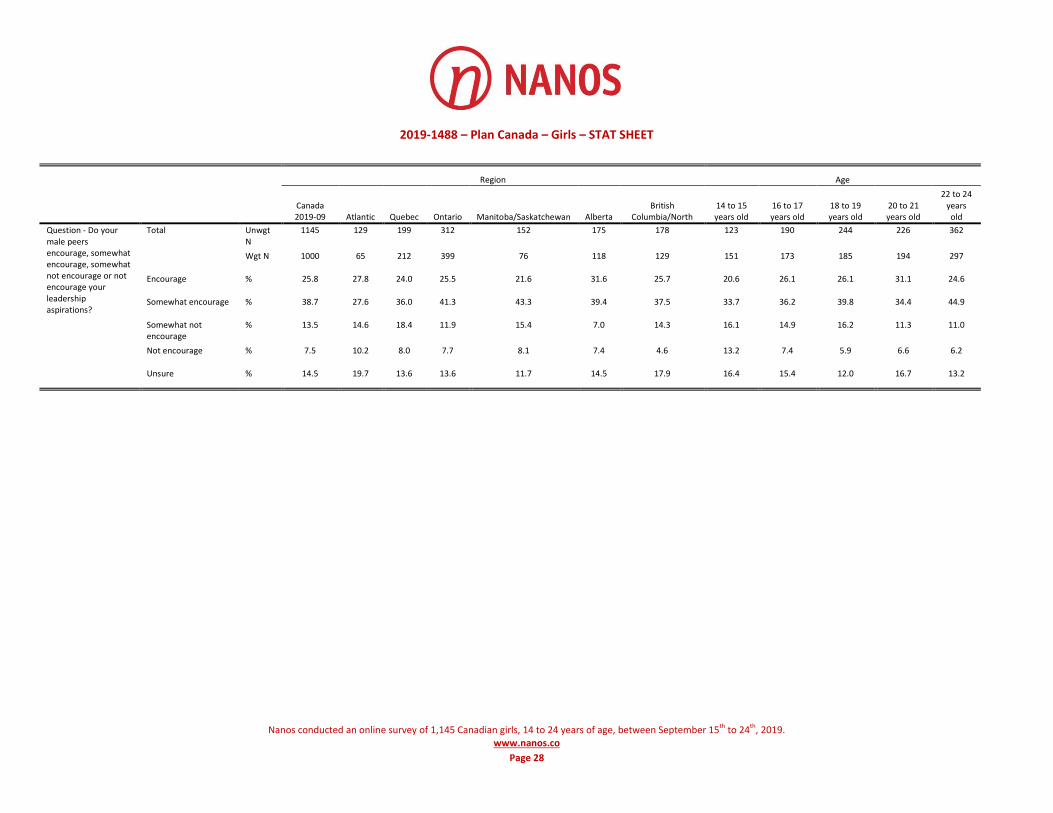
2019-1488 – Plan Canada – Girls – STAT SHEET
Nanos conducted an online survey of 1,145 Canadian girls, 14 to 24 years of age, between September 15th to 24th, 2019.
www.nanos.co
Page 28
Region Age
Canada 2019-09 Atlantic Quebec Ontario Manitoba/Saskatchewan Alberta
British Columbia/North
14 to 15 years old
16 to 17 years old
18 to 19 years old
20 to 21 years old
22 to 24 years old
Question - Do your male peers encourage, somewhat encourage, somewhat not encourage or not encourage your leadership aspirations?
Total Unwgt N
1145 129 199 312 152 175 178 123 190 244 226 362
Wgt N 1000 65 212 399 76 118 129 151 173 185 194 297
Encourage % 25.8 27.8 24.0 25.5 21.6 31.6 25.7 20.6 26.1 26.1 31.1 24.6
Somewhat encourage % 38.7 27.6 36.0 41.3 43.3 39.4 37.5 33.7 36.2 39.8 34.4 44.9
Somewhat not encourage
% 13.5 14.6 18.4 11.9 15.4 7.0 14.3 16.1 14.9 16.2 11.3 11.0
Not encourage % 7.5 10.2 8.0 7.7 8.1 7.4 4.6 13.2 7.4 5.9 6.6 6.2
Unsure % 14.5 19.7 13.6 13.6 11.7 14.5 17.9 16.4 15.4 12.0 16.7 13.2

2019-1488 – Plan Canada – Girls – STAT SHEET
Nanos conducted an online survey of 1,145 Canadian girls, 14 to 24 years of age, between September 15th to 24th, 2019.
www.nanos.co
Page 29
Region Age
Canada 2019-09 Atlantic Quebec Ontario Manitoba/Saskatchewan Alberta
British Columbia/North
14 to 15 years old
16 to 17 years old
18 to 19 years old
20 to 21 years old
22 to 24 years old
Question - When thinking of sports teams at your current or previous high school, are (or were) the girls’ teams treated the same and did they have the same status as the boys’ teams?
Total Unwgt N
1145 129 199 312 152 175 178 123 190 244 226 362
Wgt N 1000 65 212 399 76 118 129 151 173 185 194 297
The boys’ teams are/were treated better and had a higher status
% 48.6 58.0 52.7 46.7 56.7 41.2 44.8 44.6 50.7 51.5 47.3 48.3
The girls’ teams are/were treated better and had a higher status
% 5.7 2.8 6.7 5.9 5.3 4.8 6.1 5.2 4.2 7.1 5.6 6.1
Both the girls and the boys are treated the same and have the same status
% 35.2 30.4 31.6 36.9 31.6 41.4 35.0 38.5 37.6 33.0 33.3 34.9
Unsure % 10.5 8.8 9.1 10.4 6.3 12.6 14.1 11.7 7.5 8.4 13.8 10.6

2019-1488 – Plan Canada – Girls – Grouped Age – STAT SHEET
Nanos conducted an online survey of 1,145 Canadian girls, 14 to 24 years of age, between September 15th to 24th, 2019.
www.nanos.co
Page 1
Age
Canada 2019-09 14 to 17 years old 18 to 24 years old
Question - Which adjectives most describe a good leader (choose all that apply).[RANDOMIZE]
Total Unwgt N 11375 3142 8233
Wgt N 9936 3220 6717
Assertive % 4.0 3.6 4.1
Organized % 7.6 7.7 7.5
Calm % 5.2 5.7 4.9
Smart % 6.7 6.7 6.7
Bold % 3.6 3.6 3.6
Supportive % 7.0 6.8 7.0
Emotional % 0.9 0.9 0.8
Patient % 6.4 6.4 6.4
Humble % 4.7 4.4 4.9
Tactful % 3.5 3.0 3.7
Strong % 5.6 5.4 5.8
Imposing % 0.6 0.5 0.6
Stern % 1.3 1.4 1.2
Decisive % 5.4 5.2 5.4
Passionate % 6.3 6.1 6.3
Confident % 7.7 7.8 7.6
Caring % 5.8 6.1 5.6
Fearless % 3.1 3.1 3.2
Empathetic % 5.0 4.6 5.2
Helpful % 6.2 6.5 6.1
Passive % 0.7 0.9 0.6
Quiet % 0.4 0.3 0.4
Timid % 0.2 0.3 0.1
Gentle % 2.2 2.8 1.9
Unsure % 0.1 0.3 0.0

2019-1488 – Plan Canada – Girls – Grouped Age – STAT SHEET
Nanos conducted an online survey of 1,145 Canadian girls, 14 to 24 years of age, between September 15th to 24th, 2019.
www.nanos.co
Page 2
Age
Canada 2019-09 14 to 17 years old 18 to 24 years old
Question - Which adjectives describe girls (choose all that apply):[RANDOMIZE]
Total Unwgt N 11092 2979 8113
Wgt N 9712 3115 6596
Assertive % 2.6 2.9 2.5
Organized % 5.1 5.4 4.9
Calm % 4.3 4.1 4.4
Smart % 6.3 6.4 6.3
Bold % 3.7 3.6 3.7
Supportive % 5.3 5.6 5.2
Emotional % 5.6 5.7 5.5
Patient % 4.9 4.9 4.9
Humble % 3.8 3.5 3.9
Tactful % 2.2 2.2 2.2
Strong % 5.3 5.2 5.4
Imposing % 1.2 1.1 1.2
Stern % 1.4 1.7 1.3
Decisive % 2.8 2.9 2.7
Passionate % 5.8 5.5 6.0
Confident % 5.3 5.1 5.4
Caring % 6.1 6.2 6.1
Fearless % 3.8 3.7 3.8
Empathetic % 5.2 5.0 5.3
Helpful % 5.1 5.3 5.0
Passive % 2.1 2.1 2.1
Quiet % 2.7 2.7 2.7
Timid % 2.3 2.4 2.2
Gentle % 5.3 5.1 5.4
Unsure % 1.7 1.9 1.7

2019-1488 – Plan Canada – Girls – Grouped Age – STAT SHEET
Nanos conducted an online survey of 1,145 Canadian girls, 14 to 24 years of age, between September 15th to 24th, 2019.
www.nanos.co
Page 3
Age
Canada 2019-09 14 to 17 years old 18 to 24 years old
Question - Which adjectives describe boys (choose all that apply):[RANDOMIZE]
Total Unwgt N 8925 2358 6567
Wgt N 7711 2454 5257
Assertive % 5.7 5.6 5.7
Organized % 2.5 2.5 2.5
Calm % 2.8 3.2 2.6
Smart % 5.5 5.2 5.6
Bold % 6.5 6.8 6.4
Supportive % 4.2 4.4 4.1
Emotional % 2.4 2.6 2.4
Patient % 2.9 2.8 2.9
Humble % 3.1 2.8 3.2
Tactful % 3.5 3.6 3.5
Strong % 8.0 8.5 7.8
Imposing % 3.9 3.6 4.0
Stern % 4.2 3.8 4.4
Decisive % 4.9 5.2 4.8
Passionate % 4.2 3.7 4.5
Confident % 7.1 7.0 7.2
Caring % 3.8 3.9 3.8
Fearless % 6.0 5.8 6.1
Empathetic % 2.5 2.5 2.5
Helpful % 4.3 4.3 4.3
Passive % 2.7 2.9 2.6
Quiet % 2.1 2.0 2.1
Timid % 1.9 2.0 1.9
Gentle % 2.8 2.8 2.9
Unsure % 2.4 2.6 2.3
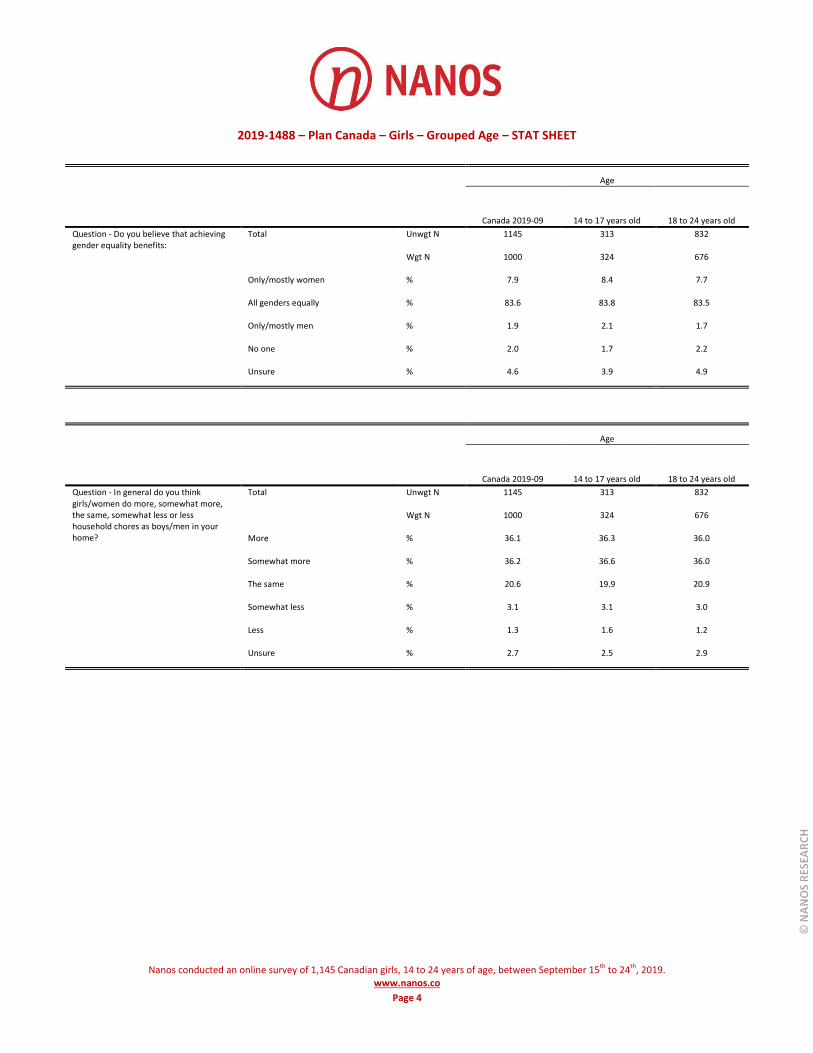
2019-1488 – Plan Canada – Girls – Grouped Age – STAT SHEET
Nanos conducted an online survey of 1,145 Canadian girls, 14 to 24 years of age, between September 15th to 24th, 2019.
www.nanos.co
Page 4
Age
Canada 2019-09 14 to 17 years old 18 to 24 years old
Question - Do you believe that achieving gender equality benefits:
Total Unwgt N 1145 313 832
Wgt N 1000 324 676
Only/mostly women % 7.9 8.4 7.7
All genders equally % 83.6 83.8 83.5
Only/mostly men % 1.9 2.1 1.7
No one % 2.0 1.7 2.2
Unsure % 4.6 3.9 4.9
Age
Canada 2019-09 14 to 17 years old 18 to 24 years old
Question - In general do you think girls/women do more, somewhat more, the same, somewhat less or less household chores as boys/men in your home?
Total Unwgt N 1145 313 832
Wgt N 1000 324 676
More % 36.1 36.3 36.0
Somewhat more % 36.2 36.6 36.0
The same % 20.6 19.9 20.9
Somewhat less % 3.1 3.1 3.0
Less % 1.3 1.6 1.2
Unsure % 2.7 2.5 2.9

2019-1488 – Plan Canada – Girls – Grouped Age – STAT SHEET
Nanos conducted an online survey of 1,145 Canadian girls, 14 to 24 years of age, between September 15th to 24th, 2019.
www.nanos.co
Page 5
Age
Canada 2019-09 14 to 17 years old 18 to 24 years old
Question - Do you regularly, occasionally or never feel pressure to change how you act in order to achieve your leadership aspirations?
Total Unwgt N 1145 313 832
Wgt N 1000 324 676
Regularly % 19.0 18.6 19.1
Occasionally % 57.0 55.2 58.0
Never % 15.9 14.1 16.8
Unsure % 8.1 12.2 6.1
Do you agree, somewhat agree, somewhat disagree or disagree with the following statements [RANDOMIZE]
Age
Canada 2019-09 14 to 17 years old 18 to 24 years old
Question - People thought of me as smart growing up
Total Unwgt N 1145 313 832
Wgt N 1000 324 676
Agree % 49.5 48.7 49.9
Somewhat agree % 34.0 34.0 34.0
Somewhat disagree % 8.8 9.7 8.4
Disagree % 4.4 5.5 3.9
Unsure % 3.3 2.2 3.8

2019-1488 – Plan Canada – Girls – Grouped Age – STAT SHEET
Nanos conducted an online survey of 1,145 Canadian girls, 14 to 24 years of age, between September 15th to 24th, 2019.
www.nanos.co
Page 6
Do you agree, somewhat agree, somewhat disagree or disagree with the following statements [RANDOMIZE]
Age
Canada 2019-09 14 to 17 years old 18 to 24 years old
Question - Girls and women have the natural abilities required to be good leaders
Total Unwgt N 1145 313 832
Wgt N 1000 324 676
Agree % 44.4 42.3 45.4
Somewhat agree % 37.4 39.3 36.6
Somewhat disagree % 9.2 10.4 8.7
Disagree % 4.3 4.1 4.4
Unsure % 4.6 3.9 5.0
Do you agree, somewhat agree, somewhat disagree or disagree with the following statements [RANDOMIZE]
Age
Canada 2019-09 14 to 17 years old 18 to 24 years old
Question - My opinions are/were valued when I was in school
Total Unwgt N 1145 313 832
Wgt N 1000 324 676
Agree % 28.4 35.7 24.9
Somewhat agree % 43.8 40.2 45.5
Somewhat disagree % 15.9 11.9 17.8
Disagree % 7.3 8.9 6.5
Unsure % 4.7 3.4 5.3

2019-1488 – Plan Canada – Girls – Grouped Age – STAT SHEET
Nanos conducted an online survey of 1,145 Canadian girls, 14 to 24 years of age, between September 15th to 24th, 2019.
www.nanos.co
Page 7
Do you agree, somewhat agree, somewhat disagree or disagree with the following statements [RANDOMIZE]
Age
Canada 2019-09 14 to 17 years old 18 to 24 years old
Question - Boys and men have the natural abilities required to be good leaders
Total Unwgt N 1145 313 832
Wgt N 1000 324 676
Agree % 32.8 30.7 33.8
Somewhat agree % 36.9 38.5 36.1
Somewhat disagree % 14.7 15.1 14.5
Disagree % 10.4 10.7 10.3
Unsure % 5.2 4.9 5.3
Do you agree, somewhat agree, somewhat disagree or disagree with the following statements [RANDOMIZE]
Age
Canada 2019-09 14 to 17 years old 18 to 24 years old
Question - My gender holds back my ability to be a leader
Total Unwgt N 1145 313 832
Wgt N 1000 324 676
Agree % 7.9 5.0 9.3
Somewhat agree % 28.8 25.8 30.3
Somewhat disagree % 16.7 15.3 17.4
Disagree % 40.8 46.8 38.0
Unsure % 5.7 7.2 5.0

2019-1488 – Plan Canada – Girls – Grouped Age – STAT SHEET
Nanos conducted an online survey of 1,145 Canadian girls, 14 to 24 years of age, between September 15th to 24th, 2019.
www.nanos.co
Page 8
Age
Canada 2019-09 14 to 17 years old 18 to 24 years old
Question - In general, are you confident, somewhat confident, somewhat not confident or not confident in your leadership abilities?
Total Unwgt N 1145 313 832
Wgt N 1000 324 676
Confident % 27.1 25.0 28.1
Somewhat confident % 48.0 48.0 48.0
Somewhat not confident % 14.6 18.0 12.9
Not confident % 7.4 7.7 7.3
Unsure % 2.9 1.3 3.7
Where do you feel that you had/have opportunities to become a leader? Please rank the following where 1 is the place where you had the best opportunities to become a leader, 2 the second best place to become a leader and so on. [RANDOMIZE]
Age
Canada 2019-09 14 to 17 years old 18 to 24 years old
Question - Rank 1 Total Unwgt N 1114 304 810
Wgt N 974 315 659
Family % 20.3 19.9 20.4
In a workplace % 11.3 5.9 13.8
Educational institutions % 15.7 15.9 15.5
Clubs and Community Groups % 7.6 7.8 7.5
Within peer groups % 16.2 17.9 15.4
Sports and Activities % 12.5 12.6 12.4
Volunteerism and activism % 10.0 12.4 8.9
I have had no opportunities to become a leader
% 3.3 3.9 3.0
Other (specify below) % 0.1 0.0 0.2
Unsure % 3.1 3.8 2.7

2019-1488 – Plan Canada – Girls – Grouped Age – STAT SHEET
Nanos conducted an online survey of 1,145 Canadian girls, 14 to 24 years of age, between September 15th to 24th, 2019.
www.nanos.co
Page 9
Where do you feel that you had/have opportunities to become a leader? Please rank the following where 1 is the place where you had the best opportunities to become a leader, 2 the second best place to become a leader and so on. [RANDOMIZE]
Age
Canada 2019-09 14 to 17 years old 18 to 24 years old
Question - Rank 2 Total Unwgt N 986 266 720
Wgt N 865 277 588
Family % 16.8 15.4 17.5
In a workplace % 10.2 7.1 11.6
Educational institutions % 14.0 14.2 13.9
Clubs and Community Groups % 14.4 15.4 13.9
Within peer groups % 21.5 23.0 20.8
Sports and Activities % 12.7 15.4 11.4
Volunteerism and activism % 10.2 9.6 10.5
Other (specify below) % 0.1 0.0 0.1
Unsure % 0.2 0.0 0.3
Where do you feel that you had/have opportunities to become a leader? Please rank the following where 1 is the place where you had the best opportunities to become a leader, 2 the second best place to become a leader and so on. [RANDOMIZE]
Age
Canada 2019-09 14 to 17 years old 18 to 24 years old
Question - Rank 3 Total Unwgt N 871 231 640
Wgt N 772 242 530
Family % 14.8 12.1 16.1
In a workplace % 12.2 4.9 15.5
Educational institutions % 16.0 15.3 16.3
Clubs and Community Groups % 13.2 16.2 11.8
Within peer groups % 16.6 18.0 15.9
Sports and Activities % 11.1 12.4 10.5
Volunteerism and activism % 16.2 21.0 14.0

2019-1488 – Plan Canada – Girls – Grouped Age – STAT SHEET
Nanos conducted an online survey of 1,145 Canadian girls, 14 to 24 years of age, between September 15th to 24th, 2019.
www.nanos.co
Page 10
Where do you feel that you had/have opportunities to become a leader? Please rank the following where 1 is the place where you had the best opportunities to become a leader, 2 the second best place to become a leader and so on. [RANDOMIZE]
Age
Canada 2019-09 14 to 17 years old 18 to 24 years old
Question - Rank 4 Total Unwgt N 767 198 569
Wgt N 678 204 474
Family % 13.8 18.6 11.7
In a workplace % 11.4 8.1 12.9
Educational institutions % 13.5 13.0 13.7
Clubs and Community Groups % 17.3 19.2 16.5
Within peer groups % 15.8 17.5 15.1
Sports and Activities % 12.2 10.1 13.1
Volunteerism and activism % 16.0 13.5 17.1
Where do you feel that you had/have opportunities to become a leader? Please rank the following where 1 is the place where you had the best opportunities to become a leader, 2 the second best place to become a leader and so on. [RANDOMIZE]
Age
Canada 2019-09 14 to 17 years old 18 to 24 years old
Question - Rank 5 Total Unwgt N 652 170 482
Wgt N 577 175 402
Family % 13.2 14.2 12.8
In a workplace % 16.1 16.7 15.8
Educational institutions % 14.4 17.1 13.3
Clubs and Community Groups % 15.7 17.5 15.0
Within peer groups % 9.3 7.1 10.2
Sports and Activities % 14.8 13.4 15.5
Volunteerism and activism % 16.4 14.1 17.4
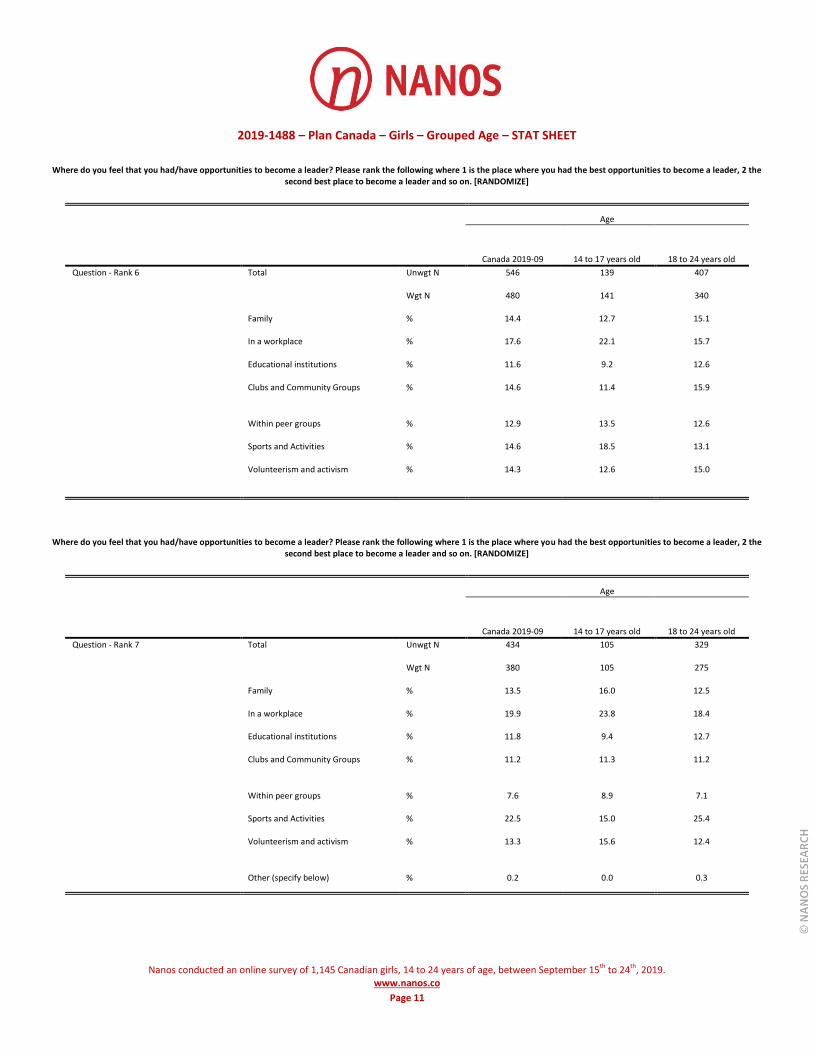
2019-1488 – Plan Canada – Girls – Grouped Age – STAT SHEET
Nanos conducted an online survey of 1,145 Canadian girls, 14 to 24 years of age, between September 15th to 24th, 2019.
www.nanos.co
Page 11
Where do you feel that you had/have opportunities to become a leader? Please rank the following where 1 is the place where you had the best opportunities to become a leader, 2 the second best place to become a leader and so on. [RANDOMIZE]
Age
Canada 2019-09 14 to 17 years old 18 to 24 years old
Question - Rank 6 Total Unwgt N 546 139 407
Wgt N 480 141 340
Family % 14.4 12.7 15.1
In a workplace % 17.6 22.1 15.7
Educational institutions % 11.6 9.2 12.6
Clubs and Community Groups % 14.6 11.4 15.9
Within peer groups % 12.9 13.5 12.6
Sports and Activities % 14.6 18.5 13.1
Volunteerism and activism % 14.3 12.6 15.0
Where do you feel that you had/have opportunities to become a leader? Please rank the following where 1 is the place where you had the best opportunities to become a leader, 2 the second best place to become a leader and so on. [RANDOMIZE]
Age
Canada 2019-09 14 to 17 years old 18 to 24 years old
Question - Rank 7 Total Unwgt N 434 105 329
Wgt N 380 105 275
Family % 13.5 16.0 12.5
In a workplace % 19.9 23.8 18.4
Educational institutions % 11.8 9.4 12.7
Clubs and Community Groups % 11.2 11.3 11.2
Within peer groups % 7.6 8.9 7.1
Sports and Activities % 22.5 15.0 25.4
Volunteerism and activism % 13.3 15.6 12.4
Other (specify below) % 0.2 0.0 0.3

2019-1488 – Plan Canada – Girls – Grouped Age – STAT SHEET
Nanos conducted an online survey of 1,145 Canadian girls, 14 to 24 years of age, between September 15th to 24th, 2019.
www.nanos.co
Page 12
Where do you feel that you had/have opportunities to become a leader? Please rank the following where 1 is the place where you had the best opportunities to become a leader, 2 the second best place to become a leader and so on. [RANDOMIZE]
Age
Canada 2019-09 14 to 17 years old 18 to 24 years old
Question - Rank 8 Total Unwgt N 10 4 6
Wgt N 9 4 5
Educational institutions % 10.9 22.6 0.0
Clubs and Community Groups % 6.7 0.0 12.9
Within peer groups % 17.3 23.4 11.6
Sports and Activities % 11.0 0.0 21.3
Volunteerism and activism % 26.1 32.7 20.1
At home % 7.3 0.0 14.1
Other (specify below) % 20.7 21.3 20.1
Age
Canada 2019-09 14 to 17 years old 18 to 24 years old
Question - Do you regularly, occasionally or never doubt that you have what it takes to be a good leader?
Total Unwgt N 1145 313 832
Wgt N 1000 324 676
Regularly % 20.1 17.1 21.5
Occasionally % 61.2 62.3 60.7
Never % 13.8 15.5 13.0
Unsure % 4.9 5.0 4.8
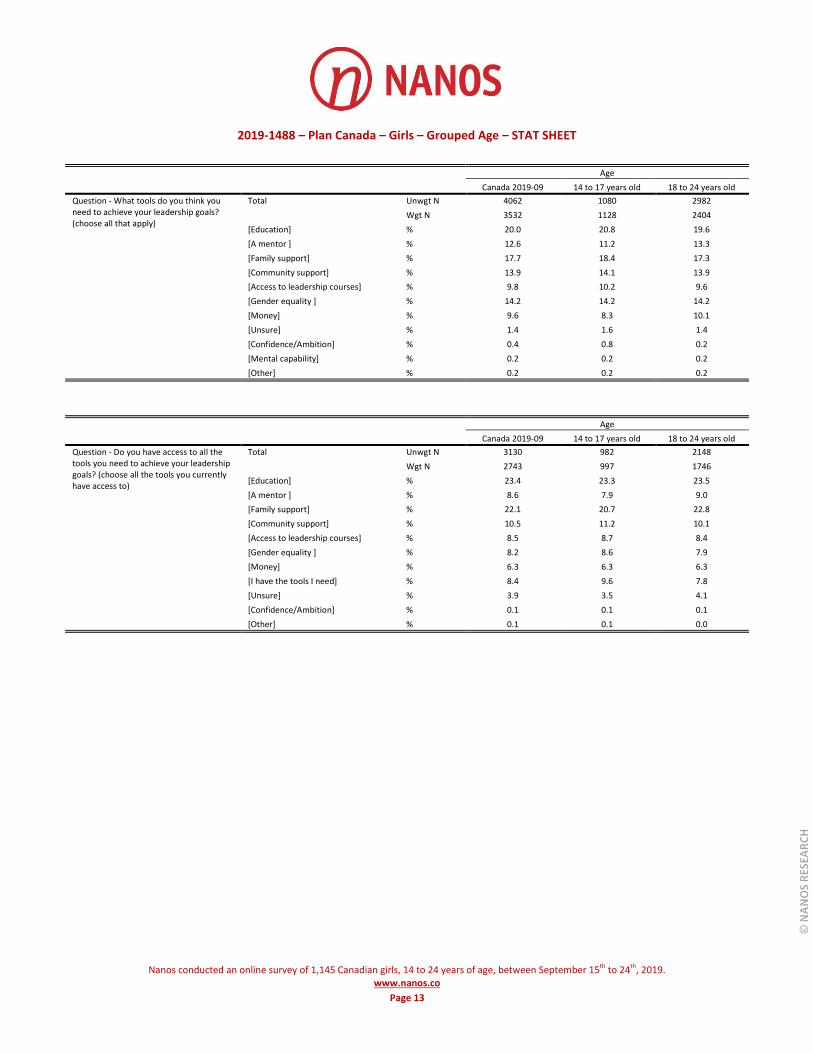
2019-1488 – Plan Canada – Girls – Grouped Age – STAT SHEET
Nanos conducted an online survey of 1,145 Canadian girls, 14 to 24 years of age, between September 15th to 24th, 2019.
www.nanos.co
Page 13
Age
Canada 2019-09 14 to 17 years old 18 to 24 years old
Question - What tools do you think you need to achieve your leadership goals? (choose all that apply)
Total Unwgt N 4062 1080 2982
Wgt N 3532 1128 2404
[Education] % 20.0 20.8 19.6
[A mentor ] % 12.6 11.2 13.3
[Family support] % 17.7 18.4 17.3
[Community support] % 13.9 14.1 13.9
[Access to leadership courses] % 9.8 10.2 9.6
[Gender equality ] % 14.2 14.2 14.2
[Money] % 9.6 8.3 10.1
[Unsure] % 1.4 1.6 1.4
[Confidence/Ambition] % 0.4 0.8 0.2
[Mental capability] % 0.2 0.2 0.2
[Other] % 0.2 0.2 0.2
Age
Canada 2019-09 14 to 17 years old 18 to 24 years old
Question - Do you have access to all the tools you need to achieve your leadership goals? (choose all the tools you currently have access to)
Total Unwgt N 3130 982 2148
Wgt N 2743 997 1746
[Education] % 23.4 23.3 23.5
[A mentor ] % 8.6 7.9 9.0
[Family support] % 22.1 20.7 22.8
[Community support] % 10.5 11.2 10.1
[Access to leadership courses] % 8.5 8.7 8.4
[Gender equality ] % 8.2 8.6 7.9
[Money] % 6.3 6.3 6.3
[I have the tools I need] % 8.4 9.6 7.8
[Unsure] % 3.9 3.5 4.1
[Confidence/Ambition] % 0.1 0.1 0.1
[Other] % 0.1 0.1 0.0

2019-1488 – Plan Canada – Girls – Grouped Age – STAT SHEET
Nanos conducted an online survey of 1,145 Canadian girls, 14 to 24 years of age, between September 15th to 24th, 2019.
www.nanos.co
Page 14
Age
Canada 2019-09 14 to 17 years old 18 to 24 years old
Question - Please reflect for a moment on those in your immediate circle, excluding family who are in a position of power. This means a person who has authority or influence in your life (for example: teachers, coaches, and bosses).How many of those are women? [Open]
Total Unwgt N 1139 312 827
Wgt N 995 323 673
Mean 4.7 5.8 4.3
Median 4.0 4.0 3.0
0 % 2.1 0.4 2.9
1 % 5.7 1.7 7.6
2 % 10.6 9.6 11.1
3 % 11.0 10.8 11.1
4 % 7.5 7.9 7.3
5 % 9.1 9.6 8.8
6 % 3.6 4.9 3.0
7 % 2.0 3.6 1.3
8 % 1.2 2.3 0.7
9 % 0.4 0.6 0.4
10 % 3.7 3.1 4.0
11 % 0.2 0.4 0.1
12 % 0.6 0.3 0.8
13 % 0.2 0.4 0.1
15 % 1.0 1.4 0.8
16 % 0.3 0.6 0.1
19 % 0.1 0.2 0.0
20 % 0.2 0.2 0.2
24 % 0.2 0.6 0.0
25 % 0.1 0.3 0.0
29 % 0.1 0.0 0.2
30 % 0.1 0.3 0.1
50 % 0.1 0.0 0.1
56 % 0.1 0.3 0.0
Unsure % 39.7 40.2 39.5
80 % 0.0 0.0 0.1

2019-1488 – Plan Canada – Girls – Grouped Age – STAT SHEET
Nanos conducted an online survey of 1,145 Canadian girls, 14 to 24 years of age, between September 15th to 24th, 2019.
www.nanos.co
Page 15
Age
Canada 2019-09 14 to 17 years old 18 to 24 years old
Question - Please reflect for a moment on those in your immediate circle, excluding family who are in a position of power. This means a person who has authority or influence in your life (for example: teachers, coaches, and bosses) How many of these are men? [Open]
Total Unwgt N 1120 300 820
Wgt N 978 311 667
Mean 4.2 4.4 4.2
Median 3.0 3.0 3.0
0 % 5.0 3.1 5.9
1 % 9.4 8.8 9.7
2 % 10.6 10.3 10.8
3 % 8.4 8.1 8.5
4 % 6.2 5.1 6.7
5 % 7.0 6.9 7.0
6 % 2.6 3.6 2.2
7 % 1.3 1.9 1.0
8 % 1.9 3.4 1.2
9 % 0.8 0.4 1.0
10 % 3.5 4.4 3.0
11 % 0.1 0.3 0.0
12 % 0.4 0.6 0.3
13 % 0.1 0.0 0.1
14 % 0.3 0.6 0.1
15 % 0.5 0.6 0.4
20 % 0.2 0.0 0.2
22 % 0.1 0.0 0.2
28 % 0.1 0.0 0.2
30 % 0.2 0.3 0.2
36 % 0.0 0.0 0.1
40 % 0.0 0.0 0.1
50 % 0.1 0.0 0.1
Unsure % 41.0 41.6 40.8
100 % 0.1 0.0 0.2

2019-1488 – Plan Canada – Girls – Grouped Age – STAT SHEET
Nanos conducted an online survey of 1,145 Canadian girls, 14 to 24 years of age, between September 15th to 24th, 2019.
www.nanos.co
Page 16
Age
Canada 2019-09 14 to 17 years old 18 to 24 years old
Question - Do you have a mentor(s)? (Examples of mentors can be people you consider leaders who have provided guidance, leadership, advice, inspiration, counselling, or personal or professional insight)
Total Unwgt N 1145 313 832
Wgt N 1000 324 676
Yes % 48.2 51.0 46.8
No % 42.3 37.1 44.8
Unsure % 9.5 11.9 8.4
Age
Canada 2019-09 14 to 17 years old 18 to 24 years old
Question – [IF THEY HAVE A MENTOR] If yes, what is the gender of your mentor?
Total Unwgt N 546 156 390
Wgt N 480 165 315
Male % 23.5 25.3 22.6
Female % 75.8 74.1 76.7
Other % 0.7 0.7 0.7
Do you agree, somewhat agree, somewhat disagree or disagree with the following? [RANDOMIZE]
Age
Canada 2019-09 14 to 17 years old 18 to 24 years old
Question - I expect to be given personally challenging and interesting work early in my career/professional life
Total Unwgt N 1145 313 832
Wgt N 1000 324 676
Agree % 36.8 37.4 36.6
Somewhat agree % 44.5 44.9 44.3
Somewhat disagree % 9.2 7.3 10.1
Disagree % 2.7 3.2 2.4
Unsure % 6.8 7.2 6.6

2019-1488 – Plan Canada – Girls – Grouped Age – STAT SHEET
Nanos conducted an online survey of 1,145 Canadian girls, 14 to 24 years of age, between September 15th to 24th, 2019.
www.nanos.co
Page 17
Do you agree, somewhat agree, somewhat disagree or disagree with the following? [RANDOMIZE]
Age
Canada 2019-09 14 to 17 years old 18 to 24 years old
Question - I find women in positions of power approachable
Total Unwgt N 1145 313 832
Wgt N 1000 324 676
Agree % 36.8 41.1 34.7
Somewhat agree % 42.2 37.0 44.7
Somewhat disagree % 13.0 13.9 12.5
Disagree % 2.8 2.4 3.0
Unsure % 5.2 5.5 5.1
Do you agree, somewhat agree, somewhat disagree or disagree with the following? [RANDOMIZE]
Age
Canada 2019-09 14 to 17 years old 18 to 24 years old
Question - I find men in positions of power approachable
Total Unwgt N 1145 313 832
Wgt N 1000 324 676
Agree % 18.8 23.3 16.6
Somewhat agree % 38.2 37.4 38.5
Somewhat disagree % 27.1 25.5 27.9
Disagree % 9.8 7.7 10.8
Unsure % 6.2 6.1 6.2
Age
Canada 2019-09 14 to 17 years old 18 to 24 years old
Question - Think of a CEO, did you picture: Total Unwgt N 1145 313 832
Wgt N 1000 324 676
A Man % 39.9 43.7 38.1
A Woman % 11.8 11.4 12.0
I wouldn’t assume either % 43.9 41.2 45.2
Unsure % 4.4 3.7 4.7
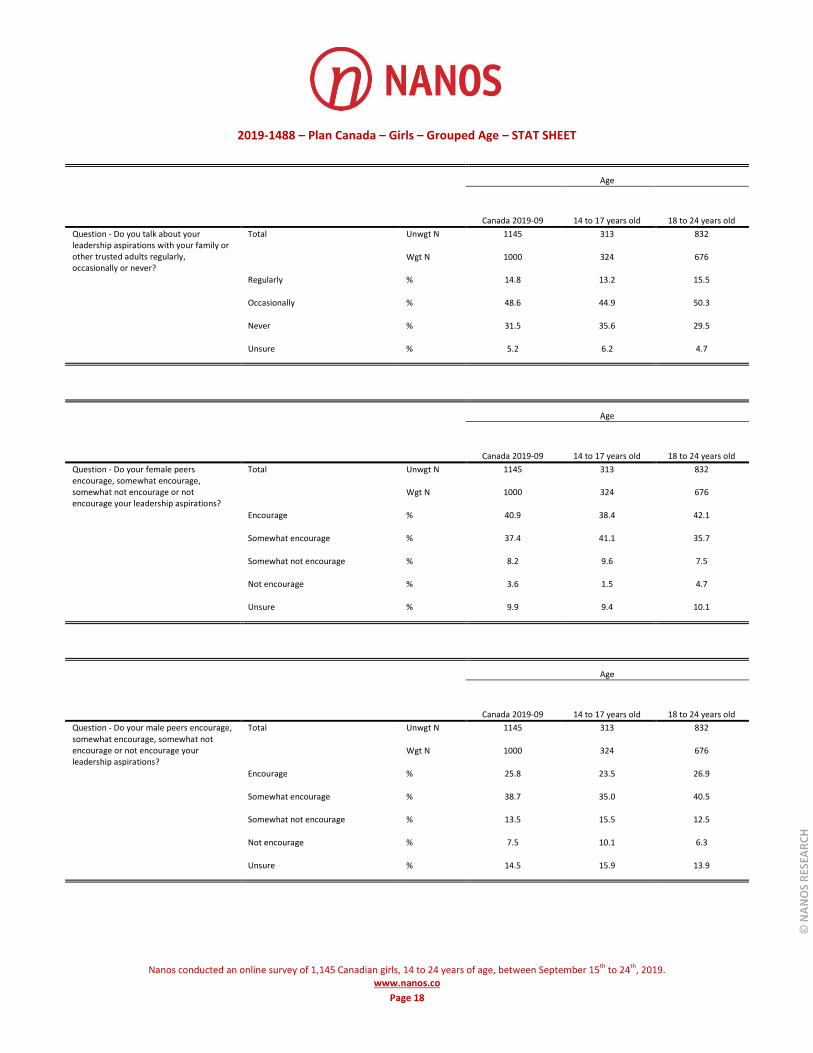
2019-1488 – Plan Canada – Girls – Grouped Age – STAT SHEET
Nanos conducted an online survey of 1,145 Canadian girls, 14 to 24 years of age, between September 15th to 24th, 2019.
www.nanos.co
Page 18
Age
Canada 2019-09 14 to 17 years old 18 to 24 years old
Question - Do you talk about your leadership aspirations with your family or other trusted adults regularly, occasionally or never?
Total Unwgt N 1145 313 832
Wgt N 1000 324 676
Regularly % 14.8 13.2 15.5
Occasionally % 48.6 44.9 50.3
Never % 31.5 35.6 29.5
Unsure % 5.2 6.2 4.7
Age
Canada 2019-09 14 to 17 years old 18 to 24 years old
Question - Do your female peers encourage, somewhat encourage, somewhat not encourage or not encourage your leadership aspirations?
Total Unwgt N 1145 313 832
Wgt N 1000 324 676
Encourage % 40.9 38.4 42.1
Somewhat encourage % 37.4 41.1 35.7
Somewhat not encourage % 8.2 9.6 7.5
Not encourage % 3.6 1.5 4.7
Unsure % 9.9 9.4 10.1
Age
Canada 2019-09 14 to 17 years old 18 to 24 years old
Question - Do your male peers encourage, somewhat encourage, somewhat not encourage or not encourage your leadership aspirations?
Total Unwgt N 1145 313 832
Wgt N 1000 324 676
Encourage % 25.8 23.5 26.9
Somewhat encourage % 38.7 35.0 40.5
Somewhat not encourage % 13.5 15.5 12.5
Not encourage % 7.5 10.1 6.3
Unsure % 14.5 15.9 13.9

2019-1488 – Plan Canada – Girls – Grouped Age – STAT SHEET
Nanos conducted an online survey of 1,145 Canadian girls, 14 to 24 years of age, between September 15th to 24th, 2019.
www.nanos.co
Page 19
Age
Canada 2019-09 14 to 17 years old 18 to 24 years old
Question - When thinking of sports teams at your current or previous high school, are (or were) the girls’ teams treated the same and did they have the same status as the boys’ teams?
Total Unwgt N 1145 313 832
Wgt N 1000 324 676
The boys’ teams are/were treated better and had a higher status
% 48.6 47.9 48.9
The girls’ teams are/were treated better and had a higher status
% 5.7 4.6 6.2
Both the girls and the boys are treated the same and have the same status
% 35.2 38.0 33.9
Unsure % 10.5 9.5 10.9

Boys in Canada: Perceptions of gender equality, leadership and stereotypes Plan International Canada | Summary Conducted by Nanos for Plan International Canada, October 2019 Submission 2019-1496

© N
AN
OS
RES
EAR
CH
SUMMARY
A majority of Canadian boys agree or somewhat agree that men and boys have the natural qualities to be good leaders and feel the same way about women and girls. Overall Canadian boys feel confident in their leadership abilities, and a majority disagree or somewhat disagree that their gender holds them back from being a leader. In terms of what makes a good leader, Canadian boys most often say the words confident and smart describe a good leader, and most often describe their gender with the word strong, and girls with the words caring and emotional.
Canadian boys feel they are equally encouraged by their female and male peers to pursue their leadership aspirations, and are twice as likely to report they never talk about their leadership aspirations with family or trusted adults, rather than regularly.
Canadian boys find women and men in positions of power to be equally approachable, and are six times more likely to picture a CEO as a man rather than a woman. Among those who report having a mentor, the majority of boys say their mentor is a man, rather than a woman.
The “what”: stereotypes, beliefs and perceptions
• Canadian boys say ‘confident’ and ‘smart’ are the adjectives that best describe a good leader – Asked to select which adjectives best describe a good leader, Canadian boys most often selected confident (67%), followed by smart (64%), organized (57%), strong (57%), supportive (54%), helpful (51%), patient (50%), and passionate (50%).
• Canadian boys say ‘caring’ and ‘emotional’ are the adjectives that best describe girls – Asked to select which adjectives best describe girls, Canadian boys most often selected caring (54%) and emotional (53%), followed by smart (50%), gentle (49%), passionate (41%), helpful (40%), and organized (39%).
• Canadian boys say ‘strong’ is the adjective that best describes boys – Asked to select which adjectives best describe boys, Canadian boys most often selected strong (61%), followed by confident (54%), bold (46%), fearless (44%), smart (40%), assertive (36%), and decisive (31%).
• Nearly three in four Canadian boys believe achieving gender equality benefits all genders equally – Asked who they believe achieving gender equally benefits the most, a majority of Canadian boys say all genders equally (74%), while 11 per cent say only/mostly women, and three per cent each say no one or only/mostly men. Nine per cent are unsure.
2
Nearly three in four Canadian boys believe achieving gender equality benefits all genders equally

© N
AN
OS
RES
EAR
CH
SUMMARY
• Just over half of Canadian boys think the girls and women do more or somewhat more household chores than the boys and men in their home – More than one in two Canadian boys say they think girls and women do more (20%) or somewhat more (33%) household chores than the boys and men in their home, while 34 per cent think they do the same amount, five per cent say somewhat less and three per cent say they do less household chores. Five per cent are unsure.
• More than half of Canadian boys say they occasionally feel pressure to change how they act in order to achieve their leadership aspirations – Over one in two Canadian boys say they occasionally feel pressure to change how they act to achieve their leadership aspirations (54%), while 21 per cent say they have never experienced this pressure, and 16 per cent say they have experienced this pressure regularly. Nine per cent are unsure.
• A majority of Canadian boys agree or somewhat agree that people thought of them as smart growing up – Nearly eight in ten Canadian boys agree (42%) or somewhat agree (34%) that people thought of them as smart growing up, while 11 per cent somewhat disagree and seven per cent disagree. Six per cent are unsure.
• Just over three in four Canadian boys agree or somewhat agree that girls and women have the natural abilities needed to be good leaders – A majority of Canadian boys agree (40%) or somewhat agree (36%) that girls and women have the natural abilities required to be good leaders, while 11 per cent somewhat disagree and seven per cent disagree. Seven per cent are unsure.
• Seven in ten Canadian boys agree or somewhat agree that their opinions are or were valued when they were in school – A majority of Canadian boys agree (30%) or somewhat agree (41%) that their opinions are/were valued when they were in school, while 15 per cent somewhat disagree and 10 per cent disagree. Six per cent are unsure.
• A majority of Canadian boys agree or somewhat agree that boys and men have the natural abilities required to be good leaders – Over seven in ten Canadian boys agree (38%) or somewhat agree (38%) that boys and men have the natural abilities required to be good leaders, while 11 per cent somewhat disagree and seven per cent disagree. Six per cent are unsure.
3
Canadian boys are equally likely to agree or somewhat agree that both girls and women and boys and men have the natural abilities needed to be good leaders

© N
AN
OS
RES
EAR
CH
SUMMARY
• More than seven in ten Canadian boys disagree or somewhat disagree that their gender holds back their ability to be a leader – A majority of Canadian boys disagree (58%) or somewhat disagree (15%) that their gender holds back their ability to be a leader, while 12 per cent somewhat agree and nine per cent agree. Seven per cent are unsure.
The “why”: Barriers – knowledge, skills, context
• Just over three in four Canadian boys say they are confident or somewhat confident in their leadership abilities – A majority of Canadian boys say they are confident (34%) or somewhat confident (42%) in their leadership abilities, while two in ten say they are somewhat not confident (15%) or not confident (five per cent). Five per cent are unsure.
• Canadian boys most often rank family and sports and activities first as the places where they have had the best opportunities to become a leader – Asked to rank where they feel they have/have had the best opportunities to become a leader, Canadian boys most often rank family and sports and activities first (18% each), followed by within peer groups (16%), in a workplace (14%), educational institutions (11%), volunteerism and activism (eight per cent), and clubs and community groups (eight per cent).
• More than half of Canadian boys say they occasionally doubt they have what it takes to be a good leader – Over half of Canadian boys say they occasionally (56%) doubt that they have what it takes to be a good leader, while 21 per cent say they regularly doubt they have what it takes, and 18 per cent say they never do. Six per cent are unsure.
• Canadian boys most often say education is the tool they need their leadership goals – Asked which tools they think they need to achieve their leadership goals, Canadian boys most often select education (23%), followed by family support (18%), community support (14%), a mentor (14%), money (11%), access to leadership courses (nine per cent), and gender equality (eight per cent).
• Canadian boys most often say they have access to education and family support as tools to achieve their leadership goals - Asked which tools they currently have access to that they need to achieve their leadership goals, Canadian boys most often select education (21%) and family support (21%), followed by community support (12%), a mentor (nine per cent), gender equality (nine per cent), money (eight per cent), and access to leadership courses (seven per cent). Nine per cent say they already have the tools they need. 4
Just over three in four Canadian boys say they are confident or somewhat confident in their leadership abilities

© N
AN
OS
RES
EAR
CH
• Canadian boys say they have an average of 4 women in their lives who are in a position of power – Asked how many people in their immediate circle who are in a position of power are women, Canadian boys say an average of 4.0 of them are women, with a median of 3.0. Boys ages 14 to 17 report a higher average of women in their immediate circle in positions of power (4.6) than boys 18 to 24 (mean of 3.7).
• Canadian boys say they have an average of 5 men in their lives who are in a position of power – Asked how many people in their immediate circle who are in a position of power are men, Canadian boys say an average of 4.8 of them are men, with a median of 3.0.
• Canadian boys are divided in terms of having a mentor – Asked if they have a mentor, 46 per cent of Canadian boys report they do, while 44 per cent report they do not. Ten per cent are unsure.
• A majority of Canadian boys who report having a mentor, report their mentor is male – Among those who report having a mentor, more than seven in ten report their mentor is male (71%), while 28 per cent report their mentor is female. One per cent report their mentor is another gender.
• Eight in ten Canadian boys agree or somewhat agree that they expect to be given personally challenging and interesting work early in their career – A majority of Canadian boys agree (41%) or somewhat agree (39%) that they expect to be given personally challenging and interesting work early in their career/professional life, while over one in ten somewhat disagree (10%) or disagree (three per cent). Seven per cent are unsure.
• Just under three in four Canadian boys agree or somewhat agree that they find women in positions of power to be approachable – A majority of Canadian boys agree (37%) or somewhat agree (37%) that they find women in positions of power to be approachable, while 12 per cent somewhat disagree and six per cent disagree. Eight per cent are unsure.
• Just over seven in ten Canadian boys agree or somewhat agree that they find men in positions of power to be approachable – A majority of Canadian boys agree (31%) or somewhat agree (40%) that they find men in positions of power to be approachable, while 17 per cent somewhat disagree and four per cent disagree. Seven per cent are unsure.
• Canadian boys are six times more likely to picture a CEO as a man rather than a woman – Asked what gender they think of when thinking of a CEO, nearly one in two Canadian boys say they picture a man (49%), while 38 per cent say they would not assume either gender, and eight per cent picture a woman. Five per cent are unsure.
SUMMARY
5
Canadian boys find women and men in positions of power equally approachable
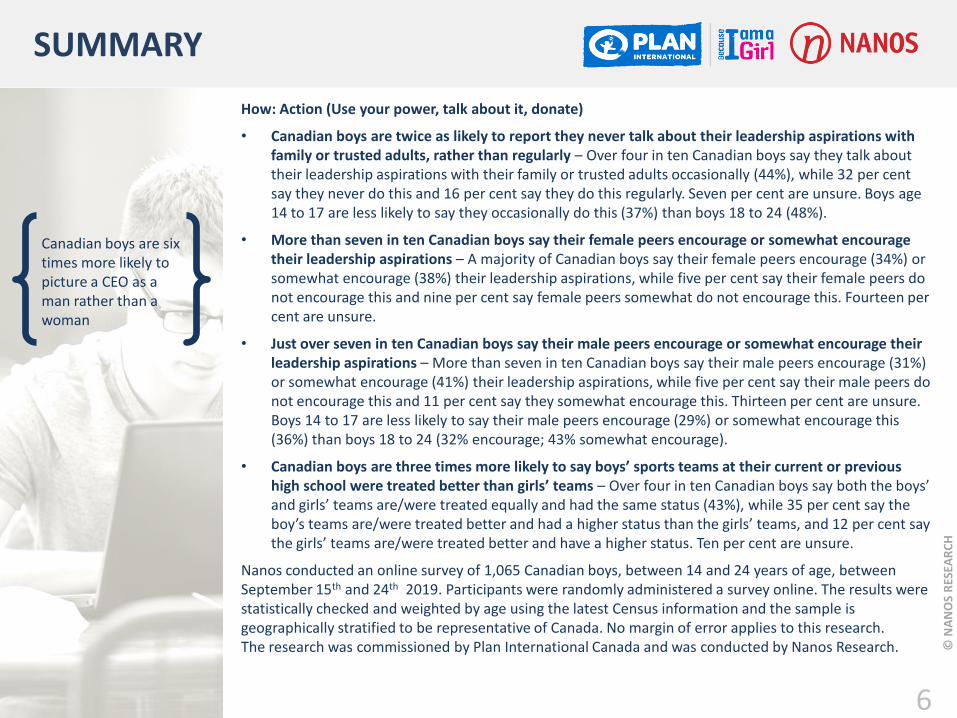
© N
AN
OS
RES
EAR
CH
SUMMARY
How: Action (Use your power, talk about it, donate)
• Canadian boys are twice as likely to report they never talk about their leadership aspirations with family or trusted adults, rather than regularly – Over four in ten Canadian boys say they talk about their leadership aspirations with their family or trusted adults occasionally (44%), while 32 per cent say they never do this and 16 per cent say they do this regularly. Seven per cent are unsure. Boys age 14 to 17 are less likely to say they occasionally do this (37%) than boys 18 to 24 (48%).
• More than seven in ten Canadian boys say their female peers encourage or somewhat encourage their leadership aspirations – A majority of Canadian boys say their female peers encourage (34%) or somewhat encourage (38%) their leadership aspirations, while five per cent say their female peers do not encourage this and nine per cent say female peers somewhat do not encourage this. Fourteen per cent are unsure.
• Just over seven in ten Canadian boys say their male peers encourage or somewhat encourage their leadership aspirations – More than seven in ten Canadian boys say their male peers encourage (31%) or somewhat encourage (41%) their leadership aspirations, while five per cent say their male peers do not encourage this and 11 per cent say they somewhat encourage this. Thirteen per cent are unsure. Boys 14 to 17 are less likely to say their male peers encourage (29%) or somewhat encourage this (36%) than boys 18 to 24 (32% encourage; 43% somewhat encourage).
• Canadian boys are three times more likely to say boys’ sports teams at their current or previous high school were treated better than girls’ teams – Over four in ten Canadian boys say both the boys’ and girls’ teams are/were treated equally and had the same status (43%), while 35 per cent say the boy’s teams are/were treated better and had a higher status than the girls’ teams, and 12 per cent say the girls’ teams are/were treated better and have a higher status. Ten per cent are unsure.
Nanos conducted an online survey of 1,065 Canadian boys, between 14 and 24 years of age, between September 15th and 24th 2019. Participants were randomly administered a survey online. The results were statistically checked and weighted by age using the latest Census information and the sample is geographically stratified to be representative of Canada. No margin of error applies to this research. The research was commissioned by Plan International Canada and was conducted by Nanos Research.
6
Canadian boys are six times more likely to picture a CEO as a man rather than a woman

© N
AN
OS
RES
EAR
CH
TABLE OF CONTENTS
7
Executive Summary
The “what”: stereotypes, beliefs and perceptions
The “why”: Barriers – knowledge, skills, context.
How: Action (Use your power, talk about it, donate)
Methodology
Tabulations

© N
AN
OS
RES
EAR
CH
The “what”: stereotypes, beliefs and perceptions
Nearly three in four Canadian boys believe achieving gender equality benefits all
genders equally
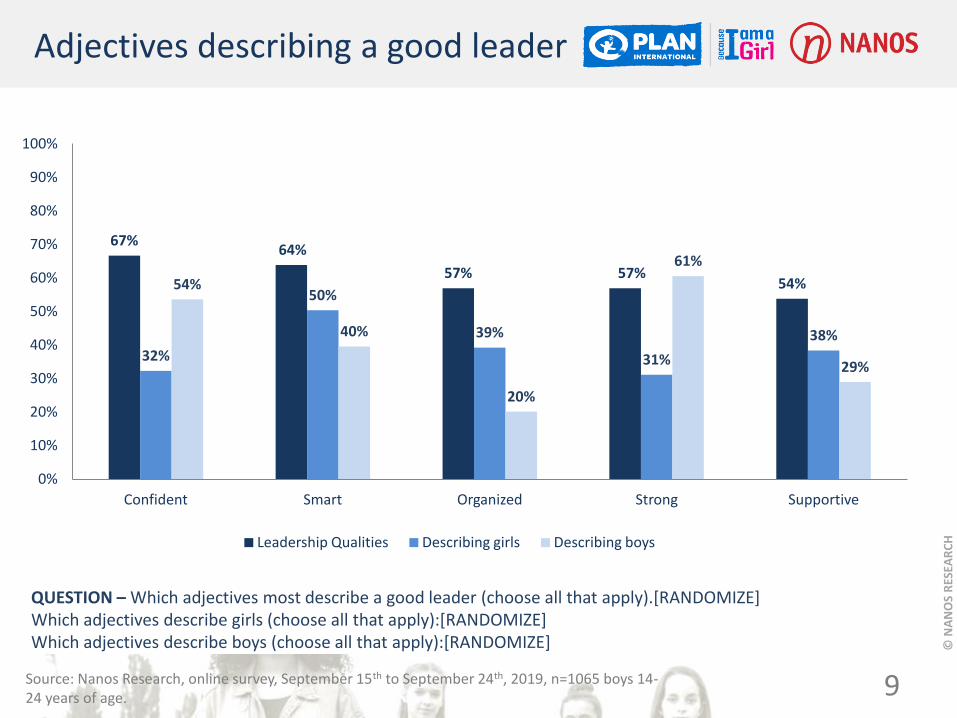
© N
AN
OS
RES
EAR
CH
67% 64%
57% 57% 54%
32%
50%
39%
31%
38%
54%
40%
20%
61%
29%
0%
10%
20%
30%
40%
50%
60%
70%
80%
90%
100%
Confident Smart Organized Strong Supportive
Leadership Qualities Describing girls Describing boys
9
QUESTION – Which adjectives most describe a good leader (choose all that apply).[RANDOMIZE] Which adjectives describe girls (choose all that apply):[RANDOMIZE] Which adjectives describe boys (choose all that apply):[RANDOMIZE]
Source: Nanos Research, online survey, September 15th to September 24th, 2019, n=1065 boys 14-24 years of age.
Adjectives describing a good leader

© N
AN
OS
RES
EAR
CH
51% 50% 50% 48% 44%
40%
32%
41%
54%
17%
31%
20%
30% 24%
31%
0%
10%
20%
30%
40%
50%
60%
70%
80%
90%
100%
Helpful Patient Passionate Caring Decisive
Leadership Qualities Describing girls Describing boys
10 Source: Nanos Research, online survey, September 15th to September 24th, 2019, n=1065 boys 14-24 years of age.
Adjectives describing a good leader
QUESTION – Which adjectives most describe a good leader (choose all that apply).[RANDOMIZE] Which adjectives describe girls (choose all that apply):[RANDOMIZE] Which adjectives describe boys (choose all that apply):[RANDOMIZE]
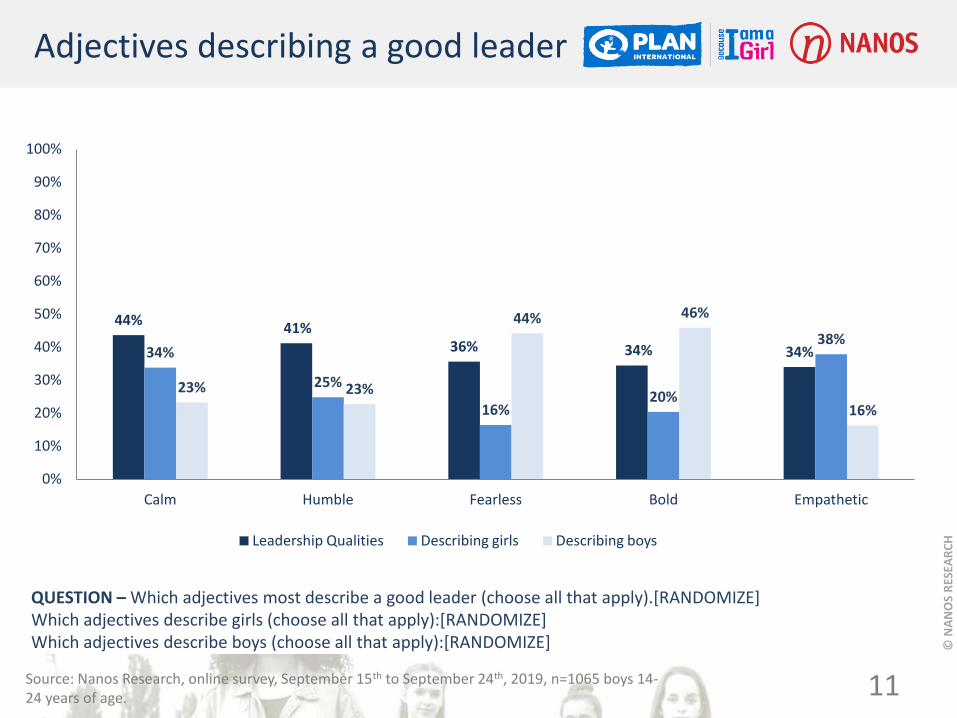
© N
AN
OS
RES
EAR
CH
44% 41%
36% 34% 34% 34%
25%
16% 20%
38%
23% 23%
44% 46%
16%
0%
10%
20%
30%
40%
50%
60%
70%
80%
90%
100%
Calm Humble Fearless Bold Empathetic
Leadership Qualities Describing girls Describing boys
11 Source: Nanos Research, online survey, September 15th to September 24th, 2019, n=1065 boys 14-24 years of age.
Adjectives describing a good leader
QUESTION – Which adjectives most describe a good leader (choose all that apply).[RANDOMIZE] Which adjectives describe girls (choose all that apply):[RANDOMIZE] Which adjectives describe boys (choose all that apply):[RANDOMIZE]

© N
AN
OS
RES
EAR
CH
33% 29%
20%
12% 10% 13% 12%
49%
9%
53%
36%
22% 19%
25%
16%
0%
10%
20%
30%
40%
50%
60%
70%
80%
90%
100%
Assertive Tactful Gentle Stern Emotional
Leadership Qualities Describing girls Describing boys
12 Source: Nanos Research, online survey, September 15th to September 24th, 2019, n=1065 boys 14-24 years of age.
Adjectives describing a good leader
QUESTION – Which adjectives most describe a good leader (choose all that apply).[RANDOMIZE] Which adjectives describe girls (choose all that apply):[RANDOMIZE] Which adjectives describe boys (choose all that apply):[RANDOMIZE]

© N
AN
OS
RES
EAR
CH
10% 8% 5%
2% 2%
22%
10%
23% 19%
13% 14%
29%
12% 11% 11%
0%
10%
20%
30%
40%
50%
60%
70%
80%
90%
100%
Passive Imposing Quiet Timid Unsure
Leadership Qualities Describing girls Describing boys
13 Source: Nanos Research, online survey, September 15th to September 24th, 2019, n=1065 boys 14-24 years of age.
Adjectives describing a good leader
QUESTION – Which adjectives most describe a good leader (choose all that apply).[RANDOMIZE] Which adjectives describe girls (choose all that apply):[RANDOMIZE] Which adjectives describe boys (choose all that apply):[RANDOMIZE]

© N
AN
OS
RES
EAR
CH
14
QUESTION – Which adjectives most describe a good leader (choose all that apply).[RANDOMIZE]
Describing a good leader versus describing girls
Assertive
Organized
Calm
Smart
Bold
Supportive
Emotional
Patient Humble
Tactful
Strong
Imposing Stern
Decisive
Passionate
Confident
Caring
Fearless
Empathetic
Helpful
Passive
Quiet
Timid
Gentle
0.0
10.0
20.0
30.0
40.0
50.0
60.0
70.0
80.0
90.0
100.0
0.0 10.0 20.0 30.0 40.0 50.0 60.0 70.0 80.0 90.0 100.0
Wo
rds
De
scri
bin
g G
irls
Words Describing a Good Leader
QUESTION – Which adjectives describe girls (choose all that apply):[RANDOMIZE]
Source: Nanos Research, online survey, September 15th to September 24th, 2019, n=1065 boys 14-24 years of age.

© N
AN
OS
RES
EAR
CH
15
QUESTION – Which adjectives most describe a good leader (choose all that apply).[RANDOMIZE]
Describing a good leader versus describing boys
Assertive
Organized Calm
Smart
Bold
Supportive
Emotional
Patient
Humble Tactful
Strong
Imposing
Stern
Decisive
Passionate
Confident
Caring
Fearless
Empathetic
Helpful
Passive
Quiet Timid
Gentle
0.0
10.0
20.0
30.0
40.0
50.0
60.0
70.0
80.0
90.0
100.0
0.0 10.0 20.0 30.0 40.0 50.0 60.0 70.0 80.0 90.0 100.0
Wo
rds
De
scri
bin
g B
oys
Words Describing a Good Leader
QUESTION – Which adjectives describe boys (choose all that apply):[RANDOMIZE]
Source: Nanos Research, online survey, September 15th to September 24th, 2019, n=1065 boys 14-24 years of age.

© N
AN
OS
RES
EAR
CH
11%
74%
3% 3%
9%
Only/mostly women All genders equally Only/mostly men
No one Unsure
QUESTION – Do you believe that achieving gender equality benefits:
All genders equally
14 to 15 years old (n=141) 75.4%
16 to 17 years old (n=202) 71.1%
18 to 19 years old (n=220) 76.7%
20 to 21 years old (n=203) 70.5%
22 to 24 years old (n=299) 75.3%
*Weighted to the true population proportion. *Charts may not add up to 100 due to rounding.
Source: Nanos Research, online survey, September 15th to September 24th, 2019, n=1065 boys 14-24 years of age. 16
Beneficiaries of gender equality
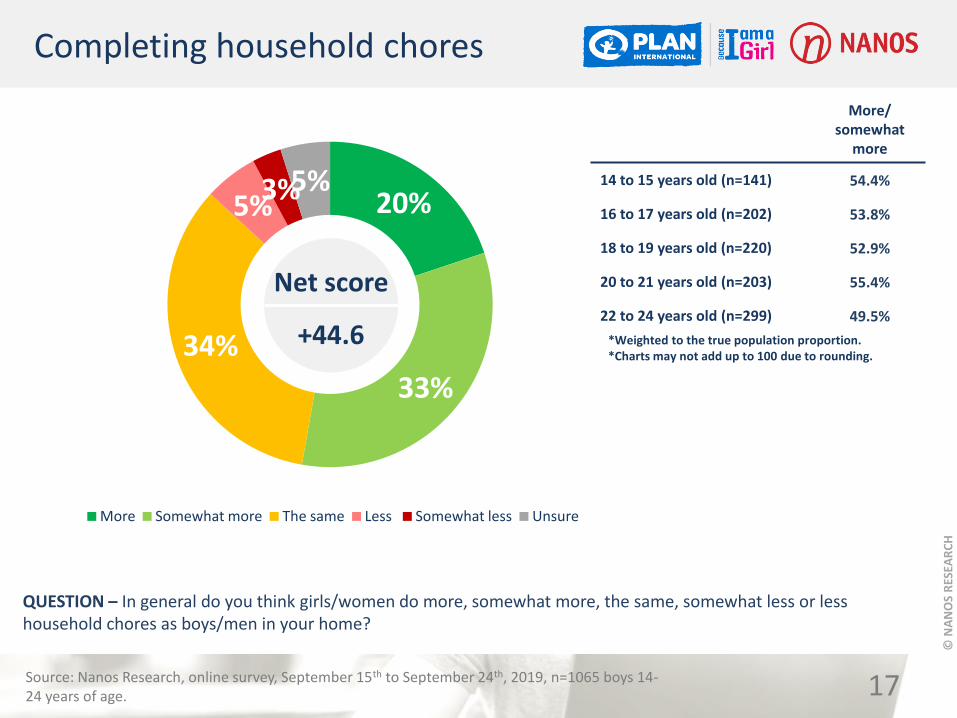
© N
AN
OS
RES
EAR
CH
20%
33%
34%
5% 3% 5%
More Somewhat more The same Less Somewhat less Unsure
Net score
+44.6
QUESTION – In general do you think girls/women do more, somewhat more, the same, somewhat less or less household chores as boys/men in your home?
More/ somewhat
more
14 to 15 years old (n=141) 54.4%
16 to 17 years old (n=202) 53.8%
18 to 19 years old (n=220) 52.9%
20 to 21 years old (n=203) 55.4%
22 to 24 years old (n=299) 49.5%
*Weighted to the true population proportion. *Charts may not add up to 100 due to rounding.
17
Completing household chores
Source: Nanos Research, online survey, September 15th to September 24th, 2019, n=1065 boys 14-24 years of age.
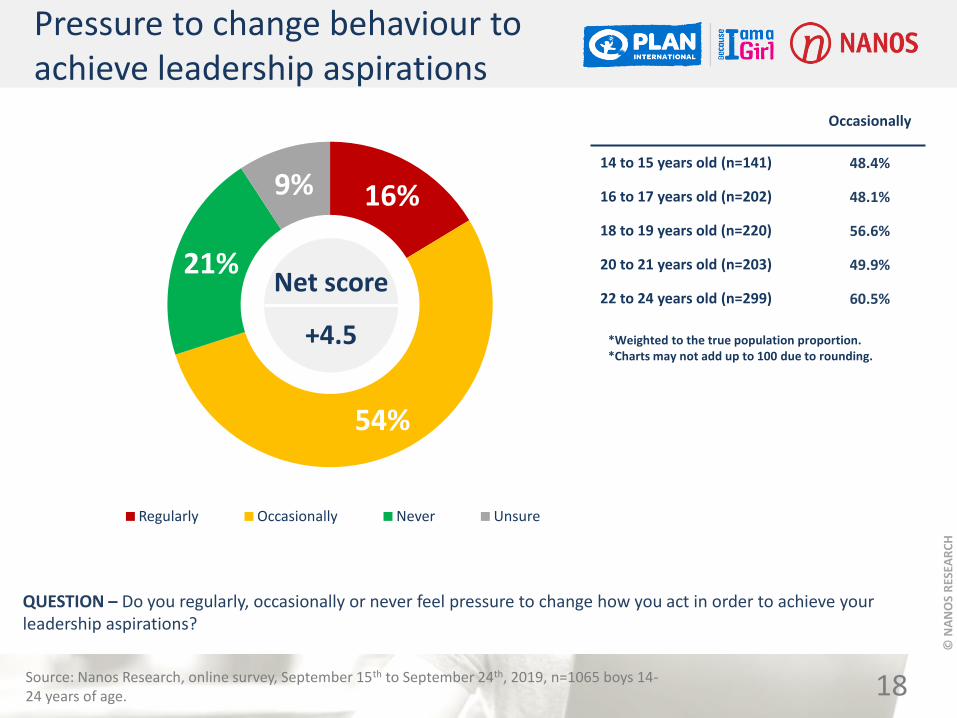
© N
AN
OS
RES
EAR
CH
16%
54%
21%
9%
Regularly Occasionally Never Unsure
Net score
+4.5
QUESTION – Do you regularly, occasionally or never feel pressure to change how you act in order to achieve your leadership aspirations?
Occasionally
14 to 15 years old (n=141) 48.4%
16 to 17 years old (n=202) 48.1%
18 to 19 years old (n=220) 56.6%
20 to 21 years old (n=203) 49.9%
22 to 24 years old (n=299) 60.5%
*Weighted to the true population proportion. *Charts may not add up to 100 due to rounding.
18
Pressure to change behaviour to achieve leadership aspirations
Source: Nanos Research, online survey, September 15th to September 24th, 2019, n=1065 boys 14-24 years of age.

© N
AN
OS
RES
EAR
CH
*Charts may not add up to 100 due to rounding
9%
30%
40%
38%
42%
12%
41%
36%
38%
34%
15%
15%
11%
11%
11%
58%
10%
7%
7%
7%
7%
6%
7%
6%
6%
0% 20% 40% 60% 80% 100%
My gender holds back my ability to be a leader.
My opinions are/were valued when I was in school
Girls and women have the natural abilities required to
be good leaders
Boys and men have the natural abilities required to
be good leaders
People thought of me as smart growing up
Agree Somewhat agree Somewhat disagree Disagree Unsure
Net score
+59.0
+58.4
+58.3
+46.2
-52.9
QUESTION – Do you agree, somewhat agree, somewhat disagree or disagree with the following statements [RANDOMIZE]
Agreement with statements about leadership
19 Source: Nanos Research, online survey, September 15th to September 24th, 2019, n=1065 boys 14-24 years of age.

© N
AN
OS
RES
EAR
CH
42%
34%
11%
7% 6%
Agree Somewhat agree Somewhat disagree Disagree Unsure
Net score
+59.0
Agree/ Somewhat
agree
14 to 15 years old (n=141) 75.8%
16 to 17 years old (n=202) 73.2%
18 to 19 years old (n=220) 76.7%
20 to 21 years old (n=203) 76.4%
22 to 24 years old (n=299) 78.7%
*Weighted to the true population proportion. *Charts may not add up to 100 due to rounding.
20
Perceived intelligence growing up
QUESTION – Do you agree, somewhat agree, somewhat disagree or disagree with the following statements [RANDOMIZE] People thought of me as smart growing up
Source: Nanos Research, online survey, September 15th to September 24th, 2019, n=1065 boys 14-24 years of age.

© N
AN
OS
RES
EAR
CH
40%
36%
11%
7% 7%
Agree Somewhat agree Somewhat disagree Disagree Unsure
Net score
+58.3
Agree/ Somewhat
agree
14 to 15 years old (n=141) 76.3%
16 to 17 years old (n=202) 73.1%
18 to 19 years old (n=220) 74.7%
20 to 21 years old (n=203) 74.1%
22 to 24 years old (n=299) 78.3%
*Weighted to the true population proportion. *Charts may not add up to 100 due to rounding.
21
Women and girls as natural leaders
QUESTION – Do you agree, somewhat agree, somewhat disagree or disagree with the following statements [RANDOMIZE] Girls and women have the natural abilities required to be good leaders
Source: Nanos Research, online survey, September 15th to September 24th, 2019, n=1065 boys 14-24 years of age.

© N
AN
OS
RES
EAR
CH
30%
41%
15%
10% 6%
Agree Somewhat agree Somewhat disagree Disagree Unsure
Net score
+46.2
Agree/ Somewhat
agree
14 to 15 years old (n=141) 74.8%
16 to 17 years old (n=202) 67.8%
18 to 19 years old (n=220) 68.6%
20 to 21 years old (n=203) 66.3%
22 to 24 years old (n=299) 72.5%
*Weighted to the true population proportion. *Charts may not add up to 100 due to rounding.
22
Opinions being valued in school
QUESTION – Do you agree, somewhat agree, somewhat disagree or disagree with the following statements [RANDOMIZE] My opinions are/were valued when I was in school
Source: Nanos Research, online survey, September 15th to September 24th, 2019, n=1065 boys 14-24 years of age.

© N
AN
OS
RES
EAR
CH
38%
38%
11%
7% 6%
Agree Somewhat agree Somewhat disagree Disagree Unsure
Net score
+58.4
Agree/ Somewhat
agree
14 to 15 years old (n=141) 71.2%
16 to 17 years old (n=202) 74.1%
18 to 19 years old (n=220) 75.9%
20 to 21 years old (n=203) 76.4%
22 to 24 years old (n=299) 79.7%
*Weighted to the true population proportion. *Charts may not add up to 100 due to rounding.
23
Men and boys as natural leaders
QUESTION – Do you agree, somewhat agree, somewhat disagree or disagree with the following statements [RANDOMIZE] Boys and men have the natural abilities required to be good leaders
Source: Nanos Research, online survey, September 15th to September 24th, 2019, n=1065 boys 14-24 years of age.

© N
AN
OS
RES
EAR
CH
9%
12%
15%
58%
7%
Agree Somewhat agree Somewhat disagree Disagree Unsure
Net score
-52.9
Somewhat disagree/ Disagree
14 to 15 years old (n=141) 69.6%
16 to 17 years old (n=202) 70.7%
18 to 19 years old (n=220) 76.5%
20 to 21 years old (n=203) 76.5%
22 to 24 years old (n=299) 72.1%
*Weighted to the true population proportion. *Charts may not add up to 100 due to rounding.
24
Gender as a barrier to being a leader
QUESTION – Do you agree, somewhat agree, somewhat disagree or disagree with the following statements [RANDOMIZE] My gender holds back my ability to be a leader
Source: Nanos Research, online survey, September 15th to September 24th, 2019, n=1065 boys 14-24 years of age.

© N
AN
OS
RES
EAR
CH
The “why”: Barriers – knowledge, skills, context
Boys are six times more likely to picture a CEO as a man rather than a woman; feel men and women in positions of power are equally
approachable

© N
AN
OS
RES
EAR
CH
34%
42%
15%
5% 5%
Confident Somewhat confident Somewhat not confident
Not confident Unsure
Net score
+56.0
Confident/ Somewhat confident
14 to 15 years old (n=141) 75.9%
16 to 17 years old (n=202) 75.4%
18 to 19 years old (n=220) 74.6%
20 to 21 years old (n=203) 72.8%
22 to 24 years old (n=299) 78.4%
*Weighted to the true population proportion. *Charts may not add up to 100 due to rounding.
26
Confidence in leadership abilities
QUESTION – In general, are you confident, somewhat confident, somewhat not confident or not confident in your leadership abilities?
Source: Nanos Research, online survey, September 15th to September 24th, 2019, n=1065 boys 14-24 years of age.

© N
AN
OS
RES
EAR
CH
First ranked
(n=1003)
Second ranked (n=906)
Third ranked (n=792)
Sports and Activities 18.4% 18.0% 12.9%
Family 17.8% 15.6% 14.8%
I have had no opportunities to become a leader 17.8% - -
Within peer groups 16.0% 18.1% 16.4%
In a workplace 14.0% 11.7% 15.1%
Educational institutions 11.4% 14.4% 14.6%
Volunteerism and activism 8.4% 11.8% 13.5%
Clubs and Community Groups 8.1% 10.1% 12.6%
Unsure 4.1% - -
Other (please specify) 1.9% 0.3% -
QUESTION – Where do you feel that you had/have opportunities to become a leader? Please rank the following where 1 is the place where you had the best opportunities to become a leader, 2 the second best place to become a leader and so on. [RANDOMIZE]
27
Opportunities to become a leader
Source: Nanos Research, online survey, September 15th to September 24th, 2019, n=1003 boys 14-24 years of age.

© N
AN
OS
RES
EAR
CH
21%
56%
18%
6%
Regularly Occasionally Never Unsure
Net score
-2.9
QUESTION – Do you regularly, occasionally or never doubt that you have what it takes to be a good leader?
Occasionally
14 to 15 years old (n=141) 56.5%
16 to 17 years old (n=202) 50.2%
18 to 19 years old (n=220) 54.6%
20 to 21 years old (n=203) 55.4%
22 to 24 years old (n=299) 59.3%
*Weighted to the true population proportion. *Charts may not add up to 100 due to rounding.
28
Doubting capability to be a good leader
Source: Nanos Research, online survey, September 15th to September 24th, 2019, n=1065 boys 14-24 years of age.

© N
AN
OS
RES
EAR
CH
23%
18%
14% 14%
11%
9% 8%
0%
5%
10%
15%
20%
25%
30%
Education Family support Community support
A mentor Money Access to leadership
courses
Gender equality
29
QUESTION – What tools do you think you need to achieve your leadership goals? (choose all that apply)
Top mentions of tools needed to achieve leadership goals
Source: Nanos Research, online survey, September 15th to September 24th, 2019, n=1065 boys 14-24 years of age.

© N
AN
OS
RES
EAR
CH
21% 21%
12% 9% 9% 9%
8% 7%
4%
0%
5%
10%
15%
20%
25%
30%
Education Family support
Community support
A mentor I have the tools I need
Gender equality
Money Access to leadership
courses
Unsure
30
QUESTION – Do you have access to all the tools you need to achieve your leadership goals? (choose all the tools you currently have access to)
Top mentions of access to tools needed to achieve leadership goals
Source: Nanos Research, online survey, September 15th to September 24th, 2019, n=1065 boys 14-24 years of age.

© N
AN
OS
RES
EAR
CH
Frequency (n=1059)
0-5 46.0%
6-10 7.1%
11-15 1.5%
16-20 0.2%
21-25 -
Over 25 0.5%
Unsure 44.6%
QUESTION – Please reflect for a moment on those in your immediate circle, excluding family who are in a position of power. This means a person who has authority or influence in your life (for example: teachers, coaches, and bosses). How many of those are women: _____ (enter number)
31
Women in a position of power
Mean Median
4.0 3.0
Source: Nanos Research, online survey, September 15th to September 24th, 2019, n=1059 boys 14-24 years of age.
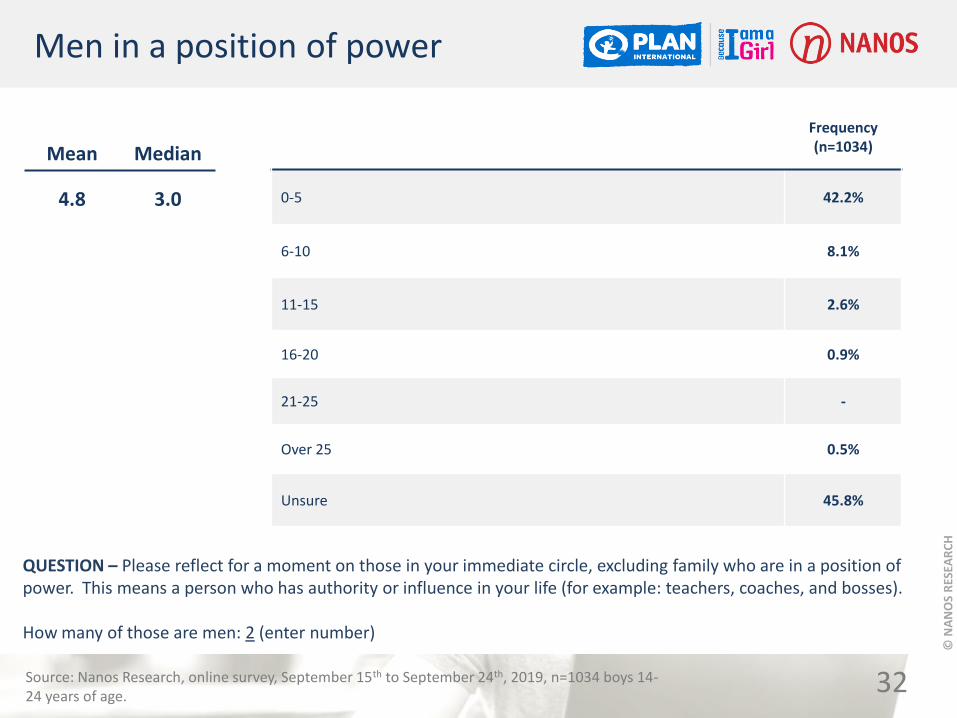
© N
AN
OS
RES
EAR
CH
Frequency (n=1034)
0-5 42.2%
6-10 8.1%
11-15 2.6%
16-20 0.9%
21-25 -
Over 25 0.5%
Unsure 45.8%
QUESTION – Please reflect for a moment on those in your immediate circle, excluding family who are in a position of power. This means a person who has authority or influence in your life (for example: teachers, coaches, and bosses). How many of those are men: 2 (enter number)
32
Men in a position of power
Mean Median
4.8 3.0
Source: Nanos Research, online survey, September 15th to September 24th, 2019, n=1034 boys 14-24 years of age.

© N
AN
OS
RES
EAR
CH
46%
44%
10%
Yes No Unsure
Net score
+1.9
QUESTION – Do you have a mentor(s)? (Examples of mentors can be people you consider leaders who have provided guidance, leadership, advice, inspiration, counselling, or personal or professional insight)
Yes
14 to 15 years old (n=141) 41.9%
16 to 17 years old (n=202) 48.2%
18 to 19 years old (n=220) 49.2%
20 to 21 years old (n=203) 46.7%
22 to 24 years old (n=299) 44.7%
*Weighted to the true population proportion. *Charts may not add up to 100 due to rounding.
33
Having a mentor
Source: Nanos Research, online survey, September 15th to September 24th, 2019, n=1065 boys 14-24 years of age.

© N
AN
OS
RES
EAR
CH
71%
28%
1%
Male Female Other
QUESTION – If yes, what is the gender of your mentor?
Male
14 to 15 years old (n=61) 77.8%
16 to 17 years old (n=101) 73.1%
18 to 19 years old (n=104) 69.9%
20 to 21 years old (n=101) 71.7%
22 to 24 years old (n=128) 66.6%
*Weighted to the true population proportion. *Charts may not add up to 100 due to rounding.
34
Gender of mentor
Source: Nanos Research, online survey, September 15th to September 24th, 2019, n=495 boys 14-24 years of age.

© N
AN
OS
RES
EAR
CH
*Charts may not add up to 100 due to rounding
31%
37%
41%
40%
37%
39%
17%
12%
10%
4%
6%
3%
7%
8%
7%
0% 20% 40% 60% 80% 100%
I find men in positions of power approachable
I find women in positions of power approachable
I expect to be given personally challenging and
interesting work early in my career/professional life
Agree Somewhat agree Somewhat disagree Disagree Unsure
Net score
+66.8
+55.7
+50.6
QUESTION – Do you agree, somewhat agree, somewhat disagree or disagree with the following? [RANDOMIZE]
Professional life and positions of power
35 Source: Nanos Research, online survey, September 15th to September 24th, 2019, n=1065 boys 14-24 years of age.

© N
AN
OS
RES
EAR
CH
41%
39%
10% 3% 7%
Agree Somewhat agree Somewhat disagree Disagree Unsure
Net score
+66.8
Agree/ Somewhat
agree
14 to 15 years old (n=141) 76.3%
16 to 17 years old (n=202) 76.9%
18 to 19 years old (n=220) 75.3%
20 to 21 years old (n=203) 86.5%
22 to 24 years old (n=299) 82.6%
*Weighted to the true population proportion. *Charts may not add up to 100 due to rounding.
36
Expectation of interesting work early in professional life
QUESTION – Do you agree, somewhat agree, somewhat disagree or disagree with the following? [RANDOMIZE] I expect, to be given personally challenging and interesting work early in my career/professional life
Source: Nanos Research, online survey, September 15th to September 24th, 2019, n=1065 boys 14-24 years of age.

© N
AN
OS
RES
EAR
CH
37%
37%
12%
6% 8%
Agree Somewhat agree Somewhat disagree Disagree Unsure
Net score
+55.7
Agree/ Somewhat
agree
14 to 15 years old (n=141) 69.1%
16 to 17 years old (n=202) 67.7%
18 to 19 years old (n=220) 74.4%
20 to 21 years old (n=203) 77.3%
22 to 24 years old (n=299) 77.8%
*Weighted to the true population proportion. *Charts may not add up to 100 due to rounding.
37
Approachability of women in positions of power
QUESTION – Do you agree, somewhat agree, somewhat disagree or disagree with the following? [RANDOMIZE] I find women in positions of power approachable
Source: Nanos Research, online survey, September 15th to September 24th, 2019, n=1065 boys 14-24 years of age.
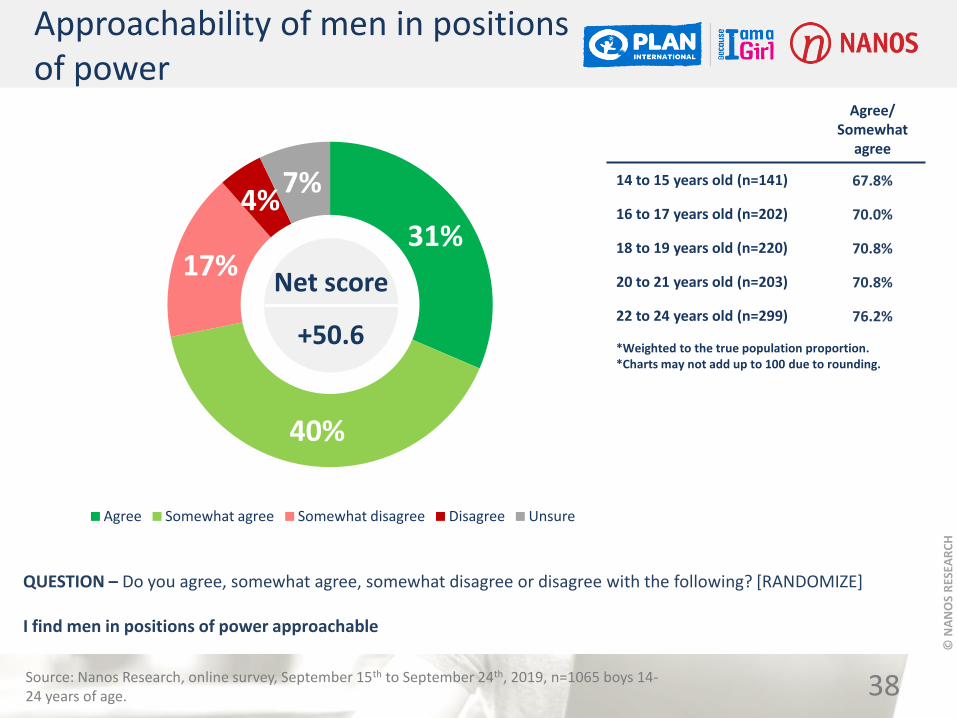
© N
AN
OS
RES
EAR
CH
31%
40%
17%
4% 7%
Agree Somewhat agree Somewhat disagree Disagree Unsure
Net score
+50.6
Agree/ Somewhat
agree
14 to 15 years old (n=141) 67.8%
16 to 17 years old (n=202) 70.0%
18 to 19 years old (n=220) 70.8%
20 to 21 years old (n=203) 70.8%
22 to 24 years old (n=299) 76.2%
*Weighted to the true population proportion. *Charts may not add up to 100 due to rounding.
38
Approachability of men in positions of power
QUESTION – Do you agree, somewhat agree, somewhat disagree or disagree with the following? [RANDOMIZE] I find men in positions of power approachable
Source: Nanos Research, online survey, September 15th to September 24th, 2019, n=1065 boys 14-24 years of age.

© N
AN
OS
RES
EAR
CH
49%
8%
38%
5%
A man A woman I wouldn't assume either Unsure
QUESTION – Think of a CEO, did you picture:
A man
14 to 15 years old (n=141) 51.2%
16 to 17 years old (n=202) 48.7%
18 to 19 years old (n=220) 51.5%
20 to 21 years old (n=203) 49.6%
22 to 24 years old (n=299) 45.6%
*Weighted to the true population proportion. *Charts may not add up to 100 due to rounding.
39
Perceived gender of CEO
Source: Nanos Research, online survey, September 15th to September 24th, 2019, n=1065 boys 14-24 years of age.

© N
AN
OS
RES
EAR
CH
How: Action (Use your power, talk about it, donate)
Canadian boys feel equally encouraged to pursue their leadership aspirations by both
their male and female peers

© N
AN
OS
RES
EAR
CH
16%
44%
32%
7%
Regularly Occasionally Never Unsure
Net score
-15.6
QUESTION – Do you talk about your leadership aspirations with your family or other trusted adults regularly, occasionally or never?
Occasionally
14 to 15 years old (n=141) 36.0%
16 to 17 years old (n=202) 37.4%
18 to 19 years old (n=220) 43.3%
20 to 21 years old (n=203) 44.7%
22 to 24 years old (n=299) 53.7%
*Weighted to the true population proportion. *Charts may not add up to 100 due to rounding.
41
Talking about leadership aspirations with family
Source: Nanos Research, online survey, September 15th to September 24th, 2019, n=1065 boys 14-24 years of age.

© N
AN
OS
RES
EAR
CH
34%
38%
9%
5%
14%
Encourage Somewhat encourage Somewhat not encourage
Not encourage Unsure
Net score
+57.8
Encourage/ Somewhat encourage
14 to 15 years old (n=141) 65.7%
16 to 17 years old (n=202) 67.5%
18 to 19 years old (n=220) 75.5%
20 to 21 years old (n=203) 73.6%
22 to 24 years old (n=299) 75.1%
*Weighted to the true population proportion. *Charts may not add up to 100 due to rounding.
42
Female peers encouraging leadership aspirations
QUESTION – Do your female peers encourage, somewhat encourage, somewhat not encourage or not encourage your leadership aspirations?
Source: Nanos Research, online survey, September 15th to September 24th, 2019, n=1065 boys 14-24 years of age.

© N
AN
OS
RES
EAR
CH
31%
41%
11%
5%
13%
Encourage Somewhat encourage Somewhat not encourage
Not encourage Unsure
Net score
+55.6
Encourage/ Somewhat encourage
14 to 15 years old (n=141) 63.4%
16 to 17 years old (n=202) 65.4%
18 to 19 years old (n=220) 75.6%
20 to 21 years old (n=203) 74.5%
22 to 24 years old (n=299) 74.3%
*Weighted to the true population proportion. *Charts may not add up to 100 due to rounding.
43
Male peers encouraging leadership aspirations
QUESTION – Do your male peers encourage, somewhat encourage, somewhat not encourage or not encourage your leadership aspirations?
Source: Nanos Research, online survey, September 15th to September 24th, 2019, n=1065 boys 14-24 years of age.

© N
AN
OS
RES
EAR
CH
35%
12%
43%
10%
The boys’ teams are/were treated better and had a higher status The girls’ teams are/were treated better and had a higher status Both the girls and the boys are treated the same and have the same status Unsure
QUESTION – When thinking of sports teams at your current or previous high school, are (or were) the girls’ teams treated the same and did they have the same status as the boys’ teams?
Both the girls and the boys
14 to 15 years old (n=141) 45.3%
16 to 17 years old (n=202) 51.5%
18 to 19 years old (n=220) 43.5%
20 to 21 years old (n=203) 33.7%
22 to 24 years old (n=299) 43.0%
*Weighted to the true population proportion. *Charts may not add up to 100 due to rounding.
44
Treatment of male versus female sports teams
Source: Nanos Research, online survey, September 15th to September 24th, 2019, n=1065 boys 14-24 years of age.

© N
AN
OS
RES
EAR
CH
METHODOLOGY
Confidential 45

© N
AN
OS
RES
EAR
CH
METHODOLOGY
Nanos conducted an online survey of 1,065 Canadian boys, between 14 and 24 years of age, between September 15th and 24th, 2019. Participants were administered a survey online. The results were statistically checked and weighted by age using the latest Census information and the sample is geographically stratified to be representative of Canada. No margin of error applies to this research. The research was commissioned by Plan International Canada and was conducted by Nanos Research. Note: Charts may not add up to 100 due to rounding.
46

© N
AN
OS
RES
EAR
CH
TECHNICAL NOTE
Element Description
Research sponsor Plan International Canada
Population and Final Sample Size
1065 Canadian boys 14 to 24 years of age.
Source of Sample QuestMindshare and Prodege
Type of Sample Non-probability
Margin of Error No margin of error applies to this research.
Mode of Survey Online survey
Sampling Method Base The sampling included Canadian boys from 14 to 24 years old.
Demographics (Captured)
Atlantic Canada, Quebec, Ontario, Prairies, British Columbia; Boys; between 14 and 24 years old. Six digit postal code was used to validate geography.
Fieldwork/Validation Not applicable.
Number of Calls Not applicable.
Time of Calls Participants were not called.
Field Dates September 15th to September 24th, 2019.
Language of Survey The survey was conducted in both English and French.
Standards
Nanos Research is a member of the Canadian Research Insights Council (CRIC) and confirms that this research fully complies with all CRIC Standards including the CRIC Public Opinion Research Standards and Disclosure Requirements. https://canadianresearchinsightscouncil.ca/standards/
Element Description
Weighting of Data
The results were weighted by age using the latest Census information (2016) and the sample is geographically stratified to ensure a distribution across all regions of Canada. See tables for full weighting disclosure.
Screening Not applicable.
Excluded Demographics
Individuals younger than 14 years old or older than 24 years old; women; individuals without internet could not participate.
Stratification
By age using the latest Census information (2016) and the sample is geographically stratified to be representative of Canada. Smaller areas such as Atlantic Canada were marginally oversampled to allow for a minimum regional sample
Estimated Response Rate
Not applicable.
Question Order Question order in the preceding report reflects the order in which they appeared in the original questionnaire.
Question Content All questions asked are contained in the report.
Question Wording The questions in the preceding report are written exactly as they were asked to individuals.
Research/Data Collection Supplier
Nanos Research
Contact
Contact Nanos Research for more information or with any concerns or questions. http://www.nanos.co Telephone:(613) 234-4666 ext. 237 Email: [email protected].

© N
AN
OS
RES
EAR
CH
ABOUT NANOS
As one of North America’s premier market and public opinion research firms, we put strategic intelligence into the hands of decision makers. The majority of our work is for private sector and public facing organizations and ranges from market studies, managing reputation through to leveraging data intelligence. Nanos Research offers a vertically integrated full service quantitative and qualitative research practice to attain the highest standards and the greatest control over the research process. www.nanos.co
A public relations consultancy for executives and organizations with images to create, issues to manage, relationships to build, and reputations to protect in a digitally disrupted era. We serve senior leaders with PR counsel that is both strategic and social, informed by a deep understanding of analytics, content, communities, media, sustainability and technology. www.signaleadership.com
This international joint venture between dimap and Nanos brings together top research and data experts from North American and Europe to deliver exceptional data intelligence to clients. The team offers data intelligence services ranging from demographic and sentiment microtargeting; consumer sentiment identification and decision conversion; and, data analytics and profiling for consumer persuasion. www.nanosdimap.com
NRM is an affiliate of Nanos Research and Rutherford McKay Associates. Our service offerings are based on decades of professional experience and extensive research and include public acceptance and engagement, communications audits, and narrative development. www.nrmpublicaffairs.com
48

© N
AN
OS
RES
EAR
CH
TABULATIONS

2019-1496 – Plan Canada – Boys – STAT SHEET
Nanos conducted an online survey of 1,065 Canadian boys, 14 to 24 years of age, between September 15th to 24th, 2019.
www.nanos.co
Page 1
Region Age
Canada 2019-09 Atlantic Quebec Ontario Manitoba/Saskatchewan Alberta
British Columbia/North
14 to 15 years old
16 to 17 years old
18 to 19 years old
20 to 21 years old
22 to 24 years old
Question - Which adjectives most describe a good leader (choose all that apply): [RANDOMIZE]
Total Unwgt N 1065 98 226 304 98 166 173 141 202 220 203 299
Wgt N 1000 62 220 399 72 118 129 164 172 178 192 294
Assertive % 32.9 31.6 21.5 34.1 40.1 38.1 40.6 23.4 36.7 33.6 33.9 35.0
Organized % 57.0 60.6 55.6 56.5 58.8 60.6 54.4 57.8 59.2 55.9 61.1 53.1
Calm % 43.6 43.1 39.4 42.2 55.0 46.1 46.8 41.1 45.6 43.2 45.9 42.5
Smart % 63.9 66.5 65.8 64.1 68.6 65.5 54.3 62.7 62.8 66.9 67.0 61.3
Bold % 34.4 34.8 31.6 36.2 38.9 31.5 34.0 27.0 38.2 41.3 39.8 28.7
Supportive % 53.8 49.0 38.7 57.7 67.5 64.2 52.7 56.6 60.6 57.0 51.5 47.9
Emotional % 9.9 5.4 10.2 10.1 14.2 7.3 11.1 9.8 10.8 10.1 12.0 8.0
Patient % 50.0 35.5 46.8 52.7 55.7 48.5 52.2 53.0 53.2 47.7 47.9 49.2
Humble % 41.1 39.9 38.2 42.0 50.9 38.4 41.1 37.8 44.9 46.5 41.2 37.5
Tactful % 28.8 31.0 22.8 29.4 35.0 31.2 30.2 24.7 26.5 27.4 31.2 31.6
Strong % 57.0 62.3 43.8 59.3 60.0 65.8 59.7 58.3 56.4 61.5 58.5 52.8
Imposing % 8.0 6.9 18.4 4.8 8.2 3.4 5.1 4.7 8.0 9.0 11.5 7.1
Stern % 12.2 13.7 8.8 12.6 18.3 14.4 10.4 8.4 10.5 11.2 19.6 11.0
Decisive % 43.7 49.8 45.3 40.8 43.3 45.9 44.8 36.4 39.4 45.0 44.4 49.0
Passionate % 49.6 53.7 48.9 49.1 49.5 52.1 47.8 45.7 53.7 48.8 55.5 46.0
Confident % 66.7 66.9 58.6 68.9 65.9 72.2 68.8 64.0 72.7 66.6 63.4 66.8
Caring % 48.4 43.9 44.7 54.8 49.6 42.9 41.4 43.0 56.9 52.0 47.3 45.0
Fearless % 35.6 44.3 20.3 41.8 39.9 34.6 36.6 29.8 35.2 39.3 39.9 33.9
Empathetic % 33.9 30.1 28.2 35.9 39.6 36.9 33.5 28.3 33.2 41.6 32.1 34.1
Helpful % 50.6 52.5 38.9 54.7 62.6 49.9 51.3 53.6 54.1 56.8 51.5 42.7
Passive % 9.6 1.7 9.3 11.5 15.0 6.0 8.5 8.7 6.3 11.0 10.5 10.6
Quiet % 5.2 4.6 7.5 3.6 6.1 4.0 7.0 1.6 8.6 3.8 5.4 5.8
Timid % 2.0 0.5 2.1 2.3 1.4 1.3 3.0 0.8 2.5 1.9 3.3 1.8
Gentle % 20.0 13.1 19.0 21.8 23.1 18.3 19.8 18.1 17.9 24.2 27.8 14.8
Unsure % 2.0 0.0 2.3 2.6 0.0 3.5 0.7 3.1 2.2 2.0 1.5 1.7

2019-1496 – Plan Canada – Boys – STAT SHEET
Nanos conducted an online survey of 1,065 Canadian boys, 14 to 24 years of age, between September 15th to 24th, 2019.
www.nanos.co
Page 2
Region Age
Canada 2019-09 Atlantic Quebec Ontario Manitoba/Saskatchewan Alberta
British Columbia/North
14 to 15 years old
16 to 17 years old
18 to 19 years old
20 to 21 years old
22 to 24 years old
Question - Which adjectives describe girls (choose all that apply): [RANDOMIZE]
Total Unwgt N 1058 97 222 303 98 165 173 141 199 219 203 296
Wgt N 994 62 216 397 72 118 129 164 169 177 192 291
Assertive % 12.8 13.7 12.4 12.6 13.7 15.5 10.6 5.4 16.2 10.5 17.8 13.1
Organized % 39.2 46.5 41.8 39.4 40.4 37.5 31.9 42.7 42.9 35.3 41.6 36.0
Calm % 33.8 33.6 33.1 33.5 40.4 31.9 33.9 31.6 33.8 32.3 36.4 34.1
Smart % 50.3 44.3 56.6 50.5 51.1 49.3 42.8 52.0 54.2 46.2 53.1 47.9
Bold % 20.3 20.8 21.8 20.6 16.9 21.3 17.8 17.4 18.1 23.4 24.6 18.7
Supportive % 38.4 44.5 26.1 40.8 49.5 40.1 40.5 32.6 43.7 37.4 43.2 35.9
Emotional % 53.0 56.3 47.7 56.1 59.5 54.4 45.8 52.9 55.5 53.7 55.0 49.8
Patient % 31.6 37.1 32.3 29.1 36.2 32.5 32.2 28.2 29.9 33.2 37.6 29.5
Humble % 24.8 26.0 21.6 26.9 23.2 23.6 25.1 21.6 28.9 22.7 25.6 25.0
Tactful % 11.6 8.6 13.5 11.8 10.3 9.6 11.8 5.8 8.1 10.8 18.1 13.1
Strong % 31.1 28.7 31.4 34.4 25.4 31.8 24.3 35.3 31.9 33.2 29.5 28.1
Imposing % 9.8 7.9 8.9 11.8 8.4 7.6 8.7 7.8 10.0 10.6 12.8 8.3
Stern % 8.8 6.4 5.8 11.6 6.4 5.9 10.5 7.5 7.4 8.7 11.7 8.6
Decisive % 17.4 13.6 18.1 16.4 24.0 18.8 15.9 14.4 16.1 15.9 22.7 17.2
Passionate % 41.0 43.1 37.4 39.9 47.5 41.6 45.5 36.9 38.3 38.7 42.7 45.2
Confident % 32.3 31.9 31.9 34.9 31.1 29.2 28.8 27.5 35.9 28.6 37.5 31.7
Caring % 53.7 58.3 46.6 57.9 55.5 53.7 49.4 54.8 53.8 54.9 55.9 50.9
Fearless % 16.4 16.8 10.2 20.0 14.7 19.7 13.3 12.4 17.4 16.3 20.3 15.5
Empathetic % 37.8 38.5 31.7 38.4 43.4 38.6 42.1 38.3 37.6 33.4 38.0 40.2
Helpful % 40.3 39.5 37.3 41.4 42.3 43.2 38.4 32.3 45.1 37.7 47.1 39.1
Passive % 21.6 19.9 18.9 22.6 23.8 17.9 25.7 20.6 23.8 23.8 23.3 18.4
Quiet % 22.5 27.1 18.6 23.7 21.5 19.1 26.7 16.2 22.8 25.0 25.8 22.2
Timid % 19.2 20.6 20.6 18.5 26.9 13.0 19.6 13.4 21.0 20.0 22.6 18.6
Gentle % 48.6 54.1 50.0 48.0 56.0 44.2 45.4 46.4 53.6 45.9 51.9 46.4
Unsure % 12.9 7.4 14.0 11.7 11.6 15.8 15.4 12.3 15.1 16.2 10.2 11.7
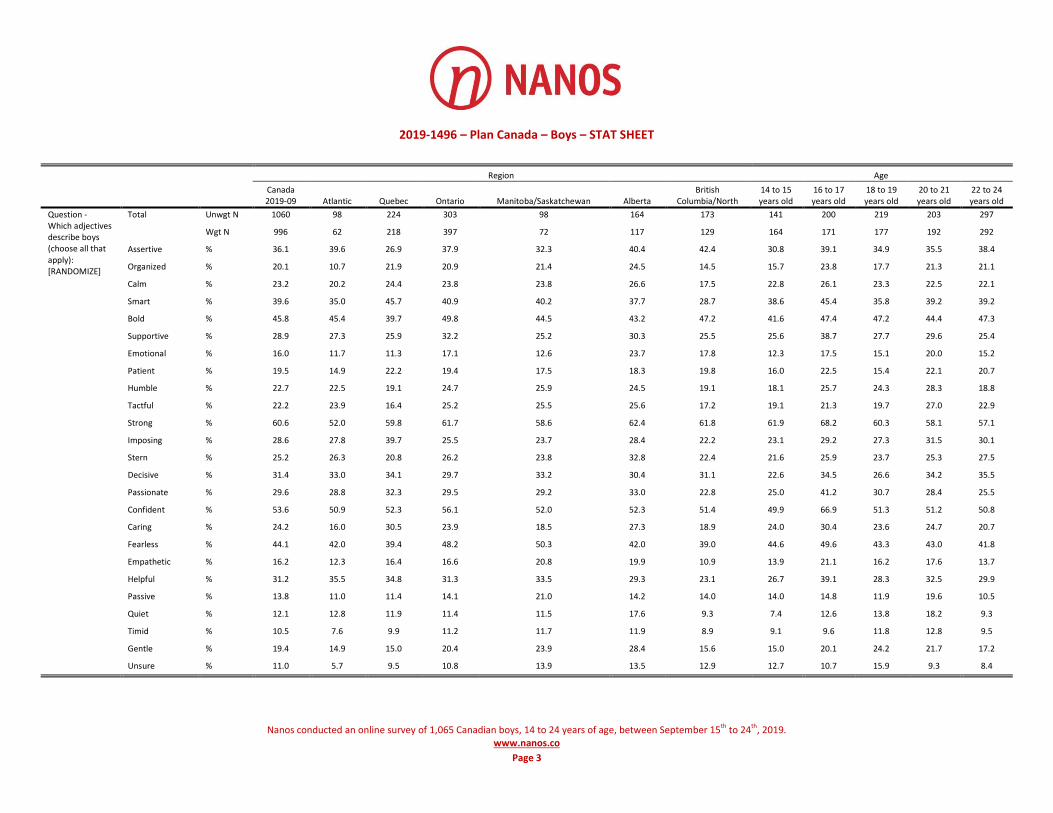
2019-1496 – Plan Canada – Boys – STAT SHEET
Nanos conducted an online survey of 1,065 Canadian boys, 14 to 24 years of age, between September 15th to 24th, 2019.
www.nanos.co
Page 3
Region Age
Canada 2019-09 Atlantic Quebec Ontario Manitoba/Saskatchewan Alberta
British Columbia/North
14 to 15 years old
16 to 17 years old
18 to 19 years old
20 to 21 years old
22 to 24 years old
Question - Which adjectives describe boys (choose all that apply): [RANDOMIZE]
Total Unwgt N 1060 98 224 303 98 164 173 141 200 219 203 297
Wgt N 996 62 218 397 72 117 129 164 171 177 192 292
Assertive % 36.1 39.6 26.9 37.9 32.3 40.4 42.4 30.8 39.1 34.9 35.5 38.4
Organized % 20.1 10.7 21.9 20.9 21.4 24.5 14.5 15.7 23.8 17.7 21.3 21.1
Calm % 23.2 20.2 24.4 23.8 23.8 26.6 17.5 22.8 26.1 23.3 22.5 22.1
Smart % 39.6 35.0 45.7 40.9 40.2 37.7 28.7 38.6 45.4 35.8 39.2 39.2
Bold % 45.8 45.4 39.7 49.8 44.5 43.2 47.2 41.6 47.4 47.2 44.4 47.3
Supportive % 28.9 27.3 25.9 32.2 25.2 30.3 25.5 25.6 38.7 27.7 29.6 25.4
Emotional % 16.0 11.7 11.3 17.1 12.6 23.7 17.8 12.3 17.5 15.1 20.0 15.2
Patient % 19.5 14.9 22.2 19.4 17.5 18.3 19.8 16.0 22.5 15.4 22.1 20.7
Humble % 22.7 22.5 19.1 24.7 25.9 24.5 19.1 18.1 25.7 24.3 28.3 18.8
Tactful % 22.2 23.9 16.4 25.2 25.5 25.6 17.2 19.1 21.3 19.7 27.0 22.9
Strong % 60.6 52.0 59.8 61.7 58.6 62.4 61.8 61.9 68.2 60.3 58.1 57.1
Imposing % 28.6 27.8 39.7 25.5 23.7 28.4 22.2 23.1 29.2 27.3 31.5 30.1
Stern % 25.2 26.3 20.8 26.2 23.8 32.8 22.4 21.6 25.9 23.7 25.3 27.5
Decisive % 31.4 33.0 34.1 29.7 33.2 30.4 31.1 22.6 34.5 26.6 34.2 35.5
Passionate % 29.6 28.8 32.3 29.5 29.2 33.0 22.8 25.0 41.2 30.7 28.4 25.5
Confident % 53.6 50.9 52.3 56.1 52.0 52.3 51.4 49.9 66.9 51.3 51.2 50.8
Caring % 24.2 16.0 30.5 23.9 18.5 27.3 18.9 24.0 30.4 23.6 24.7 20.7
Fearless % 44.1 42.0 39.4 48.2 50.3 42.0 39.0 44.6 49.6 43.3 43.0 41.8
Empathetic % 16.2 12.3 16.4 16.6 20.8 19.9 10.9 13.9 21.1 16.2 17.6 13.7
Helpful % 31.2 35.5 34.8 31.3 33.5 29.3 23.1 26.7 39.1 28.3 32.5 29.9
Passive % 13.8 11.0 11.4 14.1 21.0 14.2 14.0 14.0 14.8 11.9 19.6 10.5
Quiet % 12.1 12.8 11.9 11.4 11.5 17.6 9.3 7.4 12.6 13.8 18.2 9.3
Timid % 10.5 7.6 9.9 11.2 11.7 11.9 8.9 9.1 9.6 11.8 12.8 9.5
Gentle % 19.4 14.9 15.0 20.4 23.9 28.4 15.6 15.0 20.1 24.2 21.7 17.2
Unsure % 11.0 5.7 9.5 10.8 13.9 13.5 12.9 12.7 10.7 15.9 9.3 8.4
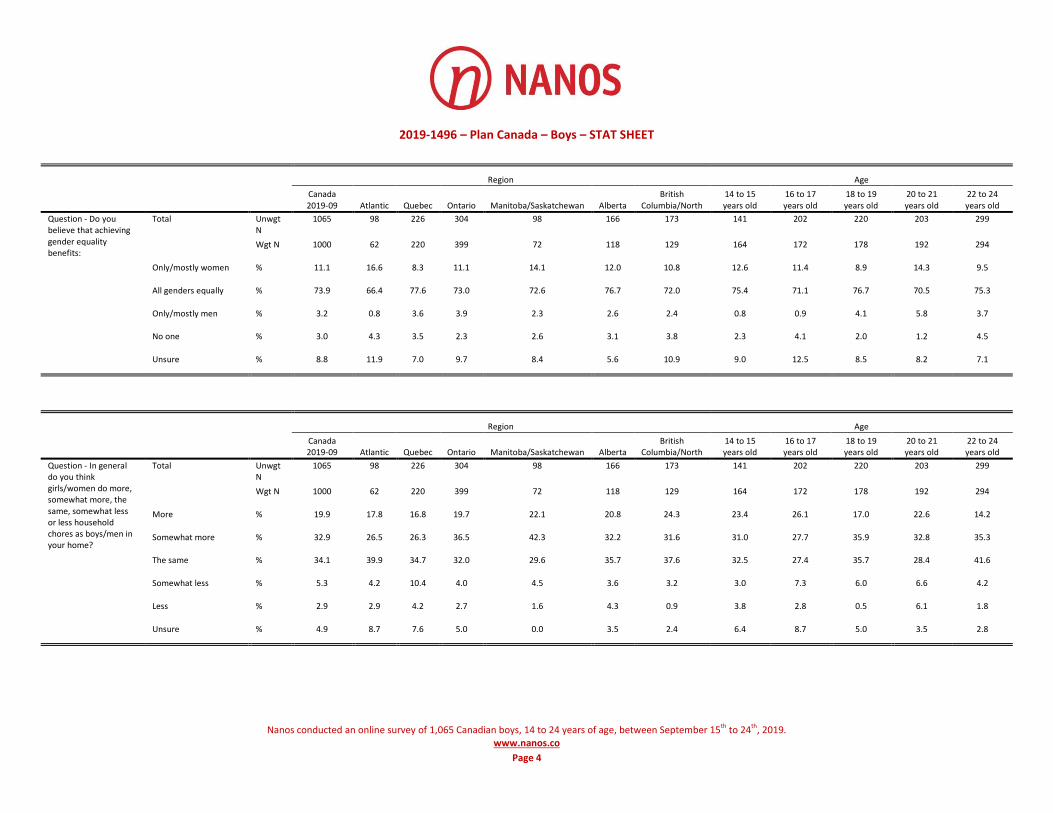
2019-1496 – Plan Canada – Boys – STAT SHEET
Nanos conducted an online survey of 1,065 Canadian boys, 14 to 24 years of age, between September 15th to 24th, 2019.
www.nanos.co
Page 4
Region Age
Canada 2019-09 Atlantic Quebec Ontario Manitoba/Saskatchewan Alberta
British Columbia/North
14 to 15 years old
16 to 17 years old
18 to 19 years old
20 to 21 years old
22 to 24 years old
Question - Do you believe that achieving gender equality benefits:
Total Unwgt N
1065 98 226 304 98 166 173 141 202 220 203 299
Wgt N 1000 62 220 399 72 118 129 164 172 178 192 294
Only/mostly women % 11.1 16.6 8.3 11.1 14.1 12.0 10.8 12.6 11.4 8.9 14.3 9.5
All genders equally % 73.9 66.4 77.6 73.0 72.6 76.7 72.0 75.4 71.1 76.7 70.5 75.3
Only/mostly men % 3.2 0.8 3.6 3.9 2.3 2.6 2.4 0.8 0.9 4.1 5.8 3.7
No one % 3.0 4.3 3.5 2.3 2.6 3.1 3.8 2.3 4.1 2.0 1.2 4.5
Unsure % 8.8 11.9 7.0 9.7 8.4 5.6 10.9 9.0 12.5 8.5 8.2 7.1
Region Age
Canada 2019-09 Atlantic Quebec Ontario Manitoba/Saskatchewan Alberta
British Columbia/North
14 to 15 years old
16 to 17 years old
18 to 19 years old
20 to 21 years old
22 to 24 years old
Question - In general do you think girls/women do more, somewhat more, the same, somewhat less or less household chores as boys/men in your home?
Total Unwgt N
1065 98 226 304 98 166 173 141 202 220 203 299
Wgt N 1000 62 220 399 72 118 129 164 172 178 192 294
More % 19.9 17.8 16.8 19.7 22.1 20.8 24.3 23.4 26.1 17.0 22.6 14.2
Somewhat more % 32.9 26.5 26.3 36.5 42.3 32.2 31.6 31.0 27.7 35.9 32.8 35.3
The same % 34.1 39.9 34.7 32.0 29.6 35.7 37.6 32.5 27.4 35.7 28.4 41.6
Somewhat less % 5.3 4.2 10.4 4.0 4.5 3.6 3.2 3.0 7.3 6.0 6.6 4.2
Less % 2.9 2.9 4.2 2.7 1.6 4.3 0.9 3.8 2.8 0.5 6.1 1.8
Unsure % 4.9 8.7 7.6 5.0 0.0 3.5 2.4 6.4 8.7 5.0 3.5 2.8

2019-1496 – Plan Canada – Boys – STAT SHEET
Nanos conducted an online survey of 1,065 Canadian boys, 14 to 24 years of age, between September 15th to 24th, 2019.
www.nanos.co
Page 5
Region Age
Canada 2019-09 Atlantic Quebec Ontario Manitoba/Saskatchewan Alberta
British Columbia/North
14 to 15 years old
16 to 17 years old
18 to 19 years old
20 to 21 years old
22 to 24 years old
Question - Do you regularly, occasionally or never feel pressure to change how you act in order to achieve your leadership aspirations?
Total Unwgt N
1065 98 226 304 98 166 173 141 202 220 203 299
Wgt N 1000 62 220 399 72 118 129 164 172 178 192 294
Regularly % 16.3 14.6 17.1 16.4 15.4 17.8 15.0 10.7 21.0 18.7 19.5 13.3
Occasionally % 53.7 55.4 51.3 52.8 54.3 54.2 58.6 48.4 48.1 56.6 49.9 60.5
Never % 20.8 20.9 21.3 22.3 15.8 18.3 20.2 22.9 16.7 16.4 26.1 21.2
Unsure % 9.2 9.0 10.4 8.5 14.5 9.6 6.2 18.0 14.1 8.3 4.5 5.0
Do you agree, somewhat agree, somewhat disagree or disagree with the following statements [RANDOMIZE]
Region Age
Canada 2019-09 Atlantic Quebec Ontario Manitoba/Saskatchewan Alberta
British Columbia/North
14 to 15 years old
16 to 17 years old
18 to 19 years old
20 to 21 years old
22 to 24 years old
Question - People thought of me as smart growing up
Total Unwgt N
1065 98 226 304 98 166 173 141 202 220 203 299
Wgt N 1000 62 220 399 72 118 129 164 172 178 192 294
Agree % 42.3 48.6 44.1 43.0 38.5 42.1 36.0 47.0 45.0 41.8 38.2 40.9
Somewhat agree % 34.3 34.3 32.0 34.0 39.5 32.9 37.2 28.8 28.2 34.9 38.2 37.8
Somewhat disagree % 10.9 2.3 10.7 10.7 10.3 12.5 15.1 8.8 10.7 11.7 10.6 12.0
Disagree % 6.7 4.2 7.7 7.2 4.4 8.3 4.3 7.2 6.7 6.7 8.9 5.0
Unsure % 5.9 10.6 5.5 5.1 7.3 4.2 7.3 8.2 9.5 4.9 4.1 4.2

2019-1496 – Plan Canada – Boys – STAT SHEET
Nanos conducted an online survey of 1,065 Canadian boys, 14 to 24 years of age, between September 15th to 24th, 2019.
www.nanos.co
Page 6
Do you agree, somewhat agree, somewhat disagree or disagree with the following statements [RANDOMIZE]
Region Age
Canada 2019-09 Atlantic Quebec Ontario Manitoba/Saskatchewan Alberta
British Columbia/North
14 to 15 years old
16 to 17 years old
18 to 19 years old
20 to 21 years old
22 to 24 years old
Question - Girls and women have the natural abilities required to be good leaders
Total Unwgt N
1065 98 226 304 98 166 173 141 202 220 203 299
Wgt N 1000 62 220 399 72 118 129 164 172 178 192 294
Agree % 39.5 44.9 37.1 41.6 38.8 38.6 35.4 41.3 36.9 36.9 42.1 39.8
Somewhat agree % 36.2 33.4 30.8 38.8 38.9 37.9 35.1 35.0 36.2 37.8 32.0 38.5
Somewhat disagree % 10.7 14.9 14.1 7.6 12.1 9.2 13.4 9.0 8.2 12.3 11.9 11.5
Disagree % 6.7 1.2 8.6 5.6 4.7 9.0 8.5 3.2 8.8 7.2 6.8 7.0
Unsure % 7.0 5.6 9.4 6.4 5.5 5.3 7.5 11.6 9.9 5.8 7.2 3.2
Do you agree, somewhat agree, somewhat disagree or disagree with the following statements [RANDOMIZE]
Region Age
Canada 2019-09 Atlantic Quebec Ontario Manitoba/Saskatchewan Alberta
British Columbia/North
14 to 15 years old
16 to 17 years old
18 to 19 years old
20 to 21 years old
22 to 24 years old
Question - My opinions are/were valued when I was in school
Total Unwgt N
1065 98 226 304 98 166 173 141 202 220 203 299
Wgt N 1000 62 220 399 72 118 129 164 172 178 192 294
Agree % 29.7 32.0 29.7 30.4 28.9 32.9 23.9 35.5 28.0 33.6 23.9 28.9
Somewhat agree % 40.5 38.4 33.0 42.0 45.0 45.6 42.3 39.3 39.8 35.0 42.4 43.6
Somewhat disagree % 14.5 9.3 16.0 13.8 10.7 11.7 20.8 7.9 12.2 15.1 20.2 15.3
Disagree % 9.5 18.8 12.1 7.1 11.6 6.3 9.5 10.0 9.6 10.1 9.1 8.9
Unsure % 5.9 1.5 9.2 6.7 3.9 3.5 3.5 7.3 10.4 6.2 4.4 3.3

2019-1496 – Plan Canada – Boys – STAT SHEET
Nanos conducted an online survey of 1,065 Canadian boys, 14 to 24 years of age, between September 15th to 24th, 2019.
www.nanos.co
Page 7
Do you agree, somewhat agree, somewhat disagree or disagree with the following statements [RANDOMIZE]
Region Age
Canada 2019-09 Atlantic Quebec Ontario Manitoba/Saskatchewan Alberta
British Columbia/North
14 to 15 years old
16 to 17 years old
18 to 19 years old
20 to 21 years old
22 to 24 years old
Question - Boys and men have the natural abilities required to be good leaders
Total Unwgt N
1065 98 226 304 98 166 173 141 202 220 203 299
Wgt N 1000 62 220 399 72 118 129 164 172 178 192 294
Agree % 38.3 47.6 40.6 36.9 35.8 39.5 34.5 36.3 38.0 37.0 41.7 38.1
Somewhat agree % 37.8 33.2 27.4 41.4 46.2 39.3 40.4 34.9 36.1 38.9 34.7 41.6
Somewhat disagree % 11.1 9.3 16.5 8.8 8.5 10.4 12.1 13.6 10.9 9.1 10.7 11.4
Disagree % 6.6 1.2 7.3 7.1 5.0 7.5 6.5 6.3 6.2 8.7 7.9 4.8
Unsure % 6.2 8.7 8.2 5.9 4.5 3.3 6.5 8.8 8.8 6.3 4.9 4.1
Do you agree, somewhat agree, somewhat disagree or disagree with the following statements [RANDOMIZE]
Region Age
Canada 2019-09 Atlantic Quebec Ontario Manitoba/Saskatchewan Alberta
British Columbia/North
14 to 15 years old
16 to 17 years old
18 to 19 years old
20 to 21 years old
22 to 24 years old
Question - My gender holds back my ability to be a leader
Total Unwgt N
1065 98 226 304 98 166 173 141 202 220 203 299
Wgt N 1000 62 220 399 72 118 129 164 172 178 192 294
Agree % 8.6 6.1 9.2 10.4 12.4 5.7 4.2 9.6 9.5 6.9 6.8 9.8
Somewhat agree % 11.6 17.2 9.1 11.7 8.0 12.8 14.0 8.1 9.8 11.9 14.2 12.9
Somewhat disagree % 15.2 7.7 15.9 13.6 13.9 14.4 23.6 18.4 9.3 12.0 16.8 17.6
Disagree % 57.9 66.0 55.5 58.5 59.4 61.0 52.7 51.2 61.4 64.5 59.7 54.5
Unsure % 6.7 2.9 10.4 5.8 6.2 6.0 5.5 12.6 10.0 4.8 2.4 5.3

2019-1496 – Plan Canada – Boys – STAT SHEET
Nanos conducted an online survey of 1,065 Canadian boys, 14 to 24 years of age, between September 15th to 24th, 2019.
www.nanos.co
Page 8
Region Age
Canada 2019-09 Atlantic Quebec Ontario Manitoba/Saskatchewan Alberta
British Columbia/North
14 to 15 years old
16 to 17 years old
18 to 19 years old
20 to 21 years old
22 to 24 years old
Question - In general, are you confident, somewhat confident, somewhat not confident or not confident in your leadership abilities?
Total Unwgt N
1065 98 226 304 98 166 173 141 202 220 203 299
Wgt N 1000 62 220 399 72 118 129 164 172 178 192 294
Confident % 34.0 45.3 34.6 33.1 28.2 31.7 35.3 30.9 35.4 35.8 35.2 32.9
Somewhat confident % 41.7 41.6 38.4 41.9 52.0 41.9 41.2 45.0 40.0 38.8 37.6 45.5
Somewhat not confident
% 14.7 8.7 12.8 15.6 14.9 15.7 17.0 12.7 13.1 16.0 16.2 15.0
Not confident % 5.0 4.4 6.3 4.7 2.3 7.4 3.4 4.4 4.6 4.3 8.6 3.7
Unsure % 4.6 0.0 7.8 4.8 2.6 3.3 3.0 7.1 6.8 5.2 2.4 2.9

2019-1496 – Plan Canada – Boys – STAT SHEET
Nanos conducted an online survey of 1,065 Canadian boys, 14 to 24 years of age, between September 15th to 24th, 2019.
www.nanos.co
Page 9
Where do you feel that you had/have opportunities to become a leader? Please rank the following where 1 is the place where you had the best opportunities to become a leader, 2 the second best place to become a leader and so on.
Region Age
Canada 2019-09 Atlantic Quebec Ontario Manitoba/Saskatchewan Alberta
British Columbia/North
14 to 15 years old
16 to 17 years old
18 to 19 years old
20 to 21 years old
22 to 24 years old
Question - Rank 1 Total Unwgt N
1003 96 207 286 90 157 167 135 193 201 189 285
Wgt N 940 61 201 375 68 112 123 155 164 163 180 277
Family % 15.7 13.5 18.4 16.3 21.3 10.1 13.0 12.0 14.7 18.8 13.3 18.3
In a workplace % 12.5 15.2 11.5 11.0 14.2 14.8 14.1 6.0 8.2 13.1 12.2 18.4
Educational institutions
% 10.3 12.8 5.3 11.4 10.0 11.3 12.8 12.1 16.6 11.5 9.4 5.4
Clubs and Community Groups
% 7.3 9.4 7.2 9.0 1.4 5.2 6.7 6.1 5.7 7.1 6.2 9.8
Within peer groups % 15.0 21.9 11.6 15.2 14.8 19.9 12.3 18.9 19.4 13.0 13.9 12.1
Sports and Activities % 17.9 10.7 21.7 16.7 14.7 18.9 19.8 24.5 15.4 18.7 19.1 14.5
Volunteerism and activism
% 7.5 5.8 8.1 7.6 4.8 8.9 7.6 6.5 4.6 8.5 8.3 8.8
Other (specify below) % 1.2 1.5 0.5 1.2 2.1 1.0 2.4 2.0 0.5 1.1 0.3 1.9
Unsure % 7.0 2.5 8.2 7.6 9.3 6.2 5.0 6.3 10.9 4.1 9.9 5.0
I have had no opportunities to become a leader
% 5.5 6.8 7.6 4.1 7.5 3.7 6.3 5.7 4.1 4.0 7.4 5.8

2019-1496 – Plan Canada – Boys – STAT SHEET
Nanos conducted an online survey of 1,065 Canadian boys, 14 to 24 years of age, between September 15th to 24th, 2019.
www.nanos.co
Page 10
Where do you feel that you had/have opportunities to become a leader? Please rank the following where 1 is the place where you had the best opportunities to become a leader, 2 the second best place to become a leader and so on.
Region Age
Canada 2019-09 Atlantic Quebec Ontario Manitoba/Saskatchewan Alberta
British Columbia/North
14 to 15 years old
16 to 17 years old
18 to 19 years old
20 to 21 years old
22 to 24 years old
Question - Rank 2 Total Unwgt N
927 88 186 264 82 149 158 121 173 189 174 270
Wgt N 865 56 179 346 59 107 118 141 145 154 162 263
Family % 15.3 16.2 17.9 15.6 11.0 14.6 12.8 15.5 12.4 17.1 18.1 14.0
In a workplace % 11.5 14.2 16.0 7.4 15.9 13.6 11.6 6.8 11.4 10.9 6.3 17.7
Educational institutions
% 13.3 17.2 12.5 13.9 13.3 14.9 9.7 14.6 12.9 14.2 12.5 12.8
Clubs and Community Groups
% 8.9 7.0 4.4 11.7 9.9 5.4 10.7 5.5 12.9 10.0 9.7 7.3
Within peer groups % 16.4 16.0 12.3 19.3 19.8 14.4 14.9 22.4 15.1 15.3 14.4 16.0
Sports and Activities % 15.6 7.3 20.3 13.7 18.0 18.1 14.9 16.1 15.6 13.9 15.5 16.5
Volunteerism and activism
% 10.5 12.4 7.7 12.2 5.0 9.0 13.0 10.8 12.4 10.8 13.5 7.3
Other (specify below) % 2.3 6.2 2.2 2.0 0.0 1.8 2.9 2.1 1.8 1.5 4.8 1.6
Unsure % 2.3 1.0 2.7 2.3 2.0 2.5 2.3 0.9 3.8 2.7 1.6 2.4
I have had no opportunities to become a leader
% 3.8 2.5 4.0 2.0 5.3 5.6 7.3 5.4 1.9 3.5 3.7 4.3

2019-1496 – Plan Canada – Boys – STAT SHEET
Nanos conducted an online survey of 1,065 Canadian boys, 14 to 24 years of age, between September 15th to 24th, 2019.
www.nanos.co
Page 11
Where do you feel that you had/have opportunities to become a leader? Please rank the following where 1 is the place where you had the best opportunities to become a leader, 2 the second best place to become a leader and so on.
Region Age
Canada 2019-09 Atlantic Quebec Ontario Manitoba/Saskatchewan Alberta
British Columbia/North
14 to 15 years old
16 to 17 years old
18 to 19 years old
20 to 21 years old
22 to 24 years old
Question - Rank 3 Total Unwgt N
818 69 156 232 78 136 147 108 157 169 154 230
Wgt N 759 43 151 303 57 96 110 127 131 136 142 222
Family % 14.1 12.9 14.2 11.7 17.5 16.5 17.1 16.5 14.0 11.1 15.6 13.7
In a workplace % 13.0 8.2 17.2 14.4 10.6 10.4 8.7 13.3 10.9 10.3 17.1 13.0
Educational institutions
% 12.9 18.4 15.0 11.1 17.5 13.6 9.9 13.9 14.7 15.8 5.8 14.0
Clubs and Community Groups
% 11.8 11.3 7.8 12.0 11.7 14.7 14.2 10.3 9.8 15.3 12.0 11.4
Within peer groups % 15.1 16.3 13.6 13.9 18.7 16.0 17.4 14.4 19.3 13.3 14.5 14.6
Sports and Activities % 11.9 14.6 12.2 11.2 4.5 13.5 14.9 7.0 17.8 14.9 12.0 9.4
Volunteerism and activism
% 12.8 14.7 11.5 16.1 10.9 7.9 9.7 17.8 8.8 13.3 13.5 11.5
Other (specify below) % 3.0 2.1 4.3 3.2 3.3 1.7 1.8 1.0 2.5 2.1 5.9 3.1
Unsure % 2.2 0.7 1.8 1.8 0.8 2.8 4.7 1.6 1.8 1.1 1.5 4.0
I have had no opportunities to become a leader
% 3.2 0.8 2.3 4.6 4.4 2.8 1.6 4.2 0.4 3.0 2.1 5.3

2019-1496 – Plan Canada – Boys – STAT SHEET
Nanos conducted an online survey of 1,065 Canadian boys, 14 to 24 years of age, between September 15th to 24th, 2019.
www.nanos.co
Page 12
Where do you feel that you had/have opportunities to become a leader? Please rank the following where 1 is the place where you had the best opportunities to become a leader, 2 the second best place to become a leader and so on.
Region Age
Canada 2019-09 Atlantic Quebec Ontario Manitoba/Saskatchewan Alberta
British Columbia/North
14 to 15 years old
16 to 17 years old
18 to 19 years old
20 to 21 years old
22 to 24 years old
Question - Rank 4 Total Unwgt N
707 60 125 211 69 119 123 96 137 148 131 195
Wgt N 663 38 121 276 51 84 92 111 117 119 123 192
Family % 13.9 14.3 14.0 12.6 17.2 18.6 11.5 15.2 15.5 13.8 13.5 12.7
In a workplace % 14.1 14.3 16.7 13.0 8.6 11.5 19.0 14.7 12.7 14.2 15.9 13.2
Educational institutions
% 12.4 12.3 13.6 10.6 12.6 16.8 12.4 11.1 14.7 10.2 13.2 12.7
Clubs and Community Groups
% 13.4 14.7 13.3 13.3 14.7 11.2 14.7 19.7 11.2 12.5 9.3 14.4
Within peer groups % 14.8 8.0 9.7 18.0 14.8 17.9 12.3 9.4 19.2 12.3 10.6 19.5
Sports and Activities % 13.4 16.0 11.3 13.4 16.3 15.1 12.1 11.3 11.6 16.2 17.8 11.4
Volunteerism and activism
% 11.0 9.2 9.6 13.7 9.3 6.7 10.8 15.2 10.4 11.9 10.9 8.5
Other (specify below) % 1.3 3.2 0.6 1.5 3.2 1.5 0.0 0.0 0.0 2.0 1.0 2.7
Unsure % 2.2 5.2 4.0 1.6 1.2 0.8 2.4 0.0 2.9 1.4 3.9 2.5
I have had no opportunities to become a leader
% 3.3 2.6 7.2 2.3 2.3 0.0 4.7 3.3 1.8 5.5 3.7 2.4

2019-1496 – Plan Canada – Boys – STAT SHEET
Nanos conducted an online survey of 1,065 Canadian boys, 14 to 24 years of age, between September 15th to 24th, 2019.
www.nanos.co
Page 13
Where do you feel that you had/have opportunities to become a leader? Please rank the following where 1 is the place where you had the best opportunities to become a leader, 2 the second best place to become a leader and so on.
Region Age
Canada 2019-09 Atlantic Quebec Ontario Manitoba/Saskatchewan Alberta
British Columbia/North
14 to 15 years old
16 to 17 years old
18 to 19 years old
20 to 21 years old
22 to 24 years old
Question - Rank 5 Total Unwgt N
591 49 100 179 59 106 98 76 120 123 108 164
Wgt N 557 32 96 234 45 76 74 89 104 100 100 164
Family % 12.5 15.5 12.7 13.8 12.1 10.4 9.2 15.0 12.5 9.1 12.4 13.2
In a workplace % 13.2 9.3 10.8 14.0 14.2 12.9 15.1 11.8 8.1 16.5 13.2 15.1
Educational institutions
% 13.6 23.0 14.1 14.3 8.0 12.0 11.5 16.8 9.9 15.8 12.8 13.2
Clubs and Community Groups
% 13.7 18.1 15.6 11.7 10.4 19.1 12.4 15.4 17.3 11.2 12.3 13.0
Within peer groups % 11.0 7.2 11.5 9.2 7.4 11.9 19.0 9.0 14.7 12.2 11.5 8.6
Sports and Activities % 12.6 6.3 11.4 16.6 12.4 9.1 7.8 11.3 16.3 12.7 8.2 13.5
Volunteerism and activism
% 13.8 10.1 14.3 10.1 27.7 17.2 14.7 12.4 14.4 14.9 13.7 13.7
Other (specify below) % 2.2 0.0 2.3 2.0 0.0 1.9 5.5 3.5 1.5 2.2 2.8 1.6
Unsure % 3.4 0.3 4.4 3.6 3.3 4.3 2.0 1.7 1.2 2.7 5.1 5.2
I have had no opportunities to become a leader
% 4.0 10.2 2.9 4.8 4.5 1.2 2.8 3.0 4.0 2.6 8.0 3.0

2019-1496 – Plan Canada – Boys – STAT SHEET
Nanos conducted an online survey of 1,065 Canadian boys, 14 to 24 years of age, between September 15th to 24th, 2019.
www.nanos.co
Page 14
Where do you feel that you had/have opportunities to become a leader? Please rank the following where 1 is the place where you had the best opportunities to become a leader, 2 the second best place to become a leader and so on.
Region Age
Canada 2019-09 Atlantic Quebec Ontario Manitoba/Saskatchewan Alberta
British Columbia/North
14 to 15 years old
16 to 17 years old
18 to 19 years old
20 to 21 years old
22 to 24 years old
Question - Rank 6 Total Unwgt N
498 43 82 151 47 87 88 59 99 102 93 145
Wgt N 470 30 79 198 35 61 67 70 85 83 88 145
Family % 11.9 10.2 11.0 13.9 7.3 7.7 14.0 16.1 11.4 13.8 7.8 11.6
In a workplace % 12.8 2.0 14.7 13.9 8.7 18.2 9.0 13.4 15.2 15.6 13.2 9.1
Educational institutions
% 11.5 14.4 8.7 11.4 17.7 11.3 10.4 13.1 14.9 5.9 13.1 10.8
Clubs and Community Groups
% 18.3 25.0 16.9 19.9 12.5 17.3 16.7 16.7 17.3 18.3 21.7 17.7
Within peer groups % 11.7 15.3 16.9 8.3 14.1 11.9 12.3 11.1 5.6 18.5 13.6 10.4
Sports and Activities % 11.6 4.7 8.2 12.2 21.7 12.8 10.4 7.6 8.5 6.9 13.5 16.8
Volunteerism and activism
% 13.2 16.0 5.3 14.9 16.3 14.7 13.4 15.6 18.2 12.2 4.1 15.2
Other (specify below) % 2.0 2.0 3.8 1.3 0.0 1.6 3.3 1.8 2.5 0.8 1.7 2.7
Unsure % 2.9 8.6 5.9 1.4 0.0 0.0 5.4 2.8 3.7 0.9 6.0 1.6
I have had no opportunities to become a leader
% 4.2 2.0 8.5 2.8 1.8 4.5 5.3 1.8 2.8 7.1 5.3 3.9

2019-1496 – Plan Canada – Boys – STAT SHEET
Nanos conducted an online survey of 1,065 Canadian boys, 14 to 24 years of age, between September 15th to 24th, 2019.
www.nanos.co
Page 15
Where do you feel that you had/have opportunities to become a leader? Please rank the following where 1 is the place where you had the best opportunities to become a leader, 2 the second best place to become a leader and so on.
Region Age
Canada 2019-09 Atlantic Quebec Ontario Manitoba/Saskatchewan Alberta
British Columbia/North
14 to 15 years old
16 to 17 years old
18 to 19 years old
20 to 21 years old
22 to 24 years old
Question - Rank 7 Total Unwgt N
416 36 63 131 42 73 71 48 77 86 82 123
Wgt N 394 25 60 172 32 51 53 55 68 70 77 124
Family % 12.9 11.9 11.9 14.7 8.3 15.9 8.9 13.9 19.7 12.8 11.0 10.1
In a workplace % 16.4 23.3 9.1 18.5 17.7 11.1 19.2 18.3 24.9 14.7 15.5 12.5
Educational institutions
% 13.2 7.4 10.3 16.6 9.2 12.6 11.2 13.7 3.8 17.5 17.2 13.2
Clubs and Community Groups
% 9.6 5.2 4.4 7.5 19.8 14.1 13.8 10.5 9.0 7.0 5.7 13.5
Within peer groups % 6.6 7.7 8.5 9.0 0.0 5.2 1.3 4.7 5.2 7.4 7.1 7.3
Sports and Activities % 11.1 12.2 16.2 10.5 6.6 10.3 10.3 15.0 6.1 16.1 6.4 12.2
Volunteerism and activism
% 16.5 17.7 23.9 13.1 15.9 21.7 13.6 7.1 20.8 16.7 18.0 17.1
Other (specify below) % 4.4 3.5 6.3 3.9 8.1 3.8 2.3 7.2 2.3 2.0 5.5 4.9
Unsure % 3.7 8.6 8.2 1.5 7.5 0.0 4.6 4.1 4.3 2.3 6.0 2.5
I have had no opportunities to become a leader
% 5.6 2.4 1.3 4.7 6.9 5.3 14.8 5.5 4.0 3.6 7.5 6.6

2019-1496 – Plan Canada – Boys – STAT SHEET
Nanos conducted an online survey of 1,065 Canadian boys, 14 to 24 years of age, between September 15th to 24th, 2019.
www.nanos.co
Page 16
Where do you feel that you had/have opportunities to become a leader? Please rank the following where 1 is the place where you had the best opportunities to become a leader, 2 the second best place to become a leader and so on.
Region Age
Canada 2019-09 Atlantic Quebec Ontario Manitoba/Saskatchewan Alberta
British Columbia/North
14 to 15 years old
16 to 17 years old
18 to 19 years old
20 to 21 years old
22 to 24 years old
Question - Rank 8 Total Unwgt N
244 19 46 69 27 36 47 31 45 47 54 67
Wgt N 226 13 44 90 19 26 34 33 40 39 50 65
Family % 6.4 0.0 4.3 8.3 0.0 10.6 6.6 11.8 2.6 12.4 4.4 3.9
In a workplace % 7.2 5.9 6.3 8.0 5.7 11.4 4.6 3.4 9.7 10.5 5.3 7.1
Educational institutions
% 8.2 2.3 10.6 4.7 8.7 8.3 16.5 0.9 8.4 7.1 8.7 12.1
Clubs and Community Groups
% 9.4 6.8 10.0 7.2 11.1 15.5 10.3 4.2 12.3 8.1 17.7 4.8
Within peer groups % 8.2 18.5 17.8 2.7 11.7 4.3 7.2 7.9 0.0 6.2 8.2 14.4
Sports and Activities % 10.8 20.7 10.6 9.1 18.1 9.1 8.6 18.1 8.9 13.5 8.3 8.4
Volunteerism and activism
% 8.5 4.5 4.1 11.2 8.2 3.9 12.1 4.1 6.7 1.8 14.0 11.6
Other (specify below) % 11.7 16.4 6.4 15.1 15.2 6.0 9.9 18.1 6.0 21.4 5.4 11.0
Unsure % 11.1 9.7 16.6 8.8 8.7 11.3 12.0 7.4 14.1 10.0 9.3 13.4
I have had no opportunities to become a leader
% 18.5 15.3 13.2 24.8 12.7 19.5 12.1 24.1 31.4 9.0 18.7 13.2

2019-1496 – Plan Canada – Boys – STAT SHEET
Nanos conducted an online survey of 1,065 Canadian boys, 14 to 24 years of age, between September 15th to 24th, 2019.
www.nanos.co
Page 17
Where do you feel that you had/have opportunities to become a leader? Please rank the following where 1 is the place where you had the best opportunities to become a leader, 2 the second best place to become a leader and so on.
Region Age
Canada 2019-09 Atlantic Quebec Ontario Manitoba/Saskatchewan Alberta
British Columbia/North
14 to 15 years old
16 to 17 years old
18 to 19 years old
20 to 21 years old
22 to 24 years old
Question - Rank 9 Total Unwgt N
209 17 41 60 22 29 40 29 38 39 47 56
Wgt N 193 11 39 79 16 21 28 31 33 32 41 56
Family % 5.1 18.9 6.7 1.8 4.0 7.9 5.6 0.0 0.0 4.7 10.0 7.6
In a workplace % 4.5 20.0 9.6 1.6 3.0 4.8 0.0 2.5 6.8 0.0 6.7 5.0
Educational institutions
% 4.1 0.0 2.2 1.7 10.5 4.8 10.8 7.4 0.0 0.0 6.8 5.1
Clubs and Community Groups
% 9.0 5.6 11.4 7.4 3.0 10.9 13.3 7.0 5.2 9.6 6.4 13.9
Within peer groups % 8.1 0.0 11.0 8.6 0.0 7.9 10.4 11.8 0.0 7.9 9.2 10.2
Sports and Activities % 5.8 8.6 2.0 10.4 0.0 0.0 4.9 1.0 3.5 6.1 8.5 7.7
Volunteerism and activism
% 12.2 3.1 15.4 15.0 4.1 10.3 9.5 4.1 20.5 11.3 10.4 13.8
Other (specify below) % 9.6 7.4 5.9 10.8 22.1 9.9 5.0 12.6 15.5 15.6 8.8 1.6
Unsure % 24.2 16.3 12.9 32.9 5.8 31.2 23.6 29.6 23.6 29.1 20.6 21.6
I have had no opportunities to become a leader
% 17.3 20.1 23.0 9.6 47.5 12.2 17.0 24.0 25.0 15.7 12.7 13.5
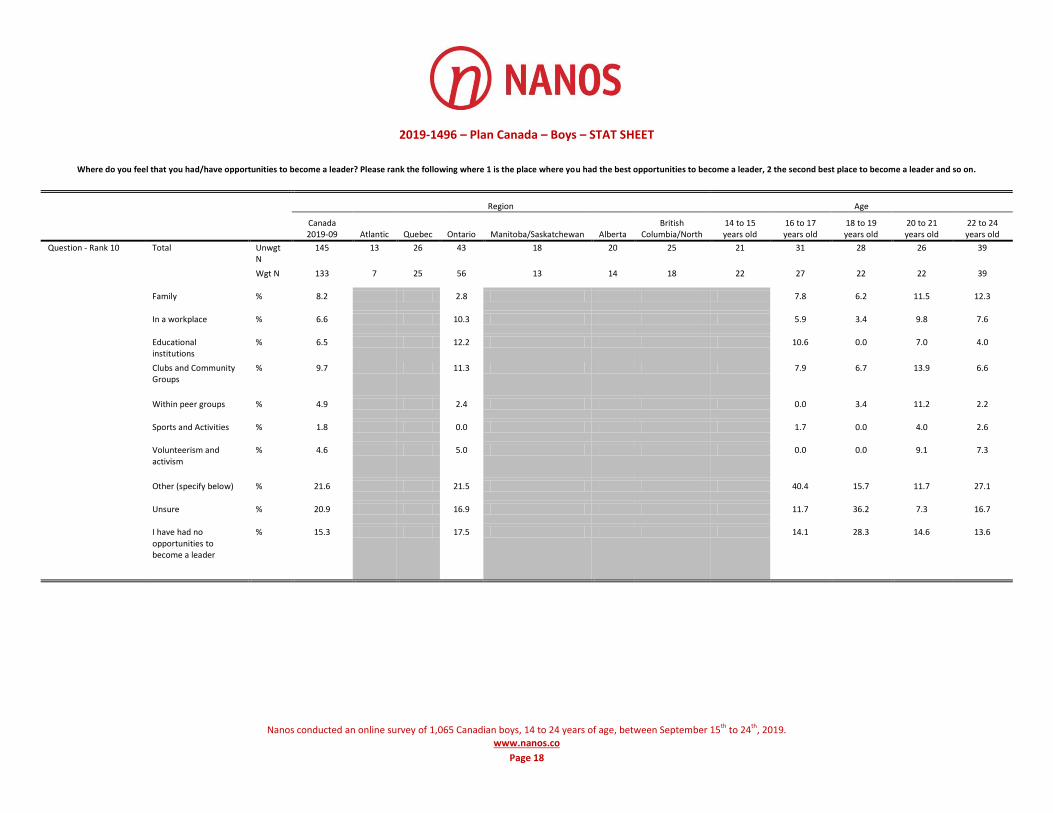
2019-1496 – Plan Canada – Boys – STAT SHEET
Nanos conducted an online survey of 1,065 Canadian boys, 14 to 24 years of age, between September 15th to 24th, 2019.
www.nanos.co
Page 18
Where do you feel that you had/have opportunities to become a leader? Please rank the following where 1 is the place where you had the best opportunities to become a leader, 2 the second best place to become a leader and so on.
Region Age
Canada 2019-09 Atlantic Quebec Ontario Manitoba/Saskatchewan Alberta
British Columbia/North
14 to 15 years old
16 to 17 years old
18 to 19 years old
20 to 21 years old
22 to 24 years old
Question - Rank 10 Total Unwgt N
145 13 26 43 18 20 25 21 31 28 26 39
Wgt N 133 7 25 56 13 14 18 22 27 22 22 39
Family % 8.2 17.3 11.7 2.8 12.5 11.9 10.8 0.0 7.8 6.2 11.5 12.3
In a workplace % 6.6 0.0 7.7 10.3 0.0 3.5 3.5 5.8 5.9 3.4 9.8 7.6
Educational institutions
% 6.5 0.0 4.1 12.2 0.0 0.0 4.2 12.2 10.6 0.0 7.0 4.0
Clubs and Community Groups
% 9.7 0.0 11.4 11.3 4.8 15.3 5.0 16.3 7.9 6.7 13.9 6.6
Within peer groups % 4.9 20.0 3.1 2.4 3.6 0.0 13.7 11.0 0.0 3.4 11.2 2.2
Sports and Activities % 1.8 14.3 3.5 0.0 0.0 3.5 0.0 0.0 1.7 0.0 4.0 2.6
Volunteerism and activism
% 4.6 0.0 4.0 5.0 3.6 7.4 5.0 5.8 0.0 0.0 9.1 7.3
Other (specify below) % 21.6 21.2 22.5 21.5 16.8 10.9 32.1 3.6 40.4 15.7 11.7 27.1
Unsure % 20.9 18.1 12.8 16.9 41.6 32.5 21.7 38.1 11.7 36.2 7.3 16.7
I have had no opportunities to become a leader
% 15.3 9.2 19.2 17.5 17.1 15.1 4.1 7.2 14.1 28.3 14.6 13.6

2019-1496 – Plan Canada – Boys – STAT SHEET
Nanos conducted an online survey of 1,065 Canadian boys, 14 to 24 years of age, between September 15th to 24th, 2019.
www.nanos.co
Page 19
Region Age
Canada 2019-09 Atlantic Quebec Ontario Manitoba/Saskatchewan Alberta
British Columbia/North
14 to 15 years old
16 to 17 years old
18 to 19 years old
20 to 21 years old
22 to 24 years old
Question - Do you regularly, occasionally or never doubt that you have what it takes to be a good leader?
Total Unwgt N
1065 98 226 304 98 166 173 141 202 220 203 299
Wgt N 1000 62 220 399 72 118 129 164 172 178 192 294
Regularly % 20.6 11.7 25.3 22.0 22.0 17.5 14.6 19.5 20.2 19.4 25.8 18.8
Occasionally % 55.7 56.1 45.7 56.8 51.3 63.0 65.0 56.5 50.2 54.6 55.4 59.3
Never % 17.7 26.1 21.2 15.7 19.6 14.6 15.3 16.0 22.4 19.4 15.8 16.0
Unsure % 6.1 6.1 7.8 5.6 7.1 5.0 5.1 8.0 7.3 6.6 3.1 5.9

2019-1496 – Plan Canada – Boys – STAT SHEET
Nanos conducted an online survey of 1,065 Canadian boys, 14 to 24 years of age, between September 15th to 24th, 2019.
www.nanos.co
Page 20
Region Age
Canada 2019-09 Atlantic Quebec Ontario Manitoba/Saskatchewan Alberta
British Columbia/North
14 to 15 years old
16 to 17 years old
18 to 19 years old
20 to 21 years old
22 to 24 years old
Question - What tools do you think you need to achieve your leadership goals? (choose all that apply)
Total Unwgt N
3036 286 547 908 315 488 492 381 549 648 602 856
Wgt N 2831 182 530 1186 218 353 362 442 453 525 575 836
[Education] % 22.7 24.6 23.0 21.7 25.0 24.1 22.0 24.3 25.4 21.1 23.0 21.2
[A mentor ] % 14.4 14.3 12.9 14.3 15.8 14.3 15.8 10.2 13.2 14.3 12.2 18.7
[Family support] % 17.8 17.3 19.3 17.9 15.2 17.4 17.6 18.2 18.5 19.0 17.7 16.6
[Community support]
% 14.4 16.4 12.7 15.7 12.5 13.0 14.0 17.4 14.2 15.0 14.4 12.5
[Access to leadership courses]
% 8.8 10.2 7.0 9.2 9.3 8.7 9.4 6.7 9.8 8.8 9.0 9.2
[Gender equality ] % 8.2 5.1 9.3 7.8 6.6 9.1 9.6 9.9 6.8 8.4 8.9 7.3
[Money] % 11.5 9.8 11.8 11.5 14.9 11.5 9.8 9.4 7.6 11.4 13.7 13.4
[Unsure] % 2.2 2.3 4.0 1.9 0.8 2.0 1.7 3.9 4.6 1.9 1.1 1.1
Region Age
Canada 2019-09 Atlantic Quebec Ontario Manitoba/Saskatchewan Alberta
British Columbia/North
14 to 15 years old
16 to 17 years old
18 to 19 years old
20 to 21 years old
22 to 24 years old
Question - Do you have access to all the tools you need to achieve your leadership goals? (choose all the tools you currently have access to)
Total Unwgt N
2912 257 562 880 242 487 484 416 577 611 525 783
Wgt N 2752 169 551 1136 181 356 359 488 482 514 498 770
[Education] % 21.3 20.1 22.1 21.0 25.5 21.6 19.4 22.3 21.6 20.8 21.6 20.8
[A mentor ] % 9.4 9.0 8.1 9.1 8.2 11.1 11.2 8.2 9.2 9.6 8.0 11.0
[Family support] % 20.6 20.3 22.2 19.8 21.8 18.2 22.5 18.4 21.8 20.4 22.0 20.5
[Community support]
% 11.6 12.6 11.6 12.2 11.7 11.5 9.2 13.0 10.1 13.1 10.9 11.1
[Access to leadership courses]
% 7.4 8.8 6.3 7.5 4.7 8.4 8.3 7.2 8.2 5.7 7.8 7.8
[Gender equality ] % 8.8 8.8 8.8 9.3 9.5 6.4 9.3 8.9 7.9 8.0 9.8 9.2
[Money] % 7.8 6.4 6.7 8.5 6.6 8.3 7.8 7.7 6.0 8.1 8.8 8.0
[I have the tools I need]
% 9.0 9.9 8.9 8.7 7.3 11.2 8.4 11.2 10.4 9.9 7.0 7.4
[Unsure] % 4.1 4.1 5.3 3.8 4.7 3.3 3.8 3.0 4.8 4.4 4.1 4.2

2019-1496 – Plan Canada – Boys – STAT SHEET
Nanos conducted an online survey of 1,065 Canadian boys, 14 to 24 years of age, between September 15th to 24th, 2019.
www.nanos.co
Page 21
Region Age
Canada 2019-09 Atlantic Quebec Ontario Manitoba/Saskatchewan Alberta
British Columbia/North
14 to 15
years old
16 to 17
years old
18 to 19
years old
20 to 21
years old
22 to 24
years old
Question - Please reflect for a moment on those in your immediate circle, excluding family who are in a position of power. This means a person who has authority or influence in your life (for example: teachers, coaches, and bosses).How many of those are women? [Open]
Total Unwgt N 1053 98 219 303 96 165 172 140 200 218 200 295
Wgt N 990 62 213 398 71 118 128 163 171 176 190 290
Mean 4.0 4.9 4.6 3.9 4.0 2.9 4.1 4.5 4.7 5.5 3.5 2.8
Median 3.0 3.0 3.0 3.0 3.0 2.0 3.0 3.0 4.0 3.0 3.0 2.0
0 % 3.5 5.9 3.6 3.0 0.7 5.5 3.9 0.8 1.4 3.0 5.8 5.3
1 % 7.8 10.1 7.0 7.7 8.4 8.8 6.9 4.7 7.5 6.2 10.4 8.8
2 % 13.0 11.5 9.9 13.3 9.6 16.0 17.0 14.4 9.0 9.4 11.1 17.9
3 % 9.7 6.3 5.0 11.9 14.2 12.4 7.5 7.6 6.2 12.5 8.3 12.2
4 % 5.9 10.7 2.7 5.3 9.4 7.3 7.6 8.3 7.1 8.7 3.6 3.6
5 % 6.0 1.5 5.8 7.3 8.9 3.0 5.4 6.3 7.1 7.1 8.4 2.8
6 % 1.8 4.3 1.1 2.1 1.3 0.8 1.9 1.1 3.0 3.2 0.7 1.3
7 % 1.3 5.5 0.4 1.5 0.0 1.4 0.7 0.2 1.8 2.2 0.0 1.8
8 % 1.1 0.9 1.3 0.6 0.8 1.3 2.1 0.8 3.3 1.5 0.5 0.0
9 % 0.4 0.0 0.4 0.3 0.9 0.0 0.5 0.0 0.0 0.4 1.5 0.0
10 % 2.7 1.1 4.4 2.7 4.0 0.4 2.0 0.7 2.9 5.3 4.7 0.8
11 % 0.1 1.0 0.0 0.0 0.0 0.0 0.0 0.0 0.0 0.0 0.0 0.2
12 % 0.8 1.1 0.9 1.4 0.0 0.0 0.0 1.7 1.7 0.0 0.0 0.9
13 % 0.3 3.6 0.0 0.0 1.3 0.0 0.0 0.0 1.3 0.0 0.5 0.0
15 % 0.3 1.9 0.4 0.0 0.0 0.6 0.0 0.0 0.2 0.5 0.4 0.3
16 % 0.1 0.0 0.0 0.0 0.7 0.0 0.0 0.0 0.3 0.0 0.0 0.0
18 % 0.2 0.0 0.0 0.3 0.0 0.5 0.0 0.8 0.0 0.3 0.0 0.0
29 % 0.1 0.0 0.0 0.0 0.0 0.0 0.6 0.0 0.4 0.0 0.0 0.0
30 % 0.1 1.4 0.0 0.0 0.0 0.0 0.0 0.5 0.0 0.0 0.0 0.0
34 % 0.1 0.0 0.6 0.0 0.0 0.0 0.0 0.7 0.0 0.0 0.0 0.0
50 % 0.1 0.0 0.4 0.0 0.0 0.0 0.0 0.0 0.0 0.4 0.0 0.0
69 % 0.2 0.0 0.0 0.3 0.0 0.0 0.5 0.0 0.0 1.0 0.0 0.0
Unsure % 44.7 33.4 56.2 42.3 39.8 42.2 43.5 51.3 46.8 38.2 44.1 44.0

2019-1496 – Plan Canada – Boys – STAT SHEET
Nanos conducted an online survey of 1,065 Canadian boys, 14 to 24 years of age, between September 15th to 24th, 2019.
www.nanos.co
Page 22
Region Age
Canada 2019-09 Atlantic Quebec Ontario Manitoba/Saskatchewan Alberta
British Columbia/North
14 to 15
years old
16 to 17
years old
18 to 19
years old
20 to 21
years old
22 to 24 years old
Question - How many of these are men? [Open]
Total Unwgt N 1034 95 222 297 96 159 165 137 193 211 200 293
Wgt N 974 60 216 390 71 114 123 160 166 171 189 288
Mean 4.8 5.0 5.8 4.7 4.8 4.3 4.4 4.2 5.5 5.4 5.0 4.4
Median 3.0 3.0 3.0 3.0 4.0 3.0 3.0 3.0 4.0 3.0 3.0 2.0
0 % 3.1 4.8 2.7 3.5 3.5 3.2 1.7 0.0 0.4 4.4 3.4 5.5
1 % 7.7 9.3 7.7 7.8 2.4 7.3 9.8 2.8 3.4 6.8 11.3 11.1
2 % 11.2 13.4 10.0 11.6 12.9 9.4 11.7 8.7 8.4 14.2 11.5 12.3
3 % 8.2 6.6 6.0 7.6 11.1 12.6 9.0 13.0 7.2 7.5 6.5 7.6
4 % 5.5 5.2 1.0 7.9 6.1 2.6 8.3 6.3 8.7 3.6 4.5 5.1
5 % 6.4 7.5 4.1 7.4 8.9 7.1 4.5 7.9 5.4 9.1 7.2 3.9
6 % 2.3 1.8 2.2 2.3 3.2 2.6 2.5 3.9 3.4 1.9 1.0 2.1
7 % 1.4 0.0 0.8 2.0 2.7 1.1 1.2 0.0 1.7 3.1 1.2 1.3
8 % 1.7 1.7 1.3 2.0 2.1 2.2 0.9 2.0 2.3 1.7 1.4 1.4
9 % 0.9 0.0 1.8 0.6 1.8 0.8 0.4 0.9 1.3 0.7 1.3 0.6
10 % 1.6 1.5 2.2 1.8 0.8 1.7 0.6 2.4 0.0 2.2 1.8 1.6
11 % 0.1 0.0 0.0 0.0 0.0 0.8 0.0 0.0 0.6 0.0 0.0 0.0
12 % 1.1 1.0 1.3 1.0 0.7 0.6 1.6 0.0 2.6 0.5 1.5 0.8
13 % 0.4 3.7 0.0 0.3 0.0 0.6 0.0 0.8 1.3 0.0 0.0 0.3
14 % 0.3 0.0 0.7 0.0 0.6 0.0 0.4 0.0 0.5 0.9 0.0 0.0
15 % 0.7 1.2 0.9 0.3 1.6 1.4 0.6 0.0 1.3 2.4 0.0 0.3
18 % 0.2 0.0 0.4 0.4 0.0 0.0 0.0 0.0 0.0 0.4 0.0 0.5
20 % 0.7 3.8 0.4 0.6 0.0 0.4 0.6 0.0 1.0 2.6 0.0 0.2
21 % 0.0 0.0 0.0 0.0 0.0 0.4 0.0 0.0 0.3 0.0 0.0 0.0
26 % 0.1 0.0 0.0 0.0 1.3 0.0 0.0 0.0 0.0 0.0 0.5 0.0
69 % 0.1 0.0 0.0 0.0 0.0 0.0 0.6 0.0 0.0 0.4 0.0 0.0
Unsure % 45.8 38.5 55.9 42.5 40.3 45.2 45.8 51.3 50.2 37.4 46.2 44.9
100 % 0.2 0.0 0.0 0.4 0.0 0.0 0.0 0.0 0.0 0.0 0.0 0.6
150 % 0.1 0.0 0.4 0.0 0.0 0.0 0.0 0.0 0.0 0.0 0.5 0.0

2019-1496 – Plan Canada – Boys – STAT SHEET
Nanos conducted an online survey of 1,065 Canadian boys, 14 to 24 years of age, between September 15th to 24th, 2019.
www.nanos.co
Page 23
Region Age
Canada 2019-09 Atlantic Quebec Ontario Manitoba/Saskatchewan Alberta
British Columbia/North
14 to 15 years old
16 to 17 years old
18 to 19 years old
20 to 21 years old
22 to 24 years old
Question - Do you have a mentor(s)? (Examples of mentors can be people you consider leaders who have provided guidance, leadership, advice, inspiration, counselling, or personal or professional insight)
Total Unwgt N
1065 98 226 304 98 166 173 141 202 220 203 299
Wgt N 1000 62 220 399 72 118 129 164 172 178 192 294
Yes % 46.0 47.4 40.4 46.2 50.8 56.2 42.6 41.9 48.2 49.2 46.7 44.7
No % 44.1 45.6 48.3 43.5 44.3 33.7 47.8 45.0 38.4 38.7 48.7 47.3
Unsure % 9.8 7.0 11.3 10.4 4.8 10.1 9.6 13.1 13.4 12.1 4.7 7.9
Region Age
Canada 2019-09 Atlantic Quebec Ontario Manitoba/Saskatchewan Alberta
British Columbia/North
14 to 15 years old
16 to 17 years old
18 to 19 years old
20 to 21 years old
22 to 24 years old
Question - If yes, what is the gender of your mentor?
Total Unwgt N
495 45 91 141 46 95 77 61 101 104 101 128
Wgt N 461 30 89 184 37 66 55 69 83 87 90 132
Male % 71.1 86.1 62.5 67.7 75.7 73.9 81.4 77.8 73.1 69.9 71.7 66.6
Female % 27.7 11.4 37.5 30.9 23.2 23.9 17.4 20.8 24.8 29.2 26.2 33.1
Other % 1.2 2.5 0.0 1.4 1.1 2.2 1.1 1.5 2.0 0.8 2.1 0.3

2019-1496 – Plan Canada – Boys – STAT SHEET
Nanos conducted an online survey of 1,065 Canadian boys, 14 to 24 years of age, between September 15th to 24th, 2019.
www.nanos.co
Page 24
Do you agree, somewhat agree, somewhat disagree or disagree with the following? [RANDOMIZE]
Region Age
Canada 2019-09 Atlantic Quebec Ontario Manitoba/Saskatchewan Alberta
British Columbia/North
14 to 15 years old
16 to 17 years old
18 to 19 years old
20 to 21 years old
22 to 24 years old
Question - I expect to be given personally challenging and interesting work early in my career/professional life
Total Unwgt N
1065 98 226 304 98 166 173 141 202 220 203 299
Wgt N 1000 62 220 399 72 118 129 164 172 178 192 294
Agree % 40.9 51.6 43.7 40.3 40.2 37.3 36.8 45.0 36.2 38.5 40.8 43.0
Somewhat agree % 39.1 34.0 31.1 41.4 43.7 42.6 42.6 31.3 40.7 36.8 45.7 39.6
Somewhat disagree % 10.2 6.4 11.4 8.9 8.2 10.4 14.9 9.7 12.2 13.4 5.7 10.2
Disagree % 3.0 4.6 4.6 3.0 2.4 2.0 0.5 1.6 1.7 4.9 4.9 2.0
Unsure % 6.8 3.4 9.2 6.4 5.5 7.7 5.2 12.4 9.1 6.4 2.8 5.2
Do you agree, somewhat agree, somewhat disagree or disagree with the following? [RANDOMIZE]
Region Age
Canada 2019-09 Atlantic Quebec Ontario Manitoba/Saskatchewan Alberta
British Columbia/North
14 to 15 years old
16 to 17 years old
18 to 19 years old
20 to 21 years old
22 to 24 years old
Question - I find women in positions of power approachable
Total Unwgt N
1065 98 226 304 98 166 173 141 202 220 203 299
Wgt N 1000 62 220 399 72 118 129 164 172 178 192 294
Agree % 37.1 55.4 28.5 37.5 39.7 43.0 35.0 38.5 35.2 36.8 40.0 35.7
Somewhat agree % 36.9 34.9 34.9 37.8 41.1 34.0 38.5 30.6 32.5 37.6 37.3 42.1
Somewhat disagree % 12.2 8.7 16.1 11.3 12.0 10.1 12.5 10.0 15.3 13.7 12.2 10.9
Disagree % 6.1 0.0 8.0 6.2 5.8 4.6 7.0 6.1 6.1 4.3 5.2 7.7
Unsure % 7.7 1.0 12.5 7.3 1.4 8.2 7.1 14.9 10.9 7.5 5.3 3.6

2019-1496 – Plan Canada – Boys – STAT SHEET
Nanos conducted an online survey of 1,065 Canadian boys, 14 to 24 years of age, between September 15th to 24th, 2019.
www.nanos.co
Page 25
Do you agree, somewhat agree, somewhat disagree or disagree with the following? [RANDOMIZE]
Region Age
Canada 2019-09 Atlantic Quebec Ontario Manitoba/Saskatchewan Alberta
British Columbia/North
14 to 15 years old
16 to 17 years old
18 to 19 years old
20 to 21 years old
22 to 24 years old
Question - I find men in positions of power approachable
Total Unwgt N
1065 98 226 304 98 166 173 141 202 220 203 299
Wgt N 1000 62 220 399 72 118 129 164 172 178 192 294
Agree % 31.4 44.2 24.7 34.3 38.2 27.8 27.7 35.1 31.0 31.5 28.1 31.8
Somewhat agree % 40.3 37.2 35.8 39.8 45.2 47.2 42.4 32.7 39.0 39.3 42.7 44.4
Somewhat disagree % 16.7 11.0 23.4 15.7 9.6 15.4 16.1 17.1 15.1 18.3 20.5 13.9
Disagree % 4.4 7.0 6.3 2.4 5.3 3.3 6.8 2.5 4.6 3.8 4.0 6.1
Unsure % 7.1 0.5 9.9 7.8 1.6 6.4 7.1 12.5 10.3 7.0 4.7 3.8
Region Age
Canada 2019-09 Atlantic Quebec Ontario Manitoba/Saskatchewan Alberta
British Columbia/North
14 to 15 years old
16 to 17 years old
18 to 19 years old
20 to 21 years old
22 to 24 years old
Question - Think of a CEO, did you picture:
Total Unwgt N
1065 98 226 304 98 166 173 141 202 220 203 299
Wgt N 1000 62 220 399 72 118 129 164 172 178 192 294
A Man % 48.9 35.6 48.5 50.0 54.3 48.0 50.3 51.2 48.7 51.5 49.6 45.6
A Woman % 8.3 9.5 8.3 8.9 8.9 6.4 7.5 8.0 8.6 6.0 8.7 9.5
I wouldn’t assume either
% 38.3 54.3 34.4 37.8 35.6 38.7 39.6 32.1 38.4 37.2 39.1 41.7
Unsure % 4.6 0.6 8.8 3.4 1.2 6.9 2.6 8.7 4.3 5.3 2.7 3.1

2019-1496 – Plan Canada – Boys – STAT SHEET
Nanos conducted an online survey of 1,065 Canadian boys, 14 to 24 years of age, between September 15th to 24th, 2019.
www.nanos.co
Page 26
Region Age
Canada 2019-09 Atlantic Quebec Ontario Manitoba/Saskatchewan Alberta
British Columbia/North
14 to 15 years old
16 to 17 years old
18 to 19 years old
20 to 21 years old
22 to 24 years old
Question - Do you talk about your leadership aspirations with your family or other trusted adults regularly, occasionally or never?
Total Unwgt N
1065 98 226 304 98 166 173 141 202 220 203 299
Wgt N 1000 62 220 399 72 118 129 164 172 178 192 294
Regularly % 16.4 16.7 17.3 17.5 10.4 14.8 16.5 17.5 14.1 17.1 17.5 16.1
Occasionally % 44.4 40.8 43.7 40.4 61.1 48.0 47.2 36.0 37.4 43.3 44.7 53.7
Never % 32.0 32.0 31.5 34.1 27.2 33.2 28.2 33.9 39.7 30.0 34.7 26.0
Unsure % 7.1 10.4 7.5 8.0 1.3 4.1 8.1 12.6 8.8 9.5 3.2 4.2
Region Age
Canada 2019-09 Atlantic Quebec Ontario Manitoba/Saskatchewan Alberta
British Columbia/North
14 to 15 years old
16 to 17 years old
18 to 19 years old
20 to 21 years old
22 to 24 years old
Question - Do your female peers encourage, somewhat encourage, somewhat not encourage or not encourage your leadership aspirations?
Total Unwgt N
1065 98 226 304 98 166 173 141 202 220 203 299
Wgt N 1000 62 220 399 72 118 129 164 172 178 192 294
Encourage % 33.8 40.7 33.0 31.4 34.2 39.5 33.4 29.8 35.4 34.9 36.5 32.6
Somewhat encourage % 38.3 39.8 39.3 37.1 38.0 37.8 39.8 35.9 32.1 40.6 37.1 42.5
Somewhat not encourage
% 9.1 7.9 8.7 10.6 4.2 5.4 12.3 9.2 6.1 8.9 10.5 10.1
Not encourage % 5.2 1.3 5.2 6.4 6.7 3.5 4.2 4.3 6.2 4.7 6.2 4.8
Unsure % 13.6 10.3 13.7 14.5 16.9 13.8 10.3 20.8 20.2 10.8 9.7 10.0

2019-1496 – Plan Canada – Boys – STAT SHEET
Nanos conducted an online survey of 1,065 Canadian boys, 14 to 24 years of age, between September 15th to 24th, 2019.
www.nanos.co
Page 27
Region Age
Canada 2019-09 Atlantic Quebec Ontario Manitoba/Saskatchewan Alberta
British Columbia/North
14 to 15 years old
16 to 17 years old
18 to 19 years old
20 to 21 years old
22 to 24 years old
Question - Do your male peers encourage, somewhat encourage, somewhat not encourage or not encourage your leadership aspirations?
Total Unwgt N
1065 98 226 304 98 166 173 141 202 220 203 299
Wgt N 1000 62 220 399 72 118 129 164 172 178 192 294
Encourage % 30.7 39.3 28.3 32.9 30.4 24.7 29.7 29.0 28.8 36.1 29.9 30.0
Somewhat encourage % 40.6 32.9 38.8 40.6 35.8 47.9 43.1 34.4 36.6 39.5 44.6 44.3
Somewhat not encourage
% 10.6 11.8 14.1 8.3 12.3 9.8 11.2 10.4 10.4 9.4 12.6 10.3
Not encourage % 5.1 4.6 5.8 5.1 7.3 3.1 4.5 6.9 5.6 4.1 4.5 4.6
Unsure % 13.1 11.4 13.0 13.2 14.2 14.4 11.4 19.3 18.6 11.0 8.4 10.7
Region Age
Canada 2019-09 Atlantic Quebec Ontario Manitoba/Saskatchewan Alberta
British Columbia/North
14 to 15 years old
16 to 17 years old
18 to 19 years old
20 to 21 years old
22 to 24 years old
Question - When thinking of sports teams at your current or previous high school, are (or were) the girls’ teams treated the same and did they have the same status as the boys’ teams?
Total Unwgt N
1065 98 226 304 98 166 173 141 202 220 203 299
Wgt N 1000 62 220 399 72 118 129 164 172 178 192 294
The boys’ teams are/were treated better and had a higher status
% 35.0 30.8 31.0 33.5 33.6 44.5 41.0 29.5 29.1 35.9 42.4 36.3
The girls’ teams are/were treated better and had a higher status
% 11.9 8.2 14.9 12.4 16.1 6.9 9.2 10.0 8.0 12.1 16.4 12.1
Both the girls and the boys are treated the same and have the same status
% 43.1 49.5 39.4 46.2 44.5 41.6 37.6 45.3 51.5 43.5 33.7 43.0
Unsure % 10.0 11.5 14.7 8.0 5.9 7.1 12.2 15.2 11.4 8.5 7.6 8.6

2019-1496 – Plan Canada – Boys – Grouped Age – STAT SHEET
Nanos conducted an online survey of 1,065 Canadian boys, 14 to 24 years of age, between September 15th to 24th, 2019.
www.nanos.co
Page 1
Age
Canada 2019-09 14 to 17 years old 18 to 24 years old
Question - Which adjectives most describe a good leader (choose all that apply): [RANDOMIZE]
Total Unwgt N 9324 3015 6309
Wgt N 8603 2857 5746
Assertive % 3.8 3.6 4.0
Organized % 6.6 6.9 6.5
Calm % 5.1 5.1 5.0
Smart % 7.4 7.4 7.4
Bold % 4.0 3.9 4.1
Supportive % 6.3 6.9 5.9
Emotional % 1.2 1.2 1.1
Patient % 5.8 6.3 5.6
Humble % 4.8 4.9 4.7
Tactful % 3.3 3.0 3.5
Strong % 6.6 6.8 6.6
Imposing % 0.9 0.8 1.0
Stern % 1.4 1.1 1.6
Decisive % 5.1 4.5 5.4
Passionate % 5.8 5.9 5.7
Confident % 7.8 8.1 7.6
Caring % 5.6 5.9 5.5
Fearless % 4.1 3.8 4.3
Empathetic % 3.9 3.6 4.1
Helpful % 5.9 6.3 5.7
Passive % 1.1 0.9 1.2
Quiet % 0.6 0.6 0.6
Timid % 0.2 0.2 0.3
Gentle % 2.3 2.1 2.4
Unsure % 0.2 0.3 0.2

2019-1496 – Plan Canada – Boys – Grouped Age – STAT SHEET
Nanos conducted an online survey of 1,065 Canadian boys, 14 to 24 years of age, between September 15th to 24th, 2019.
www.nanos.co
Page 2
Age
Canada 2019-09 14 to 17 years old 18 to 24 years old
Question - Which adjectives describe girls (choose all that apply): [RANDOMIZE]
Total Unwgt N 7790 2512 5278
Wgt N 7245 2382 4863
Assertive % 1.8 1.5 1.9
Organized % 5.4 6.0 5.1
Calm % 4.6 4.6 4.7
Smart % 6.9 7.4 6.6
Bold % 2.8 2.5 2.9
Supportive % 5.3 5.4 5.2
Emotional % 7.3 7.6 7.1
Patient % 4.3 4.1 4.5
Humble % 3.4 3.5 3.3
Tactful % 1.6 1.0 1.9
Strong % 4.3 4.7 4.1
Imposing % 1.3 1.2 1.4
Stern % 1.2 1.0 1.3
Decisive % 2.4 2.1 2.5
Passionate % 5.6 5.3 5.8
Confident % 4.4 4.4 4.4
Caring % 7.4 7.6 7.3
Fearless % 2.2 2.1 2.3
Empathetic % 5.2 5.3 5.1
Helpful % 5.5 5.4 5.6
Passive % 3.0 3.1 2.9
Quiet % 3.1 2.7 3.3
Timid % 2.6 2.4 2.7
Gentle % 6.7 7.0 6.5
Unsure % 1.8 1.9 1.7

2019-1496 – Plan Canada – Boys – Grouped Age – STAT SHEET
Nanos conducted an online survey of 1,065 Canadian boys, 14 to 24 years of age, between September 15th to 24th, 2019.
www.nanos.co
Page 3
Age
Canada 2019-09 14 to 17 years old 18 to 24 years old
Question - Which adjectives describe boys (choose all that apply): [RANDOMIZE]
Total Unwgt N 7354 2480 4874
Wgt N 6828 2341 4487
Assertive % 5.3 5.0 5.4
Organized % 2.9 2.8 3.0
Calm % 3.4 3.5 3.3
Smart % 5.8 6.0 5.6
Bold % 6.7 6.4 6.8
Supportive % 4.2 4.6 4.0
Emotional % 2.3 2.1 2.4
Patient % 2.8 2.8 2.9
Humble % 3.3 3.1 3.4
Tactful % 3.2 2.9 3.4
Strong % 8.8 9.3 8.6
Imposing % 4.2 3.8 4.4
Stern % 3.7 3.4 3.8
Decisive % 4.6 4.1 4.8
Passionate % 4.3 4.8 4.1
Confident % 7.8 8.4 7.5
Caring % 3.5 3.9 3.3
Fearless % 6.4 6.8 6.3
Empathetic % 2.4 2.5 2.3
Helpful % 4.5 4.7 4.5
Passive % 2.0 2.1 2.0
Quiet % 1.8 1.4 1.9
Timid % 1.5 1.3 1.6
Gentle % 2.8 2.5 3.0
Unsure % 1.6 1.7 1.6

2019-1496 – Plan Canada – Boys – Grouped Age – STAT SHEET
Nanos conducted an online survey of 1,065 Canadian boys, 14 to 24 years of age, between September 15th to 24th, 2019.
www.nanos.co
Page 4
Age
Canada 2019-09 14 to 17 years old 18 to 24 years old
Question - Do you believe that achieving gender equality benefits:
Total Unwgt N 1065 343 722
Wgt N 1000 337 664
Only/mostly women % 11.1 12.0 10.7
All genders equally % 73.9 73.2 74.3
Only/mostly men % 3.2 0.8 4.4
No one % 3.0 3.2 2.9
Unsure % 8.8 10.8 7.8
Age
Canada 2019-09 14 to 17 years old 18 to 24 years old
Question - In general do you think girls/women do more, somewhat more, the same, somewhat less or less household chores as boys/men in your home?
Total Unwgt N 1065 343 722
Wgt N 1000 337 664
More % 19.9 24.8 17.4
Somewhat more % 32.9 29.3 34.8
The same % 34.1 29.9 36.2
Somewhat less % 5.3 5.2 5.4
Less % 2.9 3.3 2.7
Unsure % 4.9 7.6 3.6

2019-1496 – Plan Canada – Boys – Grouped Age – STAT SHEET
Nanos conducted an online survey of 1,065 Canadian boys, 14 to 24 years of age, between September 15th to 24th, 2019.
www.nanos.co
Page 5
Age
Canada 2019-09 14 to 17 years old 18 to 24 years old
Question - Do you regularly, occasionally or never feel pressure to change how you act in order to achieve your leadership aspirations?
Total Unwgt N 1065 343 722
Wgt N 1000 337 664
Regularly % 16.3 16.0 16.5
Occasionally % 53.7 48.2 56.4
Never % 20.8 19.7 21.3
Unsure % 9.2 16.0 5.8
Do you agree, somewhat agree, somewhat disagree or disagree with the following statements [RANDOMIZE]
Age
Canada 2019-09 14 to 17 years old 18 to 24 years old
Question - People thought of me as smart growing up
Total Unwgt N 1065 343 722
Wgt N 1000 337 664
Agree % 42.3 46.0 40.4
Somewhat agree % 34.3 28.5 37.2
Somewhat disagree % 10.9 9.8 11.5
Disagree % 6.7 6.9 6.6
Unsure % 5.9 8.9 4.3

2019-1496 – Plan Canada – Boys – Grouped Age – STAT SHEET
Nanos conducted an online survey of 1,065 Canadian boys, 14 to 24 years of age, between September 15th to 24th, 2019.
www.nanos.co
Page 6
Do you agree, somewhat agree, somewhat disagree or disagree with the following statements [RANDOMIZE]
Age
Canada 2019-09 14 to 17 years old 18 to 24 years old
Question - Girls and women have the natural abilities required to be good leaders
Total Unwgt N 1065 343 722
Wgt N 1000 337 664
Agree % 39.5 39.0 39.7
Somewhat agree % 36.2 35.6 36.4
Somewhat disagree % 10.7 8.5 11.8
Disagree % 6.7 6.1 7.0
Unsure % 7.0 10.7 5.0
Do you agree, somewhat agree, somewhat disagree or disagree with the following statements [RANDOMIZE]
Age
Canada 2019-09 14 to 17 years old 18 to 24 years old
Question - My opinions are/were valued when I was in school
Total Unwgt N 1065 343 722
Wgt N 1000 337 664
Agree % 29.7 31.6 28.7
Somewhat agree % 40.5 39.5 41.0
Somewhat disagree % 14.5 10.1 16.6
Disagree % 9.5 9.8 9.3
Unsure % 5.9 8.9 4.4

2019-1496 – Plan Canada – Boys – Grouped Age – STAT SHEET
Nanos conducted an online survey of 1,065 Canadian boys, 14 to 24 years of age, between September 15th to 24th, 2019.
www.nanos.co
Page 7
Do you agree, somewhat agree, somewhat disagree or disagree with the following statements [RANDOMIZE]
Age
Canada 2019-09 14 to 17 years old 18 to 24 years old
Question - Boys and men have the natural abilities required to be good leaders
Total Unwgt N 1065 343 722
Wgt N 1000 337 664
Agree % 38.3 37.2 38.9
Somewhat agree % 37.8 35.5 38.9
Somewhat disagree % 11.1 12.2 10.6
Disagree % 6.6 6.3 6.8
Unsure % 6.2 8.8 4.9
Do you agree, somewhat agree, somewhat disagree or disagree with the following statements [RANDOMIZE]
Age
Canada 2019-09 14 to 17 years old 18 to 24 years old
Question - My gender holds back my ability to be a leader
Total Unwgt N 1065 343 722
Wgt N 1000 337 664
Agree % 8.6 9.6 8.2
Somewhat agree % 11.6 8.9 13.0
Somewhat disagree % 15.2 13.8 15.9
Disagree % 57.9 56.4 58.7
Unsure % 6.7 11.3 4.3

2019-1496 – Plan Canada – Boys – Grouped Age – STAT SHEET
Nanos conducted an online survey of 1,065 Canadian boys, 14 to 24 years of age, between September 15th to 24th, 2019.
www.nanos.co
Page 8
Age
Canada 2019-09 14 to 17 years old 18 to 24 years old
Question - In general, are you confident, somewhat confident, somewhat not confident or not confident in your leadership abilities?
Total Unwgt N 1065 343 722
Wgt N 1000 337 664
Confident % 34.0 33.2 34.4
Somewhat confident % 41.7 42.5 41.4
Somewhat not confident % 14.7 12.9 15.6
Not confident % 5.0 4.5 5.3
Unsure % 4.6 6.9 3.4
Where do you feel that you had/have opportunities to become a leader? Please rank the following where 1 is the place where you had the best opportunities to become a leader, 2 the
second best place to become a leader and so on.
Age
Canada 2019-09 14 to 17 years old 18 to 24 years old
Question - Rank 1 Total Unwgt N 1003 328 675
Wgt N 940 319 621
Family % 17.8 14.6 19.4
In a workplace % 14.0 8.6 16.8
Educational institutions % 11.4 15.8 9.1
Clubs and Community Groups % 8.1 6.6 8.9
Within peer groups % 16.0 19.9 14.0
Sports and Activities % 18.4 19.9 17.6
Volunteerism and activism % 8.4 6.7 9.2
I have had no opportunities to become a leader
% 1.9 2.4 1.6
Unsure % 4.1 5.3 3.4

2019-1496 – Plan Canada – Boys – Grouped Age – STAT SHEET
Nanos conducted an online survey of 1,065 Canadian boys, 14 to 24 years of age, between September 15th to 24th, 2019.
www.nanos.co
Page 9
Where do you feel that you had/have opportunities to become a leader? Please rank the following where 1 is the place where you had the best opportunities to become a leader, 2 the
second best place to become a leader and so on.
Age
Canada 2019-09 14 to 17 years old 18 to 24 years old
Question - Rank 2 Total Unwgt N 906 287 619
Wgt N 847 279 567
Family % 15.6 15.0 15.8
In a workplace % 11.7 9.2 13.0
Educational institutions % 14.4 14.7 14.2
Clubs and Community Groups % 10.1 11.1 9.6
Within peer groups % 18.1 20.0 17.2
Sports and Activities % 18.0 17.7 18.1
Volunteerism and activism % 11.8 11.7 11.9
Other (specify below) % 0.3 0.6 0.1
Where do you feel that you had/have opportunities to become a leader? Please rank the following where 1 is the place where you had the best opportunities to become a leader, 2 the
second best place to become a leader and so on.
Age
Canada 2019-09 14 to 17 years old 18 to 24 years old
Question - Rank 3 Total Unwgt N 792 263 529
Wgt N 736 255 481
Family % 14.8 15.3 14.5
In a workplace % 15.1 13.3 16.0
Educational institutions % 14.6 14.1 14.9
Clubs and Community Groups % 12.6 11.1 13.4
Within peer groups % 16.4 18.5 15.4
Sports and Activities % 12.9 13.0 12.9
Volunteerism and activism % 13.5 14.7 12.9

2019-1496 – Plan Canada – Boys – Grouped Age – STAT SHEET
Nanos conducted an online survey of 1,065 Canadian boys, 14 to 24 years of age, between September 15th to 24th, 2019.
www.nanos.co
Page 10
Where do you feel that you had/have opportunities to become a leader? Please rank the following where 1 is the place where you had the best opportunities to become a leader, 2 the
second best place to become a leader and so on.
Age
Canada 2019-09 14 to 17 years old 18 to 24 years old
Question - Rank 4 Total Unwgt N 688 228 460
Wgt N 645 223 421
Family % 15.5 16.0 15.3
In a workplace % 15.7 13.7 16.7
Educational institutions % 13.6 14.5 13.2
Clubs and Community Groups % 15.6 17.0 14.9
Within peer groups % 14.7 13.8 15.2
Sports and Activities % 13.1 12.8 13.2
Volunteerism and activism % 11.7 12.3 11.5
Where do you feel that you had/have opportunities to become a leader? Please rank the following where 1 is the place where you had the best opportunities to become a leader, 2 the
second best place to become a leader and so on.
Age
Canada 2019-09 14 to 17 years old 18 to 24 years old
Question - Rank 5 Total Unwgt N 573 192 381
Wgt N 540 189 351
Family % 14.6 18.2 12.7
In a workplace % 14.9 11.4 16.7
Educational institutions % 13.1 12.8 13.3
Clubs and Community Groups % 14.3 14.5 14.2
Within peer groups % 12.6 11.4 13.2
Sports and Activities % 15.2 15.5 15.0
Volunteerism and activism % 15.3 16.2 14.8

2019-1496 – Plan Canada – Boys – Grouped Age – STAT SHEET
Nanos conducted an online survey of 1,065 Canadian boys, 14 to 24 years of age, between September 15th to 24th, 2019.
www.nanos.co
Page 11
Where do you feel that you had/have opportunities to become a leader? Please rank the following where 1 is the place where you had the best opportunities to become a leader, 2 the
second best place to become a leader and so on.
Age
Canada 2019-09 14 to 17 years old 18 to 24 years old
Question - Rank 6 Total Unwgt N 478 150 328
Wgt N 448 145 302
Family % 10.5 9.2 11.1
In a workplace % 14.0 16.8 12.6
Educational institutions % 14.2 15.5 13.6
Clubs and Community Groups % 19.8 17.7 20.8
Within peer groups % 12.2 9.9 13.3
Sports and Activities % 13.4 10.9 14.6
Volunteerism and activism % 15.9 19.9 14.0
Where do you feel that you had/have opportunities to become a leader? Please rank the following where 1 is the place where you had the best opportunities to become a leader, 2 the
second best place to become a leader and so on.
Age
Canada 2019-09 14 to 17 years old 18 to 24 years old
Question - Rank 7 Total Unwgt N 383 117 266
Wgt N 361 114 247
Family % 15.5 18.3 14.3
In a workplace % 15.1 23.3 11.3
Educational institutions % 13.1 9.8 14.6
Clubs and Community Groups % 15.6 18.6 14.2
Within peer groups % 9.0 6.1 10.3
Sports and Activities % 11.0 8.3 12.3
Volunteerism and activism % 20.6 15.7 22.9

2019-1496 – Plan Canada – Boys – Grouped Age – STAT SHEET
Nanos conducted an online survey of 1,065 Canadian boys, 14 to 24 years of age, between September 15th to 24th, 2019.
www.nanos.co
Page 12
Where do you feel that you had/have opportunities to become a leader? Please rank the following where 1 is the place where you had the best opportunities to become a leader, 2 the
second best place to become a leader and so on.
Age
Canada 2019-09 14 to 17 years old 18 to 24 years old
Question - Rank 8 Total Unwgt N 5 3 2
Wgt N 4 2 2
In a workplace % 7.5 15.0 0.0
Sports and Activities % 7.5 15.0 0.0
Other (specify below) % 85.1 70.1 100.0
Age
Canada 2019-09 14 to 17 years old 18 to 24 years old
Question - Do you regularly, occasionally or never doubt that you have what it takes to be a good leader?
Total Unwgt N 1065 343 722
Wgt N 1000 337 664
Regularly % 20.6 19.9 21.0
Occasionally % 55.7 53.3 56.9
Never % 17.7 19.3 16.8
Unsure % 6.1 7.6 5.3

2019-1496 – Plan Canada – Boys – Grouped Age – STAT SHEET
Nanos conducted an online survey of 1,065 Canadian boys, 14 to 24 years of age, between September 15th to 24th, 2019.
www.nanos.co
Page 13
Age
Canada 2019-09 14 to 17 years old 18 to 24 years old
Question - What tools do you think you need to achieve your leadership goals? (choose all that apply)
Total Unwgt N 3070 943 2127
Wgt N 2859 905 1953
[Education] % 22.5 24.6 21.5
[A mentor ] % 14.3 11.7 15.4
[Family support] % 17.7 18.1 17.4
[Community support] % 14.3 15.7 13.7
[Access to leadership courses] % 8.7 8.2 9.0
[Gender equality ] % 8.1 8.3 8.0
[Money] % 11.4 8.4 12.8
[Unsure] % 2.2 4.2 1.3
[Education] % 0.4 0.3 0.5
[A mentor ] % 0.4 0.5 0.3
Age
Canada 2019-09 14 to 17 years old 18 to 24 years old
Question - Do you have access to all the tools you need to achieve your leadership goals? (choose all the tools you currently have access to)
Total Unwgt N 2915 994 1921
Wgt N 2755 971 1784
[Education] % 21.3 21.9 21.0
[A mentor ] % 9.4 8.7 9.7
[Family support] % 20.6 20.1 20.9
[Community support] % 11.6 11.5 11.6
[Access to leadership courses] % 7.4 7.7 7.2
[Gender equality ] % 8.8 8.4 9.0
[Money] % 7.8 6.9 8.3
[I have the tools I need] % 9.0 10.8 8.0
[Unsure] % 4.1 3.9 4.2
[Other] % 0.1 0.1 0.1

2019-1496 – Plan Canada – Boys – Grouped Age – STAT SHEET
Nanos conducted an online survey of 1,065 Canadian boys, 14 to 24 years of age, between September 15th to 24th, 2019.
www.nanos.co
Page 14
Age
Canada 2019-09 14 to 17 years old 18 to 24 years old
Question - Please reflect for a moment on those in your immediate circle, excluding family who are in a position of power. This means a person who has authority or influence in your life (for example: teachers, coaches, and bosses).How many of those are women? [Open]
Total Unwgt N 1059 340 719
Wgt N 995 334 662
Mean 4.0 4.6 3.7
Median 3.0 3.0 3.0
0 % 3.5 1.1 4.8
1 % 8.1 6.1 9.1
2 % 12.9 11.6 13.6
3 % 9.6 6.9 11.0
4 % 5.9 7.7 5.0
5 % 5.9 6.7 5.5
6 % 1.8 2.1 1.6
7 % 1.3 1.0 1.4
8 % 1.1 2.1 0.5
9 % 0.4 0.0 0.5
10 % 2.7 1.8 3.1
11 % 0.1 0.0 0.1
12 % 0.8 1.7 0.4
13 % 0.3 0.7 0.1
15 % 0.3 0.1 0.4
16 % 0.0 0.1 0.0
18 % 0.2 0.4 0.1
29 % 0.1 0.2 0.0
30 % 0.1 0.3 0.0
34 % 0.1 0.4 0.0
50 % 0.1 0.0 0.1
69 % 0.2 0.0 0.3
Unsure % 44.6 49.0 42.4

2019-1496 – Plan Canada – Boys – Grouped Age – STAT SHEET
Nanos conducted an online survey of 1,065 Canadian boys, 14 to 24 years of age, between September 15th to 24th, 2019.
www.nanos.co
Page 15
Age
Canada 2019-09 14 to 17 years old 18 to 24 years old
Question - Please reflect for a moment on those in your immediate circle, excluding family who are in a position of power. This means a person who has authority or influence in your life (for example: teachers, coaches, and bosses) How many of these are men? [Open]
Total Unwgt N 1034 330 704
Wgt N 974 326 648
Mean 4.8 4.9 4.8
Median 3.0 4.0 3.0
0 % 3.1 0.2 4.6
1 % 7.7 3.1 10.0
2 % 11.2 8.5 12.6
3 % 8.2 10.1 7.2
4 % 5.5 7.5 4.5
5 % 6.4 6.6 6.3
6 % 2.3 3.6 1.7
7 % 1.4 0.9 1.7
8 % 1.7 2.1 1.5
9 % 0.9 1.1 0.9
10 % 1.6 1.2 1.8
11 % 0.1 0.3 0.0
12 % 1.1 1.3 0.9
13 % 0.4 1.1 0.1
14 % 0.3 0.3 0.2
15 % 0.7 0.7 0.8
18 % 0.2 0.0 0.3
20 % 0.7 0.5 0.8
21 % 0.0 0.1 0.0
26 % 0.1 0.0 0.1
69 % 0.1 0.0 0.1
Unsure % 45.8 50.7 43.3
100 % 0.2 0.0 0.2
150 % 0.1 0.0 0.1

2019-1496 – Plan Canada – Boys – Grouped Age – STAT SHEET
Nanos conducted an online survey of 1,065 Canadian boys, 14 to 24 years of age, between September 15th to 24th, 2019.
www.nanos.co
Page 16
Age
Canada 2019-09 14 to 17 years old 18 to 24 years old
Question - Do you have a mentor(s)? (Examples of mentors can be people you consider leaders who have provided guidance, leadership, advice, inspiration, counselling, or personal or professional insight)
Total Unwgt N 1065 343 722
Wgt N 1000 337 664
Yes % 46.0 45.1 46.5
No % 44.1 41.6 45.4
Unsure % 9.8 13.2 8.1
Age
Canada 2019-09 14 to 17 years old 18 to 24 years old
Question – [IF THEY HAVE A MENTOR] If yes, what is the gender of your mentor?
Total Unwgt N 495 162 333
Wgt N 461 152 309
Male % 71.1 75.2 69.0
Female % 27.7 23.0 30.0
Other % 1.2 1.8 1.0
Do you agree, somewhat agree, somewhat disagree or disagree with the following? [RANDOMIZE]
Age
Canada 2019-09 14 to 17 years old 18 to 24 years old
Question - I expect to be given personally challenging and interesting work early in my career/professional life
Total Unwgt N 1065 343 722
Wgt N 1000 337 664
Agree % 40.9 40.5 41.2
Somewhat agree % 39.1 36.2 40.6
Somewhat disagree % 10.2 11.0 9.8
Disagree % 3.0 1.7 3.6
Unsure % 6.8 10.7 4.8

2019-1496 – Plan Canada – Boys – Grouped Age – STAT SHEET
Nanos conducted an online survey of 1,065 Canadian boys, 14 to 24 years of age, between September 15th to 24th, 2019.
www.nanos.co
Page 17
Do you agree, somewhat agree, somewhat disagree or disagree with the following? [RANDOMIZE]
Age
Canada 2019-09 14 to 17 years old 18 to 24 years old
Question - I find women in positions of power approachable
Total Unwgt N 1065 343 722
Wgt N 1000 337 664
Agree % 37.1 36.8 37.2
Somewhat agree % 36.9 31.6 39.5
Somewhat disagree % 12.2 12.7 12.0
Disagree % 6.1 6.1 6.1
Unsure % 7.7 12.8 5.1
Do you agree, somewhat agree, somewhat disagree or disagree with the following? [RANDOMIZE]
Age
Canada 2019-09 14 to 17 years old 18 to 24 years old
Question - I find men in positions of power approachable
Total Unwgt N 1065 343 722
Wgt N 1000 337 664
Agree % 31.4 33.0 30.6
Somewhat agree % 40.3 35.9 42.6
Somewhat disagree % 16.7 16.1 17.0
Disagree % 4.4 3.6 4.9
Unsure % 7.1 11.4 4.9

2019-1496 – Plan Canada – Boys – Grouped Age – STAT SHEET
Nanos conducted an online survey of 1,065 Canadian boys, 14 to 24 years of age, between September 15th to 24th, 2019.
www.nanos.co
Page 18
Do you agree, somewhat agree, somewhat disagree or disagree with the following? [RANDOMIZE]
Age
Canada 2019-09 14 to 17 years old 18 to 24 years old
Question - Think of a CEO, did you picture:
Total Unwgt N 1065 343 722
Wgt N 1000 337 664
A Man % 48.9 49.9 48.3
A Woman % 8.3 8.3 8.3
I wouldn’t assume either % 38.3 35.3 39.7
Unsure % 4.6 6.5 3.6
Age
Canada 2019-09 14 to 17 years old 18 to 24 years old
Question - Do you talk about your leadership aspirations with your family or other trusted adults regularly, occasionally or never?
Total Unwgt N 1065 343 722
Wgt N 1000 337 664
Regularly % 16.4 15.8 16.8
Occasionally % 44.4 36.7 48.3
Never % 32.0 36.9 29.6
Unsure % 7.1 10.7 5.3
Age
Canada 2019-09 14 to 17 years old 18 to 24 years old
Question - Do your female peers encourage, somewhat encourage, somewhat not encourage or not encourage your leadership aspirations?
Total Unwgt N 1065 343 722
Wgt N 1000 337 664
Encourage % 33.8 32.6 34.3
Somewhat encourage % 38.3 34.0 40.4
Somewhat not encourage % 9.1 7.6 9.9
Not encourage % 5.2 5.3 5.2
Unsure % 13.6 20.5 10.1

2019-1496 – Plan Canada – Boys – Grouped Age – STAT SHEET
Nanos conducted an online survey of 1,065 Canadian boys, 14 to 24 years of age, between September 15th to 24th, 2019.
www.nanos.co
Page 19
Age
Canada 2019-09 14 to 17 years old 18 to 24 years old
Question - Do your male peers encourage, somewhat encourage, somewhat not encourage or not encourage your leadership aspirations?
Total Unwgt N 1065 343 722
Wgt N 1000 337 664
Encourage % 30.7 28.9 31.6
Somewhat encourage % 40.6 35.6 43.1
Somewhat not encourage % 10.6 10.4 10.7
Not encourage % 5.1 6.3 4.5
Unsure % 13.1 18.9 10.1
Age
Canada 2019-09 14 to 17 years old 18 to 24 years old
Question - When thinking of sports teams at your current or previous high school, are (or were) the girls’ teams treated the same and did they have the same status as the boys’ teams?
Total Unwgt N 1065 343 722
Wgt N 1000 337 664
The boys’ teams are/were treated better and had a higher status
% 35.0 29.3 37.9
The girls’ teams are/were treated better and had a higher status
% 11.9 9.0 13.3
Both the girls and the boys are treated the same and have the same status
% 43.1 48.5 40.4
Unsure % 10.0 13.3 8.3


