Ghent University · Ghent University Faculty of Pharmaceutical Sciences SPECTROSCOPIC PROCESS...
260
Transcript of Ghent University · Ghent University Faculty of Pharmaceutical Sciences SPECTROSCOPIC PROCESS...


Ghent University
Faculty of Pharmaceutical Sciences
SPECTROSCOPIC PROCESS MONITORING FOR QUALITY
ASSESSMENT, VISUALIZATION AND UNDERSTANDING OF
PHARMACEUTICAL HOT-MELT EXTRUSION
LIEN SAERENS
Pharmacist
Thesis submitted to obtain the degree of Doctor in Pharmaceutical Sciences
2013
Promoter:
Prof. Dr. Thomas De Beer
Laboratory of Pharmaceutical Process Analytical Technology, Ghent University
Co-promoter:
Prof. Dr. Chris Vervaet
Laboratory of Pharmaceutical Technology, Ghent University


The author, the promoter and the co-promoter give the authorization to consult and to copy
parts of this thesis for personal use only. Any other use is limited by the Laws of Copyright,
especially concerning the obligation to refer to the source whenever results are cited from
this thesis.
Ghent, August 10, 2013
The author The promoter The co-promoter
Lien Saerens Prof. Dr. Thomas De Beer Prof. Dr. Chris Vervaet


ACKNOWLEDGEMENTS
These past four years turned out to be an overwhelming experience, coloured by the people
around me. Completing this PhD could not have been possible without the help, patience,
support and encouragement of numerous people, who inspired me and each contributed to
this work in their own way.
First of all, I would like to express my sincerest appreciation to my promoter, Prof. Dr.
Thomas De Beer. Thank you for giving me the opportunity to start this PhD, for the
enthusiastic guidance and advice during this period, for the freedom you gave me to
interpret and manage the project in my own way, and for the opportunities and challenges to
perform parts of this research abroad.
I am grateful to my co-promoter, Prof. Dr. Chris Vervaet, and to Prof. Dr. Jean Paul Remon,
for their constructive input and revisions of this work, for their interest in the topic and for
providing financial support for this PhD.
Special thanks go to Anneleen, Margot and Tinne, my allies in the PAT lab, with whom I
shared an ‘office’ from the very beginning. Your friendship, encouragements, scientific
assistance, the many conferences we have spent together, our brainstorm sessions and the
countless fun moments were inspiring, priceless, and helped me through the more difficult
parts of this project. My gratitude also goes out to Laurent, Ana, Fien and Laurens for their
constant interest, their support, for brightening up meetings and lunch breaks and for
making the PAT lab an enjoyable place to work.
I would like to thank all the colleagues from the lab of Pharmaceutical Technology for their
advice and helping hands, and in particular Lien, An-Katrien, Thomas and Ana for their
scientific input and assistance with the extrusion experiments. The help from Claudine,
Katharine and Ilse, who took care of the administrative tasks, is also greatly appreciated.

During this PhD, Dr. Elaine Brown gave me the opportunity to perform a part of the
presented research in the IRC in Polymer Science & Technology at the University of Bradford,
for which I am incredibly grateful. The warm welcome I received from everyone in the
department, and the help and scientific feedback during experiments from Dr. Adrian Kelly,
Dr. Tim Gough, Prof. Dr. Anant Paradkar, Dr. Ravi Dhumal and Prafulla Apshingekar is
genuinely appreciated.
I also wish to acknowledge the people at Brabender® Pharma, and in particular Dr. Dima
Ghanam and Dipl. Ing. Jane Schwarz, for inviting me to perform experiments at the
Brabender® Pharma site in Duisburg, and for their guidance and assistance during the
experimental work.
Sincere thanks go to FWO (Fonds Wetenschappelijk Onderzoek – Vlaanderen) for providing
the necessary funding to successfully complete this project.
I am particularly grateful for my friends, who succeeded in taking my mind of work as much
as possible. Whether they distracted me by going on memorable holidays or weekends with
me (Romy, Wannes, Thomas, Bart, Joachim, Anneke, Greet, Evelien, Annemieke, Severine), by
joining me on the volleyball court to reduce the stress levels (Yati, Daphne, Evi, Tine, Lynn,
Dolfien) or just by being there as my roommates (Lorijn, Eline), these past four years would
have been much tougher without them. Special thanks go to Hanneleen, for her help with the
layout and cover design.
And finally, my deepest gratitude goes out to my family, and in particular to my parents, my
brothers Tijs and Toon, my grandparents and tante Trees. Thank you for your endless support
and encouragements, and for the many opportunities you have given me!


TABLE OF CONTENTS
TABLE OF CONTENTS
LIST OF ABBREVIATIONS ..................................................................................................................... 1
CHAPTER 1
INTRODUCTION AND OBJECTIVES ..................................................................................................... 5
1.1. INTRODUCTION AND OBJECTIVES ........................................................................................... 7
1.2. REFERENCES .......................................................................................................................... 11
CHAPTER 2
HOT-MELT EXTRUSION AS A PHARMACEUTICAL PRODUCTION PROCESS ............................... 13
2.1. HOT-MELT EXTRUSION .......................................................................................................... 15
2.2. PROCESS AND EQUIPMENT ................................................................................................... 17
2.3. REFERENCES .......................................................................................................................... 20
CHAPTER 3
PROCESS MONITORING AND VISUALIZATION SOLUTIONS FOR HOT-MELT EXTRUSION ....... 23
3.1. INTRODUCTION ..................................................................................................................... 25
3.2. PROCESS ANALYTICAL TECHNOLOGY .................................................................................... 27
3.3. PROCESS ANALYTICAL TECHNIQUES APPLIED FOR PHARMACEUTICAL HOT-MELT EXTRUSION
............................................................................................................................................... 30
3.3.1. NIR spectroscopy ........................................................................................................... 30
3.3.2. Raman spectroscopy ..................................................................................................... 37
3.3.3. Monitoring of torque and power consumption ............................................................ 40
3.4. MONITORING OF POLYMER MELT EXTRUSION ..................................................................... 42
3.4.1. Spectroscopic techniques .............................................................................................. 42
3.4.1.1. NIR spectroscopy ................................................................................................... 42
3.4.1.2. UV-VIS spectroscopy .............................................................................................. 45
3.4.1.3. Fluorescence spectroscopy ................................................................................... 52

TABLE OF CONTENTS
3.4.1.4. Terahertz (THz) spectroscopy ................................................................................ 55
3.4.1.5. Dielectric spectroscopy ......................................................................................... 56
3.4.1.6. Optical detectors ................................................................................................... 57
3.4.1.7. Nuclear magnetic resonance (NMR) spectroscopy ............................................... 58
3.4.2. Ultrasonic techniques .................................................................................................... 58
3.4.3. Rheological techniques .................................................................................................. 61
3.4.4. Other process analytical techniques ............................................................................. 65
3.4.5. Combinations and comparison of complementary process analytical techniques ...... 66
3.5. CONCLUSION ......................................................................................................................... 68
3.6. REFERENCES .......................................................................................................................... 69
CHAPTER 4
RAMAN SPECTROSCOPY FOR THE IN-LINE POLYMER-DRUG QUANTIFICATION AND SOLID
STATE CHARACTERIZATION DURING A PHARMACEUTICAL HOT-MELT EXTRUSION PROCESS
............................................................................................................................................................... 73
4.1. INTRODUCTION ..................................................................................................................... 75
4.2. MATERIALS AND METHODS .................................................................................................. 77
4.2.1. Materials and hot-melt extrusion ................................................................................. 77
4.2.2. Raman spectroscopy ..................................................................................................... 78
4.2.3. Differential scanning calorimetry (DSC) ........................................................................ 78
4.2.4. Attenuated total reflectance Fourier transform infrared (ATR FT-IR) ........................... 79
4.3. RESULTS AND DISCUSSION .................................................................................................... 80
4.3.1. In-line API concentration monitoring ............................................................................ 80
4.3.2. In-line solid state monitoring ........................................................................................ 82
4.4. CONCLUSION ......................................................................................................................... 92
4.5. REFERENCES .......................................................................................................................... 93

TABLE OF CONTENTS
CHAPTER 5
VALIDATION OF AN IN-LINE RAMAN SPECTROSCOPIC METHOD FOR CONTINUOUS API
QUANTIFICATION DURING PHARMACEUTICAL HOT-MELT EXTRUSION ................................... 95
5.1. INTRODUCTION ..................................................................................................................... 97
5.2. MATERIALS AND METHODS .................................................................................................. 99
5.2.1. Materials ........................................................................................................................ 99
5.2.2. Hot-melt extrusion ........................................................................................................ 99
5.2.3. Raman spectroscopy ..................................................................................................... 99
5.2.4. Development of the Raman calibration models ......................................................... 100
5.2.5. Validation of the Raman method and estimation of its uncertainty .......................... 103
5.2.6. Evaluation of the robustness of the Raman calibration models ................................. 105
5.3. RESULTS AND DISCUSSION .................................................................................................. 107
5.3.1. Development of the Raman calibration models ......................................................... 107
5.3.2. Validation of the Raman method and estimation of its uncertainty .......................... 108
5.3.3. Evaluation of the robustness of the Raman calibration models ................................. 114
5.4. CONCLUSION ....................................................................................................................... 116
5.5. REFERENCES ........................................................................................................................ 117
CHAPTER 6
VISUALIZATION AND PROCESS UNDERSTANDING OF MATERIAL BEHAVIOUR IN THE
EXTRUSION BARREL DURING A HOT-MELT EXTRUSION PROCESS USING RAMAN
SPECTROSCOPY ................................................................................................................................. 119
6.1. INTRODUCTION ................................................................................................................... 121
6.2. MATERIALS AND METHODS ................................................................................................ 124
6.2.1. Materials ...................................................................................................................... 124
6.2.2. Hot-melt extrusion ...................................................................................................... 124
6.2.3. Raman spectroscopy ................................................................................................... 125
6.2.4. Fourier transform infrared spectroscopy (FT-IR)......................................................... 127
6.2.5. Differential scanning calorimetry (DSC) ...................................................................... 128
6.3. RESULTS AND DISCUSSION .................................................................................................. 129

TABLE OF CONTENTS
6.3.1. Influence of MPT concentration on the solid state of the extrudates ........................ 129
6.3.2. Influence of the barrel temperature on the solid state of the extrudates ................. 136
6.3.3. Influence of the rotational screw speed on the solid state of the extrudates ............ 138
6.4. CONCLUSION ....................................................................................................................... 142
6.5. REFERENCES ........................................................................................................................ 143
CHAPTER 7
IN-LINE SOLID STATE PREDICTION DURING PHARMACEUTICAL HOT-MELT EXTRUSION IN A
12 MM TWIN SCREW EXTRUDER USING RAMAN SPECTROSCOPY .......................................... 145
7.1. INTRODUCTION ................................................................................................................... 148
7.2. MATERIALS AND METHODS ................................................................................................ 150
7.2.1. Materials ...................................................................................................................... 150
7.2.2. Hot-melt extrusion ...................................................................................................... 150
7.2.3. Raman spectroscopy ................................................................................................... 152
7.2.4. Data collection, alignment and analysis ...................................................................... 154
7.2.5. Differential scanning calorimetry ................................................................................ 155
7.2.6. X-ray powder diffraction ............................................................................................. 156
7.3. RESULTS AND DISCUSSION .................................................................................................. 157
7.3.1. In-line monitoring of solid state .................................................................................. 157
7.3.2. Influence of die pressure on in-line collected Raman spectra .................................... 165
7.4. CONCLUSION ....................................................................................................................... 168
7.5. REFERENCES ........................................................................................................................ 169
CHAPTER 8
IN-LINE NIR SPECTROSCOPY FOR THE UNDERSTANDING OF POLYMER-DRUG INTERACTION
DURING PHARMACEUTICAL HOT-MELT EXTRUSION ................................................................. 171
8.1. INTRODUCTION ................................................................................................................... 173
8.2. MATERIALS AND METHODS ................................................................................................ 176
8.2.1. Materials ...................................................................................................................... 176
8.2.2. Hot-melt extrusion ...................................................................................................... 176
8.2.3. NIR spectroscopy ......................................................................................................... 177

TABLE OF CONTENTS
8.2.4. Raman spectroscopy ................................................................................................... 179
8.2.5. DSC analysis ................................................................................................................. 179
8.2.6. ATR FT-IR spectroscopy ............................................................................................... 180
8.3. RESULTS AND DISCUSSION .................................................................................................. 181
8.3.1. In-line monitoring of API concentration ...................................................................... 181
8.3.2. In-line monitoring of solid state and polymer-drug interactions ................................ 183
8.3.2.1. Near-infrared spectroscopy ................................................................................. 183
8.3.2.2. Differential scanning calorimetry ........................................................................ 185
8.3.2.3. ATR FT-IR spectroscopy ....................................................................................... 188
8.3.2.4. Raman spectroscopy ........................................................................................... 191
8.4. CONCLUSION ....................................................................................................................... 193
8.5. REFERENCES ........................................................................................................................ 194
CHAPTER 9
IN-LINE ULTRASOUND MONITORING OF DRUG CONCENTRATION DURING
PHARMACEUTICAL HOT-MELT EXTRUSION ................................................................................. 197
9.1. INTRODUCTION ................................................................................................................... 199
9.2. MATERIALS AND METHODS ................................................................................................ 201
9.2.1. Materials ...................................................................................................................... 201
9.2.2. Hot-melt extrusion ...................................................................................................... 201
9.2.3. Ultrasound equipment ................................................................................................ 202
9.2.4. Data analysis ................................................................................................................ 203
9.3. RESULTS ............................................................................................................................... 204
9.4. CONCLUSION ....................................................................................................................... 207
9.5. REFERENCES ........................................................................................................................ 208
FUTURE PERSPECTIVES .................................................................................................................... 209
SUMMARY AND GENERAL CONCLUSIONS ................................................................................... 215
SAMENVATTING EN ALGEMEEN BESLUIT .................................................................................... 223
CURRICULUM VITAE......................................................................................................................... 233

TABLE OF CONTENTS

LIST OF ABBREVIATIONS
1
LIST OF ABBREVIATIONS
API active pharmaceutical ingredient
ATR attenuated total reflectance
ATR FT-IR attenuated total reflectance Fourier transform infrared
BCS biopharmaceutical classification system
BPP bis (-pyrene) propane
CA citric acid
CA MH citric acid monohydrate
CCD charge coupled device
CEL celecoxib
Dcrit critical distance
DModX distance to model
DOE design of experiments
DSC differential scanning calorimetry
DTGS deuterated triglycine sulfate
EVA ethylene vinyl acetate
FA formaldehyde
FDA Food and Drug Administration
FT Fourier transform
FT-IR Fourier transform infrared
GMP Good Manufacturing Practice
HDPE high density polyethylene
HME hot-melt extrusion
HPLC high performance liquid chromatography
ICH International Conference on Harmonization
InGaAs indium gallium arsenide
IR infrared
LDPE low density polyethylene

LIST OF ABBREVIATIONS
2
LLDPE linear low density polyethylene
MCR multivariate curve resolution
MgSt magnesium stearate
MI melt flow index
MPT metoprolol tartrate
MSC multiplicative signal correction
NIR near infrared
NMR nuclear magnetic resonance
PA 6 polyamide 6
PAT process analytical technology
PC principal component
PCA principal component analysis
PE polyethylene
PEO polyethylene oxide
PLLA poly-L-lactic acid
PLS partial least squares
POM polyoxymethylene
PP polypropylene
PP-g-MA polypropylene grafted with maleic anhydride
PS polystyrene
PVC polyvinyl chloride
QbD quality by design
RMSEC root mean square error of calibration
RMSECV root mean square error of cross validation
RMSEP root mean square error of prediction
RTD residence time distribution
S section
SEC standard error of calibration
SEP standard error of prediction
SFSTP Société Française des Sciences et Techniques Pharmaceutiques
SIMCA soft independent modeling of class analogy
SNV standard normal variate

LIST OF ABBREVIATIONS
3
TCM thermocouple mesh
Tg glass transition temperature
THz terahertz
Tm melt temperature
TSE twin-screw extrusion
UV-VIS ultraviolet – visible
VA vinyl acetate
XRD X-ray diffraction

LIST OF ABBREVIATIONS
4

CHAPTER 1 – INTRODUCTION AND OBJECTIVES
5
CHAPTER 1
INTRODUCTION AND OBJECTIVES

CHAPTER 1 – INTRODUCTION AND OBJECTIVES
6

CHAPTER 1 – INTRODUCTION AND OBJECTIVES
7
CHAPTER 1
INTRODUCTION AND OBJECTIVES
1.1. INTRODUCTION AND OBJECTIVES
Hot-melt extrusion is defined as the process of pumping raw materials with one or two
rotating screw(s) through a die into a product of uniform shape under controlled conditions,
such as temperature, feed rate and pressure [1]. At the end of the eighteenth century, the
extrusion technique was originally invented for the manufacturing of lead pipes. Today, it is
widely applied in the plastic, rubber and food industry. In pharmaceutical manufacturing, the
technique is used to produce molecular dispersions of active pharmaceutical ingredients
(APIs) in various polymer and/or lipid matrices. The hot-melt extrusion process has proven to
be a viable method for the production of granules, pellets, tablets, suppositories, implants,
stents, transdermal systems, transmucosal systems and ophthalmic inserts [2], thereby
enhancing the dissolution rate and bioavailability of poorly soluble drugs, enabling
controlled or modified release of the drug, masking the bitter taste of several active
pharmaceutical ingredients and allowing the formulation of various thin films.
One of the advantages of the hot-melt extrusion technique, compared to the more
conventional pharmaceutical manufacturing processes, is its ability to be operated in a
continuous mode [3, 4]. The benefits of continuous manufacturing compared to batch
production are numerous [5-7]: no scale-up issues resulting in a shorter development time;
possible automation of the production line; reduction of production costs; faster product
release; less product variability and improved product quality. In contrast with the food and
chemical industry where continuous production processes are well established, the
pharmaceutical manufacturing industry currently primarily relies on batch wise production
[5], where product quality is assessed subsequent to each processing step using off-line,

CHAPTER 1 – INTRODUCTION AND OBJECTIVES
8
time-consuming analytical techniques on randomly collected samples to evaluate the end or
intermediate product quality.
Pharmaceutical production must be carried out in accordance with the Good Manufacturing
Practice (GMP) guidelines, which ensure that products should be consistently produced and
controlled to the quality standards appropriate to their intended use and as required by the
Marketing Authorization, Clinical Trial Authorization or product specification [8]. Recently,
the regulatory authorities began to encourage the transition from batch production to
continuous processing. The application of traditional off-line quality control methods would
annul the benefits inherent in continuous manufacturing, and therefore real-time, in-process
measurements of (intermediate) product quality are essential to sustain a continuous
production process. The Process Analytical Technology (PAT) guideline, proposed by the
Food and Drug Administration (FDA), presents a framework for the continuous monitoring
and control of pharmaceutical production processes [9]. Continuous manufacturing requires
a PAT monitoring and control strategy, to allow production according to the Quality by
Design (QbD) approach [10]. The ultimate purpose of PAT is to develop manufacturing
processes that can compensate for the variability in raw materials and in equipment, to
guarantee a consistent end-product quality, as required by the GMP guidelines. Therefore,
information on the critical quality attributes is gathered in real-time, to allow process
adjustments. PAT ensures that all sources of variability affecting a process are identified,
explained and managed.
Despite the increasing popularity of hot-melt extrusion as a pharmaceutical production
process, quality control is still performed off-line, and the process is more or less controlled
using standard, univariate process monitoring sensors such as temperature and pressure
probes. The data generated by these sensors does not suffice to assess the critical quality
attributes of the extrudates, and cannot ensure the development of an end product with
predefined and consistent quality characteristics. This thesis examines the application of
spectroscopic tools as process analytical techniques for the monitoring of critical quality
attributes such as API concentration, solid state and occurrence of polymer-drug interactions
during hot-melt extrusion, for the visualization of material behaviour in the process
environment and to improve the overall process understanding.

CHAPTER 1 – INTRODUCTION AND OBJECTIVES
9
In Chapter 2, a general overview of the principles of hot-melt extrusion, its advantages and
shortcomings for pharmaceutical production and an overview of the extrusion equipment
are provided. Chapter 3 summarizes the concept of PAT, and discusses the various process
analytical tools available for observation of critical process and product parameters which
are currently being applied in pharmaceutical hot-melt extrusion and in polymer extrusion.
Chapters 4 to 9 provide the results from the conducted experimental work. In Chapter 4, the
feasibility of Raman spectroscopy as a process analytical tool for in-line monitoring and
prediction of the API concentration and for monitoring of the physicochemical state of the
extrudates and possible interactions between polymers and drugs during hot-melt extrusion
was assessed. Raman spectra were collected in the extrusion die. A predictive PLS model was
developed for the in-line determination of the API concentration, and the manifestation of
peak broadening and shifts in the in-line collected Raman spectra was correlated to
differences in solid state and interactions between the API and the polymer during hot-melt
extrusion. Once the suitability of Raman spectroscopy to monitor and predict the API
concentration during hot-melt extrusion was verified, an improved API calibration model
was developed and a thorough validation method for drug quantification based on Raman
spectra collected in the extrusion die was applied (Chapter 5). The validation of the
developed method was based on the calculation of the accuracy profile, which allowed the
determination of the proportion of future measurements that will be found within preset
acceptance limits (a preset percentage of the relative bias, here set at 10%). Finally, the
uncertainty of the method was determined, and the robustness of the predictive model was
assessed via a design of experiments, where possible small fluctuations in process settings
were simulated.
In Chapter 6, the influence of variations in drug concentration, barrel temperature and
screw speed on the polymer-drug solid state and interactions throughout the entire
extrusion barrel was examined. A Raman probe was implemented in each section of the
extrusion barrel, to visualize and enhance the understanding of material behaviour during
hot-melt extrusion.

CHAPTER 1 – INTRODUCTION AND OBJECTIVES
10
The aim of the experiments performed in Chapter 7, was to create a method for the real-
time classification of extrudates according to their solid state, based on Raman spectroscopic
measurements collected in the extrusion die of a 12 mm twin-screw extruder. The influence
of variations in drug concentration, changes in barrel temperature and three different screw
configurations on the physicochemical state of the extrudates was assessed. Soft
independent modelling of class analogy was performed to develop a classification model
which allowed distinction between glassy solid solutions and crystalline dispersions of a
poorly soluble API in a polymer. Additionally, the effects on the Raman measurements of the
applied drug concentration, processing temperature and feeder performance, all resulting in
fluctuations in die pressure, were evaluated.
In Chapter 8, the suitability of NIR spectroscopy for the in-line determination of the drug
concentration, the polymer-drug solid state and molecular interactions was evaluated by
implementing an NIR probe in the extrusion die. A PLS model was developed for in-line API
concentration monitoring. The relationship between peak broadening, peak shifts, and
variations in physicochemical state of the extrudates was studied. The manifestation of new
peaks in the NIR spectra was used to determine the type of interactions occurring between
the selected polymer and API.
The aim of Chapter 9 was to evaluate the suitability of ultrasonic techniques as process
analytical tools for the in-line monitoring of the API concentration. A PLS model for API
quantification was developed based on the monitoring of torque, die pressure, ultrasonic
transit time and peak height of the ultrasound signal.

CHAPTER 1 – INTRODUCTION AND OBJECTIVES
11
1.2. REFERENCES
[1] J.W. McGinity, M.A. Repka, J.J. Koleng Jr., F. Zhang, Hot-Melt Extrusion Technology,
In: p. 2004-2020.
[2] M. Maniruzzaman, J.S. Boateng, M.J. Snowden, D. Douroumis, ISRN Pharm 2012
(2012) 1-9.
[3] Madan S, Madan S, Asian J Pharm Sci 7 (2012) 123-133.
[4] M.M. Crowley, F. Zhang, M.A. Repka, S. Thumma, S.B. Upadhye, S. Battu, J.W.
McGinity, C. Martin, Drug Dev Ind Pharm 33 (2007) 909-926.
[5] K. Plumb, Chem Eng Res Des 83 (2005) 730-738.
[6] C. Vervaet, J.P. Remon, Chem Eng Sci 60 (2005) 3949-3957.
[7] J.P. Remon, C. Vervaet, Continuous Processing of Pharmaceuticals. In: J. Swarbrick
(Ed.), Encyclopedia of Pharmaceutical Technology, third ed., Informa Healthcare USA,
Inc., New York, USA, 2007, p. 743-749.
[8] European Commission, EU Guidelines to Good Manufacturing Practice. Medicinal
Products for Human and Veterinary Use, Brussels, Belgium, 2010.
[9] Food and Drug Administration, Process Analytical Technology Initiative, Guidance for
Industry; PAT - A Framework for Innovative Pharmaceutical development,
Manufacturing and Quality Assurance, 2004.
[10] D. Rudd, Pharmacopoeial implications of continuous processes: new concepts
compared to batch processes, Presented at Process Analytical Technologies, May 3–
4, Cannes, France, 2004.

CHAPTER 1 – INTRODUCTION AND OBJECTIVES
12

CHAPTER 2 – HOT-MELT EXTRUSION AS A PHARMACEUTICAL PRODUCTION PROCESS
13
CHAPTER 2
HOT-MELT EXTRUSION AS A
PHARMACEUTICAL PRODUCTION
PROCESS
Parts of this chapter are published in:
L. Saerens, C. Vervaet, J.P. Remon, T. De Beer. Process monitoring and visualization solutions
for hot-melt extrusion: A review. Journal of Pharmacy and Pharmacology, doi:
10.1111/jphp12123 (2013).

CHAPTER 2 – HOT-MELT EXTRUSION AS A PHARMACEUTICAL PRODUCTION PROCESS
14

CHAPTER 2 – HOT-MELT EXTRUSION AS A PHARMACEUTICAL PRODUCTION PROCESS
15
CHAPTER 2
HOT-MELT EXTRUSION AS A
PHARMACEUTICAL PRODUCTION PROCESS
2.1. HOT-MELT EXTRUSION
HME is one of the most widely used processing techniques in the plastic and rubber
manufacturing industry and is extensively applied in the food processing industry. It is
defined as the process of pumping raw materials with a rotating screw through a die into a
product of uniform shape under controlled conditions, such as temperature, feed rate and
pressure [1, 2]. HME has potential to be applied in continuous manufacturing for a wide
variety of dosage forms and formulations, such as granules, pellets, tablets, capsules,
implants, suppositories, stents, transdermal and transmucosal systems and ophthalmic
inserts [3, 4]. In hot-melt extruded drug delivery systems, active pharmaceutical ingredients
(APIs) are embedded in a carrier, containing meltable materials and additional excipients.
These materials can be polymeric materials or thermodeformable waxes [5].
HME offers several advantages compared to conventional pharmaceutical production
processes [1, 3, 4, 6, 7] of solid dosage forms for certain formulations. Formulations
produced with HME often exhibit an enhanced bioavailability of poorly soluble drugs, due to
dispersion of the API at molecular level in the final dosage forms [8-10]. The molten
polymers can function as thermal binders and act as drug depots or drug release retardants,
hence allowing sustained, modified and targeted release. HME also allows masking of the
bitter taste of an API [11-13]. An improved content uniformity is obtained by the intense
agitation and distributive and dispersive mixing generated by the rotating screw and its
selected configuration, resulting in the de-aggregation of suspended particles in the molten

CHAPTER 2 – HOT-MELT EXTRUSION AS A PHARMACEUTICAL PRODUCTION PROCESS
16
polymer. The process is anhydrous, avoiding potential water-mediated drug degradation.
Exclusion of solvents in the production process decreases the number of processing steps
and eliminates the need for time-consuming drying steps. The extrudates can be cut into
tablets, hence eliminating tabletting issues caused by poor compressibility of the
formulation. An additional significant advantage is that HME is a continuous process. The
advantages of continuous production over traditional batch processes are numerous [14-16]:
less scale-up issues resulting in a shorter development time, possible automation of the
production line, reduction of production costs and waste, a reduced time-to-market, less
product variability and improved product quality.
During extrusion, all components in the formulation must be thermally stable at the selected
processing temperatures, which could limit the extrusion of thermosensitive APIs and
carriers. However, the residence time in a twin-screw extruder is relatively short, and the
temperature of each barrel segment can be controlled accurately. Downstream feeding of
thermolabile APIs (behind the kneading zone) can avoid degradation of these compounds
due to high temperatures caused by the shear forces generated by the rotating screw and its
screw design that are needed to melt the polymers. Hence, the exposure of the API to high
temperatures is reduced to a minimum. Another drawback of HME is related to the high
energy input from the shear forces in the extrusion barrel, leading to higher, uncontrolled
and unknown product temperatures, which could induce drug or polymer degradation,
having a significant impact on the product quality. This obstacle can be overcome by
adjusting the process parameters as well as the screw and die design [2].

CHAPTER 2 – HOT-MELT EXTRUSION AS A PHARMACEUTICAL PRODUCTION PROCESS
17
2.2. PROCESS AND EQUIPMENT
The equipment for HME comprises an extruder, downstream auxiliary equipment and
monitoring tools used for performance and product quality evaluation. The extruder itself
(Figure 2.1) consists of a feeding hopper, a temperature controlled barrel with one or two
screws, a screw-driving unit, a die to shape the final product and a heating/cooling device [2,
5]. A powder blend, typically containing the API, thermoplastic polymers or waxes as a
matrix carrier and other functional excipients (e.g. plasticizers, release modifying agents,
superdisintegrants, thickening agents, antioxidants, thermal lubricants, bulking agents and
miscellaneous additives [1, 2]), is fed through the feed hopper into the barrel. This barrel
usually contains different zones, each with a specific set barrel temperature. The rotating
screws within the barrel transport the powder blend towards the extrusion die. The powder
blend will melt primarily due to the heat generated by friction as the material is sheared
between the rotating screw(s) and the barrel wall, and additional heat is conducted from the
barrel [6]. This melt is then pumped through the die located at the end of the extrusion
barrel, and subjected to further downstream processing equipment.
The screw design has a significant influence on the efficiency of the HME process and on the
quality of the end product. Screw geometry directly affects the throughput, melting rate,
mixing, product temperature and homogeneity of the melt. Different screw configurations
allow downstream transport of the material in the barrel towards the extrusion die,
conveying, melting, mixing, venting or devolatilization, and pumping and compression of the
molten powder blend. Several types of screw elements are required to perform these tasks.
Conveying elements provide transport of the melt, either forward or backward. Different
mixing elements can also be included in the screw design. Their function, distributive or
dispersive mixing, is related to their geometry. Furthermore, they also play a key role in
transforming the API from its crystalline to its amorphous form [17]. A detailed overview of
all possible screw elements can be found in the literature [8, 18, 19].
In pharmaceutical HME, twin-screw extrusion is preferred over single-screw extrusion. In
twin-screw extrusion, the screws can rotate in the opposite direction (counter-rotating) or in

CHAPTER 2 – HOT-MELT EXTRUSION AS A PHARMACEUTICAL PRODUCTION PROCESS
18
the same direction (co-rotating), whichever is most favourable. Counter-rotating designs are
used when regions with very high shear are required. These extruder types allow potential
air entrapment, high pressure generation and low maximum screw speeds and output [1].
Co-rotating screws are often fully intermeshing, indicating that as the screws rotate, the
element on one screw wipes the element on the neighbouring screw, causing material to
transfer between both screws [6]. They can be operated at high screw speeds and deliver
high outputs, and offer better mixing and conveying of the melt. Other benefits related to
co-rotating screws are a shorter residence time, less tendency to overheat the materials, and
an easier material feed [6, 20].
Figure 2.1. Hot-melt extrusion equipment and process settings and parameters traditionally monitored during
pharmaceutical HME.(1. Feeding system 2. Feeding hopper 3. Temperature controlled barrel with 1 or 2 screws
4. Die 5. Heating and cooling device 6. Screw-driving unit).

CHAPTER 2 – HOT-MELT EXTRUSION AS A PHARMACEUTICAL PRODUCTION PROCESS
19
Several downstream processing devices are available for further cooling, cutting and shaping
of the hot-melt extruded strands. Cooling of the extrudates can be accomplished with air,
nitrogen, in water or simply at room temperature on conveyor belts or rolls. Film extrusion
on chilled rolls or calenders has been applied for the manufacturing of films for oral
administration [21-27] and transdermal drug delivery [28, 29]. Calendering allows
continuous shaping of the melt and solidification into tablet- or capsule-like forms [30].
Injection moulding is a downstream process step where the melt is injected into a closed
mould under high pressure and temperature conditions after leaving the extrusion die. An
overview of the applications of injection moulding for drug delivery is presented in [31].
Another possibility of shaping the extruded strands is by cutting them into small pellets using
pelletizers [32-34].
Nowadays, extruders are equipped with standard (univariate) process monitoring sensors.
These traditional monitoring options provide information on barrel and die temperatures,
feed rate or throughput, screw speed, torque and drive amperage, melt pressure, melt
temperature and possibly melt viscosity [1, 35] (Figure 2.1). Classical process control based
on measurements of these conventional parameters is in many cases not sufficient to
account for process-induced variations in material properties, to guarantee stable processing
and to monitor and predict the quality attributes of the extrudates.

CHAPTER 2 – HOT-MELT EXTRUSION AS A PHARMACEUTICAL PRODUCTION PROCESS
20
2.3. REFERENCES
[1] M.M. Crowley, F. Zhang, M.A. Repka, S. Thumma, S.B. Upadhye, S. Battu, J.W.
McGinity, C. Martin, Drug Dev Ind Pharm 33 (2007) 909-926.
[2] Madan S, Madan S, Asian J Pharm Sci 7 (2012) 123-133.
[3] M.A. Repka, S. Battu, S.B. Upadhye, S. Thumma, M.M. Crowley, F. Zhang, C. Martin,
J.W. McGinity, Drug Dev Ind Pharm 33 (2007) 1043-1057.
[4] M.A. Repka, S. Majumdar, S. Battu, R. Srirangam, S.B. Upadhye, Expert Opin Drug
Deliv 5 (2008) 1357-1376.
[5] J.W. McGinity, M.A. Repka, J.J. Koleng Jr., F. Zhang, Hot-Melt Extrusion Technology,
In: J. Swarbrick (Ed.), Encyclopedia of Pharmaceutical Technology, third ed., Informa
Healthcare USA, Inc., New York, USA, 2007, p. 2004-2020.
[6] J. Breitenbach, Eur J Pharm Biopharm 54 (2002) 107-117.
[7] C. Martin, Pharm Tech 32 (2008) 76-86.
[8] K. Kolter, M. Karl, A. Gryczke, Hot-Melt Extrusion with BASF Pharma Polymers:
Extrusion Compendium, 2nd ed., BASF SE Pharma Ingredients and Services,
Ludwigshafen, Germany, 2012.
[9] K. Dhirendra, S. Lewis, N. Udupa, K. Atin, Pak J Pharm Sci 22 (2009) 234-246.
[10] T. Vasconcelos, B. Sarmento, P. Costa, Drug Discov Today 12 (2007) 1068-1075.
[11] A. Michalk, V.R. Kanikanti, H.J. Hamann, P. Kleinebudde, J Control Release 132 (2008)
35-41.
[12] R. Witzleb, V.R. Kanikanti, H.J. Hamann, P. Kleinebudde, Eur J Pharm Biopharm 77
(2011) 170-177.
[13] A. Gryczke, S. Schminke, M. Maniruzzaman, J. Beck, D. Douroumis, Colloids Surf, B 86
(2011) 275-284.
[14] K. Plumb, Chem Eng Res Des 83 (2005) 730-738.
[15] C. Vervaet, J.P. Remon, Chem Eng Sci 60 (2005) 3949-3957.
[16] J.P. Remon, C. Vervaet, Continuous Processing of Pharmaceuticals. In: J. Swarbrick
(Ed.), Encyclopedia of Pharmaceutical Technology, third ed., Informa Healthcare USA,
Inc., New York, USA, 2007, p. 743-749.

CHAPTER 2 – HOT-MELT EXTRUSION AS A PHARMACEUTICAL PRODUCTION PROCESS
21
[17] K. Nakamichi, T. Nakano, H. Yasuura, S. Izumi, Y. Kawashima, Int J Pharm 241 (2002)
203-211.
[18] H.F. Giles Jr., J.R. Wagner Jr., E.M. Mount III, Extrusion: The Definitive Processing
Guide and Handbook, 1st ed., William Andrew, Inc., New York, USA, 2005.
[19] K. Kohlgrüber, Co-Rotating Twin-Screw Extruders: Fundamentals: Technology, and
Applications, 1st ed., Carl Hanser Verlag, München, Germany, 2008.
[20] G.P. Andrews, D.S. Jones, O. Abu Diak, D.N. Margetson, Pharm Tech 21 (2009) 18-23.
[21] J.O. Morales, J.T. McConville, Eur J Pharm Biopharm 77 (2011) 187-199.
[22] F. Cilurzo, I.E. Cupone, P. Minghetti, F. Selmin, L. Montanari, Eur J Pharm Biopharm
70 (2008) 895-900.
[23] S.V. Tumuluri, S. Prodduturi, M.M. Crowley, S.P. Stodghill, J.W. McGinity, M.A. Repka,
B.A. Avery, Drug Dev Ind Pharm 30 (2004) 505-511.
[24] V.S. Tumuluri, M.S. Kemper, I.R. Lewis, S. Prodduturi, S. Majumdar, B.A. Avery, M.A.
Repka, Int J Pharm 357 (2008) 77-84.
[25] P.K. Mididoddi, M.A. Repka, Eur J Pharm Biopharm 66 (2007) 95-105.
[26] S. Prodduturi, R.V. Manek, W.M. Kolling, S.P. Stodghill, M.A. Repka, J Pharm Sci 94
(2005) 2232-2245.
[27] M.A. Repka, K. Gutta, S. Prodduturi, M. Munjal, S.P. Stodghill, Eur J Pharm Biopharm
59 (2005) 189-196.
[28] C. AitkenNichol, F. Zhang, J.W. McGinity, Pharm Res 13 (1996) 804-808.
[29] M.M. Crowley, A. Fredersdorf, B. Schroeder, S. Kucera, S. Prodduturi, M.A. Repka,
J.W. McGinity, Eur J Pharm Sci 22 (2004) 409-418.
[30] W. Roth, B. Setnik, M. Zietsch, A. Burst, J. Breitenbach, E. Sellers, D. Brennan, Int J
Pharm 368 (2009) 72-75.
[31] L. Zema, G. Loreti, A. Melocchi, A. Maroni, A. Gazzaniga, J Control Release 159 (2012)
324-331.
[32] E. Roblegg, E. Jäger, A. Hodzic, G. Koscher, S. Mohr, A. Zimmer, J. Khinast, Eur J Pharm
Biopharm 79 (2011) 635-645.
[33] A. Kalivoda, M. Fischbach, P. Kleinebudde, Int J Pharm 439 (2012) 145-156.
[34] C.R. Young, J.J. Koleng, J.W. McGinity, Int J Pharm 242 (2002) 87-92.
[35] R. Chokshi R, H. Zia, Iran J Pharm Res 3 (2004) 3-16.

CHAPTER 2 – HOT-MELT EXTRUSION AS A PHARMACEUTICAL PRODUCTION PROCESS
22

CHAPTER 3 – PROCESS MONITORING AND VISUALIZATION SOLUTIONS FOR HOT-MELT EXTRUSION
23
CHAPTER 3
PROCESS MONITORING AND
VISUALIZATION SOLUTIONS FOR HOT-
MELT EXTRUSION
Parts of this chapter are published in:
L. Saerens, C. Vervaet, J.P. Remon, T. De Beer. Process monitoring and visualization solutions
for hot-melt extrusion: A review. Journal of Pharmacy and Pharmacology, doi:
10.1111/jphp12123 (2013).

CHAPTER 3 – PROCESS MONITORING AND VISUALIZATION SOLUTIONS FOR HOT-MELT EXTRUSION
24

CHAPTER 3 – PROCESS MONITORING AND VISUALIZATION SOLUTIONS FOR HOT-MELT EXTRUSION
25
CHAPTER 3
PROCESS MONITORING AND VISUALIZATION
SOLUTIONS FOR HOT-MELT EXTRUSION
3.1. INTRODUCTION
Process analytical tools for pharmaceutical HME are required for two purposes: (i) improving
the understanding of pharmaceutical HME by monitoring and visualizing material behaviour
during processing (an enhanced understanding of the process and the material behaviour
allows optimization of formulations, process settings such as screw configuration etc.); and
(ii) monitoring and analyzing critical product and process parameters for process control,
allowing to maintain a desired process state and guaranteeing the quality of the end
product.
The implementation of suitable process analytical tools in HME will enable the “Quality by
design” (QbD) approach introduced by the Food and Drug Administration (FDA). The Process
Analytical Technology (PAT) concept encourages continuous monitoring and control of
pharmaceutical production processes based on timely measurements of critical quality and
performance attributes of raw and in-process materials and processes [1]. A thorough
knowledge of product performance over a range of material attributes, manufacturing
process options and process parameters is requested in the ICH Q8 guideline [2], and this
understanding can be gained by the application of PAT. Continuous manufacturing cannot
rely on the currently applied quality control methods for intermediate or end products which
are mainly based on time-consuming and off-line analytical techniques, and annul the
advantages of continuous pharmaceutical production. In-process monitoring, analysis and
control of the critical process and product parameters are essential to constantly ensure
end-product quality during continuous manufacturing. Continuous manufacturing processes,

CHAPTER 3 – PROCESS MONITORING AND VISUALIZATION SOLUTIONS FOR HOT-MELT EXTRUSION
26
like HME, are made for continuous process control [3]. They adapt easily to QbD and Design
of Experiments (DOE) investigations can be performed by changing process parameters
within one experimental run. By implementing process analyzers or PAT tools, real-time
information on physical or chemical material properties is obtained, which can be utilized in
process control systems to steer the process towards a desired state, to allow real-time
release or for scale-up of the production process. The implementation of PAT strategies in
HME is valuable both in commercial manufacturing and in the development scale.

CHAPTER 3 – PROCESS MONITORING AND VISUALIZATION SOLUTIONS FOR HOT-MELT EXTRUSION
27
3.2. PROCESS ANALYTICAL TECHNOLOGY
Conventional pharmaceutical manufacturing is generally accomplished using batch
processing followed by time-consuming, expensive and inefficient off-line laboratory testing
on randomly collected samples to evaluate the end product quality. The processes
themselves are not fully understood and are often inefficient black-boxes. Therefore, the
FDA has introduced the concept of PAT [1].
PAT is defined as “a system for designing, analyzing and controlling manufacturing through
timely measurements (i.e. during processing) of critical quality and performance attributes
of raw and in- process materials and processes, with the goal of ensuring final product
quality” [1]. The objective of PAT is to improve process understanding and to control the
manufacturing process, and thus to design and develop well understood processes that will
compensate for the variability in raw materials and in equipment, thereby consistently
ensuring a predefined quality at the end of the manufacturing process. Quality should not be
tested into products, it should be built-in, to improve the efficiency of the process, and
reduce risks to quality and regulatory concerns. When implementing this QbD paradigm in
pharmaceutical manufacturing, PAT strategies are used to reduce identified manufacturing
risks associated with product quality. An appropriate combination of several PAT tools
provides relevant information concerning the critical sources of variability during
manufacturing, allowing real-time, continuous analysis of manufacturing processes and
enabling process control and optimization. In the PAT framework, these tools are
categorized as followed [1]:
- Multivariate tools for design, data acquisition and analysis
There are many development strategies that can be used to identify optimal formulations
and processes. These tools enable the identification and evaluation of product and process
variables that may be critical to product quality and performance. Additionally, they allow
the identification of potential failure modes and mechanisms and the quantification of their
effects on product quality.
CHAPTER 3 – PROCESS MONITORING AND VISUALIZATION SOLUTIONS FOR HOT-MELT EXTRUSION
28
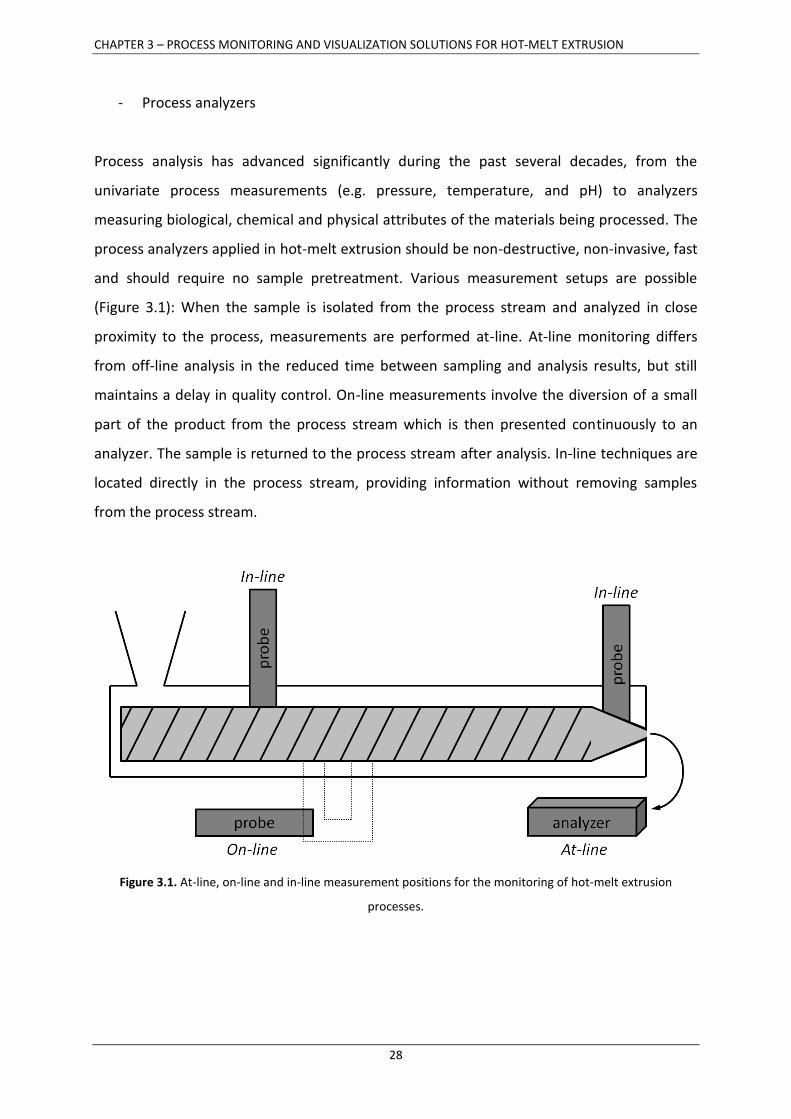
- Process analyzers
Process analysis has advanced significantly during the past several decades, from the
univariate process measurements (e.g. pressure, temperature, and pH) to analyzers
measuring biological, chemical and physical attributes of the materials being processed. The
process analyzers applied in hot-melt extrusion should be non-destructive, non-invasive, fast
and should require no sample pretreatment. Various measurement setups are possible
(Figure 3.1): When the sample is isolated from the process stream and analyzed in close
proximity to the process, measurements are performed at-line. At-line monitoring differs
from off-line analysis in the reduced time between sampling and analysis results, but still
maintains a delay in quality control. On-line measurements involve the diversion of a small
part of the product from the process stream which is then presented continuously to an
analyzer. The sample is returned to the process stream after analysis. In-line techniques are
located directly in the process stream, providing information without removing samples
from the process stream.
Figure 3.1. At-line, on-line and in-line measurement positions for the monitoring of hot-melt extrusion
processes.

CHAPTER 3 – PROCESS MONITORING AND VISUALIZATION SOLUTIONS FOR HOT-MELT EXTRUSION
29
- Process control tools
The application of process monitoring and control strategies enables monitoring of the state
of a process and actively manipulating it to maintain a desired state. Consequently, final
product quality can be guaranteed, end product characteristics can be predicted and real-
time release can be ensured, hence avoiding batch losses.
- Continuous improvement and knowledge management tools.
Over the life cycle of a product, continuous data collection and analysis are essential to
improve understanding of the process and product, and to justify proposals for post-
approval changes.
An overview of the applied process analytical tools for pharmaceutical HME discussed in this
chapter can be found in Table 3.1, together with their purpose, interfacing possibilities,
challenges and disadvantages encountered during implementation. Table 3.2 provides an
overview of the reviewed HME process analytical tools used in polymer extrusion with
relevant potential for monitoring and control of pharmaceutical HME. Their purpose,
possible benefits and shortcomings for pharmaceutical HME and interface positions are also
listed in Table 3.2. The reported possible drawbacks of each technique applied in
pharmaceutical extrusion and polymer extrusion should be taken into account when
considering application of these tools for analysis, understanding and control of
pharmaceutical HME processes.

CHAPTER 3 – PROCESS MONITORING AND VISUALIZATION SOLUTIONS FOR HOT-MELT EXTRUSION
30
3.3. PROCESS ANALYTICAL TECHNIQUES APPLIED FOR PHARMACEUTICAL
HOT-MELT EXTRUSION
3.3.1. NIR spectroscopy
Tumuluri et al. [4] applied NIR spectroscopy to predict the clotrimazole quantity in hot-melt
extruded polyethylene oxide (PEO) films via a developed partial least squares (PLS) model. A
fibre-optic NIR reflectance probe was fixed above the extruded films, behind the extrusion
die. Vector normalization of the spectra was performed to reduce the variations in intensity
caused by path length variation. Extrusion was performed on a single-screw extruder. The
calibration model, containing 9 different PEO films with varying clotrimazole content,
regressing the on-line collected NIR spectra versus the actual clotrimazole content as
determined with high-performance liquid chromatography (HPLC), yielded a root mean
square error of cross validation (RMSECV) of 0.298% (w/w). Four validation samples were
predicted within a margin of error of less than 3.5% (w/w). It was shown that the model was
more accurate for predictions at higher concentrations.
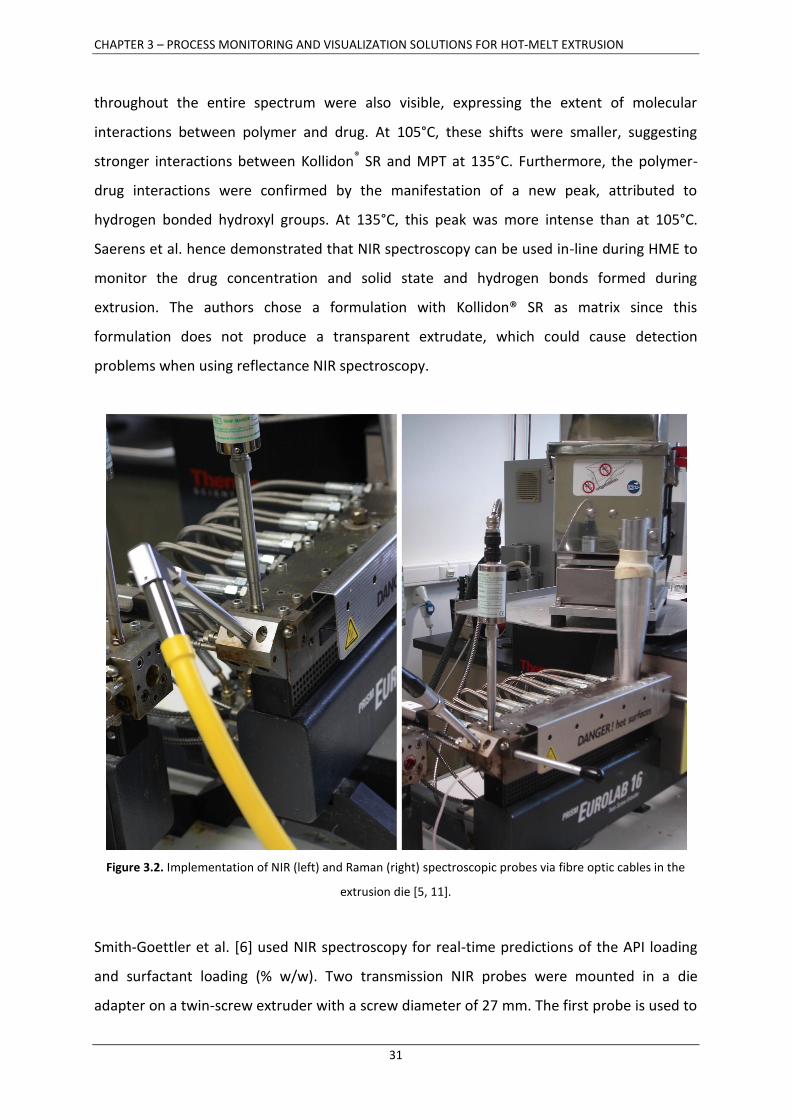
Saerens et al. [5] implemented a diffuse reflectance NIR probe in the extrusion die of a co-
rotating twin-screw extruder (screw diameter = 16 mm) (Figure 3.2) to monitor and predict
drug content and to evaluate the physicochemical state of the extrudates before exiting the
die. A PLS model was built, regressing the in-line NIR spectra collected during extrusion of
physical mixtures containing 20, 30 and 40% (w/w) metoprolol tartrate (MPT) in Kollidon® SR
(BASF, Ludwigshafen, Germany) versus the known MPT concentrations. The model was
validated with new extrusion experiments, resulting in a root mean square error of
prediction (RMSEP) of 1.54% (w/w).
Furthermore, a physical mixture with a drug load of 40% MPT (w/w) in Kollidon® SR was
extruded at 135°C and at 105°C. The in-line NIR spectra were compared to the NIR spectrum
of the physical mixture. The spectra of both extrudates still contained the MPT peaks,
though broader, indicating that not all MPT remained in its crystalline form. This broadening
of spectral bands was slightly more pronounced at 135°C than at 105°C. Peak shifts
CHAPTER 3 – PROCESS MONITORING AND VISUALIZATION SOLUTIONS FOR HOT-MELT EXTRUSION
31
throughout the entire spectrum were also visible, expressing the extent of molecular
interactions between polymer and drug. At 105°C, these shifts were smaller, suggesting
stronger interactions between Kollidon® SR and MPT at 135°C. Furthermore, the polymer-
drug interactions were confirmed by the manifestation of a new peak, attributed to
hydrogen bonded hydroxyl groups. At 135°C, this peak was more intense than at 105°C.
Saerens et al. hence demonstrated that NIR spectroscopy can be used in-line during HME to
monitor the drug concentration and solid state and hydrogen bonds formed during
extrusion. The authors chose a formulation with Kollidon® SR as matrix since this
formulation does not produce a transparent extrudate, which could cause detection
problems when using reflectance NIR spectroscopy.
Figure 3.2. Implementation of NIR (left) and Raman (right) spectroscopic probes via fibre optic cables in the
extrusion die [5, 11].
Smith-Goettler et al. [6] used NIR spectroscopy for real-time predictions of the API loading
and surfactant loading (% w/w). Two transmission NIR probes were mounted in a die
adapter on a twin-screw extruder with a screw diameter of 27 mm. The first probe is used to

CHAPTER 3 – PROCESS MONITORING AND VISUALIZATION SOLUTIONS FOR HOT-MELT EXTRUSION
32
send the light through the melt, and on the opposite side of the melt channel, a second
probe captures this signal and sends it to the detector. 20 calibration mixtures for the
development of a PLS model and six independent validation mixtures with varying API (0-
30.1% w/w) and surfactant (4.8-27.0% w/w) concentrations were extruded with an output
varied from 20 kg/h to 35 kg/h. Bands specific for the amorphous API were found in the
spectra of the extrudates, indicating that changes in the solid state of the API had occurred.
The API loading prediction model yielded an RMSEP of 0.3% w/w. The surfactant loading
prediction model yielded an RMSEP of 0.6% w/w. These predictions were then used for fault
detection, isolation of suspect material and real-time troubleshooting during HME using the
SIPAT software package (Siemens nv/sa, Brussels, Belgium). When a drift in the API loading,
due to a change in API lots with different bulk densities, was detected, the molten extrudate
stream was diverted to waste. Process parameters regarding the material feeders were
investigated, and the material continued to be diverted to waste until the feeder reached
steady state. In this research, NIR spectroscopy was hence applied for quantitative
monitoring and control of the extrusion process.
McKelvey et al. [7] illustrated the use of transmission NIR spectroscopy to study the impact
of process design and scale up on residence time distributions (RTDs) and on composition
disturbances caused by feeding issues. RTD measurements as a function of screw speed and
feed rate were performed on a co-rotating twin-screw extruder with a screw diameter of 16
mm, by adding a single drop of blue food colouring to the extruder feed inlet and measuring
the optical response at the die adapter. This RTD fingerprint was used to assess the ability to
scale from the 16 mm to a 27 mm co-rotating twin-screw extruder, using the ratio of free
volumes in the extruders (3.63) to adjust the feed rate from 2.75 kg/h to 10 kg/h. In the 27
mm extruder, each component of the mixture (compound ‘C’, a surfactant and polyvinyl
pyrrolidone-polyvinyl acetate copolymer) was fed individually, and NIR spectroscopy was
used to monitor the composition of this melt during extrusion. A die block adapter was
designed to accommodate the transmission optical probes. A predictive model based on
feeder input parameters was used to determine the melt composition and was compared to
the real-time concentration measurements with NIR spectroscopy. This model can be used
to control the feeding system and to isolate bad product. The transmission NIR spectroscopic
tool presented here was successful in measuring RTDs and formulation composition at the

CHAPTER 3 – PROCESS MONITORING AND VISUALIZATION SOLUTIONS FOR HOT-MELT EXTRUSION
33
extrusion die, providing possibilities for scale-up of the process and optimization with limited
amounts of material and time.
Troup et al. [8] described the development and implementation of an in-line transmission
NIR measurement system allowing the determination of the composition of a multi-
component melt stream at the exit of a twin-screw extruder. NIR measurements were
performed in a custom built die adapter on a 27 mm twin-screw extruder. Two loss-in-
weight mass feeders were used to feed the polymer and drug separately into the extruder. A
liquid surfactant was fed into the process using a gear pump. Data from the mass feeders
and liquid addition system were also logged. Using a PLS model, NIR spectroscopy allowed
the simultaneous prediction of the concentration of all three components in the extrudate.
The used spectral range was the 1600 – 1800 nm region since all three components have
chemical groups with strong absorbance in this region, and since this range is robust to
moisture variability. In routine manufacturing, the NIR system demonstrated to be able to
detect process upsets and to continuously ensure product uniformity over the entire
manufacturing run.
A different application of pharmaceutical HME is the production of cocrystals. Kelly et al. [9]
used NIR spectroscopy to monitor the formation of ibuprofen and nicotinamide cocrystals
during extrusion based solvent free continuous cocrystallization. The cocrystallization of
ibuprofen and nicotinamide in a 1:1 molar ratio was carried out in a co-rotating twin-screw
extruder with a screw diameter of 16 mm. A high temperature NIR reflectance probe with a
sapphire window was fitted into a threaded port at the end of the extruder barrel. Off-line
NIR spectra were taken at several points along the extruder screws to examine the dynamics
of the cocrystal formation. The formation of cocrystals occurred mainly in the latter stages of
the extruder screw, suggesting that cocrystal formation is highly dependent on the length of
the screws, residence time and shear caused by the mixing elements across the length of the
screw. The effects of three different screw configurations with different mixing intensities
(low, medium and high) dependent on the number and angle of mixing elements, the set
temperature profiles and the screw speeds were evaluated. NIR spectra from cocrystals
showed significant differences to those from the physical mixture. Once ibuprofen and
nicotinamide are bonded together, the vibrations are modified and the peaks shift, giving

CHAPTER 3 – PROCESS MONITORING AND VISUALIZATION SOLUTIONS FOR HOT-MELT EXTRUSION
34
rise to the appearance of new peaks in the NIR spectrum. The high mixing intensity screw
configuration (the screw design comprising the most mixing elements at an angle of 90°)
resulted in the most significant spectral changes compared to the spectrum of the physical
mixture. Increasing the set temperature at a screw speed of 30 rpm induced similar spectral
changes as increasing the mixing intensity of the screw configuration. Relatively small
spectral changes were observed when varying the screw speed (20, 30 and 40 rpm) at 90°C
using the high intensity screw configuration. A PLS model, regressing the in-line NIR spectra
against cocrystal purity as determined from X-ray diffraction (XRD), was developed using a
dataset including only the spectra obtained at a set temperature of 90°C with medium and
high screw intensity configurations, since temperature is a well known factor influencing the
NIR spectral signals. It was expected that calibrations over multiple temperature
configurations would not give accurate results. A correlation coefficient of 0.999 for
measured and predicted purity was obtained.
NIR spectroscopy has demonstrated to be a versatile process analysis tool for
pharmaceutical HME to monitor several critical product characteristics such as quantitative
formulation composition, solid state, polymer-drug interactions and the formation of
cocrystals (Table 3.1). Besides the application for monitoring purposes, it was also applied to
control API levels adequately. NIR spectroscopy can be applied in both reflectance and
transmission mode, depending on the type of formulation used. For transparent
formulations, the transmission mode is favoured, since spectra collected in reflection mode
contain more noise. Interpretation of the collected NIR spectra can be a challenging task
since they contain broad, overlapping overtones and combination bands. However, with the
proper chemometric techniques, the relevant information can be extracted from NIR
spectra.

CHAPTER 3 – PROCESS MONITORING AND VISUALIZATION SOLUTIONS FOR HOT-MELT EXTRUSION
35
Table 3.1. Process analytical tools applied in pharmaceutical hot-melt extrusion
Process analytical
tool
Interface In-line or on-
line
application [1]
Purpose Reported challenges/disadvantages/shortcomings References
Near infrared (NIR)
spectroscopy:
reflection
die in-line monitoring of drug
concentration
not possible to monitor a transparent formulation (low
signal/noise ratio)
[5]
post die on-line monitoring of drug
concentration
variations in path length cause variations in signal intensity,
normalization is required
[4]
die in-line monitoring of
cocrystal production
temperature influence on NIR measurements: the correlation
improved when temperature variation was excluded from the
dataset
[9]
die in-line monitoring of solid
state and polymer-
drug interactions
not possible to monitor a transparent formulation (low
signal/noise ratio) [5]
[5, 12]
NIR spectroscopy:
transmission
die in-line monitoring of drug
concentration
- [6-8]
die in-line monitoring of
surfactant
concentration
- [6-8]
die in-line monitoring of
residence time
distribution (RTD)
- [7]
die in-line identification of
feeding disturbances
- [6-8]

CHAPTER 3 – PROCESS MONITORING AND VISUALIZATION SOLUTIONS FOR HOT-MELT EXTRUSION
36
Table 3.1. Process analytical tools applied in pharmaceutical hot-melt extrusion (continued)
Process analytical
tool
Interface In-line or on-
line
application [1]
Purpose Reported challenges/disadvantages/shortcomings References
Raman
spectroscopy
die in-line monitoring of drug
concentration
difficulties with collecting spectra from a non-transparent melt
[5], resulting in a high background signal
[11]
post die on-line monitoring of drug
concentration
film undulation caused differences in path length resulting in
variations in signal intensity, normalization is required
[10]
die in-line monitoring of solid
state and polymer-
drug interactions
difficulties with collecting spectra from a non-transparent melt
[5], resulting in a high background signal
[11, 12]
die in-line monitoring of
complex formation
by an acid-base
reaction
- [14]
barrel
segments
in-line monitoring of solid
state and polymer-
drug interactions
sapphire probe window provides peaks in Raman spectrum
when window is not completely covered by sample
[13]
Motor load motor in-line monitoring of
surfactant
concentration
- [15]

CHAPTER 3 – PROCESS MONITORING AND VISUALIZATION SOLUTIONS FOR HOT-MELT EXTRUSION
37
3.3.2. Raman spectroscopy
Tumuluri et al. [10] used Raman spectroscopy to quantify the drug load in hot-melt extruded
films and to evaluate the physical state of the APIs in the formulations. A fibre optic Raman
probe was used for on-line analysis and clamped above the film in a 90° angle behind the
extrusion die. Clotrimazole and ketoprofen were used as model APIs and extruded in PEO
films on a single-screw extruder. Two PLS models were developed regressing the on-line
collected Raman spectra against the known concentration of each API. For both PLS models,
normalization to a peak for PEO was performed to allow quantification. A challenge was the
undulation of the film, resulting in different path lengths between the extruded film and the
Raman probe. This was corrected by using the ratio of the active band to the polymer band.
Saerens et al. [11] used a Raman probe implemented in the extrusion die of a co-rotating
twin-screw extruder (screw diameter = 16 mm) (Figure 3.2) to monitor and predict the drug
content and to evaluate the physicochemical state of the extrudates before exiting the die. A
PLS model was built, regressing in-line Raman spectra collected during extrusion of physical
mixtures containing 10, 20, 30 and 40% (w/w) MPT in Eudragit® RL PO (Evonik, Darmstadt,
Germany) versus the known MPT concentrations. The model was validated with
independent test extrusion runs, and resulted in an RMSEP of 0.59% (w/w). Furthermore,
two physical mixtures containing 10% (mixture A) and 40% (mixture B) MPT (w/w) in
Eudragit® RS PO (Evonik, Darmstadt, Germany) were extruded at temperatures of 140°C and
105°C, respectively. The in-line Raman spectra were compared to the Raman spectrum of
the physical mixtures. In both extrudates, peak shifts occurred, indicating interactions
through hydrogen bonds between polymer and drug. The shifts were larger in the extrudates
of mixture A, indicating stronger interactions. Evidence was found for the formation of
hydrogen bonds between the hydroxyl and/or amino groups from MPT and the carbonyl
groups belonging to the polymer. The MPT peaks in the extrudates of mixture B are still well
defined, sharp peaks, whereas for mixture A, they have broadened extensively, showing the
presence of amorphous MPT. Raman spectroscopy allowed differentiation between solid
states of the drug and formulation, and was able to accurately predict drug concentration
during HME.

CHAPTER 3 – PROCESS MONITORING AND VISUALIZATION SOLUTIONS FOR HOT-MELT EXTRUSION
38
Almeida et al. [12] extruded physical mixtures containing MPT and ethylene vinylacetate
(EVA) (50:50) on a co-rotating twin-screw extruder (16 mm). Diffuse reflectance NIR
spectroscopy and Raman spectroscopy were implemented in the die to evaluate the material
behaviour at a molecular level in-line as a function of the process settings (temperature: 90,
110 and 140°C; screw speed: 90 and 110 rpm). Principal component analysis (PCA) was
performed on all in-line collected Raman spectra. The first principal component (PC)
captured 60% of the spectral variation, induced by differences in polymer/drug solid state
caused by the variation in applied extrusion temperatures. An increased process
temperature induced a loss in drug crystallinity. Extrusion of the physical mixtures at 90°C
and 110°C provided Raman spectra characterized by sharp MPT bands, indicating that (the
majority of) the MPT was crystalline. When the extrusion temperature was increased to
140°C, broadening of the MPT peaks in the spectrum confirmed the melting of the drug.
Evidence for interactions (hydrogen bonds) between the drug and polymer, induced by a
higher processing temperature, was found. Increasing the screw speed did not result in peak
shifts in the Raman spectrum. Besides Raman spectroscopy, diffuse reflectance NIR
spectroscopy was also applied for the in-line monitoring of the extrusion process. PCA of the
NIR data led to similar conclusions as the Raman spectra. NIR spectroscopy confirmed the
formation of hydrogen bonds by the manifestation of an extra peak at 6500cm-1, attributed
to the first overtone of the hydrogen bonded hydroxyl group. NIR and Raman spectroscopy
hence provided complementary information concerning the manifestation of hydrogen
bonds between polymer and drug in this formulation.
Only one application of spectroscopic in-barrel monitoring has been illustrated [13]. To
improve the understanding of material behaviour in the barrel, a Raman probe was
implemented in each section of the barrel. MPT concentration (10 and 40% w/w in Eudragit®
RS PO), extrusion temperature (100, 120 and 140°C) and screw speed (80 and 160 rpm) were
varied to examine their influence on polymer/drug solid state throughout the entire barrel.
When extruding the formulation with 40% (w/w) MPT, broadening of MPT peaks indicated
melting of MPT between sections 2 and 3, caused by the first kneading zone (Figure 3.3).
Decreasing the concentration to 10% w/w showed an additional spectral difference (i.e.,
peak shifts indicating interactions between MPT and carrier) between sections 5 and 6, due
to formation of a solid solution. At a 10% (w/w) MPT load, increasing the extrusion

CHAPTER 3 – PROCESS MONITORING AND VISUALIZATION SOLUTIONS FOR HOT-MELT EXTRUSION
39
temperature did not influence the solid state or the barrel section where the final solid state
is obtained. At a drug load of 40% (w/w), the solid state of the end product was reached
further down the barrel when extrusion was performed at a lower barrel temperature.
Doubling the screw speed when processing a 10% MPT formulation (w/w) did not affect the
product solid state. In contrast, for a 40% (w/w) drug load, the section where the final
product solid state was obtained, was situated earlier in the barrel when applying a higher
screw speed. To conclude, the Raman spectra provided real-time information about
polymer/drug behaviour throughout the entire extrusion barrel, facilitating process
visualisation and understanding. Twin-screw extrusion is a starve-fed process where most
screw elements are not completely filled with material. This presents a challenge in
positioning the Raman probe, since the distance between probe and measured material
varies throughout processing. This variation in distance creates an undesired source of
spectral variability which needs to be filtered out.
Figure 3.3. Detail of the Raman spectra collected in barrel sections 2 and 3 during extrusion of mixtures with
40% MPT (w/w) with all screw speed settings at a) 100°C and b) 140°C [13].
CHAPTER 3 – PROCESS MONITORING AND VISUALIZATION SOLUTIONS FOR HOT-MELT EXTRUSION
40
Kindermann et al. [14] used Raman spectroscopy for the monitoring of the formation of
polyelectrolyte complexes composed of poorly water-soluble acid drugs (naproxen and
furosemide) and basic polymethacrylates (Eudragit® E PO) by an acid base-reaction during
HME. Physical mixtures of naproxen and Eudragit® E PO were pre-blended in a mixer and
subsequently hot-melt extruded with a co-rotating twin-screw extruder (screw diameter =
27 mm). A Raman spectrometer was equipped with an extruder-compatible probe. The
authors do not mention the exact location of implementation of the probe. Raman
spectroscopy was used to characterize the drug-polyelectrolyte interaction. The Raman band
representing the symmetric stretch vibration of the carbonyl group of naproxen was found
in the pure naproxen and in the physical mixture, but disappeared in the spectra of the
extrudates, confirming the acid-base-reaction and complex formation in the melt.
Similar to NIR spectroscopy, Raman spectroscopy can be used as a process analytical tool to
monitor component concentrations, solid state and intermolecular interactions that might
occur during extrusion (Table 3.1). Both techniques are complementary, and depending on
the formulation used for extrusion, one technique will be more suitable than the other.
Raman spectra are influenced by fluorescence and colour in the formulation, which might
cause difficulties due to a high background signal. These can however be (partly) overcome
by changing the type of laser.
3.3.3. Monitoring of torque and power consumption
Schilling et al. [15] determined the influence of the plasticizer citric acid on the processability
of Eudragit® RS PO during single-screw extrusion. The process parameters screw speed and
motor load were monitored as a function of citric acid (CA) content and the preset
temperature in the die. The quotient of the maximum applicable screw speed divided by the
measured load at a given temperature was calculated for each CA level. This quotient was
then interpreted as an index of processability of the formulation at the preset die
temperature. Improved processability due to plasticization was reflected by high quotients
at lower temperatures. Improved processability of a powder blend by plasticization of the
polymer yielded a higher screw speed and a lower motor load at a predefined temperature.
A temperature of 140°C was needed to extrude the pure polymer with a screw speed of 20

CHAPTER 3 – PROCESS MONITORING AND VISUALIZATION SOLUTIONS FOR HOT-MELT EXTRUSION
41
rpm, while blends containing citric acid monohydrate (CA MH) could be processed at
temperatures from 110°C to 130°C. The screw speed/motor load quotient significantly
increased when the CA MH concentration was increased from 0 to 10, 15, 20 and 25% (w/w).
This indicated a decrease in melt viscosity and enabled extrusion at lower temperatures. The
absence of a statistically significant difference between 25 and 30% (w/w) CA MH suggested
that the plasticizing effect plateaued at this concentration, coinciding with the solubility limit
of CA MH in Eudragit® RS PO. Finally, it was found that CA MH facilitated the extrusion
process more efficiently than its anhydrous form.
Torque can be easily measured during HME and is correlated with several important product
parameters that cannot straightforwardly be monitored during extrusion, such as the
rheological behaviour of the material, plasticizing effects of components in the melt,
grinding processes during extrusion and the velocity of material through the extruder. This
parameter can easily be monitored during HME without the requirement of barrel and/or
die modifications, and without the need for additional sensors.

CHAPTER 3 – PROCESS MONITORING AND VISUALIZATION SOLUTIONS FOR HOT-MELT EXTRUSION
42
3.4. MONITORING OF POLYMER MELT EXTRUSION
The polymer processing industry has developed and applied numerous process analytical
tools to improve HME process understanding, monitoring and control, to enhance product
quality and to allow real-time fault detection. In addition to the use of conventional
monitoring techniques and spectroscopic techniques such as NIR and Raman spectroscopy,
the literature describes applications of ultrasonic techniques, rheological techniques,
advanced temperature sensors, dielectric sensors, nuclear magnetic resonance (NMR)
spectroscopy, fluorescence spectroscopy, ultraviolet-visible (UV-VIS) spectroscopy and
terahertz (THz) spectroscopy. The following section provides an overview of process
monitoring techniques that have been applied in polymer extrusion which could be relevant
for pharmaceutical HME process monitoring and control. A summarized overview can be
found in Table 3.2, together with the analysis possibilities of each technique, the position in
the extruder where the technique should be/can be implemented for its purpose and
possible challenges, disadvantages and shortcomings of the analytical technique.
3.4.1. Spectroscopic techniques
3.4.1.1. NIR spectroscopy
Hansen and Vedula [16] used in-line NIR spectroscopy to monitor the comonomer (vinyl
acetate (VA)) concentration in a system of EVA copolymers simultaneously with the polymer
melt flow index (MI) for this system. In NIR absorption spectra, variations in chemical
composition are dominant effects, whereas the rheological flow effects cause only subtle
variations in the NIR spectra. The anisotropic nature of flow depends on the molecular
orientation and the orientation distribution of flowing polymer melt, which are related to
molecular weight, chain length, entanglement and branching of the polymer chain.
Differences in molecular orientation and orientation distribution affect the NIR absorbance
spectra and induce spectral shifts, hence providing information about physical properties
that directly correlate with molecular weight parameters such as MI. For EVA random
copolymers, these rheological properties are not related to the comonomer ratio for VA

CHAPTER 3 – PROCESS MONITORING AND VISUALIZATION SOLUTIONS FOR HOT-MELT EXTRUSION
43
concentrations lower than 30%. This indicates that primary effects (composition of the melt)
and secondary effects (MI) on the absorbance spectrum are independent. Dual transmission
fibre optic probes were mounted in a flow cell attached to a single-screw extruder. The
authors developed two PLS models, a first one containing three principal components which
is used for MI predictions, and a second PLS model with only one principal component for VA
concentration measurements. The standard error of prediction (SEP) values for the two
models were 0.46 for MI (ln MI (g/10 min)) predictions and 0.62 wt% for VA predictions.
These models were then applied for in-line monitoring of MI and VA concentration. All
predicted values for both responses were found between the actual laboratory value ± SEP,
indicating that NIR spectroscopic measurements can predict the VA content and the MI of
the melt during extrusion.
In a second study [17], Vedula and Hansen developed a PLS-1 model to predict the complex
viscosity (ln (│η* (ω)│)) and the VA monomer content of molten EVA copolymers. Dual
transmission fibre optic probes were mounted in a flow cell attached to a single-screw
extruder. The PLS-1 model, where the NIR spectra were regressed versus the complex
viscosities measured with a dynamic stress rheometer at different frequencies, comprised
four components. The first PC (explained 31.5% of the variation related to the rheological
response) accounted for the spectral variation caused by varying VA content, and a second
(63.4%) PC described the spectral variation caused by the rheological response. The standard
error of calibration (SEC) and SEP values were 0.38 and 0.8 respectively. Most new predicted
measurements are found within the detection limits for predictions as determined by the
SEP values. A limitation for this type of measurements is the melt temperature, which has a
large effect on rheological properties. These experiments were all performed at the same
temperature, assuring only a small variance in melt temperature in the flow cell (1-3°C). A
further improvement of the calibration models from both studies might be achieved by
including temperature as an independent variable in the X matrix.
Nagata et al. [18] developed an in-line density sensor using NIR spectroscopy. The
transmission NIR spectra of molten polyethylene (PE) in flow were collected using a fibre-
optic device attached to a single-screw extruder. The PE density depends on the number of
polymer chain branches and their length. The degree of branching could be estimated by

CHAPTER 3 – PROCESS MONITORING AND VISUALIZATION SOLUTIONS FOR HOT-MELT EXTRUSION
44
measuring the composition ratio of the methyl group (-CH3, at the ends of branches and
main chains) to the methylene (-CH2-, in polymer chains) group. In attempts to correlate the
density with the NIR spectra, the correlation coefficient R² between polymer densities and
scaled absorbances of 14 polymer grades was calculated, and the highest R² (0.9853) was
found at 1170 nm. Using this model, it was hence possible to monitor the PE density in-line
in the extrusion die.
Witschnigg et al. [19] developed an NIR method where the results of on-line extensional
rheometry (on-line measurements of drawing force performed by on-line Rheotens
equipment), Young’s modulus (calculated out of tensile tests) and interlayer distance
(determined by small angle X-ray scattering) are correlated with in-line collected NIR
spectra. A mixture of 90% polypropylene (PP), 5% organoclay and 5% compatibilizer (w/w)
was extruded in a co-rotating twin-screw extruder, which had a bypass system to create a
melt string for on-line Rheotens measurements. The NIR probe was implemented in front of
the extrusion die. Two different screw geometries (1 and 2) were applied during
experiments. Screw geometry 1 contained three kneading zones, whereas only 1 kneading
zone was present in geometry 2. For geometry 1, a PLS model with 5 components regressing
the NIR spectra versus the Young's modulus was developed resulting in an RMSECV of 30
MPa. For geometry 2, a four component PLS model was built resulting in an RMSECV of 94
MPa. For the correlation with drawing force, 2 component PLS models were developed
resulting in an RMSECV of 2.64 mN for geometry 1 and an RMSECV of 1.98 mN for geometry
2. Concerning the correlation of NIR spectra with the interlayer distance, a PLS model with 1
component and an RMSECV of 0.013 nm was developed for geometry 1 and for geometry 2,
a PLS model with 2 components resulted in an RMSECV of 0.019 nm. The measurements
were not performed at different aggregate states (melt state vs. semicrystalline solid state),
since this creates differences in NIR spectra that would affect the chemometric models.
Variations in NIR spectra caused by changing the physicochemical state of the extrudates
might interfere with the variations attributed to Young’s modulus, drawing force and
interlayer distance. Nevertheless, the authors demonstrated that NIR spectra can be used
with sufficient precision for in-line quality monitoring. However, in this publication it is not
mentioned how changes in Young’s modulus, interlayer distance and drawing force affect
the in-line collected NIR spectra.

CHAPTER 3 – PROCESS MONITORING AND VISUALIZATION SOLUTIONS FOR HOT-MELT EXTRUSION
45
In pharmaceutical HME, NIR spectroscopy is mainly applied to monitor the concentration of
melt components, and in some cases to determine the solid state and occurring
intermolecular interactions within the melt. In polymer extrusion applications however, NIR
spectra showed to correlate well with Young’s modulus, interlayer distance, drawing force,
melt flow index, complex viscosity and density.
3.4.1.2. UV-VIS spectroscopy
Wang et al. [20] applied the UV-VIS spectroscopy technique to monitor the process induced
degradation of poly-L-lactic acid (PLLA) during extrusion. Extrusion was performed on a co-
rotating twin-screw extruder, equipped with a special measurement slit die that contained
the UV-VIS transmission probes. The influence of the processing parameters barrel
temperature, screw speed and throughput on the degradation of PLLA was investigated.
Samples were also collected for off-line analysis (molar mass, melt viscosity and in vitro
biodegradation). The residence time distribution was determined by adding a red coloured
pellet to the feeding during stationary state. A reference spectrum was taken, and
subtracted from all the UV-VIS spectra collected during experiments. These difference
spectra (ΔA) exhibited a maximum at 310 nm for all processing conditions, indicating the
wavelength range of the most significant spectral changes due to degradation. ΔA increased
with increasing processing temperature and screw speed as well as with decreasing
throughput. This means that an increase in ΔA is accompanied by decrease in average molar
mass and an increase in specific mechanical energy. UV-VIS absorption of the melt can be
used to get an estimate of the molar mass of the extrudates of dry PLLA, regardless of
variations in extrusion parameters. To evaluate the effects of processing parameters on the
biodegradation rate of the extrudates, an in vitro biodegradation experiment at elevated
temperature was performed for selected extrudates. Higher in vitro weight loss was related
to higher UV-VIS absorption of the extruded materials, which is correlated with lower molar
mass of the extruded materials. The authors demonstrated that UV-VIS is very sensitive to
colour changes of the PLLA melt, and a clear correlation between increasing absorption and
a decrease in molar mass of the extrudates was found, which can be used as a measure of
polymer degradation.

CHAPTER 3 – PROCESS MONITORING AND VISUALIZATION SOLUTIONS FOR HOT-MELT EXTRUSION
46
Table 3.2. Process analytical tools applied in polymer extrusion
Process analytical
tool
Interface In-line or on-line
application [1]
Purpose Reported challenges/disadvantages/shortcomings References
Near infrared (NIR)
spectroscopy:
transmission
die in-line monomer
concentration
- [16]
die in-line complex viscosity - [17]
die in-line density by
monitoring
polymer chain
branches
- [18]
NIR spectroscopy:
reflection
die in-line drawing force and
Young's modulus
Different aggregate states will affect the chemometric
models negatively.
[19]
Ultraviolet/visible
(UV-VIS)
spectroscopy:
transmission
die in-line polymer
degradation
The low count rate of the UV-VIS diode array detector leads
to a large error, since this area is the wavelength range
where the absorption of the optical fibres connecting the
probe with the spectrometer becomes dominant.
[20]
UV-VIS spectroscopy:
reflectance
die in-line residence time
distribution (RTD)
- [21]

CHAPTER 3 – PROCESS MONITORING AND VISUALIZATION SOLUTIONS FOR HOT-MELT EXTRUSION
47
Table 3.2. Process analytical tools applied in polymer extrusion (continued)
Fluorescence
spectroscopy
die in-line melt
temperature
measurements,
temperature
gradient
measurements
- Can only be used in development phase with inert fluorescent dyes.
- Effect of pressure on calibration curve must be considered, accurate
temperature measurements require simultaneous acquisition of pressure
(temperature results need to be compensated).
- Only a small sample volume is allowed (specific probe and lens design).
- Radial measurements need to be possible (specific probe and lens design).
- Selection of fluorescent dyes: dyes need to be stable at high temperatures,
spectra should show significant changes with varying temperature, dyes
should be soluble in polymer resin and should be chemically inert.
- Effect of shear on temperature measurements: sensor needs to be located
beyond the end of screw (low shear rate flow region).
[22, 23, 25]
die in-line RTD Global RTD measurements in single-screw extrusion are delicate, as the tracer
must be incorporated at the feed opening under very specific conditions (to
avoid material accumulation, starve feed conditions and the distribution of the
dye in different screw turns, a minimal concentration though easily detectable
should be used) [25].
[25-27]
barrel in-line RTD - [25]
mixing
zone
in-line melt
temperature
measurements,
temperature
gradient
measurements
- Calibration should involve pressure data.
- Temperature spikes in data are associated with shear heating, these spikes
need to be filtered out to calculate average temperatures.
[25]
kneading
block
in-line RTD Video images revealed that, in contrast with the kneading block, the conveying
elements upstream of the kneading block were only partially filled, causing
unstable and weak signals. Therefore, measurements were performed
exclusively on the kneading block.
[25]

CHAPTER 3 – PROCESS MONITORING AND VISUALIZATION SOLUTIONS FOR HOT-MELT EXTRUSION
48
Table 3.2. Process analytical tools applied in polymer extrusion (continued)
Terahertz
spectroscopy
die in-line refractive index
measurements related
to additive compound
content
- Complexity of the system, high costs, very sensitive to vibration → a new,
partially fibre coupled terahertz spectrometer was developed.
- Die adaptations were required: silica plates that can withstand pressures only
up to 26 bar and temperatures only up to 260°C.
- The recording time needs to be reduced: only the amplitude value at a fixed
time position is used as an indicator.
- The pressure and temperature of the melt need to be observed in order to
correct the experimental data.
[28]
Dielectric
spectroscopy
die in-line comonomer
concentration,
sidechain composition
At higher temperatures, the analysis becomes more difficult since ions, permanent
dipoles and induced dipoles may all have a significant influence at an elevated
temperature.
[29]
die in-line filler concentrations Measuring cells are not sensitive for the melt in the centre of the ring, cells should
therefore be as narrow as possible.
[30]
die in-line melt viscosity The sensor utilizes a fringe field to monitor the polymer melt, so the field of the
measurement is limited to the depth of penetration of the fringe field. Therefore,
the dielectric parameters are measured at the surface of the melt stream.
[51]
Optical probes
die in-line particle size and
concentration of
dispersed phase
- [31]
die in-line melting behaviour - [34]
mixing
zone
in-line RTD Dependent on the optical characteristics of the extruded polymer and tracer, the
optical probe measured the RTD of either the entire channel volume or that of a
surface layer of the volume.
[36]
Nuclear magnetic
resonance (NMR)
spectroscopy
die on-line temperature,
composition,
homogeneity
- Increasing temperature decreases the magnetic field strength.
- Ferromagnetic materials in the extruder might deform the static field.
- Low sensitivity, but this can be overcome by increasing the experiment time for
signal accumulation.
[35]

CHAPTER 3 – PROCESS MONITORING AND VISUALIZATION SOLUTIONS FOR HOT-MELT EXTRUSION
49
Table 3.2. Process analytical tools applied in polymer extrusion (continued)
Ultrasonic
techniques:
longitudinal
waves
melting,
mixing,
pumping
zones
- barrel integrity at melting,
mixing and pumping zones,
screw and barrel wear
- [41]
melting,
mixing,
pumping
zones
in-line RTD - [36]
die in-line RTD - [36, 37]
barrel in-line melting phenomena
dependent on screw
configurations
The channel should be completely filled at measurement position:
adaptations in screw configuration/probe location are required.
[38]
Ultrasonic
techniques:
shear waves
die in-line melt density - Assumption: a change in melt density will be directly manifested by a
change in extrudate density (accurate for most polymer extrusion
applications).
- The accuracy of the measurements is highly dependent on the
condition of the ultrasound transducer and stability of the process:
constant cooling of the transducer was necessary.
- It is essential to keep the melt temperature and pressure within a
narrow range during extrusion: a change in either will affect the
acoustic properties of the melt and will interfere with the accuracy of
the intended measurements: normalisation procedures should be
applied.
[39]
Ultrasonic
techniques:
undefined
wave type
die in-line melt density - [51]

CHAPTER 3 – PROCESS MONITORING AND VISUALIZATION SOLUTIONS FOR HOT-MELT EXTRUSION
50
Table 3.2. Process analytical tools applied in polymer extrusion (continued)
Rheological
techniques:
Stress and shear
rate sensor
die in-line melt viscosity as a function of
shear rate
- [42]
Capillary
rheometer
barrel on-line torque, shear stress, shear
rate, melt flow index, linear
viscoelastic behaviour
Large deformations and relatively high shear rates
associated with the flow in a capillary rheometer may
affect the morphology of the material and consequently
its rheological response.
[43]
Oscillatory
rheometer
barrel on-line linear visco-elastic behaviour - [43]
Rotational
rheometer
barrel on-line morphology development,
reaction kinetics, linear
viscoelastic behaviour
- [44]
barrel on-line storage and loss modulus of
polymer melts
- [45]
Extensional
rheometer
die on-line melt strength - [47]
Slit die die in-line thermal degradation of
polymer
- [46]

CHAPTER 3 – PROCESS MONITORING AND VISUALIZATION SOLUTIONS FOR HOT-MELT EXTRUSION
51
Table 3.2. Process analytical tools applied in polymer extrusion (continued)
Perturbation method barrel sections in-line melting behaviour
of polymer blends
- [48]
Temperature measurements:
Thermocouple die in-line melt temperature - Slow response time.
- Measurements are highly dominated by barrel/die wall
metal temperature.
[49]
Infrared (IR) sensor die in-line melt temperature - Temperature information is limited to a small volume of
the melt flow.
- IR measurements may be affected by polymer type and
sensor calibration accuracy.
[49]
Thermocouple mesh (TCM) die in-line melt temperature - Melt flow may be slightly disturbed by the TCM.
- TCM measurements are slightly influenced by shear
heating depending on the size of the mesh wires and
junctions.
- Mesh wires may be damaged under poor melting
conditions (e.g. highly viscous or un-melted materials).
[49]
Monitoring of motor current motor in-line friction, torque,
identification of
conveying issues
Since the screw load torque signal is dominated by the solids
conveying torque, it is not sensitive enough to identify
unstable melting issues.
[50]

CHAPTER 3 – PROCESS MONITORING AND VISUALIZATION SOLUTIONS FOR HOT-MELT EXTRUSION
52
Gilmor et al. [21] developed an in-line colour monitoring system: the colour of the melt
during changeover from one pigmented PE to another was continuously measured directly in
an extruder using a fibre-optic assisted charge coupled device spectrometer. The fibre-optic
reflection probe was inserted into the die of a single-screw extruder. Residence time
distributions were calculated from the in-line reflectance data, without requiring knowledge
of the absolute concentration values in the melt.
UV-VIS spectroscopy is a process analytical technique that can be applied in pharmaceutical
HME to monitor residence time distributions of the melt, to detect polymer and/or drug
degradation, to detect impurities in the melt and to quantitatively analyse the melt
compounds. It is a simple, straightforward technique, which can be implemented through
the use of fibre optic cables. The most important advantage of UV-VIS spectroscopy
compared to NIR and Raman spectroscopy is its much lower detection limit. UV-VIS spectral
bands are highly overlapping, therefore chemometric analysis and proper pre-processing of
the obtained spectra is required.
3.4.1.3. Fluorescence spectroscopy
Migler and Bur [22] incorporated bis(-pyrene) propane (BPP), a temperature-sensitive
fluorescent dye in the polymer resin at dopant levels. By monitoring relevant spectral
features of this dye, its temperature can be measured. And through a focusing technique
(confocal fluorescent optics), the temperature can be measured as a function of distance
into the resin. Temperature profiles were measured in a circular die at the exit of a twin-
screw extruder. These measurements are based on the dependence of Ie/Im (e = eximer, m =
monomer) with temperature for BPP in polyethylene. In a succeeding study, Bur et al. [23]
added different temperature sensitive fluorescent dyes to the polymer melt during single-
screw extrusion processing to overcome the inadequacies of thermocouple and infrared
radiometer transducers. The fluorescence spectrum, collected in a slit die rheometer
attached to the extruder, reflects the resin temperature in its neighbourhood. The
temperature measurement is based on the calibration curve where the ratio I464/I473 is
plotted versus temperature for atmospheric pressure. A pressure compensation factor was
added later on. Additionally, Bur et al. [24] relocated the fluorescent confocal sensor and

CHAPTER 3 – PROCESS MONITORING AND VISUALIZATION SOLUTIONS FOR HOT-MELT EXTRUSION
53
positioned it over the top of the mixing section of a 63.5 mm diameter single-screw extruder
to monitor the temperature gradient in the channel, as a function of screw speed, screw
design and melt flow rate. Temperatures were found to be lowest in the centre of the
channel and increased at the barrel wall and at the root of the screw for the conventional
screw with only transporting elements. As expected, the channel temperatures increased
with increasing screw speed. For the mixing screw, the temperature was lowest at the barrel
wall and highest at the root of the screw. In summary, this sensor is capable of measuring
melt temperatures and temperature gradients within the melt.
Carneiro et al. [25] determined the RTD along a kneading block via in-line monitoring of the
light emission of a fluorescent tracer (perylene) in a slit die attached to a single-screw
extruder and at several locations along a co-rotating twin-screw extruder. RTD
measurements are often used to monitor and control process attributes such as consistency,
extent of polymer degradation and degree of mixing. Three devices were developed to
accommodate the probe: a slit die for single-screw extrusion, a sampling device with rotating
valve for partial measurements within twin-screw extrusion which can be inserted between
any 2 consecutive barrel sections and a transparent barrel modified to accommodate the
probe (Figure 3.4). First, the probe position (horizontal or vertical) and the influence of screw
speed were evaluated on a single-screw extruder. The authors found that increasing screw
speed reduced the RTD and by changing the probe position, different fractions of the melt
stream are monitored. Secondly, concentration versus time curves were generated to
characterize the RTD at several locations along the barrel of a twin-screw extruder, and
direct comparison with off-line data using a silica tracer produced good results. Finally,
experiments were performed on a co-rotating twin-screw extruder with a transparent barrel
to visualize the flow within a mixing block with staggered kneading disks. Video images
revealed that, in contrast with the kneading block, the conveying elements upstream of the
kneading block were only partially filled, causing unstable and weak signals. Therefore,
measurements were performed exclusively on the kneading block. The determination of
partial RTD is particularly relevant in compounding operations, or when processing thermally
sensitive materials, since it provides information that can be used to optimize the operating
window or to improve the screw configuration. In this work, an in-line technique, based on
the light emission of a perylene fluorescent tracer, was developed for the measurement of

CHAPTER 3 – PROCESS MONITORING AND VISUALIZATION SOLUTIONS FOR HOT-MELT EXTRUSION
54
RTD along the extruder axis. In-line readings were compared with off-line measurements,
and a good agreement was found. Two other examples of RTD monitoring with fluorescence
spectroscopy are presented by Barnes et al. [26] and Fang et al. [27].
Figure 3.4. Solutions to accommodate the optical probe: (a) slit die used for measurements in a single-screw
extruder; (b) modified sampling device for partial measurements in a twin-screw extruder; (c) device for partial
measurement along a transparent barrel [25].

CHAPTER 3 – PROCESS MONITORING AND VISUALIZATION SOLUTIONS FOR HOT-MELT EXTRUSION
55
Fluorescence spectroscopy has been mainly applied to monitor residence times via the use
of fluorescent tracers in the melt. The RTD of a formulation provides information on the
mixing history of the melt. A lower RTD indicates a decrease in degree of mixing in the
extrusion barrel. In addition, fluorescent tracers allow more accurate melt temperature
measurements. These applications might be of interest in pharmaceutical HME, especially
for monitoring of extrusion processes during formulation development. The addition of
fluorescent tracers will provide insight in residence times and temperature gradients
throughout the melt, and the exposure time of an API to high temperatures can be
estimated. This will enhance the understanding of material behaviour within the barrel, and
will allow the optimization of screw designs.
3.4.1.4. Terahertz (THz) spectroscopy
Krumbholz et al. [28] demonstrated the potential of an in-line monitoring method using a
fibre-coupled THz spectrometer, to study the influence of temperature and pressure on
molten PP. Measurements were performed in a custom-made die at the end of a planetary
gear extruder. The temperature and pressure of a PP melt were varied independently. No
influence of melt pressure on the terahertz parameters (absorption coefficient and refractive
index) was found. Also, no effect on the absorption coefficient was obtained when changing
the melt temperature. However, when the temperature was increased, the refractive index
decreased. The refractive index of a melt can be calculated from the time delay of the THz
pulse propagating through the melt. It is directly related to the additive content of a
compound. When extruding polymer-filler compounds, a linear relation between the
refractive index of the compound and its volumetric additive content was established.
Though a THz spectrometer is a very complex and expensive system, these first
measurements with a newly developed probe supply promising results for refractive index
measurements. The refractive index of a melt depends on the melt composition, but is also
related to the melt density, allowing the monitoring of melt density as well.

CHAPTER 3 – PROCESS MONITORING AND VISUALIZATION SOLUTIONS FOR HOT-MELT EXTRUSION
56
3.4.1.5. Dielectric spectroscopy
Perusich and McBrearty [29] applied dielectric spectroscopy to make composition
measurements of the comonomer concentration along polymer chains. Dielectric
spectroscopy imposes an electric field across the flowing polymer and measures the
resultant alternating current produced from the movement and energy associated with
dipole orientation and ionic conduction. These measurements are related to the physical
and chemical structure of the polymer. The dielectric permittivity or capacitance was found
to be proportional to the polymer sidechain composition. A short sidechain required a high
measurement frequency (short relaxation time), whereas a longer sidechain, needed a much
lower frequency (longer relaxation time) to orient the sidechain to a measurable extent. Two
types of extruders were used. First, a 22 mm single-screw extruder where the sensor
assembly was positioned at the exit of a static mixer section downstream from the screw.
And second, a twin-screw extruder without static mixer, and with the sensor positioned
downstream from the screw directly upstream from the die. The melt composition of a
variety of polymer melt systems was measured with an in-line dielectric sensor. In-line
measurements were performed on Elvax® (DuPont, Wilmington, Delaware, USA), an EVA
copolymer. Once the polymer reached the die, the measured capacitance increased
dramatically, and after 10 min a plateau was achieved. The absolute plateau value was a
direct function of the applied frequency. The measured capacitance was found to be
proportional to the VA content of Elvax®. Bur et al. [78] used the same setup on a twin-screw
extruder to perform permittivity and conductivity measurements of resin melts to quantify
filler concentrations. Sensitivity to polymer/filler composition can arise because of
permittivity contrast between polymer and filler or because of changes in conductivity
caused by variations in filler concentration. The authors found that the interelectrode
separation distance was crucial for the measurement quality. By increasing the separation,
the fringe field will extend beyond the surface, and the capacitance of the cell will decrease
and affect the sensitivity of the measurements.
Dielectric measurements are used to analyze the physical/chemical structure of organic
materials through the measurement of their dielectric properties. Since the dielectric loss
factor is affected by dipolar alignment and by ionic mobility, it provides information on
CHAPTER 3 – PROCESS MONITORING AND VISUALIZATION SOLUTIONS FOR HOT-MELT EXTRUSION
57
changes in viscosity in a material. Thus, in addition to the monitoring of comonomer content
and filler concentrations, dielectric spectroscopy could also be applied to perform
rheological measurements in the melt [30]. For example, wall slip may be preceded by
extensional stress, orienting the material and producing anisotropic dielectric properties.
Migration of polymer additives at high shear stress can be detected as well. These
measurements can easily be performed in-line, and therefore present an interesting addition
to the existing analytical techniques applied in pharmaceutical HME.
3.4.1.6. Optical detectors
Pinheiro et al. [31] measured the morphology of immiscible blends containing PP and
polyamide 6 (PA 6) in a co-rotating twin-screw extruder. The disperse phase particle size and
concentration were determined in-line with an optical device developed by Mélo and
Canevarolo [32, 33], placed at a slit die with transparent windows at the extruder exit. A
polychromatic, visible light source illuminates the entire surface of the glass window and a
photocell. The detector’s signal depends on the volume concentration and size of the
disperse phase. The normalized detector’s signal follows a linear correlation with particle
concentration of four calibration standards (Al2O3 0.5 and 2.0 µm and TiO2 0.5 and 2.0 µm).
Mixtures of Al2O3 with different particle sizes (0.5 and 2.0 µm) at different ratios showed
that the signal increases linearly with an increase in the concentration of 0.5 µm. The
detector captures the average value of a set of particles once the signal is linear with the
weight average particle size. The signal also increased with increasing PA 6 content (disperse
phase) because of the higher light scattering. The results showed that this detector is an
accurate device for the assessment of parameters such as particle size and concentration.
The same device was applied by Canevarolo et al. [34] to assess the melting behaviour
during polymer extrusion in a co-rotating twin-screw extruder. Melting of two polyamide
tracers was studied by changing the barrel temperature and keeping all other operating
conditions constant. Increasing the barrel temperature led to a fast growth of the
normalized intensity due to melting of the tracer, eventually saturating once all tracer was
molten. This type of detector can be applied in pharmaceutical HME during both the
formulation development stage and during pharmaceutical production. It can be applied as a

CHAPTER 3 – PROCESS MONITORING AND VISUALIZATION SOLUTIONS FOR HOT-MELT EXTRUSION
58
monitoring device, to determine the optimal process settings to obtain a completely molten
or dissolved API with minimal energy input but it is also relevant for process control during
manufacturing, to monitor and control the state of the melt.
3.4.1.7. Nuclear magnetic resonance (NMR) spectroscopy
Gottwald and Scheler [35] designed a surface NMR probe to monitor extrusion processes.
Surface NMR gives access to molecular mobility, correlated to temperature, composition and
homogeneity. Two main obstacles are the temperature, which decreases the magnetic field
strength and the ferromagnetic materials in the extruder which deform the static field. The
device was located next to the die of a single-screw extruder (30 mm diameter) and
measurements were performed on a sheet of soft polyvinyl chloride (PVC). The probe
withstood the harsh conditions although the melt was in direct contact with its surface. The
detected signal of the PVC melt could be clearly distinguished from the background signal.
Based on these results, the authors plan to modify an extruder element to fit the NMR
probe, allowing the in-line monitoring of any NMR-detectable parameter, rheological
information and component composition. In pharmaceutical processes, NMR is used to
monitor interactions between drugs and excipients during production, to characterize the
different polymorphic forms of an API, and for the identification and characterization of
APIs. It is sensitive for small amounts of API in the formulation.
3.4.2. Ultrasonic techniques
Sun et al. [36] monitored the RTD at the melting, mixing and pumping zones as well as at the
die exit of a twin-screw extruder (30 mm diameter) by mounting the ultrasonic probes on
the extruder barrel over the screw elements and at the die. In order to relate the measured
ultrasonic signal to the RTD, the relationship between the signal strength and the CaCO3
concentration (the ultrasonic tracer) was calibrated, which was linear in the tested
concentration range. Secondly, the RTD was measured by injecting a pulse of tracer and
monitoring the ultrasonic signal strength. The change of the strength of the ultrasonic signal
reflected from the rotating screw was caused by a change in acoustic impedance of the filled

CHAPTER 3 – PROCESS MONITORING AND VISUALIZATION SOLUTIONS FOR HOT-MELT EXTRUSION
59
material, the scattering loss by the filler and the change in the absorption of acoustic energy
due to the presence of the filler.
Lee et al. [37] also performed RTD measurements based on the ultrasonic response of CaCO3
in PE. Measurements were performed at the die exit (slit die) of a co-rotating twin-screw
extruder. The RTD was also evaluated at different filler concentrations, screw speeds,
feeding rates and screw configurations. Increasing the screw speed or feed rate reduced the
mean residence time and the variance of the residence time, whereas increasing CaCO3
concentration increased the mean residence time and variance of residence time. Both were
also increased by the presence of reverse screw elements in the configuration. The in-line
determination of RTD by ultrasound during extrusion was successfully realized.
Figure 3.5. Ultrasound scanning regions: flight region and C-chamber [38].
Wang and Min [38] developed an ultrasound in-line monitoring system to investigate the
melting behaviour of linear low density PE (LLDPE) and PVC compounds in the barrel of an
intermeshing counter-rotating twin-screw extruder (30 mm diameter). Monitoring of the

CHAPTER 3 – PROCESS MONITORING AND VISUALIZATION SOLUTIONS FOR HOT-MELT EXTRUSION
60
ultrasound wave attenuation allowed the characterization of the melting process and
uniformity across the screw channels. Various melting phenomena were described
depending on the selected materials, processing conditions and screw configurations.
Materials are periodically scanned by ultrasound in the flight region and in a C-chamber
(Figure 3.5). Melting in the flight region finishes much faster than in the C-chamber for both
LLDPE and PVC, due to the combination of heat conduction and viscous energy dissipation.
The melting in the C-chamber always starts at the pushing side of the flight and then spreads
to the trailing side. Melting level and uniformity increase with the increase of pressure in the
material. During the extrusion of LLDPE and PVC compounds, dispersed or dissipation
melting phenomena are dominant under most processing conditions. The ultrasound in-line
monitoring method efficiently investigated the melting phenomena of various polymer
systems fed in powder form or pellet form.
Abu-Zahra [39] measured the density of a polymer melt using ultrasound shear waves
propagating at a frequency of 2.25 MHz. At a solid-liquid interface, the amount of ultrasonic
shear wave energy reflected back into the solid is dependent on the operating frequency
and properties of the fluid (viscosity and density) and of the solid (density and shear
modulus). The acoustic impedance of the polymer melt is calculated using the measured
reflection coefficient of the polymer melt interface boundary. This ultrasound measurement
is independent of the attenuation in the polymer melt and the thickness of the melt stream.
A special die adapter was mounted between the extruder barrel and the die of a 19 mm
single-screw extruder, containing a shear ultrasound sensor. Different mixtures of PVC with
varying levels of blowing agent and acrylic processing aid were extruded. Statistical
correlation between the density measured by energy ration of shear ultrasound waves and
the laboratory density measurements was 96% at constant processing conditions. The main
assumption was that a change in the melt density will be directly manifested by a change in
the extrudate density, which is accurate for most polymer extrusion applications. The
difference between this application of ultrasound monitoring and the three previous
examples is the use of ultrasound shear waves instead of longitudinal waves. In longitudinal
waves, the oscillations occur in the direction of wave propagation, whereas the particles in
shear waves oscillate at a right angle to the direction of wave propagation. At a solid-liquid
interface, the amount of shear wave energy reflected back into the solid depends on the

CHAPTER 3 – PROCESS MONITORING AND VISUALIZATION SOLUTIONS FOR HOT-MELT EXTRUSION
61
operating frequency and on properties of the fluid (viscosity and density) and the solid
(density, shear modulus). A relation between the melt density and the energy ratio of shear
ultrasound waves can be established. The longitudinal wave reflection method is used to
measure the time of flight of ultrasonic waves and the ultrasound velocity in polymer melt.
These data are then used to calculate the density. Longitudinal waves can be generated in
liquids, as well as solids because the energy travels through the atomic structure by a series
of compressions and expansion movements, whereas shear waves require an acoustically
solid material for effective propagation, and therefore, are not effectively propagated in
liquids.
In polymer extrusion, ultrasound techniques have been used to monitor melt temperature
and pressure, changes in material type, effects of process settings on rheological
characteristics of the melt and filler concentration [40]. Besides qualitative and quantitative
monitoring of the polymer melt, ultrasonic sensors can be used to monitor the barrel and
screw integrity at the melting, mixing and pumping zones of the extruder via barrel or flange.
This application was discussed by Jen et al [41]. Extrusion of low density PE (LDPE) was
performed on a 30 mm co-rotating twin-screw extruder and on a 50 mm counter-rotating
twin-screw extruder. Four types of high pressure ultrasound transducers were developed
and used at the melting, mixing and pumping zones of the extruder to monitor the screw
and barrel wear.
3.4.3. Rheological techniques
Chiu et al. [42] developed a new in-line viscometer that can directly test melt viscosity as a
function of shear rate. The viscometer contains a stress sensor and a shear rate sensor which
were installed between the screw and the die of a single-screw extruder. During extrusion of
LDPE, different temperatures and screw speeds were applied, and a decreasing viscosity
with increasing temperature was detected, due to the shear thinning behaviour of LDPE. The
in-line results were compared to measurements with an off-line capillary rheometer, where
the viscosity results were lower when the shear rate was lower than 600 s-1, and higher
when the shear rate was higher than 600 s-1, possibly due to the instability of both the flow

CHAPTER 3 – PROCESS MONITORING AND VISUALIZATION SOLUTIONS FOR HOT-MELT EXTRUSION
62
meter and the stress sensor. Further research and adaptations are required to improve the
accuracy of this device.
Covas et al. [43] presented new equipment to monitor the evolution of relevant
characteristics of polymer systems along the screw axis. A sampling device was constructed,
allowing the extraction of material from the screw channel. First, an on-line capillary
rheometer was connected to the sampling device. When the material extracted from the
barrel is pushed through the die, the torque is recorded, wall shear stress is determined and
wall shear rate is calculated. The tool can also be applied for the on-line measurement of
melt flow index/melt volume flow rate. This equipment was used to measure the rheological
response of a 12% (w/w) PP-based carbon fibre composite after melting in an intermeshing
co-rotating twin-screw extruder. The coherence between on-line and off-line shear data was
clear. Large deformations and relatively high shear rates associated with the flow in a
capillary rheometer may affect the morphology of the material and consequently its
rheological response. Therefore, an on-line oscillatory rheometer was manufactured to
determine the linear viscoelastic behaviour and the non-linear properties of the melt
extracted from the screw channel. On-line monitoring along the axis of an extruder can
provide a wealth of data, contributing to the understanding of the physical and chemical
phenomena occurring inside the barrel.
In a subsequent study, Covas et al. [44] also developed an on-line rotational rheometer,
enabling the determination of morphology development and reaction kinetics along the
screw axis (Figure 3.6). The rheometer is very accurate when compared to commercial
laboratorial instruments, an average deviation in linear viscoelasticity results between the
new device and two off-line rheometers varied between 3 and 8% for various melts and
blends. Results also showed that the on-line rheometer was more accurate in capturing
structural evolutions of the materials along the extruder than analysis performed off-line on
samples collected on-line for complex multiphase systems.

CHAPTER 3 – PROCESS MONITORING AND VISUALIZATION SOLUTIONS FOR HOT-MELT EXTRUSION
63
Figure 3.6. General overview of the on-line rotational rheometer (O2R) [44].
Mould et al. [45] monitored the dynamic rheological response of PP in a co-rotating twin-
screw extruder using a new version of the on-line rotational rheometer developed by Covas
et al. [44]. The technique was validated with off-line measurements at room temperature
and at high temperatures, and on-line, and the validation step was considered successful.
The usefulness of the instrument was first demonstrated with PP, and G’ (storage modulus)
and G” (loss modulus) decreased along the extruder. Then, PP grafted with maleic anhydride
(PP-g-MA) was extruded, and a decrease of the rheological moduli was anticipated, due to
chain scission during grafting. The on-line rheometer confirmed the shift of the moduli to
lower values. Next, a PP/PP-g-MA system was extruded with 8.8% (w/w) montmorillonite
organoclay, to produce a nanocomposite. As expected, G’ and G” shifted to higher moduli
values, the elasticity increased and evolution along the barrel was clearly observed. The
results were in line with observations reported in literature, and evidenced the sensitivity
and reliability of the apparatus.

CHAPTER 3 – PROCESS MONITORING AND VISUALIZATION SOLUTIONS FOR HOT-MELT EXTRUSION
64
Rajan et al. [46] monitored the thermal degradation of polyoxymethylene (POM) during
extrusion on a co-rotating twin-screw extruder. The degradation is indicated by the emission
of formaldehyde (FA) gas, which was monitored off-line with acetyl acetone colour
measurements and by a reduction of viscosity. The on-line viscosity of the melt was
measured by the difference in melt pressure when the melt was forced through a slit die at
constant volume flow rate. When the throughput decreased and the screw speed increased,
an enhanced thermal degradation was found. A good correlation between the viscosity
measured in the slit die and the off-line FA measurements was observed. The thermal
degradation of POM is successfully monitored by means of on-line viscosity measurements.
With the use of on-line extensional rheometry on a co-rotating twin-screw extruder and off-
line rotational rheometry, Kracalik et al. [47] tested different nanocomposites and
investigated the effect of screw speed and geometry on the elongational and viscoelastic
properties. In extensional rheometry, the extruded strand is elongated by rotating wheels.
The rotation speed is increased to the time when the molten string breaks, to measure the
melt strength level. The fast assessment of the melt strength measured by extensional
rheometry correlates with a high accuracy with dynamic rheological data measured by
rotational rheometry. cot δ (G’/G” ratio), which reflects the rigidity of the melt can be
correlated with the melt strength level. The main benefit of extensional rheometry is the
simplicity without the need for expensive equipment.
During extrusion, the raw materials are subjected to shear, increased temperatures and
pressure conditions resulting in physicochemical changes within the mixture. The rheological
response of a material to an imposed stress depends on the composition, morphology,
degree of mixing and temperature. For process control purposes, it is important to obtain
rheological properties of the melt that has experienced the complete history within the
extruder, since these physicochemical changes are highly sensitive to the processing history.
However, monitoring the rheological characteristics of the melt at several locations
throughout the barrel will improve understanding of the process, and will provide useful
information for optimization of the screw configuration and the operating conditions.

CHAPTER 3 – PROCESS MONITORING AND VISUALIZATION SOLUTIONS FOR HOT-MELT EXTRUSION
65
3.4.4. Other process analytical techniques
Chen et al. [48] determined the differences in melting behaviour between a PP/polystyrene
(PS) 80:20 and a PP/PS 20:80 blend in a twin-screw extruder under identical operating
conditions. Therefore, a perturbation method was used together with temperature and
pressure measurements along the channel of a co-rotating twin-screw extruder. A glass
window was fitted in one of the nine barrel segments of the extruder, and a spacer plate was
installed upstream of the segment with the glass window. Three pressure transducers, one
RTD probe and three thermocouples were mounted in the spacer plate. In the perturbation
method, a material mass pulse is added to the extruder feed to generate a disturbance to
the steady-state operation. The pressure, temperature, residence time and drive motor
power are monitored. The time history of the pulse material in the channel can be tracked
with the RTD data, and can be combined with information from the motor power signals to
detect the location of reactions in the extrusion channel. The melting process was visualized
through the glass window using a high-speed video recording device. Once measurements at
one position were completed, the barrel was moved to the next position. Three distinct
regions for the melting of the PP/PS blends were determined: the partially filled region, the
transition region and the fully filled region. The location of the transition region was
determined from visualization results, temperature and pressure information and the pulse
signals. Solid polymer pellets melted through an erosion mechanism in all three regions. The
end of the melting process was identified using the visualization results, and the pressure
profile. With these techniques, the melting profile of several materials in the barrel can be
visualized using dyes. In pharmaceutical HME, the glass window in the barrel might also be
applied to visualize other phenomena such as dispersion and distribution of API within the
melt, given that the API has a different colour than the other components in the
formulation.
Abeykoon et al. [49] evaluated five different melt temperature measurement techniques on
a single-screw extruder. The point/bulk temperature of the die melt was measured with a 1
mm diameter non-insulated wall mounted thermocouple, a 3 mm diameter semi-insulated
wall mounted thermocouple, a 0.5 mm diameter insulated wall mounted thermocouple and
a Methotrexate infrared (IR) sensor. Melt temperatures at different radial locations of the

CHAPTER 3 – PROCESS MONITORING AND VISUALIZATION SOLUTIONS FOR HOT-MELT EXTRUSION
66
die were measured using a thermocouple mesh (TCM) with seven junctions placed between
the adapter and die. LDPE was selected for the experiments. The three wall mounted
thermocouples provided poor results in capturing variations in temperature. The IR sensor
showed a better performance in detecting thermal variations, but even here the information
is limited to a small volume of the melt flow. The TCM demonstrated that the thermal
fluctuations varied significantly across the melt flow cross-section, and these variations
increased with screw speed. However, the TCM does interfere with the melt flow, and is
difficult to implement. Accurately monitoring the melt temperature remains one of the main
challenges in HME. When only the surface temperature is monitored, information on the
melt temperature at the screws is not known. A too high temperature in the melt can cause
API and excipient degradation and affects the rheological properties of the melt. These
consequences can be monitored separately with other process analytical tools described in
this review, such as UV-VIS spectroscopy, ultrasonic techniques and rheometers. However,
knowing the true temperature of the melt at any point within the barrel will eliminate the
need to use several complementary techniques providing the same information.
Commonly used process monitoring devices, such as temperature and pressure sensors,
provide limited information on process dynamics inside the extruder barrel. Therefore,
Abeykoon et al. [50] performed inferential monitoring of the screw load torque signal by
monitoring the motor current. The torque signal was dominated by the solid friction in the
barrel and did not correlate well with melting fluctuations. However, torque measurements
were proven useful for on-line identification of solids conveying issues. This technique to
monitor polymer behaviour can be adapted in pharmaceutical HME without the requirement
of barrel and/or die modifications and without the need for additional sensors.
3.4.5. Combinations and comparison of complementary process analytical
techniques
Sun et al. [36] compared RTD measurements with an ultrasound probe and a reflective
optical probe. Both probes were implemented at the mixing zone of the screws of a twin-
screw extruder, in the same cross section of the barrel. A tracer was added to the polymer
melt to monitor the RTD. Dependent on the optical characteristics of the extruded polymer

CHAPTER 3 – PROCESS MONITORING AND VISUALIZATION SOLUTIONS FOR HOT-MELT EXTRUSION
67
and tracer, the optical probe measured the RTD of either the entire channel volume or that
of a surface layer of the volume, whereas the ultrasonic measurements always determined
the RTD of the entire channel volume. For certain polymer systems, the ultrasound
generated by the probe has a larger penetration depth than the light. The ultrasonic
technology uses signals reflected from the screw, whereas the optical probe detects signals
scattered by the tracer in the surface layer of the screw channel. The ultrasonic probe was
proven to be more appropriate for measuring the RTD of the entire channel volume, and
both techniques could provide complementary information to improve understanding of the
extrusion process.
Abu-Zahra [51] attached a special die adapter to a 19 mm diameter single-screw extruder.
An ultrasound transducer and a dielectric sensor were mounted in this die. PVC was
extruded with varying levels of chemical blowing agent (AZO)4 and processing aid (K400).
Ultrasound measurements are correlated to the melt density and the dielectric properties of
the melt provide information on the mechanical viscosity. Both complementary techniques
allow the simultaneous monitoring of the rheological properties density and viscosity of the
melt.

CHAPTER 3 – PROCESS MONITORING AND VISUALIZATION SOLUTIONS FOR HOT-MELT EXTRUSION
68
3.5. CONCLUSION
So far, monitoring of pharmaceutical HME processes remains limited to conventional
monitoring of the process settings and parameters (barrel and die temperatures, feed rate
or throughput, screw speed, torque and drive amperage, melt pressure and melt
temperature) and the application of NIR and Raman spectroscopy to monitor the API
concentration and the physicochemical state of the melt. However, the quality of an
extrudate cannot simply be assessed by monitoring its drug load and solid state. Promising
steps towards a thorough process understanding have been taken recently, but further
monitoring of component degradation, rheological properties of the melt and their effect on
processing efficiency and accurate melt temperature measurements are required to
guarantee the quality of the extrudates and to predict the physical and chemical
characteristics of the extrudates before starting the downstream processing.
Various sensors are available for observation of critical process and product parameters
during extrusion, as reported in literature related to polymer extrusion. The implementation
of the different process analytical techniques evaluated in this chapter will lead to a
thorough process understanding and will allow monitoring of the critical process and
product parameters. This monitoring will eventually lead to optimization of the HME process
and the formulations, and provide the possibility for improved process control in routine
manufacturing.

CHAPTER 3 – PROCESS MONITORING AND VISUALIZATION SOLUTIONS FOR HOT-MELT EXTRUSION
69
3.6. REFERENCES
[1] Food and Drug Administration, Process Analytical Technology Initiative, Guidance for
Industry; PAT - A Framework for Innovative Pharmaceutical development,
Manufacturing and Quality Assurance, 2004.
[2] International Conference on Harmonisation of Technical Requirements for
Registration of Pharmaceuticals for Human Use, Pharmaceutical Development Q8
(R2), 2009.
[3] I.M. Ziegler, Bulletin Technique Gattefossé 105 (2012) 44-67.
[4] S.V. Tumuluri, S. Prodduturi, M.M. Crowley, S.P. Stodghill, J.W. McGinity, M.A. Repka,
B.A. Avery, Drug Dev Ind Pharm 30 (2004) 505-511.
[5] L. Saerens, L. Dierickx, T. Quinten, P. Adriaensens, R. Carleer, C. Vervaet, J. P. Remon,
T. De Beer, Eur J Pharm Biopharm 81 (2012) 230-237.
[6] B. Smith-Goettler, C.M. Gendron, N. MacPhail, R.F. Meyer, J.X. Phillips, Spectroscopy
(2011).
[7] C. Mckelvey, L. Schenck, M. Lowinger, G. Troup, Soc Plast Eng 54 (2008).
[8] G.M. Troup, C.A. Mckelvey, L. Schenck, M. Lowinger, B. rudeen, A. Sinha, J.P. Higgins,
Soc Plast Eng 56 (2009).
[9] A.L. Kelly, T. Gough, R.S. Dhumal, S.A. Halsey, A. Paradkar, Int J Pharm 426 (2012) 15-
20.
[10] V.S. Tumuluri, M.S. Kemper, I.R. Lewis, S. Prodduturi, S. Majumdar, B.A. Avery, M.A.
Repka, Int J Pharm 357 (2008) 77-84.
[11] L. Saerens, L. Dierickx, B. Lenain, C. Vervaet, J.P. Remon, T. De Beer, Eur J Pharm
Biopharm 77 (2011) 158-163.
[12] A. Almeida, L. Saerens, T. De Beer, J.P. Remon, C. Vervaet, Int J Pharm 439 (2012)
223-229.
[13] L. Saerens, C. Vervaet, J.P. Remon, T. De Beer, Anal Chem 85 (2013) 5420-5429.
[14] C. Kindermann, K. Matthée, J. Strohmeyer, F. Sievert, J. Breitkreutz, Eur J Pharm
Biopharm 79 (2011) 372-381.
[15] S.U. Schilling, N.H. Shah, A.W. Malick, M.H. Infeld, J.W. McGinity, J Pharm Pharmacol
59 (2007) 1493-1500.
[16] M.G. Hansen, S. Vedula, J Appl Polym Sci 68 (1998) 859-872.

CHAPTER 3 – PROCESS MONITORING AND VISUALIZATION SOLUTIONS FOR HOT-MELT EXTRUSION
70
[17] S. Vedula, M.G. Hansen, J Appl Polym Sci 68 (1998) 873-889.
[18] T. Nagata, M. Ohshima, M. Tanigaki, Polym Eng Sci 40 (2000) 1107-1113.
[19] A. Witschnigg, S. Laske, M. Kracalik, M. Feuchter, G. Pinter, G. Maier, W. Märzinger,
M Haberkorn, G. Rüdiger Langecker, C. Holzer, J App Polym Sci 117 (2010) 3047-3053.
[20] Y.M. Wang, B. Steinhoff, C. Brinkmann, I. Alig, Polymer 49 (2008) 1257-1265.
[21] C. Gilmor, S.T. Balke, F. Calidonio, A. Rom-Roginski, Polym Eng Sci 43 (2003) 356-368.
[22] K.B. Migler A.J. Bur, Polym Eng Sci 38 (1998) 213-221.
[23] A.J. Bur, M.G. Vangel, S.C. Roth, Polym Eng Sci 41 (2001) 1380-1389.
[24] A.J. Bur, S.C. Roth, M.A. Spalding, D.W. Baugh, K.A. Koppi, W.C. Buzanowski, Polym
Eng Sci 44 (2004) 2148-2157.
[25] O.S. Carneiro, J.A. Covas, J.A. Ferreira, M.F. Cerqueira, Polym Test 23 (2004) 925-937.
[26] S.E. Barnes, M.G. Sibley, H.G.M. Edwards, P.D. Coates, Trans Inst Meas Control 29
(2007) 453-465.
[27] H.X. Fang, F. Mighri, A. Ajji, P. Cassagnau, S. Elkoun, J Appl Polym Sci 120 (2011) 2304-
2312.
[28] N. Krumbholz, T. Hochrein, N. Vieweg, T. Hasek, K. Kretschmer, M. Bastian, M.
Mikulics, M. Koch, Polym Test 28 (2009) 30-35.
[29] S. Perusich, M. McBrearty, Polym Eng Sci 40 (2000) 214-226.
[30] A.J. Bur, S.C. Roth, M. McBrearty, Rev Sci Instrum 73 (2002) 2097-2102.
[31] L.A. Pinheiro, G.H. Hu, L.A. Pessan, S.V. Canevarolo, Polym Eng Sci 48 (2008) 806-814.
[32] T.J.A. Melo, S.V. Canevarolo, Polym Eng Sci 42 (2002) 170-181.
[33] T.J.A. Melo, S.V. Canevarolo, Polym Eng Sci 45 (2005) 11-19.
[34] S.V. Canevarolo, M.K. Bertoline, L.A. Pinheiro, V. Palermo, S. Piccarolo, Macromol
Symp 279 (2009) 191-200.
[35] A. Gottwald, U. Scheler, Macromol Mater Eng 290 (2005) 438-442.
[36] Z. Sun, C.K. Jen, C.K. Shih, D.A. Denelsbeck, Polym Eng Sci 43 (2003) 102-111.
[37] S.M. Lee, J.C. Park, S.M. Lee, Y.J. Ahn, J.W. Lee, Korea-Aust Rheol J 17 (2005) 87-95.
[38] D.B. Wang, K. Min, Polym Eng Sci 45 (2005) 998-1010.
[39] N.H. Abu-Zahra, Int J Adv Manuf Tech 24 (2004) 661-666.
[40] Brown EC. Ultrasonic monitoring of polymer melt extrusion, Bradford, UK: University
of Bradford, 1998.
[41] C.K. Jen, Z. Zun, M. Kobayashi, Meas Sci Technol 16 (2005) 842-850.

CHAPTER 3 – PROCESS MONITORING AND VISUALIZATION SOLUTIONS FOR HOT-MELT EXTRUSION
71
[42] S.H. Chiu, H.C. Yiu, S.H. Pong, J Appl Polym Sci 63 (1997) 919-924.
[43] J.A. Covas, O. S. Carneiro, P. Costa, A.V. Machado, J.M. Maia, Plast Rubber Compos 33
(2004) 55-61.
[44] J.A. Covas, J.M. Maia, A.V. Machado, P. Costa, J Non-Newton Fluid 148 (2008) 88-96.
[45] S. Mould, J. Barbas, A.V. Machado, J.M. Nóbrega, J.A. Covas, Polym Test 30 (2011)
602-610.
[46] V.V. Rajan, R. Wäber, J. Wieser, J Appl Polym Sci 115 (2010) 2394-2401.
[47] M. Kracalik, S. Laske, A. Witschnigg, C. Holzer, Rheol Acta 2011; 50: 937-944.
[48] H.B. Chen, U. Sundararaj, K. Nandakumar, M.D. Wetzel, Ind Eng Chem Res 43 (2004)
6822-6831.
[49] C. Abeykoon, P.J. Martin, A.L. Kelly, E.C. Brown, Sensor Actuat a-Phys 182 (2012) 16-
27.
[50] C. Abeykoon, M. McAfee, K. Li, P.J. Martin, A.L. Kelly, J Mater Process Tech 211 (2011)
1907-1918.
[51] N.H. Abu-Zahra, Mechatronics 14 (2004) 789-803.

CHAPTER 3 – PROCESS MONITORING AND VISUALIZATION SOLUTIONS FOR HOT-MELT EXTRUSION
72

CHAPTER 4 – RAMAN SPECTROSCOPY FOR THE IN-LINE POLYMER-DRUG QUANTIFICATION AND SOLID STATE CHARACTERIZATION DURING HOT-MELT EXTRUSION
73
CHAPTER 4
RAMAN SPECTROSCOPY FOR THE IN-LINE
POLYMER-DRUG QUANTIFICATION AND
SOLID STATE CHARACTERIZATION
DURING A PHARMACEUTICAL HOT-MELT
EXTRUSION PROCESS
Parts of this chapter are published in:
L. Saerens, L. Dierickx, B. Lenain, C. Vervaet, J.P. Remon, T. De Beer. Raman spectroscopy for
the in-line polymer–drug quantification and solid state characterization during a
pharmaceutical hot-melt extrusion process. European Journal of Pharmaceutics and
Biopharmaceutics, 77 (2011) 158-163.

CHAPTER 4 – RAMAN SPECTROSCOPY FOR THE IN-LINE POLYMER-DRUG QUANTIFICATION AND SOLID STATE CHARACTERIZATION DURING HOT-MELT EXTRUSION
74
ABSTRACT
Chapter 4 evaluates the suitability of Raman spectroscopy as a Process Analytical Technology
(PAT) tool for the in-line determination of the active pharmaceutical ingredient (API)
concentration and the polymer-drug solid state during a pharmaceutical hot-melt extrusion
process.
For in-line API quantification, different metoprolol tartrate (MPT) - Eudragit® RL PO mixtures,
containing 10, 20, 30, and 40% MPT (w/w), were extruded and monitored in-line in the die
using Raman spectroscopy. A PLS model, regressing the MPT concentrations versus the in-
line collected Raman spectra, was developed and validated, allowing real-time API
concentration determination. The correlation between the predicted and real MPT
concentrations of the validation samples is acceptable (R²=0.997). The predictive
performance of the calibration model is evaluated by the root mean square error of
prediction (RMSEP), which is 0.59% (w/w).
Two different polymer-drug mixtures were prepared to evaluate the suitability of Raman
spectroscopy for in-line polymer-drug solid state characterization. Mixture 1 contained 90%
Eudragit® RS PO and 10% MPT (w/w), and was extruded at 140°C, hence producing a solid
solution. Mixture 2 contained 60% Eudragit® RS PO and 40% MPT (w/w), and was extruded at
105°C, producing a solid dispersion. The Raman spectra collected during these extrusion
processes provided two main observations. First, the MPT Raman peaks in the solid solution
broadened compared to the corresponding solid dispersion peaks, indicating the presence of
amorphous MPT. Secondly, peak shifts appeared in the spectra of the solid dispersion and
solid solution compared to the physical mixtures, suggesting interactions between Eudragit®
RS PO and MPT, most likely hydrogen bonds. These shifts were larger in the spectra of the
solid solution. DSC analysis and ATR FT-IR confirmed these Raman solid state observations
and the interactions seen in the spectra. Raman spectroscopy is a potential PAT-tool for the
in-line determination of the API-concentration and the polymer-drug solid state during
pharmaceutical hot-melt extrusion.

CHAPTER 4 – RAMAN SPECTROSCOPY FOR THE IN-LINE POLYMER-DRUG QUANTIFICATION AND SOLID STATE CHARACTERIZATION DURING HOT-MELT EXTRUSION
75
CHAPTER 4
RAMAN SPECTROSCOPY FOR THE IN-LINE
POLYMER-DRUG QUANTIFICATION AND
SOLID STATE CHARACTERIZATION DURING
PHARMACEUTICAL HOT-MELT EXTRUSION
4.1. INTRODUCTION
Hot-melt extrusion (HME) is one of the most widely used processing technologies in the
plastic, food and rubber industry [1]. Recently, it also found its application in pharmaceutical
manufacturing operations, offering many advantages compared to traditional
pharmaceutical processing techniques [1-5]. Nowadays, extruders allow in-line monitoring
and control of the process parameters barrel and die temperature, feed rate and screw
speed, and in-line monitoring of the motor load and the melt pressure in the extruder and
die. The in-line monitoring and control of quality parameters corresponding to the extruded
product itself, such as drug load and solid state, will allow real-time product quality
evaluation and an increased understanding of the product behaviour during extrusion.
Recently, there is a tendency within the pharmaceutical industry to move from traditional
batch processes towards continuous processing, hereby increasing process efficiency and
production. Continuous processes offer many advantages: there is no difficult scale-up
necessary, resulting in a shorter development time, an automatic production line would be
possible, production costs can be reduced, it ensures faster product release and improved
product quality [6]. Hot-melt extrusion can be operated as a continuous process, capable of

CHAPTER 4 – RAMAN SPECTROSCOPY FOR THE IN-LINE POLYMER-DRUG QUANTIFICATION AND SOLID STATE CHARACTERIZATION DURING HOT-MELT EXTRUSION
76
consistent product flow at relatively high throughput rates [1], making it a suitable technique
for large scale production.
The FDA has introduced the concept of PAT in 2004 [7]. Pharmaceutical products must meet
very strict specifications. Conventional pharmaceutical manufacturing is generally
accomplished using batch processing followed by time-consuming, expensive and less
efficient off-line laboratory testing on randomly collected samples to evaluate the end
product quality, with an increased risk of batch rejection after manufacturing. The processes
themselves are not fully understood and are often inefficient black-boxes. The general
principle of PAT is to build quality into products rather than testing it into products. PAT-
tools such as Raman spectroscopy provide in-line and real-time process information
concerning critical formulation parameters, which allows the steering of processes towards
their desired state through adaptations of process settings. Consequently, final product
quality is guaranteed, end product characteristics can be predicted and real-time release can
be ensured, hence avoiding batch losses.
Raman spectroscopy enables rapid, non-destructive and in-line measurements, and has
previously been used during hot-melt extrusion (single-screw extrusion) to monitor EVA
copolymer melt composition [8, 9], to analyze film formulations [10], and to monitor the
composition of a series of high-density polyethylene (HDPE)/polypropylene (PP) blends [11,
12]. It has also been implemented in a twin-screw extrusion process to determine the
concentration of Irganox additive in PP [13]. Raman spectroscopy has also been applied for
off-line confirmation of drug dispersion within PEO and interaction with PEO in extrudates
[14], for characterization of the hydrogen bonding nature in α- and amorphous
indomethacin [15], and for comparison of the solid state properties of solid dispersions
prepared by HME and solvent co-precipitation processes [16].

CHAPTER 4 – RAMAN SPECTROSCOPY FOR THE IN-LINE POLYMER-DRUG QUANTIFICATION AND SOLID STATE CHARACTERIZATION DURING HOT-MELT EXTRUSION
77
4.2. MATERIALS AND METHODS
4.2.1. Materials and hot-melt extrusion
Hot-melt extrusion was performed using a Prism Eurolab 16 co-rotating, fully intermeshing
twin-screw extruder (Thermo Fisher Scientific, Germany). The hot-melt extruder was
equipped with a DD Flexwall® 18 gravimetric feeder (Brabender® Technologie, Germany),
which was set in its gravimetric feeding mode.
For the development of a calibration model allowing in-line API quantification, 4 different
polymer-drug mixtures, containing 10, 20, 30 and 40% (w/w) API respectively, were
extruded. Eudragit® RL PO (Evonik Röhm, Germany) was used as polymer and metoprolol
tartrate (MPT) was used (Esteve Quimica, Spain) as API. Before extrusion, the polymer and
drug were mixed in a mortar. Each mixture was hot-melt extruded with a feeder speed of 0.3
kg/h and a screw speed of 50 rpm. The barrel temperature profile was set at 90-140-140-
140-140-140°C (from hopper to die). The torque dropped from 70% motor capacity for the
10% MPT mixture, over 35% for the 20% MPT mixture and 20% for the 30% MPT mixture to
15% for the mixture containing 40% MPT (w/w). The die pressure, measured with a pressure
probe, decreased with increasing MPT content, from 2 bar in the 10% MPT mixture to 0 bar
in the 40% (w/w) mixture.
Two different polymer-drug mixtures were prepared to evaluate the suitability of Raman
spectroscopy for in-line polymer-drug solid state characterization. Mixture A contained 10%
MPT and 90% Eudragit® RS PO (w/w) (Evonik Röhm, Germany), which has an identical
molecular structure as the RL PO form, but contains fewer ammonium groups. It was
extruded with a barrel temperature profile of 90-140-140-140-140-140°C, which is above the
melting temperature of pure MPT, 120°C, to produce a solid solution. This resulted in a
torque of 50% of the motor capacity and a die pressure of 1 bar. Mixture B consisted of 60%
Eudragit® RS PO and 40% MPT (w/w), and was extruded with a barrel temperature profile of
90-105-105-105-105-105°C, resulting in a solid dispersion. The torque was 65% and the die
pressure 0 bar. For both mixtures, the feeder speed rate was set at 0.4 kg/h and the screw

CHAPTER 4 – RAMAN SPECTROSCOPY FOR THE IN-LINE POLYMER-DRUG QUANTIFICATION AND SOLID STATE CHARACTERIZATION DURING HOT-MELT EXTRUSION
78
speed at 80 rpm. The minimum batch size used was 700g of mixture. The Hansen solubility
parameters of all polymers and MPT were calculated using SPWin version 2.1 [17].
4.2.2. Raman spectroscopy
Raman spectra were collected with a Raman Rxn1 spectrometer (Kaiser Optical Systems, Ann
Arbor, MI, USA), equipped with an air-cooled CCD detector. A fibre-optic Raman Dynisco
probe was built into the extrusion die, behind the pressure probe, to monitor the process
stream before the melt is forced through the die. The laser wavelength was the 785 nm line
from a 785 nm Invictus NIR diode laser. All spectra were recorded with a resolution of 4 cm-1
and an exposure time of 1 second, using a laser power of 400 mW. Spectra were collected
every 5 seconds. Data collection and data transfer were automated using the HoloGRAMS™
data collection software, the HoloREACT™ reaction analysis and profiling software and the
Matlab software (version 7.1, The MathWorks Inc., Natick, MA). The analyzed spectral region
was 50 – 1800 cm-1, since this region contained all useful drug and polymer information.
Data analysis was performed using SIMCA P+ (Version 12.0.1.0, Umetrics, Umeå, Sweden).
Mean centering, Savitzky-Golay and SNV pre-processing were applied on the in-line collected
spectra before principal components analysis (PCA) and partial least squares analysis (PLS),
to exclude inter-batch variation and variation caused by baseline-shifts, respectively. For PCA
and PLS, 20 spectra of each polymer-drug mixture were used to develop the models. A PLS
model was developed, regressing the MPT-concentrations (Y) versus the corresponding in-
line collected Raman spectra (X). This model was validated with 20 other spectra from each
polymer-drug mixture, which were not used to develop the PLS model.
4.2.3. Differential scanning calorimetry (DSC)
Differential scanning calorimetry with a DSC Q 2000 (TA Instruments, Belgium) was used to
confirm the Raman findings. Thermograms were produced with the Thermal Advantage
Release 5.1.2 software and analysed with TA Instruments Universal Analysis 2000 4.7A (TA
Instruments, Belgium). Aluminium hermetic pans (TA Instruments, Belgium) were used to

CHAPTER 4 – RAMAN SPECTROSCOPY FOR THE IN-LINE POLYMER-DRUG QUANTIFICATION AND SOLID STATE CHARACTERIZATION DURING HOT-MELT EXTRUSION
79
contain the samples. Measurements were carried out in a nitrogen atmosphere, with a
heating/cooling rate of 10°C/min.
4.2.4. Attenuated total reflectance Fourier transform infrared (ATR FT-IR)
Besides DSC analysis, attenuated total reflectance (ATR) Fourier transform (FT) infrared (IR)
spectroscopy was used to confirm the observations in the Raman spectra. Spectra were
collected from the pure components, MPT and Eudragit® RS PO, from the physical mixtures
A and B and from the extrudates of physical mixture A at 140°C and B at 105°C. The ATR FT-
IR spectra were measured with a Bruker Vertex 70 FT-IR spectrometer, equipped with a
DTCS detector and a PIKE accessory, equipped with a diamond ATR crystal.
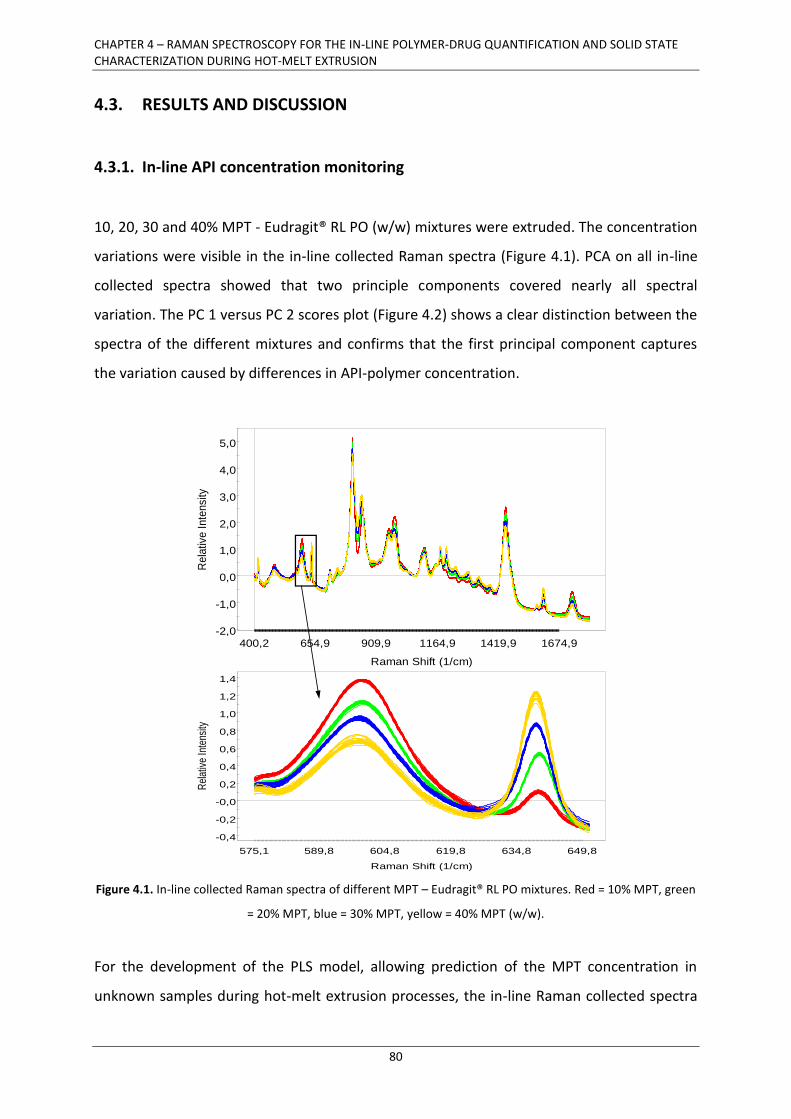
CHAPTER 4 – RAMAN SPECTROSCOPY FOR THE IN-LINE POLYMER-DRUG QUANTIFICATION AND SOLID STATE CHARACTERIZATION DURING HOT-MELT EXTRUSION
80
4.3. RESULTS AND DISCUSSION
4.3.1. In-line API concentration monitoring
10, 20, 30 and 40% MPT - Eudragit® RL PO (w/w) mixtures were extruded. The concentration
variations were visible in the in-line collected Raman spectra (Figure 4.1). PCA on all in-line
collected spectra showed that two principle components covered nearly all spectral
variation. The PC 1 versus PC 2 scores plot (Figure 4.2) shows a clear distinction between the
spectra of the different mixtures and confirms that the first principal component captures
the variation caused by differences in API-polymer concentration.
Figure 4.1. In-line collected Raman spectra of different MPT – Eudragit® RL PO mixtures. Red = 10% MPT, green
= 20% MPT, blue = 30% MPT, yellow = 40% MPT (w/w).
For the development of the PLS model, allowing prediction of the MPT concentration in
unknown samples during hot-melt extrusion processes, the in-line Raman collected spectra
-0,4
-0,2
-0,0
0,2
0,4
0,6
0,8
1,0
1,2
1,4
575,1 589,8 604,8 619,8 634,8 649,8
Rel
ativ
e In
tens
ity
Raman Shift (1/cm)SIMCA-P+ 12.0.1 - 2010-07-12 12:10:16 (UTC+1)
-2,0
-1,0
0,0
1,0
2,0
3,0
4,0
5,0
400,2 654,9 909,9 1164,9 1419,9 1674,9
Rela
tive I
nte
nsi
ty
Raman Shift (1/cm)SIMCA-P+ 12.0.1 - 2010-07-12 12:07:36 (UTC+1)

CHAPTER 4 – RAMAN SPECTROSCOPY FOR THE IN-LINE POLYMER-DRUG QUANTIFICATION AND SOLID STATE CHARACTERIZATION DURING HOT-MELT EXTRUSION
81
(X) were regressed versus the known MPT concentrations (Y). Two PLS components were
chosen, since the goodness of prediction of the model (Q² =0.997) did not increase
significantly after adding extra components [18]. To evaluate the predictive performance of
this model, 20 test spectra of each mixture were used (i.e., other spectra than used for
composing the PLS model) and were projected onto the model to predict the corresponding
MPT concentrations. Figure 4.3 shows the predicted versus the observed MPT concentration
values for these validation spectra (R² = 0.997). The resulting root mean square error of
prediction (RMSEP) is 0.59% (w/w).
Figure 4.2. PC 1 vs. PC 2 scores plot of the in-line collected Raman spectra. Red = 10% MPT, green = 20% MPT,
blue = 30% MPT, yellow = 40% MPT (w/w).
Figure 4.3. Predicted vs. observed MPT concentrations for the validation spectra. Red = 10% MPT, green = 20%
MPT, blue = 30% MPT, yellow = 40% MPT (w/w).

CHAPTER 4 – RAMAN SPECTROSCOPY FOR THE IN-LINE POLYMER-DRUG QUANTIFICATION AND SOLID STATE CHARACTERIZATION DURING HOT-MELT EXTRUSION
82
4.3.2. In-line solid state monitoring
To obtain a good compatibility between polymer and drug, the difference in solubility
parameters (δ) of polymer and drug should not be more than 7.0 MPa1/2 [19]. When this is
achieved, miscibility is significant and, therefore, glass solution formation during melt
extrusion can possibly be obtained. The Hansen solubility parameter for MPT is 23.6 MPa1/2,
19.7 MPa1/2 for Eudragit® RS PO and 19.6 MPa1/2 for Eudragit® RL PO. The smaller the
difference in solubility parameters, the greater the miscibility between two compounds.
Hence, a good miscibility and possible formation of a solid solution between Eudragit® RS PO
and MPT was expected.
Two mixtures (A and B) were extruded at two different extrusion temperatures (140°C and
105°C respectively). Mixture A was expected to result in a solid solution where the MPT has
transferred from the crystalline to the amorphous state. This would be the result of a high
processing temperature (above the melting temperature of pure MPT) and a good miscibility
between both components. Mixture B was expected to result in a solid dispersion, since the
extrusion temperature is lower than the melting temperature of MPT, which will prevent the
transfer of all MPT in the melt into the amorphous state. Hence, a fraction of the MPT will
remain crystalline and the extrudate of mixture B will exist of at least 2 phases.
Figure 4.4a shows a detail of the in-line collected Raman spectra for the extruded mixtures A
and B and the Raman spectra of the physical mixtures before extrusion. Comparison of these
spectra resulted into two major observations. First, throughout the entire Raman spectrum,
the extrudates show peak shifts compared to the spectra of the pure components and the
spectra of the physical mixtures. These peak shifts in the spectra of the extrudates indicate
interactions between MPT and Eudragit® RS PO. These interactions are stronger for extruded
mixture A, as the shifts are larger. All MPT in extruded mixture A was amorphous, which
enhances interaction with the polymer. In extruded mixture B, some MPT has transferred to
the amorphous state, but the largest fraction remained crystalline, explaining the smaller
peak shifts for this mixture. The occurring interactions are most likely hydrogen bonds
between MPT and Eudragit® RS PO, which can take place between the hydroxyl functions or
amino functions from MPT and the carbonyl groups from the polymer (Figure 4.5). Shifts of

CHAPTER 4 – RAMAN SPECTROSCOPY FOR THE IN-LINE POLYMER-DRUG QUANTIFICATION AND SOLID STATE CHARACTERIZATION DURING HOT-MELT EXTRUSION
83
the corresponding Raman peaks from these groups are indeed visible (Figure 4.4b).
Hydrogen bonding in Raman and IR spectra can be mainly observed as a broadening of the
spectral bands and a shift of these bands to lower frequencies [19]. The peak of ν(C=O)
stretch vibration[20] of Eudragit® RS PO has shifted from 1729.5 cm-1 in pure Eudragit to
1729.2 cm-1 in extruded mixture B and 1729.2 cm-1 in extruded mixture A. The shift of the
vibration of this bond is much smaller than that of the O-H or N-H stretch [19]. The peak of
ν(C-N) in pure MPT can be found at 1181 cm-1 [21], and shifts over 1179.6 cm-1 in extruded
mixture B to 1178.7 cm-1 in extruded mixture A. The ν(C-O) peak of pure MPT [21] is located
at 1109.7 cm-1, but shifts cannot be seen in the in-line collected spectra, since Eudragit® RS
PO also has a ν(C-O) peak, appearing at 1116.3 cm-1. These peaks overlap in the spectra of
the extruded mixtures, causing difficulties to see the peak shifts. The decrease in vibration
frequency of ν(C-N) adjacent to the hydrogen bond is due to weakening of these bonds,
caused by the hydrogen bond formation.
Figure 4.4. a) Raman spectra of the physical mixtures of 10% MPT in Eudragit® RS PO (w/w) (PM A, orange) and
40% MPT in Eudragit® RS PO (w/w) (PM B, blue) and the in-line collected Raman spectra of extruded mixture A
(red) and extruded mixture B (green). b) Raman spectra of pure MPT (yellow) and pure Eudragit® RS PO
(purple) and the in-line collected Raman spectra of extruded mixture A (red) and extruded mixture B (green).
-0,4
-0,2
-0,0
0,2
0,4
0,6
0,8
1,0
1,2
1,4
584,4 590,1 596,1 602,1 608,1 614,1 620,1 626,1 632,1 638,1 644,1 650,1
Re
lative
In
ten
sity
Raman Shift (1/cm)SIMCA-P+ 12.0.1 - 2010-07-09 08:37:39 (UTC+1)
Eudragit® RS PO MPTExtruded A
Extruded B
PM A
PM B
-0,2
0,0
0,2
0,4
0,6
0,8
1,0
1101,9 1109,1 1116,6 1124,1
Re
lative
In
ten
sity
Raman Shift (1/cm)SIMCA-P+ 12.0.1 - 2010-07-12 11:46:57 (UTC+1)
ν(C-O)
MPT
-0,2
0,0
0,2
0,4
0,6
0,8
1,0
1,2
1163,7 1172,4 1181,4 1190,4
Re
lative
In
ten
sity
Raman Shift (1/cm)SIMCA-P+ 12.0.1 - 2010-07-12 11:50:04 (UTC+1)
ν(C-N)
-2,0
-1,5
-1,0
-0,5
1707,9 1722,6 1737,6 1752,6
Re
lative
In
ten
sity
Raman Shift (1/cm)SIMCA-P+ 12.0.1 - 2010-07-12 11:56:13 (UTC+1)
ν(C=O)
Eudragit®RSPO
(a)
(b)

CHAPTER 4 – RAMAN SPECTROSCOPY FOR THE IN-LINE POLYMER-DRUG QUANTIFICATION AND SOLID STATE CHARACTERIZATION DURING HOT-MELT EXTRUSION
84
A second observation of interest lies in the peaks of MPT. Since pure MPT is crystalline, its
Raman spectrum contains narrow, well defined peaks. Extruded mixture B still contains a
fraction of MPT in the crystalline state. The peaks of MPT have slightly broadened, but are
still well defined. In extruded mixture A, the MPT peaks have broadened or even
disappeared, indicating the presence of amorphous MPT. In the physical mixtures, the peaks
of MPT remain as sharp as the original peaks. Interactions or transitions have not taken
place in these physical mixtures.
Figure 4.5. Molecular structures of a) Eudragit® RL/RS PO and b) Metoprolol tartrate.
The spectra in the 50 – 150 cm-1 region of the Raman spectrum contain information about
lattice vibrations corresponding to vibrations and translations of the entire molecule in the
lattice [15]. These vibrations are characteristic for the crystal structure and sensitive to local
order or disorder. For the spectrum of pure MPT, this region has sharp, well defined peaks,
which are still present in the spectra of extruded mixture B, but which have nearly
disappeared in the spectra of extruded mixture A. In extruded mixture A, broad bands are
visible, indicating a more disordered structure (Figure 4.6).
DSC analysis (Figure 4.7) was performed to confirm these interpretations from the Raman
spectra. For the samples containing Eudragit® RS PO, the maximum heating temperature
was restricted to 140°C, to avoid degradation of the polymer, which can occur above 150°C.
The glass transition temperature (Tg) of Eudragit® RS PO reaches a lower temperature in the
extrudates, due to the plasticizing effect of MPT on the polymer, and due to the extrusion
process, which slightly lowers the Tg of a polymer [22]. A lower Tg indicates a molecular
dispersion of the drug in the polymer, whereas an unchanged Tg implies separation of the
polymer- and drug phase [23]. The Tg of Eudragit® RS PO in the extrudates of 10% and 40%

CHAPTER 4 – RAMAN SPECTROSCOPY FOR THE IN-LINE POLYMER-DRUG QUANTIFICATION AND SOLID STATE CHARACTERIZATION DURING HOT-MELT EXTRUSION
85
MPT (w/w) is 46.6°C and 46.5°C, respectively, whereas the Tg of Eudragit® RS PO of the
physical mixtures A and B used to prepare these extrudates is 55.1°C and 58.1°C,
respectively, which is higher than the Tg after extrusion. This decrease in Tg after extrusion is
caused by the interaction between Eudragit® RS PO and MPT during hot-melt extrusion. The
chain mobility of the polymer increases due to incorporation of MPT in the polymer
matrices, which translates into a decrease in Tg.
Figure 4.6. Detail of the Raman spectra for the 50 cm-1
to 150 cm-1
spectral region. Yellow = pure MPT; Purple =
pure Eudragit® RS PO; red = extruded mixture A; green = extruded mixture B.
A similar shift in the endothermous melting peak of the crystalline MPT appears. The melting
temperature of pure MPT is measured at 124°C, and its onset temperature at 122.3°C. In the
physical mixtures A and B, this melting temperature has shifted to 110°C and 122.3°C,
respectively, and the onset temperature to 103.3°C and 117.3°C respectively. An even larger
shift occurs in the thermogram of extrudate B, where the Tm of MPT is 105.6°C and its onset
temperature 102.5°C. This shift again implies interactions between the polymer and the
drug. These interactions are more explicit in extrudate B, but also appear in the physical
mixtures. This endothermic peak has disappeared in the thermogram of extrudate A,
indicating that all of the MPT has become amorphous during processing. Since there is only
one Tg present, MPT and Eudragit® RS PO have interacted to form one single phase. Hence,
the extrudate of mixture A is a solid solution.
-1,0
-0,5
0,0
0,5
1,0
1,5
2,0
47,4 69,6 92,1 114,6 137,1 159,6
Rela
tive I
nte
nsity
Raman Shift (1/cm)SIMCA-P+ 12.0.1 - 2010-07-12 12:02:14 (UTC+1)
MPT
Extruded mixture A
Extruded mixture B
Eudragit® RS PO

CHAPTER 4 – RAMAN SPECTROSCOPY FOR THE IN-LINE POLYMER-DRUG QUANTIFICATION AND SOLID STATE CHARACTERIZATION DURING HOT-MELT EXTRUSION
86
Figure 4.7. a) Thermograms of pure MPT and Eudragit® RS PO and of mixture A and B after hot-melt extrusion.
b) Thermograms of physical mixtures A and B before hot-melt extrusion and of mixture A and B after hot-melt
extrusion.
The first derivative of the thermogram of extrudate B shows 2 Tg’s, one for Eudragit® RS PO
(46.5°C) and one for MPT (12°C, Tg of pure MPT = 14.2°C). A fraction of the MPT in this
mixture has become amorphous during processing, but has not interacted with the polymer
phase. Hence, this extrudate exists of three phases: an amorphous polymer phase, an
amorphous drug phase and a crystalline drug phase. This extrudate is in fact a solid
dispersion which is partially crystalline and partially amorphous. Therefore, the DSC
thermograms confirm the observations from the in-line Raman spectra.

CHAPTER 4 – RAMAN SPECTROSCOPY FOR THE IN-LINE POLYMER-DRUG QUANTIFICATION AND SOLID STATE CHARACTERIZATION DURING HOT-MELT EXTRUSION
87
Figures 4.8a and 4.8b represent the ATR FT-IR spectra of metoprolol tartrate and Eudragit®
RS PO, respectively. The IR spectra of the physical mixtures of metoprolol tartrate and
Eudragit® RS PO (Figure 4.8c and 4.8d) can be seen as the combinations of the IR spectra of
the independent products in their respective ratios. The MPT signals are sharp and the
fingerprint area (1500 cm-1 – 600 cm-1) shows an explicit pattern. The position of the bands
in the IR spectra of the physical mixtures remains unchanged compared to the
corresponding bands in the spectra of the pure components. No new bands or band shifts
occur.
The IR spectrum of mixture B, which was extruded at a temperature of 105°C, results in a
significantly changed IR pattern (Figure 4.8f). In the spectral area of 3800 cm-1 – 2800 cm-1,
the C-H stretch vibrations of the acrylate polymer are dominantly present. The pattern of the
different OH and NH vibrations of the API has disappeared. They are replaced by a broad
band between 3700 cm-1 and 2300 cm-1, which can be assigned to associated hydroxyl
groups due to hydrogen bonding with the carbonyl functions of the polymer. The bond
representing the ester group of the acrylate polymer is dominantly present compared to the
corresponding physical mixture (Figure 4.8f vs. 4.8d). The bands in the 1610 cm-1 – 1585 cm-1
area, belonging to the metoprolol carboxylate groups, have shifted. In the fingerprint area
(1500 cm-1 – 600 cm-1), the pattern has disappeared and the bonds arising from the polymer
are explicitly present compared to the physical mixture. This indicates a strong association of
the API with the polymer, forming coupled vibrations of MPT with the polymer.
In the IR spectrum of mixture A, which was extruded at a temperature of 140°C, this effect is
even more distinct (Figure 4.8e), showing only the vibrational state (and thus spectrum) of
the polymer. Due to the formation of strong hydrogen bonds between the hydroxyl groups
of MPT and the ester carbonyl groups of the polymer, a macromolecular structure with its
own vibrations is generated, where the MPT is no longer present as an independent
molecule. With exception of very weak IR absorption bands at 1612 cm-1 and 1513 cm-1, no
typical absorption bands of MPT can be detected in the IR spectrum. The spectral area of
3500 cm-1 – 2800 cm-1 also shows only 1 weak and broadened band of the associated
hydroxyl groups of the drug.

CHAPTER 4 – RAMAN SPECTROSCOPY FOR THE IN-LINE POLYMER-DRUG QUANTIFICATION AND SOLID STATE CHARACTERIZATION DURING HOT-MELT EXTRUSION
88
Figure 4.8. ATR FT-IR spectra of a) MPT, b) Eudragit® RS PO, c) physical mixture A
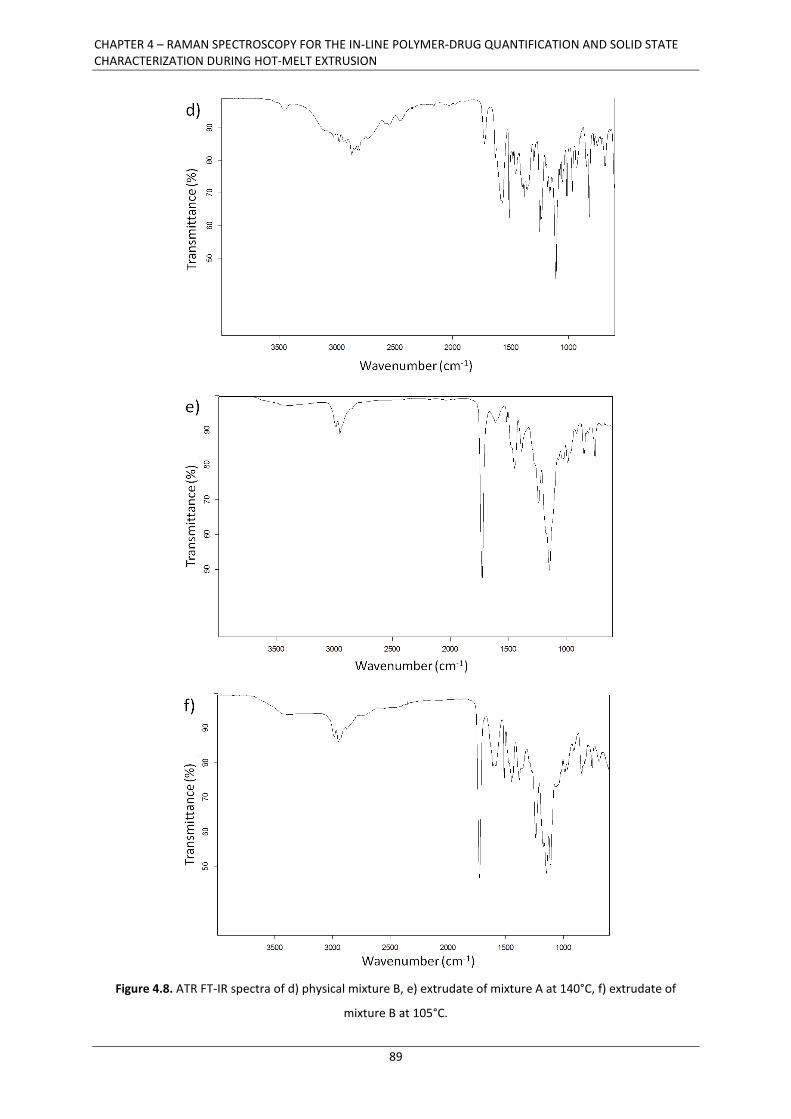
CHAPTER 4 – RAMAN SPECTROSCOPY FOR THE IN-LINE POLYMER-DRUG QUANTIFICATION AND SOLID STATE CHARACTERIZATION DURING HOT-MELT EXTRUSION
89
Figure 4.8. ATR FT-IR spectra of d) physical mixture B, e) extrudate of mixture A at 140°C, f) extrudate of
mixture B at 105°C.

CHAPTER 4 – RAMAN SPECTROSCOPY FOR THE IN-LINE POLYMER-DRUG QUANTIFICATION AND SOLID STATE CHARACTERIZATION DURING HOT-MELT EXTRUSION
90
To demonstrate that the broadening of peaks and the peak shifts occurring in the in-line
collected spectra are not an effect of the measurement environment (i.e. caused by the
effect of temperature changes on the Raman measurements), samples were collected during
extrusion of a mixture containing 40% MPT and 60% Eudragit ® RS PO (w/w), and cooling at
room temperature was monitored with Raman spectroscopy immediately after sample
collection. After one day of storage at room temperature, Raman spectra of the samples
were collected again. All of these spectra were compared to the spectra of the physical
mixtures and the spectra gathered in-line during extrusion. During extrusion, a throughput
of 0.3 kg/h, a screw speed of 80 rpm and a barrel temperature of 140°C were applied.
Figure 4.9. Raman spectra from the physical mixture (MPT – Eudragit® RS PO 40-60) (black), the extrudates
during extrusion (red) and the extrudates after cooling at room temperature (blue).

CHAPTER 4 – RAMAN SPECTROSCOPY FOR THE IN-LINE POLYMER-DRUG QUANTIFICATION AND SOLID STATE CHARACTERIZATION DURING HOT-MELT EXTRUSION
91
As demonstrated in Figure 4.9, the spectral difference between the physical mixture and the
in-line measurements is manifested as peak broadening, due to a transition from crystalline
to amorphous MPT, and as peak shifts, caused by the interaction of MPT with Eudragit® RS
PO. After cooling the extrudates at room temperature, the broadening of the peaks
remained visible, as well as the peak shifts, indicating that this is an actual physicochemical
difference between sample and physical mixture, rather than an effect of measurement
environment.

CHAPTER 4 – RAMAN SPECTROSCOPY FOR THE IN-LINE POLYMER-DRUG QUANTIFICATION AND SOLID STATE CHARACTERIZATION DURING HOT-MELT EXTRUSION
92
4.4. CONCLUSION
In this chapter, Raman spectroscopy was evaluated as a PAT tool to monitor the API
concentration and polymer-drug melt solid state during pharmaceutical hot-melt extrusion
processes. Comparison between the in-line collected Raman spectra and the off-line
obtained DSC thermograms and ATR FT-IR spectra demonstrated that information about the
physicochemical state of a polymer-drug melt can be obtained from the Raman spectra,
allowing monitoring and prediction of the polymer-drug solid state throughout the extrusion
process. With Raman spectroscopy, it was possible to detect differences between
amorphous and crystalline polymer drug melts. The in-line collected Raman spectra also
gave an indication of the occurring interactions during the hot-melt extrusion process, which
leads to a better understanding of the process.
A PLS model was developed and validated, allowing drug concentration monitoring of
unknown samples during hot-melt extrusion. Raman spectroscopy was able to detect
variations in drug concentration and to predict drug concentrations with an RMSEP of 0.59%
(w/w).

CHAPTER 4 – RAMAN SPECTROSCOPY FOR THE IN-LINE POLYMER-DRUG QUANTIFICATION AND SOLID STATE CHARACTERIZATION DURING HOT-MELT EXTRUSION
93
4.5. REFERENCES
[1] R. Chokshi, H. Zia, Iranian J Pharm Res 3 (2004) 3-16.
[2] J. Breitenbach, Eur J Pharm Biopharm 54 (2002) 107-117.
[3] M.M. Crowley, F. Zhang, M.A. Repka, S. Thumma, S.B. Upadhye, S. Battu, J.W.
McGinity, C. Martin, Drug Dev Ind Pharm 33 (2007) 909-926.
[4] M.A. Repka, S. Battu, S.B.Upadhye, S. Thumma, M.M. Crowley, F. Zhang, C. Martin,
J.W. McGinity, Drug Dev Ind Pharm 33 (2007) 1043-1057.
[5] M.A. Repka, S. Majumdar, S. Battu, R. Srirangam, S.B. Upadhye, Expert Opin Drug
Deliv 5 (2008) 1357-1376.
[6] E.I. Keleb, A. Vermeire, C. Vervaet, J.P. Remon, Int J Pharm 273 (2004) 183–194.
[7] Food and Drug Administration, Process Analytical Technology Initiative, Guidance for
Industry; PAT - A Framework for Innovative Pharmaceutical development,
Manufacturing and Quality Assurance, 2004.
[8] S.E. Barnes, M.G. Sibley, H.G.M. Edwards, P.D. Coates, Trans Inst Meas Control, 29
(2007) 453-465.
[9] S.E. Barnes, E.C. Brown, M.G. Sibley, H.G.M. Edwards, P.D. Coates, Analyst 130 (2005)
286-292.
[10] V.S. Tumuluri, M.S. Kemper, I.R. Lewis, S. Prodduturi, S. Majumdar, B.A. Avery, M.A.
Repka, Int J Pharm 357 (2008) 77-84.
[11] S.E. Barnes, E.C. Brown, M.G. Sibley, H.G.M. Edwards, I.J. Scowen, P.D. Coates, Appl
Spectrosc 59 (2005) 611-619.
[12] P.D. Coates, S.E. Barnes, M.G. Sibley, E.C. Brown, H.G.M. Edwards, I.J. Scowen,
Polymer 44 (2003) 5937-5949.
[13] I. Alig, D. Fischer, D. Lellinger, B. Steinhoff, Macromol Symp 230 (2005) 51-58.
[14] L. Li, O. AbuBaker, Z.J. Shao, Drug Dev Ind Pharm 32 (2006) 991-1002.
[15] L.S. Taylor, G. Zografi, Pharm Res 14 (1997) 1691-1698.
[16] Z. Dong, A. Chatterji, H. Sandhu, D.S. Choi, H. Chokshi, N. Shah, Int J Pharm 355 (2007)
141-149.
[17] J. Breitkreutz, Pharm Res 15 (1998) 1370-1375.

CHAPTER 4 – RAMAN SPECTROSCOPY FOR THE IN-LINE POLYMER-DRUG QUANTIFICATION AND SOLID STATE CHARACTERIZATION DURING HOT-MELT EXTRUSION
94
[18] L. Eriksson, E. Johansson, N. Kettaneh-Wold, J. Trygg, C. Wikström, S. Wold, Multi-
and Megavariate Data Analysis Part I: Basic Principles and Applications, 2nd ed.,
Umetrics Academy, Umeå, Sweden, 2006.
[19] Y. He, B. Zhu, Y. Inoue, Prog Polym Sci 29 (2004) 1021-1051.
[20] M. De Veij, P. Vandenabeele, T. De Beer, J.-P. Remon, L. Moens, J Raman spectrosc 40
(2008) 297-30.
[21] G. Socrates, Infrared and Raman Characteristic Group Frequencies: Tables and Charts,
3rd ed., John Wiley & Sons Ltd., Chichester, UK, 2004.
[22] V.B. Mathot, Calorimetry and Thermal Analysis of Polymers, 1st ed., Hanser
Publishers, New York, USA, 1994.
[23] S. Qi, A. Gryczke, P. Belton, D.Q.M. Craig, Int J Pharm 354 (2008) 158-167.

CHAPTER 5 – VALIDATION OF AN IN-LINE RAMAN SPECTROSCOPIC METHOD FOR CONTINUOUS API QUANTIFICATION DURING PHARMACEUTICAL HOT-MELT EXTRUSION
95
CHAPTER 5
VALIDATION OF AN IN-LINE RAMAN
SPECTROSCOPIC METHOD FOR
CONTINUOUS API QUANTIFICATION
DURING PHARMACEUTICAL HOT-MELT
EXTRUSION
Parts of this chapter are published in:
L. Saerens, N. Segher, C. Vervaet, J.P. Remon, T. De Beer. Validation of an in-line Raman
spectroscopic method for continuous API quantification during pharmaceutical hot-melt
extrusion. Accepted for publication in Analytica Chimica Acta (2013).
CHAPTER 5 – VALIDATION OF AN IN-LINE RAMAN SPECTROSCOPIC METHOD FOR CONTINUOUS API QUANTIFICATION DURING PHARMACEUTICAL HOT-MELT EXTRUSION
96
ABSTRACT
A calibration model for in-line API determination was developed based on Raman spectra
collected during hot-melt extrusion. This predictive model was validated by calculating the
accuracy profile based on the analysis results of validation experiments. Furthermore, based
on the data of the accuracy profile, the measurement uncertainty was determined. Finally,
the robustness of the model was evaluated.
A Raman probe was implemented in the die of a twin-screw extruder, to monitor the drug
concentration during extrusion of physical mixtures containing 15, 20, 25, 30 and 35% (w/w)
metoprolol tartrate (MPT) in Eudragit® RS PO. Different calibration models for the
prediction of the MPT content were developed, based on the use of single spectra or
averaged spectra, and using partial least squares (PLS) regression or multivariate curve
resolution (MCR). These predictive models were validated by extruding and monitoring
mixtures containing 17.5, 22.5, 25.0, 27.5 and 32.5% (w/w) MPT. Each validated
concentration was monitored on three different days, by two different operators. The β-
expectation tolerance intervals were calculated for each model and for each of the validated
MPT concentration levels (β was set at 95%), and acceptance limits were set at 10% (relative
bias), indicating that at least 95% of future measurements should not deviate more than
10% from the true value. The only model where these acceptance limits were not exceeded,
was the MCR model based on averaged Raman spectra. The uncertainty measurements for
this model showed that the unknown true value can be found at a maximum of ± 7.00%
around the measured result, with a confidence level of 95%. The robustness of this model
was evaluated via an experimental design varying throughput, screw speed and barrel
temperature. The robustness designs showed no significant influence of any of the
fluctuating process settings on the predicted concentration values.
Raman spectroscopy proved to be a fast, non-destructive and reliable method for the
quantification of MPT during hot-melt extrusion. From the accuracy profile of the MCR
model based on averaged spectra, it was concluded that for each MPT concentration in the
validated concentration range, 95 out 100 future routine measurements will be included
within the acceptance limits (10%).

CHAPTER 5 – VALIDATION OF AN IN-LINE RAMAN SPECTROSCOPIC METHOD FOR CONTINUOUS API QUANTIFICATION DURING PHARMACEUTICAL HOT-MELT EXTRUSION
97
CHAPTER 5
VALIDATION OF AN IN-LINE RAMAN
SPECTROSCOPIC METHOD FOR CONTINUOUS
API QUANTIFICATION DURING
PHARMACEUTICAL HOT-MELT EXTRUSION
5.1. INTRODUCTION
Raman spectroscopy is a molecular vibrational spectroscopic technique, allowing fast and
non-destructive measurements which do not require any sample pretreatment. The use of
custom made fibre optic probes connected to the spectrometers allows the implementation
into the process stream [1]. A Raman spectrum is an overlay of the fingerprints (i.e., a
combination of spectral bands) of the individual components in a mixture, making Raman
spectroscopy a suitable tool for quantification purposes. Hence, Raman spectroscopy can be
applied as a process analytical tool to monitor and predict the concentration of an active
pharmaceutical ingredient (API) during hot-melt extrusion.
So far, only two quantitative applications of Raman spectroscopy during hot-melt extrusion
have been reported. In a first application [2] the API concentration was monitored behind
the extrusion die, where a Raman probe was clamped above an extruded film. In the second
application [3], the Raman probe was implemented in the extrusion die to monitor the API
content of the extrudates. In both applications, a partial least squares (PLS) regression
model was developed for the prediction of the API concentration, and a traditional
chemometric validation approach [4] was used to validate the predictive models. First, the

CHAPTER 5 – VALIDATION OF AN IN-LINE RAMAN SPECTROSCOPIC METHOD FOR CONTINUOUS API QUANTIFICATION DURING PHARMACEUTICAL HOT-MELT EXTRUSION
98
root mean square error of calibration (RMSEC) and the root mean square error of the cross
validation (RMSECV) are calculated, and then an external validation dataset is used to
validate the predictive model. The quantitative performance of the Raman spectroscopic
models is evaluated by calculating the root mean square error of prediction (RMSEP) based
on the prediction results of the validation experiments. Small values of RMSEC, RMSECV and
RMSEP indicate a good quantitative performance of the models. However, this validation
approach does not fulfil the regulatory requirements in the ICH Q2 [5] and FDA [6]
guidelines for validation of analytical procedures.
Many official documents [5, 6] describe the validation criteria which should be assessed, but
no experimental protocols are provided. The ICH Q2 guideline [5] requires the assessment
of accuracy, precision (repeatability and intermediate precision), specificity, linearity and
range to validate an analytical quantification method for the active pharmaceutical
ingredient in a drug product. The same validation characteristics are entailed by the FDA
guidelines for validation [6], with addition of the robustness of the method. However, these
guidelines are most often limited to these general concepts [7]. The determination of the
validation parameters and the chemometric values (RMSEC, RMSECV, and RMSEP) does not
suffice to evaluate the risk that every future measurement will be close enough to the
unknown true value of the sample. These statistics only provide information concerning
previously performed experiments. Statistics allowing to make a decision related to the
validity of a method for future analyses are necessary.
The Société Française des Sciences et Techniques Pharmaceutiques (SFSTP) has developed a
validation strategy based on the total error of the procedure (bias + standard deviation).
Each analytical measurement reflects its true value, the bias of the method and its precision
[8]. This approach minimizes the risk to accept an inaccurate calibration method or to reject
a capable method. The objective of validation is to guarantee that every measurement
performed in future analysis is close enough to the unknown true value [7], and that the
difference will be lower than a preset acceptance limit. In this chapter, a Raman
spectroscopic method for the quantification of metoprolol tartrate (MPT) in a polymer
matrix during a hot-melt extrusion process was developed and validated by calculating the
accuracy profile based on the analysis results of validation experiments.

CHAPTER 5 – VALIDATION OF AN IN-LINE RAMAN SPECTROSCOPIC METHOD FOR CONTINUOUS API QUANTIFICATION DURING PHARMACEUTICAL HOT-MELT EXTRUSION
99
5.2. MATERIALS AND METHODS
5.2.1. Materials
Physical mixtures containing MPT (Esteve Quimica, Spain), Eudragit® RS PO (Evonik,
Germany) and magnesium stearate (Mg St) (Fagron, Belgium) were blended in a Turbula
mixer before extrusion. The Mg St was added to the formulation to improve feeding
behaviour of the mixtures in the extruder. Preparation of the validation mixtures was
performed in triplicate, to allow extrusion on three different days, by two different
operators.
5.2.2. Hot-melt extrusion
All physical mixtures were extruded on a 16 mm twin-screw extruder (Prism Eurolab 16,
Thermo Fisher Scientific, Germany). The hot-melt extruder was equipped with a DD
Flexwall® 18 gravimetric feeder (Brabender® Technologie, Germany), which was set in its
gravimetric feeding mode and supplied the physical mixtures with a throughput of 0.3 kg/h.
The applied screw speed was 80 rpm for all experiments, and the barrel temperature from
feeding area to die was set at 70-142-142-142-142-120°C.
5.2.3. Raman spectroscopy
In-line Raman spectra were collected with a Raman Rxn1 spectrometer (Kaiser Optical
Systems, Ann Arbor, MI, USA). A fibre-optic Raman Dynisco probe was implemented into the
die head (Figure 5.1) [3], to monitor the MPT concentration of the melt before it is forced
through the die. The laser wavelength was the 785 nm line from a 785 nm Invictus NIR diode
laser. All in-line collected spectra were recorded with a resolution of 4 cm-1 and an exposure
time of three seconds, using a laser power of 400 mW. Spectra were collected every 15
seconds. Data collection and data transfer were automated using the HoloGRAMSTM data
collection software, and the Matlab software (version 7.1, The MathWorks Inc., Natick, MA).
Once an experiment was started, 15 minutes stabilization time was applied before starting

CHAPTER 5 – VALIDATION OF AN IN-LINE RAMAN SPECTROSCOPIC METHOD FOR CONTINUOUS API QUANTIFICATION DURING PHARMACEUTICAL HOT-MELT EXTRUSION
100
the collection of the spectra. After this, the experiments were continued for another 15
minutes, during which 60 in-line spectra were collected.
Figure 5.1. Experimental setup: Raman Dynisco probe (1) implemented in the die (2) of a 16 mm twin-screw
extruder.
5.2.4. Development of the Raman calibration models
Four different calibration models based on the Raman spectra collected during extrusion of
the calibration mixtures (Table 5.1) were developed and evaluated. First, a PLS model was
developed using the SIMCA P+ software (Version 12.0.1.0, Umetrics, Umeå, Sweden) (Model
1). Prior to modelling, SNV pre-processing and Savitzky-Golay smoothing were applied on
the spectral range of 0 – 1800 cm-1 to eliminate the additive baseline offset variations and to
allow noise reduction in the spectra. The PLS model was built by regressing the 300 in-line
collected and preprocessed spectra (5 concentration levels x 60 spectra/concentration level)
versus the actual MPT concentration values (Table 5.1).

CHAPTER 5 – VALIDATION OF AN IN-LINE RAMAN SPECTROSCOPIC METHOD FOR CONTINUOUS API QUANTIFICATION DURING PHARMACEUTICAL HOT-MELT EXTRUSION
101
Table 5.1. Composition of the calibration and validation mixtures.
Calibration
mixtures
Metoprolol tartrate
(MPT)
(% w/w, theoretical)
Eudragit® RS
PO
(% w/w)
Magnesium
stearate
(% w/w)
Actual MPT
concentration
(% w/w)
1 15,0 84,5 0,5 15,0141
2 20,0 79,5 0,5 20,0090
3 25,0 74,5 0,5 25,0072
4 30,0 69,5 0,5 30,0077
5 35,0 64,5 0,5 35,0025
Validation
mixtures
MPT (% w/w,
theoretical)
Eudragit® RS
PO
(% w/w)
Magnesium
stearate
(% w/w)
Actual MPT
concentration
(% w/w) day 1
Actual MPT
concentration
(% w/w) day 2
Actual MPT
concentration
(% w/w) day 3
1 17,5 82,0 0,5 17,5056 17,4989 17,5078
2 22,5 77,0 0,5 22,5049 22,5049 22,5032
3 25,0 74,5 0,5 25,0037 25,0012 24,9993
4 27,5 72,0 0,5 27,4995 27,4995 27,5071
5 32,5 67,0 0,5 32,4979 32,5012 32,5023

CHAPTER 5 – VALIDATION OF AN IN-LINE RAMAN SPECTROSCOPIC METHOD FOR CONTINUOUS API QUANTIFICATION DURING PHARMACEUTICAL HOT-MELT EXTRUSION
102
Model 2, a PLS model as well, was not based on the original spectra collected during
extrusion of the calibration mixtures, but on the averaged spectra of ten successively
collected spectra. Therefore, this model was developed using 30 spectra (5 concentration
levels x 6 averaged spectra/concentration level). No official regulations on sample size for
extrusion processes exist, but the FDA guidance on content uniformity [9] states that sample
quantities larger than three times the dosage unit range can only be used with an adequate
scientific justification. The amount of MPT passing the probe window during one
measurement (three seconds) in the mixture with the highest MPT concentration (i.e. 35%
w/w), at a throughput of 0.3 kg/h is 87.5 mg. Since the unit dosage is 200 mg, and the
Raman signal does not penetrate the entire melt volume, the combination of ten spectra
does not exceed this limit.
For a third predictive model (Model 3), multivariate curve resolution (MCR) was applied,
using the HoloREACTTM reaction analysis and profiling software (Kaiser Optical Systems, Ann
Arbor, MI, USA). In MCR, a two-way data matrix D (m x n) is decomposed into two matrices
C (m x k) and ST (k x n), containing the pure concentration profiles for each modelled
component in the system and the corresponding pure spectra of the k species of the
unknown mixture, respectively [10]. This decomposition is performed according to Eq. (5.1):
(5.1)
Where E (m x n) is the error matrix containing the residual variation. Before analysis, a
baseline correction and normalization were applied on two spectral ranges. The first range,
1600 -1630 cm-1, represents a peak specific for MPT, and the second range from 1710 –
1750 cm-1 contains a peak for Eudragit® RS PO. Next, a model based on the MCR scores of
the MPT peak from 300 spectra (5 concentration levels x 60 spectra/ concentration level)
versus the actual MPT concentration, was developed. The same approach was used to
develop Model 4, but using the average spectra of ten successively collected spectra.

CHAPTER 5 – VALIDATION OF AN IN-LINE RAMAN SPECTROSCOPIC METHOD FOR CONTINUOUS API QUANTIFICATION DURING PHARMACEUTICAL HOT-MELT EXTRUSION
103
5.2.5. Validation of the Raman method and estimation of its uncertainty
The strategy suggested by the SFSTP [7, 8, 11, 12] was applied for validation of the
developed calibration models. The main objective of this commission was the harmonization
of approaches for the validation of quantitative analytical procedures. The objective of
validation is to guarantee that the difference between every single measurement (xi), which
will be performed in routine analysis, and the unknown true value of the sample (µT) will be
lower than an acceptable limit (λ) [7] (Eq. (5.2)):
(5.2)
For this particular analytical procedure, λ was set at 10%. A procedure is qualified as
acceptable when it can assure that the probability (Eq. (5.3)) that measurements will fall
outside the preset acceptance limits is less or equal to the risk that the analyst is able to
take during routine use:
(5.3)
with β being the proportion of measurements inside the acceptance limits. The expected
proportion of measurements falling outside the acceptance limits evaluates the risk of an
analytical procedure. In this study, the desired proportion of measurements found within
the acceptance limits was set at 95%.
The MPT concentration levels of the validation samples are overviewed in Table 5.1, and the
mean concentrations as calculated by the four different models are shown in Table 5.2. Each
validation mixture was extruded on three different days by two operators, accounting for
the inter-day and operator variation. Problems occurred during extrusion of the validation
mixture with a 32.5% (w/w) MPT concentration on the third day, caused by a defect in the
temperature monitoring device. Therefore, these spectral data were excluded from the data
analysis.

CHAPTER 5 – VALIDATION OF AN IN-LINE RAMAN SPECTROSCOPIC METHOD FOR CONTINUOUS API QUANTIFICATION DURING PHARMACEUTICAL HOT-MELT EXTRUSION
104
Table 5.2. Mean predicted MPT concentrations (% w/w).
MPT
concentration
(% w/w)
Actual MPT
concentration
(% w/w)
Mean predicted MPT
concentration (% w/w)
Model 1
Mean predicted MPT
concentration (% w/w)
Model 2
Mean predicted MPT
concentration (% w/w)
Model 3
Mean predicted MPT
concentration (% w/w)
Model 4
17,5 - day 1 17,5056 13,6026 13,7674 16,2110 17,0442
17,5 - day 2 17,4989 14,8947 14,8176 18,0945 17,6324
17,5 - day 3 17,5078 15,0605 15,2321 17,9913 17,7284
22,5 - day 1 22,5049 20,7349 21,0132 20,9911 22,0764
22,5 - day 2 22,5049 21,6028 21,7217 21,3559 21,7461
22,5 - day 3 22,5032 19,5813 19,8187 22,3763 21,4988
25,0 - day 1 25,0037 21,7440 22,0244 23,3160 23,4095
25,0 - day 2 25,0012 23,1770 23,4599 23,8353 24,2815
25,0 - day 3 24,9993 22,9997 23,2904 24,0506 24,0160
27,5 - day 1 27,4995 25,0717 25,3138 25,0914 25,3532
27,5 - day 2 27,4995 27,7401 27,7172 27,8007 26,8305
27,5 - day 3 27,5071 27,5212 27,6717 27,1136 27,0039
32,5 - day 1 32,4979 31,4534 31,6651 31,7784 32,1468
32,5 - day 2 32,5012 33,1504 33,3448 33,8719 32,9962

CHAPTER 5 – VALIDATION OF AN IN-LINE RAMAN SPECTROSCOPIC METHOD FOR CONTINUOUS API QUANTIFICATION DURING PHARMACEUTICAL HOT-MELT EXTRUSION
105
The objective of validation is to evaluate the risks or confidences that every single
measurement that will be performed, will be close enough to the unknown true value of the
sample. Therefore, the determination of trueness, precision, linearity and other validation
criteria is not sufficient to provide these guarantees. The adapted decision tool was the
accuracy profile of the analytical procedure based on the β-expectation tolerance interval
and the concept of total error (bias + standard deviation). Every analytical method is
characterized by a systematic error or true bias and a random error or true variance
(measured by a standard deviation) [7]. Both these parameters are inherent of the analytical
method and always unknown as well as the true value. The accuracy profile of a method is
acquired by calculating the β-expectation tolerance interval at every concentration level
[13], and is used to decide whether the analytical procedure is considered as valid or not [8].
The variance used to estimate the β-expectation tolerance interval is equal to the sum of
the total variance of the method plus the variance of the bias. The standard deviation of the
β-expectation tolerance interval can be used as an estimate of the standard uncertainty in
the measurements. Using the data collected for the development of the accuracy profile,
the measurement uncertainty was estimated [14]. The uncertainty is defined as a parameter
associated with the result of a measurement, which characterizes the dispersion of the
values that could reasonably be attributed to the measurand [15].
5.2.6. Evaluation of the robustness of the Raman calibration models
Finally, a robustness testing design was created with the MODDE software (version 9.1.0.0,
Umetrics, Umeå, Sweden) to evaluate whether the performance of the quantification
method is sensitive to small fluctuations in process settings. The factors throughput, screw
speed and barrel temperature were varied during extrusion of a physical mixture containing
25% MPT, 74.5% Eudragit® RS PO and 0.5% Mg St (w/w). The robustness testing design used
was a linear 23-1+3 fractional factorial design (resolution III) (Table 5.3). The factor levels
were chosen by considering which changes may occur in the laboratory. The responses used
in these designs were the MPT concentrations predicted by the developed models. The ideal
result in a robustness testing study is identical response values for each trial [16]. The
significance and lack of fit of the robustness design models were assessed via an F-test, to

CHAPTER 5 – VALIDATION OF AN IN-LINE RAMAN SPECTROSCOPIC METHOD FOR CONTINUOUS API QUANTIFICATION DURING PHARMACEUTICAL HOT-MELT EXTRUSION
106
evaluate the robustness of the responses. The robustness testing design was performed for
Model 4, which delivered the best accuracy profile.
Table 5.3. Robustness design.
Experiment
number
Run Order Throughput
(kg/h)
Screw speed
(rpm)
Temperature (°C)
1 7 0,275 70 70-144-144-144-144-120
2 4 0,325 70 70-140-140-140-140-120
3 5 0,275 90 70-140-140-140-140-120
4 1 0,325 90 70-144-144-144-144-120
5 3 0,3 80 70-142-142-142-142-120
6 6 0,3 80 70-142-142-142-142-120
7 2 0,3 80 70-142-142-142-142-120

CHAPTER 5 – VALIDATION OF AN IN-LINE RAMAN SPECTROSCOPIC METHOD FOR CONTINUOUS API QUANTIFICATION DURING PHARMACEUTICAL HOT-MELT EXTRUSION
107
5.3. RESULTS AND DISCUSSION
5.3.1. Development of the Raman calibration models
For the development of Model 1, the first predictive model for MPT concentration
monitoring, all in-line collected preprocessed Raman spectra (300 spectra in total) (X) were
regressed versus the actual MPT concentrations (Y). Two principal components were
chosen, since the goodness of prediction of the model (Q² = 0.993) did not improve
significantly when adding extra components. The scores and loading plot for the first
principal component (R² = 0.937) confirm that this component represents the variation in
the Raman spectra caused by the difference in MPT concentration level in the calibration
mixtures (Figure 5.2). Positive peaks in the loading of the first component correspond to
MPT-peaks, whereas the negative peaks belong to the polymer. A higher PC 1 score value
therefore indicates a higher MPT concentration. The RMSECV of this two-component PLS
model is 0.61% (w/w). The predictive performance of this model was evaluated by
calculating the MPT concentrations for the spectra collected during extrusion of all
validation mixtures. This resulted in an RMSEP value of 2.28% (w/w).
A second PLS model, referred to as Model 2 in section 5.2.4., was developed using the
averaged spectra collected during extrusion of the calibration mixtures. A two-component
model was developed (Q² = 0.994), and the first principal component (R² = 0.941) captured
the variation in the Raman spectra originating from concentration level differences in the
calibration mixtures. The RMSECV of this two-component PLS model was 0.57% (w/w). The
predictive performance of the model was evaluated by calculating the MPT concentrations
for the averaged spectra collected during extrusion of all validation mixtures. This resulted
in an RMSEP value of 2.09% (w/w).
Models 3 and 4 are calibration models based on the MCR scores for one MPT peak (1600 –
1630 cm-1) from the original (300) and averaged (30) spectra, respectively. Linear regression
of these MPT scores resulted in an R² of 0.95 and 0.99, and an RMSEP of 1.57% and 1.09%
(w/w) for Models 3 and 4, respectively.

CHAPTER 5 – VALIDATION OF AN IN-LINE RAMAN SPECTROSCOPIC METHOD FOR CONTINUOUS API QUANTIFICATION DURING PHARMACEUTICAL HOT-MELT EXTRUSION
108
Figure 5.2. a) PC 1 versus PC 2 scores scatterplots of in-line collected Raman spectra during extrusion of the
calibration mixtures and b) loading plot of the first principal component.
5.3.2. Validation of the Raman method and estimation of its uncertainty
The MPT concentration of the validation mixtures was predicted during extrusion, using the
four developed calibration models. The mean calculated concentrations for each model are
presented in Table 5.2. Since the introduced MPT concentrations for each concentration
level differed slightly, an alignment on the concentration level was performed prior to data
analysis. For each validation concentration level, trueness, precision, and β-expectation
tolerance intervals were calculated (Table 5.4) and the linearity was assessed (Table 5.4 and
Figure 5.3). The specificity of the method was demonstrated by the loadings of PC 1 (Figure
5.2b), which clearly showed that the largest source of variation (93.7%) in the in-line
collected Raman spectra is related to changes in MPT concentration. For all four models, a
linear relation between the introduced MPT concentration and the MPT concentration as
calculated by the model was found, and the R² values (Figure 5.3) all approach 1. The
calculated values for precision (Table 5.4) show that the results for intermediate precision
are equal to or worse than the repeatability results for all MPT concentration levels in all
applied calibration models. The intermediate precision comprises both the variability caused

CHAPTER 5 – VALIDATION OF AN IN-LINE RAMAN SPECTROSCOPIC METHOD FOR CONTINUOUS API QUANTIFICATION DURING PHARMACEUTICAL HOT-MELT EXTRUSION
109
by the extrusion of the validation mixtures on different days, and the fact that the
experiments were performed by two different operators. This difference between
repeatability and intermediate precision indicates that the inter-day variability in the
dataset is larger than the within-day variability, which is caused by an operator or day effect.
Regarding the operator effect, each operator might for instance fixate the Raman probe
more tightly or loosely in the extrusion die, also causing variations in the in-line collected
Raman spectra.
Figure 5.3. Assessment of linearity (computed concentration = ƒ(introduced concentration)) for a) Model 1, b)
Model 2, c) Model 3, d) Model 4.
For models 1, 2 and 3, the β-expectation tolerance intervals exceeded the preset acceptance
limits (10% relative bias) for each of the validated concentration levels (Figure 5.4). In model
4, the only validated concentration of which the acceptance limits were exceeded by the β-
expectation tolerance interval, is the mixture with 27.5% MPT (w/w). Table 5.2 shows that
for this concentration level, the mean predicted concentration for Model 4 is much lower on
day 1, 25.3532% MPT, than on day 2 and 3, 26.8305% MPT and 27.0039% MPT (w/w)
respectively. The Raman spectra collected on this day showed larger background signal
variations than on day 2 and 3, which might cause the larger error in prediction of the MPT
concentration. However, a clear cause for these background variations was not found.
When the data from day 1 were excluded from the accuracy profile calculations, the β-
expectation tolerance intervals for all validated concentrations remained within the

CHAPTER 5 – VALIDATION OF AN IN-LINE RAMAN SPECTROSCOPIC METHOD FOR CONTINUOUS API QUANTIFICATION DURING PHARMACEUTICAL HOT-MELT EXTRUSION
110
acceptance limits of 10% (Figure 5.5). Thus the entire accuracy profile, created after
connecting the upper and lower tolerance limits for the validated concentration levels in
order to interpolate the behaviour of the limits for the entire method range, was found
within the preset acceptance limit. This indicates that, for at least 95 out of 100 future
routine measurements, the predicted concentrations will be included within the acceptance
limits.
Figure 5.4. Accuracy profiles for a) Model 1, b) Model 2, c) Model 3, d) Model 4. The red lines represent the
acceptance limits which were set at 10% relative bias.
Figure 5.5. Accuracy profile for Model 4, with exclusion of the spectra collected during extrusion of the
validation mixture with 27.5% MPT (w/w) on day 1. The red lines represent the acceptance limits which were
set at 10% relative bias.

CHAPTER 5 – VALIDATION OF AN IN-LINE RAMAN SPECTROSCOPIC METHOD FOR CONTINUOUS API QUANTIFICATION DURING PHARMACEUTICAL HOT-MELT EXTRUSION
111
Table 5.4. Validation parameters for each calibration model: trueness, precision, accuracy and linearity.
Trueness Model 1 Model 2 Model 3 Model 4
MPT
concentration
(% w/w)
Relative bias
(%)
Recovery
(%)
Relative bias
(%)
Recovery
(%)
Relative bias
(%)
Recovery
(%)
Relative bias
(%)
Recovery
(%)
17,50 -17,05 82,95 -16,56 83,44 -0,41 99,59 -0,20 99,80
22,50 -8,29 91,71 -7,35 92,65 -4,13 95,87 -3,18 96,82
25,00 -9,45 90,55 -8,31 91,69 -5,07 94,93 -4,40 95,60
27,50 -2,63 97,37 -2,19 97,81 -3,03 96,97 -4,02 95,98
32,50 -0,61 99,39 0,02 100,02 1,00 101,00 0,22 100,22
Precision Model 1 Model 2 Model 3 Model 4
MPT
concentration
(% w/w)
Repeatability
standard
deviation (%)
Intermediate
precision
standard
deviation (%)
Repeatability
standard
deviation (%)
Intermediate
precision
standard
deviation (%)
Repeatability
standard
deviation (%)
Intermediate
precision
standard
deviation (%)
Repeatability
standard
deviation (%)
Intermediate
precision
standard
deviation (%)
17,50 4,98 5,64 3,04 4,63 6,03 8,02 1,71 2,34
22,50 3,41 5,66 2,47 5,11 7,30 7,30 2,31 2,31
25,00 3,63 4,55 2,72 3,74 4,09 4,09 2,37 2,49
27,50 3,97 6,64 1,06 5,74 4,78 6,71 1,08 4,09
32,50 2,56 4,32 2,96 4,07 4,48 5,94 3,29 3,29

CHAPTER 5 – VALIDATION OF AN IN-LINE RAMAN SPECTROSCOPIC METHOD FOR CONTINUOUS API QUANTIFICATION DURING PHARMACEUTICAL HOT-MELT EXTRUSION
112
Table 5.4. Validation parameters for each calibration model: trueness, precision, accuracy and linearity (continued).
Accuracy
MPT
concentration
(% w/w)
Model 1
β-expectation tolerance limits
(%)
Model 2
β-expectation tolerance limits
(%)
Model 3
β-expectation tolerance limits
(%)
Model 4
β-expectation tolerance limits
(%)
17,50 [-29,19; -6,38] [-28,46; -4,72] [-22,82; 22,00] [-7,04; 6,10]
22,50 [-26,54; 10,39] [-30,13; 15,97] [-20,35; 12,09] [-8,08; 2,31]
25,00 [-19,95; 2,02] [-17,71; 1,65] [-14,07; 3,93] [-9,47; 1,94]
27,50 [-24,69; 21,77] [-29,50; 26,47] [-22,86; 16,80] [-22,857; 16,10]
32,50 [-64,34; 63,85] [-20,17; 19,47] [-28,30; 30,30] [-8,49; 8,62]
Linearity
Model 1
Model 2
Model 3
Model 4
R² 0,9574 0,9663 0,9102 0,9676
Intercept -6,4101 -6,3373 -0,8193 -0,1888
Slope 1,1914 1,1957 1,0082 0,9821

CHAPTER 5 – VALIDATION OF AN IN-LINE RAMAN SPECTROSCOPIC METHOD FOR CONTINUOUS API QUANTIFICATION DURING PHARMACEUTICAL HOT-MELT EXTRUSION
113
Table 5.5. Estimates of the different uncertainties for each level of the accuracy profile in each calibration model.
MPT concentration level Uncertainty of the bias Uncertainty Expanded uncertainty Relative expanded uncertainty
(% w/w) (% w/w) (% w/w) (% w/w) (%)
Model 1 17,5 0,30 0,87 1,79 9,89
22,5 0,58 1,31 2,61 11,60
25,0 0,43 1,12 2,25 8,98
27,5 0,89 2,01 4,01 14,60
32,5 0,85 1,64 3,28 10,10
Model 2 17,5 0,32 0,75 1,50 8,55
22,5 0,56 1,21 2,41 10,72
25,0 0,38 0,94 1,88 7,53
27,5 0,89 1,79 3,58 13,00
32,5 0,73 1,51 3,01 9,30
Model 3 17,5 0,61 15,30 3,05 17,44
22,5 0,45 1,64 3,28 14,56
25,0 0,28 1,01 2,02 8,08
27,5 0,81 1,96 3,93 14,30
32,5 1,05 2,21 4,43 13,60
Model 4 17,5 0,18 0,45 0,89 5,11
22,5 0,15 0,52 1,05 4,66
25,0 0,20 0,63 1,26 5,05
27,5 0,14 0,37 0,74 2,70
32,5 0,38 1,14 2,27 7,00

CHAPTER 5 – VALIDATION OF AN IN-LINE RAMAN SPECTROSCOPIC METHOD FOR CONTINUOUS API QUANTIFICATION DURING PHARMACEUTICAL HOT-MELT EXTRUSION
114
According to a recent draft of guide ISO/DTS 21748 [14, 17], the measurement uncertainty
can be estimated from trueness and precision (repeatability and reproducibility). Table 5.5
shows the estimates for the uncertainty of bias, the uncertainty which combines the
uncertainty of bias with the intermediate precision standard deviation, the expanded
uncertainty and the relative expanded uncertainty for each level of the accuracy profile in
each calibration model. The expanded uncertainty defines a 95% probability interval around
the mean value in which the unknown true value is found. The relative expanded
uncertainty is the expanded uncertainty divided with the corresponding introduced
concentration [15]. For Model 4, the relative expanded uncertainty was not higher than
7.00% (after exclusion of the data generated during extrusion of the validation mixture
containing 32.5% MPT (w/w) on day 1). This demonstrates that with a confidence level of
95%, the unknown true value is found at a maximum of ± 7.00% around the measured
result.
5.3.3. Evaluation of the robustness of the Raman calibration models
Since Model 4, based on the averaged Raman spectra and developed with MCR resulted in
the best accuracy profile, the robustness was only assessed for this model. During
robustness testing, the sensitivity of the responses to small changes in the factors was
determined. A physical mixture containing 25% MPT, 74.5% Eudragit ® RS PO and 0.5% Mg
St (w/w) was extruded according to a linear 23-1+3 fractional factorial design, where the
effects of small changes in barrel temperature (140 – 144°C), throughput (0.275 – 0.325
kg/h) and screw speed (70 – 90 rpm) on the predicted MPT concentration (response) were
evaluated (Table 5.3).
The model parameters of interest for robustness evaluation are listed in Table 5.6. An ideal
result is a Q² near zero, indicating a weak relationship between the factors and the
response. Model 4 resulted in a Q² of -0.2, demonstrating that the response, i.e. the
predicted MPT concentration, was robust. A negative Q² suggests a very poor model.
Besides the calculation of Q², two F-tests were performed. The first F-test, the regression
model significance test, was used to determine whether the modellable variation in the
dataset is larger than the residual variation. When p1 is smaller than 0.05, the variance

CHAPTER 5 – VALIDATION OF AN IN-LINE RAMAN SPECTROSCOPIC METHOD FOR CONTINUOUS API QUANTIFICATION DURING PHARMACEUTICAL HOT-MELT EXTRUSION
115
explained by the model is larger than the unexplained variance, and the model is significant
[18]. For Model 4, the p1 value exceeded the 0.05 reference value, indicating that the model
was insignificant. A second F-test, the lack of fit test, compared the model error (the fact
that the model is imperfect) to the replicate error (presence of variation when performing
replicate experiments) [18]. A p2 value higher than the reference value of 0.05, indicates
that both errors are small and of the same magnitude. p2 is 0.050 for model 4,
demonstrating that it showed (or bordered on) lack of fit. From these parameters, it can be
concluded that there was no significant relationship between the predicted MPT
concentrations and the small factor changes. Therefore, the response is robust to the
applied variations in process settings.
Table 5.6. Model parameters of interest for robustness evaluation.
Q² p1
(Regression model significance test)
p2
(Lack of fit test)
Model 4 -0,2 0,19 0,05

CHAPTER 5 – VALIDATION OF AN IN-LINE RAMAN SPECTROSCOPIC METHOD FOR CONTINUOUS API QUANTIFICATION DURING PHARMACEUTICAL HOT-MELT EXTRUSION
116
5.4. CONCLUSION
An in-line Raman spectroscopic method was developed and validated for the determination
of the active content during pharmaceutical hot-melt extrusion, based on multivariate curve
resolution modelling of the averaged in-line collected Raman spectra. The method was
thoroughly validated, and showed good precision, trueness, linearity, specificity and
accuracy over the applied concentration range. The accuracy profile guaranteed that 95 out
of 100 future routine measurements will be included within the preset acceptance limits of
10%. The uncertainty of the measurements was assessed via the uncertainty of bias and the
expanded uncertainty at each concentration level. The robustness of the response was also
evaluated, and demonstrated that the determined MPT concentration was insensitive to the
applied fluctuations in process settings.

CHAPTER 5 – VALIDATION OF AN IN-LINE RAMAN SPECTROSCOPIC METHOD FOR CONTINUOUS API QUANTIFICATION DURING PHARMACEUTICAL HOT-MELT EXTRUSION
117
5.5. REFERENCES
[1] T. De Beer, A. Burggraeve, M. Fonteyne, L. Saerens, J.P. Remon, C. Vervaet, Int J
Pharm 417 (2011) 32-47.
[2] V.S. Tumuluri, M.S. Kemper, I.R. Lewis, S. Prodduturi, S. Majumdar, B.A. Avery, M.A.
Repka, Int J Pharm 357 (2008) 77-84.
[3] L. Saerens, L. Dierickx, B. Lenain, C. Vervaet, J.P. Remon, T. De Beer, Eur J Pharm
Biopharm 77 (2011) 158-163.
[4] C. De Bleye, P.F. Chavez, J. Mantanus, R. Marini, P. Hubert, E. Rozet, E. Ziemons, J
Pharm Biomed Anal 60 (2012) 125-132.
[5] International Conference on Harmonisation of Technical Requirements for
Registration of Pharmaceuticals for Human Use, Validation of Analytical Procedures:
Text and Methodology Q2 (R1), 2005.
[6] Food and drug administration, Guidance for Industry (draft), Analytical Procedures
and Methods Validation, 2000.
[7] P. Hubert, J.J. Nguyen-Huu, B. Boulanger, E. Chapuzet, P. Chiap, N. Cohen, P.A.
Compagnon, W. Dewé, M. Feinberg, M. Lallier, M. Laurentie, N. Mercier, G. Muzard,
C. Nivet, L. Valat, J Pharm Biomed Anal 32 (2004) 579-586.
[8] P. Hubert, J.J. Nguyen-Huu, B. Boulanger, E. Chapuzet, N. Cohen, P.A. Compagnon,
W. Dewé, M. Feinberg, M. Laurentie, N. Mercier, G. Muzard, L. Valat, E. Rozet, J
Pharm Biomed Anal 45 (2007) 82-96.
[9] Food and Drug Administration, Guidance for Industry, Powder Blends and Finished
Dosage Units - Stratified In-Process Dosage Unit Sampling and Assessment, 2003.
[10] C. Ruckebusch, L. Blanchet, Anal Chim Acta 765 (2013) 28-36.
[11] P. Hubert, J.J. Nguyen-Huu, B. Boulanger, E. Chapuzet, P. Chiap, N. Cohen, P.A.
Compagnon, W. Dewé, M. Feinberg, M. Lallier, M. Laurentie, N. Mercier, G. Muzard,
C. Nivet, L. Valat, E. Rozet, J Pharm Biomed Anal 45 (2007) 70-81.
[12] P. Hubert, J.J. Nguyen-Huu, B. Boulanger, E. Chapuzet, N. Cohen, P.A. Compagnon,
W. Dewé, M. Feinberg, M. Laurentie, N. Mercier, G. Muzard, L. Valat, E. Rozet, J
Pharm Biomed Anal 48 (2008) 760-771.
[13] R.W. Mee, Technometrics 26 (1984) 251-253.

CHAPTER 5 – VALIDATION OF AN IN-LINE RAMAN SPECTROSCOPIC METHOD FOR CONTINUOUS API QUANTIFICATION DURING PHARMACEUTICAL HOT-MELT EXTRUSION
118
[14] M. Feinberg, B. Boulanger, W. Dewé, P. Hubert, Anal Bioanal Chem 380 (2004) 502-
514.
[15] Eurachem/CITAC Guide CG4. Quantifying Uncertainty in Analytical Measurement, 3rd
ed., 2012.
[16] L. Eriksson, E. Johansson, N. Kettaneh-Wold, Wikström, S. Wold, Experimental
objective: Robustness testing, In: Design of Experiments: Principles and Applications,
3rd ed., Umetrics Academy, Umeå, Sweden, 2008, p. 169-181.
[17] ISO/DTS 21748 Guide to the use of repeatability, reproducibility and trueness
estimates in measurement uncertainty estimation, ISO, Geneva, Switzerland, 2003.
[18] L. Eriksson, E. Johansson, N. Kettaneh-Wold, Wikström, S. Wold, Analysis of Variance:
ANOVA, In: Design of Experiments: Principles and Applications, 3rd ed., Umetrics
Academy, Umeå, Sweden, 2008, p. 317-322.

CHAPTER 6 – VISUALIZATION AND PROCESS UNDERSTANDING OF MATERIAL BEHAVIOUR IN THE EXTRUSION BARREL DURING A HOT-MELT EXTRUSION PROCESS USING RAMAN SPECTROSCOPY
119
CHAPTER 6
VISUALIZATION AND PROCESS
UNDERSTANDING OF MATERIAL
BEHAVIOUR IN THE EXTRUSION BARREL
DURING A HOT-MELT EXTRUSION
PROCESS USING RAMAN SPECTROSCOPY
Parts of this chapter are published in:
L. Saerens, C. Vervaet, J.P. Remon, T. De Beer. Visualization and process understanding of
material behavior in the extrusion barrel during a hot-melt extrusion process using Raman
spectroscopy. Analytical Chemistry, 85 (2013) 5420-5429.

CHAPTER 6 – VISUALIZATION AND PROCESS UNDERSTANDING OF MATERIAL BEHAVIOUR IN THE EXTRUSION BARREL DURING A HOT-MELT EXTRUSION PROCESS USING RAMAN SPECTROSCOPY
120
ABSTRACT
The aim of Chapter 6 was to improve the understanding of material behaviour in
pharmaceutical hot-melt extrusion by implementing a Raman probe in each section of the
barrel. FT-IR measurements were performed to confirm the Raman observations.
Metoprolol tartrate (MPT) concentration (10 and 40% in Eudragit® RS PO (w/w)), extrusion
temperature (100, 120 and 140°C) and screw speed (80 and 160 rpm) were varied to
examine their influence on polymer/drug solid state throughout the barrel. When extruding
a formulation with a 40 (w/w) MPT concentration, broadening of MPT peaks indicates
melting of MPT between sections 2 and 3 of the extrusion barrel, caused by the presence of
a first kneading zone. Decreasing the concentration to 10% (w/w) shows an additional
spectral difference (i.e. peak shifts indicating interactions between MPT and carrier)
between sections 5 and 6, due to formation of a solid solution. At a 10% MPT load (w/w),
increasing the extrusion temperature does not influence the solid state or the barrel section
where the final solid state is obtained. At a drug load of 40% (w/w), the solid state of the
end product is reached further down the barrel when the temperature decreases. Doubling
the screw speed when processing a 10% MPT (w/w) formulation does not affect the solid
state of the product or the location where it is obtained. In contrast, at 40% drug load
(w/w), the section where the final product is produced, is situated earlier in the barrel when
a higher speed was applied. The Raman spectra provide real-time information about
polymer/drug behaviour throughout the barrel, facilitating process understanding and
optimisation.

CHAPTER 6 – VISUALIZATION AND PROCESS UNDERSTANDING OF MATERIAL BEHAVIOUR IN THE EXTRUSION BARREL DURING A HOT-MELT EXTRUSION PROCESS USING RAMAN SPECTROSCOPY
121
CHAPTER 6
VISUALIZATION AND PROCESS
UNDERSTANDING OF MATERIAL BEHAVIOUR
IN THE EXTRUSION BARREL DURING A HOT-
MELT EXTRUSION PROCESS USING RAMAN
SPECTROSCOPY
6.1. INTRODUCTION
Hot-melt extrusion (HME) is one of the most widely applied processing technologies in the
plastic, food and rubber industry [1]. In pharmaceutical manufacturing, HME is used to
obtain formulations where (poorly soluble) drugs are embedded in polymer matrices,
offering many advantages compared to conventional pharmaceutical processing techniques.
This processing technique does not require water or solvents; products have a short
residence time; bioavailability of poorly soluble drugs can be improved; production of
formulations with controlled, sustained or targeted release is possible and HME is a
continuous production process [1, 2].
Today, the pharmaceutical industry intends to move from the traditional batch processes
towards continuous processes, hereby increasing process efficiency and production.
Continuous processes are based on the ‘one-in-one-out’ principle and offer many
advantages: no scale-up issues resulting in a shorter development time; possible
automation of the production line; reduction of production costs; faster product release;
less product variability and improved product quality [3, 4]. The currently applied quality

CHAPTER 6 – VISUALIZATION AND PROCESS UNDERSTANDING OF MATERIAL BEHAVIOUR IN THE EXTRUSION BARREL DURING A HOT-MELT EXTRUSION PROCESS USING RAMAN SPECTROSCOPY
122
control methods for intermediate or end products are mainly based on time-consuming and
off-line analytical techniques, and annul the advantages of continuous pharmaceutical
production. Evidently, continuous in-process measurements are required to obtain a
continuous production process. The ICH Q8 guideline on pharmaceutical development
states that real-time control of drug product quality is recommended rather than end-
product testing on limited samples of the final product [5]. Understanding the sources of
variability and their impact on drug product quality provides an opportunity to minimize the
need for end product testing.
Thermal stability of the individual compounds is a requirement for hot-melt extrusion,
although not all thermolabile compounds are excluded because of the short residence times
in the extrusion barrel. Another drawback of the hot-melt extrusion technology is related to
the high energy input from the shear forces in the extrusion barrel, leading to higher,
uncontrolled product temperatures, which could induce drug or polymer degradation,
having a significant impact on the product quality [1, 2]. This setback can be overcome by
adjusting the process parameters as well as the screw design and die, which requires a
thorough process understanding. Sufficient process understanding can be generated by
implementing PAT tools such as Raman spectroscopy, allowing the visualization of the
materials in the process environment and linking these observations to applied process and
formulation parameters. Appropriate custom made fibre optic probes connected to the
spectrometer can be implemented into the HME equipment [6]. In-die monitoring of
formulation parameters such as drug load and solid state during a pharmaceutical hot-melt
extrusion process, has already been demonstrated using Raman spectroscopy [7] and NIR
spectroscopy [8]. By using Raman spectroscopy along the extruder barrel, physical and
chemical properties of the melt throughout the entire barrel can be examined. This will be
demonstrated in this chapter.
The in-barrel monitoring of melt characteristics and behaviour during twin-screw extrusion
(TSE) has not yet been reported for pharmaceutical hot-melt extrusion processes, but has
been investigated in the field of polymer extrusion. An ultrasound in-line monitoring system
was used to investigate the melting behaviour of linear low density polyethylene and
polyvinyl chloride compounds in an intermeshing counter-rotating twin-screw extruder [9].

CHAPTER 6 – VISUALIZATION AND PROCESS UNDERSTANDING OF MATERIAL BEHAVIOUR IN THE EXTRUSION BARREL DURING A HOT-MELT EXTRUSION PROCESS USING RAMAN SPECTROSCOPY
123
Monitoring of the ultrasound wave attenuation allowed characterization of the melting
process and uniformity across the screw channels. Various melting phenomena were
described depending on the selected materials, processing conditions and screw
configurations. An on-line capillary rheometer was used to measure the rheological
response of a 12 wt-% polypropylene-based carbon fibre composite after melting in an
intermeshing co-rotating twin-screw extruder [10]. The recorded torque was used to
determine the apparent wall shear stress, which is used to calculate the true values for wall
shear rate and stress. The linear viscoelastic behaviour of linear low-density polyethylene
(LLDPE) was measured on-line with an oscillatory rheometer [11]. Rheological
measurements are sensitive to composition, morphology, degree of mixing and
temperature. Finally, determination of the residence time distribution along a kneading
block has been performed by on-line monitoring of the light emission of a fluorescent tracer
at several locations along the extruder [12]. Concentration versus time curves were
generated to characterize the residence time distribution along a mixing block with
staggered kneading disks in a twin-screw extruder.
To allow the optimization and to improve the understanding of a pharmaceutical hot-melt
extrusion process, all process and formulation variables must be considered in combination
with the behaviour of the melt in the different extruder sections. So far, the majority of the
PAT tools used in hot-melt extrusion has been inserted between the extruder barrel and the
die, whereas the major material changes occur within the extruder barrel [11]. The aim of
this chapter was to improve the understanding of the material behaviour in a
pharmaceutical hot-melt extrusion process environment by monitoring and visualizing the
polymer-drug processing throughout the entire extrusion barrel using Raman spectroscopy.
Additionally, the in-line collected Raman spectra allow to assess the impact of process
settings such as barrel temperature and screw speed on the interactions between polymer
and drug. The spectroscopic measurements throughout the barrel might therefore help to
optimize the process settings, the screw design and the barrel length required to obtain
extrudates with predefined solid state properties.

CHAPTER 6 – VISUALIZATION AND PROCESS UNDERSTANDING OF MATERIAL BEHAVIOUR IN THE EXTRUSION BARREL DURING A HOT-MELT EXTRUSION PROCESS USING RAMAN SPECTROSCOPY
124
6.2. MATERIALS AND METHODS
6.2.1. Materials
Metoprolol tartrate (MPT) (Esteve Quimica, Barcelona, Spain) was chosen as model drug. It
has a melting temperature (Tm) of 120°C. Eudragit® RS PO (Evonik Rohm, Germany) was used
as polymer to form the matrix systems. Eudragit® RS PO is an amorphous copolymer of
acrylic and methacrylic acid esters with a low content of quaternary ammonium groups,
which are present as salts. It has a glass transition temperature (Tg) of approximately 65°C.
The solubility parameters of both components are 23.6 MPa½ and 19.7 MPa½ for MPT and
Eudragit® RS PO, respectively [13]. Components with similar solubility parameters are likely
to be miscible (t < 7 MPa½) and components with t > 10 MPa½ are likely to be
immiscible. As the difference in total solubility parameter is less than 4 MPa½, a good
miscibility and possible formation of a solid solution can be expected [14].
6.2.2. Hot-melt extrusion
Hot-melt extrusion was performed with a Prism Eurolab 16 co-rotating, fully intermeshing
twin-screw extruder (Thermo Fisher Scientific, Germany). The hot-melt extruder was
equipped with a DD Flexwall® 18 gravimetric feeder (Brabender® Technologie, Germany),
which was set in its gravimetric feeding mode and supplied the physical mixtures with a
throughput of 0.3 kg/h. The applied screw configuration is shown in Figure 6.1. The screws
consist of three kneading blocks, surrounded by transport zones. The kneading elements are
required for intensive mixing [15], both distributive and dispersive, since they retain the
melt in the extruder for a longer period under intense shear. Furthermore, they also play a
key role in transforming the drug from its crystalline to its amorphous form [16]. The first
kneading block, located in sections 2 and 3, contains five kneading elements at a 30° angle
towards each other, three elements at a 60° angle and finally four elements at a 90° angle.
The second, smaller kneading block, in section 4 has only three elements at a 30° angle
followed by one element at a 60°angle. The final, third kneading element, situated in

CHAPTER 6 – VISUALIZATION AND PROCESS UNDERSTANDING OF MATERIAL BEHAVIOUR IN THE EXTRUSION BARREL DURING A HOT-MELT EXTRUSION PROCESS USING RAMAN SPECTROSCOPY
125
sections 5 and 6, consists of three kneading elements at a 30° angle, three elements at a 60°
angle and finally 6 elements at a 90° angle.
Figure 6.1. Applied screw configuration. The arrows indicate the insert positions of the Raman probe.
The extruder has a modular design with 6 sections (S) (one feeding zone and 5 barrel
sections, Figure 6.1) and a die. The temperature of each section can be controlled
separately, with exception of the feeding zone. MPT concentration (10 and 40% w/w), barrel
temperature (120 and 140°C, and 100 and 140°C for 10% and 40% MPT (w/w), respectively)
and screw speed (80 and 160 rpm) were varied during hot-melt extrusion (Table 6.1). The
temperature of barrel section 2 was kept constant at 70°C to prevent sticking of the physical
mixture in the feed zone. Each physical mixture was extruded for 25 minutes, where the first
10 min were process stabilization time, followed by 15 minutes of in-line Raman monitoring.
6.2.3. Raman spectroscopy
Raman spectra were collected with a Raman Rxn1 spectrometer (Kaiser Optical Systems,
Ann Arbor, MI, USA). A fibre-optic Raman Dynisco probe was built into each of the 5 free
barrel sections (Figure 6.2), to monitor the physicochemical state of the melt and to
understand the polymer-drug behaviour throughout the entire extruder barrel during
extrusion. The diameter of this probe at interface point is 7.7 mm, and the diameter of the
laser beam on the sample surface is approximately 100 micron. The laser wavelength was

CHAPTER 6 – VISUALIZATION AND PROCESS UNDERSTANDING OF MATERIAL BEHAVIOUR IN THE EXTRUSION BARREL DURING A HOT-MELT EXTRUSION PROCESS USING RAMAN SPECTROSCOPY
126
the 785 nm line from a 785 nm Invictus NIR diode laser. All spectra were recorded with a
resolution of 4 cm-1 and an exposure time of two seconds, using a laser power of 400 mW.
The Raman spectra were acquired in dynamic mode. When determining the acquisition time
of one spectrum, the signal intensity (and noise) of the sample and the amount of material
passing by the probe window during this exposure time should be considered. At two
seconds, the acquisition time is long enough to obtain sufficient signal intensity and at the
same time short enough to avoid large amounts of material passing by the probe window.
Spectra were collected every 20 seconds. The analyzed spectral region was 100 – 1800 cm-1,
since this region contains all useful drug and polymer information. Data collection and data
transfer were automated using the HoloGRAMSTM data collection software, the
HoloREACTTM reaction analysis and profiling software and the Matlab software (version 7.1,
The MathWorks Inc., Natick, MA).
Table 6.1. Extrusion experiments.
Experiment
number
Metoprolol
tartrate
Eudragit®
RS PO
Barrel temperature
profile
Screw
speed
(% w/w) (% w/w) S2-S3-S4-S5-S6-Die (°C) (rpm)
1 10 90 70-120-120-120-120-120 80
2 10 90 70-140-140-140-140-140 80
3 10 90 70-120-120-120-120-120 160
4 10 90 70-140-140-140-140-140 160
5 40 60 70-100-100-100-100-100 80
6 40 60 70-140-140-140-140-140 80
7 40 60 70-100-100-100-100-100 160
8 40 60 70-140-140-140-140-140 160
Data analysis was performed using SIMCA P+ (Version 12.0.1.0, Umetrics, Umeå, Sweden).
Standard normal variate (SNV) pre-processing was applied on the in-line collected spectra
before principal components analysis (PCA), to remove undesirable scatter effects which
could be caused by the variation in the angle of incidence from the laser light, and the
varying probe-sample distance due to the rotating screws. Twenty subsequent spectra of

CHAPTER 6 – VISUALIZATION AND PROCESS UNDERSTANDING OF MATERIAL BEHAVIOUR IN THE EXTRUSION BARREL DURING A HOT-MELT EXTRUSION PROCESS USING RAMAN SPECTROSCOPY
127
each extrusion experiment (Table 6.1) were selected for PCA. Once an experiment was
started, a period of 15 minutes was allowed for stabilization of the process. The residence
time of this formulation is shorter than ten minutes, indicating that the 20 succeeding
spectra were collected when the process was stable.
Figure 6.2. Experimental setup with Raman Dynisco probe mounted in section 2.
6.2.4. Fourier transform infrared spectroscopy (FT-IR)
To confirm the in-line Raman observations, samples were collected for off-line analysis by
pausing the extrusion operation, opening the extrusion barrel and collecting the samples
from the screws at the position where the Raman probe is inserted in the barrel. FT-IR was
selected to confirm the crystallinity of the collected samples. FT-IR measurements were
performed with a Bruker Vertex 70 FT-IR spectrometer, equipped with a DTGS detector and
a PIKE accessory, equipped with a diamond ATR crystal.

CHAPTER 6 – VISUALIZATION AND PROCESS UNDERSTANDING OF MATERIAL BEHAVIOUR IN THE EXTRUSION BARREL DURING A HOT-MELT EXTRUSION PROCESS USING RAMAN SPECTROSCOPY
128
6.2.5. Differential scanning calorimetry (DSC)
Differential scanning calorimetry was performed with a DSC Q 2000 (TA Instruments,
Belgium). The thermograms were produced with the Thermal Advantage Release 5.1.2
software and analysed with TA Instruments Universal Analysis 2000 4.7A (TA Instruments,
Belgium). Hermetically sealed aluminium pans (TA Instruments, Belgium) were filled with
the samples collected from every barrel section. Measurements were carried out in a
nitrogen atmosphere. The flow rate of dry nitrogen gas was 50 mL/min. Temperature and
enthalpic calibration was performed using indium as standard. Samples were subjected to
three cycles. First, the pans were heated with a heating rate of 10,0°C/min from -30°C up to
140°C in the first heating cycle. After heating, a cooling cycle was started with a cooling rate
of -10,0°C/min to -30°C, followed by a second and final heating cycle which was identical to
the first.
CHAPTER 6 – VISUALIZATION AND PROCESS UNDERSTANDING OF MATERIAL BEHAVIOUR IN THE EXTRUSION BARREL DURING A HOT-MELT EXTRUSION PROCESS USING RAMAN SPECTROSCOPY
129
6.3. RESULTS AND DISCUSSION
Raman spectra collected during extrusion provide information regarding the
physicochemical state of the polymer-drug melt and the interactions that occur during
processing [7]. Broadening of the spectral MPT bands indicates the transition from its
crystalline state, usually represented by sharp and well defined peaks in the Raman
spectrum, to its amorphous form. Peak shifts in Raman spectra collected during extrusion
compared to the spectrum of the physical mixture, are indicative of interactions between
MPT and Eudragit® RS PO.
6.3.1. Influence of MPT concentration on the solid state of the extrudates
Principal component analysis was applied on the dataset containing the in-line collected
Raman spectra from all extrusion experiments (800 spectra: 20 spectra per experiment per
section, 8 experiments, Table 6.1). The loadings of principal component 1 (PC 1) show that
PC 1 distinguishes between the background signals from the probe itself and the signals
from the formulation (65% of the total spectral variation) (Figure 6.3a). In TSE, most screw
elements are not completely filled with material, since TSE is a starve-fed process. The
background signal from the probe itself contains three peaks, at 418 cm-1, 577cm-1 and 750
cm-1, with a rather low intensity. These three peaks will be overwhelmed by the spectrum of
the formulation when the sapphire window of the probe is completely covered by material.
However, when parts of the sapphire window do not contain material or when the distance
between this window and the sample increases, these three peaks appear in the collected
Raman spectra with varying intensity dependent on the percentage of fill of the screw
element where measurements were performed. In Figure 6.3b, the average spectra of the
Raman spectra collected during extrusion of mixtures with 40% MPT (w/w) at 140°C with a
screw speed of 160 rpm in S2 and S6 are shown. The increased level of filling in S6 can be
distinguished from the loss of intensity of the peaks specific for the Raman probe (indicated
by the arrows), whereas the intensity of the peaks representing Eudragit® RS PO and MPT at
600 cm-1 and 640 cm-1 respectively, remains constant.

CHAPTER 6 – VISUALIZATION AND PROCESS UNDERSTANDING OF MATERIAL BEHAVIOUR IN THE EXTRUSION BARREL DURING A HOT-MELT EXTRUSION PROCESS USING RAMAN SPECTROSCOPY
130
The second principal component (PC 2, capturing 16% of the total variation) describes the
spectral variation originating from the different applied MPT concentrations during the
experiments (Figure 6.4). In the loading of PC 2, all positive peaks represent Raman peaks
originating from MPT, and the negative bands can be found as peaks in the Raman spectrum
of Eudragit® RS PO. The higher the score value in PC 2, the more MPT is present in the
extruded mixtures. To eliminate this overwhelming concentration-dependent spectral
variation when examining differences in polymer/drug solid state, the spectra collected
during the experiments with different concentration levels are analyzed separately.
Figure 6.3. a) Comparison of the PC 1 loading, the spectrum inherent to the probe and the spectrum of the
Eudragit® RS PO – MPT mixture. b) mean Raman spectra collected during extrusion of a mixture with 40% MPT
(w/w) at 140°C and with 160 rpm in segments 2 and 6.

CHAPTER 6 – VISUALIZATION AND PROCESS UNDERSTANDING OF MATERIAL BEHAVIOUR IN THE EXTRUSION BARREL DURING A HOT-MELT EXTRUSION PROCESS USING RAMAN SPECTROSCOPY
131
Figure 6.4. Comparison of the loading from the second principal component (black) and the spectra of pure
Eudragit® RS PO (red) and MPT (blue).
Figures 6.5a and 6.5b show the PC 1 versus PC 2 scores scatterplot of the Raman spectra
collected during the extrusion experiments with a drug load of 10% (w/w) (experiments 1 to
4, Table 6.1) and 40% MPT (w/w) (experiments 5 to 8, Table 6.1), respectively. PC 1 captures
the variation in the Raman spectra caused by differences in degree of filling in the screw
elements. This component describes 76% of the total spectral variation of the 40% MPT
(w/w) spectra and 78% of the total variation of the 10% MPT (w/w) spectra. PC 2,
representing 13% of the variation of both the 40% MPT (w/w) spectra and 10% MPT (w/w)
spectra, explains the spectral differences in the solid state of MPT (Figure 6.6). In this figure,
the PC 2 loading is compared to the mean spectra collected in sections 2 and 6 during an
extrusion experiment of a mixture with a drug load of 40% (w/w), at a temperature of 100°C
and with a screw speed of 160 rpm (Table 6.1, experiment 7). Positive peaks in this loading
represent MPT in its crystalline form, and can be found in the spectra gathered in section 2,
where the Raman probe is still collecting spectra of the physical mixture. The sharp negative

CHAPTER 6 – VISUALIZATION AND PROCESS UNDERSTANDING OF MATERIAL BEHAVIOUR IN THE EXTRUSION BARREL DURING A HOT-MELT EXTRUSION PROCESS USING RAMAN SPECTROSCOPY
132
peaks represent the amorphous MPT that has interacted with the polymer, causing peak
shifts in the spectra of section 6 compared to section 2.
Figure 6.5. PC 1 versus PC 2 scores scatterplots of in-line collected Raman spectra of all extrusion runs with
mixtures containing a) 10% MPT, and b) 40% MPT (w/w). (red = spectra collected in S2, blue = S3, purple = S4,
green = S5, black = S6).

CHAPTER 6 – VISUALIZATION AND PROCESS UNDERSTANDING OF MATERIAL BEHAVIOUR IN THE EXTRUSION BARREL DURING A HOT-MELT EXTRUSION PROCESS USING RAMAN SPECTROSCOPY
133
Figure 6.6. Comparison of the PC 2 loading (red) with the spectra collected in sections 2 (blue) and 6 (green)
during extrusion of a mixture containing 40% MPT (w/w) with a screw speed of 160 rpm and at a temperature
of 100°C.
At a high drug load (40% MPT (w/w), Figure 6.5.b), the variation between the Raman spectra
collected in section 2 and section 3 is larger compared to the variation between other
neighbouring sections (i.e. sections 3 and 4, sections 4 and 5, sections 5 and 6) according to
PC 2. This indicates that the main changes in solid state, caused by the melting of MPT,
occur at this position in the extrusion barrel. The Raman spectra (Figure 6.7) illustrate peak
broadening in the absorption bands of MPT and peak shifts when the melt arrives in section
3, compared to the material in section 2. This is primarily caused by the retention of the
melt between both sections, due to the presence of the first kneading block. The melt is
subjected for a longer time to the higher temperature and shear forces between section 2
and 3, causing MPT to melt. Although extrusion at 100°C is performed at a set temperature
20°C below the melting temperature of the drug, the addition of kneading zones allows
melting of MPT due to input of mechanical energy generated by the high shear forces
applied on the mixture. When looking more in detail at Figure 6.5.b, an additional difference
between sections 5 and 6 is present in the PC 1 versus PC 2 scores scatterplot of the mixture
containing 40% MPT (w/w) which was extruded at 140°C with a screw speed of 160 rpm
(black data points outside the ellipse) (Table 6.1, experiment 8). The high temperature and

CHAPTER 6 – VISUALIZATION AND PROCESS UNDERSTANDING OF MATERIAL BEHAVIOUR IN THE EXTRUSION BARREL DURING A HOT-MELT EXTRUSION PROCESS USING RAMAN SPECTROSCOPY
134
high shear forces originating from the increased screw speed allow the formation of a solid
solution in section 6, which was not stable due to the high drug load of the extrudate.
Figure 6.7. Detail of the Raman spectra collected in barrel sections 2 and 3 during extrusion of mixtures
containing 40% MPT (w/w) at all screw speed settings at a) 100°C and b) 140°C.
When extruding a mixture with a low drug load (10% MPT (w/w), Figure 6.5.a), a similar
variation between section 2 and section 3 is observed. However, in contrast to the
experiments at higher drug load, an additional difference can also be noticed between the
last two sections of the barrel. At a 40% drug load (w/w), MPT melt when passing through
the first kneading zone due to the higher temperature and shear forces in section 3 and a
solid glassy suspension is produced, but a solid solution is not formed, due to the high drug
load. In the extrudates with a 10% drug load (w/w), the final kneading zone, located in
section 5 facilitates the dissolution of the drug into the polymer matrix and a complete solid
solution is created due to shear forces. The formation of a solid solution was confirmed by
the DSC thermograms from the samples collected in section 6 (Figure 6.8). All thermograms

CHAPTER 6 – VISUALIZATION AND PROCESS UNDERSTANDING OF MATERIAL BEHAVIOUR IN THE EXTRUSION BARREL DURING A HOT-MELT EXTRUSION PROCESS USING RAMAN SPECTROSCOPY
135
exhibit only one Tg, and no melting peaks for MPT are visible. This indicates that MPT is
dissolved into the polymer and that a one phase system is created when the melt passes
through the final kneading zone in section 5. The extrudates created with a 10% MPT
concentration (w/w) are all transparent, in contrast with the opaque end products
containing 40% MPT (w/w).
Figure 6.8. DSC thermograms of samples collected in barrel section 6 from all extrusion runs with mixtures
containing 10% MPT (w/w).
The off-line FT-IR measurements of the samples collected in the barrel confirm that
extrusion of physical mixtures containing 10% MPT (w/w) results in the formation of a solid
solution for all experimental runs. The IR spectra from the samples collected in section 6
during all 10% MPT (w/w) experiments (Table 6.1, experiments 1-4) show that the IR
absorption bands of the polymer are more explicitly present in both the fingerprint area and
the X-H region, indicating the dissolution of MPT into the polymer (data not shown). In the
spectral region of 3000 cm-1 – 3100 cm-1 [17], the absence of OH stretch vibrations of
alcohol groups in the spectra collected in section 6 shows that all MPT molecules have
interacted with the polymer through the formation of hydrogen bonds, and that there are
no independent MPT molecules present. In sections 2 to 5, peaks representing these
vibrations can still be detected. The hydrogen bond formation is thus facilitated by the

CHAPTER 6 – VISUALIZATION AND PROCESS UNDERSTANDING OF MATERIAL BEHAVIOUR IN THE EXTRUSION BARREL DURING A HOT-MELT EXTRUSION PROCESS USING RAMAN SPECTROSCOPY
136
kneading zone located in section 5. These OH stretch vibrations and other absorption bands
specific for MPT are still present in spectra obtained in section 6 from all extrusion runs with
mixtures of 40% MPT (w/w). However, in-line Raman spectra indicated an additional
difference when extrusion was performed at a temperature of 140°C and with a screw
speed of 160 rpm (Table 6.1, experiment 8). This difference between in-line collected
Raman spectra and off-line gathered FT-IR spectra can be explained by the instability of this
solid solution, containing a high drug load. The time delay between extrusion and collection
of the FT-IR spectrum was sufficient for MPT to recrystallize. This recrystallization is caused
by the decrease in temperature when the samples are taken from the screws and barrel.
6.3.2. Influence of the barrel temperature on the solid state of the extrudates
Since the extruder barrel is modular, the temperature can be set for each section
individually. A straight temperature profile [18] was used, where the temperature of section
2 was kept at 70°C throughout all experiments, and the temperatures of sections 3 to 6
were set according to Table 6.1. Physical mixtures with a drug load of 10% (w/w) could not
be extruded at temperatures below 120°C, as the extrusion torque exceeded its limits. MPT
has a plasticizing effect on Eudragit® RS PO [7], allowing extrusion of the physical mixture
containing 40% (w/w) MPT at a barrel temperature of 100°C.
During extrusion of the physical mixtures containing 10% MPT (w/w), there is no noticeable
spectral variation related to solid state caused by varying the barrel temperature, since the
actual product temperature exceeds the melt temperature of the drug in all cases.
The PC 1 versus PC 2 scores scatterplot of the spectra collected during extrusion of a
mixture containing 40% MPT (w/w) applying a screw speed of 80 rpm (Fig 6.9.a) (Table 6.1,
experiments 5 and 6) shows clustering into three different groups (along PC 2) at both
temperatures. A first group represents the physical mixture as measured in section 2,
followed by a second cluster where MPT is molten. In the third group, some of the MPT has
interacted with the polymer, inducing spectral shifts, but there still are molten MPT
molecules that did not interact with the polymer present in the mixture. An increase of 40°C
in temperature does not affect the solid state of the end product, but it does determine

CHAPTER 6 – VISUALIZATION AND PROCESS UNDERSTANDING OF MATERIAL BEHAVIOUR IN THE EXTRUSION BARREL DURING A HOT-MELT EXTRUSION PROCESS USING RAMAN SPECTROSCOPY
137
how fast the solid state of the final product is reached. When extruding at 100°C, this end
state is reached in section 6, with the help of the kneading zone located ahead of this
section. This kneading zone is not required at a barrel temperature of 140°C, since the final
solid state is attained in section 4. These observations can be found in the Raman spectra
collected during extrusion as well (Figure 6.9.b). The peak situated at 812 cm-1 represents
the C-C stretching vibration of Eudragit® RS PO [19], and the peak located at 819 cm-1
corresponds to the out-of-plane vibration of the COOH groups of MPT [17]. This peak
becomes wider when the mixture reaches a temperature higher than 120°C, due to the
melting of MPT.
Figure 6.9. a) PC 1 versus PC 2 scores scatterplot of the in-line collected Raman spectra during extrusion of
mixtures containing 40% MPT (w/w) with a screw speed of 80 rpm at 100°C and 140°C and b) mean Raman
spectra collected in all different sections during extrusion of mixtures containing 40% MPT (w/w) with a screw
speed of 80 rpm at 100°C and 140°C.

CHAPTER 6 – VISUALIZATION AND PROCESS UNDERSTANDING OF MATERIAL BEHAVIOUR IN THE EXTRUSION BARREL DURING A HOT-MELT EXTRUSION PROCESS USING RAMAN SPECTROSCOPY
138
When extruding the 40% MPT (w/w) mixture with a screw speed of 160 rpm (Table 6.1,
experiments 7 and 8), an increase in barrel temperature from 100°C to 140°C enables the
formation of an instable solid solution, as previously mentioned. Since a high screw speed is
applied, shear forces on the material are much higher, and the additional energy input due
to the higher barrel temperature allows the molecular dispersion of MPT into the polymer.
6.3.3. Influence of the rotational screw speed on the solid state of the extrudates
The second process parameter which was varied throughout the experiments, was the
rotational screw speed (80 - 160rpm). In a twin-screw extruder, the screw speed is a critical
parameter in controlling mixing of polymer, drug and excipients; melting behaviour;
pressure and melt temperature [18]. The selected screw speed determines the percentage
of fill of the screws, the residence time of materials in the extruder and the torque level. An
increase in screw speed (for a constant barrel temperature profile and throughput) will
result in a higher shear rate [20] which reduces the viscosity of the melt due to the shear
thinning effect, resulting in a lower torque. Moreover, higher screw speeds raise the melt
temperature, reducing the torque level as well. Additionally, a higher screw speed results in
improved mixing, a shorter residence time and a lower percentage of screw fill [18].
The PC 1 versus PC 2 scores scatterplot of the in-line collected Raman spectra during
extrusion of a mixture containing 10% MPT (w/w) at 120°C (Figure 6.10.a) (Table 6.1,
experiments 1 and 3) demonstrates that at both screw speeds, three different groups can be
distinguished regarding solid state (PC 2). A first group includes the spectra collected in
section 2, which show sharp peaks for MPT. This mixture still contains crystalline MPT. A
second cluster displays the spectra obtained in sections 3, 4 and 5, where MPT is molten.
The third and final group shows the Raman spectra from section 6 where MPT molecules
have interacted with the polymer and a solid solution is produced. In this figure, it can be
seen that doubling the screw speed does not have an impact on the solid state of the final
product, since the spectra in section 6 show a similar solid state for both 80 and 160 rpm.
However, a small difference caused by changes in screw speed can be noticed in-line, more
specific in sections 3, 4 and 5. The higher screw speed increases the shear rate and the melt
temperature, which results in a solid state that leans more towards the solid state of the

CHAPTER 6 – VISUALIZATION AND PROCESS UNDERSTANDING OF MATERIAL BEHAVIOUR IN THE EXTRUSION BARREL DURING A HOT-MELT EXTRUSION PROCESS USING RAMAN SPECTROSCOPY
139
end product than when using a low screw speed. This small difference in solid state can be
distinguished in the Raman spectra collected in sections 3, 4 and 5 during extrusion (Figure
6.11a). The spectra display larger peak shifts at a screw speed of 160 rpm compared to 80
rpm, indicating stronger interactions between the polymer and the drug. The same results
can be observed during extrusion of a mixture with 10% MPT (w/w) at 140°C (Table 6.1,
experiments 2 and 4).
Figure 6.10. PC 1 versus PC 2 scores scatterplots of the in-line collected Raman spectra during extrusion of
mixtures containing 10% MPT (w/w) at a temperature of 120°C and with screw speeds of 80 and 160 rpm (a),
and mixtures containing 40% MPT (w/w) at a temperature of 140°C and with screw speeds of 80 and 160 rpm
(b). (red = 80 rpm, blue = 160 rpm).

CHAPTER 6 – VISUALIZATION AND PROCESS UNDERSTANDING OF MATERIAL BEHAVIOUR IN THE EXTRUSION BARREL DURING A HOT-MELT EXTRUSION PROCESS USING RAMAN SPECTROSCOPY
140
During extrusion of a mixture containing 40% MPT (w/w) at 140°C (Table 6.1, experiments 6
and 8), changes in screw speed have a significant impact on the solid state of the end
product (Figure 6.10.b). In this case, an increase of the screw speed from 80 rpm to 160 rpm
enables the formation of a solid solution with a drug load of 40% (w/w), as shown in the
difference in solid state (PC 2) in section 6 for both screw speeds. Even though a higher
screw speed reduces the residence time, the higher shear forces and temperature induce
interactions between polymer and drug, which can be noticed in the spectra obtained in
section 6 (Figure 6.11b). The kneading zone located between sections 5 and 6 facilitates the
formation of a solid solution in this extrusion run. However, due to the high MPT
concentration, the produced solid solution is instable and recrystallizes during cooling at
room temperature. It can also be noticed that the PC 2 scores for section 2 and 3 of the
extrusion run at 140°C and 160 rpm (Table 6.1, experiment 8) have almost identical values
for PC 2. This could be due to conduction of heat in the mixture that is retained in front of
the kneading zone between these sections of the barrel, which initiates MPT melting even
before it reaches the kneading zone.
At 100°C (Table 6.1, experiments 5 and 7), doubling of the screw speed does not influence
the solid state of the end product (data not shown). However, it does change the location in
the barrel where this solid state is reached. When extruding at a screw speed of 80 rpm, the
solid state corresponding to the final product is obtained in section 6, as a result of the
kneading element located between sections 5 and 6 which increases the shear forces on the
melt. At higher screw speed, the solid state of the end product is already obtained in section
5, without the requirement of additional kneading elements, since the higher screw speed
induces higher shear forces earlier in the barrel. Consequently, increasing the screw speed
during extrusion of mixtures with a high drug load reduces the number of barrel sections
required to obtain the end product. By reducing the barrel length, the mean residence time
and therefore the time in which the mixture is in contact with a high temperature can be
decreased, avoiding degradation problems.

CHAPTER 6 – VISUALIZATION AND PROCESS UNDERSTANDING OF MATERIAL BEHAVIOUR IN THE EXTRUSION BARREL DURING A HOT-MELT EXTRUSION PROCESS USING RAMAN SPECTROSCOPY
141
Figure 6.11. Detail of the mean Raman spectrum collected in barrel sections 3, 4 and 5 during extrusion of
mixtures containing 10% MPT (w/w) at 120°C, with a screw speed of 80 rpm (red) and 160 rpm (blue). b) Detail
of the mean Raman spectrum collected in barrel sections 3, 4 and 5 during extrusion of mixtures containing
40% MPT (w/w) at 140°C, with a screw speed of 80 rpm (red) and 160 rpm (blue).
Throughout the experiments it has also been demonstrated that the second kneading zone,
located in section 4, does not have a relevant influence on the solid state of this
formulation. Almost no differentiation can be detected between spectra collected in
sections 3, 4 and 5. This second, smaller kneading zone does not affect the extrusion process
for this formulation.

CHAPTER 6 – VISUALIZATION AND PROCESS UNDERSTANDING OF MATERIAL BEHAVIOUR IN THE EXTRUSION BARREL DURING A HOT-MELT EXTRUSION PROCESS USING RAMAN SPECTROSCOPY
142
6.4. CONCLUSION
Raman spectroscopy is a suitable PAT-tool for the monitoring of the polymer-drug solid
state during hot-melt extrusion. By implementing the probe in the different sections of the
extruder barrel, a complete visualization and improved understanding of the polymer-drug
behaviour throughout the entire extrusion barrel is gained, leading to a more profound
understanding of the hot-melt extrusion process. The impact of variations in process and
formulation parameters on the physicochemical state of the extrudates was evaluated in
the different barrel sections, allowing the optimization of barrel and screw design
depending on the selected settings and formulation. The spectroscopic visualisation of the
entire extrusion barrel might therefore be helpful to optimize the process settings, the
screw design and the barrel length required to obtain extrudates with predefined solid state
properties.

CHAPTER 6 – VISUALIZATION AND PROCESS UNDERSTANDING OF MATERIAL BEHAVIOUR IN THE EXTRUSION BARREL DURING A HOT-MELT EXTRUSION PROCESS USING RAMAN SPECTROSCOPY
143
6.5. REFERENCES
[1] J. Breitenbach, J. Eur J Pharm Biopharm 54 (2002) 107-1171.
[2] M.M. Crowley, F. Zhang, M.A. Repka, S. Thumma, S.B. Upadhye, S.K. Battu, J.W.
McGinity, C. Martin, Drug Dev Ind Pharm 33 (2007) 909-926.
[3] C. Vervaet, J.P. Remon, Chem Eng Sci 60 (2005) 3949-3957.
[4] K. Plumb, Chem Eng Res Des 83 (2005) 730-738.
[5] International Conference on Harmonisation of Technical Requirements for
Registration of Pharmaceuticals for Human Use, Pharmaceutical Development Q8
(R2), 2009.
[6] T. De Beer, A. Burggraeve, M. Fonteyne, L. Saerens, J.P. Remon, C. Vervaet, Int J
Pharm 417 (2011) 32-47.
[7] L. Saerens, L. Dierickx, B. Lenain, C. Vervaet, J.P. Remon, T. De Beer, Eur J Pharm
Biopharm 77 (2011) 158-163.
[8] L. Saerens, L. Dierickx, T. Quinten, P. Adriaensens, R. Carleer, C. Vervaet, J.P. Remon,
T. De Beer, Eur J Pharm Biopharm 81 (2012) 230-237.
[9] D. Wang, K. Min, Polym Eng Sci 45 (2005) 998-1010.
[10] C.W. Macosko, Rheology: Principles, Measurements and Applications, 1st ed., Wiley-
VCH, New York, USA, 1994.
[11] J.A. Covas, O.S. Carneiro, P. Costa, P.; A.V. Machado, J.M. Maia, Plast Rubber Compos
33 (2004) 55-61.
[12] O.S. Carneiro, J.A. Covas, J.A. Ferreira, M.F. Cerqueira, Polym Test 23 (2004) 925-937.
[13] J. Breitkreutz, Pharm Res 15 (1998) 1370–137.
[14] A. Forster, J. Hempenstall, I. Tucker, T. Rades, Int J Pharm 226 (2001) 147-161.
[15] E. Verhoeven, T.R.M. De Beer, G. Van den Mooter, J.P. Remon, C. Vervaet, Eur J
Pharm Biopharm 69 (2008) 312-319.
[16] K. Nakamichi, T. Nakano, H. Yasuura, S. Izumi, Y. Kawashima, Int J Pharm 241 (2002)
203-211.
[17] A. Bright, T.S. Renuga Devi, S. Gunasekaran, ChemTech 2 (2010) 379-388.
[18] H.F. Giles Jr., J.R. Wagner Jr., E.M. Mount III, Extrusion: The Definitive Processing
Guide and Handbook, 1st ed., William Andrew, Inc., New York, USA, 2005.

CHAPTER 6 – VISUALIZATION AND PROCESS UNDERSTANDING OF MATERIAL BEHAVIOUR IN THE EXTRUSION BARREL DURING A HOT-MELT EXTRUSION PROCESS USING RAMAN SPECTROSCOPY
144
[19] M. De Veij, P. Vandenabeele, T. Beer, J.P. Remon, L.J. Moens, Raman spectrosc 40
(2008) 297-307.
[20] H. Liu, P. Wang, X. Zhang, F. Shen, C.G. Gogos, Int J Pharm 383 (2010) 161-169.

CHAPTER 7 – IN-LINE SOLID STATE PREDICTION DURING PHARMACEUTICAL HOT-MELT EXTRUSION IN A 12 MM TWIN SCREW EXTRUDER USING RAMAN SPECTROSCOPY
145
CHAPTER 7
IN-LINE SOLID STATE PREDICTION
DURING PHARMACEUTICAL HOT-MELT
EXTRUSION IN A 12 MM TWIN SCREW
EXTRUDER USING RAMAN
SPECTROSCOPY
Parts of this chapter are published in:
L. Saerens, D. Ghanam, C. Raemdonck, K. Francois, J. Manz, R. Krüger, S. Krüger, C. Vervaet,
J.P. Remon, T. De Beer. In-line solid state prediction during pharmaceutical hot-melt
extrusion in a 12 mm twin-screw extruder using Raman spectroscopy. Submitted to
European Journal of Pharmaceutics and Biopharmaceutics (2013).

CHAPTER 7 – IN-LINE SOLID STATE PREDICTION DURING PHARMACEUTICAL HOT-MELT EXTRUSION IN A 12 MM TWIN SCREW EXTRUDER USING RAMAN SPECTROSCOPY
146
ABSTRACT
In Chapter 7, Raman spectroscopy was used for the in-line monitoring of the solid state of
materials during pharmaceutical hot-melt extrusion in the die head of a 12 mm
(development scale) twin-screw extruder during formulation development.
A full factorial (mixed) design was generated to determine the influence of variations in
concentration of Celecoxib (CEL) in Eudragit® E PO, three different screw configurations and

CHAPTER 7 – IN-LINE SOLID STATE PREDICTION DURING PHARMACEUTICAL HOT-MELT EXTRUSION IN A 12 MM TWIN SCREW EXTRUDER USING RAMAN SPECTROSCOPY
147
varying barrel temperature profiles on the solid state, melt temperature and die pressure of
continuously produced extrudates in real-time. Off-line XRD and DSC analysis were used to
evaluate the suitability of Raman spectroscopy for solid state predictions. First, principal
component analysis (PCA) was performed on all in-line collected Raman spectra from the
experimental design. The resulting PC 1 versus PC 2 scores plot showed clustering according
to physicochemical state of the extrudates, and two classes, one class where crystalline CEL
is still present and a second class where no crystalline CEL was detected, were found. Then, a
soft independent modelling of class analogy (SIMCA) model was developed, by modelling
these two classes separately by disjoint PCA models. These two separate PCA models were
then used for the classification of new produced extrudates and allowed distinction between
glassy solid solutions of CEL and crystalline dispersions of CEL. All extrudates were classified
similarly by Raman spectroscopy, XRD and DSC measurements, with exception of the
extrudates with a 30% CEL concentration (w/w) extruded at 130°C. The Raman spectra of
these experiments showed bands which were sharper than the amorphous spectra, but
broader than the crystalline spectra, indicating the presence of CEL that has dissolved into
the matrix and CEL in its crystalline state. XRD and DSC measurements did not detect this.
Modifications in the screw configuration did not affect the solid state and did not have an
effect on the solid state prediction of new produced extrudates.
Secondly, the influence of variations in die pressure on the Raman spectra was examined.
The applied drug concentration, processing temperature and feeder performance influence
the die pressure, which was reflected in the Raman spectra as a change in spectral intensity.
When applying PCA on the raw spectra from the experimental design, the first principal
component described the influence of die pressure on the spectra, which was seen as a
decrease in Raman intensity of the whole spectrum when the pressure in the sample
increased. Clustering according to processing temperature was found, although the
temperature in the die remained constant, indicating that a difference in viscosity, resulting
in a changed die pressure, was detected. When the feeder was stopped, the score values of
the first principal component almost simultaneously decreased, and only stabilized once the
die pressure became stable. Since Raman spectra collected in the extrusion die are
influenced by changes in die pressure, disturbances upstream of the extrusion process can
be observed and identified in the Raman measurements.

CHAPTER 7 – IN-LINE SOLID STATE PREDICTION DURING PHARMACEUTICAL HOT-MELT EXTRUSION IN A 12 MM TWIN SCREW EXTRUDER USING RAMAN SPECTROSCOPY
148
CHAPTER 7
IN-LINE SOLID STATE PREDICTION DURING
PHARMACEUTICAL HOT-MELT EXTRUSION IN
A 12 MM TWIN SCREW EXTRUDER USING
RAMAN SPECTROSCOPY
7.1. INTRODUCTION
The high throughput screening of potential therapeutic agents has increased the amount of
poorly soluble drug candidates. In the Biopharmaceutical Classification System (BCS), many
active pharmaceutical ingredients (APIs) such as Celecoxib (CEL) have been categorized as
Class II, implying that they have a high permeability, but a low aqueous solubility. The
bioavailability of this type of compounds is limited by their dissolution rate. The low water
solubility of these compounds makes it challenging to formulate them for oral delivery.
Several manners of improving the dissolution of the drug have been proposed [1], but the
preferred option to enhance the solubility and therefore the bioavailability of the drug is
through formulation approaches. Presenting the compound as a solid dispersion will reduce
the particle size of the API, improve the wettability, increase the porosity, and allow the
formulation of drugs in their amorphous state [2]. The current method of choice for the
manufacturing of solid dispersions is hot-melt extrusion (HME) [1]. Melt extrusion has
several advantages over solvent based methods for the formation of glass solid solutions
(solid dispersions where the API is completely dissolved in an amorphous carrier). When
applying solvent evaporation methods, the first challenge is to find a solvent in which both
API and carrier are soluble [3]. Other disadvantages of solvent methods include difficulties of
removing the residual (organic) solvent, toxicity issues due to residual solvent, the

CHAPTER 7 – IN-LINE SOLID STATE PREDICTION DURING PHARMACEUTICAL HOT-MELT EXTRUSION IN A 12 MM TWIN SCREW EXTRUDER USING RAMAN SPECTROSCOPY
149
requirement of a secondary drying step and possible ecological problems [1, 2, 4]. Using hot-
melt extrusion to produce solid dispersions requires high processing temperatures, but
avoids the need for solvents. Furthermore, HME is a one step continuous process with
decreased ecological implications. It has been shown that glassy solid solutions of CEL can be
produced via hot-melt extrusion using several polymer carriers, each increasing the
dissolution rate of the drug [5, 6].
Process analytical tools such as Raman spectroscopy can provide in-line and real-time
information about critical process and formulation parameters. Raman spectroscopy has
been used off-line in previous studies for the physical characterization of solid dispersions. It
can be applied to determine the type of solid dispersion (solid solution, glass suspension,
etc.), the solid state of the API and polymers and the occurring molecular interactions
between polymer and drug [6-9]. Custom made fibre optic probes connected to the
spectrometer can be implemented into the HME equipment [10]. In-die monitoring of solid
state and molecular interactions during a pharmaceutical hot-melt extrusion process has
already been demonstrated using Raman spectroscopy [9] and NIR spectroscopy [11]. In this
chapter, the application of Raman spectroscopy as a PAT tool during formulation
development and to determine the influence of varying process settings on the material
properties was demonstrated. Therefore, the physicochemical properties of the melt were
determined in-line during hot-melt extrusion on a 12 mm development scale twin-screw
extruder with low material need, avoiding the dissipation of materials and making off-line
analysis redundant.

CHAPTER 7 – IN-LINE SOLID STATE PREDICTION DURING PHARMACEUTICAL HOT-MELT EXTRUSION IN A 12 MM TWIN SCREW EXTRUDER USING RAMAN SPECTROSCOPY
150
7.2. MATERIALS AND METHODS
7.2.1. Materials
Celecoxib (CEL) (Selectchemie, Zürich, Switzerland) was selected as a model drug. CEL is an
example of a poorly soluble (BCS Class II) drug with a water solubility of 3-7 mg/L and a
melting temperature (Tm) of 163°C. The polymer Eudragit® E PO (Evonik®, Weiterstadt,
Germany) was used to form the matrix system. It is a cationic copolymer based on
dimethylaminoethyl methacrylate, butyl methacrylate, and methyl methacrylate. Eudragit® E
PO is an amorphous polymer, used to create the matrix in which CEL is dissolved.
The solubility parameters of both components were calculated with SPWin, version 2.11
[12], to give an indication of miscibility of polymer and drug. The calculated values were 26.7
MPa½ and 19.7 MPa½ for CEL and Eudragit® E PO respectively. For components with a
difference in solubility parameters (t) smaller than 7.0 MPa1/2, miscibility is likely, whereas
components with t > 10 MPa½ are expected to be immiscible [13]. When t lays between
5 MPa1/2 and 10 MPa1/2, prediction of glass solution formation requires further investigation
with thermal analysis. As the difference in total solubility parameters is 7.0 MPa½, further
DSC measurements were performed to assess the solubility of CEL in Eudragit® E PO.
Physical mixtures of both components were prepared with a Turbula® T2F mixer (Willy A.
Bachofen GmbH, Muttenz, Switzerland). The concentration of CEL was varied between 30%
and 50% (w/w) in Eudragit® E PO throughout the experiments (Table 7.1).
7.2.2. Hot-melt extrusion
Hot-melt extrusion was performed with a development scale co-rotating twin-screw
extruder with a screw diameter of 12mm (PTSE 12/36, Brabender® Pharma, Duisburg,
Germany). The extruder was equipped with a loss in weight feeder (Brabender® Technologie,
Duisburg, Germany), which was used in its gravimetric feeding mode and supplied the

CHAPTER 7 – IN-LINE SOLID STATE PREDICTION DURING PHARMACEUTICAL HOT-MELT EXTRUSION IN A 12 MM TWIN SCREW EXTRUDER USING RAMAN SPECTROSCOPY
151
Table 7.1. Performed extrusion experiments (full factorial (mixed) screening design).
Process and formulation settings Responses
Experiment Drug load Screw Barrel temperature profile Melt temperature Die pressure PC 1
number (% w/w) Configuration (feeding zone → die) (°C) in die (°C) (bar) Score values
1 30 FF 20-70-130-130-130-110 110,90 13,77 4,5461
2 30 FF 20-70-150-150-150-110 113,58 11,22 -3,4645
3 30 FB 20-70-130-130-130-110 111,31 18,28 2,6151
4 30 FB 20-70-150-150-150-110 114,20 16,36 -4,1576
5 30 2F 20-70-130-130-130-110 111,11 16,65 1,9484
6 30 2F 20-70-150-150-150-110 113,70 15,67 -3,1045
7 50 FF 20-70-130-130-130-110 111,35 16,89 8,7996
8 50 FF 20-70-150-150-150-110 114,06 7,75 -4,8359
9 50 FB 20-70-130-130-130-110 111,00 11,93 11,5758
10 50 FB 20-70-150-150-150-110 113,35 5,81 -5,7765
11 50 2F 20-70-130-130-130-110 111,18 14,45 8,0646
12 50 2F 20-70-150-150-150-110 113,55 7,11 -4,5921
13 40 FB 20-70-140-140-140-110 112,20 10,63 -2,3848
14 40 FB 20-70-140-140-140-110 112,01 10,77 -5,5010
15 40 FB 20-70-140-140-140-110 112,11 11,27 -3,7324

CHAPTER 7 – IN-LINE SOLID STATE PREDICTION DURING PHARMACEUTICAL HOT-MELT EXTRUSION IN A 12 MM TWIN SCREW EXTRUDER USING RAMAN SPECTROSCOPY
152
physical mixtures with a throughput of 1.5 g/min. Three different screw configurations were
applied during experiments (Table 7.1): the first configuration included 2 consecutive
forward kneading elements (FF), a second configuration contained a forward kneading
element followed by a backward kneading element (FB), and the third screw setup
comprised 2x2 consecutive forward kneading elements (2F) (Figure 7.1). The FF
configuration will induce the lowest amount of shear on the mixture and will result in the
shortest residence time. When the shear forces on the mixture increase, and the time of
exposure to a high temperature becomes longer, the formation of a glass solution will be
facilitated. Shear forces and residence time values will increase when two more forward
kneading elements are added to the design, or when a forward kneading element is replaced
by a backward kneading element. The impact of these design alterations is expected to be
more distinct at lower processing temperatures than at the higher barrel temperatures. The
processing temperature was varied from 130°C to 150°C throughout the experiments, and
the die temperature was kept constant (110°C) for each experiment to guarantee a solid end
product (Table 7.1). Logging of the extrusion settings (throughput, screw speed, barrel and
die temperature) and parameters (actual barrel, die and product temperature, actual
throughput, actual screw speed, die pressure, motor load) was performed with the
WinExtXT® software (Brabender® Pharma, Duisburg, Germany). Extrudate samples were
collected during the experiments and stored at room temperature.
Figure 7.1. Applied screw configurations: FF, FB and 2F.
7.2.3. Raman spectroscopy
Both in-line and off-line Raman spectra were collected with a Raman Rxn1 spectrometer
(Kaiser Optical Systems, Ann Arbor, MI, USA). For in-line measurements, a fibre-optic Raman
Dynisco probe was built into the die head (Figure 7.2), to monitor the physicochemical state

CHAPTER 7 – IN-LINE SOLID STATE PREDICTION DURING PHARMACEUTICAL HOT-MELT EXTRUSION IN A 12 MM TWIN SCREW EXTRUDER USING RAMAN SPECTROSCOPY
153
of the extrudate before it is forced through the die. The laser wavelength was the 785 nm
line from a 785 nm Invictus NIR diode laser. All in-line collected spectra were recorded with a
resolution of 4 cm-1 and an exposure time of one second, using a laser power of 400 mW.
Spectra were collected every 20 seconds. The analyzed spectral region was 100 – 1800 cm-1,
since this region contains all envisaged drug and polymer information. Prior to data analysis,
SNV pre-processing was applied on the in-line collected spectra to eliminate the additive
baseline offset variations and multiplicative scaling effects in the spectra, induced by
pressure variations at the measurement point.
Figure 7.2. Experimental setup. 1) Extruder control panel, 2) Feeder control panel, 3) Feeder unit, 4) Extrusion
barrel, 5) Extrusion die with implemented Raman probe.
After storage of the samples collected during extrusion at room temperature for one year,
off-line Raman spectra of the extrudates were collected to verify the stability of the end
products. These spectra were recorded with a resolution of 4 cm-1 and an exposure time of
five seconds, using a laser power of 400 mW.

CHAPTER 7 – IN-LINE SOLID STATE PREDICTION DURING PHARMACEUTICAL HOT-MELT EXTRUSION IN A 12 MM TWIN SCREW EXTRUDER USING RAMAN SPECTROSCOPY
154
7.2.4. Data collection, alignment and analysis
An experimental design (Table 7.1) was created using the MODDE software (version 9.1.0.0,
Umetrics, Umeå, Sweden) to study the influence of the above described factors (drug load,
screw configuration and processing temperature) on extrusion. The applied design was a full
factorial (mixed) screening design with two quantitative factors, CEL concentration and
processing temperature, and screw configuration as a qualitative factor with three levels (FF,
FB and 2F, Figure 7.1). The monitored responses in the design were the melt temperature as
measured by the temperature probe in the die head, die pressure and the physicochemical
state of the extrudates, which was monitored with Raman spectroscopy. Data collection
during each design experiment (Raman spectral data + logged data) and data alignment
were automated using the SIPAT software (Siemens NV, Brussels, Belgium) and SIMCA Q
(Umetrics, Umeå, Sweden). Raman spectral data analysis was performed using SIMCA P+
(version 12.0.1.0, Umetrics, Umeå, Sweden).
The analysed spectral region was the region from 0 to 1800 cm-1. Since the formulation
coloured slightly yellow (due to the use of Eudragit® E PO) during extrusion, the background
signal of all Raman spectra gained intensity. Coloured substances will absorb laser beam
energy, and generate fluorescence which contaminates the Raman spectrum. However, the
peaks of CEL were still detectable in the in-line collected spectra. Soft independent
modelling of class analogy (SIMCA) was used to distinguish between extrudates containing
crystalline CEL, and extrudates where a glassy solid solution was formed, where CEL is
molecularly dissolved into the polymer matrix. Therefore, principal component analysis
(PCA) was in first instance performed on all spectra collected during the design experiments
(Table 7.1), hence providing a general overview of the data and giving an indication of
present class separation (i.e., glassy solid solution versus crystalline suspension), trends and
outliers [14]. Subsequent to this initial overview, each class of observations determined from
this PCA was modelled separately by disjoint PCA models. These two separate PCA models
were then used to predict a likely class membership for new observations. Based on the
residual variation of each class, the distance to the model (DModX) for each (new)
observation can be calculated [14]. DModX values are calculated by Eq. (7.1):

CHAPTER 7 – IN-LINE SOLID STATE PREDICTION DURING PHARMACEUTICAL HOT-MELT EXTRUSION IN A 12 MM TWIN SCREW EXTRUDER USING RAMAN SPECTROSCOPY
155
(7.1)
Where eik are the sum-squared residuals after projection of the observation on the PCA
model of a certain class, A is the number of principal components retained to model this
class and K is the number of variables. A critical distance (Dcrit) to the model is calculated
(from the F-distributed values of the residual standard deviation of each observation divided
by the pooled residual standard deviation of the model) and is set at the 0.05 probability
level. When the probability of belonging to the model is higher than 95%, the observation is
considered as a member of that particular class. Observations that do not fit any class, i.e.
observations found outside Dcrit are considered as either outliers or members of a new,
unseen class. In a Coomans’ plot, DModX values for two classes are plotted against each
other in a scatter plot. By plotting the class membership limits (Dcrit) as well, four areas of
diagnostic interest are created. The upper left-hand and lower right-hand area contain
observations belonging to one of both classes can be found. In the lower left-hand area of
the plot, there is a region where prediction set samples that fit both models are found, and
in the upper right-hand area the observations that do not conform with either of the models
are found.
The ability of a class model to classify observations correctly cannot be realistically assessed
if only training set samples are considered. It is recommended that an independent
prediction set of observations that has not influenced the model calculations is employed.
This will enable a more realistic assessment of the classification performance of each model
[14]. The classification model developed for classification of new samples was implemented
in the SIPAT software, and applied for real-time data analysis and solid state predictions of
new runs.
7.2.5. Differential scanning calorimetry
From each experiment (Table 7.1), samples were collected after extrusion. Differential
scanning calorimetry was performed with a DSC Q 2000 (TA Instruments, Belgium). The
thermograms were produced with the Thermal Advantage Release 5.1.2 software and

CHAPTER 7 – IN-LINE SOLID STATE PREDICTION DURING PHARMACEUTICAL HOT-MELT EXTRUSION IN A 12 MM TWIN SCREW EXTRUDER USING RAMAN SPECTROSCOPY
156
analysed with TA Instruments Universal Analysis 2000 4.7A (TA Instruments, Belgium).
Hermetically sealed aluminium hermetic pans (TA Instruments, Belgium) were used to
contain the samples. Measurements were carried out in a nitrogen atmosphere. The flow
rate of dry nitrogen gas was 50 mL/min. Samples were subjected to three cycles. First, the
pans were heated with a heating rate of 10,0 °C/min from 0°C up to 200°C in the first heating
cycle. Then, a cooling cycle was started with a cooling rate of -10,0 °C/min to 0°C, followed
by a second and final heating cycle which was identical to the first. The results from the first
heating cycle reflect the influences of the hot-melt extrusion processing on the mixture,
whereas the second heating cycle provides insight in the possible interactions between both
pure components.
7.2.6. X-ray powder diffraction
The crystallinity of CEL was assessed using X-ray diffraction on the pure compounds, the
physical mixtures and the produced extrudates. X-ray diffraction was performed with a D2
Phaser (Bruker) in the angular range of 5° < 2θ < 70° using a step scan mode (step size =
0.020°, step time = 1s).

CHAPTER 7 – IN-LINE SOLID STATE PREDICTION DURING PHARMACEUTICAL HOT-MELT EXTRUSION IN A 12 MM TWIN SCREW EXTRUDER USING RAMAN SPECTROSCOPY
157
7.3. RESULTS AND DISCUSSION
7.3.1. In-line monitoring of solid state
DSC measurements were performed on the pure components CEL and Eudragit® E PO and
on a physical mixture (50:50) of both to assess the solubility of CEL in Eudragit® E PO (Figure
7.3). To determine the Tm for CEL and the Tg for Eudragit®, the first heating cycle was used.
The Tm of CEL was found at 164.1°C with an onset temperature of 162.9°C, and the Tg of
Eudragit® E PO was located at 55.6°C with an onset temperature at 54.8°C. To determine
whether CEL is soluble in the Eudragit® E PO matrix, a physical mixture containing 50% of
each component (w/w) was first heated, then cooled and reheated to verify the absence of
crystalline CEL. No endothermic melting peak for CEL was detected in the thermogram of the
second heating cycle, and only one Tg is visible at 62.5°C with an onset temperature of
57.1°C. This indicates that, in this 50:50 (% w/w) mixture, all CEL has interacted with the
polymer on a molecular level, resulting in a glassy solution. Since CEL is soluble in the
Eudragit® E PO matrix, it was not required to perform hot-melt extrusion at or above the Tm
of CEL, hence lowering the processing temperatures required during the experiments.
Figure 7.3. DSC thermograms of 1) pure CEL, first heating cycle, 2) pure Eudragit® E PO, first heating cycle and
3) a physical mixture of both (50:50), second heating cycle.
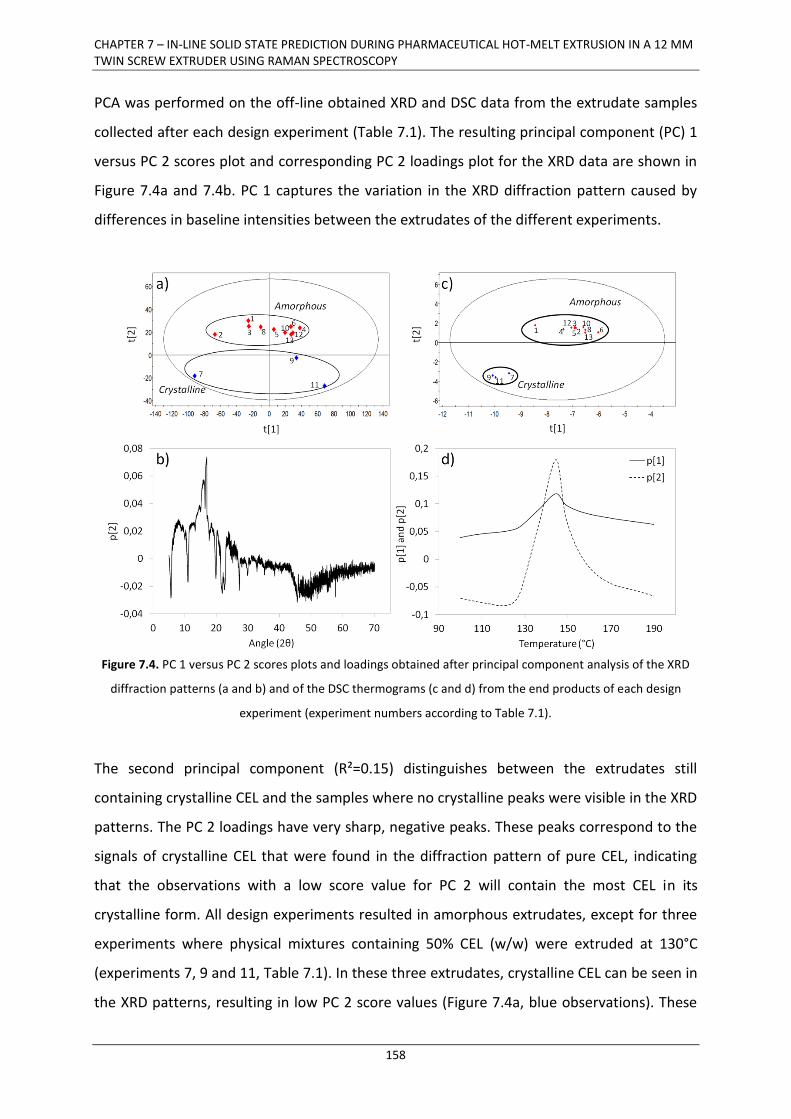
CHAPTER 7 – IN-LINE SOLID STATE PREDICTION DURING PHARMACEUTICAL HOT-MELT EXTRUSION IN A 12 MM TWIN SCREW EXTRUDER USING RAMAN SPECTROSCOPY
158
PCA was performed on the off-line obtained XRD and DSC data from the extrudate samples
collected after each design experiment (Table 7.1). The resulting principal component (PC) 1
versus PC 2 scores plot and corresponding PC 2 loadings plot for the XRD data are shown in
Figure 7.4a and 7.4b. PC 1 captures the variation in the XRD diffraction pattern caused by
differences in baseline intensities between the extrudates of the different experiments.
Figure 7.4. PC 1 versus PC 2 scores plots and loadings obtained after principal component analysis of the XRD
diffraction patterns (a and b) and of the DSC thermograms (c and d) from the end products of each design
experiment (experiment numbers according to Table 7.1).
The second principal component (R²=0.15) distinguishes between the extrudates still
containing crystalline CEL and the samples where no crystalline peaks were visible in the XRD
patterns. The PC 2 loadings have very sharp, negative peaks. These peaks correspond to the
signals of crystalline CEL that were found in the diffraction pattern of pure CEL, indicating
that the observations with a low score value for PC 2 will contain the most CEL in its
crystalline form. All design experiments resulted in amorphous extrudates, except for three
experiments where physical mixtures containing 50% CEL (w/w) were extruded at 130°C
(experiments 7, 9 and 11, Table 7.1). In these three extrudates, crystalline CEL can be seen in
the XRD patterns, resulting in low PC 2 score values (Figure 7.4a, blue observations). These

CHAPTER 7 – IN-LINE SOLID STATE PREDICTION DURING PHARMACEUTICAL HOT-MELT EXTRUSION IN A 12 MM TWIN SCREW EXTRUDER USING RAMAN SPECTROSCOPY
159
extrudates were also opaque, whereas all other formulations resulted in transparent end
products.
PCA was also performed on all thermograms (first heating cycle) collected after each design
experiment. Only a small region of the thermograms was used for analysis, from 100°C to
190C°, since this region captures information related to the presence of a melt peak for CEL.
The PC 1 (R²=0.93) versus PC 2 (R²=0.06) scores plot and the loadings plots for both
components are shown in Figure 7.4c and 7.4d, respectively. The loadings for both PC 1 and
PC 2 show a peak at the position where crystalline CEL displays a melting peak in the
thermogram. This indicates that measurements with low score values in both components
will contain crystalline CEL. Hence, DSC analysis of the extrudates clustered the end products
in an identical manner as the XRD analysis. In the three experiments with a concentration of
50% CEL (w/w) at a temperature of 130°C (blue observations in Figure 7.4c), an endothermic
melting peak was visible at 143.3°C, 143.7°C and 145.3°C when using the FF, FB and 2F screw
configurations, respectively.
During each extrusion experiment (15 experiments, Table 7.1), 15 in-line Raman spectra
were collected resulting in a data set of 225 spectra. In first instance, a general overview of
the data was envisaged by applying PCA on this training set. The resulting PC 1 versus PC 2
scores plot (Figure 7.5a) shows three clusters of spectra oriented along PC 1 (R²=0.96). The
spectra having the highest PC 1 score values correspond to the extrudates containing 50%
CEL (w/w) extruded at 130°C. The loadings of this component (Figure 7.5b) indeed represent
the sharp peaks of crystalline CEL, indicating that the spectra having a high PC 1 score value
correspond to extrudates containing crystalline CEL. This was confirmed by the off-line XRD
and DSC analysis. However, Raman spectroscopy seems to distinguish two groups within the
spectra collected during all other experiments of the design. The spectra obtained during
extrusion of 30% CEL (w/w) mixtures at 130°C (experiments 1, 3 and 5, Table 7.1) have lower
PC 1 score values than the spectra collected during extrusion of 50% CEL (w/w) mixtures at
130°C, but these score values are remarkably higher than those for all other experiments of
the design. Raman spectroscopy apparently detects an additional difference between the
spectra collected during extrusion of 30% CEL (w/w) at 130°C and the other experiments,
which was not found in XRD and DSC analysis. According to the latter two, these extrudates

CHAPTER 7 – IN-LINE SOLID STATE PREDICTION DURING PHARMACEUTICAL HOT-MELT EXTRUSION IN A 12 MM TWIN SCREW EXTRUDER USING RAMAN SPECTROSCOPY
160
did not contain any crystalline CEL. Nevertheless, the Raman spectra suggest that there is
some crystalline CEL present when extruding a 30% CEL (w/w) mixture at 130°C.
Figure 7.5. a) PC 1 versus PC 2 scores scatterplot obtained after PCA of the in-line collected Raman spectra and
b) PC 1 loadings plot.
When the scores of PC 1 are used as responses in the experimental design (Table 7.1), only
the factor temperature has a significant (negative) effect on the scores of PC 1, which
captures the spectral variation related to physicochemical state of the extrudates. It is
possible to create glassy solutions with 30%, 40% and 50% CEL (w/w), as long as the selected
processing temperature is high enough. A negative effect of temperature on the score values
for PC 1 was registered, indicating that the lower the processing temperature is, the higher
the score values in PC 1 will be and thus the more crystalline CEL will be. The tested

CHAPTER 7 – IN-LINE SOLID STATE PREDICTION DURING PHARMACEUTICAL HOT-MELT EXTRUSION IN A 12 MM TWIN SCREW EXTRUDER USING RAMAN SPECTROSCOPY
161
modifications in the screw configuration did not affect the physicochemical state of the
extrudates for this formulation.
Figure 7.6. Coomans’ plot for the validation set: Distances of the new Raman observations to the models with
(y-axis) and without crystalline CEL (x-axis).
In a next step, a classification model was developed allowing the classification according to
solid state of new extruded physical mixtures. Therefore, SIMCA modelling was applied. The
dataset used for PCA with Raman spectra was split into two separate groups (classes)
according to the off-line DSC and XRD measurements (one class where crystalline CEL is still
present and a second class where no crystalline CEL was detected) and a separate PCA
model was fit for each class. The class where crystalline CEL was detected in the off-line
measurements contained 45 spectra (experiments 7, 9 and 11, Table 7.1) and the class
where no crystalline CEL was found comprised 180 spectra (all other experiments). The class
membership of a validation set containing 75 in-line collected Raman spectra (5 non
subsequent spectra from each experiment) which were not used to build the model was
estimated by calculating the distance to the model of these new spectra (observations). A
Coomans’ plot was used as a diagnostic tool to interpret the classification results of this
validation set (Figure 7.6). The experiments at 130°C with 50% CEL (w/w) (experiments 7, 9
and 11, Table 7.1) are assigned to the group containing crystalline CEL, and all other
experiments, with exception of the spectra collected during extrusion of 30% CEL (w/w) at
130°C (experiments 1, 3 and 5, Table 7.1), belong to the group where no crystalline CEL is
detected. In-line Raman measurements do not classify the spectra of the latter as
completely crystalline or without any crystallinity, since the critical distance (Dcrit, red lines)

CHAPTER 7 – IN-LINE SOLID STATE PREDICTION DURING PHARMACEUTICAL HOT-MELT EXTRUSION IN A 12 MM TWIN SCREW EXTRUDER USING RAMAN SPECTROSCOPY
162
is exceeded for both models. The Raman spectra of these three experiments showed bands
which were sharper than the amorphous spectra, but broader than the crystalline spectra
(Figure 7.7), indicating the presence of CEL that has dissolved into the matrix and CEL in its
crystalline state. This indicates a possible higher sensitivity of in-line Raman spectroscopy to
determine the physicochemical state of the extrudates compared to the off-line XRD and
DSC results. This developed classification model was added to the measuring method in the
SIPAT software, allowing real-time determination of the solid state in the continuously
produced extrudates.
Figure 7.7. In-line collected Raman spectra during extrusion of 50% CEL (w/w) at 130°C (purple) and 150°C
(green) and of 30% CEL (w/w) at 130°C (red) and 150°C (blue).
A Coomans’ plot was calculated for the off-line XRD and DSC measurements as well (Figure
7.8a and 7.8b, respectively). Two separate PCA models were fit for each class observed in
the original PCA models, i.e. a class where crystalline CEL was detected, and a class where no
crystalline CEL was found. The class with crystalline CEL contained the off-line data from
experiments 7, 9 and 11 (Table 7.1), and all other off-line measurements were assigned to
the class without crystalline CEL. The distance to these two new PCA models for new off-line
measurements performed on extrudate samples collected after each experiment was
calculated and plotted. The XRD diffraction patterns show that all measurements with

CHAPTER 7 – IN-LINE SOLID STATE PREDICTION DURING PHARMACEUTICAL HOT-MELT EXTRUSION IN A 12 MM TWIN SCREW EXTRUDER USING RAMAN SPECTROSCOPY
163
exception of the three experiments with physical mixtures containing a 50% CEL
concentration (w/w) that were extruded at 130°C, have a DModX lower than Dcrit for the
PCA model without the crystalline data. In the Coomans’ plot based on the DSC
measurements, four datapoints exceed the critical distance to the model without crystalline
CEL. Three of these points are the measurements conducted on extrudates containing 50%
CEL (w/w) and extruded at 130°C, and the other datapoint, only slightly exceeding the limit,
is the extrudate with 40% CEL (w/w).
Figure 7.8. a) Coomans’ plot for the prediction of off-line measurements: distance of the new observations in
XRD (a) and DSC (b) measurements to the models with (y-axis) and without crystalline CEL (x-axis)

CHAPTER 7 – IN-LINE SOLID STATE PREDICTION DURING PHARMACEUTICAL HOT-MELT EXTRUSION IN A 12 MM TWIN SCREW EXTRUDER USING RAMAN SPECTROSCOPY
164
From each run of the experimental design, extrudate samples were collected and stored at
room temperature for one year. Then, off-line Raman spectra were collected from these
samples, to verify the stability of the extrudates. Principal component analysis was applied
to these measurements, and the resulting PC 1 (R²=0.81) versus PC 2 (R²=0.15) scores plot
(Figure 7.9a) demonstrates that the spectra collected from extrudates with 30% CEL (w/w)
extruded at 130°C (experiments 1, 3 and 5, Table 7.1) and with 50% CEL (w/w) extruded at
130°C (experiments 7, 9 and 11, Table 7.1) have higher PC 1 score values than the spectra
collected from all other extrudate samples. The loadings of this component (Figure 7.9b)
again represent crystalline CEL. This indicates that recrystallization has occurred in the
extrudates containing 30% CEL (w/w) which were extruded at 130°C. The Raman spectra for
these samples show sharp bands for CEL. Therefore, the developed classification model for
solid state also provides an indication of the storage stability of the extrudates.
Figure 7.9. a) PC 1 versus PC 2 scores scatterplot obtained after PCA of the off-line collected Raman spectra
after storage at room temperature for 1 year and b) PC 1 loadings plot.

CHAPTER 7 – IN-LINE SOLID STATE PREDICTION DURING PHARMACEUTICAL HOT-MELT EXTRUSION IN A 12 MM TWIN SCREW EXTRUDER USING RAMAN SPECTROSCOPY
165
7.3.2. Influence of die pressure on in-line collected Raman spectra
In addition to solid state properties, Raman spectra collected during extrusion in the die
head also provide information on processing history. When PCA is applied on the raw
spectra of all experiments in Table 7.1 (without any pre-processing), clustering in the PC 1
versus PC 2 scores plot along PC 1 according to processing temperature can be observed
(Figure 7.10a). This is expressed in the Raman spectra as differences in background signal
(Figure 7.10b). However, the temperature at the Raman measurement point, the die, was
kept constant at 110°C, and the average monitored melt temperature in the die did not vary
more than ± 3°C between al the experiments from the design (Table 7.1). On the other hand,
a large variation in average die pressure can be noticed between the different experiments
(Table 7.1 and Figure 7.10b). This variation is caused by two factors. First, a higher
processing temperature reduces the viscosity of the melt, and lowers the die pressure.
Secondly, CEL has a plasticizing effect on Eudragit® E PO [5]. The CEL molecules settle
between the polymer chains and decrease the interaction between the polymer molecules.
The more CEL interacts with the matrix, the lower the viscosity of the melt, resulting in the
lowest die pressures when 50% CEL (w/w) is extruded at a temperature of 150°C and the
highest pressures when 30% and 50% CEL (w/w) are processed at 130°C. A higher pressure
at the measurement point results in a decrease in Raman intensity [15]. Possible causes for
this intensity decrease are the scattering losses due to heterogeneities induced by pressure
gradients, and a change of absorption coefficient with pressure. This is a general
observation, and is manifested as an intensity decrease in the whole spectrum (Figure
7.10b).
Die pressure changes during hot-melt extrusion are not only related to drug concentration or
processing temperatures, but can also be caused by changes in feeder performance. Since
the in-line collected Raman spectra are influenced by the relative pressure in the die, Raman
spectroscopy also reflects the performance of the feeding equipment during processing. PCA
was applied on all Raman spectra collected during experiment number 10 from the design
(Table 7.1) with a physical mixture containing 50% CEL (w/w), at a temperature of 150°C and
with the FB screw configuration. The scores from the first principal component were plotted
together with the feed rate and the die pressure versus process time (Figure 7.11). The
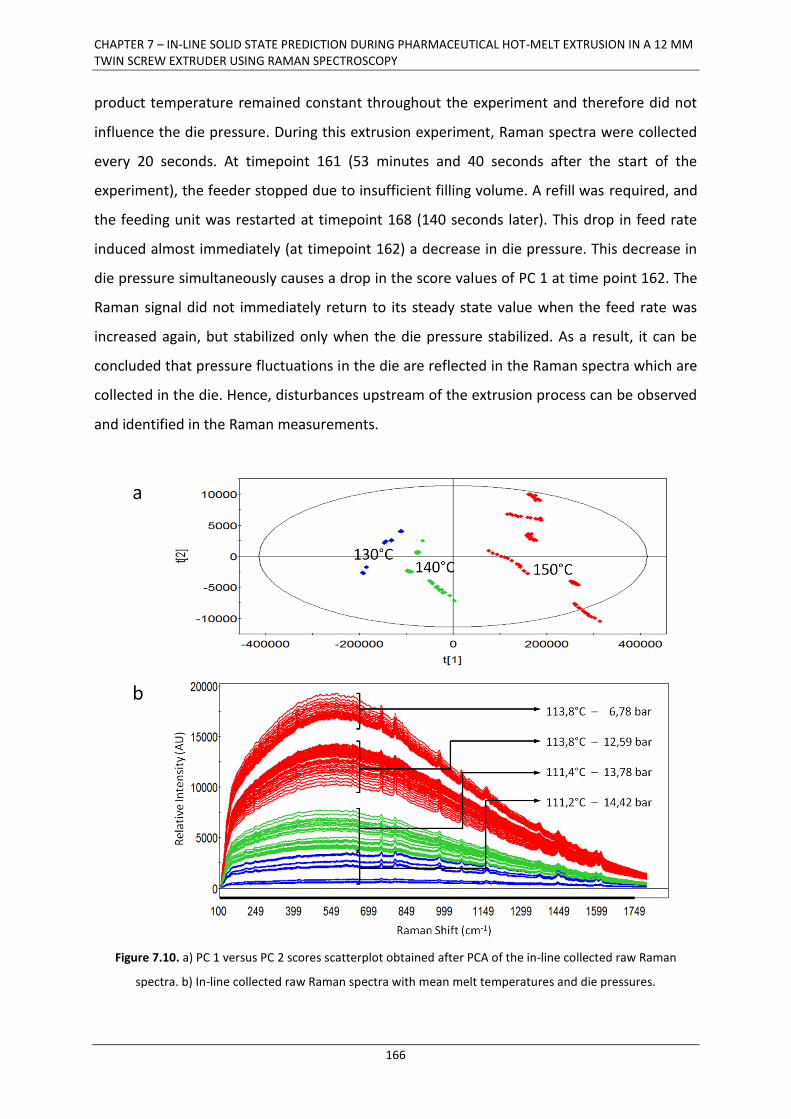
CHAPTER 7 – IN-LINE SOLID STATE PREDICTION DURING PHARMACEUTICAL HOT-MELT EXTRUSION IN A 12 MM TWIN SCREW EXTRUDER USING RAMAN SPECTROSCOPY
166
product temperature remained constant throughout the experiment and therefore did not
influence the die pressure. During this extrusion experiment, Raman spectra were collected
every 20 seconds. At timepoint 161 (53 minutes and 40 seconds after the start of the
experiment), the feeder stopped due to insufficient filling volume. A refill was required, and
the feeding unit was restarted at timepoint 168 (140 seconds later). This drop in feed rate
induced almost immediately (at timepoint 162) a decrease in die pressure. This decrease in
die pressure simultaneously causes a drop in the score values of PC 1 at time point 162. The
Raman signal did not immediately return to its steady state value when the feed rate was
increased again, but stabilized only when the die pressure stabilized. As a result, it can be
concluded that pressure fluctuations in the die are reflected in the Raman spectra which are
collected in the die. Hence, disturbances upstream of the extrusion process can be observed
and identified in the Raman measurements.
Figure 7.10. a) PC 1 versus PC 2 scores scatterplot obtained after PCA of the in-line collected raw Raman
spectra. b) In-line collected raw Raman spectra with mean melt temperatures and die pressures.

CHAPTER 7 – IN-LINE SOLID STATE PREDICTION DURING PHARMACEUTICAL HOT-MELT EXTRUSION IN A 12 MM TWIN SCREW EXTRUDER USING RAMAN SPECTROSCOPY
167
Figure 7.11. PC 1 score values for the Raman spectra from the first principal component plotted with the feed
rate (kg/h) and the measured die pressure (bar).

CHAPTER 7 – IN-LINE SOLID STATE PREDICTION DURING PHARMACEUTICAL HOT-MELT EXTRUSION IN A 12 MM TWIN SCREW EXTRUDER USING RAMAN SPECTROSCOPY
168
7.4. CONCLUSION
The results in chapter 7 demonstrate that Raman spectroscopic measurements allowed the
differentiation between glassy solid solutions and crystalline dispersions. A classification
model was developed to classify continuously produced extrudates according to solid state
in real-time. Off-line analysis with DSC and XRD appeared not to be sensitive enough to
detect small fractions of crystalline CEL that later on induced recrystallization of CEL in the
extrudates during storage. This small fraction was noticed in the Raman spectra, which
therefore also provided information on the stability of the extrudates. Consequently, Raman
spectroscopy can be used for the monitoring of product quality during hot-melt extrusion on
the development scale. Additionally, die pressure fluctuations caused by feeding
disturbances upstream the extrusion process are reflected in the Raman spectra.

CHAPTER 7 – IN-LINE SOLID STATE PREDICTION DURING PHARMACEUTICAL HOT-MELT EXTRUSION IN A 12 MM TWIN SCREW EXTRUDER USING RAMAN SPECTROSCOPY
169
7.5. REFERENCES
[1] C. Leuner, J. Dressman, Eur J Pharm Biopharm 50 (2000) 47-60.
[2] T. Vasconcelos, B. Sarmento, P. Costa, Drug Discovery Today 12 (2007) 1068-1075.
[3] K. Dhirendra, S. Lewis, N. Udupa, K. Atin , Pak J Pharm Sci 22 (2009) 234-246.
[4] S. Janssens, G. Van den Mooter, J Pharm Pharmacol 61 (2009) 1571-1586.
[5] J. Albers, Hot-melt extrusion with poorly soluble drugs, Institut für Pharmazeutische
Technologie und Biopharmazie, Heinrich-Heine Universität, Düsseldorf, Germany,
2008.
[6] G.P. Andrews, O. Abu-Diak, F. Kusmanto, P. Hornsby, Z. Hui, D.S. Jones, J Pharm
Pharmacol 62 (2010) 1580-1590.
[7] G.P. Andrews, O.A. Abu-Diak, D.S. Jones, J Pharm Sci 99 (2010) 1322-1335.
[8] L.S. Taylor, G. Zografi, Pharm Res 14 (1997) 1691-1698.
[9] L. Saerens, L. Dierickx, B. Lenain, C. Vervaet, J.P. Remon, T. De Beer, Eur J Pharm
Biopharm 77 (2011) 158-163.
[10] T. De Beer, A. Burggraeve, M. Fonteyne, L. Saerens, J.P. Remon, C. Vervaet, Int J
Pharm 417 (2011) 32-47.
[11] L. Saerens, L. Dierickx, T. Quinten, P. Adriaensens, R. Carleer, C. Vervaet, J. P. Remon,
T. De Beer, Eur J Pharm Biopharm 81 (2012) 230-237.
[12] J. Breitkreutz, Pharm Res 15 (1998) 1370-1375.
[13] A. Forster, J. Hempenstall, I. Tucker, T. Rades, Int J Pharm 226 (2001) 147-161.
[14] L. Eriksson, E. Johansson, N. Kettaneh-Wold, J. Trygg, C. Wikström, S. Wold, PLS, In:
Multi- and Megavariate Data Analysis Part I: Basic Principles and Applications, 3rd ed.,
Umetrics Academy, Umeå, Sweden, 2006, p. 63-101.
[15] G. Lucazeau, J Raman Spectrosc 34 (2003) 478-496.

CHAPTER 7 – IN-LINE SOLID STATE PREDICTION DURING PHARMACEUTICAL HOT-MELT EXTRUSION IN A 12 MM TWIN SCREW EXTRUDER USING RAMAN SPECTROSCOPY
170

CHAPTER 8 – IN-LINE NIR SPECTROSCOPY FOR THE UNDERSTANDING OF POLYMER-DRUG INTERACTION DURING PHARMACEUTICAL HOT-MELT EXTRUSION
171
CHAPTER 8
IN-LINE NIR SPECTROSCOPY FOR THE
UNDERSTANDING OF POLYMER-DRUG
INTERACTION DURING PHARMACEUTICAL
HOT-MELT EXTRUSION
Parts of this chapter are published in:
L. Saerens, L. Dierickx, T. Quinten, P. Adriaensens, R. Carleer, C. Vervaet, J.P. Remon, T. De
Beer. In-line spectroscopy for the understanding of polymer-drug interaction during
pharmaceutical hot-melt extrusion. European Journal of Pharmaceutics and
Biopharmaceutics, 81 (2012) 230-237.

CHAPTER 8 – IN-LINE NIR SPECTROSCOPY FOR THE UNDERSTANDING OF POLYMER-DRUG INTERACTION DURING PHARMACEUTICAL HOT-MELT EXTRUSION
172
ABSTRACT
Chapter 8 evaluates the use of near-infrared spectroscopy for the in-line determination of
the drug concentration, the polymer-drug solid state behaviour and molecular interactions
during hot-melt extrusion.
Kollidon®SR was extruded with varying metoprolol tartrate (MPT) concentrations (20, 30, and
40% w/w) and monitored using NIR spectroscopy. A PLS model allowed drug concentration
determination. The correlation between predicted and real MPT concentrations was good
(R²=0.97). The predictive performance of the model was evaluated by the root mean square
error of prediction, which was 1.54%. Kollidon®SR with 40% MPT (w/w) was extruded at
105°C and 135°C to evaluate the suitability of NIR spectroscopy for in-line polymer-drug solid
state characterization.
NIR spectra indicated the presence of amorphous MPT and hydrogen bonds between drug
and polymer in the extrudates. More amorphous MPT and interactions could be found in the
extrudates produced at 135°C than at 105°C. Raman spectroscopy, DSC and ATR FT-IR were
used to confirm the NIR observations. Due to the instability of the formulation, only in-line
Raman spectroscopy was an adequate confirmation tool. NIR spectroscopy is a potential
PAT-tool for the in-line determination of API-concentration and for the polymer-drug solid
state behaviour monitoring during pharmaceutical hot-melt extrusion.

CHAPTER 8 – IN-LINE NIR SPECTROSCOPY FOR THE UNDERSTANDING OF POLYMER-DRUG INTERACTION DURING PHARMACEUTICAL HOT-MELT EXTRUSION
173
CHAPTER 8
IN-LINE NIR SPECTROSCOPY FOR THE
UNDERSTANDING OF POLYMER-DRUG
INTERACTION DURING PHARMACEUTICAL
HOT-MELT EXTRUSION
8.1. INTRODUCTION
Hot-melt extrusion (HME) is one of the most widely used processing technologies in the
plastic, food and rubber industry [1]. Recently, it also found its application in pharmaceutical
manufacturing operations, offering many advantages compared to traditional
pharmaceutical processing techniques [1-5] for solids: the process is anhydrous; poorly
compactable materials can be incorporated into tablets; the materials have a short
residence time in the extruder during processing; HME enables superior mixing (both
distributive and dispersive); it allows the production of formulations with modified release; it
allows masking of the bitter taste of several active pharmaceutical ingredients (API’s) and in
addition it improves the dissolution rate and the bioavailability of poorly water soluble drugs
by the formation of solid solutions or solid dispersions [6]. A solid dispersion consists of at
least two different components, generally a hydrophilic matrix and a hydrophobic drug [7].
The polymer matrix can be either crystalline or amorphous, and the drug can be dispersed
molecularly, in amorphous clusters or in crystalline particles. Each of these solid states has
its own properties such as storage stability, dissolution rate, etc. The degree of crystallinity
or amorphism in pharmaceutical materials is recognized as a critical factor that will affect
drug stability and dosage form performance [8].

CHAPTER 8 – IN-LINE NIR SPECTROSCOPY FOR THE UNDERSTANDING OF POLYMER-DRUG INTERACTION DURING PHARMACEUTICAL HOT-MELT EXTRUSION
174
Nowadays, extruders already allow in-line monitoring and control of process parameters
(e.g. barrel and die temperature, powder feed rate and screw speed, torque and melt
pressure in the extruder and die). In-line monitoring and control of quality parameters
corresponding to the extruded product itself, such as drug load and solid state, has been
performed recently with Raman spectroscopy [9], but not yet with NIR spectroscopy. Besides
real-time assessment of product characteristics, in-line spectroscopic monitoring helps to
increase the understanding of the product behaviour during extrusion.
Today, the intention within the pharmaceutical industry is to move from traditional batch
processing towards continuous processing, hereby increasing process efficiency and
production. Continuous processes are based on the one-in-one-out principle and offer many
advantages: no scale-up issues resulting in a shorter development time, possible automation
of the production line, reduction of production costs, faster product release, less product
variability and improved product quality [10,11]. Hot-melt extrusion can be operated as a
continuous process, capable of consistent product flow at relatively high throughput rates
[1], making it suitable for large scale production.
The FDA has introduced the concept of Process Analytical Technology (PAT) in 2004 [12].
Pharmaceutical products must meet very strict specifications. However, conventional
pharmaceutical manufacturing is generally accomplished using batch processing followed by
time-consuming, expensive and less efficient off-line laboratory testing on randomly
collected samples to evaluate the intermediate or end product quality. The processes
themselves are not fully understood and are often inefficient black-boxes. PAT-tools such as
near-infrared (NIR) spectroscopy provide in-line and real-time process information
concerning critical formulation parameters, which might contribute to steering processes
towards their desired state through adaptations of process settings. It is evident that
continuous manufacturing needs continuous process monitoring and control.
Near-infrared spectroscopy is a fast, non-destructive analytical technique, which requires
(nearly) no sample pre-treatments [13]. In the near infrared area (800-2500 nm or 12500-
4000 cm-1), mainly vibrations of CH, OH, NH and SH bonds are observed as overtones or
combinations of the fundamental IR bands, resulting in overlapping absorption bands in the

CHAPTER 8 – IN-LINE NIR SPECTROSCOPY FOR THE UNDERSTANDING OF POLYMER-DRUG INTERACTION DURING PHARMACEUTICAL HOT-MELT EXTRUSION
175
spectra. Hence, NIR spectra are more complex and difficult to interpret compared to IR
spectra. Therefore, chemometrics are often required to extract the useful information from
the NIR spectra [14]. Because of its unique properties [14], like high analysis speed, no need
for sample preparations, its non-destructive and non-invasive nature of analysis and the use
of fibre optical probes, NIR spectroscopy is an ideal process analyzer for hot-melt extrusion.
Furthermore, due to the fact that NIR spectra are sensitive to changes in hydrogen bonding
and packing in the crystal lattice, NIR can be applied for solid state analysis and the
understanding of molecular interactions [15].
NIR spectroscopy has been applied in-line and in the transmission mode during single-screw
hot-melt extrusion to monitor the HDPE/PP [16, 17] and LDPE/PP [18] polymer melt
composition in the extrusion die. Furthermore, NIR spectroscopy has been used to monitor
the ethylene vinylacetate copolymer composition in the extrusion die during single-screw
extrusion [19-21], and for the quantification of the copolymer composition in a
polypropylene and ethylene vinyl acetate blend [22] during twin-screw extrusion. NIR has
also been applied to measure the polymer melt flow index [21] in single-screw extrusion and
to detect and quantify small amounts of Irganox in polypropylene [23] and Mg(OH)2 in LDPE
[20] and HDPE [24] during twin-screw extrusion. In another application, NIR spectroscopy
was used to monitor the content of pulverised chalk in polypropylene [22], to quantify the
melamin cyanurate concentration in polyamid 12 [25] and to quantify the composition of a
PE/PS blend [25] during twin-screw extrusion.
In this chapter, the suitability of NIR spectroscopy in its reflectance mode for the in-line
monitoring of pharmaceutical HME processes was evaluated. Via fibre optic cables, an NIR
probe was implemented in the HME equipment, to monitor the API content and the
polymer-drug behaviour (solid state and molecular interactions) during hot-melt extrusion.

CHAPTER 8 – IN-LINE NIR SPECTROSCOPY FOR THE UNDERSTANDING OF POLYMER-DRUG INTERACTION DURING PHARMACEUTICAL HOT-MELT EXTRUSION
176
8.2. MATERIALS AND METHODS
8.2.1. Materials
Metoprolol tartrate (MPT) (Esteve Quimica, Barcelona, Spain) (Figure 8.1a) was chosen as a
model drug. It has a melting temperature (Tm) around 120°C. Kollidon® SR (Figure 8.1b) was
kindly donated by BASF (Ludwigshafen, Germany). This amorphous polymer consists of 8
parts polyvinyl acetate (w/w) and 2 parts polyvinyl pyrrolidone (w/w). The solubility
parameters of both components were calculated by SPWin, version 2.11 [26] to predict the
solid state miscibility.
Figure 8.1. Molecular structures of a) Metoprolol tartrate (Ph. Eur. 7.0) and b) Kollidon® SR.
8.2.2. Hot-melt extrusion
Hot-melt extrusion was performed with a Prism Eurolab 16 co-rotating, fully intermeshing
twin-screw extruder (Thermo Fisher Scientific, Germany). The temperature of each segment
of the extruder and of the die can be controlled separately. The hot-melt extruder was
equipped with a DD Flexwall® 18 feeder (Brabender® Technologie, Germany), which was set
in its gravimetric feeding mode.

CHAPTER 8 – IN-LINE NIR SPECTROSCOPY FOR THE UNDERSTANDING OF POLYMER-DRUG INTERACTION DURING PHARMACEUTICAL HOT-MELT EXTRUSION
177
For the development of a calibration model allowing in-line API quantification, 3 different
polymer-drug mixtures, consisting of Kollidon® SR and 20%, 30% and 40% (w/w) MPT
respectively, were extruded. Prior to hot-melt extrusion, the polymer and drug were
blended in a mortar. Each mixture was hot-melt extruded with a feeder speed of 0.5 kg/h
and a screw speed of 80 rpm. The barrel temperature profile was set at 90-135-135-135-135-
135°C (from hopper to die) for all mixtures. The minimum batch size used was 700g of
polymer-drug mixture.
In a second part of the study, two identical polymer drug-mixtures were prepared to
evaluate the suitability of NIR spectroscopy for in-line polymer-drug solid state
characterization. Both physical mixtures contained 40% MPT and 60% Kollidon® SR (w/w),
and were extruded with a powder feed rate of 0.5 kg/h and a screw speed of 80 rpm. The
first mixture was extruded using a barrel temperature profile of 90-135-135-135-135-135°C,
which is above the melting temperature of pure MPT. The other mixture was extruded using
a barrel temperature profile of 90-105-105-105-105-105°C.
8.2.3. NIR spectroscopy
Diffuse reflectance NIR spectra were continuously collected in-line and noninvasively during
hot-melt extrusion using a Fourier-Transform NIR spectrometer (Thermo Fisher Scientific,
Zellik, Belgium, Nicolet Antaris II near-IR analyzer) equipped with an InGaAs detector, a
quartz halogen lamp, and a fibre-optic probe which was mounted in the extrusion die (Figure
8.2). Spectra were collected every 30 seconds in the 9000 – 4500 cm-1 region with a
resolution of 16 cm-1 and averaged over 32 scans. For the monitoring of the stability of the
extruded end products, spectra of the extrudates were continuously collected off-line for 20
minutes immediately after extrusion at room temperature. Here, spectra were collected
every 13 seconds with a resolution of 16 cm-1 and averaged over 32 scans.
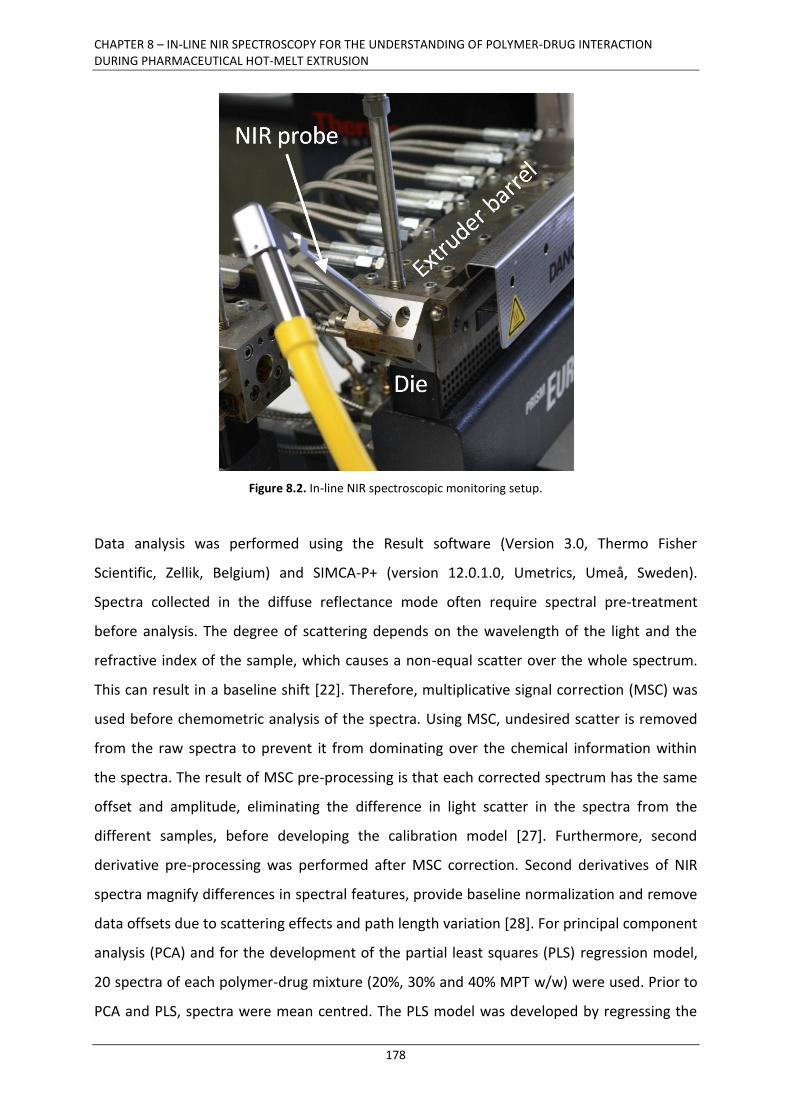
CHAPTER 8 – IN-LINE NIR SPECTROSCOPY FOR THE UNDERSTANDING OF POLYMER-DRUG INTERACTION DURING PHARMACEUTICAL HOT-MELT EXTRUSION
178
Figure 8.2. In-line NIR spectroscopic monitoring setup.
Data analysis was performed using the Result software (Version 3.0, Thermo Fisher
Scientific, Zellik, Belgium) and SIMCA-P+ (version 12.0.1.0, Umetrics, Umeå, Sweden).
Spectra collected in the diffuse reflectance mode often require spectral pre-treatment
before analysis. The degree of scattering depends on the wavelength of the light and the
refractive index of the sample, which causes a non-equal scatter over the whole spectrum.
This can result in a baseline shift [22]. Therefore, multiplicative signal correction (MSC) was
used before chemometric analysis of the spectra. Using MSC, undesired scatter is removed
from the raw spectra to prevent it from dominating over the chemical information within
the spectra. The result of MSC pre-processing is that each corrected spectrum has the same
offset and amplitude, eliminating the difference in light scatter in the spectra from the
different samples, before developing the calibration model [27]. Furthermore, second
derivative pre-processing was performed after MSC correction. Second derivatives of NIR
spectra magnify differences in spectral features, provide baseline normalization and remove
data offsets due to scattering effects and path length variation [28]. For principal component
analysis (PCA) and for the development of the partial least squares (PLS) regression model,
20 spectra of each polymer-drug mixture (20%, 30% and 40% MPT w/w) were used. Prior to
PCA and PLS, spectra were mean centred. The PLS model was developed by regressing the

CHAPTER 8 – IN-LINE NIR SPECTROSCOPY FOR THE UNDERSTANDING OF POLYMER-DRUG INTERACTION DURING PHARMACEUTICAL HOT-MELT EXTRUSION
179
MPT-concentrations (Y) versus the corresponding in-line collected NIR spectra (X). This
model was validated using 5 new NIR spectra collected during new extrusion runs of each
polymer-drug mixture. These validation spectra were used to evaluate the predictive
performance of the PLS model.
8.2.4. Raman spectroscopy
To confirm the in-line NIR polymer-drug solid state observations, Raman spectra were
collected using a Raman Rxn1 spectrometer (Kaiser Optical Systems, Ann Arbor, MI, USA),
equipped with an air-cooled CCD detector. A fibre-optic Raman Dynisco probe was used to
monitor the extrusion process in-line. The Raman Dynisco probe was implemented into the
extrusion die [9], in an identical manner as the NIR probe (see Figure 8.2). The laser
wavelength was the 785 nm line from a 785 nm Invictus NIR diode laser. All spectra were
recorded with a resolution of 4 cm-1 and an exposure time of 2 seconds, using a laser power
of 400 mW. Spectra were collected every 15 seconds. Data collection and data transfer were
automated using the HoloGRAMS™ data collection software, the HoloREACT™ reaction
analysis and profiling software, the Matlab software (version 7.1, The MathWorks Inc.,
Natick, MA) and SIMCA-P+ (version 12.0.1.0, Umetrics, Umeå, Sweden) was used for data
analysis . The analyzed spectral region was 0 – 1800 cm-1, since this region contained all
useful drug and polymer information. Savitzky-Golay and SNV pre-processing were applied
on the in-line collected spectra to exclude inter-batch variation and variation caused by
baseline-shifts, respectively.
8.2.5. DSC analysis
Differential scanning calorimetry was performed with a DSC Q 2000 (TA Instruments,
Belgium). The thermograms were produced with the Thermal Advantage Release 5.1.2
software and analysed with TA Instruments Universal Analysis 2000 4.7A (TA Instruments,
Belgium). Hermetically sealed aluminium pans (TA Instruments, Belgium) were used
containing the samples of approximately 5 mg. Measurements were carried out in a nitrogen
atmosphere. The flow rate of dry nitrogen gas was 50 mL/min. Temperature and enthalpic
calibration was performed using indium as standard. Samples were subjected to three

CHAPTER 8 – IN-LINE NIR SPECTROSCOPY FOR THE UNDERSTANDING OF POLYMER-DRUG INTERACTION DURING PHARMACEUTICAL HOT-MELT EXTRUSION
180
cycles. First, the pans were heated with a heating rate of 10,0°C/min from -30°C up to 180°C
in the first heating cycle. Then, a cooling cycle was started with a cooling rate of -10,0°C/min
to -30°C, followed by a second and final heating cycle which was identical to the first.
8.2.6. ATR FT-IR spectroscopy
In addition to DSC analysis and Raman spectroscopy, attenuated total reflectance (ATR)
Fourier transform (FT) infrared (IR) spectroscopy was also used to confirm the solid state
observations in the NIR spectra. Spectra were collected from MPT and Kollidon® SR, from the
physical mixture containing 40% MPT in Kollidon® SR (w/w) and from the extrudates of this
physical mixture extruded at 135°C and 105°C. The ATR FT-IR spectra were collected with a
Bruker Vertex 70 FT-IR spectrometer, equipped with a DTGS detector and a PIKE accessory,
equipped with a diamond ATR crystal.

CHAPTER 8 – IN-LINE NIR SPECTROSCOPY FOR THE UNDERSTANDING OF POLYMER-DRUG INTERACTION DURING PHARMACEUTICAL HOT-MELT EXTRUSION
181
8.3. RESULTS AND DISCUSSION
8.3.1. In-line monitoring of API concentration
Mixtures of 20, 30 and 40% (w/w) MPT in Kollidon® SR were hot-melt extruded. Figure 8.3
shows the differences in the pre-processed in-line collected NIR spectra (6150 - 4500 cm-1).
PCA was applied on 60 NIR spectra (20 spectra per extruded MPT concentration level)
leading to a model with two principal components covering nearly all spectral variation. The
first principal component (PC 1) captures 99.0% of the variation; the second component (PC
2) covers 0.4% of extra variation. The variation captured by the first component is caused by
differences in API concentration, as confirmed by the PC 1 versus PC 2 scores plot (Figure
8.4). The variation captured by the second principal component, contains only a minor part
of the total spectral variation, which is not caused by differences in drug loading.
Figure 8.3. Pre-processed in-line collected NIR spectra of different MPT – Kollidon® SR mixtures. Red = 20%
MPT, green = 30% MPT, blue = 40% MPT (w/w).
A PLS model, allowing prediction of the MPT concentration in unknown samples during hot-
melt extrusion processes was developed. The in-line collected NIR spectra (X) were
regressed versus the known MPT concentrations (Y). A model with two PLS components was

CHAPTER 8 – IN-LINE NIR SPECTROSCOPY FOR THE UNDERSTANDING OF POLYMER-DRUG INTERACTION DURING PHARMACEUTICAL HOT-MELT EXTRUSION
182
chosen, since the goodness of prediction of the model (Q²) did not increase significantly
after adding extra components [27]. The predictive performance of this PLS model was
evaluated using five test spectra collected during new hot-melt extrusion runs of three
mixtures, also containing 20%, 30% and 40% (w/w) MPT in Kollidon® SR. The PLS model was
used to predict the corresponding MPT concentrations of these 15 NIR test spectra. When
plotting the predicted versus the observed MPT concentration values an R² of 0.97 was
obtained. The resulting root mean square error of prediction (RMSEP) was 1.54%. The
spread in predicted concentration values was larger for mixtures containing a drug load of
20% compared to the 30% and 40% MPT mixtures (w/w). NIR absorption bands are typically
broad, and due to overlapping of peaks, it is more difficult to accurately predict small drug
concentrations, since the peaks of MPT are masked by larger peaks of Kollidon® SR.
Figure 8.4. PC 1 (99%) versus PC 2 (0.2%) scores plot obtained after PCA on the pre-processed in-line collected
NIR spectra during extrusion of mixtures containing Kollidon® SR and 20% (red), 30% (green) and 40% (blue)
MPT (w/w).

CHAPTER 8 – IN-LINE NIR SPECTROSCOPY FOR THE UNDERSTANDING OF POLYMER-DRUG INTERACTION DURING PHARMACEUTICAL HOT-MELT EXTRUSION
183
8.3.2. In-line monitoring of solid state and polymer-drug interactions
8.3.2.1. Near-infrared spectroscopy
To obtain a good compatibility between polymer and drug, the difference between solubility
parameters (δ) of polymer and drug should be less than 7.0 MPa1/2 [29]. When this is
achieved, miscibility is likely and, therefore, a glass solution could be formed during melt
extrusion. Components with a difference in solubility parameters higher than 10 MPa1/2 are
likely to be immiscible. The solubility parameter for MPT is 23.6 MPa1/2 and 20.9 MPa1/2 for
Kollidon® SR. As the difference between these solubility parameters is 2.7 MPa1/2, sufficient
miscibility between Kollidon® SR and MPT may be expected.
Two mixtures containing both 40% MPT and 60% Kollidon® SR (w/w) were extruded at 105°C
and 135°C, respectively. It was expected that the fraction of crystalline MPT would be larger
when extrusion was performed at 105°C, since this temperature is below the melting
temperature of MPT (± 120°C). At 135°C, more MPT was expected to transform to the
amorphous state. It is evident that formulations containing a mixture of crystalline and
amorphous API are not stable and therefore not desired in pharmaceutical dosage forms.
However, the aim of the experiments described in this chapter was not to develop a stable
pharmaceutical formulation, but to demonstrate the potential of NIR spectroscopy to
monitor different states of a drug within a formulation and to detect undesired changes in
the solid state of the drug during the hot-melt extrusion process.
Figure 8.5 shows the NIR spectra of the physical mixture (Kollidon® SR with a drug load of
40% MPT (w/w)) and the in-line collected spectra during extrusion of this physical mixture at
105°C and 135°C. When comparing the spectra of the extrudates to those of the physical
mixture, peak shifts throughout the entire spectrum are visible (Figure 8.5a). These shifts
indicate molecular interactions between polymer and drug. The shifts are smaller for the
extrudate produced at 105°C compared to the extrudate processed at 135°C, suggesting
more interaction between Kollidon® SR and MPT in the latter. Some of the MPT in the
extrudates produced at 135°C (above Tm of MPT) is amorphous, which enhances interaction

CHAPTER 8 – IN-LINE NIR SPECTROSCOPY FOR THE UNDERSTANDING OF POLYMER-DRUG INTERACTION DURING PHARMACEUTICAL HOT-MELT EXTRUSION
184
Figure 8.5. Pre-processed NIR spectra of the physical mixture containing 60% Kollidon® SR and 40% MPT (w/w)
(blue) and of the in-line collected spectra during hot-melt extrusion at 105°C (green) and 135°C (red).
with the polymer. At 105°C (below Tm of MPT), a larger fraction of MPT remains crystalline,
explaining the smaller peak shifts in the spectra of this extrudate. Polymers can improve the
physical stability of drugs in solid dispersions, due to specific interactions such as ion-dipole
interactions and intermolecular hydrogen bonding with functional groups of the drug [6, 30].
These interactions are confirmed by the appearance of a peak at 6495 cm-1 (1540 nm) in the
spectra of the extrudates (Figure 8.5b), which is absent in the spectrum of the physical

CHAPTER 8 – IN-LINE NIR SPECTROSCOPY FOR THE UNDERSTANDING OF POLYMER-DRUG INTERACTION DURING PHARMACEUTICAL HOT-MELT EXTRUSION
185
mixture. This peak indicates the formation of hydrogen bonds in which the hydroxyl groups
of MPT act as proton donors. In hydrogen bonded alcohols, a broad peak manifests in the
6850 – 6240 cm-1 region, which is attributed to the first overtone of the bonded hydroxyl
[31]. At 135°C, more MPT is present in the amorphous state, which means that more MPT is
free to interact with the polymer, leading to the formation of more hydrogen bonds. This
explains why the peak at 6495 cm-1 is slightly more intense in the spectra of the extrudates
produced at 135°C than at 105°C.
The NIR spectra of pure MPT contain well defined, rather narrow bands. Both extrudates still
contain the MPT peaks (Figure 8.5c), though they are broader, indicating that not all MPT
remained in its crystalline form and that some MPT became amorphous. Broad bands
indicate a lack of long-range three-dimensional order of the molecules [32]. The peaks in the
extrudate at 135°C are slightly broader and less defined than at 105°C, indicating the
presence of more amorphous MPT in the extrudate at 135°C. Since Kollidon® SR is an
amorphous polymer, this broadening does not occur in polymer peaks. In the physical
mixture, no interactions have occurred. Consequently, the peaks of MPT in the spectrum of
the physical mixture remain as sharp as the original MPT peaks.
8.3.2.2. Differential scanning calorimetry
DSC analysis, ATR FT-IR spectroscopy and Raman spectroscopy were used to confirm the
interpretation of solid state and drug-polymer interaction from the NIR spectra. Figure 8.6a
details the thermograms of the physical mixture and the extrudates of the physical mixture
extruded at 105°C and 135°C. In the extrudates, the glass transition temperature (Tg) of
Kollidon® SR decreased due to the extrusion process itself, which slightly lowers the Tg of a
polymer [33], and due to the plasticizing effect of MPT on the polymer, shown in Figure 8.6b.
For confirmation of the NIR spectral information, data from the first heating cycle were used,
whereas the data from the second heating cycle were used to confirm the plasticizing effect
of MPT on Kollidon® SR. The higher the drug loading in a physical Kollidon® SR – MPT
mixture, the lower the Tg in the second heating cycle of the DSC experiment. A lower Tg
indicates a molecular dispersion and thus miscibility of the drug in the polymer, whereas an
unchanged Tg implies separation of the polymer- and drug phase [34]. The thermogram of

CHAPTER 8 – IN-LINE NIR SPECTROSCOPY FOR THE UNDERSTANDING OF POLYMER-DRUG INTERACTION DURING PHARMACEUTICAL HOT-MELT EXTRUSION
186
the physical mixture shows a Tg at 45.4°C for Kollidon® SR (Figure 8.6a). The Tg of Kollidon®
SR in the extrudates containing 40% MPT (w/w) at 105°C and 135°C is 40.2°C and 40.7°C,
respectively. The chain mobility of the polymer has increased due to incorporation of MPT in
the polymer matrix, which results into a decrease in glass transition temperature. However,
the decrease in Tg is identical for both extrudates, suggesting that an equal level of
interactions has occurred in both extrudates, which is in contrast with the NIR
measurements, where a stronger peak shift in the extrudate produced at 135°C was
observed.
A similar shift in the endothermal melting peak of the crystalline MPT appears (Figure 8.6a).
The melting temperature of MPT in the physical mixture is measured at 120.7°C, with an
onset temperature of the endothermal peak at 113.7°C. This melting peak is also present in
both thermograms of the extrudates. However, the melting enthalpy for MPT in the
extrudate at 135°C is much smaller than the one in the extrudate at 105°C, even though both
extrudates contain 40% MPT (w/w). In the extrudate at 135°C, more MPT has transformed to
the amorphous state, leaving a smaller fraction of crystalline MPT and thus a smaller area
under the curve of the melting peak. The melt enthalpy for MPT in the physical mixture is
37.2 J/g. In the extrudate at 105°C, this enthalpy has reduced to 6.7 J/g, meaning that only
18.0% of the MPT is crystalline in this extrudate, assumed that MPT in the physical mixture is
100% crystalline. For the extrudate at 135°C, the amount of crystalline MPT is even lower,
9.1%, since the melt enthalpy is only 3.4 J/g. The melting points (Tm) for the extrudates
produced at 105°C and 135°C can be found at 115.7°C and 117.1°C, with onset melting
temperatures of the corresponding endotherms at 109.7°C and 110.0°C respectively.
Compared to the physical mixture, this shift again implies interactions between the polymer
and the drug, but no variations can be seen in interaction strength between both extrudates.
The extrudates show a second Tg, at a lower temperature than the Tg of Kollidon® SR. This is
the glass transition temperature of amorphous MPT, at 16.9°C and 17.0°C in the extrudates
processed at 105°C and 135°C, respectively. A fraction of the MPT in both mixtures has
become amorphous during processing, but has not been dispersed at a molecular level in the
polymer matrix as there are 2 Tg’s visible in the thermograms. Hence, the extrudates

CHAPTER 8 – IN-LINE NIR SPECTROSCOPY FOR THE UNDERSTANDING OF POLYMER-DRUG INTERACTION DURING PHARMACEUTICAL HOT-MELT EXTRUSION
187
Figure 8.6. a) Thermograms of the physical mixture containing 60% Kollidon® SR and 40% MPT (w/w) and the
extrudates produced at 135°C and 105°C. b) Effects of MPT loading (% w/w) on glass transition temperature
(Tg) of Kollidon® SR in physical mixtures.

CHAPTER 8 – IN-LINE NIR SPECTROSCOPY FOR THE UNDERSTANDING OF POLYMER-DRUG INTERACTION DURING PHARMACEUTICAL HOT-MELT EXTRUSION
188
consist of three phases: an amorphous polymer phase, an amorphous drug phase and a
crystalline drug phase. These extrudates are in fact solid dispersions which are partially
crystalline and partially amorphous. The free amorphous drug fraction has the tendency to
recrystallize due to the poor physical stability of formulations in the amorphous state. These
results do not completely confirm the in-line NIR observations. The NIR spectra suggest that
more and stronger interactions occur in the extrudate at 135°C than at 105°C. However, in
the DSC thermograms, no differences were obtained between both extrudates, with
exception of the difference in amount of amorphous MPT.
8.3.2.3. ATR FT-IR spectroscopy
Figures 8.7a and 8.7b represent the FT-IR spectra of metoprolol tartrate and Kollidon® SR
respectively. The FT-IR spectrum of the physical mixture of 40% metoprolol tartrate and 60%
Kollidon® SR (w/w) (Figure 8.7c) is a combination of the FT-IR spectra of the individual
components (Figs. 8.7a and 8.7b). The MPT signals are sharp and the fingerprint area, 1500
cm-1 – 600 cm-1 shows an explicit pattern. The position of the bands in the IR spectra of the
physical mixture remains unchanged compared to the corresponding bands in the spectra of
the pure components. No new bands or band shifts can be seen.
The FT-IR spectra of the mixtures containing Kollidon® SR and MPT (60:40, w/w), which were
extruded at a temperature of 105°C and 135°C (Figure 8.7d), result in a significantly changed
FT-IR pattern compared to the spectrum of the physical mixture. The FT-IR spectrum of the
extrudate produced at 105°C shows that the IR absorption bands of the polymer are more
explicitly present (Figure 8.7). This indicates an association of the API with the polymer,
forming coupled vibrations of MPT with the polymer. In the spectral region of 2800 cm-1 –
3800 cm-1, the presence of OH stretch vibrations of alcohol groups indicates that some
independent MPT molecules are still present and that not all drug molecules have interacted
with the polymer. The infrared spectrum of the extrudate produced at 135°C is similar to the
IR spectrum of the extrudate produced at 105°C (data not shown), showing no difference in
interactions between the extrudates produced at different temperatures.

CHAPTER 8 – IN-LINE NIR SPECTROSCOPY FOR THE UNDERSTANDING OF POLYMER-DRUG INTERACTION DURING PHARMACEUTICAL HOT-MELT EXTRUSION
189
Figure 8.7. ATR FT-IR spectra of a) pure MPT, b) pure Kollidon® SR.

CHAPTER 8 – IN-LINE NIR SPECTROSCOPY FOR THE UNDERSTANDING OF POLYMER-DRUG INTERACTION DURING PHARMACEUTICAL HOT-MELT EXTRUSION
190
Figure 8.7. ATR FT-IR spectra of c) the physical mixture containing 40% MPT and 60% Kollidon® SR (w/w) and d)
the extrudate of the physical mixture produced at 105°C.
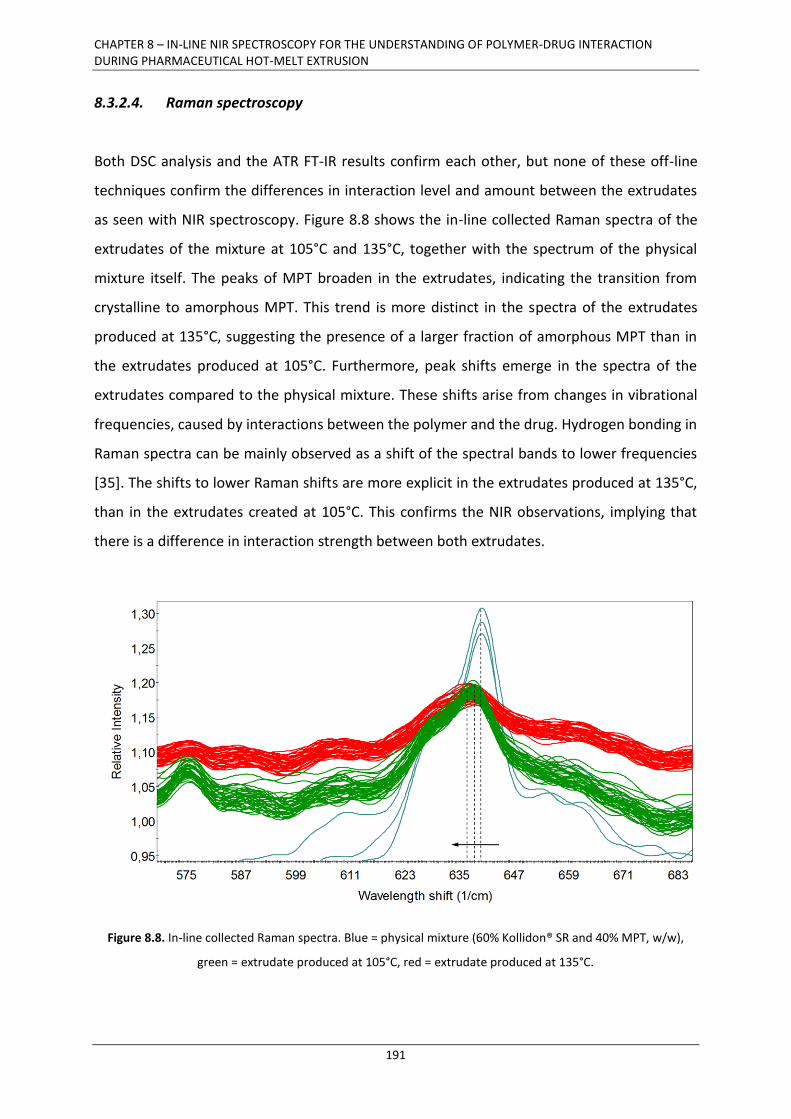
CHAPTER 8 – IN-LINE NIR SPECTROSCOPY FOR THE UNDERSTANDING OF POLYMER-DRUG INTERACTION DURING PHARMACEUTICAL HOT-MELT EXTRUSION
191
8.3.2.4. Raman spectroscopy
Both DSC analysis and the ATR FT-IR results confirm each other, but none of these off-line
techniques confirm the differences in interaction level and amount between the extrudates
as seen with NIR spectroscopy. Figure 8.8 shows the in-line collected Raman spectra of the
extrudates of the mixture at 105°C and 135°C, together with the spectrum of the physical
mixture itself. The peaks of MPT broaden in the extrudates, indicating the transition from
crystalline to amorphous MPT. This trend is more distinct in the spectra of the extrudates
produced at 135°C, suggesting the presence of a larger fraction of amorphous MPT than in
the extrudates produced at 105°C. Furthermore, peak shifts emerge in the spectra of the
extrudates compared to the physical mixture. These shifts arise from changes in vibrational
frequencies, caused by interactions between the polymer and the drug. Hydrogen bonding in
Raman spectra can be mainly observed as a shift of the spectral bands to lower frequencies
[35]. The shifts to lower Raman shifts are more explicit in the extrudates produced at 135°C,
than in the extrudates created at 105°C. This confirms the NIR observations, implying that
there is a difference in interaction strength between both extrudates.
Figure 8.8. In-line collected Raman spectra. Blue = physical mixture (60% Kollidon® SR and 40% MPT, w/w),
green = extrudate produced at 105°C, red = extrudate produced at 135°C.
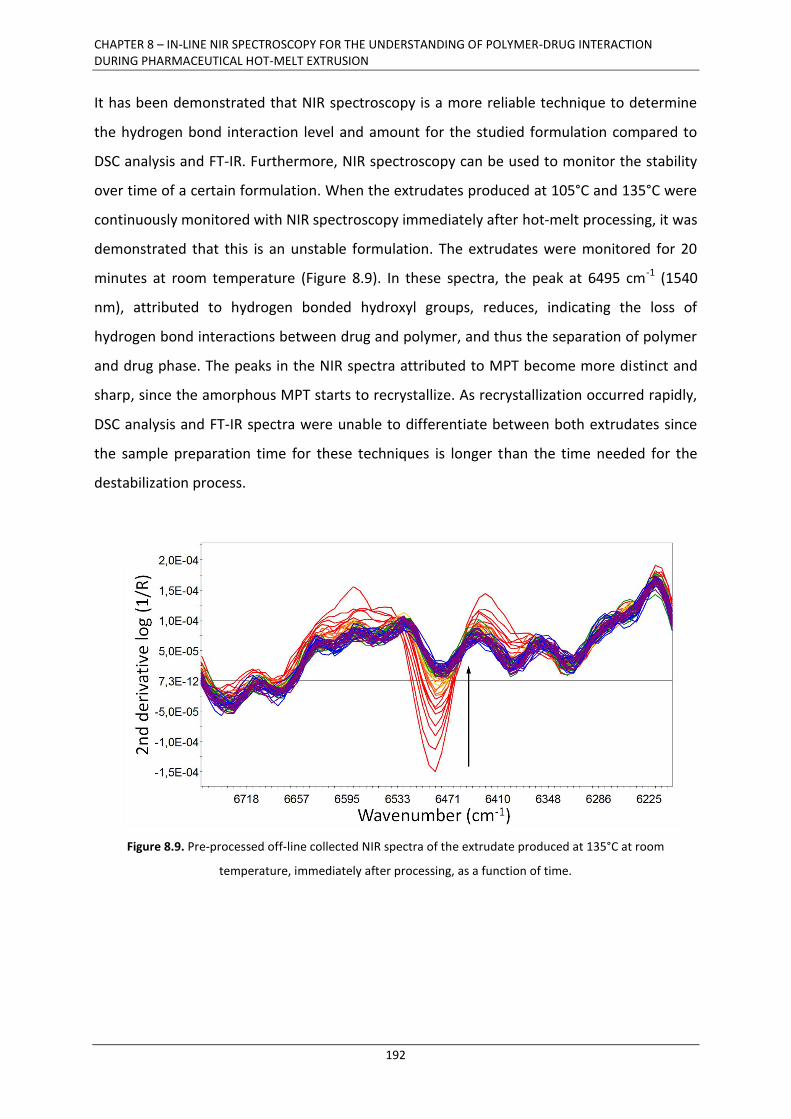
CHAPTER 8 – IN-LINE NIR SPECTROSCOPY FOR THE UNDERSTANDING OF POLYMER-DRUG INTERACTION DURING PHARMACEUTICAL HOT-MELT EXTRUSION
192
It has been demonstrated that NIR spectroscopy is a more reliable technique to determine
the hydrogen bond interaction level and amount for the studied formulation compared to
DSC analysis and FT-IR. Furthermore, NIR spectroscopy can be used to monitor the stability
over time of a certain formulation. When the extrudates produced at 105°C and 135°C were
continuously monitored with NIR spectroscopy immediately after hot-melt processing, it was
demonstrated that this is an unstable formulation. The extrudates were monitored for 20
minutes at room temperature (Figure 8.9). In these spectra, the peak at 6495 cm-1 (1540
nm), attributed to hydrogen bonded hydroxyl groups, reduces, indicating the loss of
hydrogen bond interactions between drug and polymer, and thus the separation of polymer
and drug phase. The peaks in the NIR spectra attributed to MPT become more distinct and
sharp, since the amorphous MPT starts to recrystallize. As recrystallization occurred rapidly,
DSC analysis and FT-IR spectra were unable to differentiate between both extrudates since
the sample preparation time for these techniques is longer than the time needed for the
destabilization process.
Figure 8.9. Pre-processed off-line collected NIR spectra of the extrudate produced at 135°C at room
temperature, immediately after processing, as a function of time.

CHAPTER 8 – IN-LINE NIR SPECTROSCOPY FOR THE UNDERSTANDING OF POLYMER-DRUG INTERACTION DURING PHARMACEUTICAL HOT-MELT EXTRUSION
193
8.4. CONCLUSION
In this chapter, NIR spectroscopy was evaluated to monitor the API concentration and the
polymer-drug melt behaviour during a pharmaceutical hot-melt extrusion process. With NIR
spectroscopy, it was possible to detect variations in drug concentrations. A PLS model was
developed and validated, allowing continuous drug concentration monitoring. It was
possible to predict drug concentrations with an RMSEP of 1.54% (w/w).
With respect to the polymer-drug behaviour during extrusion, in-line NIR spectroscopy was
able to detect changes in physicochemical state of the extrudates, as well as in amount and
strength of the intermolecular interactions during processing. Furthermore, the use of NIR
spectroscopy allowed the determination of the type of interactions occurring during hot-
melt extrusion. These interactions are manifested as hydrogen bonds between Kollidon® SR
and MPT molecules.
In-line Raman spectroscopy confirmed these NIR observations. The collected spectra
displayed similar peak shifts and peak broadening, demonstrating the equivalent changes in
solid state and interactions during melt extrusion. Comparison of the in-line collected NIR
spectra and the off-line DSC analysis and off-line collected ATR FT-IR spectra showed that
NIR is a more powerful process analyzer, able to differentiate between extrudates being
processed under varying conditions, whereas DSC analysis and ATR FT-IR indicated no
differences in occurring interactions between extrudates produced at different
temperatures.

CHAPTER 8 – IN-LINE NIR SPECTROSCOPY FOR THE UNDERSTANDING OF POLYMER-DRUG INTERACTION DURING PHARMACEUTICAL HOT-MELT EXTRUSION
194
8.5. REFERENCES
[1] R. Chokshi, H. Zia, Iran J Pharm Res 3 (2004) 3-16.
[2] J. Breitenbach, Eur J Pharm Biopharm 54 (2002) 107-117.
[3] M.M. Crowley, F. Zhang, M.A. Repka, S. Thumma, S.B. Upadhye, S.K. Battu, J.W.
McGinity, C. Martin, Drug Dev Ind Pharm 33 (2007) 909-926.
[4] M.A. Repka, S.K. Battu, S.B. Upadhye, S. Thumma, M.M. Crowley, F. Zhang, C. Martin,
J.W. McGinity, Drug Dev Ind Pharm 33 (2007) 1043-1057.
[5] M.A. Repka, S. Majumdar, S.K. Battu, R. Srirangam, S.B. Upadhye, Expert Opin Drug
Delivery 5 (2008) 1357-1376.
[6] T. Vasconcelos, B. Sarmento, P. Costa, Drug Discovery Today 12 (2007) 1068-1075.
[7] K. Dhirendra, S. Lewis, N. Udupa, K. Atkin, Pak J Pharm Sci 22 (2009) 234-246.
[8] B.C. Hancock, G. Zografi, J Pharm Sci 86 (1997) 1-12.
[9] L. Saerens, L. Dierickx, B. Lenain, C. Vervaet, J.P. Remon, T. De Beer, Eur J Pharm
Biopharm 77 (2011) 158-163.
[10] E.I. Keleb, A. Vermeire, C. Vervaet, J.P. Remon, Int J Pharm 273 (2004) 183-194.
[11] C. Vervaet, J.P. Remon, Chem Eng Sci 60 (2005) 3949-3957.
[12] Food and Drug Administration, Process Analytical Technology Initiative, Guidance for
Industry; PAT - A Framework for Innovative Pharmaceutical development,
Manufacturing and Quality Assurance, 2004.
[13] Y. Roggo, P. Chalus, L. Maurer, C. Lema-Martinez, A. Edmond, N. Jent, J Pharm
Biomed Anal 44 (2007) 683-700.
[14] J. Luypaert, D.S. Massart, Y. Vander Heyden, Talanta 72 (2007) 865-883.
[15] E. Räsänen, N. Sandler, J Pharm Pharmacol 59 (2007) 147-159.
[16] S.E. Barnes, E.C. Brown, M.G. Sibley, H.G.M. Edwards, I.J. Scowen, P.D. Coates, Appl
Spectrosc 59 (2005) 611-619.
[17] P.C. Coates, S.E. Barnes, M.G. Sibley, E.C. Brown, H.G.M. Edwards, I.J. Scowen,
Polymer 44 (2003) 5937-5949.
[18] T. Rohe, W. Becker, S. Kölle, N. Eisenreich, P. Eyerer, Talanta 50 (1999) 283-290.
[19] S.E. Barnes, E.C. Brown, M.G. Sibley, H.G.M. Edwards, P.D. Coates, Analyst 130 (2005)
286-292.

CHAPTER 8 – IN-LINE NIR SPECTROSCOPY FOR THE UNDERSTANDING OF POLYMER-DRUG INTERACTION DURING PHARMACEUTICAL HOT-MELT EXTRUSION
195
[20] S.E. Barnes, M.G. Sibley, H.G.M. Edwards, P.D. Coates, Trans Inst Meas Control 29
(2007) 453-465.
[21] M.G. Hansen, S. Vedula, J Appl Polym Sci 68 (1998) 859-872.
[22] D. Fischer, T. Bayer, K.J. Eichhorn, M. Otto, Fresenius’ J Anal Chem 359 (1997) 74-77.
[23] I. Alig, D. Fischer, D. Lellinger, B. Steinhoff, Macromol Symp 230 (2005) 51-58.
[24] S.E. Barnes, G.D. Smith, E.C. Brown, H.G.M. Edwards, P.D. Coates, ANTEC 3 (2004)
3813-3817.
[25] D. Fischer, K. Sahre, M. Abdelrhim, B. Voit, V.B. Sadhu, J. Pionteck, H. Komber, J.
Hutschenreuter, C R Chim 9 (2006) 1419-1424.
[26] J. Breitkreutz, Pharm Res 15 (1998) 1370–1375.
[27] L. Eriksson, E. Johansson, N. Kettaneh-Wold, J. Trygg, C. Wikström, S. Wold, Multi-
and megavariate data analysis part I: basic principles and applications, 3rd ed.
Umetrics Academy, Umeå, Sweden, 2006.
[28] D.E. Honigs, Anal Instrum 14 (1985) 1-62.
[29] A. Forster, J. Hempenstall, I. Tucker, T. Rades, Int J Pharm 226 (2001) 147–161.
[30] I. Ghebre-Sellassie, C. Martin, Pharmaceutical Extrusion Technology, 1st ed., Marcel
Dekker, New York, USA, 2003.
[31] L. Weyer, S.C. Lo, Spectra – Structure Correlations in the Near-Infrared, In: Handbook
of Vibrational Spectroscopy, 1st ed., John Wiley and Sons, Ltd., Chichester, UK, 2006.
[32] K. Izutsu, Y. Hiyama, C. Yomota, T. Kawanishi, AAPS PharmSciTech 10 (2009) 524-529.
[33] V.B. Mathot, Calorimetry and Thermal Analysis of Polymers, 1st ed., Hanser
Publishers, New York, USA, 1994.
[34] S. Qi, A. Gryczke, P. Belton, D.Q.M. Craig, Int J Pharm 354 (2008) 158-167.
[35] G. Socrates, Infrared and Raman Characteristic Group Frequencies: Tables and Charts,
3rd ed., John Wiley & Sons Ltd., Chichester, UK, 2004.

CHAPTER 8 – IN-LINE NIR SPECTROSCOPY FOR THE UNDERSTANDING OF POLYMER-DRUG INTERACTION DURING PHARMACEUTICAL HOT-MELT EXTRUSION
196

CHAPTER 9 – IN-LINE ULTRASOUND MONITORING OF DRUG CONCENTRATION DURING PHARMACEUTICAL HOT-MELT EXTRUSION
197
CHAPTER 9
IN-LINE ULTRASOUND MONITORING OF
DRUG CONCENTRATION DURING
PHARMACEUTICAL HOT-MELT
EXTRUSION

CHAPTER 9 – IN-LINE ULTRASOUND MONITORING OF DRUG CONCENTRATION DURING PHARMACEUTICAL HOT-MELT EXTRUSION
198
ABSTRACT
The aim of this chapter is to evaluate the suitability of ultrasonic techniques as PAT tools for
the in-line monitoring of drug concentration during a pharmaceutical hot-melt extrusion
process.
Physical mixtures of metoprolol tartrate (MPT) and Eudragit® RS PO were extruded with a
rotational screw speed of 175 rpm, a feed rate of 0.75 kg/h and at a temperature of 110°C.
Ultrasonic transit time and peak height were measured by the implementation of two
ultrasound transducers in a die adapter. Die pressure and extrusion torque were also
monitored during processing.
A PLS model, regressing the MPT concentrations versus the in-line measured ultrasonic
transit time and peak height, was created to allow MPT concentration monitoring. A second
set of experiments was performed to validate this model, resulting in a root mean square
error of prediction (RMSEP) of 1.47% (w/w). When regressing the MPT content versus the
monitored torque and die pressure, a similar RMSEP was obtained (1.48% (w/w)). When
combining all factors (torque, die pressure and ultrasound data), an RMSEP prediction error
of 0.94 % (w/w) was obtained. Ultrasound monitoring techniques are potential tools for the
in-line determination of the drug content in pharmaceutical hot-melt extrusion processes.

CHAPTER 9 – IN-LINE ULTRASOUND MONITORING OF DRUG CONCENTRATION DURING PHARMACEUTICAL HOT-MELT EXTRUSION
199
CHAPTER 9
IN-LINE ULTRASOUND MONITORING OF
DRUG CONCENTRATION DURING
PHARMACEUTICAL HOT-MELT EXTRUSION
9.1. INTRODUCTION
In addition to optical spectroscopy, ultrasonic monitoring is one of the potential techniques
for in-line monitoring and control during polymer extrusion [1]. It is a fast, robust, non-
invasive and non-destructive technique which can easily be implemented in the extrusion
equipment. Ultrasonic vibrations have a frequency higher than that detectable by the human
ear, typically above 20 kHz. This technique has been used in polymer processing to monitor
melt temperature and pressure, changes in material type, effects of process settings on
rheological characteristics of the melt and filler concentration [2]. Ultrasound monitoring has
also been applied to monitor residence time distributions in the extrusion die [3, 4] and at
various melting, mixing and pumping zones in the barrel [3]. The melt density has been
assessed using ultrasound monitoring in the extrusion die [5], and occurring melting
phenomena throughout the barrel have been evaluated [6].
The results in this chapter are used to evaluate whether ultrasonic techniques, using
longitudinal waves, can be applied as PAT tools for the in-line monitoring of drug
concentrations in a pharmaceutical hot-melt extrusion process. During monitoring with the
ultrasound technique, the velocity and attenuation of an ultrasound wave traversing a
polymer melt during extrusion can be measured [7]. These values are related to the melt
viscosity and elastic moduli, which are associated with the drug concentration in the
polymer melt. In longitudinal waves, the oscillations occur in the direction of wave

CHAPTER 9 – IN-LINE ULTRASOUND MONITORING OF DRUG CONCENTRATION DURING PHARMACEUTICAL HOT-MELT EXTRUSION
200
propagation. The velocity of ultrasound waves is related to the type of waveform
(longitudinal or shear), the elastic moduli and the density of the polymer melt. For
longitudinal waves, the velocity is calculated by Eq. (9.1):
(9.1)
Where Cl is the velocity of the longitudinal wave, E is Young’s modulus of elasticity (a
proportionality constant between uniaxial stress and strain), ν is Poisson’s ratio (the ratio of
radial strain to axial strain) and ρ is the density of the material. When an ultrasound wave
travels through a melt, its intensity (peak height) will decrease with distance. This weakening
is caused by attenuation, which includes absorption, reflection and scattering of the
sound. Absorption is the main factor contributing to the attenuation of the signal. Ultrasonic
velocity and attenuation vary with temperature and pressure, related to changes in elastic
moduli and density with temperature and pressure. When temperature and pressure
influences are constant, a change in velocity or attenuation indicates a change in extruded
material, since the distance between transducers remains constant, and can be correlated to
a variation in drug concentration in the melt.

CHAPTER 9 – IN-LINE ULTRASOUND MONITORING OF DRUG CONCENTRATION DURING PHARMACEUTICAL HOT-MELT EXTRUSION
201
9.2. MATERIALS AND METHODS
9.2.1. Materials
Metoprolol tartrate (MPT) (Esteve Quimica, Barcelona, Spain) was chosen as model drug. It
has a melting temperature (Tm) of 123°C. Eudragit® RS PO (Evonik, Germany) was used as
polymer to form the matrix systems. Eudragit® RS PO is an amorphous copolymer of acrylic
and methacrylic acid esters with a low content of quaternary ammonium groups, which are
present as salts. It has a glass transition temperature (Tg) of approximately 65°C. The
solubility parameters of both components are 23.6 MPa½ and 19.7 MPa½ for MPT and
Eudragit® RS PO, respectively, and were calculated with SPWin, version 2.11 [8].
Components with similar solubility parameters are likely to be miscible (t < 7 MPa½) and
components with t > 10 MPa½ are expected to be immiscible [9]. As the difference in total
solubility parameter is less than 4 MPa½, a good miscibility and possible formation of a solid
solution could be expected.
9.2.2. Hot-melt extrusion
Hot-melt extrusion was carried out with a Pharmalab co-rotating twin-screw extruder
(Thermo Scientific, UK) with a screw diameter of 16 mm and length-to-diameter ratio of
40:1. The temperature of each segment of the extruder and of the die can be controlled
separately. The hot-melt extruder was equipped with a gravimetric twin-screw feeder
(Brabender® Technologie, Germany). For the development of a calibration model allowing
in-line API quantification, different polymer-drug mixtures containing 10%, 20%, 30% and
40% (w/w) MPT in Eudragit® RS PO were extruded. Prior to hot-melt extrusion, the polymer
and drug were blended in a Turbula mixer. Each mixture was extruded with a throughput of
0.75 kg/h and a screw speed of 150 rpm. The barrel temperature profile was set at 20-30-40-
70-80-110-110-110-110-110°C (from hopper to die) for all mixtures. During extrusion, the
torque (% of motor load), die pressure (bar) and melt temperature (°C) in the die were
continuously monitored and logged every second.

CHAPTER 9 – IN-LINE ULTRASOUND MONITORING OF DRUG CONCENTRATION DURING PHARMACEUTICAL HOT-MELT EXTRUSION
202
9.2.3. Ultrasound equipment
Ultrasonic transit time (µs, used to calculate ultrasonic velocity) and peak height (V, related
to attenuation and reflection) measurements were obtained from the melt using
instrumentation designed at the University of Bradford (Figure 9.1), containing an ultrasonic
pulser-receiver (Panametrics 5900), a sampling digital oscilloscope (LeCroy 9350AM) and
automated process monitoring and analysis software. Data from the pulser-receiver were
sampled using the oscilloscope at a frequency of 1 GHz and converted to form an array of
voltage values representing the magnitude of the received sound wave, and time values
calculated from the known trigger time and sampling frequency. The received wave was
analysed using custom software employing a peak detection algorithm, to provide a measure
of transit time and peak height of the first received echo. The method of operation was
therefore ‘through transmission’, and the measured transit time is a total value through
both the transducers and the melt. Data were acquired every second from the melt using
custom-designed high temperature 3.5 MHz narrow band longitudinal wave transducers
mounted directly opposite one another into the extrusion die adapter (Figure 9.2).
Figure 9.1. Experimental setup with instrumentation designed at the University of Bradford.

CHAPTER 9 – IN-LINE ULTRASOUND MONITORING OF DRUG CONCENTRATION DURING PHARMACEUTICAL HOT-MELT EXTRUSION
203
Figure 9.2. Experimental setup with longitudinal wave transducers mounted directly opposite one another in
the extrusion die adapter. 1) Feeding unit, 2) extrusion barrel, 3) custom made die adapter, 4) ultrasound
transducers.
9.2.4. Data analysis
Data analysis was performed using SIMCA-P+ (version 12.0.1.0, Umetrics, Umeå, Sweden).
The in-line collected ultrasound data (transit time and peak height) and/or the logged torque
and die pressure measured during extrusion were used for the development of three partial
least squares (PLS) regression models, which were developed by regressing the MPT-
concentrations (Y) versus the corresponding in-line collected ultrasound data and/or
extrusion process parameters (X). The first predictive model linked the logged extrusion
parameters (torque and die pressure) to the MPT concentration, in the second model the
prediction was based on the ultrasound parameters (transit time and peak height) and a
third model combined both extrusion and ultrasound parameters. The predictive
performance of these PLS models was validated using data gathered during new extrusion
experiments of each polymer-drug mixture, with identical process settings.

CHAPTER 9 – IN-LINE ULTRASOUND MONITORING OF DRUG CONCENTRATION DURING PHARMACEUTICAL HOT-MELT EXTRUSION
204
9.3. RESULTS
Physical mixtures containing 10, 20, 30 and 40% (w/w) MPT in Eudragit® RS PO were
extruded. The concentration variations were reflected in the monitored extrusion
parameters, die pressure and torque, and in the ultrasound parameters, ultrasonic transit
time and peak height (Table 9.1).
Table 9.1. Average process parameters and ultrasound parameters for each MPT
concentration level.
MPT
(% w/w)
Average die
pressure
(bar)
Average
torque
(% motor load)
Average melt
temperature
(°C)
Average
transit time
(µs)
Average peak
height (V)
10 10.05 ± 71.78 ± 1.77 116 ± 0.24 39.202 ± 0.009 0.007 ± 0.001
20 6.15 ± 59.80 ± 1.20 113 ± 0.37 39.147 ± 0.011 0.009 ± 0.001
30 2.50 ± 48.05 ± 0.89 110 ± 0.51 39.091 ± 0.005 0.013 ± 0.002
40 1.25 ± 38.80 ± 2.78 108 ± 0.44 39.026 ± 0.005 0.016 ± 0.002
First of all, the data generated from the extrusion process were used to monitor and predict
the fraction of MPT in the melt. A PLS model was developed, regressing the in-line measured
torque and die pressure versus the MPT concentration. A clustering according to the MPT
concentration was seen along the first principal component (Figure 9.3a), which captured
97.4% of all variation in the dataset. The validation of this predictive model with
measurements performed during new extrusion experiments resulted in a root mean square
error of prediction (RMSEP) of 1.48% (w/w) MPT (Table 9.2). Die pressure and torque
decreased with increasing drug concentration, since MPT has a plasticizing effect on the
polymer [10], making it easier to process when the MPT concentration increases.
A second PLS model was developed using the ultrasound parameters transit time and peak
height as X-matrix, and the MPT concentration as Y-matrix. The first principal component,
comprising 96.0% of the variation from the dataset, was related to MPT concentration
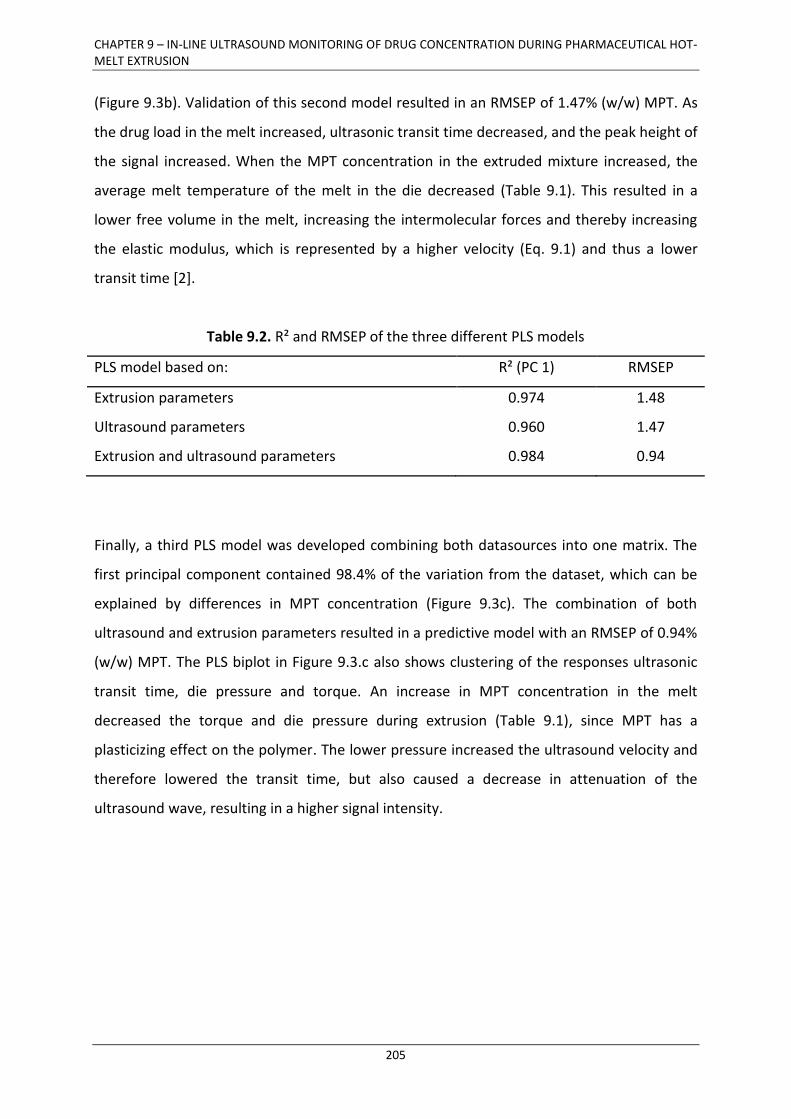
CHAPTER 9 – IN-LINE ULTRASOUND MONITORING OF DRUG CONCENTRATION DURING PHARMACEUTICAL HOT-MELT EXTRUSION
205
(Figure 9.3b). Validation of this second model resulted in an RMSEP of 1.47% (w/w) MPT. As
the drug load in the melt increased, ultrasonic transit time decreased, and the peak height of
the signal increased. When the MPT concentration in the extruded mixture increased, the
average melt temperature of the melt in the die decreased (Table 9.1). This resulted in a
lower free volume in the melt, increasing the intermolecular forces and thereby increasing
the elastic modulus, which is represented by a higher velocity (Eq. 9.1) and thus a lower
transit time [2].
Table 9.2. R² and RMSEP of the three different PLS models
PLS model based on: R² (PC 1) RMSEP
Extrusion parameters 0.974 1.48
Ultrasound parameters 0.960 1.47
Extrusion and ultrasound parameters 0.984 0.94
Finally, a third PLS model was developed combining both datasources into one matrix. The
first principal component contained 98.4% of the variation from the dataset, which can be
explained by differences in MPT concentration (Figure 9.3c). The combination of both
ultrasound and extrusion parameters resulted in a predictive model with an RMSEP of 0.94%
(w/w) MPT. The PLS biplot in Figure 9.3.c also shows clustering of the responses ultrasonic
transit time, die pressure and torque. An increase in MPT concentration in the melt
decreased the torque and die pressure during extrusion (Table 9.1), since MPT has a
plasticizing effect on the polymer. The lower pressure increased the ultrasound velocity and
therefore lowered the transit time, but also caused a decrease in attenuation of the
ultrasound wave, resulting in a higher signal intensity.

CHAPTER 9 – IN-LINE ULTRASOUND MONITORING OF DRUG CONCENTRATION DURING PHARMACEUTICAL HOT-MELT EXTRUSION
206
Figure 9.3. PLS biplots of the models developed with a) only extrusion parameters (torque and die pressure); b)
only ultrasound parameters (transit time and peak height); c) both extrusion and ultrasound parameters.

CHAPTER 9 – IN-LINE ULTRASOUND MONITORING OF DRUG CONCENTRATION DURING PHARMACEUTICAL HOT-MELT EXTRUSION
207
9.4. CONCLUSION
Ultrasound monitoring techniques are potential tools for the in-line determination of the
drug content in pharmaceutical hot-melt extrusion processes. The results in chapter 9 show
that the use of ultrasonic techniques improved the predictive performance of the calibration
model when comparing it to the model based only on die pressure and torque
measurements.
The velocity of longitudinal waves through the melt can provide useful information on the
elastic properties of the melt and on its density. Additionally, the attenuation also supplies
information related to the concentration of the drug in the mixture during extrusion.
However, both parameters are strongly influenced by temperature and pressure changes,
and therefore require an extensive calibration before this technique can be applied as a
monitoring tool for melt density and elasticity.

CHAPTER 9 – IN-LINE ULTRASOUND MONITORING OF DRUG CONCENTRATION DURING PHARMACEUTICAL HOT-MELT EXTRUSION
208
9.5. REFERENCES
[1] I. Alig, B. Steinhoff, D. Lellinger, Meas Sci Technol 21 (2010) 1-19.
[2] E.C. Brown, Ultrasonic monitoring of polymer melt extrusion, University of Bradford,
Bradford, UK, 1998.
[3] Z. Sun, C.K. Jent, C.K. Shih, D.A. Denelsbeck, Eng Sci 43 (2003) 102-111.
[4] S.M. Lee, J.C. Park, S.M. Lee, Y.J. Ahn, J.W. Lee, Korea-Aust Rheol J 17 (2005) 87-95.
[5] N.H. Abu-Zahra, Int J Adv Manuf Tech 24 (2004) 661-666.
[6] D.B. Wang, K. Min, Polym Eng Sci 45 (2005) 998-1010.
[7] R. Kažys, R. Rekuvienė, Ultragarsas 66 (2011) 20-25.
[8] J. Breitkreutz, Pharm Res 15 (1998) 1370-1375.
[9] A. Forster, J. Hempenstall, I. Tucker, T. Rades, Int J Pharm 226 (2001) 147–161.
[10] L. Saerens, L. Dierickx, B. Lenain, C. Vervaet, J.P. Remon, T. De Beer, Eur J Pharm
Biopharm 77 (2011) 158-163.

FUTURE PERSPECTIVES
209
FUTURE PERSPECTIVES

FUTURE PERSPECTIVES
210

FUTURE PERSPECTIVES
211
FUTURE PERSPECTIVES
The results in this thesis demonstrate that the implementation of both Raman and NIR
spectroscopy in pharmaceutical hot-melt extrusion processes allows the monitoring of
drug/polymer concentration and solid state, and the visualization of solid state and
interactions throughout the entire extrusion process.
The implementation of process analytical techniques in pharmaceutical hot-melt extrusion
serves two purposes. The results described in this thesis regarding monitoring of solid state
and interactions contribute to the first purpose of the implementation of process analytical
tools in hot-melt extrusion, i.e. the improvement of process understanding by monitoring
and visualizing the material behaviour. The second objective, monitoring and analyzing
critical product and process parameters for process control and guaranteed end product
quality, has been addressed during the development and validation of predictive models for
API quantification. These models are created using data collected from a 12 or 16 mm twin-
screw extruder. Both equipment types are lab scale extruders. The applicability of these
monitoring models in larger, production scale extruders needs to be evaluated. To provide
actual process control, the model responses from several implemented process analytical
techniques, combined with the data collected from the standard sensors implemented in
extrusion (temperature, pressure, torque) should trigger control loops when exceeding
preset limits, to divert material with a inferior quality to waste (feed-forward control) and to
allow the process to restabilize and produce extrudates with the desired quality by altering
the process settings (feed-back control).
The spectroscopic process analyzers examined in this work enable the quantification of the
different components in the extrudates and allow monitoring of solid state and interactions.
These formulation characteristics help in defining the quality of the extrudates, but these are
not the only (critical) quality attributes which need to be assessed. The application of
spectroscopic techniques in extrusion can serve other purposes as well. Using spectroscopic

FUTURE PERSPECTIVES
212
techniques, the detection of degradation products and reactions, the quantification and the
location of formation of these products along the screws can be determined.
An additional interesting application of spectroscopic tools, since hot-melt extruded
products often show modified or sustained release, is to link the drug release profiles
obtained in vitro (during dissolution experiments) or in vivo to the in-line obtained process
information. Since spectroscopic tools can provide information on the type and strength of
interactions between drugs and polymers, it might be possible to correlate the in-line
obtained spectroscopic data with the drug release profiles. Raman and NIR spectroscopy are
often complementary analytical tools, and depending on the formulation used for extrusion,
one technique will be more suitable than the other. Raman spectra can be strongly
influenced by fluorescence and colour in the formulation, and NIR spectra, particularly in
reflectance mode, contain a large amount of noise when monitoring a transparent
formulation. Both tools can be applied in the reflectance or transmission mode, by using
custom made die adapters, dependent on the properties of the formulation which needs to
be monitored and the extrusion equipment. The transmission mode can be used to monitor
across the entire melt channel, whereas the reflection mode will only monitor a fraction of
the melt channel depth.
Another important (critical) characteristic of the melt is its viscosity. This is particularly
relevant for further downstream processing. The melt requires a certain viscosity when
being further processed to form pellets, or when injection moulding is applied. In polymer
extrusion, the use of on-line rheometers (capillary, oscillatory, rotational and extensional)
has been illustrated. By implementing these tools, the melt viscosity, shear stress, melt flow
index, linear viscoelastic behaviour and melt strength can be evaluated. So far, these
rheometers only have an on-line application, which requires elaborate adaptations to the
extrusion equipment. On-line rheometers can be implemented immediately before or after
the extrusion die, to assess the final rheological characteristics of the melt, but they can also
be used throughout the entire barrel to determine the influence of certain kneading zones in
the screw configuration on the rheological features of the melt, and to assess the effect of
varying drug concentrations on these rheological parameters.

FUTURE PERSPECTIVES
213
As discussed in Chapter 6, both spectroscopic and rheometric in-process measurements can
provide information concerning the effect of different types of screw elements on the
extruded formulation. By implementing these process analytical techniques along the
extrusion barrel, the optimal screw configuration (i.e. location and number of kneading and
pressure building zones) for extrusion of a certain formulation can be determined. This
allows the development of the most energy-efficient screw configuration, providing both
dispersive and distributive mixing with an optimal mechanical energy input.
The extrusion process on its own is only one step in a (continuous) manufacturing line.
Monitoring of critical process and formulation parameters is required along the entire
production process. Initially, the powder or premix feeding and liquid addition (upstream
processes) need to be controlled adequately. Secondly, several downstream processes are
available for further cooling, cutting, shaping and collection of the hot-melt extruded
strands, and they each have a significant impact on the quality of the end product. Certain
downstream process applications require the melt to be cooled. The effect of the
(controlled) cooling on the quality of the extruded strands needs to be evaluated. Cooling
might induce recrystallization of an amorphous drug, thereby altering its bioavailability. In
addition, it also changes the viscosity of the extrudates. Other downstream equipment adds
(mechanical) energy to the melt, thereby increasing its temperature, which also translates
into changes in solid state and viscosity. The influence of all of these effects on the end
product quality needs to be assessed, to allow production according to the ‘Quality by
Design’ principle and to enable process control. Not only will this result in an improved
product quality, but it will also enhance the process understanding and allow process
optimization.

FUTURE PERSPECTIVES
214

SUMMARY AND GENERAL CONCLUSIONS
215
SUMMARY AND GENERAL CONCLUSIONS

SUMMARY AND GENERAL CONCLUSIONS
216

SUMMARY AND GENERAL CONCLUSIONS
217
SUMMARY AND GENERAL CONCLUSIONS
Traditionally, extruders are equipped with standard, univariate process monitoring sensors
such as probes monitoring temperature and pressure, which are used to control the hot-
melt extrusion process in an indirect manner by correlating the extrudate properties to
these measurements. The data generated by these sensors do not suffice to assess the
critical quality attributes of the extrudates, will not account for process-induced variations in
material properties, cannot guarantee stable processing and are not able to ensure the
production of an end product with predefined and consistent quality characteristics.
Therefore, the application of spectroscopic process monitoring tools, in particular Raman
spectroscopy and NIR spectroscopy, was evaluated in this thesis, to monitor, visualize and
predict the drug concentration and the material behaviour of polymer-drug mixtures during
hot-melt extrusion, and to improve overall process understanding.
In Chapter 2, the principles of hot-melt extrusion and its advantages and possible
shortcomings as a non-conventional pharmaceutical manufacturing technique are discussed.
Twin-screw extrusion is preferred over single-screw extrusion, since it provides a better
mixing capability and allows the dispersion of an API into the polymer. Traditional
monitoring and control of hot-melt extrusion processes includes the determination of barrel
and product temperature, the measurement of pressure in the extrusion die, the continuous
logging of torque values and the monitoring of screw speed and throughput.
The pharmaceutical industry is encouraged by several regulatory authorities to implement
more advanced and innovative process analytical techniques into manufacturing processes
to improve both product quality and process performance. An overview and critical
evaluation of more advanced process analytical techniques (compared to the traditional
monitoring sensors) for monitoring and visualizing material behaviour during processing and
improving the process understanding of hot-melt extrusion is provided in Chapter 3. Various
sensors such as spectroscopic tools, ultrasonic techniques and rheological applications are

SUMMARY AND GENERAL CONCLUSIONS
218
available for observation of critical process and product parameters during extrusion. An
appropriate combination of the different process analytical techniques evaluated in this
chapter will lead to a thorough process understanding and will allow monitoring of the
critical process and product parameters. This monitoring will eventually lead to optimization
of the HME process and the formulations, and provide the possibility for improved process
control in routine manufacturing.
In Chapter 4, the feasibility of Raman spectroscopy as a process analytical tool for the in-line
monitoring and prediction of the API concentration and for the monitoring of
physicochemical state of the extrudates and possible interactions between polymers and
drugs during hot-melt extrusion was assessed. A Raman probe was implemented in the die
of a twin-screw extruder, and spectra were collected every 5 seconds during extrusion. For
the in-line API quantification, a PLS model regressing the collected Raman spectra versus the
drug concentrations was developed. The predictive ability of this model was evaluated by
the correlation between the predicted and real drug concentration values (R² = 0.997) and
the prediction error for new measurements (RMSEP = 0.59% w/w), which both
demonstrated the suitability of Raman spectroscopy for the prediction of the API
concentration during hot-melt extrusion. A comparison between the in-line collected Raman
spectra and the off-line obtained DSC thermograms and ATR FT-IR spectra of the extrudate
samples collected during processing demonstrated that information concerning the
physicochemical state of a polymer-drug melt can be obtained from the Raman spectra.
Broadening of peaks in the spectra indicated that the drug was present in its amorphous
state, and the manifestation of peak shifts for both peaks corresponding to the API and to
the polymer demonstrated that interactions between both components occurred during
hot-melt extrusion.
Once the suitability of Raman spectroscopy to monitor the API concentration during hot-
melt extrusion was evaluated, an advanced validation strategy for the Raman spectroscopic
drug quantification method was applied in Chapter 5. Different models for the prediction of
the API content were compared, based on the use of single spectra or averaged spectra, and
using partial least squares regression or multivariate curve resolution. The predictive models
were developed by extruding and monitoring five calibration mixtures, each with a different

SUMMARY AND GENERAL CONCLUSIONS
219
API concentration and were validated using five other validation mixtures, each extruded on
three different days by two different operators. For the validation of the different models,
the accuracy profiles of the analytical procedures were calculated, based on the β-
expectation tolerance intervals and the concept of total error (bias + standard deviation). For
each of the validated API concentrations, the β-expectation tolerance intervals were
calculated. These intervals allowed the determination of the proportion of future
measurements (set at 95%) that will be found within preset acceptance limits, which were
set at 10% of the relative bias. The model developed using averaged spectra and multivariate
curve resolution was the only model which guaranteed that 95% of future concentration
measurements will not deviate more than 10% from the reference value. The model showed
good precision, trueness, linearity, specificity and accuracy over the applied concentration
range. The robustness of the developed predictive model was evaluated via an experimental
design varying throughput, screw speed and barrel temperature. No significant influence of
any of these process settings on the predicted concentration values was found. The
uncertainty of the measurements was assessed via the uncertainty of bias and the expanded
uncertainty at each concentration level. The uncertainty measurements for this model
showed that the unknown true value can be found at a maximum of ± 7.00% around the
measured result, with a confidence level of 95%.
In Chapter 6, the Raman probe was implemented in each section of the extrusion barrel, to
enhance the understanding of material behaviour during hot-melt extrusion. The influence
of variations in drug concentration, barrel temperature and screw speed on the polymer-
drug solid state and interactions was examined. Since hot-melt extrusion is a starve fed
process, the barrel will not be completely filled with material in every segment. This causes a
background signal in the in-line collected Raman spectra, which could not be corrected for.
Principal component analysis was applied to separate this source of variation in the spectra
from the relevant information. When a formulation with a high drug load was extruded,
melting of the drug occurred in the first kneading zone, located between barrel sections 2
and 3. This was the same for a low drug load. However, an additional spectral difference was
found when the melt passed through a third kneading zone, where the drug dissolved into
the polymer and a solid glassy suspension was produced due to the high shear forces applied
on the mixture. In the Raman spectra, this was indicated by the presence of peak shifts, and

SUMMARY AND GENERAL CONCLUSIONS
220
it was confirmed by FT-IR spectra collected from samples gathered from the extrusion barrel.
When extruding mixtures with a low drug load, increasing the processing temperature did
not influence the solid state of the final product or the location in the barrel where the final
product is attained. At a high drug load however, the solid state of the end product is
reached further down the barrel when the temperature is decreased. Doubling the screw
speed when processing a formulation with a low drug load did not affect the solid state of
the product or the location in the barrel where it is obtained. In contrast, at a high drug load,
the section where the final product is produced, is situated earlier in the barrel when
applying a higher rotational speed. The performed in-barrel measurements provide real-time
information about polymer/drug behaviour throughout the barrel, hence allowing the
optimization of process settings and barrel and screw design required to obtain extrudates
with predefined, constant solid state characteristics.
The aim of the experimental work discussed in Chapter 7, was to classify extrudates in-line
according to their solid state. A Raman probe was implemented in the die head of an
extruder, and collected spectra every 20 seconds. The influence of variations in drug
concentration, changes in barrel temperature and three different screw configurations on
the physicochemical state of the extrudates was assessed. Soft independent modelling of
class analogy was performed to develop a model which allowed distinction between glassy
solid solutions and crystalline dispersions of a poorly soluble API in a polymer, based on the
in-line collected Raman spectra. Off-line analysis with DSC and XRD appeared not to be
sensitive enough to detect small fractions of crystalline drug, which can later on induce
recrystallization of all of the API during storage. These small crystalline fractions were
detected in the Raman spectra, where the solid state characterization was based on the
appearance of peak broadening and peak shifts. Modifications in screw configuration did not
affect the solid state of the final products.
The influence of die pressure on the Raman spectra was also examined in Chapter 7. The
applied drug concentration, processing temperature and feeder performance all influence
the die pressure, and this effect can be found in the background signal of the Raman spectra
before pre-processing. Disturbances in the feeding process can thus be observed and
identified in the Raman measurements.

SUMMARY AND GENERAL CONCLUSIONS
221
In Chapter 8, the suitability of NIR spectroscopy for the in-line determination of the drug
concentration, the polymer-drug solid state and molecular interactions during extrusion was
evaluated. The NIR probe was mounted in the extrusion die, and NIR spectra of the melt
were collected every 30 seconds. A PLS model was developed for in-line API concentration
monitoring. A good correlation between predicted and real drug concentrations was found
(R² = 0.97), and the prediction error for new measurements was 1.54% (w/w). The in-line
collected NIR spectra showed peak broadening during extrusion, caused by the presence of
amorphous API, and a new peak was found, which was not present in the spectra from the
physical mixtures, indicating the formation of hydrogen bonds during processing.
In Chapter 9, the aim was to evaluate the suitability of ultrasonic techniques as process
analytical tools for the in-line monitoring of the API concentration. Ultrasonic transit time
and peak height were measured by the implementation of two ultrasound transducers in a
custom made die adapter. First, a PLS model for quantification was developed based solely
on the monitored die pressure and torque. It was demonstrated that adding the transit time
and peak height monitored using ultrasonic techniques improved the predictive ability of
this PLS model.

SUMMARY AND GENERAL CONCLUSIONS
222

SAMENVATTING EN ALGEMEEN BESLUIT
223
SAMENVATTING EN ALGEMEEN BESLUIT

SAMENVATTING EN ALGEMEEN BESLUIT
224

SAMENVATTING EN ALGEMEEN BESLUIT
225
SAMENVATTING EN ALGEMEEN BESLUIT
De procescontrole bij hot-melt extrusie wordt traditioneel uitgevoerd met behulp van
standaard technieken die univariate data opleveren, zoals probes die de temperatuur en
druk meten. Deze worden gebruikt om het extrusieproces op indirecte wijze onder controle
te houden, door de geregistreerde parameters te correleren met bepaalde eigenschappen
van het extrudaat. De metingen die door deze sensoren uitgevoerd worden, volstaan niet
om de kwaliteit van extrudaten te bepalen, meten geen variaties in materiaaleigenschappen
die veroorzaakt worden door veranderingen in het extrusieproces, kunnen geen stabiel
proces garanderen en zijn ontoereikend om een eindproduct met een vooropgestelde en
onveranderlijke kwaliteit af te leveren. Daarom werd in deze thesis het gebruik van
spectroscopische technieken onderzocht, voornamelijk de toepassingen van Raman
spectroscopie en nabije-infraroodspectroscopie, om de geneesmiddelconcentratie en het
gedrag van materialen tijdens extrusie te monitoren, te visualiseren en te voorspellen, en
om de algemene kennis van het extrusieproces te verbeteren.
In Hoofdstuk 2 worden de principes van hot-melt extrusie, samen met de voordelen en
eventuele tekortkomingen van de techniek als farmaceutisch productieproces beschreven.
Dubbele-schroef extrusie wordt verkozen boven enkele-schroef extrusie, door de betere
mengeigenschappen die het dispergeren van het geneesmiddel in het polymeer mogelijk
maken. Het monitoren en controleren van het extrusieproces gaat gebruikelijk gepaard met
het bepalen van de temperatuur van het mengsel en de schroefkamer, het meten van de
druk in de matrijs, het continu monitoren van de torsie, de schroefsnelheid en de snelheid
waarmee het fysisch mengsel gevoed wordt.
De regelgevende instanties moedigen de farmaceutische industrie aan om geavanceerde en
innovatieve proces analytische technieken te gebruiken in productieprocessen om de
kwaliteit van de ontwikkelde producten en de prestaties van de processen te perfectioneren.
Hoofdstuk 3 geeft een overzicht en kritische evaluatie van meer geavanceerde en

SAMENVATTING EN ALGEMEEN BESLUIT
226
efficiëntere technieken (in vergelijking met de traditionele sensoren) die kunnen gebruikt
worden om het gedrag van materialen tijdens extrusie te monitoren en om het
extrusieproces beter te begrijpen. Een gevarieerd aanbod aan sensoren, zoals
spectroscopische technieken, ultrasone technieken en reologische toepassingen zijn
voorhanden om kritische proces- en productparameters te observeren tijdens extrusie. Een
geschikte combinatie van de technieken die in dit hoofdstuk beschreven worden, zal leiden
tot een verbeterd inzicht in het extrusieproces en laat het determineren van kritische
proces- en productparameters toe. Dit zal uiteindelijk de optimalisatie van het
extrusieproces en de geëxtrudeerde formulaties bevorderen, en maakt een verfijnde
procescontrole in routineproductie mogelijk.
In Hoofdstuk 4 werd de toepasbaarheid van Raman spectroscopie als proces analytische
techniek geëvalueerd voor het in-line monitoren en voorspellen van de
geneesmiddelconcentratie en voor het monitoren van de fysicochemische eigenschappen
(amorficiteit, kristalliniteit, de manier waarop het geneesmiddel gedispergeerd is in de
matrix) van de extrudaten en eventuele interacties tussen polymeren en geneesmiddelen
tijdens extrusie. Een Raman probe werd ingebouwd in de matrijs van een dubbele-schroef
extruder, en Raman spectra van het mengsel tijdens extrusie werden elke 5 seconden
opgemeten. Voor de in-line kwantificatie werd een PLS model ontwikkeld. Het voorspellend
vermogen van dit model werd geëvalueerd aan de hand van de correlatie tussen de
voorspelde en ‘echte’ geneesmiddelconcentraties (R² = 0.997) en aan de hand van de
predictiefout voor nieuwe metingen (RMSEP = 0.59% w/w), die beiden de geschiktheid van
Raman spectroscopie voor concentratiewaarnemingen tijdens extrusie bevestigen. Een
vergelijking tussen in-line opgenomen Raman spectra en off-line resultaten van de DSC- en
XRD-analyses toont aan dat de Raman spectra informatie bevatten over de fysicochemische
eigenschappen van een polymeer-geneesmiddel mengsel tijdens extrusie. Het verbreden van
pieken in het spectrum wijst op de overgang van het geneesmiddel van een kristallijne naar
een amorfe toestand, en de aanwezigheid van piekverschuivingen voor zowel pieken eigen
aan het geneesmiddel als aan het polymeer duidt op het ontstaan van interacties tussen
beide componenten in het mengsel tijdens extrusie.

SAMENVATTING EN ALGEMEEN BESLUIT
227
Nadat aangetoond werd dat Raman spectroscopie kan gebruikt worden om de concentratie
van het geneesmiddel te bepalen tijdens extrusie, werd een verfijnde validatiestrategie
toegepast op de kwantificatiemethode gebaseerd op Raman spectroscopie in Hoofdstuk 5.
Verschillende voorspellende modellen, opgebouwd uit de enkelvoudige of gemiddelde
spectra, en ontwikkeld via PLS of MCR, werden met elkaar vergeleken. De Raman spectra die
gebruikt werden om de voorspellende modellen op te stellen, werden verzameld tijdens
extrusie van vijf verschillende kalibratiemengsels met elk een andere
geneesmiddelconcentratie, en gevalideerd met vijf validatiemengsels, geëxtrudeerd op drie
verschillende dagen door twee operatoren. Voor de validatie van deze methoden werd het
totale-fout-profiel voor elke methode berekend, gebaseerd op de ‘β-expectation tolerance
intervals’ en het concept van de totale fout (= bias + standaarddeviatie). Voor elke
gevalideerde concentratie werd het ‘β-expectation tolerance interval’ bepaald. Met behulp
van deze intervallen kan het aantal toekomstige metingen (ingesteld op 95%) dat binnen
vooropgestelde acceptatielimieten (10% relatieve bias) zal vallen, geschat worden. Het
model ontwikkeld op basis van gemiddelde spectra en MCR was het enige dat kon
garanderen dat minstens 95% van de toekomstige metingen niet meer dan 10% van de
‘echte’ concentratie zullen afwijken. Het model heeft een goede precisie, accuraatheid,
lineariteit, specificiteit en juistheid over het toegepaste concentratiebereik. De robuustheid
van dit model werd nagegaan via een experimenteel design waarbij voedingssnelheid,
schroefsnelheid en procestemperatuur werden gevarieerd. Geen van deze procesvariabelen
bleek een significant effect te hebben op het voorspellen van de geneesmiddelconcentraties.
De onzekerheid van de metingen werd geëvalueerd aan de hand van de onzekerheid van de
bias en de uitgebreide onzekerheid voor elk concentratieniveau. De onbekende, ‘echte’
waarde ligt op maximum ± 7.00% van het gemeten resultaat (met een zekerheid van 95%).
In Hoofdstuk 6 werd de Raman probe ingebouwd in elk segment van de schroefkamer, om
het gedrag van materialen tijdens extrusie te visualiseren. De invloed van variaties in
geneesmiddelconcentratie, schroefkamertemperatuur en schroefsnelheid op de
fysicochemische eigenschappen en interacties tussen het geneesmiddel en het polymeer
werd onderzocht. Bij hot-melt extrusie is de schroefkamer nooit volledig gevuld met
materiaal, wat een verschil in het achtergrondsignaal in de in-line opgenomen Raman
spectra veroorzaakte. Hiervoor kon niet gecorrigeerd werden. Daarom werd voor principale

SAMENVATTING EN ALGEMEEN BESLUIT
228
componentenanalyse gekozen, om deze bron van variatie in de spectra te scheiden van de
relevante informatie. Wanneer een formulatie met een hoge geneesmiddelconcentratie
geëxtrudeerd werd, smolt het geneesmiddel in de eerste kneedzone (tussen segment 2 en
3). Dit fenomeen vond ook plaats bij formulaties met een lage geneesmiddelconcentratie.
Daar werd een extra verschil in de spectra waargenomen, onder de vorm van
piekverschuivingen, ter hoogte van de derde kneedzone, waar het geneesmiddel oploste in
het polymeer en er een vaste oplossing gevormd werd, dankzij de hoge wrijvingskrachten in
die derde kneedzone. Dit werd bevestigd door off-line opgenomen FT-IR spectra van stalen
verzameld in de schroefkamer. Bij een lage geneesmiddelconcentratie had het verhogen van
de procestemperatuur geen invloed op de fysicochemische eigenschappen van het
eindproduct of op de locatie in de schroefkamer waar dit eindproduct gevormd werd. Dit
was ook het geval voor het verdubbelen van de schroefsnelheid. Echter, bij extrusie van een
fysisch mengsel met een hoog geneesmiddelgehalte, wordt de fysicochemische toestand van
het eindproduct pas verder in de schroefkamer bereikt wanneer de temperatuur lager wordt
ingesteld. Wanneer de schroefsnelheid verdubbeld wordt, bevindt het segment waar het
eindproduct wordt gevormd zich vroeger in de schroefkamer. De uitgevoerde metingen
doorheen de volledige schroefkamer verstrekken real-time informatie over het gedrag van
het polymeer-geneesmiddel mengsel in de schroefkamer, wat de optimalisatie van
procesparameters en procesdesign (schroeven en schroefkamer) toelaat, zodat extrudaten
met een vooropgestelde en constante kwaliteit kunnen afgeleverd worden.
In Hoofdstuk 7 werd een Raman probe ingebouwd in de matrijs van een dubbele-schroef
extruder, en elke 20 seconden werd een spectrum opgenomen. Het doel was het opstellen
van een model om extrudaten te classificeren op basis van hun fysicochemische toestand.
Het effect van variaties in geneesmiddelconcentratie, veranderingen in procestemperatuur
en drie verschillende schroefconfiguraties op de fysicochemische eigenschappen van de
extrudaten werd onderzocht. Een model werd ontwikkeld, gebruik makend van ‘soft
independent modelling of class analogy’, waardoor het mogelijk was om in-line een
onderscheid te maken tussen amorfe oplossingen en kristallijne dispersies van het slecht
oplosbaar geneesmiddel in het polymeer, aan de hand van de opgenomen Raman spectra.
Off-line analyse met DSC en XRD bleek niet gevoelig genoeg om kleine kristallijne fracties van
het geneesmiddel te detecteren, die later de uitkristallisatie van het overige amorfe

SAMENVATTING EN ALGEMEEN BESLUIT
229
geneesmiddel kunnen induceren. Deze kleine fracties werden wel gedetecteerd met Raman
spectroscopie, aan de hand van piekvernauwing en het voorkomen van piekverschuivingen.
De verschillende schroefconfiguraties hadden geen invloed op de fysicochemische
eigenschappen van de extrudaten.
Naast het opstellen van een classificatiemodel, werd ook nagegaan of de druk in de matrijs
een invloed heeft op de Raman spectra. De gebruikte geneesmiddelconcentratie,
procestemperatuur en de manier waarop het fysisch mengsel in de schroefkamer gevoed
wordt, beïnvloeden de druk in de matrijs, en dit effect wordt teruggevonden in de niet-
gecorrigeerde Raman spectra als een verschil in het achtergrondsignaal. Storingen in de
voeding kunnen dus geobserveerd en geïdentificeerd worden aan de hand van de Raman
spectra.
In Hoofdstuk 8 werd het gebruik van nabije-infraroodspectroscopie geëvalueerd om de
geneesmiddelconcentratie, de fysicochemische eigenschappen van de extrudaten en het
ontstaan van interacties tijdens extrusie te monitoren. Een NIR probe werd gemonteerd in
de matrijs, en elke 30 seconden werd een NIR spectrum opgenomen. Een PLS model werd
ontwikkeld om het geneesmiddelgehalte in-line te bepalen. De voorspelde en echte
geneesmiddelconcentraties vertoonden een goede correlatie (R² = 0.97), en nieuwe
metingen resulteerden in een lage predictiefout (RMSEP = 1.54% w/w). De in-line
opgenomen NIR spectra vertoonden piekverbreding tijdens extrusie, veroorzaakt door de
aanwezigheid van het geneesmiddel in de amorfe vorm, en het ontstaan van een nieuwe
piek, die niet teruggevonden werd in de spectra van de fysische mengsels, wees op de
vorming van waterstofbruggen tussen het polymeer en het geneesmiddel.
Het doel van Hoofdstuk 9 was de evaluatie van ultrasone technieken als proces analytische
toepassingen om de geneesmiddelconcentratie in-line te bepalen. De transittijd van het
ultrasone signaal en de piekhoogte werden gemeten in een matrijsadapter, waarin twee
ultrasone probes ingebouwd waren. Er werd eerst een PLS model voor kwantificatie
opgesteld, enkel gebaseerd op de gemeten druk in de matrijs en de torsie tijdens extrusie. Er
werd aangetoond dat het toevoegen van de gemeten transittijd en piekhoogte van het
ultrasone signaal het voorspellend vermogen van het model verhoogde.

SAMENVATTING EN ALGEMEEN BESLUIT
230
De resultaten in deze thesis tonen aan dat de implementatie van zowel Raman als nabije-
infrarood spectroscopie in farmaceutische hot-melt extrusieprocessen toelaat de
geneesmiddelconcentratie en fysicochemische eigenschappen van extrudaten te
voorspellen, en de interacties tussen polymeer en geneesmiddel doorheen het volledige
extrusieproces in kaart te brengen. Dit draagt bij tot de twee objectieven van het toepassen
van PAT in extrusieprocessen: (i) het proces beter begrijpen aan de hand van visualisatie van
het gedrag van materialen gedurende het proces en (ii) het meten en analyseren van
kritische formulatie- en procesparameters om procescontrole mogelijk te maken en de
kwaliteit van het eindproduct te garanderen.
Alle experimenten uit dit onderzoek werden uitgevoerd op laboschaal-extruders (12 en 16
mm). Er moet bijgevolg nagegaan worden of de ontwikkelde methodes en gebruikte
modellen ook van toepassing kunnen zijn op grootschalige toestellen. Het bepalen van de
geneesmiddelconcentratie en de fysicochemische eigenschappen van de extrudaten laat toe
de kwaliteit van de extrudaten te definiëren, maar dit zijn niet de enige (kritische)
kwaliteitseigenschappen die moeten gemeten worden. Naast deze twee karakteristieken is
het nodig om mogelijke degradatieproducten en -reacties te detecteren, en eventueel om de
vrijstelling in vitro en in vivo van het geneesmiddel vooraf te bepalen op basis van
spectroscopische data. De viscositeit van de extrudaten is een eigenschap die van groot
belang is voor het verder verwerken van de extrudaten, en die kan nagegaan worden door
het implementeren van on-line reometers in de schroefkamer of na de matrijs. Het gebruik
van spectroscopische en reologische technieken kan ook bijdragen tot de optimalisatie van
de gebruikte schroefconfiguratie. De meest energie-efficiënte schroefconfiguratie voor
extrusie van een bepaalde formulatie kan op deze manier ontwikkeld worden.
Het extrusieproces is slechts 1 stap in een (continue) productielijn. Het voeden van poeders
of fysische poedermengsels moet voldoende gecontroleerd worden. Daarnaast moet ook de
impact van de verschillende ‘downstream’ processen op de kwaliteit van de extrudaten
geëvalueerd worden. Het koelen of opwarmen van de extrudaten, al dan niet gecontroleerd,
heeft een significant effect op de kristalliniteit, de manier waarop het geneesmiddel
gedispergeerd is in de matrix en op de viscositeit van het eindproduct. Het bepalen van

SAMENVATTING EN ALGEMEEN BESLUIT
231
kritische proces- en formulatie-eigenschappen over de gehele productielijn is noodzakelijk
om productie volgens het ‘Quality by Design’ principe te garanderen.

SAMENVATTING EN ALGEMEEN BESLUIT
232

CURRICULUM VITAE
233
CURRICULUM VITAE

CURRICULUM VITAE
234

CURRICULUM VITAE
235
CURRICULUM VITAE - LIEN SAERENS
PERSONAL INFORMATION
SURNAME: Saerens
FIRST NAMES: Lien Lieve Jan
NATIONALITY: Belgian
DATE OF BIRTH: 10/12/1986
PLACE OF BIRTH: Dendermonde, Belgium
CIVIL STATUS: unmarried
ADDRESS: Albert Scheuremanspark 20
8210 Loppem
EMAIL: [email protected]
EDUCATION
2009 – present: PhD in Pharmaceutical Sciences: “Spectroscopic process monitoring for
quality assessment, visualization and understanding of pharmaceutical hot-
melt extrusion”
Promoter: Prof. Dr. Thomas De Beer, Co-promoter: Prof. Dr. Chris Vervaet
Laboratory of Pharmaceutical Process Analytical Technology,
Ghent University, Belgium
2004 – 2009: Master in Pharmaceutical Care
Ghent University, Belgium
1998 – 2004: Degree Sciences - Mathematics
Sint Lodewijkscollege, Brugge, Belgium

CURRICULUM VITAE
236
EXPERIENCE
2012: Research exchange
Brabender® Pharma GmbH
Duisburg, Germany
April – June 2011: Research exchange
School of Engineering, Design and Technology
University of Bradford, United Kingdom
August 2009: Apotheek Van Nieuwerburgh (Lloyds Pharma), Eeklo, Belgium
2008 – 2009: Pharmacist internship
Apotheek Martin, Reep 44, 9000 Gent, Belgium
2008: Master thesis: “The Effect of Moisture on the Mixing Behaviour of
Granules”
Promoter: Prof. Dr. Chris Vervaet
Department of Pharmaceutical Technology, University of Helsinki
PUBLICATIONS IN PEER REVIEWED JOURNALS
Validation of an in-line Raman spectroscopic method for continuous API quantification during
pharmaceutical hot-melt extrusion
L. Saerens, N. Segher, C. Vervaet, J.P. Remon, T. De Beer
Accepted for publication in Analytica Chimica Acta (2013)
In-line solid state prediction during pharmaceutical hot-melt extrusion in a 12 mm twin screw
extruder using Raman spectroscopy
L. Saerens, D. Ghanam, C. Raemdonck, K. Francois, J. Manz, R. Krüger, S. Krüger, C. Vervaet, J.P.
Remon, T. De Beer
Submitted to European Journal of Pharmaceutics and Biopharmaceutics (2013)
Process monitoring and visualization solutions for hot-melt extrusion: A review
L. Saerens, C. Vervaet, J.P. Remon, T. De Beer
Journal of Pharmacy and Pharmacology (2013) doi: 10.1111/jphp.12123

CURRICULUM VITAE
237
Visualization and process understanding of material behavior in the extrusion barrel during a
hot-melt extrusion process using Raman spectroscopy
L. Saerens, C. Vervaet, J.P. Remon, T. De Beer
Analytical Chemistry 85 (2013) 5420-5429
Prilling of fatty acids as a continuous process for the development of controlled release
multiparticulate dosage forms
A. Vervaeck, L. Saerens, B.G. De Geest, T. De Beer, R. Carleer, P. Adriaensens, J.P. Remon, C.
Vervaet
European Journal of Pharmaceutics and Biopharmaceutics (2013)doi:10.1016/j.ejpb.2013.02.003
In-line NIR spectroscopy for the understanding of polymer-drug interaction during
pharmaceutical hot-melt extrusion
L. Saerens, L. Dierickx, T. Quinten, P. Adriaensens, R. Carleer, C. Vervaet, J. P. Remon, T. De Beer
European Journal of Pharmaceutics and Biopharmaceutics 81 (2012) 230-237
Co-extrusion as manufacturing technique for fixed-dose combination mini-matrices
L. Dierickx, L. Saerens, A. Almeida, T. De Beer, J.P. Remon, C. Vervaet
European Journal of Pharmaceutics and Biopharmaceutics 81 (2012) 683-689
Preparation and evaluation of sustained-release matrix tablets based on metoprolol and an
acrylic carrier using injection moulding
T. Quinten, G.P. Andrews, T. De Beer, L. Saerens, W. Bouquet, D.S. Jones, P. Hornsby, J.P. Remon,
C. Vervaet
AAPS PharmSciTech 13 (2012) 1197-1211
Upscaling and in-line process monitoring via spectroscopic techniques of ethylene vinyl acetate
hot-melt extruded formulations
A. Almeida, L. Saerens, T. De Beer, J.P. Remon, C. Vervaet
International Journal of Pharmaceutics 439 (2012) 223-229
Raman spectroscopy for the in-line polymer-drug quantification and solid state characterization
during a pharmaceutical hot-melt extrusion process
L. Saerens, L. Dierickx, B. Lenain, C. Vervaet, J.P. Remon, T. De Beer
European Journal of Pharmaceutics and Biopharmaceutics 77 (2011) 158-163
Near infrared and Raman spectroscopy for the in-process monitoring of pharmaceutical
production processes
T. De Beer, A. Burggraeve, M. Fonteyne, L. Saerens, J.P. Remon, C. Vervaet
International Journal of Pharmaceutics 417 (2011) 32-47
Detection of counterfeit Viagra® by Raman microspectroscopy imaging and multivariate analysis
P.-Y. Sacré, E. Deconinck, L. Saerens, T. De Beer, P. Courselle, R. Vancauwenberghe, P. Chiap, J.
Crommen, J. O. De Beer
Journal of Pharmaceutical and Biomedical Analysis 56 (2011) 454-461

CURRICULUM VITAE
238
PRESENTATIONS AT CONFERENCES
Oral presentations
In-line solid state prediction during pharmaceutical hot-melt extrusion in a 12 mm twin screw
extruder using Raman spectroscopy
L. Saerens, D. Ghanam, C. Raemdonck, K. Francois, R. Krüger, S. Krüger, C. Vervaet, J.P. Remon,
T. De Beer
7th Annual PSSRC Symposium, Lille (France), 4-6 July 2013
NIR and Raman spectroscopy as PAT tools in pharmaceutical hot-melt extrusion
L. Saerens, T. De Beer.
APV Hands-on workshop on Hot Melt Extrusion, Karlsruhe (Germany), 5-6 June 2013
In-line solid state monitoring of Celecoxib/Eudragit EPO systems during hot-melt extrusion by
Raman spectroscopy
L. Saerens, D. Ghanam, C. Raemdonck, K. Francois, R. Krüger, S. Krüger, C. Vervaet, J.P. Remon,
T. De Beer
APV Experts’ Workshop on Hot-Melt Extrusion, Ludwigshafen (Germany), 5-6 November 2012.
Spectroscopic hot-melt extrusion in-process monitoring throughout the entire extrusion barrel
L. Saerens, T. De Beer.
APS Amorphous IV: Hot-melt extrusion and powder technology in pharmaceutical industry,
University of Greenwich (United Kingdom), 12-13 June 2012.
Ultrasound and NIR monitoring of a pharmaceutical hot-melt extrusion process
L. Saerens, E. Brown, A. Kelly, T. Gough, R. Dhumal, P. Apshingekar, A. Paradkar, C. Vervaet, J.P.
Remon, T. De Beer
EuPAT 5, Ghent (Belgium), 9-10 May 2012
Visualization and understanding of material behaviour in the extrusion barrel during
pharmaceutical hot-melt extrusion using Raman spectroscopy
L. Saerens, C. Vervaet, J.P. Remon, T. De Beer
16th Forum of Pharmaceutical Sciences, Blankenberge (Belgium), 7-8 May 2012
In-line Raman spectroscopy for the understanding of polymer-drug behavior in the extrusion
barrel during a pharmaceutical hot-melt extrusion process
L. Saerens, C. Vervaet, J.P. Remon, T. De Beer
5th Annual PSSRC Symposium, Helsinki (Finland), 26-27 September 2011
NIR spectroscopy as PAT-tool for in-line monitoring of pharmaceutical hot-melt extrusion
processes
L. Saerens, C. Vervaet, J.P. Remon, T. De Beer
Thermo Scientific User Meeting, Neder-over-heembeek (Belgium), 25 November 2010
CURRICULUM VITAE
239
In-line determination of API content and solid state during pharmaceutical hot-melt extrusion
processes using Raman spectroscopy
L. Saerens, C. Vervaet, J.P. Remon, T. De Beer
IWPCPS 12 Workshop, Lille (France) 21-24 June 2010
NIR spectroscopy as PAT tool for in-line and real-time monitoring of pharmaceutical hot-melt
extrusion processes
L. Saerens, C. Vervaet, J.P. Remon, T. De Beer
Thermo Scientific Summer Meeting, Arnhem (The Netherlands) 16 June 2010
Poster presentations
In-line solid state monitoring during pharmaceutical hot-melt extrusion using Raman
spectroscopy
L. Saerens, D. Ghanam, C. Raemdonck, K. Francois, R. Krüger, S. Krüger, C. Vervaet, J.P. Remon, T. De Beer Knowledge for growth, Ghent (Belgium), 30 May 2013
In-line solid state monitoring during pharmaceutical hot-melt extrusion in a 12mm pharma twin
screw extruder using Raman spectroscopy
L. Saerens, D. Ghanam, C. Raemdonck, K. Francois, R. Krüger, S. Schlaefke, C. Vervaet, J.P. Remon, T. De Beer 2012 AAPS annual meeting and exposition, Chicago (USA), 14-18 October 2012
Visualization and understanding of material behaviour in the extrusion barrel during
pharmaceutical hot-melt extrusion using Raman spectroscopy
L. Saerens, C. Vervaet, J.P. Remon, T. De Beer
Scientific Afternoon, Faculty of Pharmaceutical Sciences, Ghent University, Ghent (Belgium), 16
May 2012
Visualization and understanding of material behaviour in the extrusion barrel during
pharmaceutical hot-melt extrusion using Raman spectroscopy
L. Saerens, C. Vervaet, J.P. Remon, T. De Beer
EuPAT 5, Ghent (Belgium), 9-10 May 2012
Raman spectroscopy for the in-line monitoring of a pharmaceutical hot-melt extrusion process
L. Saerens, B. Braeckman, C. Vervaet, J.P. Remon, T. De Beer
8th PBP World Meeting, Istanbul (Turkey), 19-22 March 2012
NIR and Raman spectroscopy as Process Analytical Tools for In-Line and Real-Time Monitoring of
a Pharmaceutical Hot-Melt Extrusion Process
L. Saerens, J.P. Remon, C. Vervaet, T. De Beer
Europact 2011, Glasgow (United Kingdom), 26-29 April 2011
CURRICULUM VITAE
240
Raman spectroscopy as a process analytical tool for in-line and real-time monitoring of a
pharmaceutical hot-melt extrusion process
L. Saerens, J.P. Remon, C. Vervaet, T. De Beer
2010 AAPS annual meeting and exposition / FIP PSWC, New Orleans (USA), 14-18 November
2010
Raman spectroscopy as a process analytical tool for in-line and real-time monitoring of a
pharmaceutical hot-melt extrusion process
L. Saerens, J.P. Remon, C. Vervaet, T. De Beer
PSWC 2010 Congress for students and postdoctoral fellows, New Orleans (USA), 13-14 November
2010
Raman spectroscopy as a process analytical tool for in-line and real-time monitoring of a
pharmaceutical hot-melt extrusion process
L. Saerens, J.P. Remon, C. Vervaet, T. De Beer
Drug Analysis, Antwerp (Belgium), 21-24 September 2010
Raman spectroscopy as a process analytical tool for in-line and real-time monitoring of a
pharmaceutical hot-melt extrusion process
L. Saerens, J. P. Remon, C. Vervaet, T. De Beer
Scientific Afternoon, Faculty of Pharmaceutical Sciences, Ghent University, Ghent (Belgium), 12
May 2010
ATTENDED COURSES, CONFERENCES AND WORKSHOPS
- Conference: 11th Chemometrics symposium: Advances in Chemometrics, Belgian
Chemometrics Society, 8 June 2012, Ghent (Belgium)
- Workshop: Continuous Processing for Tablet Manufacturing, EuPat 5 Pre-conference
workshop, 8 May 2012, Ghent (Belgium)
- Course: Introduction to Process Control for Chemists, Pharmacists and Formulation Scientists,
27-29 June 2011, CPACT, Perceptive Engineering, Daresbury (United Kingdom)
- Course: Support Vector Machines: Non-linear modeling made easy, 26 April 2011, Glasgow
(United Kingdom)
- Course: Hyperspectral Chemical Imaging for Process Analytics, 26 April 2011, Glasgow (United
Kingdom)
- Course: Modulated Differential Scanning Calorimetry (MDSC) Training Course, 15 June 2010,
TA Instruments, Ghent (Belgium)

CURRICULUM VITAE
241
- Course: Differential Scanning Calorimetry (DSC) Training Course, 7 June 2010, TA Instruments,
Ghent (Belgium)
- Conference: EuPAT 4 – Taking PAT to the next level, 5-6 May 2010, Kuopio (Finland)
- Workshop: Pharmaceutical Hot Melt Extrusion, 15 April 2010, Coperion GmbH, Stuttgart
(Germany)
- Course: Design of Experiments, January 2010, Ghent (Belgium)
- Course: Multivariate Data Analysis, January 2010, Ghent (Belgium)
LANGUAGE SKILLS
Speaking Reading Writing
Dutch (native language) very good very good very good
French good good good
English very good very good very good
German notions notions notions