GHANA JOURNAL OF FORESTRY - CSIR-FORIG · The Ghana Journal of Forestry (ISSN 0855-1707) is...
88
VOLUME 31, 2015 ISSN 0855-1707 GHANA JOURNAL OF FORESTRY, VOL. 31, 2015 GHANA JOURNAL OF FORESTRY, VOL. 31, 2015 GHANA JOURNAL OF FORESTRY Seedling abundance, composition and growth forecast under two logging intensities in a moist tropical forest in Ghana A.Duah-Gyamfi, B. Kyereh, V. K. Agyeman, K. A. Adam K. O. Afriyie and M. D. Swaine.....1 - 20 Methodology for efficient survey of pests in smallholder tree plantations: e case of the Community Forestry Management Project in Ghana P. P. Bosu, M. M. Apetorgbor and E. E. Nkrumah….............………………………………….….21 - 33 e significance of medicinal plants in a valley rice growing eco-system (Sawah): e case of Ahafo-Ano South District, Ghana E. Nutakor ........................................................................................................................34 - 44 Influence of indole-3-butyric acid concentrations on rooting of Cinnamomum camphora (L.) Presl marcots E. A. Owusu, C. M. Asare and S. Ackon…………………………………….................................45 - 50 Calorific values and gravimetric yield of six wood fuel species in the Forest Transition Zone of Ghana J. K. Korang, B. D. Obiri, H. Appiah and S. Awuku…………………………………............……51 - 61 Effects of land use changes on flora diversity in Oban Division of the Cross River National Park, Nigeria E. T. Ikyaagba, S. O. Jimoh and J. I. Amonum…………………………………………….............62 - 77
Transcript of GHANA JOURNAL OF FORESTRY - CSIR-FORIG · The Ghana Journal of Forestry (ISSN 0855-1707) is...
VOLUME 31, 2015
ISSN 0855-1707
GHANA JOURNAL OF FORESTRY, VOL. 31, 2015
GH
AN
A JO
UR
NA
L OF FO
RE
STR
Y, V
OL. 31, 2015
GHANAJOURNAL OFFORESTRY
Seedling abundance, composition and growth forecastunder two logging intensities in a moist tropical forest in GhanaA.Duah-Gyam�, B. Kyereh, V. K. Agyeman, K. A. Adam K. O. Afriyie and M. D. Swaine.....1 - 20
Methodology for e�cient survey of pests in smallholder tree plantations: �e case of the Community Forestry Management Project in GhanaP. P. Bosu, M. M. Apetorgbor and E. E. Nkrumah….............………………………………….….21 - 33
�e signi�cance of medicinal plants in a valley rice growing eco-system (Sawah): �e case of Ahafo-Ano South District, Ghana E. Nutakor ........................................................................................................................34 - 44
In�uence of indole-3-butyric acid concentrations on rooting of Cinnamomum camphora (L.) Presl marcotsE. A. Owusu, C. M. Asare and S. Ackon…………………………………….................................45 - 50
Calori�c values and gravimetric yield of six wood fuelspecies in the Forest Transition Zone of GhanaJ. K. Korang, B. D. Obiri, H. Appiah and S. Awuku…………………………………............……51 - 61
E�ects of land use changes on �ora diversity in Oban Division of the Cross River National Park, NigeriaE. T. Ikyaagba, S. O. Jimoh and J. I. Amonum…………………………………………….............62 - 77
VOLUME 31, 2015
PUBLICATION INFORMATION
The Ghana Journal of Forestry (ISSN 0855-1707) is published by CSIR-Forestry Research
Institute of Ghana.
The Journal publishes scientific articles concerned with forest management and conservation,
and in particular the application of biological, ecological and social knowledge to the
management of forests. The scope of the Journal includes the global forest ecosystem.
The Journal aims to encourage communication between scientists in disparate fields which
share a common interest in ecology and natural resources management, and to bridge the gap
between research workers and forest managers in the field to the benefit of both. The Journal is
indexed by the Centre for Agriculture and Biosciences International (CABI) and can be
accessed online from this website: http://www.ajol.info.
Annual subscription is US $55 for institutions, US $35 for individuals, and US $20 for single
issues. For overseas subscriptions, please add US $10 for postage. All cheques should be made
payable to CSIR-Forestry Research Institute of Ghana. Two issues are published every year.
Audience: research workers, managers and policy makers in forestry, natural resources,
ecological conservation and related fields.
Copies of the Journal are available from the:
THE EDITOR-IN-CHIEF
CSIR-FORESTRY RESEARCH INSTITUTE Of GHANA
P. O. BOX UP 63, KNUST
KUMASI, GHANA
Tel: (233) 3220 60123 / 60373
Fax: (233) 3220 60121
Email: [email protected], [email protected]
All rights reserved csir-forig
Ghana J. Forestry, Vol. 31, 2015 ISSN 0855-1707
GHANA JOURNAL OF FORESTRY
CSIR-FORESTRY RESEARCH INSTITUTE OF GHANA
P. O. BOX UP 63, KNUST
KUMASI, GHANA

GHANA JOURNAL OF FORESTRY
VOLUME 31, 2015
EDITORIAL ADVISORY BOARD
Dr. John Ocloo
University P. O. Box 694
K. N. U. S. T., Kumasi
GHANA
Dr. M. D. Swaine
Honorary Lecturer in Botany
School of Biological Sciences
University of Aberdeen
SCOTLAND
Dr. N. A. Darkwa
P. O. Box 1060
K. N. U. S. T., Kumasi
GHANA
Dr. Ouddara Souvannavong
FAO African Forestry Project
Via delle Terme di Caracalla
001000, Rome
ITALY
Mr. J. G. K. Owusu
Forest Consultant
F. R. N. R., Kumasi
GHANA
Prof. Ivan Eastin
Director, CINTRAFOR
University of Washington
Seattle, Washington
U. S. A.
Prof. Kwabena Tuffour
P. O. Box 180
Achimota, Accra,
GHANA
Prof. Michael Wagner
Northern Arizona Univ.
School of Forestry
Flagstaff, Arizona
U. S. A
Prof. Oteng-Yeboah
Accra, GHANA
Prof. Jeff. Morrel
Oregon State University
Dept. of Forest Products
Corvallis
Oregon 97331-5704
U. S. A.
Prof. Yoshihiko Hirashima
Graduate School of Bio-
Agricultural Sciences Nagoya
University, Furo-cho Chikusaku,
Nagoya 464-8601
JAPAN
EDITORIAL COMMITTEE
Dr. Paul P. Bosu (Editor-in-Chief)
Mrs. Margaret Sraku-Lartey (Editor)
Dr. Stephen Adu-Bredu (Editor)
Dr. Emmanuel Ebanyenle (Editor)
Dr. Kwame Antwi Oduro (Editor)
Mrs. Naomi Appiah (Editorial Secretary)

CONTENTS Seedling abundance, composition and growth forecast
under two logging intensities in a moist tropical forest in Ghana
A.Duah-Gyamfi, B. Kyereh, V. K. Agyeman, K. A. Adam
K. O. Afriyie and M. D. Swaine……………………...……………………………................1 - 20
Methodology for efficient survey of pests in smallholder
tree plantations: The case of the Community Forestry
Management Project in Ghana
P. P. Bosu, M. M. Apetorgbor and E. E. Nkrumah…..……………………………………21 - 33
The significance of medicinal plants in a valley rice
growing eco-system (Sawah): The case of Ahafo-Ano
South District, Ghana
E. Nutakor .....................................................................................................................34 - 44
Influence of indole-3-butyric acid concentrations on
rooting of Cinnamomum camphora (L.) Presl marcots
E. A. Owusu, C. M. Asare and S. Ackon……………………………………......................45 - 50
Calorific values and gravimetric yield of six wood fuel
species in the Forest Transition Zone of Ghana
J. K. Korang, B. D. Obiri, H. Appiah and S. Awuku………………………………………51 - 61
Effects of land use changes on flora diversity in Oban Division
of the Cross River National Park, Nigeria
E. T. Ikyaagba, S. O. Jimoh and J. I. Amonum…………………………………………….62 - 77

Seedling abundance, composition and growth forecast in a moist tropical forest in Ghana A. Duah-Gyamfi et al.
Ghana J. Forestry, Vol. 31, 2015, 1 – 20 1
SEEDLING ABUNDANCE, COMPOSITION AND GROWTH FORECAST
UNDER TWO LOGGING INTENSITIES IN A MOIST TROPICAL FOREST IN
GHANA
A. Duah-Gyamfi1, B. Kyereh2, V. K. Agyeman,3, K. A. Adam4, K. O. Afriyie1and M. D. Swaine5
1CSIR-Forestry Research Institute of Ghana, University P. O. Box 63, Kumasi, Ghana
2 Faculty of Renewable Natural Resources, Kwame Nkrumah University of Science and Technology,
Kumasi, Ghana, 3Council for Scientific and Industrial Research (CSIR), Secretariat, Accra
4Ghana Timber Millers’ Organization, Kumasi, Ghana 5Institute of Biological and Environmental Sciences, University of Aberdeen, Aberdeen, U K
Email: [email protected];[email protected]
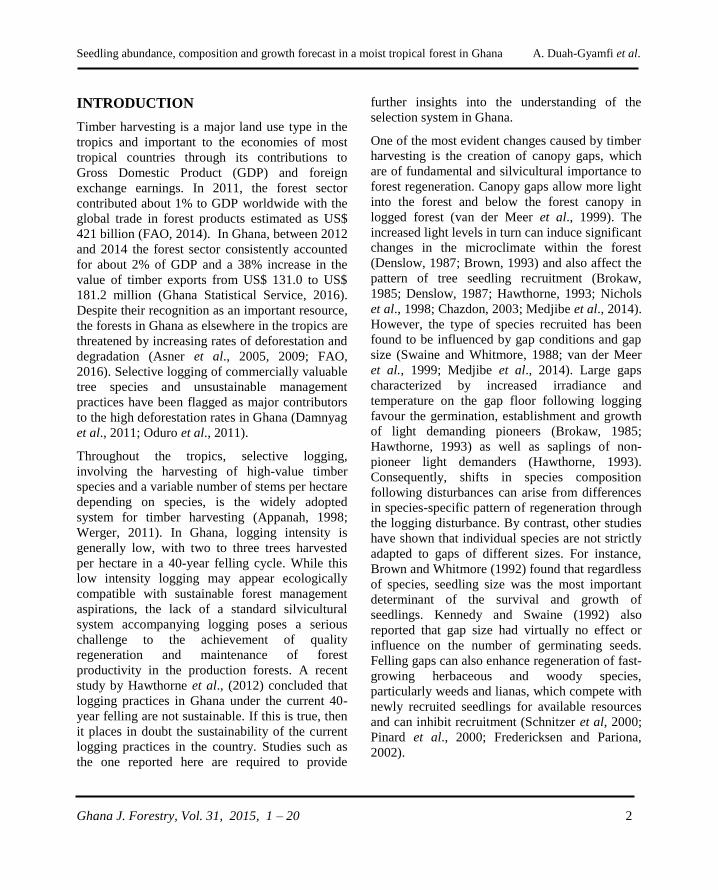
ABSTRACT
Timber species differ in their response to logging disturbance. Knowledge about the impacts of different
logging intensities is necessary to determine levels of timber extraction compatible with species responses
in order to refine management interventions. We examined the effects of two logging intensities on the
abundance and composition of tree seedlings in gaps in Pra Anum Forest Reserve within a Moist Semi-
deciduous forest in Ghana. In addition, we assessed seedling growth by forecasting the probability of
locating a seedling (≥ 55 cm) in the two logging intensities compared to controls. Logging was carried
out experimentally at two intensities, 26 m3/ha (1 AAC) and 52 m3/ha (2 AAC) of extracted timber, in a
128 ha compartment. Twenty plots each of 60 m2 were randomly established in gaps in each of the
logging treatments and in the unlogged forest. These plots were monitored for number of seedlings and
height growth of timber tree species for 33 months in four different enumerations. We used mixed effect
models to assess the abundance of seedlings over time. A non-metric multidimensional scaling (NMDS)
was used to determine the shifts in species composition. Seedling abundance was significantly different in
gaps for both high and low logging intensities, however, a significant interaction effect between
abundance and time was found only in the low intensity treatment. There was a significant difference in
the rate of change in species composition between the high intensity and unlogged forest (P = 0.03) but
the rate of change between the low intensity and unlogged forest was not significant (P = 0.27). After 3
years, we predicted that it was approximately three and two times more likely to locate a seedling (≥ 55
cm) in the low and high intensity treatments, respectively compared to controls. An explanation for this is
that the high intensity treatment enhanced competition from herbaceous weeds, which affected the
survival and growth of tree seedlings. Based on this result, we recommend enforcement of silvicultural
prescriptions to the management of logged forests in order to achieve the level of forest manipulation
needed to ensure productivity.
Keywords: Abundance, Composition, Gaps, Logging intensity, Model, Selective logging
Seedling abundance, composition and growth forecast in a moist tropical forest in Ghana A. Duah-Gyamfi et al.
Ghana J. Forestry, Vol. 31, 2015, 1 – 20 2
INTRODUCTION
Timber harvesting is a major land use type in the
tropics and important to the economies of most
tropical countries through its contributions to
Gross Domestic Product (GDP) and foreign
exchange earnings. In 2011, the forest sector
contributed about 1% to GDP worldwide with the
global trade in forest products estimated as US$
421 billion (FAO, 2014). In Ghana, between 2012
and 2014 the forest sector consistently accounted
for about 2% of GDP and a 38% increase in the
value of timber exports from US$ 131.0 to US$
181.2 million (Ghana Statistical Service, 2016).
Despite their recognition as an important resource,
the forests in Ghana as elsewhere in the tropics are
threatened by increasing rates of deforestation and
degradation (Asner et al., 2005, 2009; FAO,
2016). Selective logging of commercially valuable
tree species and unsustainable management
practices have been flagged as major contributors
to the high deforestation rates in Ghana (Damnyag
et al., 2011; Oduro et al., 2011).
Throughout the tropics, selective logging,
involving the harvesting of high-value timber
species and a variable number of stems per hectare
depending on species, is the widely adopted
system for timber harvesting (Appanah, 1998;
Werger, 2011). In Ghana, logging intensity is
generally low, with two to three trees harvested
per hectare in a 40-year felling cycle. While this
low intensity logging may appear ecologically
compatible with sustainable forest management
aspirations, the lack of a standard silvicultural
system accompanying logging poses a serious
challenge to the achievement of quality
regeneration and maintenance of forest
productivity in the production forests. A recent
study by Hawthorne et al., (2012) concluded that
logging practices in Ghana under the current 40-
year felling are not sustainable. If this is true, then
it places in doubt the sustainability of the current
logging practices in the country. Studies such as
the one reported here are required to provide
further insights into the understanding of the
selection system in Ghana.
One of the most evident changes caused by timber
harvesting is the creation of canopy gaps, which
are of fundamental and silvicultural importance to
forest regeneration. Canopy gaps allow more light
into the forest and below the forest canopy in
logged forest (van der Meer et al., 1999). The
increased light levels in turn can induce significant
changes in the microclimate within the forest
(Denslow, 1987; Brown, 1993) and also affect the
pattern of tree seedling recruitment (Brokaw,
1985; Denslow, 1987; Hawthorne, 1993; Nichols
et al., 1998; Chazdon, 2003; Medjibe et al., 2014).
However, the type of species recruited has been
found to be influenced by gap conditions and gap
size (Swaine and Whitmore, 1988; van der Meer
et al., 1999; Medjibe et al., 2014). Large gaps
characterized by increased irradiance and
temperature on the gap floor following logging
favour the germination, establishment and growth
of light demanding pioneers (Brokaw, 1985;
Hawthorne, 1993) as well as saplings of non-
pioneer light demanders (Hawthorne, 1993).
Consequently, shifts in species composition
following disturbances can arise from differences
in species-specific pattern of regeneration through
the logging disturbance. By contrast, other studies
have shown that individual species are not strictly
adapted to gaps of different sizes. For instance,
Brown and Whitmore (1992) found that regardless
of species, seedling size was the most important
determinant of the survival and growth of
seedlings. Kennedy and Swaine (1992) also
reported that gap size had virtually no effect or
influence on the number of germinating seeds.
Felling gaps can also enhance regeneration of fast-
growing herbaceous and woody species,
particularly weeds and lianas, which compete with
newly recruited seedlings for available resources
and can inhibit recruitment (Schnitzer et al, 2000;
Pinard et al., 2000; Fredericksen and Pariona,
2002).
Seedling abundance, composition and growth forecast in a moist tropical forest in Ghana A. Duah-Gyamfi et al.
Ghana J. Forestry, Vol. 31, 2015, 1 – 20 3
Logging impacts on the forest ecosystem are
variable and depend on factors such as harvest
intensity, harvesting methods and skill of field
personnel, site differences due to soil, topography,
and biota. Some studies have reported a direct
relationship between felling intensity and area
damaged (Hendrison, 1990; Sist et al., 2014). On
the other hand, the direction of the effects of
logging on forest communities is not consistent
among different forests and different species
groups. It is expected that plant species
composition changes would increase
proportionally with logging intensity, particularly
pioneer species which colonize disturbed sites
immediately after logging. Similarly, there is a
positive relationship between felling intensity and
canopy opening, therefore, depending on which
species guild is to be favoured in a particular
compartment, felling intensity may vary (low,
medium or high) in view of the fact that species
with different regeneration strategies respond
differently to logging (Hawthorne, 1993;
Chazdon, 2003). However, studies are needed to
determine appropriate thresholds of low, medium
and high intensity felling in different forest types
(Osho, 1995; Pena-Claros et al., 2008). In
addition, given that logging disturbance increases
the number of available sites for species
regeneration and these sites may be filled only by
species abundant at the right place and time
(Hubbell et al., 1999), it is therefore important to
examine the effects of logging intensity on the
abundance and composition of tree seedlings over
time. This has scarcely been tested in Ghana and
in most West African countries despite the
increasing importance of logging in the subregion.
The objective of this study was to determine the
abundance and composition of tree seedlings in
felling gaps under two logging intensities in a
moist tropical forest in Ghana. We also sought to
predict seedling height growth under the different
logging intensities. The lack of a standard
silvicultural system in the management of Ghana’s
natural forests calls for research to test the
sustainability of the current system. Studies have
shown that whilst regeneration of tree species may
be profuse in the first few years following logging
(Hawthorne, 1993; Duah-Gyamfi et al., 2014a,
2014b), it is not sustained due to the proliferation
of herbaceous weeds and climbers in logging
gaps. Thus, logging without silvicultural practices
cannot attain the desired level of forest
manipulation needed to ensure productivity.
The questions we addressed in this paper and the
corresponding hypothesis were: (i) Are abundance
and composition of timber tree seedlings related to
logging intensity? We expected that the
abundance and composition of tree seedlings
increase with increasing logging intensity, as long
as the forest recovers over time from logging
disturbance. (ii) How does logging intensity
influence height growth of tree seedlings
overtime? In keeping with the results of other
studies, we predicted faster seedling height growth
to be most likely in the most intensively logged
treatment.
The work described in the present paper
complements that of Adam (2003) who examined
ecological and silvicultural considerations in tree
selection in selective logging for natural forest
management in Ghana, and Duah-Gyamfi et al.
(2014b) who compared regeneration on disturbed
sites following logging but did not test the effects
of the logging treatments imposed in the design of
the silvicultural experiment as reported in this
paper.
MATERIALS AND METHODS
The Study Area
Data were collected from the Research Working
Cycle (RWC) of Pra Anum Forest Reserve (6o 16'
N, 1o 12' W) in the South-east sub-type of Moist
Semi-deciduous (MSSE) forest in Ghana (Hall
and Swaine, 1981). Covering an area of about
12,332 ha, Pra Anum has served as timber
production area and silvicultural research station
Seedling abundance, composition and growth forecast in a moist tropical forest in Ghana A. Duah-Gyamfi et al.
Ghana J. Forestry, Vol. 31, 2015, 1 – 20 4
since 1954 (FIP, 1989). Total mean annual rainfall
and temperature recorded for the period 2000 –
2010 ranged between 98.0 and 170.6 cm and 23.0
and 27.5 °C, respectively. Soils are deeply
weathered and composed of forest oxysol-
ochrosol intergrades (Brammer, 1962). The
relative abundance of common timber species in
the research compartment for trees ≥ 70 cm dbh
are Triplochiton scleroxylon (17.6%), Celtis
mildbraedii (15.4%), Cylicodiscus gabunensis
(8.5%), Turreaenthus africanus (6.9%) and Ceiba
pentandra (6.2%).
Experimental Design and Field Methods
Four experimental blocks approximately 32 ha
each were established in the research
compartment. Each block was designed to be
randomly subjected to one of four types of logging
intensity: low intensity - harvesting of small
stems[i.e. 1 Annual Allowable Cut (AAC = 26.3
m3 ha-1,× small stems)]; low intensity – harvesting
of large stems[i.e. 1 Annual Allowable Cut (AAC
= 26.3 m3 ha-1, × large stems)]; high intensity -
harvesting of small stems [i.e. 2 Annual Allowable
Cut (AAC = 52.6 m3 ha-1, × small stems)], and
high intensity [i.e. 2 Annual Allowable Cut (AAC
= 52.6 m3 ha-1, × large stems)]. However,
permission was not granted by the Forest Services
Division (FSD) for inclusion of smaller stems
below the minimum-felling diameter (MFD).
Therefore, all trees selected for felling, either large
or small diameter stem, were necessarily within
the MFD for the respective species (50 - 110 cm
dbh). For purposes of the present paper, the
logging treatments imposed in the four blocks can
be categorized into two broad types: high or low
intensity.
In August 2000, immediately following
harvesting, 20 sample plots were randomly
established in felling gaps in each of the treatment
blocks (hereinafter referred to as Gap-High or
Gap-Low depending on treatment block). Felling
gaps were laid in the direction of tree fall from
stump to crown zone and measured approximately
30 m × 2 m. Control plots were set up in an
identical fashion in unlogged parts of the forest.
Digital hemispherical photograph 1 m above each
plot center was taken with a Nikon F2 digital
camera to determine canopy openness.
Using an ocular estimation, soil condition was
assessed on a 4-point scale: 1= no disturbance; 2 =
topsoil slightly disturbed but intact; 3 = slightly
disturbed and displaced, ≤ 20 cm; 4 = topsoil
moderately disturbed, 20 ≤ x < 50 cm.
In this study, we adopted a more practical, field-
based definition for seedlings: germinating seeds
with open cotyledons and up to young plants < 1m
tall and < 1 cm dbh (Zagt, 1997). Seedling
censuses were carried out within each plot at 0.5,
4.2, 10 and 33 months (mo) after logging. At the
time of the first census, each seedling was
identified to species level and tagged (using
consecutive numbers) to ensure accurate re-
identification. Seedlings were mapped and vertical
height from the ground to the apical bud measured
with a meter tape or telescopic rod when
necessary. In subsequent censuses, surviving
tagged seedlings were re-measured, dead or
missing seedlings noted and new recruits tagged,
identified, height measured and their positions in
the plots mapped to the nearest centimeter. In
December, 2012, a random assessment of the
ground layer composition was carried out in 10
randomly selected gaps using 1m × 1m quadrats.
Within each gap, the quadrat was placed at the
North, East, South and West directions and the
number of ground herbaceous and woody species
identified and recorded. Total heights of tallest
tree species in each plot were also estimated using
a vertex and a transponder.
Data Analysis
Response Function Modeling (Modeling
Seedling Abundance)
To examine the effects of the logging treatments
on seedling abundance over time, we used a
Seedling abundance, composition and growth forecast in a moist tropical forest in Ghana A. Duah-Gyamfi et al.
Ghana J. Forestry, Vol. 31, 2015, 1 – 20 5
generalized linear mixed model as implemented in
the statistical interface R (R Development Core
Team, 2015). In this study, we settled on mixed
effects statistical method, an extension of
regression models, for these reasons: (1) we were
interested in trends and comparisons in seedling
abundance; (2) based on (1) above, it was possible
to investigate directly the interaction between
treatment and time given the temporal and spatial
autocorrelation between seedling abundance and
time; (3) we could use the totality of the data,
given the hierarchical structure in our
experimental design (Pinheiro and Bates, 2000;
Zuur et al., 2009; Maindonald and Braun, 2012;
Crawley, 2013), thus, increasing the power of
statistical tests implemented in our analysis. We
identified significant treatment effects and trends
by determining the best model among a
hierarchical set of alternatives. Our experimental
design suggested temporal or spatial correlation
might be present (Pinheiro and Bates, 2000;
Schabenberger and Pierce, 2002; Zuur et al.,
2009; Crawley, 2013), therefore, to determine a
robust model to answer our first question, we
sought first to ensure we had correctly specified
the error structure, and afterwards tested for a
contribution by effects of interest (Zuur et al.,
2007; 2009). This step is very important in mixed-
model building. If the random effects are poorly
chosen, the error introduced affects the values and
quality of the fixed effects as the random effects
work their way into the standard deviation of the
slopes of the fixed effects and vice versa (Zuur et
al., 2009). We evaluated statistical significance
using likelihood ratio tests and compared models
using Akaike’s Information Criterion (AIC) and
estimated log-likelihoods (LL) (Burnham and
Anderson, 2002). Unless otherwise indicated,
model parameters were estimated using maximum
likelihood (ML) in the R package Non-linear
Mixed Effects (nlme) (Pinheiro and Bates, 2000).
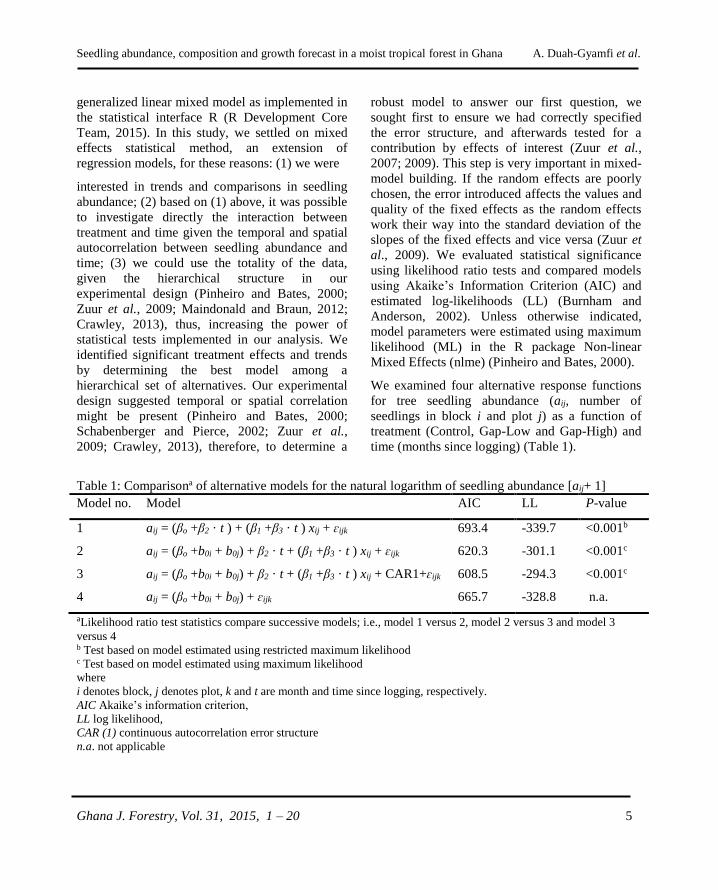
We examined four alternative response functions
for tree seedling abundance (aij, number of
seedlings in block i and plot j) as a function of
treatment (Control, Gap-Low and Gap-High) and
time (months since logging) (Table 1).
Table 1: Comparisona of alternative models for the natural logarithm of seedling abundance [aij+ 1]
Model no. Model AIC LL P-value
1
2
3
4
aij = (βo +β2 · t ) + (β1 +β3 · t ) xij + ɛijk
aij = (βo +b0i + b0j) + β2 · t + (β1 +β3 · t ) xij + ɛijk
aij = (βo +b0i + b0j) + β2 · t + (β1 +β3 · t ) xij + CAR1+ɛijk
aij = (βo +b0i + b0j) + ɛijk
693.4
620.3
608.5
665.7
-339.7
-301.1
-294.3
-328.8
<0.001b
<0.001c
<0.001c
n.a.
aLikelihood ratio test statistics compare successive models; i.e., model 1 versus 2, model 2 versus 3 and model 3
versus 4 b Test based on model estimated using restricted maximum likelihood c Test based on model estimated using maximum likelihood
where
i denotes block, j denotes plot, k and t are month and time since logging, respectively.
AIC Akaike’s information criterion,
LL log likelihood,
CAR (1) continuous autocorrelation error structure
n.a. not applicable
Seedling abundance, composition and growth forecast in a moist tropical forest in Ghana A. Duah-Gyamfi et al.
Ghana J. Forestry, Vol. 31, 2015, 1 – 20 6
Model 1 was a fixed-effects only specification for
abundance as a function of treatment (xij, for the
ith block and jth) plot and time (t, months since
logging). Model 2 was the same as model 1, but
was augmented with the random effects b0i for
block and b0j for plot within block. Model 3 was
an extension of Model 2, augmented with a first-
order continuous autoregressive correlation error
structure, [CAR (1)], a correction for the unequal
time interval. Model 4 was an intercept-only
variant of Model 3, which implies no treatment or
time effects. As in classical model building in
regression analysis, standard diagnostics were
used to evaluate regression assumptions (Neter et
al., 1996).
Change in Community Composition
We used non-metric multidimensional scaling
(NMDS) ordination as implemented in R package
vegan 2.3 (Oksanen et al., 2015) and PC-ORD
version 6.2 (McCune and Mefford, 2011) to
examine tree seedling species composition among
treatments over time. We conducted the NMDS
using Sorensen’s (Bray-Curtis) distance measure
in PC-ORD’s autopilot mode (slow and through)
and a random starting configuration (McCune and
Grace, 2002). According to McCune and Grace
(2002), the procedure automatically determines
dimensionality by comparing final stress values to
determine the best solution for the NMDS
ordination. Seedling abundance data were square-
root transformed to reduce the stress and over
influence of sample plots with high seedling
abundance to improve the interpretability of the
NMDS ordination (McCune and Grace, 2002).
Rare species with a frequency of < 5% were
excluded from the analysis. The square-root
transformation and removal of rare species
reduced the stress of the best solution from 24.9 to
16.7, which is an improvement from an
unacceptable to acceptable level of stress
(McCune and Grace, 2002). Kendall’s τ rank
correlation coefficient was used to examine
relationships between each axis and the
environmental variables, canopy openness and soil
condition.
To test for differences in species composition
between treatment types, a Multiple Response
Permutation Procedure (MRPP) was employed.
MRPP compares within-group to between-group
distances between sample units (McCune and
Grace, 2002). To carry out this analysis, a distance
matrix was computed followed by an effect size
(chance-corrected within-group agreement, A) that
describes the observed within-group homogeneity
compared to expected homogeneity due to chance.
Values of A range from 1 when there is complete
agreement within groups, to 0 when within group
heterogeneity equals random expectation. We
used Sorenson’s distance measure to maintain
consistency with the distance measure used in the
NMDS ordination. We carried out two separate
MRPP analyses to test for compositional changes
between treatments at the initial and final
censuses. If a difference was found in the MRPP
analysis, then, an indicator species analysis (ISA)
(Dufrene and Legendre, 1997) was used to
determine which species were more prevalent in a
given treatment. In ISA, an indicator value (IV) is
computed for each species in each treatment by
multiplying relative abundance by relative
frequency and multiplying by 100. To determine if
a species’ maximum IV was significant, we
conducted a Monte Carlo test of significance with
10,000 randomizations (McCune and Grace,
2002). An alpha level of 0.05 and minimum IV of
25 were set to determine significance (Dufrene
and Legendre, 1997).
We examined differences in the rates of change in
species abundance over time by computing
successional (directional) vectors between plot-
level NMDS ordination scores for the initial and
final censuses. Successional vectors show
movements of sample units in species space and
since we were interested in trends (McCune and
Mefford, 2006), we assessed whether control plots
moved in a different direction and or rate than
Seedling abundance, composition and growth forecast in a moist tropical forest in Ghana A. Duah-Gyamfi et al.
Ghana J. Forestry, Vol. 31, 2015, 1 – 20 7
gaps. Differences in mean length of gap and
control vectors were compared with a pooled t-
test.
Prediction of Height Growth
For forests recovering from logging, growth
would be expected to be accelerated in gaps
relative to unlogged sites, due to increased
recruitment of seedlings into saplings and
subsequently into adult size classes under gap
conditions. We used binary logistic regression to
examine the probability that a plot (gap) had a
seedling (>55 cm tall) in the final census (2004) as
a function of initial (2000) canopy openness and
soil disturbance. We chose >55 cm given the slow
growth of seedlings in controls, which served as
the baseline for comparison with gaps. The
analysis was carried out in the R statistical
interface using a generalized linear model (GLM)
with the binomial family and the package ggplot2
(Wickham, 2009). Generalized linear models are
applications of linear regression model which
allow for the response variable to have
distributions other than the normal distribution
(Zuur et al., 2009).
RESULTS
Changes in Seedling Abundance
The treatments imposed in this study had a
significant effect on seedling abundance
throughout the study (Tables 1 and 2; Figure 1).
Because of substantial temporal autocorrelation in
the abundance data, models including random
effects and CAR (1) error structure were
statistically superior to models without these
components (models 3 vs. 2; models 3 vs. 4; P<
0.001; Table 1) and were preferred by AIC and LL
(Table 2). Given the obvious trend, it was not
surprising that the intercept-only model 4 was
inferior to the more complex alternatives. Thus,
model 3, which included random effects for block
and plot within block, and a CAR (1) error
structure, was identified as the best
characterization for tree seedling abundance over
time (Table 2).
Table 2: Model 3 term effects (±1S.E.) and
statistical significance.
Model term (effect) Abundance
Value
Intercept
Month
Gap-High
Gap-Low
Gap-High x month
Gap-Low x month
1.92 (0.206)**
0.03 (0.007)**
1.22 (0.247)**
1.26 (0.287)**
-0.02 (0.010)
-0.05 (0.010)**
** Statistical significance is specified at the < 0.01 level
A detailed examination of model 3 reveals an
interesting result - a significant interaction effect
for Gap-Low and time (Table 2). By contrast,
there was no significant interaction effect for Gap-
High and time (Table 2). In general, the treatments
imposed had a significant effect on seedling
abundance and stimulated divergent responses in
abundance among some species overtime.
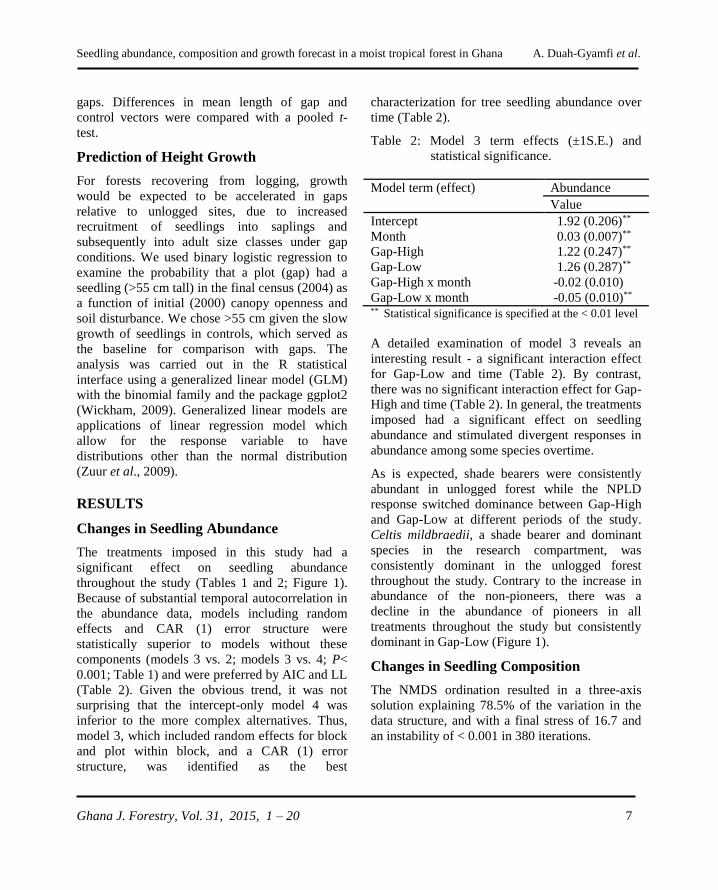
As is expected, shade bearers were consistently
abundant in unlogged forest while the NPLD
response switched dominance between Gap-High
and Gap-Low at different periods of the study.
Celtis mildbraedii, a shade bearer and dominant
species in the research compartment, was
consistently dominant in the unlogged forest
throughout the study. Contrary to the increase in
abundance of the non-pioneers, there was a
decline in the abundance of pioneers in all
treatments throughout the study but consistently dominant in Gap-Low (Figure 1).
Changes in Seedling Composition
The NMDS ordination resulted in a three-axis
solution explaining 78.5% of the variation in the
data structure, and with a final stress of 16.7 and
an instability of < 0.001 in 380 iterations.
Seedling abundance, composition and growth forecast in a moist tropical forest in Ghana A. Duah-Gyamfi et al.
Ghana J. Forestry, Vol. 31, 2015, 1 – 20 8
Figure 1: Changes in the proportion of seedlings
(±1S.E.) over time for pioneer, non-
pioneer light demander (NPLD) and
shade bearer (SB) in control (●), Gap-
Low (Δ), and Gap-High (*).
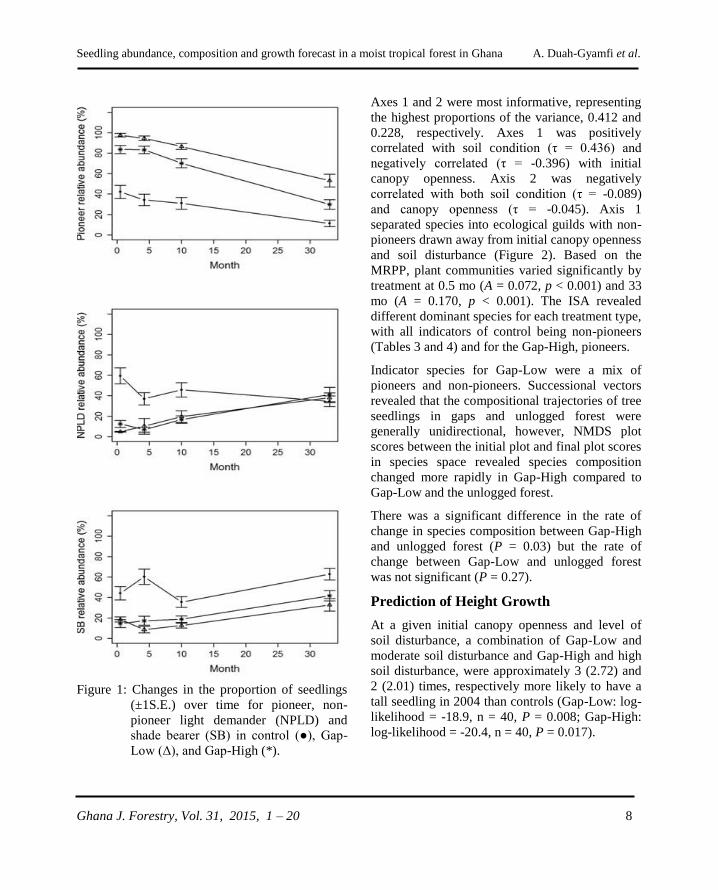
Axes 1 and 2 were most informative, representing
the highest proportions of the variance, 0.412 and
0.228, respectively. Axes 1 was positively
correlated with soil condition (τ = 0.436) and
negatively correlated (τ = -0.396) with initial
canopy openness. Axis 2 was negatively
correlated with both soil condition (τ = -0.089)
and canopy openness (τ = -0.045). Axis 1
separated species into ecological guilds with non-
pioneers drawn away from initial canopy openness
and soil disturbance (Figure 2). Based on the
MRPP, plant communities varied significantly by
treatment at 0.5 mo (A = 0.072, p < 0.001) and 33
mo (A = 0.170, p < 0.001). The ISA revealed
different dominant species for each treatment type,
with all indicators of control being non-pioneers
(Tables 3 and 4) and for the Gap-High, pioneers.
Indicator species for Gap-Low were a mix of
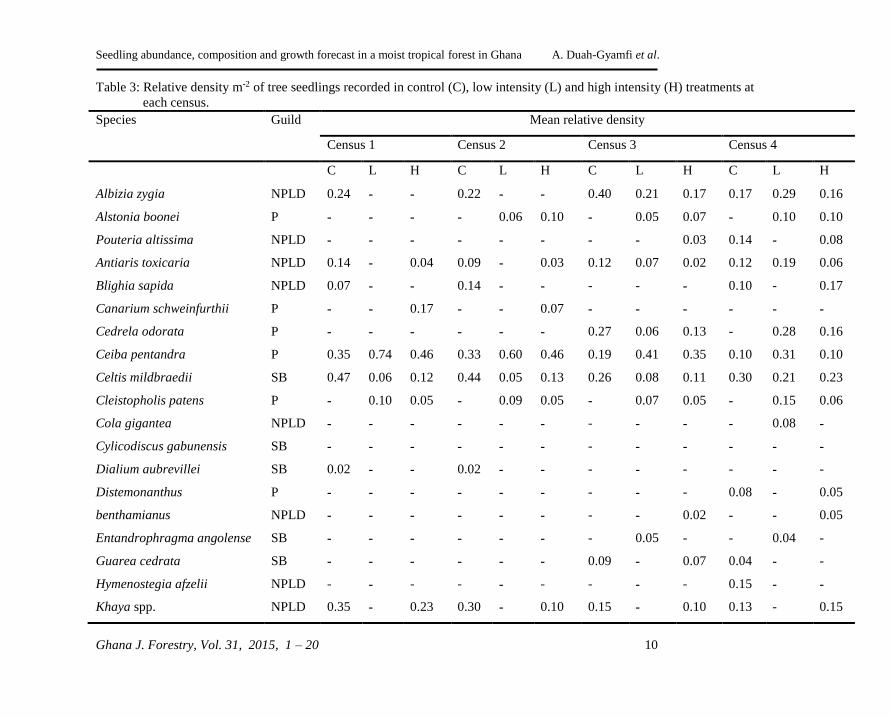
pioneers and non-pioneers. Successional vectors
revealed that the compositional trajectories of tree
seedlings in gaps and unlogged forest were
generally unidirectional, however, NMDS plot
scores between the initial plot and final plot scores
in species space revealed species composition
changed more rapidly in Gap-High compared to
Gap-Low and the unlogged forest.
There was a significant difference in the rate of
change in species composition between Gap-High
and unlogged forest (P = 0.03) but the rate of
change between Gap-Low and unlogged forest
was not significant (P = 0.27).
Prediction of Height Growth
At a given initial canopy openness and level of
soil disturbance, a combination of Gap-Low and
moderate soil disturbance and Gap-High and high
soil disturbance, were approximately 3 (2.72) and
2 (2.01) times, respectively more likely to have a
tall seedling in 2004 than controls (Gap-Low: log-
likelihood = -18.9, n = 40, P = 0.008; Gap-High:
log-likelihood = -20.4, n = 40, P = 0.017).
Seedling abundance, composition and growth forecast in a moist tropical forest in Ghana A. Duah-Gyamfi et al.
Ghana J. Forestry, Vol. 31, 2015, 1 – 20 9
Figure 2: Nonmetric multidimensional scaling (NMDS) ordination bi-plots with species scores for axis 1
plotted against axis 2 (a) and successional vectors representing trajectories of sample plots in
species space (b, c, d). Vectors indicate direction and magnitude of sample plot movement in
NMDS space between the initial and final censuses. Arrow lengths indicate magnitude of plot
movement between the initial and final censuses, an indication of relative changes in species
composition over time.
Seedling abundance, composition and growth forecast in a moist tropical forest in Ghana A. Duah-Gyamfi et al.
Ghana J. Forestry, Vol. 31, 2015, 1 – 20 10
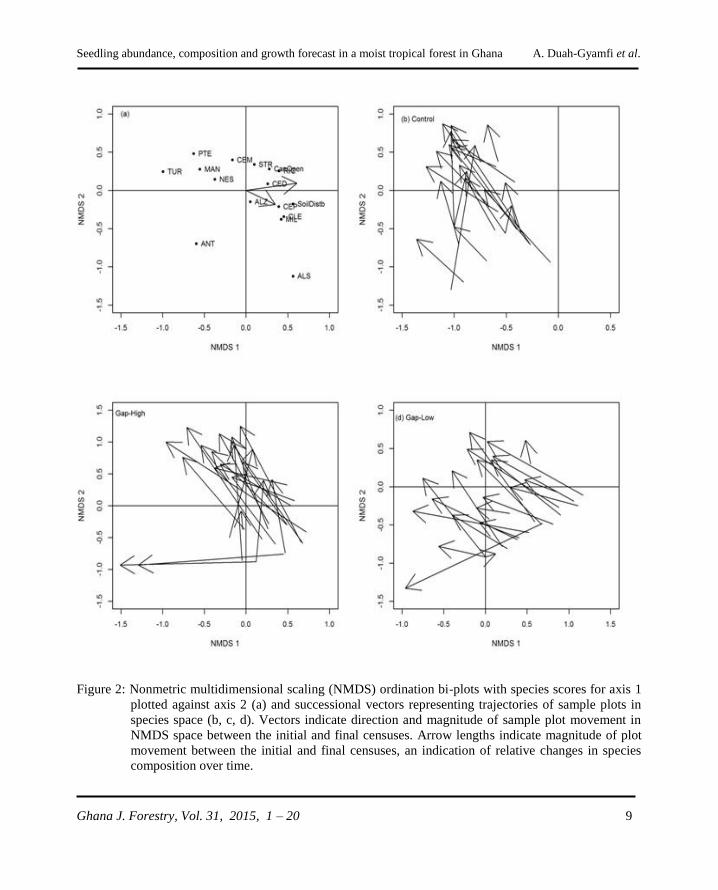
Table 3: Relative density m-2 of tree seedlings recorded in control (C), low intensity (L) and high intensity (H) treatments at
each census.
Species Guild Mean relative density
Census 1 Census 2 Census 3 Census 4
C L H C L H C L H C L H
Albizia zygia
Alstonia boonei
Pouteria altissima
Antiaris toxicaria
Blighia sapida
Canarium schweinfurthii
Cedrela odorata
Ceiba pentandra
Celtis mildbraedii
Cleistopholis patens
Cola gigantea
Cylicodiscus gabunensis
Dialium aubrevillei
Distemonanthus
benthamianus
Entandrophragma angolense
Guarea cedrata
Hymenostegia afzelii
Khaya spp.
NPLD
P
NPLD
NPLD
NPLD
P
P
P
SB
P
NPLD
SB
SB
P
NPLD
SB
SB
NPLD
NPLD
0.24
-
-
0.14
0.07
-
-
0.35
0.47
-
-
-
0.02
-
-
-
-
-
0.35
-
-
-
-
-
-
-
0.74
0.06
0.10
-
-
-
-
-
-
-
-
-
-
-
-
0.04
-
0.17
-
0.46
0.12
0.05
-
-
-
-
-
-
-
-
0.23
0.22
-
-
0.09
0.14
-
-
0.33
0.44
-
-
-
0.02
-
-
-
-
-
0.30
-
0.06
-
-
-
-
-
0.60
0.05
0.09
-
-
-
-
-
-
-
-
-
-
0.10
-
0.03
-
0.07
-
0.46
0.13
0.05
-
-
-
-
-
-
-
-
0.10
0.40
-
-
0.12
-
-
0.27
0.19
0.26
-
-
-
-
-
-
-
0.09
-
0.15
0.21
0.05
-
0.07
-
-
0.06
0.41
0.08
0.07
-
-
-
-
-
0.05
-
-
-
0.17
0.07
0.03
0.02
-
-
0.13
0.35
0.11
0.05
-
-
-
-
0.02
-
0.07
-
0.10
0.17
-
0.14
0.12
0.10
-
-
0.10
0.30
-
-
-
-
0.08
-
-
0.04
0.15
0.13
0.29
0.10
-
0.19
-
-
0.28
0.31
0.21
0.15
0.08
-
-
-
-
0.04
-
-
-
0.16
0.10
0.08
0.06
0.17
-
0.16
0.10
0.23
0.06
-
-
-
0.05
0.05
-
-
-
0.15
Seedling abundance, composition and growth forecast in a moist tropical forest in Ghana A. Duah-Gyamfi et al.
Ghana J. Forestry, Vol. 31, 2015, 1 – 20 11
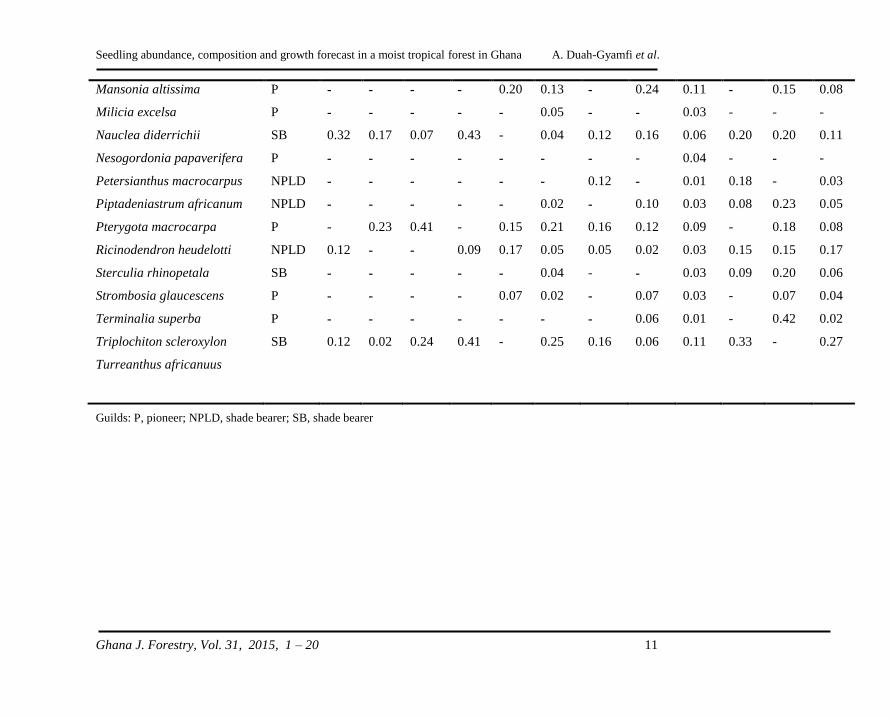
Mansonia altissima
Milicia excelsa
Nauclea diderrichii
Nesogordonia papaverifera
Petersianthus macrocarpus
Piptadeniastrum africanum
Pterygota macrocarpa
Ricinodendron heudelotti
Sterculia rhinopetala
Strombosia glaucescens
Terminalia superba
Triplochiton scleroxylon
Turreanthus africanuus
P
P
SB
P
NPLD
NPLD
P
NPLD
SB
P
P
SB
-
-
0.32
-
-
-
-
0.12
-
-
-
0.12
-
-
0.17
-
-
-
0.23
-
-
-
-
0.02
-
-
0.07
-
-
-
0.41
-
-
-
-
0.24
-
-
0.43
-
-
-
-
0.09
-
-
-
0.41
0.20
-
-
-
-
-
0.15
0.17
-
0.07
-
-
0.13
0.05
0.04
-
-
0.02
0.21
0.05
0.04
0.02
-
0.25
-
-
0.12
-
0.12
-
0.16
0.05
-
-
-
0.16
0.24
-
0.16
-
-
0.10
0.12
0.02
-
0.07
0.06
0.06
0.11
0.03
0.06
0.04
0.01
0.03
0.09
0.03
0.03
0.03
0.01
0.11
-
-
0.20
-
0.18
0.08
-
0.15
0.09
-
-
0.33
0.15
-
0.20
-
-
0.23
0.18
0.15
0.20
0.07
0.42
-
0.08
-
0.11
-
0.03
0.05
0.08
0.17
0.06
0.04
0.02
0.27
Guilds: P, pioneer; NPLD, shade bearer; SB, shade bearer
Seedling abundance, composition and growth forecast in a moist tropical forest in Ghana A. Duah-Gyamfi et al.
Ghana J. Forestry, Vol. 31, 2015, 1 – 20 12
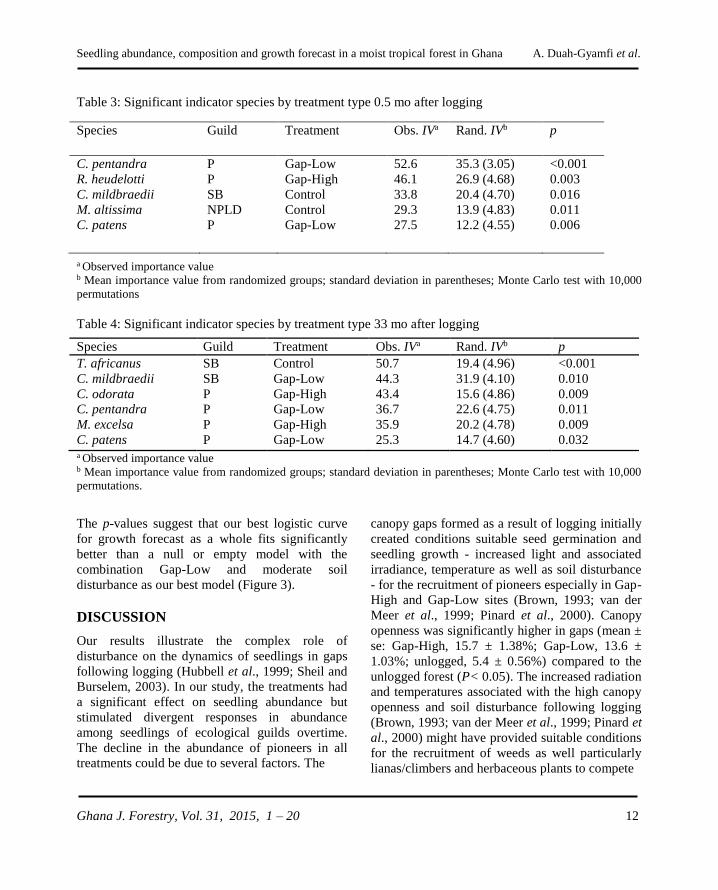
Table 3: Significant indicator species by treatment type 0.5 mo after logging
Species Guild Treatment Obs. IVa Rand. IVb p
C. pentandra
R. heudelotti
C. mildbraedii
M. altissima
C. patens
P
P
SB
NPLD
P
Gap-Low
Gap-High
Control
Control
Gap-Low
52.6
46.1
33.8
29.3
27.5
35.3 (3.05)
26.9 (4.68)
20.4 (4.70)
13.9 (4.83)
12.2 (4.55)
<0.001
0.003
0.016
0.011
0.006
a Observed importance value b Mean importance value from randomized groups; standard deviation in parentheses; Monte Carlo test with 10,000
permutations
Table 4: Significant indicator species by treatment type 33 mo after logging
Species Guild Treatment Obs. IVa Rand. IVb p
T. africanus
C. mildbraedii
C. odorata
C. pentandra
M. excelsa
C. patens
SB
SB
P
P
P
P
Control
Gap-Low
Gap-High
Gap-Low
Gap-High
Gap-Low
50.7
44.3
43.4
36.7
35.9
25.3
19.4 (4.96)
31.9 (4.10)
15.6 (4.86)
22.6 (4.75)
20.2 (4.78)
14.7 (4.60)
<0.001
0.010
0.009
0.011
0.009
0.032 a Observed importance value b Mean importance value from randomized groups; standard deviation in parentheses; Monte Carlo test with 10,000
permutations.
The p-values suggest that our best logistic curve
for growth forecast as a whole fits significantly
better than a null or empty model with the
combination Gap-Low and moderate soil
disturbance as our best model (Figure 3).
DISCUSSION
Our results illustrate the complex role of
disturbance on the dynamics of seedlings in gaps
following logging (Hubbell et al., 1999; Sheil and
Burselem, 2003). In our study, the treatments had
a significant effect on seedling abundance but
stimulated divergent responses in abundance
among seedlings of ecological guilds overtime.
The decline in the abundance of pioneers in all
treatments could be due to several factors. The
canopy gaps formed as a result of logging initially
created conditions suitable seed germination and
seedling growth - increased light and associated
irradiance, temperature as well as soil disturbance
- for the recruitment of pioneers especially in Gap-
High and Gap-Low sites (Brown, 1993; van der
Meer et al., 1999; Pinard et al., 2000). Canopy
openness was significantly higher in gaps (mean ±
se: Gap-High, 15.7 ± 1.38%; Gap-Low, 13.6 ±
1.03%; unlogged, 5.4 ± 0.56%) compared to the
unlogged forest (P< 0.05). The increased radiation
and temperatures associated with the high canopy
openness and soil disturbance following logging
(Brown, 1993; van der Meer et al., 1999; Pinard et
al., 2000) might have provided suitable conditions
for the recruitment of weeds as well particularly
lianas/climbers and herbaceous plants to compete
Seedling abundance, composition and growth forecast in a moist tropical forest in Ghana A. Duah-Gyamfi et al.
Ghana J. Forestry, Vol. 31, 2015, 1 – 20 13
for these resources with the pioneers (Schnitzer et
al., 2000; Fredericksen and Pariona, 2002).
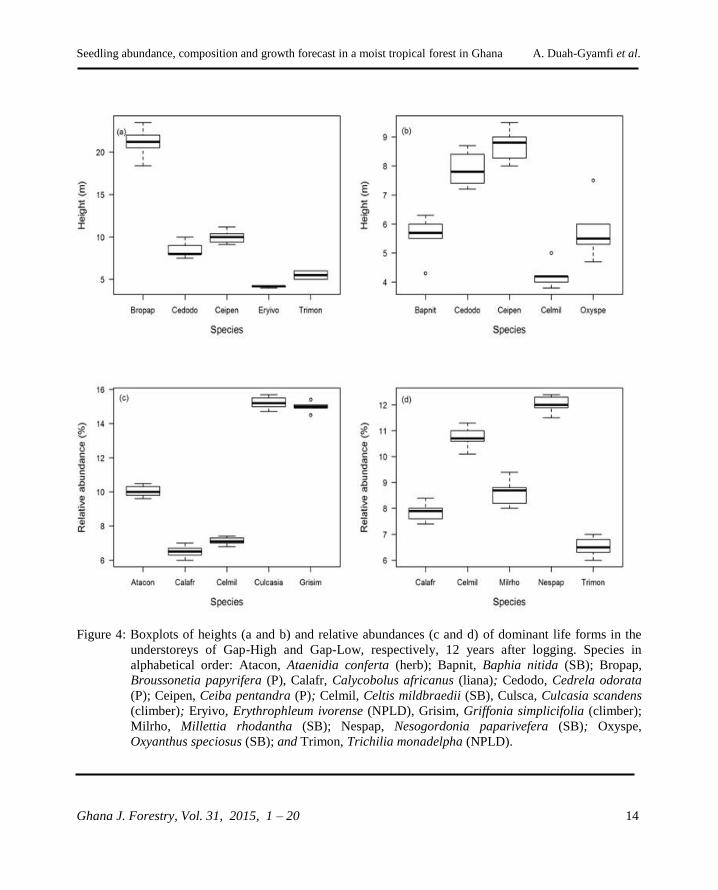
An examination of the ground layer of Gap-High
12 years after logging revealed that the most
abundant species were lianas and herbs with C.
mildbraedii being the only timber tree species
(Figure 4). In terms of plant height, two invasive
species, B. papyrifera, and C. odorata were
among the tallest/leading species in Gap-High
(Figure 4). The presence of lianas, herbs, and
invasive species in the high intensity gaps might
have produced a stiffer competition against tree
pioneers and created shade detrimental to their
survival (Swaine and Whitmore, 1988) hence their
low abundance in Gap-High compared to Gap-
Low where the dominance of weeds and lianas in
the ground layer was moderate (Figure 4). This is
in agreement with Schnitzer et al. 2004, who
reported that in Cameroon lianas recruited heavily
into logging gaps within 1 year and many survived
for longer than 6 years. Similar results were
reported by Thompson et al. (1998) who observed
an increase in density of herbs and sprouts, four
times greater in large gaps than in small and
unlogged forests few months after gap creation in
a tropical forest in Brazil.
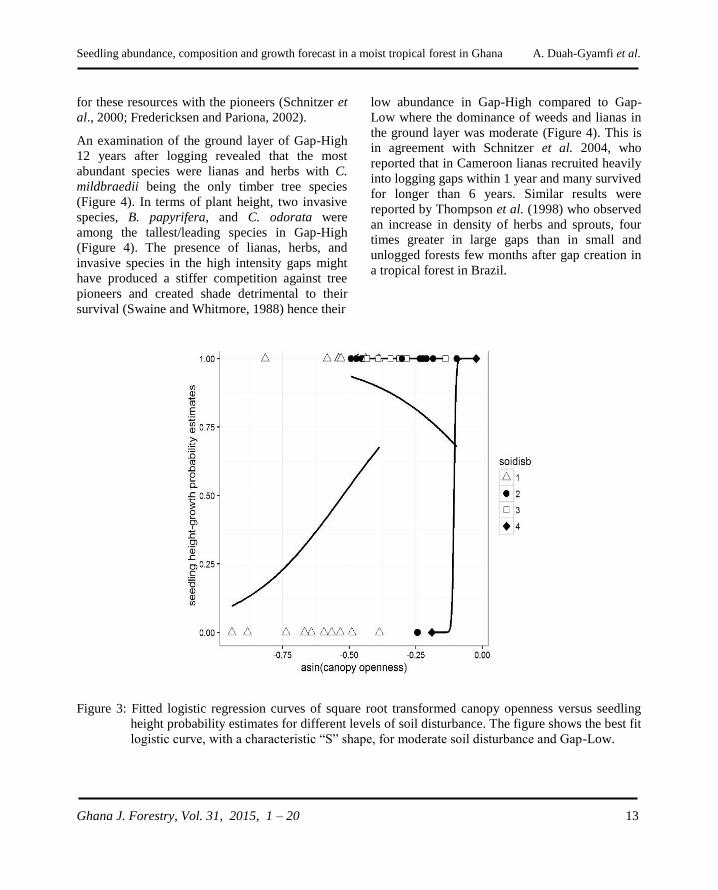
Figure 3: Fitted logistic regression curves of square root transformed canopy openness versus seedling
height probability estimates for different levels of soil disturbance. The figure shows the best fit
logistic curve, with a characteristic “S” shape, for moderate soil disturbance and Gap-Low.
Seedling abundance, composition and growth forecast in a moist tropical forest in Ghana A. Duah-Gyamfi et al.
Ghana J. Forestry, Vol. 31, 2015, 1 – 20 14
Figure 4: Boxplots of heights (a and b) and relative abundances (c and d) of dominant life forms in the
understoreys of Gap-High and Gap-Low, respectively, 12 years after logging. Species in
alphabetical order: Atacon, Ataenidia conferta (herb); Bapnit, Baphia nitida (SB); Bropap,
Broussonetia papyrifera (P), Calafr, Calycobolus africanus (liana); Cedodo, Cedrela odorata
(P); Ceipen, Ceiba pentandra (P); Celmil, Celtis mildbraedii (SB), Culsca, Culcasia scandens
(climber); Eryivo, Erythrophleum ivorense (NPLD), Grisim, Griffonia simplicifolia (climber);
Milrho, Millettia rhodantha (SB); Nespap, Nesogordonia paparivefera (SB); Oxyspe,
Oxyanthus speciosus (SB); and Trimon, Trichilia monadelpha (NPLD).
Seedling abundance, composition and growth forecast in a moist tropical forest in Ghana A. Duah-Gyamfi et al.
Ghana J. Forestry, Vol. 31, 2015, 1 – 20 15
The authors also observed that for large gaps the
number of recruits for some species was generally
low and concluded that conditions were not
favourable for their germination and establishment
because of higher light, temperatures, or soil-
surface dryness (van der Meer et al., 1999). A
similar reasoning could be espoused for the low
abundance of pioneers in Gap-High compared to
Gap-Low observed in the current study. Although,
none of the pioneers survived in the unlogged
forest throughout the study, recruitment was
evident and this concurs with the observation of
Kyereh et al. (1999) that several Ghanaian forest
trees believed to be pioneers do germinate but
soon die under forest shade. This characteristic of
pioneers could probably be due to their negative
carbon balance (Swaine et al., 1997; Kyereh et al.,
1999).
Contrary to the decline in seedling abundance
observed in pioneers, the non-pioneers slowly but
steadily increased in abundance in gaps overtime.
Whereas SBs were consistently abundant in
unlogged forest, the NPLDs switched dominance
between Gap-High and Gap-Low at different
periods of the study. Our results agree with a
study in Bia Forest Reserve (Hawthorne, 1993), in
which regeneration of most light-demanders in
selectively logged forests including NPLDs were
favored by gaps in disturbed areas compared to
unlogged forest.
The results of the present study suggest a
significant interaction only between Gap-Low and
time in the mixed-model; indeed, the model
suggests that overall abundance was slightly lower
in Gap-Low compared to control. Given the rapid
colonization of high intensity gaps by weeds and
other species coupled with the lack of silvicultural
practices following logging, then the significant
interaction between Gap-Low and time is
interesting. While this result may be encouraging,
it is unclear how long this interaction will persist
considering the increase in abundance of
herbaceous and invasive tree species which can
slow the rate of succession.
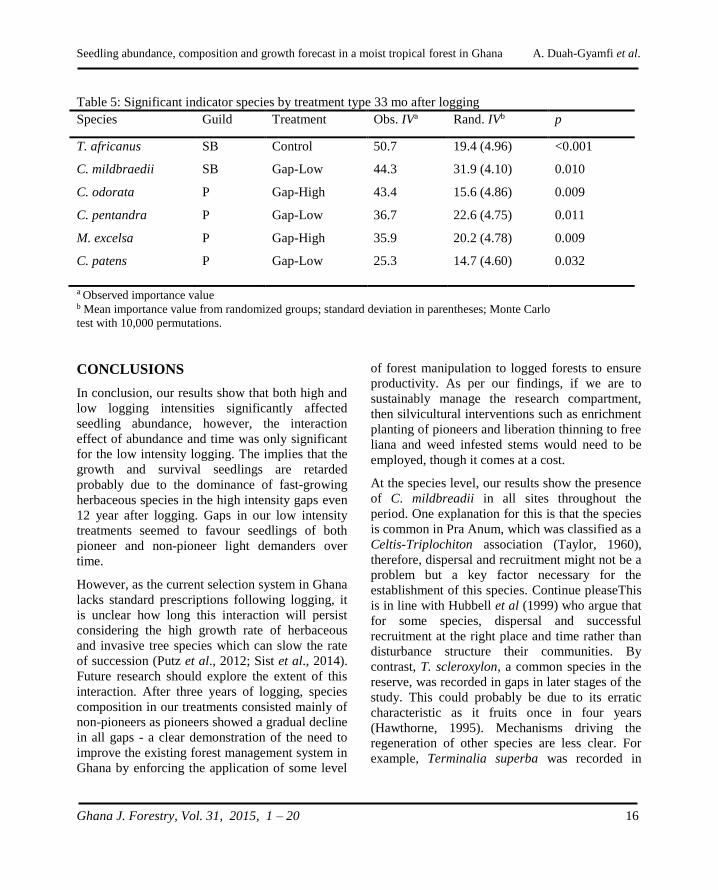
We observed a shift in the composition of the
seedling community within treatments towards
increased representation by non-pioneers (Figure
2). Despite the compositional convergence,
logging treatments were dissimilar, though not as
drastic as at 0.5 mo, due to the observed variation
in dominant species (even within an ecological
guild) among treatments. Our observation was
elucidated by the indicator species analysis within
and between treatments. For instance, at 33 mo C.
mildbraedii, a shade bearer, was an indicator
species in Gap-Low while C. odorota, a pioneer,
was dominant in Gap-High (by contrast the second
and third ranked indicator species in Gap-Low
were pioneers, C. pentandra and C. patens,
respectively (Table 5). On the basis of this result,
the study does not entirely support the notion that
species of ecological guilds are adapted to gaps of
a certain size. The observed variations within
individual species belonging to different
ecological guilds make it unlikely that a species is
best adapted to one gap size. Our finding accords
with other studies in tropical forests (Brown and
Whitmore, 1992; Kennedy and Swaine, 1992;
Thompson et al., 1998) that reported no evidence
for gap partitioning as a means of differentiation
in rain forest species.
Gaps in low intensity logging with moderate soil
disturbance represented the most likely
combination to find a seedling (≥ 55 cm). This
observation compliments the significant
interaction between Gap-Low and time. Since the
species composition of gaps was dominated by
non-pioneers at 33 mo, it was not surprising that
moderate soil disturbance fitted in our growth
forecast. We believe that growth forecast would
have been higher if silvicultural interventions had
been applied to our plots. This assertion is based
on increased growth rates of species in logged
forests following the application of silvicultural
interventions after logging (D’Oliveira, 2000).
Seedling abundance, composition and growth forecast in a moist tropical forest in Ghana A. Duah-Gyamfi et al.
Ghana J. Forestry, Vol. 31, 2015, 1 – 20 16
Table 5: Significant indicator species by treatment type 33 mo after logging
Species Guild Treatment Obs. IVa Rand. IVb p
T. africanus
C. mildbraedii
C. odorata
C. pentandra
M. excelsa
C. patens
SB
SB
P
P
P
P
Control
Gap-Low
Gap-High
Gap-Low
Gap-High
Gap-Low
50.7
44.3
43.4
36.7
35.9
25.3
19.4 (4.96)
31.9 (4.10)
15.6 (4.86)
22.6 (4.75)
20.2 (4.78)
14.7 (4.60)
<0.001
0.010
0.009
0.011
0.009
0.032
a Observed importance value b Mean importance value from randomized groups; standard deviation in parentheses; Monte Carlo
test with 10,000 permutations.
CONCLUSIONS
In conclusion, our results show that both high and
low logging intensities significantly affected
seedling abundance, however, the interaction
effect of abundance and time was only significant
for the low intensity logging. The implies that the
growth and survival seedlings are retarded
probably due to the dominance of fast-growing
herbaceous species in the high intensity gaps even
12 year after logging. Gaps in our low intensity
treatments seemed to favour seedlings of both
pioneer and non-pioneer light demanders over
time.
However, as the current selection system in Ghana
lacks standard prescriptions following logging, it
is unclear how long this interaction will persist
considering the high growth rate of herbaceous
and invasive tree species which can slow the rate
of succession (Putz et al., 2012; Sist et al., 2014).
Future research should explore the extent of this
interaction. After three years of logging, species
composition in our treatments consisted mainly of
non-pioneers as pioneers showed a gradual decline
in all gaps - a clear demonstration of the need to
improve the existing forest management system in
Ghana by enforcing the application of some level
of forest manipulation to logged forests to ensure
productivity. As per our findings, if we are to
sustainably manage the research compartment,
then silvicultural interventions such as enrichment
planting of pioneers and liberation thinning to free
liana and weed infested stems would need to be
employed, though it comes at a cost.
At the species level, our results show the presence
of C. mildbreadii in all sites throughout the
period. One explanation for this is that the species
is common in Pra Anum, which was classified as a
Celtis-Triplochiton association (Taylor, 1960),
therefore, dispersal and recruitment might not be a
problem but a key factor necessary for the
establishment of this species. Continue pleaseThis
is in line with Hubbell et al (1999) who argue that
for some species, dispersal and successful
recruitment at the right place and time rather than
disturbance structure their communities. By
contrast, T. scleroxylon, a common species in the
reserve, was recorded in gaps in later stages of the
study. This could probably be due to its erratic
characteristic as it fruits once in four years
(Hawthorne, 1995). Mechanisms driving the
regeneration of other species are less clear. For
example, Terminalia superba was recorded in
Seedling abundance, composition and growth forecast in a moist tropical forest in Ghana A. Duah-Gyamfi et al.
Ghana J. Forestry, Vol. 31, 2015, 1 – 20 17
gaps in later enumerations. This late arrival could
be due to seeds not finding suitable germination
sites, dispersal from distant sources, or decline in
population at the study area. Further studies
should be carried out on potential factors (e.g.
litter accumulation, dispersal, soil nutrients)
limiting the regeneration and establishment of
common timber species in the research
compartment.
ACKNOWLEDGEMENTS
We thank Peter Amoako, Asumadu Kwaku,
Jonathan Dabo, Vincent Berko, and Dominic
Bosompem for their assistance with fieldwork and
the CSIR–Forestry Research Institute of Ghana for
logistic support. This research was funded jointly
by the University of Aberdeen, the British
Ecological Society and Tropenbos International,
the Netherlands, under the Tropenbos-Ghana
(TBI-Ghana) Programme.
REFERENCES
Adam, K. A. (2003). Tree selection in selective
logging: ecological and silvicultural
considerations for natural forest management in
Ghana. Ph.D. Thesis, University of Aberdeen,
U.K.
Appanah, S. (1998). Management of natural
forests. In: Appanah, S. and Turnbull, J. M., eds.
A Review of Dipterocarps, Taxonomy, Ecology
and Silviculture. CIFOR, Bogor, Indonesia. pp.
133-149.
Asner, G. P., Knapp, D. E., Broadbent, E. N.,
Oliveira, P. J. C., Keller, M. and Silva, J. N. (2005). Selective logging in the Brazilian
Amazon. Science, 310:480-482.
Asner, G. P., Rudel, T. K., Aide, T. M., Defries,
R. and Emerson, R. (2009). A contemporary
assessment of change in humid tropical forests.
Conservation Biology, 23(6):1386-1395.
Brammer, H. (1962). Soils. In: Wills, J. B., ed.
Agriculture and land use in Ghana, Ministry of
Agriculture, Accra, Ghana. London, UK, Oxford
University Press. pp. 84-114.
Brokaw, N. V. L. (1985). Gap-phase regeneration
in a tropical forest. Ecology, 66:682–687.
Brown, N. D. and Whitmore, T. C. (1992). Do
dipterocarp seedlings really partition tropical rain
forest gaps? In: Marshall, A. G. and Swaine, M.
D., eds. Tropical Rain Forest: Disturbance and
Recovery. The Royal Society, London, pp. 369–
378.
Brown, N. D. (1993). The implications of climate
and gap microclimate for seedling growth
conditions in a Bornean lowland forest. Journal of
Tropical Ecology, 9:153- 168.
Burnham, K. P. and Anderson, D. R. (2002).
Model selection and multimodel inference: a
practical information-theoretic approach. 2nd ed.
Springer-Verlag, New York. 488 pp.
Chazdon, R. L. (2003). Tropical forest recovery:
legacies of human impact and natural
disturbances. Perspectives in Plant Ecology,
Evolution and Systematises, 6:51–71.
Crawley, M. J. (2013). The R book. 2nd ed. John
Wiley and Sons, Ltd. 1051 pp.
Damnyag, L., Tyynela, T., Appiah, M.,
Saastamoinen, O. and Pappinen, A. (2011).
Economic cost of deforestation in semi-deciduous
forests — A case of two forest districts in Ghana.
Ecological Economics 70:2503–2510.
Denslow, J. S. (1987). Tropical rain forest gaps
and tree species diversity. Annual Review of
Ecological Systems, 18:431–451.
D’Oliveira, M. V. N. (2000). Artificial
regeneration in gaps and skidding trails after
mechanised forest exploitation in Acre, Brazil.
Forest Ecology and Management, 127:67 – 76.
Seedling abundance, composition and growth forecast in a moist tropical forest in Ghana A. Duah-Gyamfi et al.
Ghana J. Forestry, Vol. 31, 2015, 1 – 20 18
Duah-Gyamfi, A., Swaine, E. K., Adam, K. A.,
Pinard, M. A. and Swaine, M. D. (2014a). Can
harvesting for timber in tropical forest enhance
tree regeneration? Forest Ecology and
Management, 314: 26–37.
Duah-Gyamfi, A., Kyereh, B., Adam, K. A.,
Agyeman, V. K. and Swaine, M. D. (2014b).
Natural regeneration dynamics of tree seedlings
on skid trails and tree gaps following selective
logging in a moist tropical semi-deciduous forest
in Ghana. Scientific Research: Journal of
Forestry, 4:49-57.
Dufrene, M. and Legendre, P. (1997). Species
assemblages and indicator species: the need for a
flexible asymmetrical approach. Ecological
Monographs, 67:345–366.
Food and Agriculture Organization. (2014).
Contribution of the forestry sector to national
economies, 1990-2011, by A. Lebedys and Y. Li.
Forest Finance Working Paper FSFM/ACC/09.
FAO, Rome. 156 pp. + Appendices.
Food and Agriculture Organization. (2016).
State of the World’s Forests 2016. Forests and
agriculture: land-use challenges and opportunities.
FAO, Rome. 107 pp.
Forest Inventory Project (1989). Forest
inventory project report: Pra Anum Forest
Reserve. Ghana Forestry Department, Kumasi,
Ghana and the Overseas Development
Administration, London, U.K.
Fredericksen, T. S., and Pariona, W. (2002).
Effect of skidder disturbance on commercial tree
regeneration in logging gaps in a Bolivian tropical
forest. Forest Ecology and Management 171:
223–230.
Ghana Statistical Service. (2016). Quarterly
Gross Domestic Bulletin (2008 – 2015), April
2016 edition. 29 pp.
Hall, J. B. and Swaine, M. D. (1981).
Distribution and ecology of vascular plants in a
tropical rain forest: Forest vegetation in Ghana.
Geobotany 1. Junk Publishers, The Hague. 383 pp.
Hawthorne, W. D. (1993). Forest regeneration
after logging: Findings of a study in the Bia South
Game Production Reserve, Ghana. ODA Forestry
Series No. 3. 52 pp.
Hawthorne, W. D. (1995). Ecological profiles of
Ghanaian forest trees. Tropical Forestry Papers
29. Oxford Forestry Institute, Oxford. 319 pp.
Hawthorne, W. D. and Abu-Juam, M. (1995).
Forest protection in Ghana: with particular
reference to vegetation and plant species. IUCN,
Gland, Switzerland and Cambridge, U. K. 203 pp.
Hawthorne, W. D., Sheil, D., Agyeman, V. K.,
Abu-Juam, M. and Marshall, C. A. M. (2012).
Logging scars in Ghanaian high forest: towards
improved models for sustainable production.
Forest Ecology and Management, 271:27-36.
Hendrison, J. (1990). Damage-Controlled
logging in managed rain forest in Suriname.
Ecology and management of tropical forests in
Suriname. Agricultural Univ. Wageningen. The
Netherlands. 204 pp.
Hubbell, S. P., Foster, R. B., O’Brien, S. T.,
Harms, K. E., Condit, R., Wechsler, B., Wright,
S. J. and Lao, S. L. (1999). Light-gap
disturbances, recruitment limitation, and tree
diversity in a neotropical forest. Science, 283:554-
557.
Oksanen, J., Blanchet, F. G., Kindt, R.,
Legendre, P., Minchin, R., O’Hara, R. B.,
Simpson, G. L., Solymos, P., Henry, M.,
Stevens, H. and Wagner, H. (2015). Vegan:
Community Ecology Package. R package version
2.3-0. Available from: http://CRAN.R-
project.org/package=vegan/.
Kennedy, D. N. and Swaine, M. D. (1992).
Germination and growth of colonizing species in
artificial gaps of different sizes in dipterocarp rain
forest. In: Marshall, A. G. and Swaine, M. D., eds.
Seedling abundance, composition and growth forecast in a moist tropical forest in Ghana A. Duah-Gyamfi et al.
Ghana J. Forestry, Vol. 31, 2015, 1 – 20 19
Tropical Rain Forest: Disturbance and Recovery.
The Royal Society, London. pp. 357–367.
Kyereh, B., Swaine, M. D. and Thompson, J. (1999). Effect of light on the germination of forest
trees in Ghana. Journal of Tropical Ecology,
87:772–783.
Maindonald, J. and Braun, W. J. (2012). Data
analysis and graphics using R: an example-based
approach. 3rd ed. Cambridge University Press,
New York. 525 pp.
McCune, B. and Grace, J. B. (2002). Analysis of
ecological communities. Gleneden Beach, Oregon,
U. S. A. 300 pp.
McCune, B. and Mefford, M. J. (2011). PC-
ORD multivariate analysis of ecological data,
version 6.2. MJM software, Gleneden Beach,
Oregon, U. S. A.
Medjibe, V. P., Poulsen, J. R., Clark, C. J. and
Mbani, O. A. (2014). Natural regeneration of
selected timber species in the Republic of Congo.
African Journal of Ecology, 52(4):552-563.
Neter, J., Kuther, M. H., Nachtsheim, C. J. and
Wasserman, W. (1996). Applied linear statistical
models. 4th ed. Richard D. Irwin, Chicago.
Nichols, J. D., Wagner, M. R., Agyeman, V. K.,
Bosu, P. P. and Cobbinah, J. R. (1998).
Influence of artificial gaps in tropical forest on
survival, growth, and Phytolama lata on Milicia
excelsa. Forest Ecology and Management, 110(1-
3):353-362.
Oduro, K. A., Foli, E. G., Mohren, G. M. J. and
Dumenu, W. K. (2011). Management for
sustainable forestry in other tropical countries:
Ghana. In: Werger, M. J. A., ed. Sustainable
Management of Tropical Rainforests: the CELOS
Management System. Tropenbos Series 25.
Tropenbos International, Paramaribo, Suriname.
Osho, J. S. A. (1995). Optimal sustainability
harvest models for a Nigerian tropical rain forest.
Journal of Environmental Management, 45:101-
108.
Pena-Claros, M., Peters, E. M., Justiniano, M.
J., Bongers, F., Blate, G. M., Fredericksen, T.
S. and Putz, F. E. (2008). Regeneration of
commercial tree species following silvicultural
treatments in a moist tropical forest. Forest
Ecology and Management, 255:1283–1293.
Pinard, M. A., Barker, M. G. and Tay, J. (2000). Soil disturbance and post-logging forest
recovery on bulldozer paths in Sabah, Malaysia.
Forest Ecology and Management, 130(1):213-
225.
Pinheiro, J. C. and Bates, D. M. (2000). Mixed-
effects models in S and S-PLUS. Springer, New
York.
Putz, F. E., Zuidema, P. A., Synnott, T. Pena-
Claros, M., Pinard, M., Sheil, D., Vanclay, J.
K., Sist, P., Gourlet-Fleury, S., Griscon, B.,
Palmer, J. and Zagt, R. (2012). Sustaining
conservation values in selectively logged tropical
forests: the attained and the attainable.
Conservation Letters, 5:296-303.
R Development Core Team (2015). R: A
language and environment for statistical
computing. R Foundation for Statistical Analysis.
Available from http://www.r-project.org.
Schabenberger, O. and Pierce, F. J. (2002).
Contemporary statistical models for the plant and
soil sciences. CRC Press, New York.
Schnitzer, S. A., Dalling, J. W. and Carson, W.
P. (2000). The impact of lianas on tree
regeneration in tropical forest canopy gaps:
evidence for an alternative pathway of gap-phase
regeneration. Journal of Ecology, 88:655–666.
Schnitzer, S. A., Parren, M. P. E. and Bongers,
F. (2004). Recruitment of lianas into logging gaps
and the effects of pre-harvest climber cutting in a
lowland forest in Cameroon. Forest Ecology and
Management, 190:87-98.
Seedling abundance, composition and growth forecast in a moist tropical forest in Ghana A. Duah-Gyamfi et al.
Ghana J. Forestry, Vol. 31, 2015, 1 – 20 20
Sist, P., Rutishauser, E., Pena-Claros, M.,
Shenkin, A., Herault, B., Blanc, L., Baraloto,
C., Baya, F., Benedet, F., Silva, K. E., Descroix,
L., Ferreira, J. N., Gourlet-Fleury, S., Guedes,
M. C., Harun, I. B., Jalonen, R., Kanashiro, M.,
Krisnawati, H., Kshatriya, M., Lincoln, P.,
Mazzei, L., Medjibe, V., Nasi, R., D’Oliveira,
M. V. N., D’Oliveira, L.C., Picard, N., Pietsch,
S., Pinard, M., Priyadi, H., Putz, F. E., Rodney,
K., Rossi, V., Roopsind, A., Ruschel, A. R.,
Shari, N. H. Z., Souza, C. R., Susanty, F. H.,
Sotta, E. D., Toledo, M., Vidal, E., West, T. A
.P., Wortel, V. and Yamada, T. (2014). The
tropical managed forests observatory: a research
network addressing the future of tropical logged
forests. Applied Vegetation Science, 18(1):171-
174.
Swaine, M. D., Agyeman, V. K., Kyereh, B.,
Orgle, T. K., Thompson, J. and Veenendaal, E.
M. (1997). Ecology of Forest Trees in Ghana.
ODA Forestry Series 7. University of Aberdeen,
Aberdeen, U. K.
Swaine, M. D. and Whitmore, T. C. (1988). On
the definition of ecological species groups in
tropical rain forests. Vegetation, 75(1):81-86.
Thompson, J., Scott, D. A., Fraser, P. J., Marrs,
R. H., Miller, R. P. and Viana, V. (1998). Rain
forest on Maraca Island, Roraima, Brazil: artificial
gaps and plant response to them. Forest Ecology
and Management, 102:305-321.
Van der Meer, P. J., Dignan, P. and Saveneh,
A. G. (1999). Effect of gap size on seedling
establishment, growth and survival at three years
in mountain ash (Eucalyptus regnans F. Muell.)
forest in Victoria, Australia. Forest Ecology and
Management, 117:33-42.
Werger, M. J. A. (2011). Sustainable
Management of Tropical Rainforests: the CELOS
Wickham, H. (2009). ggplot2: elegant graphics
for data analysis. Springer New York.
Zagt, R. J. (1997). Tree demography in the
tropical rain forest of Guyana. Ph.D. thesis,
Utrecht University, Utrecht, the Netherlands.
Tropenbos-Guyana Series 3, Tropenbos-Guyana
Programme, Georgetown, Guyana.Management
System. Tropenbos Series 25. Tropenbos
International, Paramaribo, Suriname. 282 pp.
Zuur, A. F., Leno, E. N. and Smith, G. M. (2007). Analyzing ecological data. Springer, New
York. 686 pp.
Zuur, A. F., leno, E. N., Walker, N. J., Savaliev,
A. A. and Smith, G. M. (2009). Mixed effects
models and extension in ecology with R. Springer,
New York. 574 pp.
Efficient survey of pests in smalholder tree plantations: Case of the CFM project in Ghana P. P. Bosu et al.
Ghana J. Forestry, Vol. 31, 2015, 21 – 33 21
METHODOLOGY FOR EFFICIENT SURVEY OF PESTS IN SMALLHOLDER
TREE PLANTATIONS: THE CASE OF THE COMMUNITY FORESTRY
MANAGEMENT PROJECT IN GHANA
P. P. Bosu, M. M. Apetorbgor and E. E. Nkrumah
CSIR-Forestry Research Institute of Ghana, University P.O. Box 63, Kumasi Ghana.
Email: [email protected]
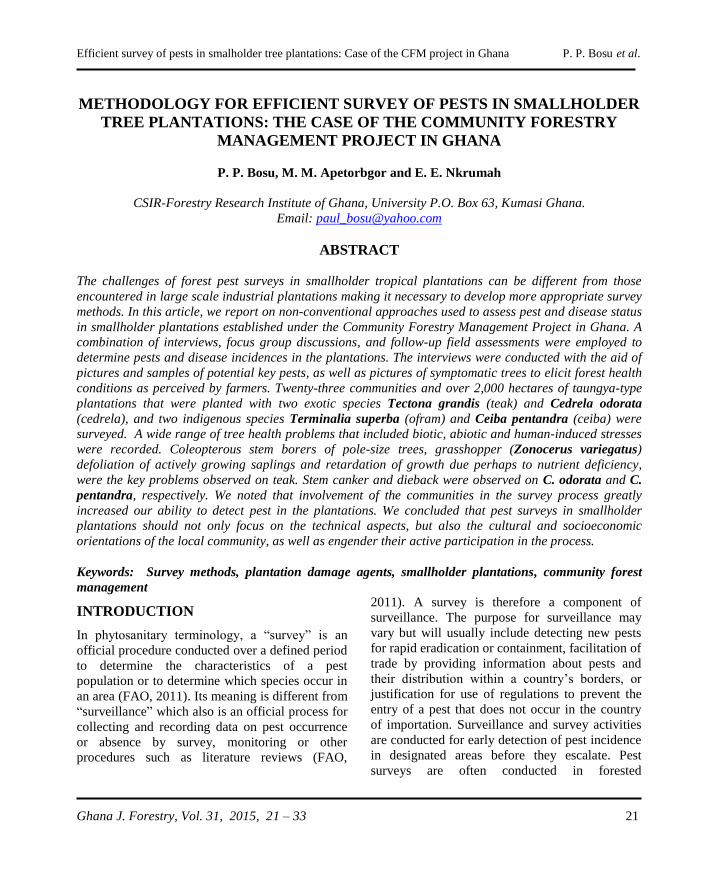
ABSTRACT
The challenges of forest pest surveys in smallholder tropical plantations can be different from those
encountered in large scale industrial plantations making it necessary to develop more appropriate survey
methods. In this article, we report on non-conventional approaches used to assess pest and disease status
in smallholder plantations established under the Community Forestry Management Project in Ghana. A
combination of interviews, focus group discussions, and follow-up field assessments were employed to
determine pests and disease incidences in the plantations. The interviews were conducted with the aid of
pictures and samples of potential key pests, as well as pictures of symptomatic trees to elicit forest health
conditions as perceived by farmers. Twenty-three communities and over 2,000 hectares of taungya-type
plantations that were planted with two exotic species Tectona grandis (teak) and Cedrela odorata
(cedrela), and two indigenous species Terminalia superba (ofram) and Ceiba pentandra (ceiba) were
surveyed. A wide range of tree health problems that included biotic, abiotic and human-induced stresses
were recorded. Coleopterous stem borers of pole-size trees, grasshopper (Zonocerus variegatus)
defoliation of actively growing saplings and retardation of growth due perhaps to nutrient deficiency,
were the key problems observed on teak. Stem canker and dieback were observed on C. odorata and C.
pentandra, respectively. We noted that involvement of the communities in the survey process greatly
increased our ability to detect pest in the plantations. We concluded that pest surveys in smallholder
plantations should not only focus on the technical aspects, but also the cultural and socioeconomic
orientations of the local community, as well as engender their active participation in the process.
Keywords: Survey methods, plantation damage agents, smallholder plantations, community forest
management
INTRODUCTION
In phytosanitary terminology, a “survey” is an
official procedure conducted over a defined period
to determine the characteristics of a pest
population or to determine which species occur in
an area (FAO, 2011). Its meaning is different from
“surveillance” which also is an official process for
collecting and recording data on pest occurrence
or absence by survey, monitoring or other
procedures such as literature reviews (FAO,
2011). A survey is therefore a component of
surveillance. The purpose for surveillance may
vary but will usually include detecting new pests
for rapid eradication or containment, facilitation of
trade by providing information about pests and
their distribution within a country’s borders, or
justification for use of regulations to prevent the
entry of a pest that does not occur in the country
of importation. Surveillance and survey activities
are conducted for early detection of pest incidence
in designated areas before they escalate. Pest
surveys are often conducted in forested
Efficient survey of pests in smalholder tree plantations: Case of the CFM project in Ghana P. P. Bosu et al.
Ghana J. Forestry, Vol. 31, 2015, 21 – 33 22
landscapes, botanic gardens, and ports to prevent
entry and spread of invasive pests.
Forest pest surveys are not routinely conducted in
Ghana. This may be largely attributed to logistical
and financial constraints. But also because
plantation forestry did not receive serious
attention in the past. As a result of persistent pest
and disease problems on high-value indigenous
species such as Milicia excelsa, Milicia regia,
Khaya ivorensis, Khaya anthotheca , Pericopsis
elata (Wagner, et al., 2008), and Terminalia
ivorensis (Ofosu-Asiedu, 1988; Ofosu-Asiedu and
Canon, 1976) attention shifted to the planting of
exotic tree species. With few pest and disease
problems, teak (Tectona grandis), cedrela
(Cedrela odorata), and various species of
Eucalyptus became the exotic species of choice
for plantation development in Ghana. Statistics
from the Forestry Commission (FC) of Ghana
indicate that teak now constitutes about 70% of
Ghana’s forest plantation estate (FC, 2013).
However, few years into the implementation of
the National Forest Plantations Development
Programme (NFPDP) which was launched in
2001, reports of pests and disease incursions of
economic proportions emerged from across the
country. Somehow, the reports included pest
incidences on teak, cedrela and other exotic
species which hitherto were rarely attacked (Bosu
and Apetorgbor, 2009). This obviously required
surveying of the plantations to better understand
the pest and disease situation before any
management interventions could be prescribed.
Ghana’s forest plantation estate was estimated at
estimated at 60,000 hectares in year 2000 (FC,
2013). According to the FC some 185,088 ha of
new plantations had been added to the plantation
estate by the end of 2014 (FC, 2015). The rapid
increase in the area under plantations in Ghana
was as a result of the implementation of the
NFPDP, which targeted the planting of some
20,000 ha annually. The objectives for
establishing the plantations were various, and
included restoration of degraded forest landscapes,
increase in wood supply in the country,
employment generation and by extension
reduction of rural poverty, improving
environmental quality, carbon sequestration and
food security improvement. The programme was
implemented under various components as per the
funding source. They include the Modified
Taungya System (MTS), Community Forestry
Management Project (CFMP), the Highly-
Indebted Poor Country Initiative (HIPC) of the
World Bank, and several others implemented by
private or quasi-private developers or the Forest
Services Division (FSD) (FC, 2013).
As expected, the sudden increase in plantation
estate resulted in the emergence of pests and
disease problems (Bosu and Apetorgbor, 2009).
While several of the pest problems encountered in
the new plantations were known, a few were
completely new to forestry in Ghana (Wagner, et
al., 2008). Identifying forest pests and disease
problems, and understanding the scale and scope
of the problems is a necessary first step towards
effective management in all situations. Thus, a
setting-up of a pest surveillance system to ensure
adequate protection against pests and diseases
became obvious. Without a history of systematic
forest pest surveillance in Ghana, and with no
existing guidelines or protocols forest pest
surveillance in the country, managers needed to
start from scratch. A complementary study
reported by Apetorgbor and Roux (2015), was
broader in scope and focused more on tree
diseases in plantations scattered throughout the
southern half of the country.
The CFMP was initiated as part of the several
national forest plantation development projects
aimed at expanding the plantation base. The
CFMP also had as one of its key objectives to
restore degraded forest reserves. As a result, the
plantations were established under collaborative
arrangements between the FSD, Ministry of Food
and Agriculture (MoFA), and farming
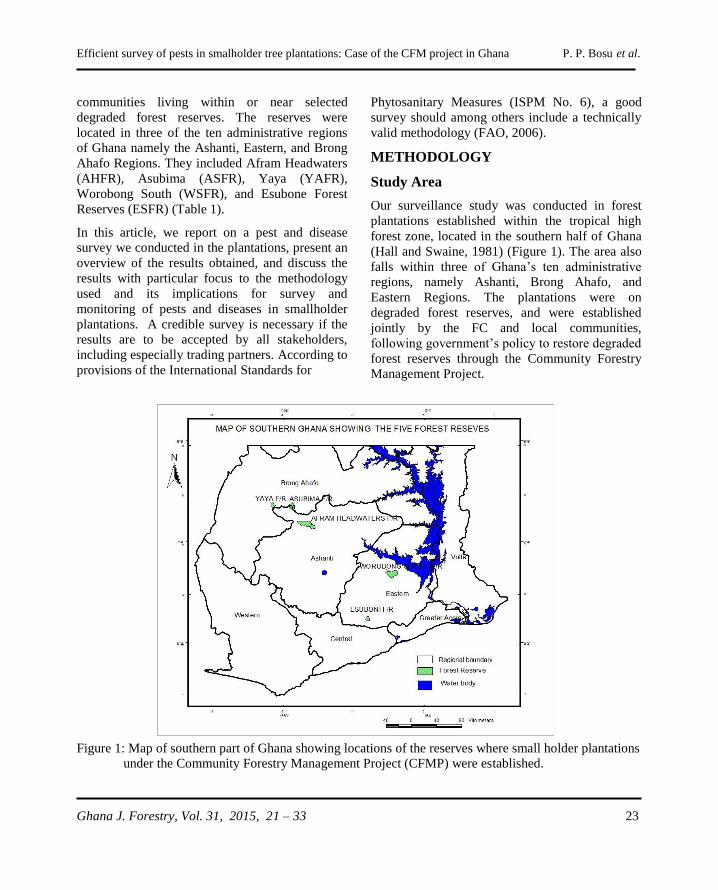
Efficient survey of pests in smalholder tree plantations: Case of the CFM project in Ghana P. P. Bosu et al.
Ghana J. Forestry, Vol. 31, 2015, 21 – 33 23
communities living within or near selected
degraded forest reserves. The reserves were
located in three of the ten administrative regions
of Ghana namely the Ashanti, Eastern, and Brong
Ahafo Regions. They included Afram Headwaters
(AHFR), Asubima (ASFR), Yaya (YAFR),
Worobong South (WSFR), and Esubone Forest
Reserves (ESFR) (Table 1).
In this article, we report on a pest and disease
survey we conducted in the plantations, present an
overview of the results obtained, and discuss the
results with particular focus to the methodology
used and its implications for survey and
monitoring of pests and diseases in smallholder
plantations. A credible survey is necessary if the
results are to be accepted by all stakeholders,
including especially trading partners. According to
provisions of the International Standards for
Phytosanitary Measures (ISPM No. 6), a good
survey should among others include a technically
valid methodology (FAO, 2006).
METHODOLOGY
Study Area
Our surveillance study was conducted in forest
plantations established within the tropical high
forest zone, located in the southern half of Ghana
(Hall and Swaine, 1981) (Figure 1). The area also
falls within three of Ghana’s ten administrative
regions, namely Ashanti, Brong Ahafo, and
Eastern Regions. The plantations were on
degraded forest reserves, and were established
jointly by the FC and local communities,
following government’s policy to restore degraded
forest reserves through the Community Forestry
Management Project.
Figure 1: Map of southern part of Ghana showing locations of the reserves where small holder plantations
under the Community Forestry Management Project (CFMP) were established.
Efficient survey of pests in smalholder tree plantations: Case of the CFM project in Ghana P. P. Bosu et al.
Ghana J. Forestry, Vol. 31, 2015, 21 – 33 24
Reconnaissance Visits
Prior to the start of the full scale monitoring
activities, reconnaissance visits were made to the
communities and plantation sites to obtain inputs
necessary for designing an appropriate survey
methodology. The visits revealed that using a
conventional survey approach would not
adequately provide information/data on the
incidence of pests and diseases in the plantations.
This was because we realized at the very
beginning that some farmers were hesitant to
engage with our team without permission by their
elders or taungya head, and it looked like it was
going to be difficult to have access to the farms.
Again, farms were small in size and in most places
scattered over the landscape so that following
conventional approaches was going to be
logistically very difficult. Thus, a new
methodology was needed. This included a
combination of interviews, focus group
discussions, field survey of plantations, and post-
survey discussion or validation with affected
plantation owners or community.
Field Survey
Communities involved in the project surrounded
the five forest reserves (AHFR, ASFR, YAFR,
WSFR, and ESFR) (Table 1). Most of the
plantations were established between 2002 and
2005, and the survey was conducted between June
2006 and October 2007. In total about 2,300 ha of
plantations, and about 23 communities were
visited. The survey team consisted of a forest
entomologist, a plant pathologist and two field
assistants. Prior to visiting each community, the
survey crew interacted with the District Manager
of the FSD for a briefing on the status of forest
plantation development and general forest health
issues in the District. Thereafter, the team moved
into the community to undertake the survey as
described below.
Interactions with Community Heads and
Farmers
On arrival in each community, the survey team
met with the chiefs, elders, assembly member(s)
(local government representative), and the leader
of the CFMP farmers group (also known as
Taungya Head), to formally inform them of the
purpose of the visit and seek their permission to
work in the communities. Such courtesy meetings
are customary in Ghana and are essential to the
successful execution of projects in rural
communities.
Table 1: List of villages involved in the Community Forestry Management Project (CFMP) visited during
the study.
Forest Reserve Communities Forest Zone
Afram Headwaters Ada Nkwanta, Akrofoa, Daban, Kwapanin Dry Semi-deciduous
Asubima Asunkwa, Atabourso I, Atabourso II,
Aworopataa, Woraso
Dry Semi-deciduous
Esuboni Kofi Dade, Nyamenti, Owusukwae, Small
London
Moist Semi-Deciduous,
South East
Worobong South Ankesu, Ayigbetown, Feyiase, Kumferi,
Mianya, Owusukrom
Moist Semi-deciduous
South East
Yaya Asuakwaa, Ayigbekrom, Mallamkorum,
Owusukrom
Dry Semi-deciduous
Efficient survey of pests in smalholder tree plantations: Case of the CFM project in Ghana P. P. Bosu et al.
Ghana J. Forestry, Vol. 31, 2015, 21 – 33 25
Focus Group Discussion
After the meeting with the chiefs and elders, an
announcement was made, usually through the
local information centre or by word of mouth, for
a town-hall style meeting with farmers involved in
the plantation project. This meeting was usually
conducted in the vernacular and facilitated by the
Taungya head. Here, the team interacted with the
tree growers asking pertinent questions on tree
pest and disease problems with the aid of a pre-
prepared checklist. The questions were structured
to capture information on the nature of plantation,
history of establishment, forest issues, nursery
pest problems, and other relevant information. In
order to help the farmers understand the
discussion, interviewers carried pictures of
plantation tree species showing symptoms and
signs of potential damage caused by insects and
diseases, as well as pictures of the insect pests
commonly associated with the planted trees. These
aids helped clarify the nature of the damage seen
and elicited farmer’s recall of past and/or current
pest problems. Information provided by farmers
was carefully recorded, including the name(s) of
farmers reporting the particular pest problem,
nature of the problem, and approximate location
of the farm(s).
Field Inspection
Once interviews were completed, a list of
potential pest problems, their locations, and
affected farmers was compiled for field
inspection. Follow-up field inspections were then
conducted, within a few days of obtaining the
information to verify and assess the claims. In
addition to the survey team, the inspection usually
included the taungya head and the farmer or
farmers who had observed symptoms in their
plantations. Where the symptoms reported were
also observed in the plantation, an assessment of
the severity of the infestation/infection was
conducted by the survey crew. The assessment
included estimates of number of plants attacked
and severity of the attacks. In addition, a quick
inspection was made of nearby plantations to
determine whether the infestation had spread.
Severity of tree damage were classified
qualitatively as minor (signs of pest or disease
attack present but no physical evidence of impact
on tree growth), moderate (signs of pest or disease
attack, with physical evidence of impact on tree
health/growth; e.g. defoliation, leaves are necrotic,
sap flow, stunted growth), severe (damage to tree
very visible, affecting 50% or more of tree; e.g.
trees heavily or completely defoliated, heavy flow
of sap/cracks, latter stages of dieback, etc), or
death of trees.
Post-field Inspection Discussion
(Validation)
Once the inspection was over, further discussion
with the farmer(s) was done to clarify any issues
that might have arisen during the assessment. The
validation phase often began in the field and was
completed within the community with as many
farmers as possible involved. Underlying causes
or predisposing factors of the attack were
discussed along with strategies on how the attack
could be controlled or managed. Here, farmers
were educated on basic principles of integrated
pest management (IPM) approaches. At least one
follow-up or monitoring visit was made to the
communities where attacks were recorded.
Summarizing the Results on Forest
Health?
The results of the study were summarized under
two main subheadings namely, the stages and
steps involved in the survey, and the data and
information on the pest/disease incidence
observed in the plantations.
RESULTS
Survey Methodology
The stages or steps involved in the present survey
may be summarized with a flow chart as shown in
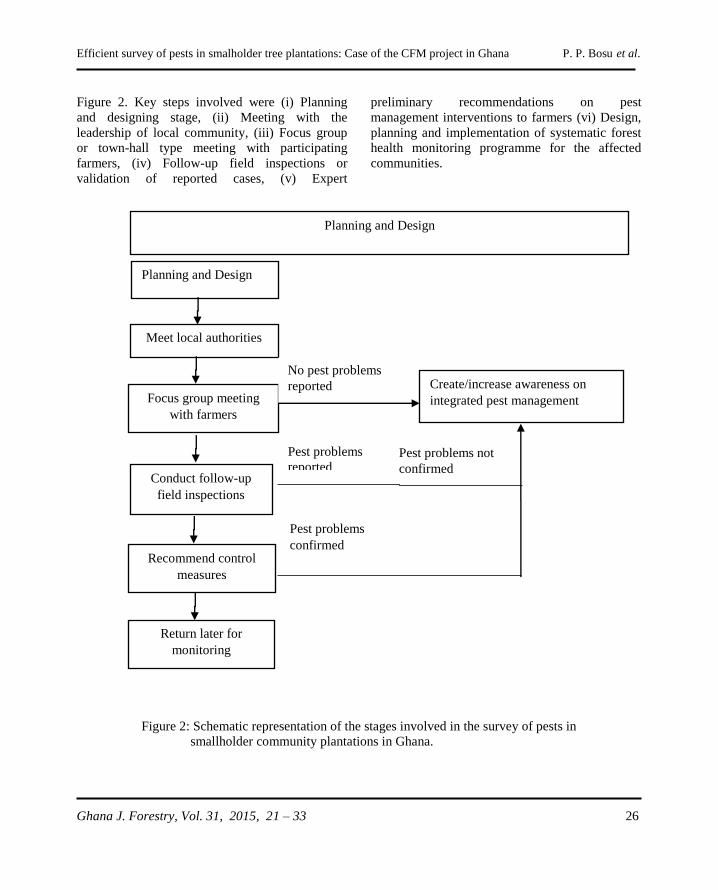
Efficient survey of pests in smalholder tree plantations: Case of the CFM project in Ghana P. P. Bosu et al.
Ghana J. Forestry, Vol. 31, 2015, 21 – 33 26
Meet local authorities
Figure 2. Key steps involved were (i) Planning
and designing stage, (ii) Meeting with the
leadership of local community, (iii) Focus group
or town-hall type meeting with participating
farmers, (iv) Follow-up field inspections or
validation of reported cases, (v) Expert
preliminary recommendations on pest
management interventions to farmers (vi) Design,
planning and implementation of systematic forest
health monitoring programme for the affected
communities.
Figure 2: Schematic representation of the stages involved in the survey of pests in
smallholder community plantations in Ghana.
Planning and Design
Planning and Design
Focus group meeting
with farmers
Conduct follow-up
field inspections
Recommend control
measures
Return later for
monitoring
No pest problems
reported Create/increase awareness on
integrated pest management
Pest problems
reported Pest problems not
confirmed
Pest problems
confirmed
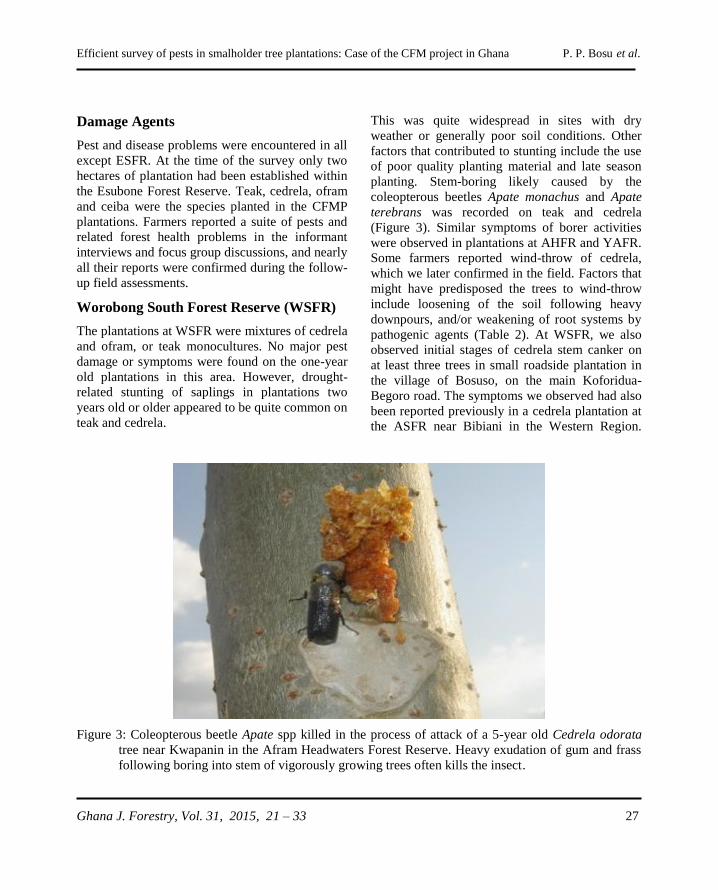
Efficient survey of pests in smalholder tree plantations: Case of the CFM project in Ghana P. P. Bosu et al.
Ghana J. Forestry, Vol. 31, 2015, 21 – 33 27
Damage Agents
Pest and disease problems were encountered in all
except ESFR. At the time of the survey only two
hectares of plantation had been established within
the Esubone Forest Reserve. Teak, cedrela, ofram
and ceiba were the species planted in the CFMP
plantations. Farmers reported a suite of pests and
related forest health problems in the informant
interviews and focus group discussions, and nearly
all their reports were confirmed during the follow-
up field assessments.
Worobong South Forest Reserve (WSFR)
The plantations at WSFR were mixtures of cedrela
and ofram, or teak monocultures. No major pest
damage or symptoms were found on the one-year
old plantations in this area. However, drought-
related stunting of saplings in plantations two
years old or older appeared to be quite common on
teak and cedrela.
This was quite widespread in sites with dry
weather or generally poor soil conditions. Other
factors that contributed to stunting include the use
of poor quality planting material and late season
planting. Stem-boring likely caused by the
coleopterous beetles Apate monachus and Apate
terebrans was recorded on teak and cedrela
(Figure 3). Similar symptoms of borer activities
were observed in plantations at AHFR and YAFR.
Some farmers reported wind-throw of cedrela,
which we later confirmed in the field. Factors that
might have predisposed the trees to wind-throw
include loosening of the soil following heavy
downpours, and/or weakening of root systems by
pathogenic agents (Table 2). At WSFR, we also
observed initial stages of cedrela stem canker on
at least three trees in small roadside plantation in
the village of Bosuso, on the main Koforidua-
Begoro road. The symptoms we observed had also
been reported previously in a cedrela plantation at
the ASFR near Bibiani in the Western Region.
Figure 3: Coleopterous beetle Apate spp killed in the process of attack of a 5-year old Cedrela odorata
tree near Kwapanin in the Afram Headwaters Forest Reserve. Heavy exudation of gum and frass
following boring into stem of vigorously growing trees often kills the insect.
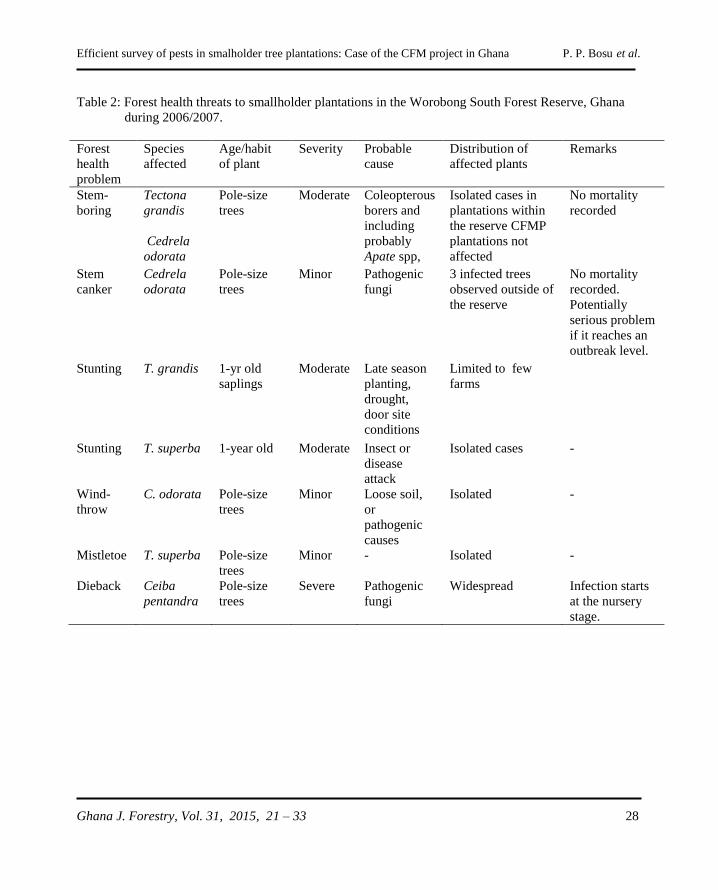
Efficient survey of pests in smalholder tree plantations: Case of the CFM project in Ghana P. P. Bosu et al.
Ghana J. Forestry, Vol. 31, 2015, 21 – 33 28
Table 2: Forest health threats to smallholder plantations in the Worobong South Forest Reserve, Ghana
during 2006/2007.
Forest
health
problem
Species
affected
Age/habit
of plant
Severity Probable
cause
Distribution of
affected plants
Remarks
Stem-
boring
Tectona
grandis
Cedrela
odorata
Pole-size
trees
Moderate Coleopterous
borers and
including
probably
Apate spp,
Isolated cases in
plantations within
the reserve CFMP
plantations not
affected
No mortality
recorded
Stem
canker
Cedrela
odorata
Pole-size
trees
Minor Pathogenic
fungi
3 infected trees
observed outside of
the reserve
No mortality
recorded.
Potentially
serious problem
if it reaches an
outbreak level.
Stunting T. grandis
1-yr old
saplings
Moderate Late season
planting,
drought,
door site
conditions
Limited to few
farms
Stunting T. superba 1-year old Moderate Insect or
disease
attack
Isolated cases -
Wind-
throw
C. odorata Pole-size
trees
Minor Loose soil,
or
pathogenic
causes
Isolated -
Mistletoe T. superba Pole-size
trees
Minor - Isolated -
Dieback Ceiba
pentandra
Pole-size
trees
Severe Pathogenic
fungi
Widespread Infection starts
at the nursery
stage.
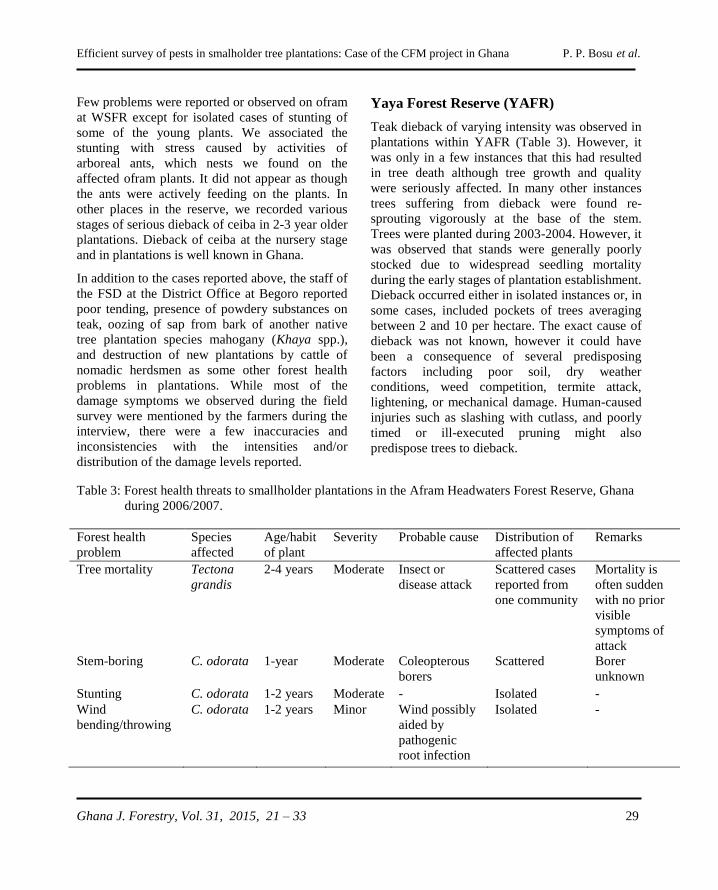
Efficient survey of pests in smalholder tree plantations: Case of the CFM project in Ghana P. P. Bosu et al.
Ghana J. Forestry, Vol. 31, 2015, 21 – 33 29
Few problems were reported or observed on ofram
at WSFR except for isolated cases of stunting of
some of the young plants. We associated the
stunting with stress caused by activities of
arboreal ants, which nests we found on the
affected ofram plants. It did not appear as though
the ants were actively feeding on the plants. In
other places in the reserve, we recorded various
stages of serious dieback of ceiba in 2-3 year older
plantations. Dieback of ceiba at the nursery stage
and in plantations is well known in Ghana.
In addition to the cases reported above, the staff of
the FSD at the District Office at Begoro reported
poor tending, presence of powdery substances on
teak, oozing of sap from bark of another native
tree plantation species mahogany (Khaya spp.),
and destruction of new plantations by cattle of
nomadic herdsmen as some other forest health
problems in plantations. While most of the
damage symptoms we observed during the field
survey were mentioned by the farmers during the
interview, there were a few inaccuracies and
inconsistencies with the intensities and/or
distribution of the damage levels reported.
Yaya Forest Reserve (YAFR)
Teak dieback of varying intensity was observed in
plantations within YAFR (Table 3). However, it
was only in a few instances that this had resulted
in tree death although tree growth and quality
were seriously affected. In many other instances
trees suffering from dieback were found re-
sprouting vigorously at the base of the stem.
Trees were planted during 2003-2004. However, it
was observed that stands were generally poorly
stocked due to widespread seedling mortality
during the early stages of plantation establishment.
Dieback occurred either in isolated instances or, in
some cases, included pockets of trees averaging
between 2 and 10 per hectare. The exact cause of
dieback was not known, however it could have
been a consequence of several predisposing
factors including poor soil, dry weather
conditions, weed competition, termite attack,
lightening, or mechanical damage. Human-caused
injuries such as slashing with cutlass, and poorly
timed or ill-executed pruning might also
predispose trees to dieback.
Table 3: Forest health threats to smallholder plantations in the Afram Headwaters Forest Reserve, Ghana
during 2006/2007.
Forest health
problem
Species
affected
Age/habit
of plant
Severity Probable cause Distribution of
affected plants
Remarks
Tree mortality Tectona
grandis
2-4 years Moderate Insect or
disease attack
Scattered cases
reported from
one community
Mortality is
often sudden
with no prior
visible
symptoms of
attack
Stem-boring C. odorata 1-year Moderate Coleopterous
borers
Scattered Borer
unknown
Stunting C. odorata 1-2 years Moderate - Isolated -
Wind
bending/throwing
C. odorata 1-2 years Minor Wind possibly
aided by
pathogenic
root infection
Isolated -
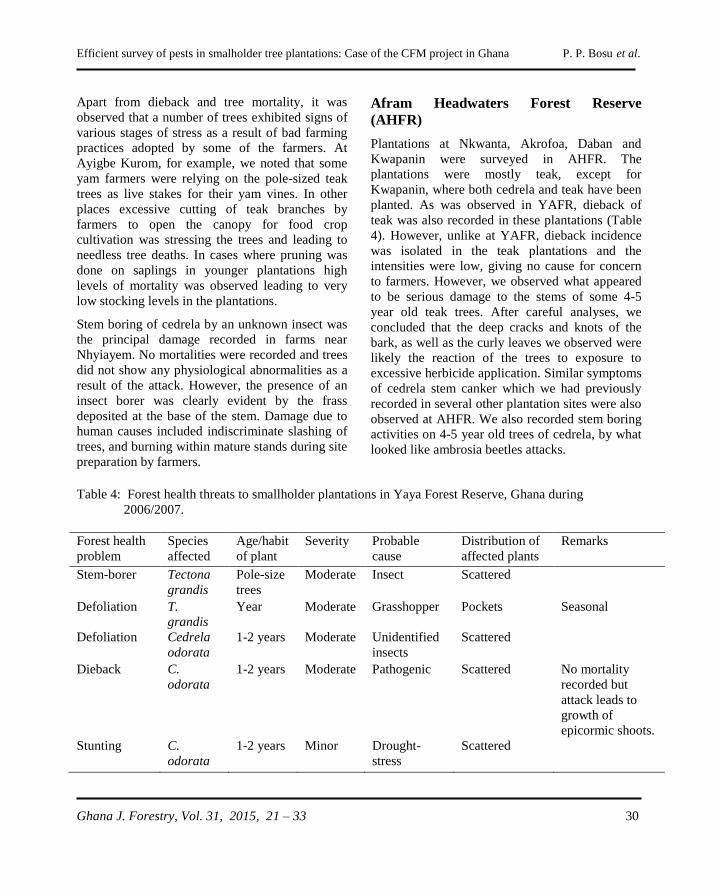
Efficient survey of pests in smalholder tree plantations: Case of the CFM project in Ghana P. P. Bosu et al.
Ghana J. Forestry, Vol. 31, 2015, 21 – 33 30
Apart from dieback and tree mortality, it was
observed that a number of trees exhibited signs of
various stages of stress as a result of bad farming
practices adopted by some of the farmers. At
Ayigbe Kurom, for example, we noted that some
yam farmers were relying on the pole-sized teak
trees as live stakes for their yam vines. In other
places excessive cutting of teak branches by
farmers to open the canopy for food crop
cultivation was stressing the trees and leading to
needless tree deaths. In cases where pruning was
done on saplings in younger plantations high
levels of mortality was observed leading to very
low stocking levels in the plantations.
Stem boring of cedrela by an unknown insect was
the principal damage recorded in farms near
Nhyiayem. No mortalities were recorded and trees
did not show any physiological abnormalities as a
result of the attack. However, the presence of an
insect borer was clearly evident by the frass
deposited at the base of the stem. Damage due to
human causes included indiscriminate slashing of
trees, and burning within mature stands during site
preparation by farmers.
Afram Headwaters Forest Reserve
(AHFR)
Plantations at Nkwanta, Akrofoa, Daban and
Kwapanin were surveyed in AHFR. The
plantations were mostly teak, except for
Kwapanin, where both cedrela and teak have been
planted. As was observed in YAFR, dieback of
teak was also recorded in these plantations (Table
4). However, unlike at YAFR, dieback incidence
was isolated in the teak plantations and the
intensities were low, giving no cause for concern
to farmers. However, we observed what appeared
to be serious damage to the stems of some 4-5
year old teak trees. After careful analyses, we
concluded that the deep cracks and knots of the
bark, as well as the curly leaves we observed were
likely the reaction of the trees to exposure to
excessive herbicide application. Similar symptoms
of cedrela stem canker which we had previously
recorded in several other plantation sites were also
observed at AHFR. We also recorded stem boring
activities on 4-5 year old trees of cedrela, by what
looked like ambrosia beetles attacks.
Table 4: Forest health threats to smallholder plantations in Yaya Forest Reserve, Ghana during
2006/2007.
Forest health
problem
Species
affected
Age/habit
of plant
Severity Probable
cause
Distribution of
affected plants
Remarks
Stem-borer Tectona
grandis
Pole-size
trees
Moderate Insect Scattered
Defoliation T.
grandis
Year Moderate Grasshopper Pockets Seasonal
Defoliation Cedrela
odorata
1-2 years Moderate Unidentified
insects
Scattered
Dieback C.
odorata
1-2 years Moderate Pathogenic Scattered No mortality
recorded but
attack leads to
growth of
epicormic shoots.
Stunting C.
odorata
1-2 years Minor Drought-
stress
Scattered
Efficient survey of pests in smalholder tree plantations: Case of the CFM project in Ghana P. P. Bosu et al.
Ghana J. Forestry, Vol. 31, 2015, 21 – 33 31
Asubima Forest Reserve (ASFR)
No serious pest problems or forest health issues
were noted in ASFR. This was because very few
plantations had been established or were readily
accessible for survey. A newly established
plantation near the village of Wuraso was poorly
stocked as a result of poor seedling survival.
From the reports of farmers during the key
informant and focus group, it was gathered that
the pest or forest health challenges in the
plantations were not too different from those in
the AHFR and YAFR.
DISCUSSION
The survey revealed several latent forest health
problems in the CFMP plantations. While the
problems could not generally be described as
serious, several including the sudden death of teak
trees, defoliation of teak seedlings, dieback of
cedrela, as well as stem canker on cedrela were of
major concern to affected farmers. Also, abiotic
factors such as drought and poor site, planting
issues such as use of poor quality planting
material and poor timing of planting, and damage
from pruning were setbacks to the efforts of some
of the communities, especially those with
plantations in dry sites (Speight and Wylie, 2001).
However, proper management backed by effective
supervision from the FSD should help mitigate
future tree damage or mortality.
The design and approach of the survey provide
useful lessons for effective surveillance of pests
and diseases in smallholder tropical plantations in
Ghana and elsewhere. Forest health challenges of
small holder plantations are obviously different
from those in large scale industrial plantations.
Firstly, plantations often start as agroforestry or
taungya systems, including both trees and food
crops. Which means that, pest problems and their
management may be more complicated than in
pure tree plantations (Schroth, et. al., 2000; Singh,
1995; Singh and Singh, 1988; Epila, 1986). It also
means that forest health experts should be familiar
with pests of commonly grown crops in order to
provide technical assistance to farmers whose
problems could be on both tree and food crops, or
possibly on food crops alone.
Secondly, as the name implies, smallholder farms
are small in size, and in our study most were less
than 2.5 ha per farmer and were mostly
established on the landscape in a mosaic pattern.
Such a situation requires that the system of survey
and monitoring adopted should be all-inclusive,
involving all farmers within a catchment area.
Such an approach helps to quickly identify any
pest problems and underlying causes. It also helps
to achieve effective and cost-efficient control, if
needed.
Thirdly, pest surveys in smallholder plantations
should be participatory. Conventional survey
approaches in large scale plantations are often
systematic and somewhat mechanical. Experts
usually set up plots or monitor the forest
systematically using ground (often with vehicles)
and/or aerial surveys (usually with light aircraft)
(Woodall, et al., 2010; Speight and Wylie, 2001).
They are usually aided by sophisticated data
recording and photographic equipment, with very
little if any non-expert involvement. Such a
system cannot be applied to small holder
plantations, especially in developing countries
where resources are limited. As can be seen from
our study, involvement of local authorities,
farmers, and opinion leaders was critical in
obtaining results. Otherwise, access to the
plantations alone could have been a challenge to
survey crew.
Fourthly, effective surveillance in smallholder
plantations should be done concurrently with
technical assistance for the control/management of
the affected plantations. It should also include
awareness and education on integrated pest
management (IPM) strategies in the communities.
Farmers’ commitment to tree planting projects is
often low and therefore they need to be
Efficient survey of pests in smalholder tree plantations: Case of the CFM project in Ghana P. P. Bosu et al.
Ghana J. Forestry, Vol. 31, 2015, 21 – 33 32
encouraged and motivated continually to sustain
their interest. Any serious pest outbreak left
unattended, to the point of threatening the
plantations, or the time or resources invested by
the farmer can lead to abandonment of the project.
Finally, FHM programme in smallholder
plantations should be amenable to the local
situation. It is important to first consider the
prevailing condition in the locality in order to
design the survey approach. In the present study,
plantations were established in degraded forest
reserves by adjoining communities. In addition to
land for planting, the farmers were organized by
the Forest Plantations Development Centre, and
given logistical, financial and technical assistance
to undertake the project. Again, they were
organized into groups to facilitate the process of
project monitoring and evaluation. It was therefore
relatively easy to gain access to the communities,
the farmers, their farms and relevant information.
This may not necessarily be the same in other
situations. Thus, it is essential that analysis is done
before the initiation of survey programme in
smallholder plantations in the tropics.
CONCLUSION
The conditions under which this study was
conducted contributed greatly to the outcome
obtained. The CFMP project was a donor-funded
project being implemented by the FC so the
circumstances under which farmers were
operating were different from normal. Farmers
were given access to degraded portions of the
forest reserves for cultivation. In addition, they
received financial, logistical and technical
assistance from the FC to motivate them to
undertake the taungya activities. Also, the taungya
conditions were modified from what pertained in
the past, where farmers were allowed to grow their
crops and tend the trees for a few years, after
which they were ejected when the tree canopy
closed. Under the present modified taungya
system, farmers were required to continue with the
maintenance of the plantations even when they
stopped crop cultivation until the trees matured.
According to the new benefit sharing scheme
under the MTS, farmers are then entitled to 40%
of the proceeds from the trees at the end of the
rotation. Such a system was is a strong motivation
for farmers to commit to the project and
collaborate/ support any moves that appear to
increase the success of the project. The support
and commitment received by the project team
might not necessarily be the same if farmers were
working on their own accord, outside of the forest
reserves, and without any form of technical or
logistical support.
This study has shown that surveillance of pest
status in smallholder tropical plantations should
not only focus on the technical aspects, but should
be amenable to suit the local cultural and
socioeconomic conditions. Such a system should
also be designed to concurrently advice farmers on
how to control the observed pest problems, as well
as education and creation of awareness on IPM
strategies.
ACKNOWLEDGEMENT
Funds for the study were provided by the National
Forest Plantation Development Programme
(NFPDP), under the Community Reforestation
Programme On-farm Research Project of the
Ministry of Lands and Natural Resources, Ghana.
The authors wish to thank Dr. Victor K. Agyeman,
Director-General of the Council for Scientific and
Industrial Research (CSIR), formerly Director
(CSIR-Forestry Research Institute of Ghana,
FORIG) and Manager of NFPDP. Gratitude also
goes to Dr. Ernest G. Foli, who was the
Coordinator of the CFMP On-farm Research
Project at CSIR-FORIG and several anonymous
reviewers.
REFERENCES
Apetorgbor M. M. and Roux, J. (2015).
Efficient survey of pests in smalholder tree plantations: Case of the CFM project in Ghana P. P. Bosu et al.
Ghana J. Forestry, Vol. 31, 2015, 21 – 33 33
Diseases of plantation forestry trees in southern
Ghana. International Journal of Phytopathology,
04 (01): 5-13.
Bosu, P. P. and Apetorgbor, M. M. (2009).
Rising pest problems in forest plantations in
Ghana. Forestry Research Institute of Ghana.
Technical Note No. 2. 9pp.
Epila, J. S. O. (1986). The Case for Insect Pest
Management in Agroforestry Research. Journal
Agricultural Systems, 19: 37-54.
FAO (2011). Guide to implementation of
phytosanitary standards in forestry. FAO Forestry
Paper 164. Rome. 165pp.
FAO (2006). Guidelines for surveillance (2007).
International Standards for Phytosanitary
Measures (ISPM No. 6). 8pp.
Forestry Commission (2013). Draft Ghana
National Forest Plantation Development Strategy,
2015-2040.
Forestry Commission (2015). National Forest
Plantation Development Project, Ghana. 2014
Annual Report. 47pp.
Forestry Commission (2007). Ghana Forestry
Commission, Annual Report, Accra.
Hall, J. B. and Swaine, M. D. (1981).
Distribution and Ecology of Vascular Plants in a
Tropical Rain Forest: Forest Vegetation of Ghana.
W. Junk Publishers. The Hague. 383pp.
Ofosu-Asiedu, A. (1988). Some destructive
diseases of tree crops in Africa, South of the
Sahara. Paper read at 5th ICPP Meeting 20-27
August 1988. Kyoto, Japan.
Ofosu-Asiedu, A. and Cannon, P. (1976).
Terminalia ivorensis decline in Ghana. Pest
Articles and News Summaries, 22(2): 239-242.
Schroth, G., Krauss, U., Gasparotto, L., Duarte
Aguilar, J. A. and Vohland, K. (2000). Pests
and diseases in agroforestry systems of the humid
tropics. Agroforestry Systems, 50: 199–241, 2000.
Singh, P. and Singh S. (1987). Pest and pathogen
management in agroforestry systems. In:Khosla
P.K. and Khurana D.K. eds. Agroforestry for rural
needs. Solan: Indian Society of Tree Scientists.
Speight, M. R. and Wylie, F. R. (2001). Insect
pests in tropical forestry. 1st edition. CAB
International, Wallingford, UK. 307 pp.
Wagner, M.R., Cobbinah, J.R. and Bosu, P.P.
(2008). Forest Entomology in West Tropical
Africa: Forest Insects of Ghana. 2nd Edition.
Springer. The Netherlands. 244pp.
Woodall, C.W., Amacher, M.C., Bechtold,
W.A., Coulston, J.W., Jovan, S. Perry, C.H.,
Randolph, K.C. K., Schulz, B.K., Smith, G.C.,
Tkacz, B., and Will-Wolf, S. (2011). Status and
future of the forest health indicators program of
the USA. Environmental Monitoring and
Assessment, 177 (1-4):419-436.
Significance of medicinal plants in a valley rice growing eco-system (Sawah) E. Nutakor
Ghana J. Forestry, Vol. 31, 2015, 34 – 44 34
THE SIGNIFICANCE OF MEDICINAL PLANTS IN A VALLEY RICE
GROWING ECOSYSTEM (SAWAH): THE CASE OF AHAFO-ANO SOUTH
DISTRICT, GHANA.
E. Nutakor
CSIR-Forestry Research Institute of Ghana, University P.O. Box 63, KNUST, Kumasi, Ghana
Email:[email protected]
ABSTRACT
The technology for wet valley rice production or Sawah, has gained increased popularity in Ghana as it
holds promise for improved food production and poverty reduction. However, there is concern that this
system could have negative implications for wetland ecosystems especially in the provision of medicinal
plants (MPs) for human health. The study identified medicinal plants and their utilization by local people
in 3 Sawah pilot communities in Ahafo-Ano South District, Ghana. It assessed their perceptions of the
Sawah system in relation to distribution, diversity and availability of medicinal plants in the ecosystem.
Data was collected using participatory research approach. In terms of distribution and diversity of MPs,
the results revealed that, out of 84 different plant species mentioned, 48% were found in the Sawah
system, while 61%, 38% and 30% were in upland farms, forests and homesteads/gardens, respectively.
The Sawah system was ranked (perceived as) second in the availability of medicinal plants by 32% of
respondents compared to other land use types such as farms (39%); forest (17%) and homestead/gardens
(12%). Availability of MPs varied across land use types with farms and homesteads/gardens having the
highest mean availability indices of 2.64 and 2.36 respectively with the Sawah system ranking slightly
above forest lands with least availability index. The MPs are generally on the decline in the ecosystem,
thus there would be the need for interventions to conserve them in the ecosystem.
Keywords: Medicinal plants, wet valley rice production system, Sawah, perception, utilization.
INTRODUCTION
“Sawah” (Indonesian term for wet rice-field) is an
inland valley rice production technology used in
lowland areas where rice fields are bunded and
leveled with inlet and outlet for irrigation and
drainage. Sawah system is gaining increasing
popularity in Ghana due to its associated increased
production output compared to the traditional
upland systems (Oladele and Wakatsuki, 2010;
Wakatsuki, et al., 1998; Obeng, 1994). Rice
productivity analysis of rice production in Ghana
shows that the Sawah technology increased output
from 1.0 t/ha under traditional system to over 5
t/ha under the “Sawah” system (Buri et al., 2008;
Buri et al., 2012). Thus, Sawah (wet valley rice
production) is considered as a promising
sustainable rice production system that addresses
Ghana’s domestic rice demand, huge rice imports,
quest to increase rice productivity and ensure food
security (Alarima et al., 2013). Besides, the Sawah
system is perceived to conserve and enhance
wetland ecosystem services (Oladele and
Wakatsuki, 2010). Generally, 15% of rice growing
areas and 68% of irrigated rice areas practice the
Sawah system (Ragasa et al., 2013). The current
rate of diffusion is said to be limited (ranked third
in terms of rice management practices in Ghana)
compared Asia (Ragasa et al., 2013). However, to
improve the adoption and diffusion of Sawah rice
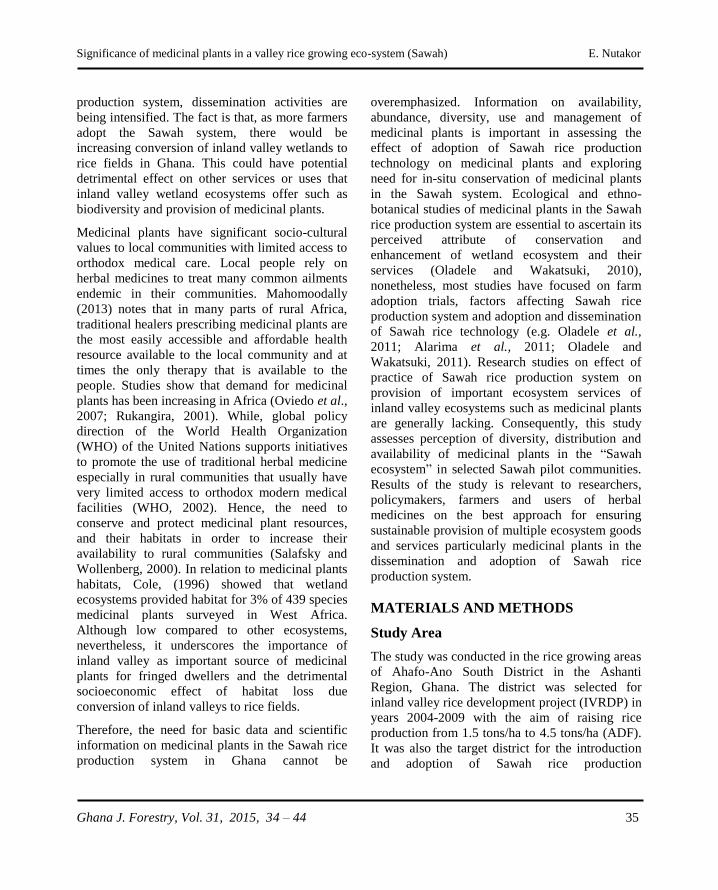
Significance of medicinal plants in a valley rice growing eco-system (Sawah) E. Nutakor
Ghana J. Forestry, Vol. 31, 2015, 34 – 44 35
production system, dissemination activities are
being intensified. The fact is that, as more farmers
adopt the Sawah system, there would be
increasing conversion of inland valley wetlands to
rice fields in Ghana. This could have potential
detrimental effect on other services or uses that
inland valley wetland ecosystems offer such as
biodiversity and provision of medicinal plants.
Medicinal plants have significant socio-cultural
values to local communities with limited access to
orthodox medical care. Local people rely on
herbal medicines to treat many common ailments
endemic in their communities. Mahomoodally
(2013) notes that in many parts of rural Africa,
traditional healers prescribing medicinal plants are
the most easily accessible and affordable health
resource available to the local community and at
times the only therapy that is available to the
people. Studies show that demand for medicinal
plants has been increasing in Africa (Oviedo et al.,
2007; Rukangira, 2001). While, global policy
direction of the World Health Organization
(WHO) of the United Nations supports initiatives
to promote the use of traditional herbal medicine
especially in rural communities that usually have
very limited access to orthodox modern medical
facilities (WHO, 2002). Hence, the need to
conserve and protect medicinal plant resources,
and their habitats in order to increase their
availability to rural communities (Salafsky and
Wollenberg, 2000). In relation to medicinal plants
habitats, Cole, (1996) showed that wetland
ecosystems provided habitat for 3% of 439 species
medicinal plants surveyed in West Africa.
Although low compared to other ecosystems,
nevertheless, it underscores the importance of
inland valley as important source of medicinal
plants for fringed dwellers and the detrimental
socioeconomic effect of habitat loss due
conversion of inland valleys to rice fields.
Therefore, the need for basic data and scientific
information on medicinal plants in the Sawah rice
production system in Ghana cannot be
overemphasized. Information on availability,
abundance, diversity, use and management of
medicinal plants is important in assessing the
effect of adoption of Sawah rice production
technology on medicinal plants and exploring
need for in-situ conservation of medicinal plants
in the Sawah system. Ecological and ethno-
botanical studies of medicinal plants in the Sawah
rice production system are essential to ascertain its
perceived attribute of conservation and
enhancement of wetland ecosystem and their
services (Oladele and Wakatsuki, 2010),
nonetheless, most studies have focused on farm
adoption trials, factors affecting Sawah rice
production system and adoption and dissemination
of Sawah rice technology (e.g. Oladele et al.,
2011; Alarima et al., 2011; Oladele and
Wakatsuki, 2011). Research studies on effect of
practice of Sawah rice production system on
provision of important ecosystem services of
inland valley ecosystems such as medicinal plants
are generally lacking. Consequently, this study
assesses perception of diversity, distribution and
availability of medicinal plants in the “Sawah
ecosystem” in selected Sawah pilot communities.
Results of the study is relevant to researchers,
policymakers, farmers and users of herbal
medicines on the best approach for ensuring
sustainable provision of multiple ecosystem goods
and services particularly medicinal plants in the
dissemination and adoption of Sawah rice
production system.
MATERIALS AND METHODS
Study Area
The study was conducted in the rice growing areas
of Ahafo-Ano South District in the Ashanti
Region, Ghana. The district was selected for
inland valley rice development project (IVRDP) in
years 2004-2009 with the aim of raising rice
production from 1.5 tons/ha to 4.5 tons/ha (ADF).
It was also the target district for the introduction
and adoption of Sawah rice production
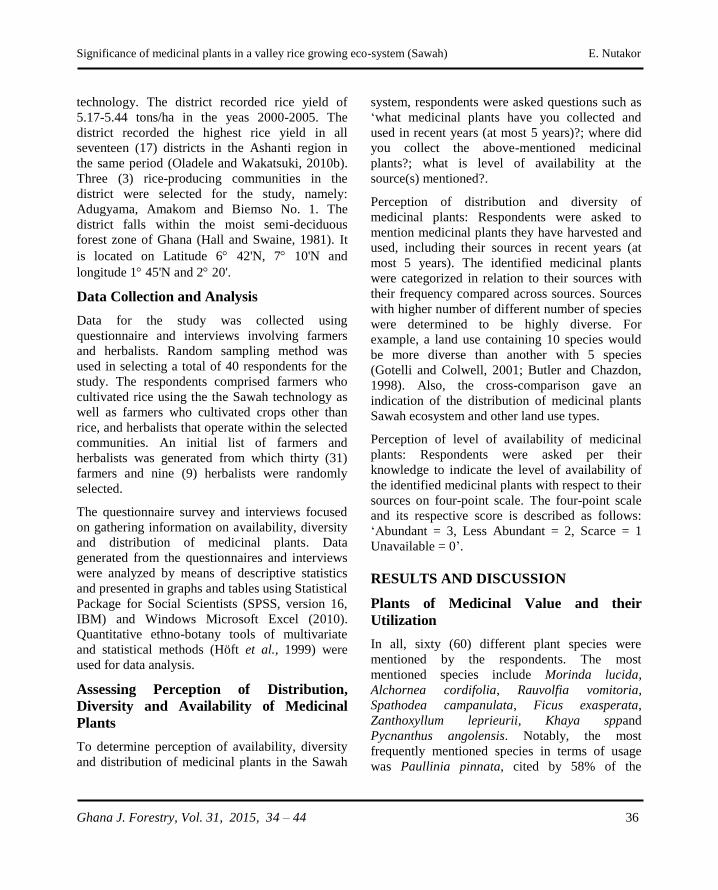
Significance of medicinal plants in a valley rice growing eco-system (Sawah) E. Nutakor
Ghana J. Forestry, Vol. 31, 2015, 34 – 44 36
technology. The district recorded rice yield of
5.17-5.44 tons/ha in the yeas 2000-2005. The
district recorded the highest rice yield in all
seventeen (17) districts in the Ashanti region in
the same period (Oladele and Wakatsuki, 2010b).
Three (3) rice-producing communities in the
district were selected for the study, namely:
Adugyama, Amakom and Biemso No. 1. The
district falls within the moist semi-deciduous
forest zone of Ghana (Hall and Swaine, 1981). It
is located on Latitude 6 42'N, 7 10'N and
longitude 1 45'N and 2 20'.
Data Collection and Analysis
Data for the study was collected using
questionnaire and interviews involving farmers
and herbalists. Random sampling method was
used in selecting a total of 40 respondents for the
study. The respondents comprised farmers who
cultivated rice using the the Sawah technology as
well as farmers who cultivated crops other than
rice, and herbalists that operate within the selected
communities. An initial list of farmers and
herbalists was generated from which thirty (31)
farmers and nine (9) herbalists were randomly
selected.
The questionnaire survey and interviews focused
on gathering information on availability, diversity
and distribution of medicinal plants. Data
generated from the questionnaires and interviews
were analyzed by means of descriptive statistics
and presented in graphs and tables using Statistical
Package for Social Scientists (SPSS, version 16,
IBM) and Windows Microsoft Excel (2010).
Quantitative ethno-botany tools of multivariate
and statistical methods (Höft et al., 1999) were
used for data analysis.
Assessing Perception of Distribution,
Diversity and Availability of Medicinal
Plants
To determine perception of availability, diversity
and distribution of medicinal plants in the Sawah
system, respondents were asked questions such as
‘what medicinal plants have you collected and
used in recent years (at most 5 years)?; where did
you collect the above-mentioned medicinal
plants?; what is level of availability at the
source(s) mentioned?.
Perception of distribution and diversity of
medicinal plants: Respondents were asked to
mention medicinal plants they have harvested and
used, including their sources in recent years (at
most 5 years). The identified medicinal plants
were categorized in relation to their sources with
their frequency compared across sources. Sources
with higher number of different number of species
were determined to be highly diverse. For
example, a land use containing 10 species would
be more diverse than another with 5 species
(Gotelli and Colwell, 2001; Butler and Chazdon,
1998). Also, the cross-comparison gave an
indication of the distribution of medicinal plants
Sawah ecosystem and other land use types.
Perception of level of availability of medicinal
plants: Respondents were asked per their
knowledge to indicate the level of availability of
the identified medicinal plants with respect to their
sources on four-point scale. The four-point scale
and its respective score is described as follows:
‘Abundant = 3, Less Abundant = 2, Scarce = 1
Unavailable = 0’.
RESULTS AND DISCUSSION
Plants of Medicinal Value and their
Utilization
In all, sixty (60) different plant species were
mentioned by the respondents. The most
mentioned species include Morinda lucida,
Alchornea cordifolia, Rauvolfia vomitoria,
Spathodea campanulata, Ficus exasperata,
Zanthoxyllum leprieurii, Khaya sppand
Pycnanthus angolensis. Notably, the most
frequently mentioned species in terms of usage
was Paullinia pinnata, cited by 58% of the
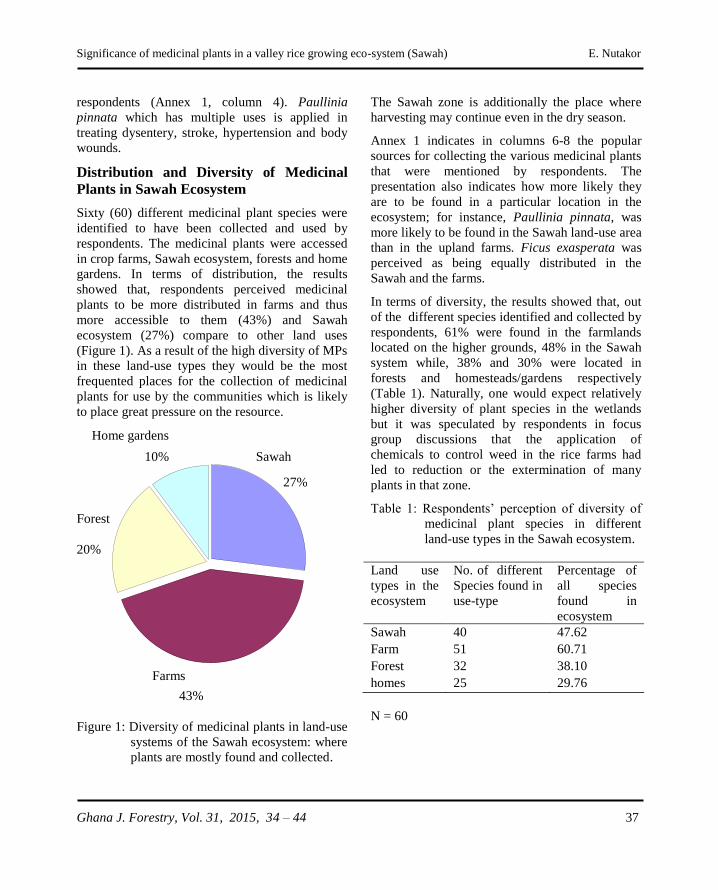
Significance of medicinal plants in a valley rice growing eco-system (Sawah) E. Nutakor
Ghana J. Forestry, Vol. 31, 2015, 34 – 44 37
respondents (Annex 1, column 4). Paullinia
pinnata which has multiple uses is applied in
treating dysentery, stroke, hypertension and body
wounds.
Distribution and Diversity of Medicinal
Plants in Sawah Ecosystem
Sixty (60) different medicinal plant species were
identified to have been collected and used by
respondents. The medicinal plants were accessed
in crop farms, Sawah ecosystem, forests and home
gardens. In terms of distribution, the results
showed that, respondents perceived medicinal
plants to be more distributed in farms and thus
more accessible to them (43%) and Sawah
ecosystem (27%) compare to other land uses
(Figure 1). As a result of the high diversity of MPs
in these land-use types they would be the most
frequented places for the collection of medicinal
plants for use by the communities which is likely
to place great pressure on the resource.
Figure 1: Diversity of medicinal plants in land-use
systems of the Sawah ecosystem: where
plants are mostly found and collected.
The Sawah zone is additionally the place where
harvesting may continue even in the dry season.
Annex 1 indicates in columns 6-8 the popular
sources for collecting the various medicinal plants
that were mentioned by respondents. The
presentation also indicates how more likely they
are to be found in a particular location in the
ecosystem; for instance, Paullinia pinnata, was
more likely to be found in the Sawah land-use area
than in the upland farms. Ficus exasperata was
perceived as being equally distributed in the
Sawah and the farms.
In terms of diversity, the results showed that, out
of the different species identified and collected by
respondents, 61% were found in the farmlands
located on the higher grounds, 48% in the Sawah
system while, 38% and 30% were located in
forests and homesteads/gardens respectively
(Table 1). Naturally, one would expect relatively
higher diversity of plant species in the wetlands
but it was speculated by respondents in focus
group discussions that the application of
chemicals to control weed in the rice farms had
led to reduction or the extermination of many
plants in that zone.
Table 1: Respondents’ perception of diversity of
medicinal plant species in different
land-use types in the Sawah ecosystem.
Land use
types in the
ecosystem
No. of different
Species found in
use-type
Percentage of
all species
found in
ecosystem
Sawah 40 47.62
Farm 51 60.71
Forest 32 38.10
homes 25 29.76
N = 60
Sawah
27%
Farms
43%
Forest
20%
Home gardens
10%
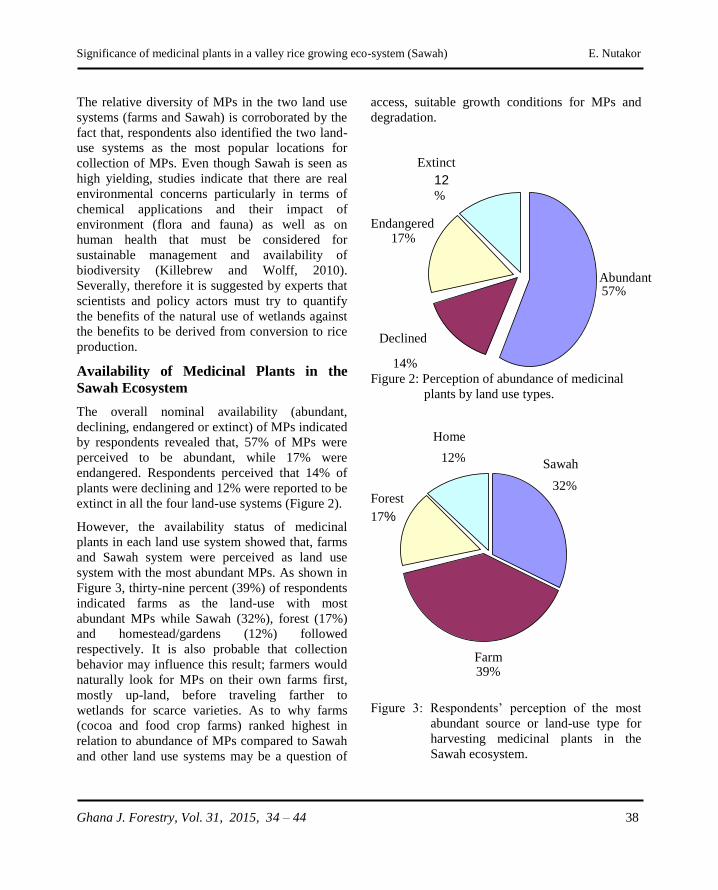
Significance of medicinal plants in a valley rice growing eco-system (Sawah) E. Nutakor
Ghana J. Forestry, Vol. 31, 2015, 34 – 44 38
The relative diversity of MPs in the two land use
systems (farms and Sawah) is corroborated by the
fact that, respondents also identified the two land-
use systems as the most popular locations for
collection of MPs. Even though Sawah is seen as
high yielding, studies indicate that there are real
environmental concerns particularly in terms of
chemical applications and their impact of
environment (flora and fauna) as well as on
human health that must be considered for
sustainable management and availability of
biodiversity (Killebrew and Wolff, 2010).
Severally, therefore it is suggested by experts that
scientists and policy actors must try to quantify
the benefits of the natural use of wetlands against
the benefits to be derived from conversion to rice
production.
Availability of Medicinal Plants in the
Sawah Ecosystem
The overall nominal availability (abundant,
declining, endangered or extinct) of MPs indicated
by respondents revealed that, 57% of MPs were
perceived to be abundant, while 17% were
endangered. Respondents perceived that 14% of
plants were declining and 12% were reported to be
extinct in all the four land-use systems (Figure 2).
However, the availability status of medicinal
plants in each land use system showed that, farms
and Sawah system were perceived as land use
system with the most abundant MPs. As shown in
Figure 3, thirty-nine percent (39%) of respondents
indicated farms as the land-use with most
abundant MPs while Sawah (32%), forest (17%)
and homestead/gardens (12%) followed
respectively. It is also probable that collection
behavior may influence this result; farmers would
naturally look for MPs on their own farms first,
mostly up-land, before traveling farther to
wetlands for scarce varieties. As to why farms
(cocoa and food crop farms) ranked highest in
relation to abundance of MPs compared to Sawah
and other land use systems may be a question of
access, suitable growth conditions for MPs and
degradation.
Figure 2: Perception of abundance of medicinal
plants by land use types.
Figure 3: Respondents’ perception of the most
abundant source or land-use type for
harvesting medicinal plants in the
Sawah ecosystem.
Sawah
32%
Farm 39%
Forest
17%
Home
12%
57%
Declined
14%
Endangered 17%
Extinct
12%
Abundant
Significance of medicinal plants in a valley rice growing eco-system (Sawah) E. Nutakor
Ghana J. Forestry, Vol. 31, 2015, 34 – 44 39
As noted at the focus group discussions, the wet
valley areas where Sawah rice production system
is practiced were reported to have come under
increasing agro-chemical application, while
forests have become less accessible to people for
collection of non-timber forest products such as
medicinal plants due to forest degradation. In
terms of access, majority of farmers with farms
and farm lands would access these areas for MPs
than trek long distances to the forest and valley
areas to collect MPs. It is also possible most
farmers may have domesticated some of the most
important and commonly used MPs in their farms
thereby increasing its abundance and distribution
over larger land area compare to homesteads or
gardens. The home gardens have not also been the
most popular sources for the ten most important
MPs shown in Annex 1. In Sawah system
(commercialized rice cultivation), there is an
increasing use of agricultural chemicals
unfavorable to growth and development of
medicinal plants. The low level of diversity and
abundance of MPs in the forests in the study area
may be due to degradation and deforestation or
even restricted access and distance.
Generally, farms having high level of abundance
of MPs should make them of special interest
among conservationists with regards to
availability of biodiversity. Also, not to be
neglected is the Sawah system since respondents
at focus group discussions and during key
informant interviews indicated that the wet valley
areas are an important source of MPs during the
dry seasons.
Overall, MPs’ availability index for all land-use
types was determined as 1.97 (Table 2) along the
continuum (3-0). For individual land-use systems,
crop farms scored the highest mean availability
index (2.64) followed by the homesteads/gardens
(2.36). Sawah system and forest scored the least
indices of 1.58 and 1.45 respectively. Crop farms
and home-gardens would be expected to have high
score of availability indices if important plants are
domesticated and protected to ensure their
availability (Rukangira, 2001; Cunningham,
1997).
Table 2: Score of availability of medicinal plants
in the Sawah ecosystem.
Land use
types in the
ecosystem
N Mean
score
Std.
Deviation
Sawah 81 1.58 1.25
Farm 72 2.64 0.72
Forest 71 1.45 1.31
Home 50 2.36 0.80
274 1.97 1.19
This however does not necessarily mean that these
areas should have higher plant diversity. It could
simply mean that over the period under
assessment the perception was that there had been
only a certain trend (increase or decline etc.) of
change in availability of the plants. Although,
homesteads/gardens scored the second highest
availability index, it can be argued that, the score
may partly be attributed to the smallness of N for
this group. A look at the availability scores of the
Sawah system and forest zone shows that MPs
seem to be on the decline in these land use types
since their means were generally below the overall
mean availability index of (1.97). Obviously, this
makes the case for investing in availability actions
targeted at improving availability of medicinal
plants in these land use types.
CONCLUSION
The study has assessed the perception of
distribution, availability and relative diversity of
MPs in the Sawah eco-system in the pilot
communities of Ahafo-Ano South District, Ghana.
The study revealed that a wide variety of MPs
were collected and used for various and multiple
Significance of medicinal plants in a valley rice growing eco-system (Sawah) E. Nutakor
Ghana J. Forestry, Vol. 31, 2015, 34 – 44 40
purposes with in the communities. Multiple parts
including roots of plants are harvested for use. The
harvesting of roots and peeling of tree bark are
practices that have serious implications for the
survival of MPs and thus the sustainable
management of the resource.
The perception is that majority of medicinal plants
mentioned are between abundant and declining
within the ecosystem. The most bio-diverse and
popular harvesting sources are the farms and wet
lands, the latter now being prone to chemical
application. The popularity of collection sites
could be due to plant diversity and not necessarily
abundance of any particular MPs in that site.
Thus if a particular MP can be found only in the
Sawah for instance, albeit scarce, that would still
drive people to the location to harvest that MP.
In terms of abundance of medicinal plants, Sawah
system was ranked second to farms. However,
availability of MPs varied across land use types
with farms and homesteads/gardens having the
highest mean availability indices of 2.64 and 2.36
respectively. Sawah system was slightly above
forest with regards to land use types with least
availability index. The implication is that MPs are
on the decline in the Sawah and forest land use
types. This calls for investing in availability
actions targeted at improving availability of
medicinal plants in these land use types.
The emerging commercial rice farming in the wet
lands is a challenge to sustainability of the eco-
system and survival of medicinal plant diversity
and availability. The Sawah technology could
promote excessive chemical usage (herbicides
especially) if not checked with other improved
farm practices. Nonetheless, it is worth noting
that, the observed results were perceptions based
on collection experience of respondents for all
species identified. It would subsequently be more
revealing to examine the influence of social and
cultural factors on perception of the identified
species. For instance, access to some locations
may be influenced significantly by gender, social
status, management regime, occupation, among
others.
REFERENCES
Alarima, C. I., Adamu, C. O., Masunaga, T.
and Wakatsuki, T. (2011). Constraints to Sawah
Rice Production System in Nigeria. Journal of
Human Ecology, 36 (2): 121-130
Appendini, K. (2001). Land and livelihood: What
do we know and what are the issues? In Zoomers,
A. (ed.) Land and Sustainable Livelihood in Latin
America, pp. 23–38. Amsterdam: Royal Tropical
Institute/Vervuert Verlag. pp. 23 – 38.
Bukuluki, P., Luwangula, R. and Walakira, E.
J. (2014). Harvesting of medicinal plants in
Uganda: Practices, availability and implications
for sustainability of supplies. International
Journal of Medicinal Plant Research, 3 (1):1-10.
Buri, M. M., Issaka, R. N. Wakatsuiki, and
Kawano, O. (2012. “Reducing rural poverty
through improved and sustainable rice production
technologies: A case study of the Sawah system in
the Ahafo Ano South District in Ghana. Paper
presented at the International Conference on
Sustainable Agriculture for Food, Energy and
Industry, 2-6th July,, 2008 at Sapporo University,
Hokkaido, Japan.
Buri, M. M., Issaka, R. N. Wakatsuiki, and
Kawano, O. (2012. “Improving the Productivity
of Lowland Soils for Rice Cultivation in Ghana:
The Role of the ‘Sawah’ System.” Journal of Soil
Science and Environmental Management 3 (3):
56–62.
Butler, B. J. and Chazdon, R. L. (1998). Species
richness, spatial variation, and abundance of the
soil seed bank of a secondary tropical rain forest.
Biotropica, 30 (2):214-222.
Cunningham, M., Cunningham, A. B. and
Schippman, U. (1997). A brief literature on Trade
in Prunus Africana and the implementation of
Significance of medicinal plants in a valley rice growing eco-system (Sawah) E. Nutakor
Ghana J. Forestry, Vol. 31, 2015, 34 – 44 41
CITES. German Federal Agency for Nature
Conservation, Bonn, Germany. 5pp
FAO (1997). Consultation on Wetland
characterization and classification for sustainable
agricultural development in Southern and East
Africa (Agl/Safr - 814) Harare, Zimbabwe, 2-6
December1997:http://www.fao.org/docrep/003/X6
611E/x6611e04a.htm. Accessed June 2015
Africa Development Fund (2001) Inland Valley
rice development project appraisal report.
GHA/PAAC/2001/01. 45pp.
Gotelli, N. J and Colwell, R. K. (2001).
Quantifying biodiversity: procedures and pitfalls
in the measurement and comparison of species
richness. Ecology Letters, 4: 379-391.
Hall J. B and Swaine, M. D. (1981). Distribution
and ecology of Vascular plants in a tropical rain
Forest. Forest vegetation in Ghana. Geobotany, 1:
1981. Springer, ISBN: 978-94-009- 8652-7.
Hirose, H, and Wakatsuki, T. (2002).
Restoration of Inland Valley Ecosystems in West
Africa, Norin Tokei Kyokai, Tokoyo, 2002,
572pp.
Höft, M., Barik, S. K. and Lykke, A. M.
(1999). Quantitative ethnobotany applications of
multivariate and statistical analyses in ethno
botany. PEOPLE AND PLANTS working paper.
http://peopleandplants.org/web-content
1/pdf/wp6.p. Accessed May 2012.
Inocencio, A., Sally, H. and Merrey, D. J. (2003). Innovative approaches to agricultural
water use for improving food security in sub-
Saharan Africa. Colombo, Sri Lanka: International
Water Management Institute. 18pp.
Killebrew, K and Wolff, H. (2010).
Environmental Impacts of Agricultural
Technologies. Evans School Policy Analysis and
Research (EPAR) Brief No. 65, Prepared for the
Agricultural Policy and Statistics Team of the Bill
and Melinda Gates Foundation, March 17, 2010.
Kolawole, A., Oladele, O. I. and Wakatsuki, T. (2010). Impact of Sawah system on rice based
farming system in Nigeria. Journal of Food,
Agriculture and Environment, 8 (3 & 4): 473-475.
Kiringe, J. W. (2005). Ecological and
anthropological threats to ethno-medicinal plant
resources and their utilization in Maasai
communal ranches in the Amboseli region of
Kenya. Ethnobotany Research and Applications,
3:231-241.
Mahomoodally, M. F. (2013). Traditional
medicines in Africa: An appraisal of ten potent
African medicinal plants, Evidence-Based
Complementary and Alternative Medicine, Vol.
2013, Article ID 617459, 14 pages, 2013.
doi:10.1155/2013/617459.
Moser, C. (1998). The asset vulnerability
framework: Reassessing urban poverty reduction
strategies. World Development, 26 (1):1-19.
Northwest Resistance Against Genetic
Engineering (2012). Bountiful rice harvest from
'sawah' systemhttp://nwrage.org/content/bountiful-
rice-harvest-sawah-system. Accessed December
2012.
Obeng, H. (1994). Soils suitable for large-scale
rice cultivation in Ghana. Paper presented at the
International Seminar, Towards Rice Self-
Sufficiency in Ghana, 6-7 June 1994, Akosombo,
Ghana.
Oladele, O. I. and Wakatsuki, T. (2010).
Sawah rice production system as eco-technology
for sustainable management of resources and land
in Nigeria and Ghana. Paper presentation at
Hokkaido Graduate School of Agriculture,
Hokkaido, Japan. Accessed at:
http://www.agr.hokudai.ac.jp/ICSA08/speakers/O-
8.Oladele.pdf.
Oladele, O. I. and Wakatsuki, T. (2010b).
Sawah Rice Eco-technology and Actualization of
Green Revolution in West Africa: Experience
from Nigeria and Ghana. Rice Science, 2010,
Significance of medicinal plants in a valley rice growing eco-system (Sawah) E. Nutakor
Ghana J. Forestry, Vol. 31, 2015, 34 – 44 42
17(3): 168−172
Oladele, O. I. and Wakatsuki, T. (2011).
Learning Alliances in Sawah Rice Technology
Development and Dissemination in Nigeria and
Ghana. Life Science Journal, 2011;8(2)
Oladele, O. I., Kolawole, A. and Wakatsuki, T. (2011). Land tenure, investment and adoption of
Sawah rice production technology in Nigeria and
Ghana: A qualitative approach. African Journal of
Agricultural Research, 6 (6): 1519-1524.
Oteng, J. W. and Sant’Anna, R. (1998). Rice
production in Africa: current situation and issues.
FAO international rice Commission newsletter:
http://www.fao.org/docrep/003/X2243T/x2243t05.
htm#TopOfPage. Accessed in June 2015
Oviedo, G., Noejovich, F. and Zamudio, T. (2007). Challenges for the maintenance of
traditional biodiversity knowledge in Latin
America. Research reports prepared at the request
of the Secretariat of the Convention on Biological
Diversity.Source:http://www.researchgate.net/publ
ication/228768237 accessed June 2014.
Rukangira, E. (2001). The African herbal
industry: Constraints and challenges. Erboristeria
Doman (2001). Paper presentation at The natural
products and cosmeceuticals conference. Source:
http://www.blackherbals.com/herbal_industry.rtf.
Accessed in December 2014.
Salafsky, N. and Wollenberg, E. (2000). Linking
livelihoods and availability: A conceptual
framework and scale for assessing the integration
of human needs and biodiversity. World
Development, 28 (8): 1421-1438.
Wakatsuki, T., Shinmura, Y., Otoo, E. and
Olaniyn, G. O. (1998). Sawah systems for
integrated watershed management of small inland
valleys in West Africa. In: FAO. Institutional and
technical options in the development and
management of small-scale irrigation. Rome,
Italy.
World Health Organization of the United
Nations (2002). Traditional medicine strategy
2002-2005. World Health Organization, Geneva.
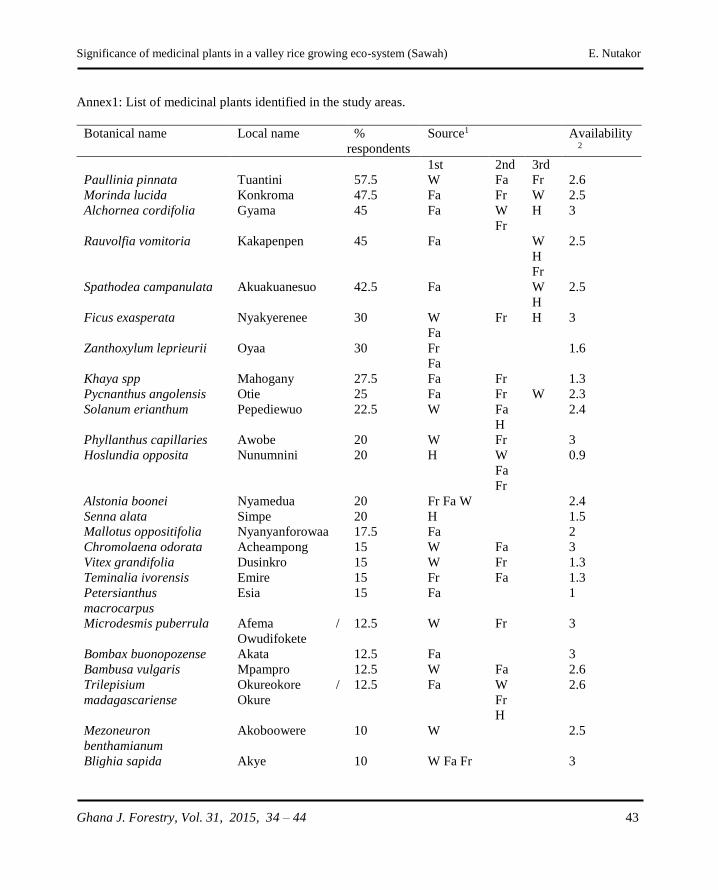
Significance of medicinal plants in a valley rice growing eco-system (Sawah) E. Nutakor
Ghana J. Forestry, Vol. 31, 2015, 34 – 44 43
Annex1: List of medicinal plants identified in the study areas.
Botanical name Local name %
respondents
Source1 Availability2
1st 2nd 3rd
Paullinia pinnata Tuantini 57.5 W Fa Fr 2.6
Morinda lucida Konkroma 47.5 Fa Fr W 2.5
Alchornea cordifolia Gyama 45 Fa W
Fr
H 3
Rauvolfia vomitoria Kakapenpen 45 Fa W
H
Fr
2.5
Spathodea campanulata Akuakuanesuo 42.5 Fa W
H
2.5
Ficus exasperata Nyakyerenee 30 W
Fa
Fr H 3
Zanthoxylum leprieurii Oyaa 30 Fr
Fa
1.6
Khaya spp Mahogany 27.5 Fa Fr 1.3
Pycnanthus angolensis Otie 25 Fa Fr W 2.3
Solanum erianthum Pepediewuo 22.5 W Fa
H
2.4
Phyllanthus capillaries Awobe 20 W Fr 3
Hoslundia opposita Nunumnini 20 H W
Fa
Fr
0.9
Alstonia boonei Nyamedua 20 Fr Fa W 2.4
Senna alata Simpe 20 H 1.5
Mallotus oppositifolia Nyanyanforowaa 17.5 Fa 2
Chromolaena odorata Acheampong 15 W Fa 3
Vitex grandifolia Dusinkro 15 W Fr 1.3
Teminalia ivorensis Emire 15 Fr Fa 1.3
Petersianthus
macrocarpus
Esia 15 Fa 1
Microdesmis puberrula Afema /
Owudifokete
12.5 W Fr 3
Bombax buonopozense Akata 12.5 Fa 3
Bambusa vulgaris Mpampro 12.5 W Fa 2.6
Trilepisium
madagascariense
Okureokore /
Okure
12.5 Fa W
Fr
H
2.6
Mezoneuron
benthamianum
Akoboowere 10 W 2.5
Blighia sapida Akye 10 W Fa Fr 3
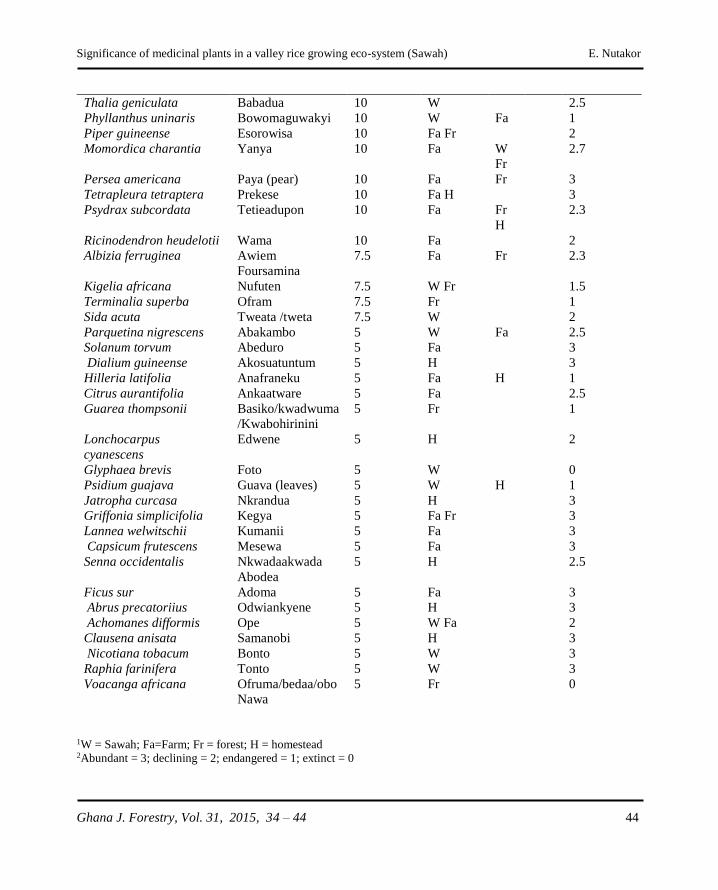
Significance of medicinal plants in a valley rice growing eco-system (Sawah) E. Nutakor
Ghana J. Forestry, Vol. 31, 2015, 34 – 44 44
Thalia geniculata Babadua 10 W 2.5
Phyllanthus uninaris Bowomaguwakyi 10 W Fa 1
Piper guineense Esorowisa 10 Fa Fr 2
Momordica charantia Yanya 10 Fa W
Fr
2.7
Persea americana Paya (pear) 10 Fa Fr 3
Tetrapleura tetraptera Prekese 10 Fa H 3
Psydrax subcordata Tetieadupon 10 Fa Fr
H
2.3
Ricinodendron heudelotii Wama 10 Fa 2
Albizia ferruginea Awiem
Foursamina
7.5 Fa Fr 2.3
Kigelia africana Nufuten 7.5 W Fr 1.5
Terminalia superba Ofram 7.5 Fr 1
Sida acuta Tweata /tweta 7.5 W 2
Parquetina nigrescens Abakambo 5 W Fa 2.5
Solanum torvum Abeduro 5 Fa 3
Dialium guineense Akosuatuntum 5 H 3
Hilleria latifolia Anafraneku 5 Fa H 1
Citrus aurantifolia Ankaatware 5 Fa 2.5
Guarea thompsonii Basiko/kwadwuma
/Kwabohirinini
5 Fr 1
Lonchocarpus
cyanescens
Edwene 5 H 2
Glyphaea brevis Foto 5 W 0
Psidium guajava Guava (leaves) 5 W H 1
Jatropha curcasa Nkrandua 5 H 3
Griffonia simplicifolia Kegya 5 Fa Fr 3
Lannea welwitschii Kumanii 5 Fa 3
Capsicum frutescens Mesewa 5 Fa 3
Senna occidentalis Nkwadaakwada
Abodea
5 H 2.5
Ficus sur Adoma 5 Fa 3
Abrus precatoriius Odwiankyene 5 H 3
Achomanes difformis Ope 5 W Fa 2
Clausena anisata Samanobi 5 H 3
Nicotiana tobacum Bonto 5 W 3
Raphia farinifera Tonto 5 W 3
Voacanga africana Ofruma/bedaa/obo
Nawa
5 Fr 0
1W = Sawah; Fa=Farm; Fr = forest; H = homestead 2Abundant = 3; declining = 2; endangered = 1; extinct = 0
Influence of indole-3-butyric acid concentrations on cinnamomium camphora E. O. Owusu et al.
Ghana J. Forestry, Vol. 31, 2015, 45 – 50 45
INFLUENCE OF INDOLE-3-BUTYRIC ACID CONCENTRATIONS ON
ROOTING OF CINNAMOMUM CAMPHORA (L.) PRESL MARCOTS
E. O. Owusu, C. M. Asare and S. Ackon
CSIR-Plant Genetic Resources Research Institute, Bunso
Email: [email protected]
ABSTRACT
In this study, marcotting technique was used to reproduce camphor tree (Cinnamomum camphora (L.)
Presl) at the Council for Scientific and Industrial Research Plant Genetic Resources Research Institute at
Bunso. The aim of the study was to determine indole-3-butyric acid (IBA) concentration that promotes
rooting in marcotted camphor tree. One hundred shoots of similar girth (0.9 cm) were sampled on the
only C. camphora tree at Bunso and marcotted by girdling 2.5 cm-wide strip of the bark at 15 cm from
the apex. Thereafter, a set of 25 girdled strips were each treated with 2000 mg/l, 4000 mg/l, 6000 mg/l or
0 mg/l (control) IBA concentration. Two handfuls of moistened river sand and decomposed palm fiber
mixture (1:2 v/v) root substrate, was placed in 25 cm2 transparent polyethylene film and wrapped around
the girdled surface. Data collected after 12 weeks indicated that IBA concentrations had effect on rooting
of the marcots. Number of survived marcots, rooted marcots, root length and sprouted marcots differed
significantly (p ≤ 0.05) amongst marcots of different IBA concentrations. Differences in callus formation
were however not significant amongst the different concentrations. Rooting and shoot performance of
marcotted camphor were highest at 4000 mg/l IBA concentration. Marcotting camphor tree without IBA
or applying of 6000 mg/l IBA resulted in poor rooting.
Keywords: Cinnamomum camphora, vegetative propagation, marcotting, indole-3-butyric acid.
INTRODUCTION
Vegetative propagation techniques have been
instrumental in tree improvement programmes
over the years. New plants are produced from
vegetative organs of parent plants to generate
offspring with similar parental genotype (Zobel
and Talbert, 1984; Ofori et al., 1996). It is a useful
and reliable method for multiplying tree species of
superior genotype as it bars any somatic mutation
(Hartmann et al., 2011). It also ensures rapid
maturity of desirable tree species for early
utilization (Hartmann et al., 2011). Propagation by
grafting, budding, marcotting and cuttings are
some of the most common techniques in
vegetative propagation which are amateur-friendly
and require simple inexpensive equipment
(Hartmann et al., 2011; JICA, 2002).
Plants of the Lauraceae family like Cinnamomum
camphora (L.) Presl have been propagated
vegetatively over the years. This is because seed
propagated plants are genetically diverse and have
long juvenile periods (Hartmann et al., 2011).
Cinnamomum camphora is native to China,
Taiwan, and Japan (Li and Bai, 1982; Rabuil et
al., 2011). It is evergreen, large and grows up to
20-30 m tall with a round dense crown. The leaves
are simple, ovate and alternate with pinnate
venation along entire leaf margin and about 6-12
cm long and 2.5-5.5 cm wide. Leaves are glossy
green, thin and leathery textured and give off
camphor aroma when crushed. The stem and
Influence of indole-3-butyric acid concentrations on cinnamomium camphora E. O. Owusu et al.
Ghana J. Forestry, Vol. 31, 2015, 45 – 50 46
branch of young trees are bright green, tinged with
red, maturing into a dark grey-brown and rugged-
looking trunk which appears almost black when
wet. Trunk and branch structure of older trees are
similar to mature live oak. Flowers are tiny,
inconspicuous and yellow and appear from April –
May. The tree produces profuse, small, fleshy
black berry fruits which is 1.3 cm in diameter
from August-November (Cerveny et al., 2006).
Camphor tree has been underexploited due to over
reliance on artificial sources of fragrances and
flavour. However, recent demand for natural
sources of fragrances and flavour call for
propagation techniques aimed at increasing
populations of natural sources of fragrances and
flavours like the camphor tree to meet future
demand. Essential oils from C. camphora have
been identified to be among the most important
oils in world trade. Camphor oils are extracted
from the roots, branches, leaves and wood of the
tree for pharmaceutical use and flavouring. The
fruit core is about 40% oil which has industrial
and medicinal uses. The wood is good for
construction, ship building and cabinet-making (Li
and Bai, 1982).
Vegetative propagation techniques such as
marcotting have been widely used for commercial
propagation of lychee (Litchi chinensis Sonn.)
(Hartmann et al., 2011). Misra and Jaiswal (1993)
studied the propagation of Anthocephalus
chinensis (Sonn) by marcotting with the aid of
Indole-3-butyric acid (IBA) and reported that all
marcots showed callusing but only those treated
with IBA showed rooting. Plant auxins are known
to promote root formation in vegetative plant parts
(Aminah et al., 2006). The auxins increase cell
wall elasticity which accelerates cell division and
consequently enhance rooting through
translocation of carbohydrate and other nutrients
to the rooting zone (Middleton et al., 1980).
Marcotting is considered as one of the simplest
and oldest methods of plant multiplication. It is
one of the safest because while the prepared plant
is making roots, the parent plant continues to
provide nourishment until it can fend for itself
when sufficient new roots have been formed
(Sicuranza et al., 2005).
Marcotting was therefore considered as a viable
method for reproducing C. camphora (camphor
tree) on the premises of Council for Scientific and
Industrial Research, Plant Genetics Resources
Research Institute (CSIR-PGRRI). The study was
carried out to determine the optimum IBA
concentration that would promote root initiation
and survival of marcotted C. camphora.
MATERIALS AND METHODS
Experimental Site and Design
The experiment was carried out at CSIR-PGRRI,
Bunso in the Eastern Region of Ghana between
April and August, 2013. Bunso lies on 06⁰ 17' 19"
N, 00⁰28' 05" W and elevation of 226 m.
Temperature ranges from 24°C to about 28°C and
average rainfall is about 1750 mm. Marcotting
was initiated on selected branches of the only C.
camphora tree on the campus of CSIR-PGRRI. At
the time of the experiment, the tree had a dbh
(diameter at breast height) of 94.30 cm and height
of 3.22 m. The experiment was set up in a
completely randomized design with four
treatments, each replicated 25 times. The
treatments were indole-3-butyric acid (IBA)
concentrations of 2000 mg/l, 4000 mg/l and 6000
mg/l and a control (0 mg/l) where no IBA was
applied. Thus, a total of 100 shoots were
marcotted. In order to avoid bias, each shoot
selected for marcotting was allocated randomly to
the treatments by use of a table of random
numbers (Johnson and Bhattacharyya, 2006).
Preparation of Rooting Hormone
Indole-3-butyric acid of concentrations of 2000
mg/l, 4000 mg/l and 6000 mg/l were used as
rooting hormone for the treatments. Indole-3-
butyric acid concentration of 2000 mg/l was
Influence of indole-3-butyric acid concentrations on cinnamomium camphora E. O. Owusu et al.
Ghana J. Forestry, Vol. 31, 2015, 45 – 50 47
prepared by dissolving 200 mg of powdered stock
IBA in 100 ml of 50% ethanol solution in a
volumetric flask .The same process was followed
for preparation of the 4000 ml/l and 6000 mg/l
IBA concentrations
Preparation of Rooting Medium
River sand and decomposed oil palm fibres
collected from a decomposing palm tree were
mixed thoroughly in proportions of 1: 2 v/v on
thick sheet of polythene. Stones and other foreign
materials were removed and the mixture sterilized
by autoclaving at 121°C and 15 psi for 15 minutes
in sealed glass jars.
Selection of Leafy Shoots for Marcotting
Leafy shoots measuring 15 cm in length from the
apex and approximately 0.9 cm in diameter
(Hartmann et al., 2011) were selected from
healthy branches of the C. camphora tree. Barks
of selected shoots were girdled by removing 2.5
cm-wide strip. The debarked surfaces were
scraped of all phloem and cambium tissues to
retard healing of the exposed surfaces, after which
the IBA solution was then applied. Two handfuls
(180 cm3) of moistened rooting media was placed
in 25 cm2 transparent polyethylene sheet and
wrapped around the girdled surface. Monitoring of
the setup was done weekly for 12 weeks. The
marcots were excised from the plant with a pair of
secateurs after 12 weeks for examination. The
transparent polyethylene sheet and the rooting
medium were removed, and the marcots examined
for callus formation, roots and shoot sprouts.
Callus forms as a result of dedifferentiation of
tissues indicated by bulging of the girdled areas of
the marcots.
Data Collection
Marcotted shoots that had green leaves and stem
after 12 weeks were considered alive. Marcots that
were alive were counted for the different IBA
treatments. Data collected included survived
marcots, rooted marcots, root length, sprouted
marcots and callused marcots. Root length
measurements were done with a metric measuring
rule.
Statistical Analyses
Data were transformed using square root
transformation where applicable before Analysis
of Variance (ANOVA). GenStat package software
Version 12 was used for the analysis. The
Duncans multiple range test was used to separate
the differences between means at 5% level of
significance.
RESULTS
Survival and Callus Formation
Marcots survival was highest in the 4000 mg/l
IBA concentrations and least in the control (Table
1). There was callus formation in all the survived
marcots. There was callus formation in 19 out of
24 survived marcots with the 4000 mg/l IBA
concentration as compared to the least, 11 out of
21 survived marcots with the 6000 mg/l IBA
concentration (Table 1). Survived marcots with
IBA concentrations 2000 mg/l and the control
both had 18 callused marcots as shown in Table 1.
Shoot Sprout
There were considerable numbers of new shoot
sprout in marcots of all the IBA concentrations.
Even though the control formed more new shoots
per unit marcot, the percentage of marcots that
formed new shoots was higher in those treated
with IBA (Table 2). Shoot formation in marcots
ranged from 24 marcots in IBA concentration of
4000 mg/l with a mean shoot sprout per marcot of
17.88 to 20 marcots in IBA concentration of 0
mg/l (control) with a mean shoot sprout per
marcot of 20.05 (Table 2).
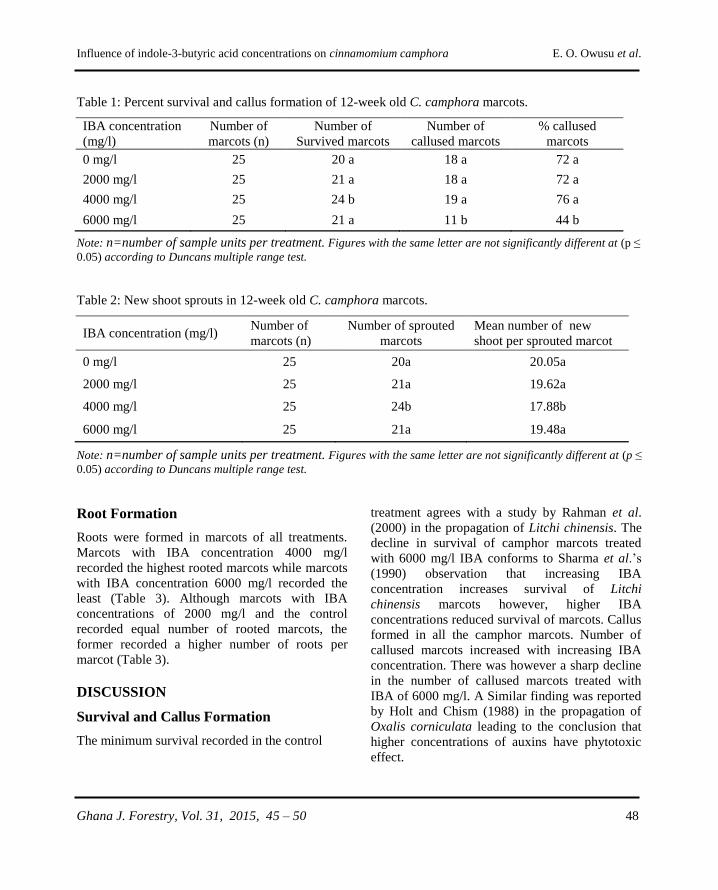
Influence of indole-3-butyric acid concentrations on cinnamomium camphora E. O. Owusu et al.
Ghana J. Forestry, Vol. 31, 2015, 45 – 50 48
Table 1: Percent survival and callus formation of 12-week old C. camphora marcots.
IBA concentration
(mg/l)
Number of
marcots (n)
Number of
Survived marcots
Number of
callused marcots
% callused
marcots
0 mg/l 25 20 a 18 a 72 a
2000 mg/l 25 21 a 18 a 72 a
4000 mg/l 25 24 b 19 a 76 a
6000 mg/l 25 21 a 11 b 44 b
Note: n=number of sample units per treatment. Figures with the same letter are not significantly different at (p ≤
0.05) according to Duncans multiple range test.
Table 2: New shoot sprouts in 12-week old C. camphora marcots.
IBA concentration (mg/l) Number of
marcots (n)
Number of sprouted
marcots
Mean number of new
shoot per sprouted marcot
0 mg/l 25 20a 20.05a
2000 mg/l 25 21a 19.62a
4000 mg/l 25 24b 17.88b
6000 mg/l 25 21a 19.48a
Note: n=number of sample units per treatment. Figures with the same letter are not significantly different at (p ≤
0.05) according to Duncans multiple range test.
Root Formation
Roots were formed in marcots of all treatments.
Marcots with IBA concentration 4000 mg/l
recorded the highest rooted marcots while marcots
with IBA concentration 6000 mg/l recorded the
least (Table 3). Although marcots with IBA
concentrations of 2000 mg/l and the control
recorded equal number of rooted marcots, the
former recorded a higher number of roots per
marcot (Table 3).
DISCUSSION
Survival and Callus Formation
The minimum survival recorded in the control
treatment agrees with a study by Rahman et al.
(2000) in the propagation of Litchi chinensis. The
decline in survival of camphor marcots treated
with 6000 mg/l IBA conforms to Sharma et al.’s
(1990) observation that increasing IBA
concentration increases survival of Litchi
chinensis marcots however, higher IBA
concentrations reduced survival of marcots. Callus
formed in all the camphor marcots. Number of
callused marcots increased with increasing IBA
concentration. There was however a sharp decline
in the number of callused marcots treated with
IBA of 6000 mg/l. A Similar finding was reported
by Holt and Chism (1988) in the propagation of
Oxalis corniculata leading to the conclusion that
higher concentrations of auxins have phytotoxic
effect.
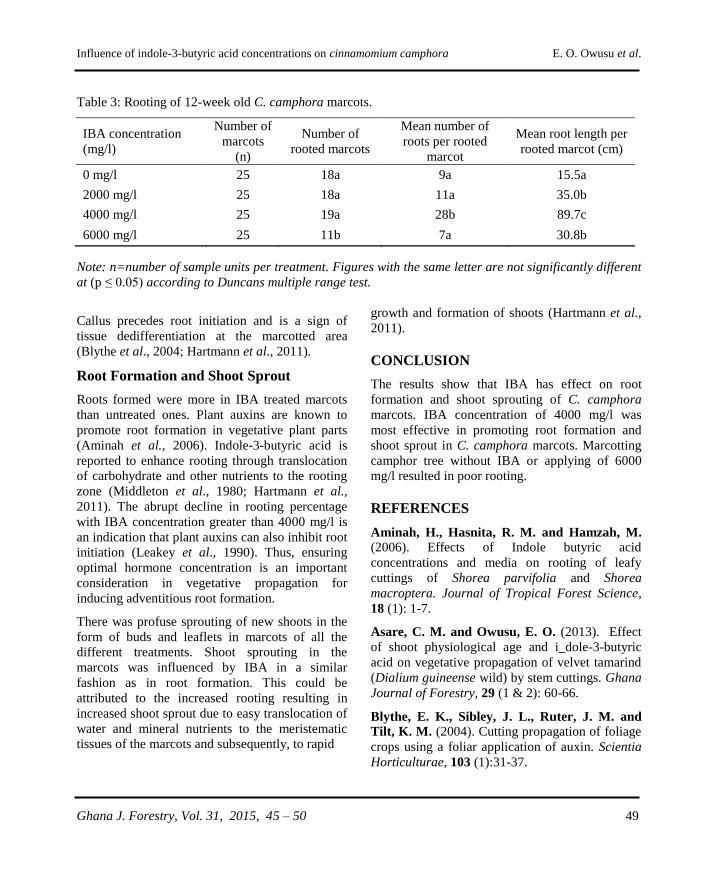
Influence of indole-3-butyric acid concentrations on cinnamomium camphora E. O. Owusu et al.
Ghana J. Forestry, Vol. 31, 2015, 45 – 50 49
Table 3: Rooting of 12-week old C. camphora marcots.
IBA concentration
(mg/l)
Number of
marcots
(n)
Number of
rooted marcots
Mean number of
roots per rooted
marcot
Mean root length per
rooted marcot (cm)
0 mg/l 25 18a 9a 15.5a
2000 mg/l 25 18a 11a 35.0b
4000 mg/l 25 19a 28b 89.7c
6000 mg/l 25 11b 7a 30.8b
Note: n=number of sample units per treatment. Figures with the same letter are not significantly different
at (p ≤ 0.05) according to Duncans multiple range test.
Callus precedes root initiation and is a sign of
tissue dedifferentiation at the marcotted area
(Blythe et al., 2004; Hartmann et al., 2011).
Root Formation and Shoot Sprout
Roots formed were more in IBA treated marcots
than untreated ones. Plant auxins are known to
promote root formation in vegetative plant parts
(Aminah et al., 2006). Indole-3-butyric acid is
reported to enhance rooting through translocation
of carbohydrate and other nutrients to the rooting
zone (Middleton et al., 1980; Hartmann et al.,
2011). The abrupt decline in rooting percentage
with IBA concentration greater than 4000 mg/l is
an indication that plant auxins can also inhibit root
initiation (Leakey et al., 1990). Thus, ensuring
optimal hormone concentration is an important
consideration in vegetative propagation for
inducing adventitious root formation.
There was profuse sprouting of new shoots in the
form of buds and leaflets in marcots of all the
different treatments. Shoot sprouting in the
marcots was influenced by IBA in a similar
fashion as in root formation. This could be
attributed to the increased rooting resulting in
increased shoot sprout due to easy translocation of
water and mineral nutrients to the meristematic
tissues of the marcots and subsequently, to rapid
growth and formation of shoots (Hartmann et al.,
2011).
CONCLUSION
The results show that IBA has effect on root
formation and shoot sprouting of C. camphora
marcots. IBA concentration of 4000 mg/l was
most effective in promoting root formation and
shoot sprout in C. camphora marcots. Marcotting
camphor tree without IBA or applying of 6000
mg/l resulted in poor rooting.
REFERENCES
Aminah, H., Hasnita, R. M. and Hamzah, M. (2006). Effects of Indole butyric acid
concentrations and media on rooting of leafy
cuttings of Shorea parvifolia and Shorea
macroptera. Journal of Tropical Forest Science,
18 (1): 1-7.
Asare, C. M. and Owusu, E. O. (2013). Effect
of shoot physiological age and i_dole-3-butyric
acid on vegetative propagation of velvet tamarind
(Dialium guineense wild) by stem cuttings. Ghana
Journal of Forestry, 29 (1 & 2): 60-66.
Blythe, E. K., Sibley, J. L., Ruter, J. M. and
Tilt, K. M. (2004). Cutting propagation of foliage
crops using a foliar application of auxin. Scientia
Horticulturae, 103 (1):31-37.
Influence of indole-3-butyric acid concentrations on cinnamomium camphora E. O. Owusu et al.
Ghana J. Forestry, Vol. 31, 2015, 45 – 50 50
Cerveny, C. B., Gibson, J. L. and Barrett, J. E. (2006). Influence of stem cutting location on
propagation of Murraya paniculata and Tecoma
stans. Hortscience, 41 (3):500-501.
Japan International Corporation Agency
(JICA) (2002). Agroforestry in Ghana. A
technology information book. Sakva Company
Ltd., Ghana. pp. 3-7.
Hartmann, H. T., Kester, D. E., Davies, D. F. T.
Jr. and Geneve, R. L. (2011). Plant Propagation
Principles and Practices. 8th ed. Prentice Hall,
Upper Saddle River, New Jersey.
Holt, J. S. and Chism, W. J. (1988). Herbicidal
activity of NAA (1- naphthaleneacetic acid) on
creeping woodsorrel (Oxalis corniculata) in
ornamentals. Weed Science, 36: 227-233.
Johnson, R. A. and Bhattacharyya, G. K. (2006). Statistics: Principles and Methods. 5th
Edition. John Wiley and Sons, USA. 688p.
Leakey, R. R. B., Mésen, F., Tchoundjeu, Z.,
Longman, K. A., Dick, J. M. C. P., Newton, A.
C., Matin, A., Grace, J. M. and Muthoka, P. N. (1990). Low-technology techniques for the
vegetative propagation of tropical trees.
Commonwealth Forestry Review, 69: 247-257.
Li, X. and Bai, P. (1982). Cinnamomum Trew. In:
Li Xiwen (ed.). Flora Reipublicae Popularis
Sinicae. Tomus 31. Science Press. Beijing, China.
pp. 160-229.
Middleton, W., Jarvis, B. C. and Booth, A. (1980). The role of leaves in auxins and boron
dependant on rooting stem cuttings of Phaseous
aureus Roxb. New Phytoogist, 84: 251-259.
Misra, K. K. and Jaiswal, H. R. (1993)
Propagation of Anthocephalus chinensis sonn.by
air layering with the aid of Indole butyric acid.
Indian Forester, 199: 587-589.
Ofori, D. A., Newton, A. C., Leakey, R. R. B.
and Grace, J. (1996). Vegetative propagation of
Milicia excelsa by leafy stem cuttings: effects of
auxin concentration, leaf area and rooting
medium. Forest Ecology and Management, 84:
39-48.
Rabiul, H., Subhasish, M. and Parag, G. (2011).
Investigation of in- vitro Anthelmintic activity of
Cinnamomum camphor leaves, International
Journal of Drug Development and Research, 3(1):
295-300.
Rahman, N., Hussain, I., Imran, M., Jan, T.
and Awan, A. A. (2000). Effect of different
concentrations of IBA on rooting of Litchi (Litchi
Chinensis) in air layering. Pakistan Journal of
Biological Sciences, 3(2): 330-331.
Sharma, S. B., Ray, P. K. and Singh, B. K. (1990). A note on rooting and survival of litchi
layers. Indian Journal of Horticulture, 47: 174-
176.
Sicuranza, J., Castrataro, N., Johnson, B. and
Maynard, B. (2005). Softwood cutting
propagation of native Lauraceae (Lindera benzoin
and Sassafras albidum) as alternatives to invasive
horticulture plants. International Plant
Propagators' Society Combined Proceedings
2005, 55: 415-417.
Zobel, B. and Talbert, J. (1984). Applied forest
tree improvement. Waveland Press Inc., New
York. 37p.
Calorific values and gravimetric yield of six wood fuel species in Ghana J. K. Korang et al.
Ghana J. Forestry, Vol. 31, 2015, 51 – 61 51
CALORIFIC VALUES AND GRAVIMETRIC YIELD OF SIX WOOD
FUEL SPECIES IN THE FOREST TRANSITION ZONE OF GHANA
J. K. Korang, B. D. Obiri, H. Appiah and S. Awuku
CSIR- Forestry Research Institute of Ghana, University P. O. Box 63, Kumasi, Ghana.
Email: [email protected]
ABSTRACT
The biomass and energy-calorific values of six of the most common tree species used for wood fuel
production in the Transition Forest Zone of Ghana were assessed. Moisture content (mc), volatile matter
(vm), ash content (ash), fixed carbon (fc) and calorific value (cv) were determined for the species;
Azadirachta indica, Senna siamea, Anogeissus leiocarpus, Afzelia africana, Pterocarpus erinaceus and
Khaya senegalensis. Results showed that A. africana, K. senegalensis, P. erinaceus and A. indica have
the highest mc, vm, ash content and fixed carbon content, respectively. P. erinaceus gave the highest
gravimetric yield (gy) of 33.30% during carbonization, which correlated very well with green density of
the species. A. africana and A. indica posses the highest (5.17 kcal/g) and lowest (3.39 kcal/g) calorific
values for fuel wood, respectively. Similarly, A. indica and A. africana have the highest (6.79 kcal/g) and
lowest (6.07 kcal/g) calorific values for charcoal respectively. Contrary to the assertion that fast growing
species produce poor quality wood fuel, this work has shown that exotic fast growing species such as S.
siamea produces good quality charcoal.
Keywoods: Wood fuel, charcoal, fuel wood, calorific value, fuel index value
INTRODUCTION
Bioenergy in different forms is one of the most
common and easily accessible energy in the world
(Nielsen et al., 2009; Antal et al., 1990;
Chandrasekaran et al. 2012; Finco et al., 2010). In
developing countries like Ghana, wood fuel is the
most important source of bioenergy (Okello et al.,
2001), contributing between 50 to 90% of all
energy consumed (Mensah et al. 2014). Although
wood fuels are perceived as cheap source of
energy, they have a greater economy cost to the
environment. It has been reported as the cause of
forest degradation and eventually deforestation in
some countries.
The overexploitation of the forest for charcoal
production, firewood and furniture making has
resulted in the depletion of forest reserves at a
faster rate, estimated at 3% per year (Foley, 1985).
According to Emerhi (Emerhi, 2011), in sub-
Saharan countries overexploitation has resulted in
the shortage of preferred indigenous tree species
for wood fuel, and as a result wood fuel producers
have to travel longer distances to obtain preferred
species. Wood fuel consumption has led to the
depletion of over 75% of the total forest cover in
many sub-Saharan countries and thus leading to
environmental crises. The demand for bioenergy
especially wood fuel is estimated to double
between 2010 and 2030, and as such a shift to
sustainable production of biomass for wood fuel is
urgently needed for developing countries (Lund,
2007, Duku et al., 2011). The sustainability of
biomass for wood fuel will become even more
important in the coming decades, from the
Calorific values and gravimetric yield of six wood fuel species in Ghana J. K. Korang et al.
Ghana J. Forestry, Vol. 31, 2015, 51 – 61 52
environmental, economic and societal points of
view.
Switching from fuel wood to charcoal has proven
to be more conducive for most urban lifestyles as
charcoal is more convenient to use, produces less
noxious fumes when burnt and is easier to
transport. Even those households that have
switched to fossil fuels (mainly Liquefied
Petroleum Gas, LPG) use wood fuel occasionally,
often for specific traditional preparations.
According to the Ghana Statistical Service Ghana
Demographic Health Survey by Ghana Statistical
(2009), about 56% of urban households use
charcoal compare to 14% for fuel wood. Unlike
fuel wood where dead wood or tree branches are
collected, wood is harvested from the forest
through clear felling and selective logging for
charcoal production (Hosier, 1993).
The utilization of wood as a source of energy has
significantly increased during the past decade and
charcoal remains the major product. Charcoal is a
wood fuel made from burning wood in a low-
oxygen environment (pyrolysis). The yield of
charcoal is related to tree species (Ramos et al.,
2008; Bourque, et al., 2009; Shah et al., 1992).
Obiri et al. (2014) listed the preferred tree species
for wood fuel in Ghana. These tree species are
known to possess good characteristics of wood
fuel (Houehanou et al., 2011).
The chemical composition of biomass changes
between tree species (Chandrasekaran et al. 2012;
Bao et al., 2001; Oduor et al., 2013) and affects
the energy properties of wood fuel. High lignin
and extractive content of tree species are very
good candidate for wood fuel (Stevens et al.,
2010; White, 1987). Volatile matter and fixed
carbon content are the properties used to represent
the combustible chemical composition of wood
fuel (Nurmi, 1992). These components undergo
combustion to release energy during use. Tree
species with very high volatile matter and fixed
component couples with low moisture and ash
content are favorable for good wood fuel.
Little information exists on the characteristics of
some important tree species used for fuel wood in
Ghana and other developing countries. The
objective of this study was to evaluate energy
characteristics of indigenous tree species used
commonly in agroforestry farming systems and
fuel wood plantations.
METHOD AND MATERIALS
Collection of Wood Species
Wood samples for the study were obtained from
the Kintampo North District, within the Forest
Transition zone of Ghana. The area produces large
quantities of wood fuel, which are transported for
sale mainly in Accra, Kumasi and other major
towns and cities throughout the country. Six (6)
tree species, comprising two (2) exotics
(Azadirachta indica, Senna siamea) and four (4)
indigenous (Anogeissus leiocarpus, Afzelia
africana, Pterocarpus erinaceus and Khaya
senegalensis) were used in the study. Two small-
sized logs of each tree species with diameter
ranging from 10-12 cm and average length were
collected from the Kintampo North District of
Ghana. The samples were stored under shed for
eight (8) weeks to dry before measurements were
taken.
Wood Density Measurements
Basic density and moisture content of the wood
were determined based on International standards
(ASTM D2395-07a (R08), ASTM D2974-14). An
average of 50 cube samples of dimensions 2 x 2 x
2 cm (width x thickness x length) were cut for
both density and green moisture content
determination. Each cube was soaked in water
until it sunk or became swollen. The weight of the
container and the water it contained were
determined. The wood specimen was submerged

Calorific values and gravimetric yield of six wood fuel species in Ghana J. K. Korang et al.
Ghana J. Forestry, Vol. 31, 2015, 51 – 61 53
in the water, and the mass of container plus water
plus specimen was again determined. The increase
in mass of the container and its contents was equal
to the mass of water displaced by the specimen in
grams and that was numerically equal to the
volume of water (cm3) displaced by the wood
sample (ASTM D2395-07a (R08)). The wood
blocks were then oven-dried at 101±3oC to
constant mass and the oven dry mass determined.
The Green Moisture Content (gmc%) and the
Basic Density (gd), Swollen Density (sd) and
Green Density (gd) were estimated.
Physico-Chemical Properties of Wood Fuel
The wood and the charcoal cubes were milled and
sieved to determine their quality by proximate
analysis, including moisture content (mc), volatile
matter (vm), ash content (Ash) and fixed carbon
content (fc) according to the international standard
ASTM D 1762-84 (ASTM 2001a).
Moisture Content
The moisture content (mc) was found by weighing
1.00 g of the sample into a crucible. The sample
was placed in oven at 100±3°C until the mass of
the sample was constant. The sample was then
cooled in a desiccator and reweighed.
Moisture content (mc %) =Initial weight of sample
Initial weight of sample - Weight of ovendry sample
Volatile Matter The volatile matter (vm) was determined by
weighing 1.00 g of the oven-dry sample into a
crucible. The sample was then kept in a furnace at
a temperature of 550°C for 5 min, cooled in a
desiccator and re-weighed.
Volatile matter (mc %) =Weight of ovendry sample
Weight of ovendry sample - Weight of residue
Ash Content The ash content was determined by returning the
crucible into the furnace at 550°C for 30 min for
combustion. After complete combustion, the
sample was removed and cooled in a desiccator
and before weighing to obtain the weight of ash.
Ash content (Ash %) =Weight of ovendry sample
Weight of Ash
Fixed Carbon Content
Fixed carbon (fc) was computed using the formula below:
Fixed carbon (fc %) = 100 % - (Volatile matter + Ash content)
Determination of Calorific Values
The cv was determined with a bomb calorimeter
using the milled and sieved wood and charcoal
products; about 0.50 g of oven-dried sample, was
completely combusted under a pressurized (3000
kPa) oxygen atmosphere. The change in
temperature of the system was used to calculate
the calorific value.
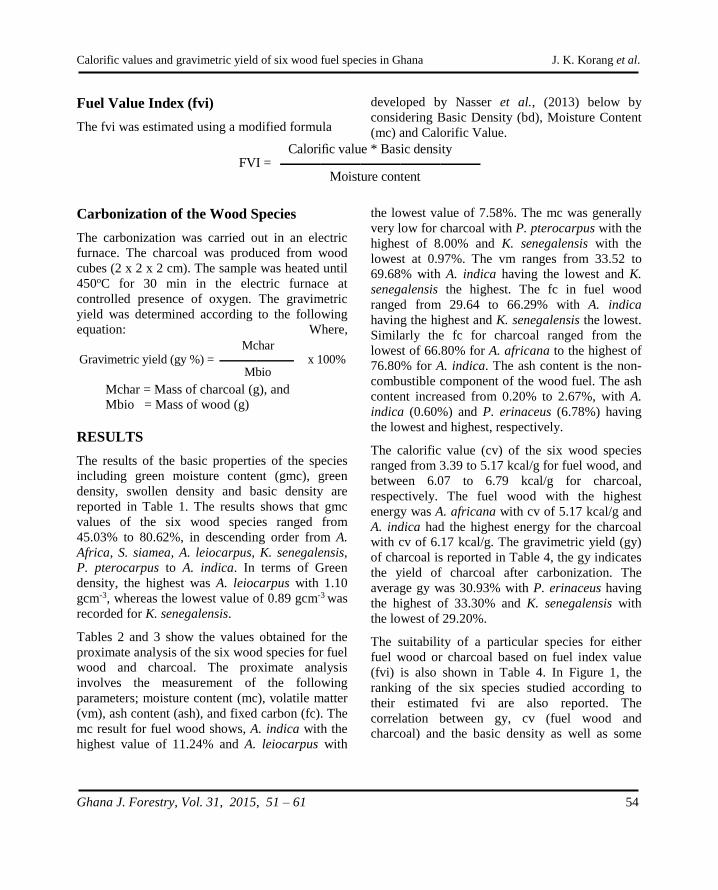
Calorific values and gravimetric yield of six wood fuel species in Ghana J. K. Korang et al.
Ghana J. Forestry, Vol. 31, 2015, 51 – 61 54
Fuel Value Index (fvi)
The fvi was estimated using a modified formula
developed by Nasser et al., (2013) below by
considering Basic Density (bd), Moisture Content
(mc) and Calorific Value.
FVI =Moisture content
Calorific value * Basic density
Carbonization of the Wood Species
The carbonization was carried out in an electric
furnace. The charcoal was produced from wood
cubes (2 x 2 x 2 cm). The sample was heated until
450oC for 30 min in the electric furnace at
controlled presence of oxygen. The gravimetric
yield was determined according to the following
equation: Where,
Gravimetric yield (gy %) =Mbio
Mcharx 100%
Mchar = Mass of charcoal (g), and
Mbio = Mass of wood (g)
RESULTS
The results of the basic properties of the species
including green moisture content (gmc), green
density, swollen density and basic density are
reported in Table 1. The results shows that gmc
values of the six wood species ranged from
45.03% to 80.62%, in descending order from A.
Africa, S. siamea, A. leiocarpus, K. senegalensis,
P. pterocarpus to A. indica. In terms of Green
density, the highest was A. leiocarpus with 1.10
gcm-3, whereas the lowest value of 0.89 gcm-3 was
recorded for K. senegalensis.
Tables 2 and 3 show the values obtained for the
proximate analysis of the six wood species for fuel
wood and charcoal. The proximate analysis
involves the measurement of the following
parameters; moisture content (mc), volatile matter
(vm), ash content (ash), and fixed carbon (fc). The
mc result for fuel wood shows, A. indica with the
highest value of 11.24% and A. leiocarpus with
the lowest value of 7.58%. The mc was generally
very low for charcoal with P. pterocarpus with the
highest of 8.00% and K. senegalensis with the
lowest at 0.97%. The vm ranges from 33.52 to
69.68% with A. indica having the lowest and K.
senegalensis the highest. The fc in fuel wood
ranged from 29.64 to 66.29% with A. indica
having the highest and K. senegalensis the lowest.
Similarly the fc for charcoal ranged from the
lowest of 66.80% for A. africana to the highest of
76.80% for A. indica. The ash content is the non-
combustible component of the wood fuel. The ash
content increased from 0.20% to 2.67%, with A.
indica (0.60%) and P. erinaceus (6.78%) having
the lowest and highest, respectively.
The calorific value (cv) of the six wood species
ranged from 3.39 to 5.17 kcal/g for fuel wood, and
between 6.07 to 6.79 kcal/g for charcoal,
respectively. The fuel wood with the highest
energy was A. africana with cv of 5.17 kcal/g and
A. indica had the highest energy for the charcoal
with cv of 6.17 kcal/g. The gravimetric yield (gy)
of charcoal is reported in Table 4, the gy indicates
the yield of charcoal after carbonization. The
average gy was 30.93% with P. erinaceus having
the highest of 33.30% and K. senegalensis with
the lowest of 29.20%.
The suitability of a particular species for either
fuel wood or charcoal based on fuel index value
(fvi) is also shown in Table 4. In Figure 1, the
ranking of the six species studied according to
their estimated fvi are also reported. The
correlation between gy, cv (fuel wood and
charcoal) and the basic density as well as some
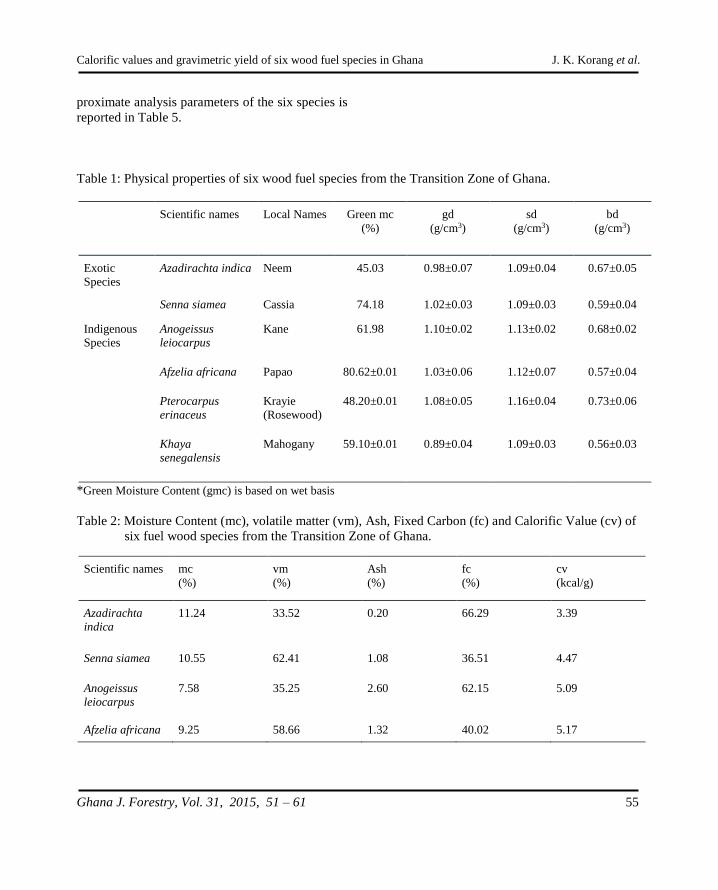
Calorific values and gravimetric yield of six wood fuel species in Ghana J. K. Korang et al.
Ghana J. Forestry, Vol. 31, 2015, 51 – 61 55
proximate analysis parameters of the six species is
reported in Table 5.
Table 1: Physical properties of six wood fuel species from the Transition Zone of Ghana.
Scientific names Local Names Green mc
(%)
gd
(g/cm3)
sd
(g/cm3)
bd
(g/cm3)
Exotic
Species
Azadirachta indica Neem 45.03 0.98±0.07 1.09±0.04 0.67±0.05
Senna siamea Cassia 74.18 1.02±0.03 1.09±0.03 0.59±0.04
Indigenous
Species
Anogeissus
leiocarpus
Kane
61.98 1.10±0.02 1.13±0.02 0.68±0.02
Afzelia africana Papao 80.62±0.01 1.03±0.06 1.12±0.07 0.57±0.04
Pterocarpus
erinaceus
Krayie
(Rosewood)
48.20±0.01 1.08±0.05 1.16±0.04 0.73±0.06
Khaya
senegalensis
Mahogany 59.10±0.01 0.89±0.04 1.09±0.03 0.56±0.03
*Green Moisture Content (gmc) is based on wet basis
Table 2: Moisture Content (mc), volatile matter (vm), Ash, Fixed Carbon (fc) and Calorific Value (cv) of
six fuel wood species from the Transition Zone of Ghana.
Scientific names mc
(%)
vm
(%)
Ash
(%)
fc
(%)
cv
(kcal/g)
Azadirachta
indica
11.24 33.52 0.20 66.29 3.39
Senna siamea 10.55 62.41 1.08 36.51 4.47
Anogeissus
leiocarpus
7.58 35.25 2.60 62.15 5.09
Afzelia africana 9.25 58.66 1.32 40.02 5.17
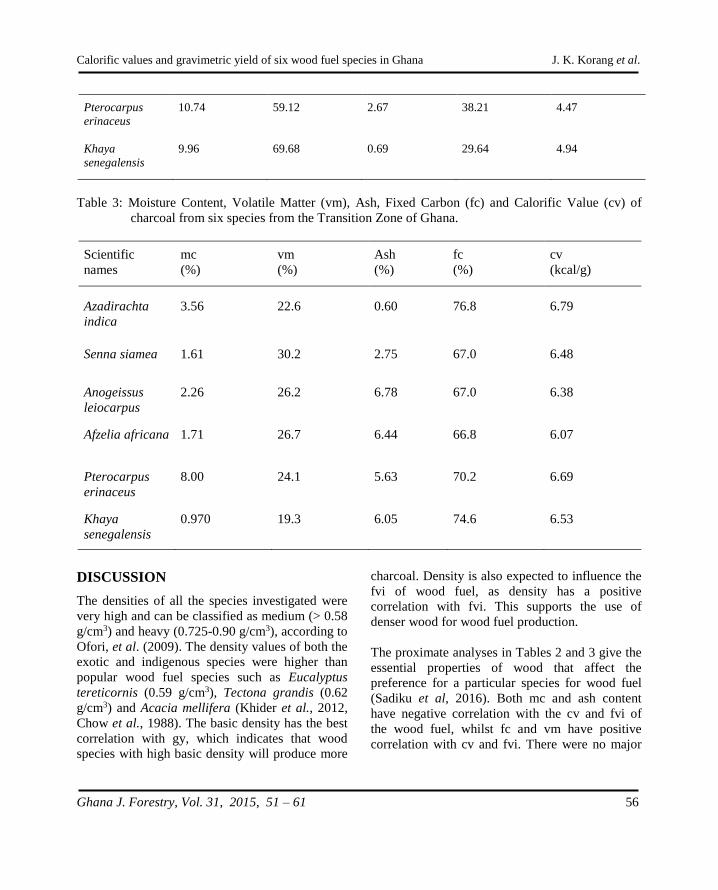
Calorific values and gravimetric yield of six wood fuel species in Ghana J. K. Korang et al.
Ghana J. Forestry, Vol. 31, 2015, 51 – 61 56
Pterocarpus
erinaceus
10.74 59.12 2.67 38.21 4.47
Khaya
senegalensis
9.96 69.68 0.69 29.64 4.94
Table 3: Moisture Content, Volatile Matter (vm), Ash, Fixed Carbon (fc) and Calorific Value (cv) of
charcoal from six species from the Transition Zone of Ghana.
Scientific
names
mc
(%)
vm
(%)
Ash
(%)
fc
(%)
cv
(kcal/g)
Azadirachta
indica
3.56 22.6 0.60 76.8 6.79
Senna siamea 1.61 30.2 2.75 67.0 6.48
Anogeissus
leiocarpus
2.26 26.2 6.78 67.0 6.38
Afzelia africana 1.71 26.7 6.44 66.8 6.07
Pterocarpus
erinaceus
8.00 24.1 5.63 70.2 6.69
Khaya
senegalensis
0.970 19.3 6.05 74.6 6.53
DISCUSSION
The densities of all the species investigated were
very high and can be classified as medium (> 0.58
g/cm3) and heavy (0.725-0.90 g/cm3), according to
Ofori, et al. (2009). The density values of both the
exotic and indigenous species were higher than
popular wood fuel species such as Eucalyptus
tereticornis (0.59 g/cm3), Tectona grandis (0.62
g/cm3) and Acacia mellifera (Khider et al., 2012,
Chow et al., 1988). The basic density has the best
correlation with gy, which indicates that wood
species with high basic density will produce more
charcoal. Density is also expected to influence the
fvi of wood fuel, as density has a positive
correlation with fvi. This supports the use of
denser wood for wood fuel production.
The proximate analyses in Tables 2 and 3 give the
essential properties of wood that affect the
preference for a particular species for wood fuel
(Sadiku et al, 2016). Both mc and ash content
have negative correlation with the cv and fvi of
the wood fuel, whilst fc and vm have positive
correlation with cv and fvi. There were no major
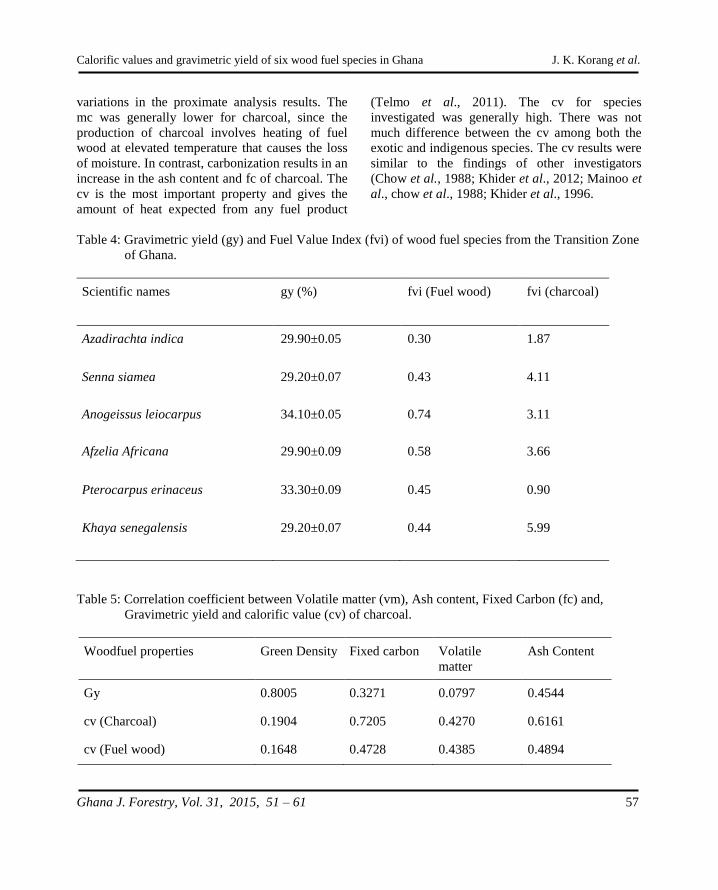
Calorific values and gravimetric yield of six wood fuel species in Ghana J. K. Korang et al.
Ghana J. Forestry, Vol. 31, 2015, 51 – 61 57
variations in the proximate analysis results. The
mc was generally lower for charcoal, since the
production of charcoal involves heating of fuel
wood at elevated temperature that causes the loss
of moisture. In contrast, carbonization results in an
increase in the ash content and fc of charcoal. The
cv is the most important property and gives the
amount of heat expected from any fuel product
(Telmo et al., 2011). The cv for species
investigated was generally high. There was not
much difference between the cv among both the
exotic and indigenous species. The cv results were
similar to the findings of other investigators
(Chow et al., 1988; Khider et al., 2012; Mainoo et
al., chow et al., 1988; Khider et al., 1996.
Table 4: Gravimetric yield (gy) and Fuel Value Index (fvi) of wood fuel species from the Transition Zone
of Ghana.
Scientific names gy (%) fvi (Fuel wood) fvi (charcoal)
Azadirachta indica 29.90±0.05 0.30 1.87
Senna siamea 29.20±0.07 0.43 4.11
Anogeissus leiocarpus 34.10±0.05 0.74 3.11
Afzelia Africana 29.90±0.09 0.58 3.66
Pterocarpus erinaceus 33.30±0.09 0.45 0.90
Khaya senegalensis 29.20±0.07 0.44 5.99
Table 5: Correlation coefficient between Volatile matter (vm), Ash content, Fixed Carbon (fc) and,
Gravimetric yield and calorific value (cv) of charcoal.
Woodfuel properties Green Density Fixed carbon Volatile
matter
Ash Content
Gy 0.8005 0.3271 0.0797 0.4544
cv (Charcoal) 0.1904 0.7205 0.4270 0.6161
cv (Fuel wood) 0.1648 0.4728 0.4385 0.4894
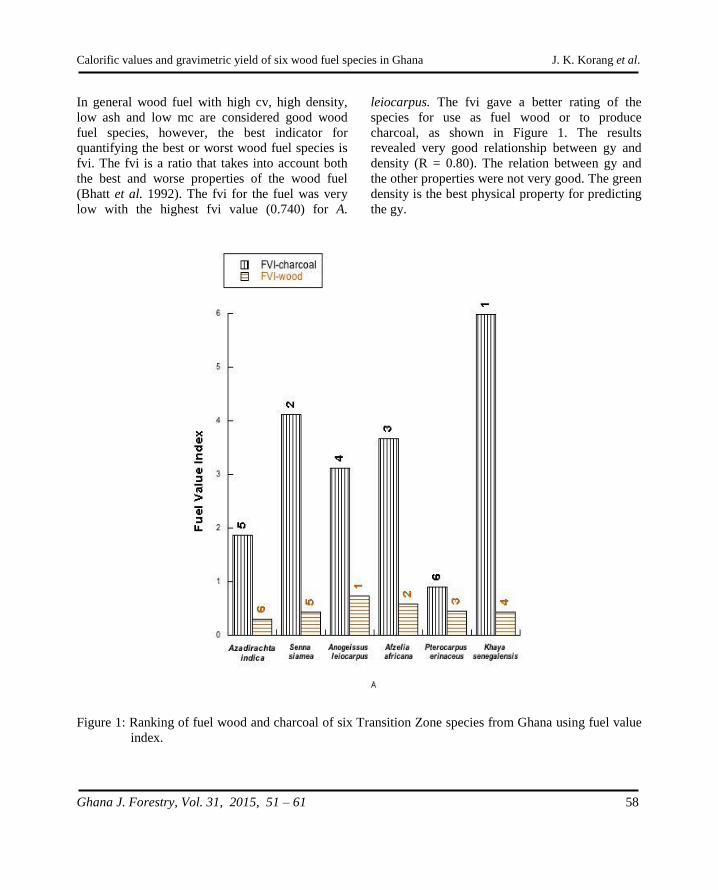
Calorific values and gravimetric yield of six wood fuel species in Ghana J. K. Korang et al.
Ghana J. Forestry, Vol. 31, 2015, 51 – 61 58
In general wood fuel with high cv, high density,
low ash and low mc are considered good wood
fuel species, however, the best indicator for
quantifying the best or worst wood fuel species is
fvi. The fvi is a ratio that takes into account both
the best and worse properties of the wood fuel
(Bhatt et al. 1992). The fvi for the fuel was very
low with the highest fvi value (0.740) for A.
leiocarpus. The fvi gave a better rating of the
species for use as fuel wood or to produce
charcoal, as shown in Figure 1. The results
revealed very good relationship between gy and
density (R = 0.80). The relation between gy and
the other properties were not very good. The green
density is the best physical property for predicting
the gy.
Figure 1: Ranking of fuel wood and charcoal of six Transition Zone species from Ghana using fuel value
index.
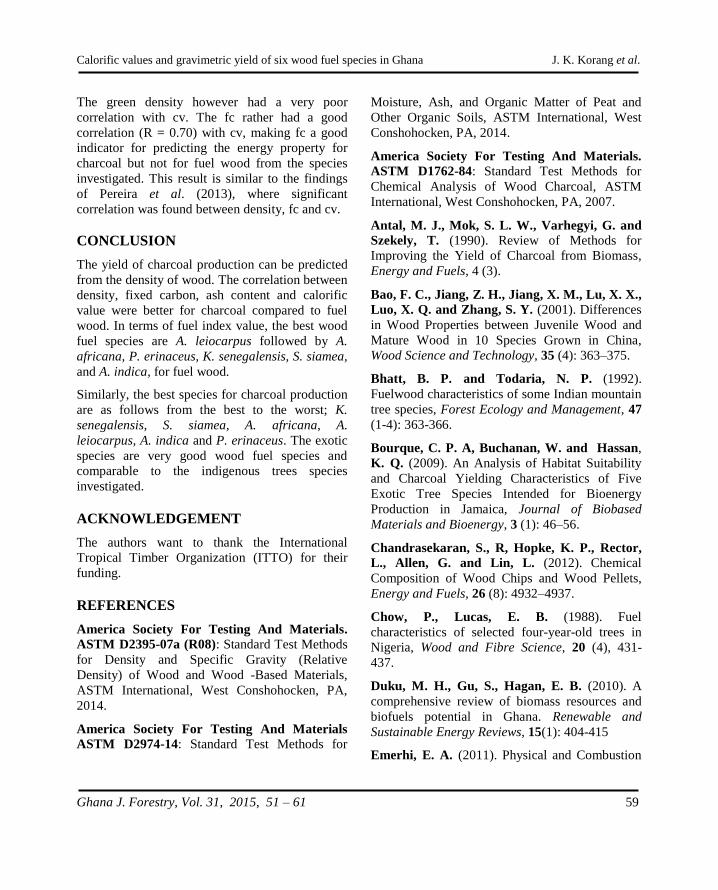
Calorific values and gravimetric yield of six wood fuel species in Ghana J. K. Korang et al.
Ghana J. Forestry, Vol. 31, 2015, 51 – 61 59
The green density however had a very poor
correlation with cv. The fc rather had a good
correlation (R = 0.70) with cv, making fc a good
indicator for predicting the energy property for
charcoal but not for fuel wood from the species
investigated. This result is similar to the findings
of Pereira et al. (2013), where significant
correlation was found between density, fc and cv.
CONCLUSION
The yield of charcoal production can be predicted
from the density of wood. The correlation between
density, fixed carbon, ash content and calorific
value were better for charcoal compared to fuel
wood. In terms of fuel index value, the best wood
fuel species are A. leiocarpus followed by A.
africana, P. erinaceus, K. senegalensis, S. siamea,
and A. indica, for fuel wood.
Similarly, the best species for charcoal production
are as follows from the best to the worst; K.
senegalensis, S. siamea, A. africana, A.
leiocarpus, A. indica and P. erinaceus. The exotic
species are very good wood fuel species and
comparable to the indigenous trees species
investigated.
ACKNOWLEDGEMENT
The authors want to thank the International
Tropical Timber Organization (ITTO) for their
funding.
REFERENCES
America Society For Testing And Materials.
ASTM D2395-07a (R08): Standard Test Methods
for Density and Specific Gravity (Relative
Density) of Wood and Wood -Based Materials,
ASTM International, West Conshohocken, PA,
2014.
America Society For Testing And Materials ASTM D2974-14: Standard Test Methods for
Moisture, Ash, and Organic Matter of Peat and
Other Organic Soils, ASTM International, West
Conshohocken, PA, 2014.
America Society For Testing And Materials.
ASTM D1762-84: Standard Test Methods for
Chemical Analysis of Wood Charcoal, ASTM
International, West Conshohocken, PA, 2007.
Antal, M. J., Mok, S. L. W., Varhegyi, G. and
Szekely, T. (1990). Review of Methods for
Improving the Yield of Charcoal from Biomass,
Energy and Fuels, 4 (3).
Bao, F. C., Jiang, Z. H., Jiang, X. M., Lu, X. X.,
Luo, X. Q. and Zhang, S. Y. (2001). Differences
in Wood Properties between Juvenile Wood and
Mature Wood in 10 Species Grown in China,
Wood Science and Technology, 35 (4): 363–375.
Bhatt, B. P. and Todaria, N. P. (1992).
Fuelwood characteristics of some Indian mountain
tree species, Forest Ecology and Management, 47
(1-4): 363-366.
Bourque, C. P. A, Buchanan, W. and Hassan,
K. Q. (2009). An Analysis of Habitat Suitability
and Charcoal Yielding Characteristics of Five
Exotic Tree Species Intended for Bioenergy
Production in Jamaica, Journal of Biobased
Materials and Bioenergy, 3 (1): 46–56.
Chandrasekaran, S., R, Hopke, K. P., Rector,
L., Allen, G. and Lin, L. (2012). Chemical
Composition of Wood Chips and Wood Pellets,
Energy and Fuels, 26 (8): 4932–4937.
Chow, P., Lucas, E. B. (1988). Fuel
characteristics of selected four-year-old trees in
Nigeria, Wood and Fibre Science, 20 (4), 431-
437.
Duku, M. H., Gu, S., Hagan, E. B. (2010). A
comprehensive review of biomass resources and
biofuels potential in Ghana. Renewable and
Sustainable Energy Reviews, 15(1): 404-415
Emerhi, E. A. (2011). Physical and Combustion
Calorific values and gravimetric yield of six wood fuel species in Ghana J. K. Korang et al.
Ghana J. Forestry, Vol. 31, 2015, 51 – 61 60
Properties of Briquettes Produced from Sawdust
of Three Hardwood Species and Different Organic
Binders. Advances in Applied Science Research, 2
(6): 236-46.
Finco, V. A. M. and Doppler, W. (2010).
Bioenergy and Sustainable Development: The
Dilemma of Food Security and Climate Change in
the Brazilian Savannah. Energy for Sustainable
Development, 14 (3): 194–199.
Foley, G. (1985). Wood Fuel and Conventional
Fuel Demands in the Developing World. Energy
in Developing Countries, 14 (4/5): 253–258.
Ghana Statistical Service (GSS), Ghana
Demographic Health Survey (GHS), and ICF
Macro. (2009). Ghana Demographic and Health
Survey 2008. Accra, Ghana: GSS, GHS, and ICF
Macro.
Hosier, R. H. (1993). Charcoal Production and
Environmental Degradation. Environmental
History, Selective Harvesting, and Post-Harvest
Management. Energy Policy, 21 (5): 491–509.
Houehanou, D. T., Assogbadjo, E. A., Kakaï, G.
R., Houinato, M. and Sinsin, B. (2011).
Valuation of Local Preferred Uses and Traditional
Ecological Knowledge in Relation to Three
Multipurpose Tree Species in Benin, West Africa.
Forest Policy and Economics, 13 (7): 554-562.
Khider, T. O. and Elsaki, O. T. (2012). Heat
value of four hardwood species from Sudan.
Journal of Forest Products and Industries, 1 (2),
5-9.
Lund, H. (2007). Renewable Energy Strategies
for Sustainable Development. Energy, 32 (6):
912–919.
Mainoo, A. A. and Ulzen-Appiah, F. (1996).
Growth, wood yield and energy characteristics of
Leucaena leucocephala, Gliricidia sepium and
Senna siamea at age four years. Ghana Journal of
Forestry, 3: 69-79.
Mensah, G. S., Kemausuor, F. and Brew-
Hammond, A. (2014). Energy Access Indicators
and Trends in Ghana. Renewable and Sustainable
Energy Reviews, 30: 317-323.
Nasser, A. R., Salem, M. Z. M., Al-Mefarrej, A.
H. Abdel-Aal, A. M. and Soliman, S. S. (2013).
Fuel Characteristics of Vine Prunings (Vitis
vinifera L.) as a Potential Source for Energy
Production. BioResources, 9 (1): 482–496.
Nielsen, K. P. N., Gardner, D., Poulsen, T. and
Felby, C. (2009). Importance of Temperature,
Moisture Content, and Species for the Conversion
Process of Wood Residues into Fuel Pellets. Wood
and Fiber Science, 41 (4): 414–425.
Nurmi, J. (1992). Measurement and Evaluation of
Wood Fuel. Biomass and Bioenergy, 2 (1-6): 157–
171.
Obiri, B. D., Nunoo, I., Obeng, E., Owusu, F. O.
and Marfo, E. (2014). The Charcoal Industry in
Ghana: An Alternative Livelihood Option for
Displaced Illegal Chainsaw Lumber Producers.
Tropenbos International, Wageningen, The
Netherlands.
Oduor, M. N. and Githiomi J. K. (2013). Fuel-
Wood Energy Properties of Prosopis Spp in
Baringo District, Kenya. African Journal of
Agricultural Research, 8 (21): 2476–2481.
Ofori, J., Brentuo, B., Mensah, M.,
Mohammed, A. I. and Boama-Tawiah, R. (2009). Properties of 10 Ghanaian high density
lesser-used-species of importance to bridge
constrcution – part 1: Green moisture content,
basic density and shrinkage characteristics. Ghana
Journal of Forestry, 25: 67-77.
Okello, B. D., O’Connor, T. G. and Young, T.
P. (2001). Growth, Biomass Estimates, and
Charcoal Production of Acacia drepanolobium in
Laikipia, Kenya. Forest Ecology and
Management, 142 (1-3): 143–153.
Calorific values and gravimetric yield of six wood fuel species in Ghana J. K. Korang et al.
Ghana J. Forestry, Vol. 31, 2015, 51 – 61 61
Pereira, B. L. C., Carneiro, A. C. O., Carvalho,
A. M. M. L., Colodette, J. L. Oliveira, C. A.,
Ramos, M. A., Medeiros, P. M., Ana, A. L. S.
A., Feliciano, L. P. and Albuquerque, U. P.
(2008). Can wood quality justify local preferences
for firewood in an Area of caatinga (dryland)
Vegetation? Biomass and Bioenergy, 32 (6): 503–
509.
Sadiku, A. N., Oluyege, O. A. and Sadiku, B. I.
(2016). Analysis of the Calorific and Fuel Value
Index of Bamboo as a Source of Renewable
Biomass Feedstock for Enegry Generation in
Nigeria. Lignocellulose, 5 (1), 34-49.
Shah, N., Girard, P., Mezerette, C. Vergnet, A.
M. (1992). Wood-to-charcoal conversion in a
partial-combustion kiln: an experimental study to
understand and Upgrade the Process. Fuel, 71 (8):
955–962.
Stevens, J. and Gardner, J. D. (2010).
Enhancing the Fuel Value of Wood Pellets with
the Addition of Lignin. Wood and Fiber Science,
42 (4): 439–443.
Telmo, C. and Lousada, J. (2011). Heating
Values of Wood Pellets from Different Species.
Biomass and Bioenergy, 35 (7): 2634–2639.
White, R. (1987). Effect of Lignin Content and
Extractives on the Higher Heating Value of Wood.
Wood and Fiber Science, 19 (4): 446 – 452.
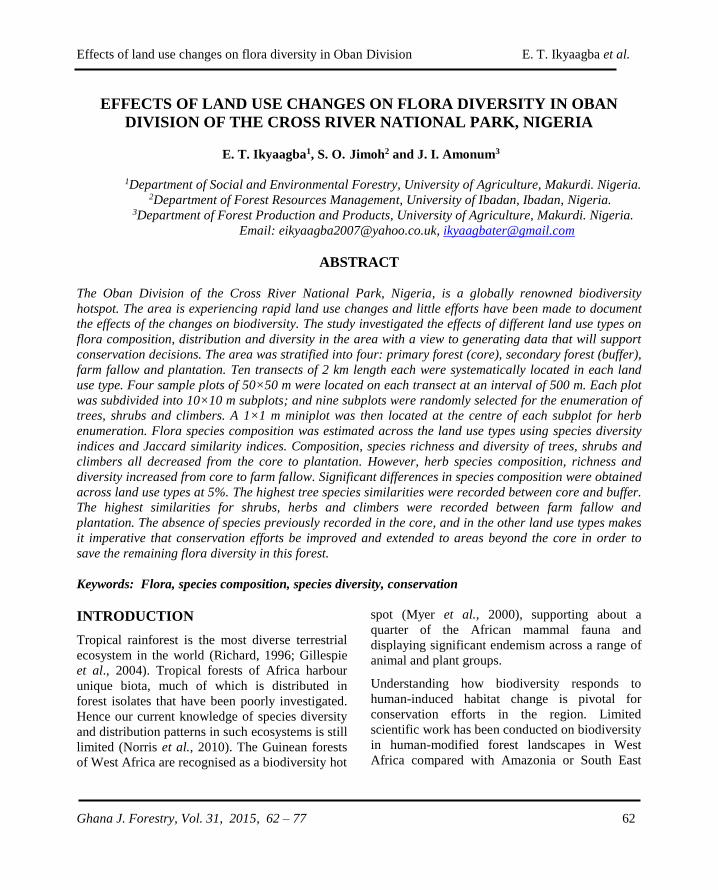
Effects of land use changes on flora diversity in Oban Division E. T. Ikyaagba et al.
Ghana J. Forestry, Vol. 31, 2015, 62 – 77 62
EFFECTS OF LAND USE CHANGES ON FLORA DIVERSITY IN OBAN
DIVISION OF THE CROSS RIVER NATIONAL PARK, NIGERIA
E. T. Ikyaagba1, S. O. Jimoh2 and J. I. Amonum3
1Department of Social and Environmental Forestry, University of Agriculture, Makurdi. Nigeria.
2Department of Forest Resources Management, University of Ibadan, Ibadan, Nigeria. 3Department of Forest Production and Products, University of Agriculture, Makurdi. Nigeria.
Email: [email protected], [email protected]
ABSTRACT
The Oban Division of the Cross River National Park, Nigeria, is a globally renowned biodiversity
hotspot. The area is experiencing rapid land use changes and little efforts have been made to document
the effects of the changes on biodiversity. The study investigated the effects of different land use types on
flora composition, distribution and diversity in the area with a view to generating data that will support
conservation decisions. The area was stratified into four: primary forest (core), secondary forest (buffer),
farm fallow and plantation. Ten transects of 2 km length each were systematically located in each land
use type. Four sample plots of 50×50 m were located on each transect at an interval of 500 m. Each plot
was subdivided into 10×10 m subplots; and nine subplots were randomly selected for the enumeration of
trees, shrubs and climbers. A 1×1 m miniplot was then located at the centre of each subplot for herb
enumeration. Flora species composition was estimated across the land use types using species diversity
indices and Jaccard similarity indices. Composition, species richness and diversity of trees, shrubs and
climbers all decreased from the core to plantation. However, herb species composition, richness and
diversity increased from core to farm fallow. Significant differences in species composition were obtained
across land use types at 5%. The highest tree species similarities were recorded between core and buffer.
The highest similarities for shrubs, herbs and climbers were recorded between farm fallow and
plantation. The absence of species previously recorded in the core, and in the other land use types makes
it imperative that conservation efforts be improved and extended to areas beyond the core in order to
save the remaining flora diversity in this forest.
Keywords: Flora, species composition, species diversity, conservation
INTRODUCTION
Tropical rainforest is the most diverse terrestrial
ecosystem in the world (Richard, 1996; Gillespie
et al., 2004). Tropical forests of Africa harbour
unique biota, much of which is distributed in
forest isolates that have been poorly investigated.
Hence our current knowledge of species diversity
and distribution patterns in such ecosystems is still
limited (Norris et al., 2010). The Guinean forests
of West Africa are recognised as a biodiversity hot
spot (Myer et al., 2000), supporting about a
quarter of the African mammal fauna and
displaying significant endemism across a range of
animal and plant groups.
Understanding how biodiversity responds to
human-induced habitat change is pivotal for
conservation efforts in the region. Limited
scientific work has been conducted on biodiversity
in human-modified forest landscapes in West
Africa compared with Amazonia or South East
Effects of land use changes on flora diversity in Oban Division E. T. Ikyaagba et al.
Ghana J. Forestry, Vol. 31, 2015, 62 – 77 63
Asia (Gardner et al., 2009). Oban Division of
Cross River National Park (CRNP) in Nigeria is
located within the Guinean forests of West Africa
which is known to be among the top 25
biodiversity hot spots in the world (Myer et al.,
2000). Oban Division of CRNP is the only area in
the sub-region with near intact largest block of
contiguous forest and high level of endemism
(Oates et al., 2004). Bergl et al. (2007) listed some
taxa in the area that show high level of species
richness and endemism to including primates,
amphibians, birds, butterflies, dragonflies, fish and
vascular plants.
Despite the biological value of the forest of this
area the future of the area is not secured. This is
because the Park is surrounded by 39 enclave
communities with high population density (Fa et.
al., 2006). As a consequence, the remaining
forests are becoming increasingly degraded and
fragmented. Oates et al. (2004) tag the area as
“understudied” with little efforts being made to
document the biological effects of land use
changes going on in the area. Onadeko (2006)
concluded that basic data needed to support the
management and conservation of Oban Division
of CRNP is scarce and certain taxa remain
understudied. Therefore, the effects of different
land use types on flora species composition,
distribution and abundance was investigated with
a view to generating data that will support
conservation efforts in the area.
The Study Area
The Oban Division of CRNP was carved out of
Oban group Forest Reserve in 1991. It is located
in Cross River State, Nigeria, within latitudes
05o15' and 05o25'N, and longitudes 08o30' and
08o45'E (Figure 1). The total area (including
buffer zones), is about 3,000 km2. The area of
farm fallow and plantation is not specified as they
occur in several locations and in varying sizes at
the periphery of the park. The park shares a
boundary with Korup National Park, Cameroon, in
the east. Annual rainfall ranges between 2,500 and
3,000 mm (Oates et al., 2004; Bisong and Mfon,
2006; Jimoh et al., 2012).
Relative humidity is about 75-95% in January, but
towards the end of the year, it reduces gradually to
below 70% as a result of the harmattan (Bisong
and Mfon, 2006, Jimoh et al., 2012). Altitude
ranges from 100 to over 1,000 m above sea level
(Oates et al., 2004). Four vegetation types are
distinguishable within the park. These include
high forest, ridge forest, secondary forest (buffer
zone) and swamp forest. Patches of oil palm and
cocoa plantations as well as farm fallows exist in
various locations at the periphery of the park.
Schmitt (1996) identified 1,303 species of plants,
141 lichens, and 56 mosses within the park.
Seventy seven of these are endemic to Nigeria.
Fauna diversity includes 134 mammals, 318 birds,
42 snakes, and over 1,266 butterflies (Schmitt,
1996).
Some of the typical tree species found in the area
include; Pericopsis elata (Harms) Van Meeuwen,
Amphimas pterocarpoides Harms, Enantia
chlorantha (A DC) van Setten and Maas,
Entandrophragma spp, Hannoa klaineana Pierre
and Engl, Irvingia spp (Aubry-Lecomte) Bail,
Khaya grandifoliola C.DC. Lophira alata Banks
exGaertn.f. Milicia excelsa(Welw.) C.C. Berg,
Piptadeniastrum africanum (Hook.f) Brenan,
Piptostigma pilosum Oliv,. Strombosia schefflei
Engl. Tabernaemontana spp, Terminalia spp and
Treculia spp, (Jimoh et al., 2012).
Study Design and Data Collection
Oban Division of CRNP is divided into two
corridors, the West and East corridors. The
Western corridor is made up of eight villages,
while the Eastern Corridor has 31 villages. With
the permission of the management of the park, the
study was conducted in all the corridors. Five
villages: Obung (Erokut), Old Ekuri and Ifumkpa
in the West and Aking/ Osomba and Ekang in the
East were purposively selected from these
corridors based on their proximity to the park as
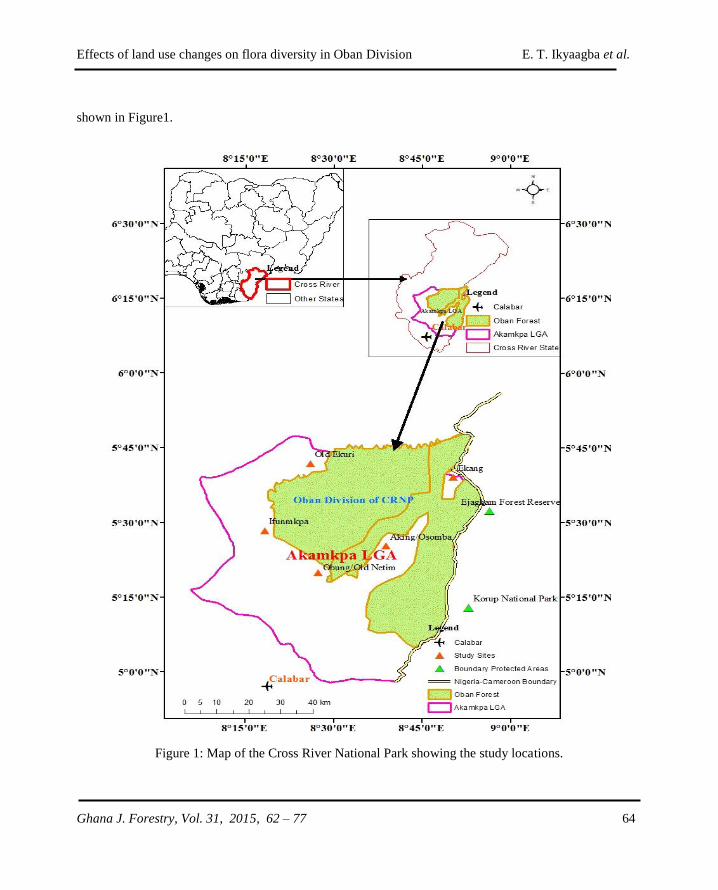
Effects of land use changes on flora diversity in Oban Division E. T. Ikyaagba et al.
Ghana J. Forestry, Vol. 31, 2015, 62 – 77 64
shown in Figure1.
Figure 1: Map of the Cross River National Park showing the study locations.
Effects of land use changes on flora diversity in Oban Division E. T. Ikyaagba et al.
Ghana J. Forestry, Vol. 31, 2015, 62 – 77 65
The study was conducted in the four major land
use types in the Oban Division of CRNP namely;
primary forest (core), secondary forest (buffer),
farm fallow and plantation. Ten transects of 2 km
length each were systematically located in each
land use type at a regular interval of 2 km apart,
this was to cover different gradients present in the
study area (Walter et al., 2006). Four sample plots
of 50 × 50 m were located on each transect at an
interval of 500 m. Each plot was sub-divided into
10×10 m subplots and nine subplots were
randomly selected for trees, shrubs and climbers
enumeration. A 1×1 m miniplot was then located
at the centre of each subplot (Sullivan et al., 2005;
Turyahabwe and Tweheyo, 2010). Within the 50 x
50 m plots, trees with diameter at breast height
(DBH) ≥ 10 cm and climbers were enumerated.
Trees with DBH of ≤ 10 cm considered as shrubs
and saplings and they were enumerated within the
10 x10 m subplots (Sullivan et al., 2005;
Turyahabwe and Tweheyo, 2010). All the herbs
and seedlings within the 1 x 1 m sub-plots were
also enumerated. Each of the trees encountered
was assigned a class based on DBH (Sullivan et
al., 2005, Turyahabwe and Tweheyo, 2010).
Diameters of trees were measured using a
diameter tape. Where there were cases of irregular
features such as buttresses, diameters were taken
above those features (Turyahabwe and Tweheyo,
2010).
The identification of plant samples was carried out
using flora field guides (Keay, 1989; Akobundu
and Agyakwa, 1998; Arbonnier, 2004). A
taxonomist was engaged for the identification of
the plants on the field. Those that could not be
identified on the field were preserved in wooden
press and taken to the Forestry Research Institute
of Nigeria Ibadan Herbarium for proper
identification. Identified species were grouped
into species, genera and families.
Floristic composition in the various land use types
were estimated using density, species richness,
diversity and evenness.
Density was estimated:
Density = Number of individuals species
Area sampled
Species richness was computed using Margalef
Index Magurran (2004) as follows:
N
SD
ln
1 ………………...................(1)
Where, D = species richness index (Margalef
Index), S = number of species and N = the total
number of individuals.
Species diversity was estimated using the
Shannon-wiener diversity index as cited
Turyahabwe and Tweheyo (2010). The Shannon-
wiener diversity index equation is stated as:
i
s
i
i ppH ln1
……………………………………......(2)
Where H′ = species diversity index, pi = the
proportion of individuals or the abundance of the
ith species expressed as a proportion of the total
abundance. The use of natural logs is usual
because this gives information in binary digits.
Species evenness was estimated using Pielou’s
evenness (equitability) index (Pielou, 1975) as
cited by Turyahabwe and Tweheyo (2010) as
follows:
Species evenness was estimated using Pielou’s
evenness (equitability) index (Pielou, 1966) as
cited by Odiwe et al. (2012) as follows:
SIn
HJ
…………………..................................(3)
J′ = Pielou’s evenness index Where S is the total
species number, H is the diversity index and ln=
natural logarithm.
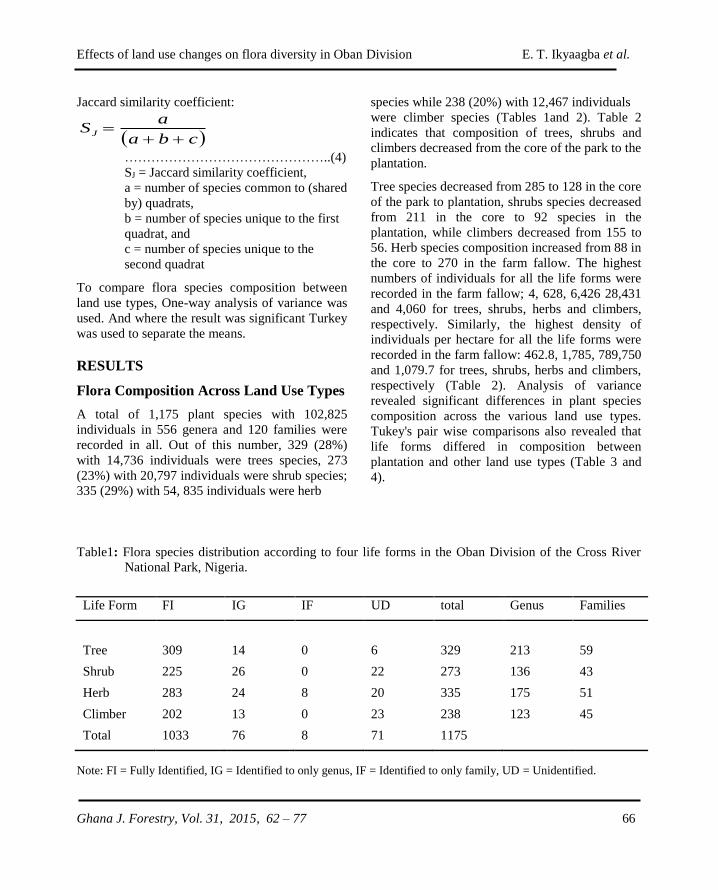
Effects of land use changes on flora diversity in Oban Division E. T. Ikyaagba et al.
Ghana J. Forestry, Vol. 31, 2015, 62 – 77 66
Jaccard similarity coefficient:
cba
aSJ
………………………………………..(4)
SJ = Jaccard similarity coefficient,
a = number of species common to (shared
by) quadrats,
b = number of species unique to the first
quadrat, and
c = number of species unique to the
second quadrat
To compare flora species composition between
land use types, One-way analysis of variance was
used. And where the result was significant Turkey
was used to separate the means.
RESULTS
Flora Composition Across Land Use Types
A total of 1,175 plant species with 102,825
individuals in 556 genera and 120 families were
recorded in all. Out of this number, 329 (28%)
with 14,736 individuals were trees species, 273
(23%) with 20,797 individuals were shrub species;
335 (29%) with 54, 835 individuals were herb
species while 238 (20%) with 12,467 individuals
were climber species (Tables 1and 2). Table 2
indicates that composition of trees, shrubs and
climbers decreased from the core of the park to the
plantation.
Tree species decreased from 285 to 128 in the core
of the park to plantation, shrubs species decreased
from 211 in the core to 92 species in the
plantation, while climbers decreased from 155 to
56. Herb species composition increased from 88 in
the core to 270 in the farm fallow. The highest
numbers of individuals for all the life forms were
recorded in the farm fallow; 4, 628, 6,426 28,431
and 4,060 for trees, shrubs, herbs and climbers,
respectively. Similarly, the highest density of
individuals per hectare for all the life forms were
recorded in the farm fallow: 462.8, 1,785, 789,750
and 1,079.7 for trees, shrubs, herbs and climbers,
respectively (Table 2). Analysis of variance
revealed significant differences in plant species
composition across the various land use types.
Tukey's pair wise comparisons also revealed that
life forms differed in composition between
plantation and other land use types (Table 3 and
4).
Table1: Flora species distribution according to four life forms in the Oban Division of the Cross River
National Park, Nigeria.
Life Form FI IG IF UD total Genus Families
Tree 309 14 0 6 329 213 59
Shrub 225 26 0 22 273 136 43
Herb 283 24 8 20 335 175 51
Climber 202 13 0 23 238 123 45
Total 1033 76 8 71 1175
Note: FI = Fully Identified, IG = Identified to only genus, IF = Identified to only family, UD = Unidentified.
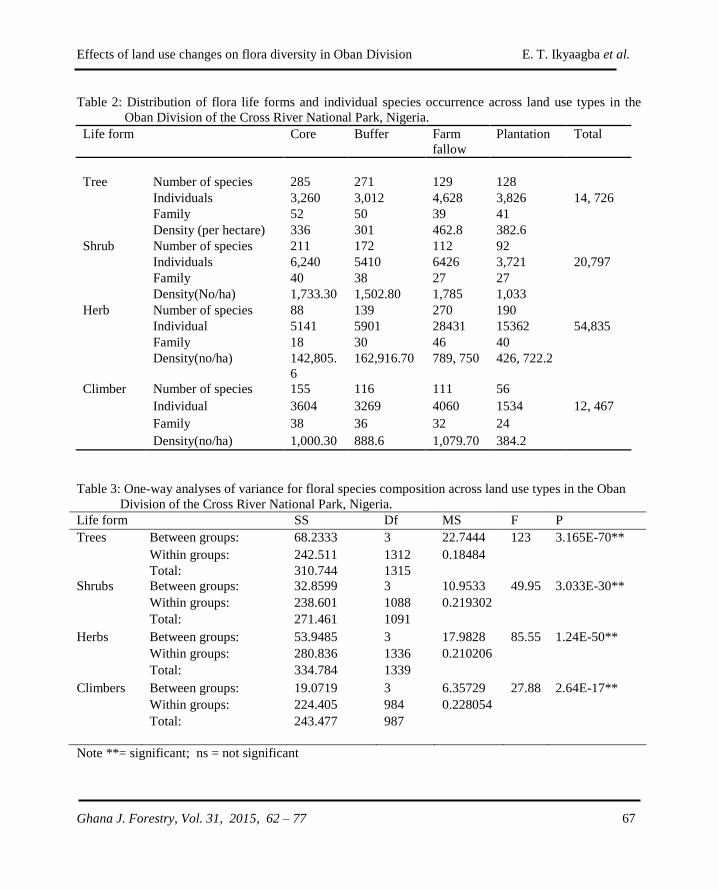
Effects of land use changes on flora diversity in Oban Division E. T. Ikyaagba et al.
Ghana J. Forestry, Vol. 31, 2015, 62 – 77 67
Table 2: Distribution of flora life forms and individual species occurrence across land use types in the
Oban Division of the Cross River National Park, Nigeria.
Life form Core Buffer Farm
fallow
Plantation Total
Tree Number of species 285 271 129 128
Individuals 3,260 3,012 4,628 3,826 14, 726
Family 52 50 39 41
Density (per hectare) 336 301 462.8 382.6
Shrub Number of species 211 172 112 92
Individuals 6,240 5410 6426 3,721 20,797
Family 40 38 27 27
Density(No/ha) 1,733.30 1,502.80 1,785 1,033
Herb Number of species 88 139 270 190
Individual 5141 5901 28431 15362 54,835
Family 18 30 46 40
Density(no/ha) 142,805.
6
162,916.70 789, 750 426, 722.2
Climber Number of species 155 116 111 56
Individual 3604 3269 4060 1534 12, 467
Family 38 36 32 24
Density(no/ha) 1,000.30 888.6 1,079.70 384.2
Table 3: One-way analyses of variance for floral species composition across land use types in the Oban
Division of the Cross River National Park, Nigeria.
Life form SS Df MS F P
Trees Between groups: 68.2333 3 22.7444 123 3.165E-70**
Within groups: 242.511 1312 0.18484
Total: 310.744 1315
Shrubs Between groups: 32.8599 3 10.9533 49.95 3.033E-30**
Within groups: 238.601 1088 0.219302
Total: 271.461 1091
Herbs Between groups: 53.9485 3 17.9828 85.55 1.24E-50**
Within groups: 280.836 1336 0.210206
Total: 334.784 1339
Climbers Between groups: 19.0719 3 6.35729 27.88 2.64E-17**
Within groups: 224.405 984 0.228054
Total: 243.477 987
Note **= significant; ns = not significant
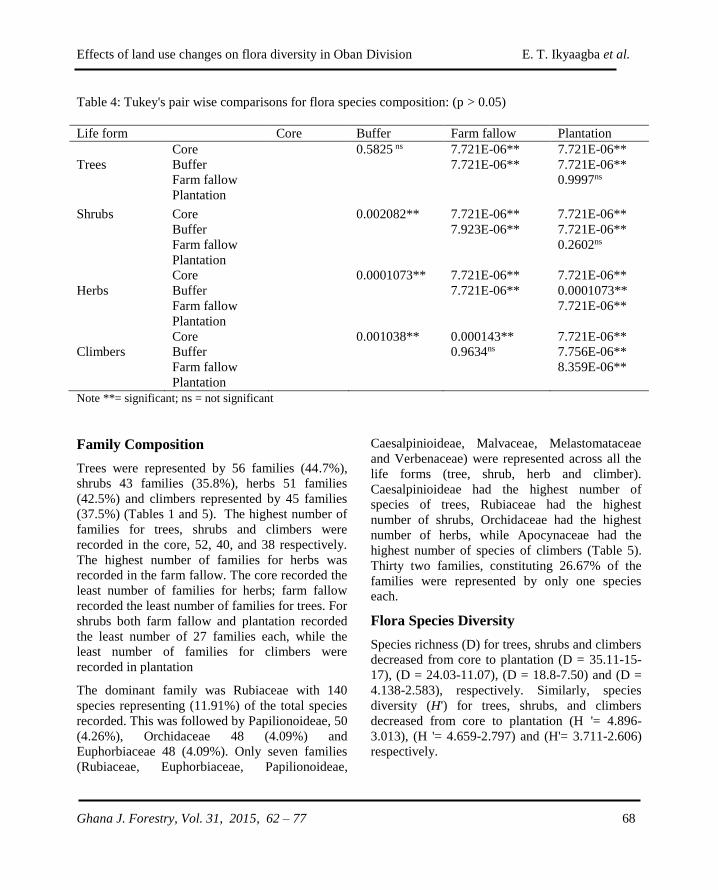
Effects of land use changes on flora diversity in Oban Division E. T. Ikyaagba et al.
Ghana J. Forestry, Vol. 31, 2015, 62 – 77 68
Table 4: Tukey's pair wise comparisons for flora species composition: (p > 0.05)
Life form Core Buffer Farm fallow Plantation
Core 0.5825 ns 7.721E-06** 7.721E-06**
Trees Buffer 7.721E-06** 7.721E-06**
Farm fallow 0.9997ns
Plantation
Shrubs Core 0.002082** 7.721E-06** 7.721E-06**
Buffer 7.923E-06** 7.721E-06**
Farm fallow 0.2602ns
Plantation
Core 0.0001073** 7.721E-06** 7.721E-06**
Herbs Buffer 7.721E-06** 0.0001073**
Farm fallow 7.721E-06**
Plantation
Core 0.001038** 0.000143** 7.721E-06**
Climbers Buffer 0.9634ns 7.756E-06**
Farm fallow 8.359E-06**
Plantation
Note **= significant; ns = not significant
Family Composition
Trees were represented by 56 families (44.7%),
shrubs 43 families (35.8%), herbs 51 families
(42.5%) and climbers represented by 45 families
(37.5%) (Tables 1 and 5). The highest number of
families for trees, shrubs and climbers were
recorded in the core, 52, 40, and 38 respectively.
The highest number of families for herbs was
recorded in the farm fallow. The core recorded the
least number of families for herbs; farm fallow
recorded the least number of families for trees. For
shrubs both farm fallow and plantation recorded
the least number of 27 families each, while the
least number of families for climbers were
recorded in plantation
The dominant family was Rubiaceae with 140
species representing (11.91%) of the total species
recorded. This was followed by Papilionoideae, 50
(4.26%), Orchidaceae 48 (4.09%) and
Euphorbiaceae 48 (4.09%). Only seven families
(Rubiaceae, Euphorbiaceae, Papilionoideae,
Caesalpinioideae, Malvaceae, Melastomataceae
and Verbenaceae) were represented across all the
life forms (tree, shrub, herb and climber).
Caesalpinioideae had the highest number of
species of trees, Rubiaceae had the highest
number of shrubs, Orchidaceae had the highest
number of herbs, while Apocynaceae had the
highest number of species of climbers (Table 5).
Thirty two families, constituting 26.67% of the
families were represented by only one species
each.
Flora Species Diversity
Species richness (D) for trees, shrubs and climbers
decreased from core to plantation (D = 35.11-15-
17), (D = 24.03-11.07), (D = 18.8-7.50) and (D =
4.138-2.583), respectively. Similarly, species
diversity (H') for trees, shrubs, and climbers
decreased from core to plantation (H '= 4.896-
3.013), (H '= 4.659-2.797) and (H'= 3.711-2.606)
respectively.
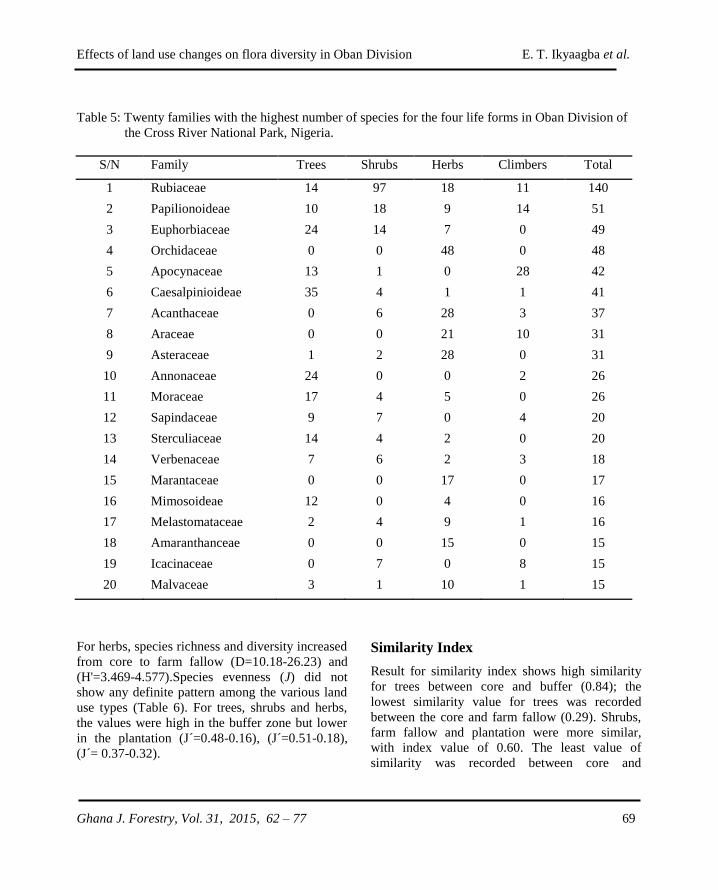
Effects of land use changes on flora diversity in Oban Division E. T. Ikyaagba et al.
Ghana J. Forestry, Vol. 31, 2015, 62 – 77 69
Table 5: Twenty families with the highest number of species for the four life forms in Oban Division of
the Cross River National Park, Nigeria.
S/N Family Trees Shrubs Herbs Climbers Total
1 Rubiaceae 14 97 18 11 140
2 Papilionoideae 10 18 9 14 51
3 Euphorbiaceae 24 14 7 0 49
4 Orchidaceae 0 0 48 0 48
5 Apocynaceae 13 1 0 28 42
6 Caesalpinioideae 35 4 1 1 41
7 Acanthaceae 0 6 28 3 37
8 Araceae 0 0 21 10 31
9 Asteraceae 1 2 28 0 31
10 Annonaceae 24 0 0 2 26
11 Moraceae 17 4 5 0 26
12 Sapindaceae 9 7 0 4 20
13 Sterculiaceae 14 4 2 0 20
14 Verbenaceae 7 6 2 3 18
15 Marantaceae 0 0 17 0 17
16 Mimosoideae 12 0 4 0 16
17 Melastomataceae 2 4 9 1 16
18 Amaranthanceae 0 0 15 0 15
19 Icacinaceae 0 7 0 8 15
20 Malvaceae 3 1 10 1 15
For herbs, species richness and diversity increased
from core to farm fallow (D=10.18-26.23) and
(H'=3.469-4.577).Species evenness (J) did not
show any definite pattern among the various land
use types (Table 6). For trees, shrubs and herbs,
the values were high in the buffer zone but lower
in the plantation (J´=0.48-0.16), (J´=0.51-0.18),
(J´= 0.37-0.32).
Similarity Index
Result for similarity index shows high similarity
for trees between core and buffer (0.84); the
lowest similarity value for trees was recorded
between the core and farm fallow (0.29). Shrubs,
farm fallow and plantation were more similar,
with index value of 0.60. The least value of
similarity was recorded between core and
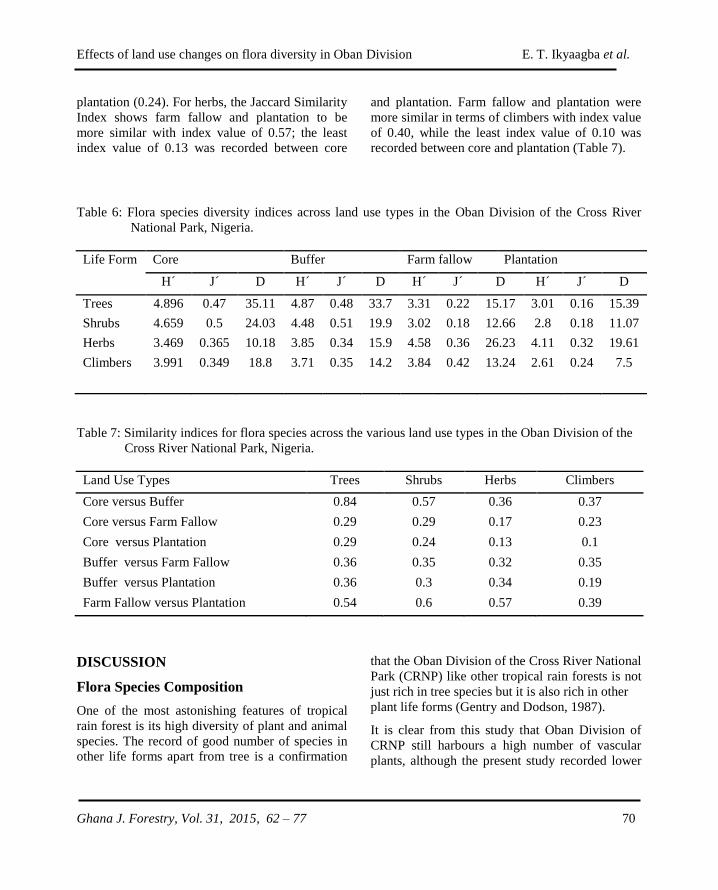
Effects of land use changes on flora diversity in Oban Division E. T. Ikyaagba et al.
Ghana J. Forestry, Vol. 31, 2015, 62 – 77 70
plantation (0.24). For herbs, the Jaccard Similarity
Index shows farm fallow and plantation to be
more similar with index value of 0.57; the least
index value of 0.13 was recorded between core
and plantation. Farm fallow and plantation were
more similar in terms of climbers with index value
of 0.40, while the least index value of 0.10 was
recorded between core and plantation (Table 7).
Table 6: Flora species diversity indices across land use types in the Oban Division of the Cross River
National Park, Nigeria.
Life Form Core Buffer Farm fallow Plantation
H´ J´ D H´ J´ D H´ J´ D H´ J´ D
Trees 4.896 0.47 35.11 4.87 0.48 33.7 3.31 0.22 15.17 3.01 0.16 15.39
Shrubs 4.659 0.5 24.03 4.48 0.51 19.9 3.02 0.18 12.66 2.8 0.18 11.07
Herbs 3.469 0.365 10.18 3.85 0.34 15.9 4.58 0.36 26.23 4.11 0.32 19.61
Climbers 3.991 0.349 18.8 3.71 0.35 14.2 3.84 0.42 13.24 2.61 0.24 7.5
Table 7: Similarity indices for flora species across the various land use types in the Oban Division of the
Cross River National Park, Nigeria.
Land Use Types Trees Shrubs Herbs Climbers
Core versus Buffer 0.84 0.57 0.36 0.37
Core versus Farm Fallow 0.29 0.29 0.17 0.23
Core versus Plantation 0.29 0.24 0.13 0.1
Buffer versus Farm Fallow 0.36 0.35 0.32 0.35
Buffer versus Plantation 0.36 0.3 0.34 0.19
Farm Fallow versus Plantation 0.54 0.6 0.57 0.39
DISCUSSION
Flora Species Composition
One of the most astonishing features of tropical
rain forest is its high diversity of plant and animal
species. The record of good number of species in
other life forms apart from tree is a confirmation
that the Oban Division of the Cross River National
Park (CRNP) like other tropical rain forests is not
just rich in tree species but it is also rich in other
plant life forms (Gentry and Dodson, 1987).
It is clear from this study that Oban Division of
CRNP still harbours a high number of vascular
plants, although the present study recorded lower
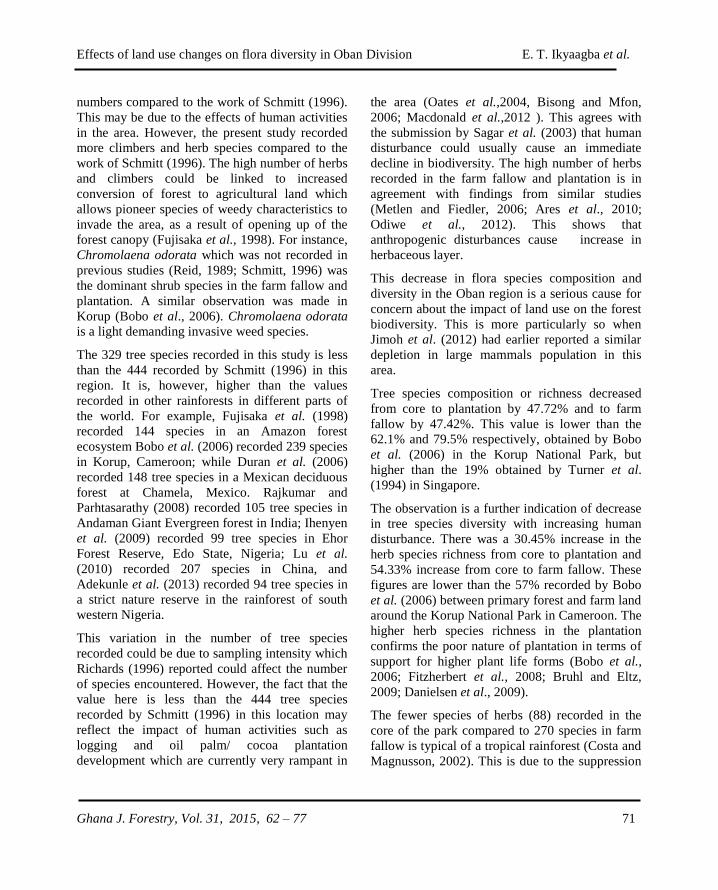
Effects of land use changes on flora diversity in Oban Division E. T. Ikyaagba et al.
Ghana J. Forestry, Vol. 31, 2015, 62 – 77 71
numbers compared to the work of Schmitt (1996).
This may be due to the effects of human activities
in the area. However, the present study recorded
more climbers and herb species compared to the
work of Schmitt (1996). The high number of herbs
and climbers could be linked to increased
conversion of forest to agricultural land which
allows pioneer species of weedy characteristics to
invade the area, as a result of opening up of the
forest canopy (Fujisaka et al., 1998). For instance,
Chromolaena odorata which was not recorded in
previous studies (Reid, 1989; Schmitt, 1996) was
the dominant shrub species in the farm fallow and
plantation. A similar observation was made in
Korup (Bobo et al., 2006). Chromolaena odorata
is a light demanding invasive weed species.
The 329 tree species recorded in this study is less
than the 444 recorded by Schmitt (1996) in this
region. It is, however, higher than the values
recorded in other rainforests in different parts of
the world. For example, Fujisaka et al. (1998)
recorded 144 species in an Amazon forest
ecosystem Bobo et al. (2006) recorded 239 species
in Korup, Cameroon; while Duran et al. (2006)
recorded 148 tree species in a Mexican deciduous
forest at Chamela, Mexico. Rajkumar and
Parhtasarathy (2008) recorded 105 tree species in
Andaman Giant Evergreen forest in India; Ihenyen
et al. (2009) recorded 99 tree species in Ehor
Forest Reserve, Edo State, Nigeria; Lu et al.
(2010) recorded 207 species in China, and
Adekunle et al. (2013) recorded 94 tree species in
a strict nature reserve in the rainforest of south
western Nigeria.
This variation in the number of tree species
recorded could be due to sampling intensity which
Richards (1996) reported could affect the number
of species encountered. However, the fact that the
value here is less than the 444 tree species
recorded by Schmitt (1996) in this location may
reflect the impact of human activities such as
logging and oil palm/ cocoa plantation
development which are currently very rampant in
the area (Oates et al.,2004, Bisong and Mfon,
2006; Macdonald et al.,2012 ). This agrees with
the submission by Sagar et al. (2003) that human
disturbance could usually cause an immediate
decline in biodiversity. The high number of herbs
recorded in the farm fallow and plantation is in
agreement with findings from similar studies
(Metlen and Fiedler, 2006; Ares et al., 2010;
Odiwe et al., 2012). This shows that
anthropogenic disturbances cause increase in
herbaceous layer.
This decrease in flora species composition and
diversity in the Oban region is a serious cause for
concern about the impact of land use on the forest
biodiversity. This is more particularly so when
Jimoh et al. (2012) had earlier reported a similar
depletion in large mammals population in this
area.
Tree species composition or richness decreased
from core to plantation by 47.72% and to farm
fallow by 47.42%. This value is lower than the
62.1% and 79.5% respectively, obtained by Bobo
et al. (2006) in the Korup National Park, but
higher than the 19% obtained by Turner et al.
(1994) in Singapore.
The observation is a further indication of decrease
in tree species diversity with increasing human
disturbance. There was a 30.45% increase in the
herb species richness from core to plantation and
54.33% increase from core to farm fallow. These
figures are lower than the 57% recorded by Bobo
et al. (2006) between primary forest and farm land
around the Korup National Park in Cameroon. The
higher herb species richness in the plantation
confirms the poor nature of plantation in terms of
support for higher plant life forms (Bobo et al.,
2006; Fitzherbert et al., 2008; Bruhl and Eltz,
2009; Danielsen et al., 2009).
The fewer species of herbs (88) recorded in the
core of the park compared to 270 species in farm
fallow is typical of a tropical rainforest (Costa and
Magnusson, 2002). This is due to the suppression
Effects of land use changes on flora diversity in Oban Division E. T. Ikyaagba et al.
Ghana J. Forestry, Vol. 31, 2015, 62 – 77 72
by tree canopy which could only permit shade-
loving species to thrive under closed canopy
(LaFrankie et al., 2006). The number of herb
species recorded in the core of the park was
similar to what is obtainable in other tropical
rainforests. For instance, Poulsen and Balslev
(1991) recorded 96 herbs species in Ecuador,
Poulsen and Balslev (1996) listed 87 herb species
in Borneo.
Family Composition
The dominance of the families such as Rubiaceae,
Euphorbiaceae, Fabaceae (Papilionoideae,
Caesalpinioideae, Mimosoideae), Apocynaceae,
Acanthaceae, Asteraceae and Moraceae in this
study is comparable with the results of other
studies in other rain forest regions ( Kessler et al.,
2005; Ihenyen et al., 2009; Mbue et al., 2009;
Rasingam and Parathasarathy, 2009; Adekunle et
al., 2013). The poor representation of most of the
families is typical of the African rain forest (Plana,
2004).
Five out of the nine plant families endemic to the
Guineo-Congolian Region are found in Oban Hills
Region (Schmitt, 1996). Four of the families
(Lepidobotryaceae, Octoknemaceae, Pandaceae,
and Scytopetalaceae) were recorded in this study.
All of them were recorded in the core and buffer
zones of the park. This implies that one of them,
Medusandraceae, might have become locally
extinct as it was with Yellow-backed and Bay
duikers in the area (Jimoh et al., 2012). Also most
of the families recorded in this study, especially
those in the herbaceous and shrubby life forms,
like Acanthaceae, Amaranthaceae, Aracaceae,
Asteraceae, Commelinaceae are strongly
associated with land use pressures (Houlahan et
al., 2006).
Species Diversity
The H' index range of 3.02-4.66 in shrub layer and
3.47-4.58 in the herb layer, suggests less variation
in species diversity in the herb layer than in the
shrub layer in the four land use types. As
suggested by Lu et al. (2011), high H' index and
low J´ index of the understory in the four land use
types indicate that the species diversity of the
understory in this the area may be constituted by
rare species or dominated by few species. In all
the four land use types, the evenness of shrubs was
relatively low (0.18-0.51) indicating that only few
species like; Olax gambecola and Chromolaena
odorata, clearly dominate core and buffer; farm
fallow and plantation respectively. For instance,
the evenness index was lower in farm fallow
(0.18) which was dominated by Chromolaena
odorata.
A Similar pattern was observed for herbs. The
evenness index was higher in the core (0.3648)
with 88 species compared with the plantation
(0.32) with 190 species. This shows that plantation
was dominated by few species like Commelina
benghalensis, Ageratum conyzoides, Celosia
leptostachya, Asystasia gangetica, and Acanthus
montanus. This higher dominance is attributable to
continued anthropogenic disturbances which
favoured herbaceous layer (Ares et al., 2010; Lu et
al., 2011).
The lower values of species evenness recorded in
the study may also be an indication of poor
representation of some genera and families, most
of which were represented by only one species,
even though they contribute greatly to the
diversity indices. This poor representation was
also recorded by Rasingam and Parathasarathy
(2009) in India and Adekunle et al. (2013) in a
strict nature reserve in the rainforest of south
western Nigeria. It also indicates that most of the
families in the area have species that are not
evenly distributed; giving rise to fragile nature of
most of the families, genera and species. The
ecological implication of this is that continued
disturbance of this ecosystem may cause local
extinction of some of the species or genera or even
some families. The decrease in plant species
diversity from core to plantation indicates that
Effects of land use changes on flora diversity in Oban Division E. T. Ikyaagba et al.
Ghana J. Forestry, Vol. 31, 2015, 62 – 77 73
land use has an impact on plants diversity in the
study area (Bobo et al., 2006). Other studies also
show similar pattern (Fusjisaka et al., 1997; Sagar
et al., 2003; Gradstein et al., 2007; Mbue et al.,
2009).
However, there was an exception with herbs, as
the composition and diversity increased from core
to plantation and was highest in the farm fallow,
suggesting that herbs are favoured by land use
change as competition from trees for light and
below-ground resources is reduced (Ares et al.,
2010). This is in line with the observation by
Schulze et al. (2004) that, diversity indices may
not always decrease with human disturbances, but
in some instances it may stimulate increase in
occurrences of other species.
The decreased diversity values of the other life
forms (trees, shrubs and climbers) from core to
plantation, according to Norris et al. (2010), could
be as a result of land preparation method for the
establishment of such plantation. This view was
expressed by Bobo et al. (2006) in a different way
which links it to poor farm management methods.
This study however, agrees with the view of
Norris et al. (2010), which ascribed the
observation to poor land preparation in which the
land is bulldozed or slashed and burned.
Similarity Index
Not much variation was observed between buffer
and the core in terms of floristic composition,
richness and diversity in the study area. There was
no discernible pattern of flora species occurrence
as one moved from buffer to the core of the park.
The species richness and diversity values are
similar. A similar pattern was reported in the
Korup National Park (Zapfack et al., 2002; Bobo
et al., 2006; Mbue et al., 2009). This similarity is
an indication that the buffer and core are the same
forest with minimal human impacts. Another
possible reason for the similarity could be an
indication of recovery of buffer areas after human
disturbance especially logging activities, which
allows for the re-establishment of species which
are usually considered old growth forest
specialists in the buffer (Fujisaka et al., 1998;
Laidlaw et al., 2007; Chazdon et al., 2009).
Chazdon et al. (2009), opined that this similarity
could be age-dependent., even though the present
study did not assess the age of the secondary
forest but the similarity was more pronounced in
Aking, Ekuri, Obung / Old Netim Erokut and
Ifumkpa where human activities especially
farming, in the buffer, was minimal.
CONCLUSION
There is significant impact of land use on plant
species diversity in the study area. Tree species
composition decreased from 444 in 1996 to 329 in
2013 implying a loss of about 26%. Herbs were
favoured by forest conversion to other land uses
especially agriculture (farm fallow and plantation).
Vascular plant species especially trees, shrubs and
climbers are more reactive to the land-use change
as they exhibit a decrease in species richness and
diversity from core to plantation. Even though the
area is highly diverse, especially the core of the
park, where the vegetation is near primary forest
the biotic community appears to be ecologically
fragile, as there is a high number of rare flora
species with many species and families
represented by only one individual or species.
Some of the species and families are endemic and
have specialized habitats which make them more
vulnerable to extinction. Medusandraceae, one of
the five endemic families in Oban Hills was not
recorded during this study, and it appears the
family has become locally extinct. Therefore
continued conversion of their particular habitat by
human activities is a threat to their continued
existence in the area.
It is recommended that, good land use planning be
put in place and implemented. Also conservation
efforts in the area should extend beyond the core
and buffer zones to include support zone
communities if the future of this remnant of the
Effects of land use changes on flora diversity in Oban Division E. T. Ikyaagba et al.
Ghana J. Forestry, Vol. 31, 2015, 62 – 77 74
biologically diverse Gulf of Guinea forest in
Nigeria is to be saved.
ACKNOWLEDGEMENTS
We thank the Volkswagen Foundation, Hanover,
Germany, for providing the grant to the University
of Ibadan, Nigeria, within its ‘Africa Initiative’ –
‘Knowledge for Tomorrow – Cooperative
Research Projects in sub-Saharan Africa’ which
made this study possible. We are grateful to the
Federal Board for National Park Service, Abuja,
the Conservator of Cross River National Park,
Chief J. Keffa, for permitting us to carry out the
study within the Park, and other members of staff
of the Cross River National Park, for their kind
assistance in planning and logistics. We must
appreciate the contributions of Mr. Adamu Usman
Afikpo of blessed memory; he was indeed a friend
and a helper. We also appreciate the assistance of
local community members in the Oban Sector of
CRNP for their enthusiastic support during field
work. We acknowledged the contributions of Dr.
Matthias Waltert and our other colleagues on the
project.
REFERENCES
Adekunle, V. A. J., Olagoke, A. O. and
Akindele, S. O. (2013). Tree species diversity and
structure of a Nigerian strict nature reserve.
Tropical Ecology, 54 (3): 275-289.
Akobundu, I. O. and Agyakwa, C. W. (1998). A
handbook of West African Weeds, 2nd ed. Ibadan:
IITA. 1 - 420pp.
Arbonnier, M. (2004). Trees, Shrubs and Lianas
of West African dry zones. Paris, CIRAD, 1-
573pp.
Ares, A., Neill, A. R. and Puettmann, K. J.
(2010). Understory abundance, species diversity
and functional attribute response to thinning in
coniferous stands. Forest Ecology and
Management, 260:1104 - 1113.
Bergl, R. A., Oates, J. F. and Fotsoe, R. (2007).
Distribution and protected area coverage of
endemic taxa in West Africa’s Biafran forests and
highlands Biological Conservation, 134: 195 -
208.
Bisong, F. E. and Mfon, P. Jnr . (2006). Effect
of logging on stand damage in rainforest of sourth-
eastern Nigeria. West African Journal of Applied
Ecology, 10: 119-12
Bobo, K. S., Waltert, M., Sainge, N. M.,
Njokagbor, J., Fermon, H. and Muhlenberg, M.
(2006). From forest to farmland: species richness
patterns of trees and understorey plants along a
gradient of forest conversion in southwestern
Cameroon. Biodiversity and Conservation, 15:
4097 – 4117.
Bruhl, C. A. and Eltz, T. (2009). Fuelling the
biodiversity crisis: species loss of ground-dwelling
forest ants in oil palm plantations in Sabah,
Malaysia (Borneo). Biodiversity Conservation, 19
(2) :519 - 529.
Chazdon, R. L., Harvey, C. A., Komar, O.,
Griffith, D. M., Ferguson, B. G., Martınez-
Ramos, M., Morales, H., Nigh, R., Soto-Pinto,
L., Van Breugel, M. and Philpott, S. M. (2009).
Beyond Reserves: A Research Agenda for
Conserving Biodiversity in Human-modified
Tropical Landscapes: Biotropica, 41 (2): 142 –
153.
Costa, F. and Magnusson, W. (2002). Selective
logging effects on abundance, diversity, and
composition of tropical understory herbs.
Ecological Applications, 12 (3): 807 – 819.
Danielsen, F., Beukema, H., Burgess, N. D.,
Parish, F., Bruhl, C. A., Donald, P. F.,
Murdiyarso, D., Phalan, B., Reijnders, L.,
Struebig, M. and Fitzherbert, E. B. (2009).
Biofuel plantations on forested lands: double
jeopardy for biodiversity and climate.
Conservation Biology, 23: 348 – 358.
Effects of land use changes on flora diversity in Oban Division E. T. Ikyaagba et al.
Ghana J. Forestry, Vol. 31, 2015, 62 – 77 75
Dodson, E. K., Peterson, D. W. and Harrod, R.
J. (2008). Understory vegetation response to
thinning and burning restoration treatments in dry
coniferous forests of the eastern Cascades, USA.
Forest Ecology and Management, 255: 3130 -
3140.
Duran, E., Meave, J. A., Lott, D. J. and Segura,
G. (2006). Structure and tree diversity patterns at
landscape level in a Mexican tropical deciduous
forest. Boletin de Sociedad Botanica de Mexico,
79: 43 - 60.
Eniang, E. A., Eniang, M. E. and Akpan, C.
E. (2008). Bush meat trading in the Oban Hills
Region of South- Eastern Nigeria : Implication for
sustainable Livelihoods and Conservation.
Ethiopian Journal of environmental studies and
management, 1 (1) 70 – 83.
Fa, J. E., Seymour, S., Dupain, J., Amin, R.,
Albrechtsen, L. and Macdonald, D. (2006).
Getting to grips with the magnitude of
exploitation: Bushmeat in the Cross - Sanaga river
region, Nigeria and Cameroon. Biological
Conservation, 129: 497 - 510.
Fujisaka, S., Escobar, G. and Veneklaas, E. J.
(1998). Plant community diversity relative to
human land uses in an Amazon forest colony.
Biodiversity and Conservation, 7: 41–57
Fitzherbert, E. B., Struebig, M. J., Morel, A.,
Danielsen, F., Bruhl, C. A., Donald, P. F. and
Phalan, B. (2008). "How will oil palm expansion
affect biodiversity?. Trends in Ecology and
Evolution, 23: 538 – 45.
Gardner, T. A., Barlow, J., Chazdon, R.,
Ewers, R. M., Harvey, C. A., Peres, C. A. and
Sodhi, N. S. (2009). Prospects for tropical forest
biodiversity in a human-modified world. Ecology
Letters, 12: 561 – 582.
Gentry, A. H. and Dodson, C. D. (1987).Contribution of non-trees to species
richness of a tropical rainforest. Biotropica, 19:
149 – 156.
Gillespie, T. W., Brock, J. and Wright, C. W.
(2004). Prospects for quantifying structure,
floristic composition and species richness of
tropical forests; International Journal Remote
Sensing, 25 (4): 707 – 715.
Gradstein, S. R., Kessler, M. and Pitopang, R.
(2007). Tree species diversity relative to human
land uses in tropical rain forest margins in Central
Sulawesi Tscharntke T, Leuschner C, Zeller M,
Guhardja E, Bidin A (eds), The stability of
tropical rainforest margins, linking ecological,
economic and social constraints of land use and
conservation, Springer Verlag Berlin 2007, 321-
334 pp.
Houlahan, J., Keddy, P. A. and Findlay, C. S.
(2006). The effects of adjacent land use on
wetland species richness and community
composition. Wetlands, 26 (1): 79 - 96.
Ihenyen, J., Okoegwale, E. E., Mensah, J. K.
(2009). Composition of Tree Species In Ehor
Forest Reserve, Edo State, Nigeria. Nature and
Science, 7 (8): 8 – 18.
Jimoh, S. O., Ikyaagba, E. T., Aralape, A. A.,
Adeyemi, A. A. and Waltert, M. (2012). Local
depletion of two larger Duikers in the Oban Hills
Region, Nigeria. African Journal Ecology, 51, 228
– 234.
Kessler, M., Keßler, P. J. A., Gradstein, S. R.,
Bach, K., Schmull, M. and Pitopang, R. (2005).
Tree diversity in primary forest and different land
use systems in Central Sulawesi, Indonesia.
Biodiversity and Conservation, 14: 547 – 560.
LaFrankie, J. V., Ashton, P. S., Chuyong, G. B.,
Co, L., Condit, R., Davies, S. J., Foster, R.,
Hubbell, S. P., Kenfack, D., Lagunzad, D.,
Losos, E. C., Nor, N. S. M., Tan, S., Thomas,
D. W., Valencia, R. and Villa, G. (2006).
Contrasting structure and composition of the
understory in species-rich tropical rain forests.
Ecology, 87 (9): 2298 - 2305.
Effects of land use changes on flora diversity in Oban Division E. T. Ikyaagba et al.
Ghana J. Forestry, Vol. 31, 2015, 62 – 77 76
Laidlaw, M. R. L., Kitching, K. G., Small, A.
and Stork, N. (2007). Temporal and spatial
variation in an Australian tropical rainforest.
Austral Ecology, 32 (1): 10 – 20.
Lü, X. T., Yin, J. X. and Tang, J. W. (2010).
Structure, tree species diversity and composition
of tropical seasonal rain forests in Xishuangbanna,
south-west China. Journal of Tropical Forest
Science, 22: 260 – 270.
Lü, X. T., Yin, J. X. , Tang, J. W. (2011).
Diversity and composition of understory
vegetation in the tropical seasonal rain forest of
Xishuangbanna, SW China. Revista de Biología
Tropical, 59 (1): 455 – 463.
Magurran, A. E. (2004). Measuring Biological
Diversity Blackwell Science, Oxford. pp.1 - 70.
Mbue, I. N., Ge, J., Kanyamanda, K., Njamnsi,
Y. N. and Samake, M. (2009). Floristic
inventory and diversity assessment of lowland
African Montane Rainforest at Korup, Cameroon
and implications for conservation. African.
Journal of Ecology, 48: 759 – 768.
Macdonald, D. W., Johnson, P. J., Albrechtsen,
L., Seymour,S., Dupain, J., Hall, A. and Fa, E.
J. (2012). Bush Meat trae in Cross-sanga river
region: Evidence for the Importance Protected
areas. Biological Conservation, 147: 107 – 114.
Metlen, K. L. and Fiedler, C. E. (2006).
Restoration treatment effects on the understory of
ponderosa pine/Douglas-fir forests in western
Montana, USA. Forest Ecology and Management,
222:355 - 369.
Myers, N., Mittermeier, R. A., Mittermeier, C.
G., Da Fonseca, G. A. B. and Kent, J. (2000).
Biodiversity hotspots for conservation priorities.
Nature, 403:853 – 858.
Norris, K., Asase, A., Collen, B., Gockowksi, J.,
Mason, J., Phalan, B. and Wade, A. (2010).
Biodiversity in a forest-agriculture mosaic – The
changing face of West African rainforests.
Biological Conservtion.143: 2341 – 2350.
Oates, J. F., Bergl, R. A. and Linder, J. M. (2004). Africa’s Gulf of Guinea Forests:
Biodiversity Patterns and Conservation Priorities:
Advances in Applied Biodiversity Science,
number 6.Conservation International, Washington
D.C. pp. 1 – 95.
Odiwe, A. I., Olowoyo, J. O. and Ajiboye, O. (2012). Effects of land-use change on under storey
species composition and distribution in tropical
rainforest. Notulae Scientia Biologicae, 4 (1): 150-
156.
Onadeko, A. (2006). An amphibian survey of the
Oban hill division of cross river National park,
NCF - WCS Biodiversity research programme.
Accessed from http://www.wcsnigeria.org/wild-
places/cross-river-np-oban.aspx on 21/6/2011.
Plana, V. (2004). Mechanisms and tempo of
evolution in the African Guineo–Congolian
rainforest Philosophical Transactions Royal
Society London Biological Science, 359 (1450):
1585 – 1594.
Poulsen, A. D. and Balslev, H. (1991).
Abundance and cover of ground herbs in and
Amazonian rain forest. Journal of Vegetation
Science, 2: 315 – 322.
Poulsen, A. D.and Balslev, H. (1996). Species
richness and density of ground herbs within a plot
of lowland rainforest in North-west Borneo.
Journal of Tropical Ecology, 12 (2): 177 - 190.
Rajkumar, M. and Parthasarathy, N. (2008).
Tree diversity and structure of Andaman giant
evergreen forests in India. Taiwania, 53: 356 -
368.
Rasingam, L. and Parthasarathy, N. (2009).
Diversity of understory plants in undisturbed and
disturbed tropical lowland forests of Little
Andaman Island, India. Biodiversity and
Conservation, 18: 1045 – 1065.
Effects of land use changes on flora diversity in Oban Division E. T. Ikyaagba et al.
Ghana J. Forestry, Vol. 31, 2015, 62 – 77 77
Reid, J. C. (1989). Flora and Fauna Richness of
the Oban Division of the CRNP. Appendix 7
CRNP (Oban Division) Plan for Developing the
Park and its Support Zone, WWF, Gland
Switzerland. pp. 1 - 89.
Richards, P. W. (1996). The Tropical Rainforest.
Cambridge: Cambridge University. pp. 1 - 450.
Sagar, R., Singh, A. and Sing, J. S. (2008).
Differential effect of woody plant canopies on
species composition and diversity of ground
vegetation: a case study. Tropical Ecology, 492:
189 – 197.
Schmitt, K. (1996). Botanical survey in the Oban
Division of CRNP –Technical Report on Oban
Hill progamm Calabar. pp. 1 – 55.
Schulze. C. H., Waltert, M., Keßler, P. J. A.,
Pitopang, R., Shahabudd, Veddeler, D.,
Mu¨hlenberg M., Gradstein, S. R., Leuschner,
C., Steffan-Dewenter, I. and Tscharntke, T. (2004). Biodiversity indicator groups of tropical
land-use systems: comparing plants, birds and
insects. Ecological Applications, 14: 1321 – 1333.
Sullivan, T. P and Sullivan, D. S. (2006). Plant
and small mammal diversity in orchard versus non
–crop habitats. Agriculture Ecosystems and
Environment, 116: 235-243.
Turner I. M., Tan H. T. W., Wee Y. C.,
Ibrahim A. B., Chew P. T. and Corlett R. T.
(1994). A study of plant species extinction in
Singapore: lessons for the conservation of tropical
biodiversity. Conservation Biology, 8: 705 – 712.
Turyahabwe, N. and Tweheyo, M. (2010). Does
Forest tenure influence forest vegetation
characteristic? A comparative analysis of private,
local and central government forest reserves in
Central Uganda: The International Forestry
Review, 12 (4): 320 – 338.
Walter, M., Heber, S., Riedelbauch, S., Lien, J.
L. and Muhlenberg, M. 2006. Estimates of blue
Duiker (Cephalophus monticola) densities from
diurnal and nocturnal line transects in the Korup
region, south-western Cameroon. African Journal
Ecology, 44, 290 – 292.
Zapfack, L., Engwald, S., Sonke, B.,
Achoundong, G. and Madong B. A. (2002). The
impact of land conversion on plant biodiversity in
the forest zone of Cameroon. Biodiversity and
Conservation 11: 2047– 2061.


GHANA JOURNAL OF FORESTRY
GUIDE TO CONTRIBUTORS
A. SCOPE: Contributions in any aspect of forest science and related disciplines will be considered.
All submissions to the journal should be sent in Triplicate to: Editorial Committee, Ghana
Journal of Forestry, UST-Box 63, Kumasi, Ghana. Tel. (03220)-60123, 60373;
Fax (03220)-60121; E-mail: [email protected]. [email protected]
B. FORM:
1. Title page should include title, authors and their affiliations; and all articles should have line numbering.
2. ABSTRACT:
Should be on a separate page and should not be more than 250 words. The abstract should be followed by
not more than five keywords.
3. The paper should be divided into suitable sections under short headings: Introduction, Materials and Methods,
Results, Discussion
4. All submissions should be in English, typed in double space on one side only of A4 (210mm x 297mm)
paper with borders of 30mm on all sides.
5. Tables/Figures must be submitted on in Microsoft Excel, be placed after text and numbered consecutively,
with appropriate headings as referred to in the text.
6. Drawings should be completely lettered, the size of lettering being appropriate to that of the drawings.
7. Photographs should be of good quality, submitted on separate pages, be numbered, have titles and referred
to in the text.
9. References should be cited in the text as follows:
(i) Osei (1998) and should appear in the text at the end of an appropriate sentence or as part of a sentence.
(ii) All references should be listed at the end of the paper in alphabetical order on separate sheets and should
include all publications cited in the text as follows:
Baidoe, J. F. (1996) Yield regulation in the high forest of Ghana. Ghana Journal of Forestry 2:22-27.
(iii) In the list of references, all titles of periodicals should be given in full, journals names should be
written in full; while for books, the title, place of publication, name of publisher and edition if any
should be stated as follows:
Jane, F. W. (1996) The Structure of Wood, 1st ed. London, A and C Black, p328.
C. Authors should submit electronic version of accepted articles using Microsoft Word 2007.
D. Line Spacing: single spaced for text; double spaced between paragraphs.
E. Reprints: 5 reprints of each article will be supplied free of charge to the author(s).