Ghana: Decentralization and the Health Logistics Systems
77
Ghana: Decentralization and the Health Logistics Systems Thomas Bossert, Ph.D. Diana Bowser, M.P.H. Harvard School of Public Health Johnnie Amenyah, B.Pharm., MBA Rebecca Copeland, M.S.P.H. John Snow Inc./DELIVER Deloitte and Touche Ghana 2004 Harvard School of Public Healt h
Transcript of Ghana: Decentralization and the Health Logistics Systems

Ghana: Decentralization and the Health Logistics Systems
Thomas Bossert, Ph.D.Diana Bowser, M.P.H.Harvard School of Public Health
Johnnie Amenyah, B.Pharm., MBARebecca Copeland, M.S.P.H.John Snow Inc./DELIVER
Deloitte and Touche
Ghana 2004
Harvard School of Public Health

Ghana: Decentralization and the Health Logistics Systems
Thomas Bossert, Ph.D.Diana Bowser, M.P.H.Harvard School of Public Health
Johnnie Amenyah, B.Pharm., MBARebecca Copeland, M.S.P.H.John Snow Inc./DELIVER
Deloitte and Touche
Ghana 2004
Harvard School of Public Health

DELIVERDELIVER, a five-year worldwide technical assistance support contract, is funded by the Commodities Security and Logistics (CSL) Division in the Center for Population, Health and Nutrition of the Bureau for Global Health of the U.S. Agency for International Development (USAID).
Implemented by John Snow, Inc. (JSI), (contract no. HRN-C-00-00-00010-00), and subcontractors (Manoff Group, Program for Appropriate Technology in Health [PATH], Social Sectors Development Strategies, Inc., and Synaxis, Inc.). DELIVER strengthens the supply chains of health and family planning programs in developing countries to ensure the availability of critical health products for customers. DELIVER also provides technical management and analysis of USAID’s central commodity management information system (NEWVERN).
This document does not necessarily represent the views or opinions of USAID. It may be reproduced if credit is given to John Snow, Inc./DELIVER.
Recommended CitationBossert Thomas, Diana Bowser, Johnnie Amenyah, and Becky Copeland. 2004. Ghana: Decentralization and Health Logistics Systems: Arlington, Va.: John Snow, Inc./DELIVER for USAID for the U.S. Agency for Interna-tional Development.
AbstractDecentralization has been one of the most far-reaching interventions in health sector reform packages. In Ghana, health sector reform took place from 1998–2002 under the Health Sector Support Project (HSSP) and supported by the World Bank; it continued under another five-year medium-term health strategy for 2002–2006. To implement these reform packages, a number of health reform initiatives were put in place, most notably, the decentralization of administration within the sector and the integration of supply systems to improve management efficiency.
This second country study, designed by DELIVER and the Harvard School of Public Health, assessed the impact of decentralization on the performance of health logistics systems. The first study took place in Guatemala. Using the decision space model, the following paper examines pre-defined functions within the health logistics system in order to measure the changes in performance indicators related to changes introduced by decentralization and integration.
The study found that, in Ghana, greater decision space was related to better performance for financing and plan-ning/budgeting; and worse performance was related to procurement, inventory control, storage, logistics manage-ment information systems, training, and client contact. Comparisons of results from Ghana are made to the results from Guatemala; conclusions are drawn as to which functions should remain centralized and which functions should be allowed a greater level of decision space.
DELIVERJohn Snow, Inc.1616 North Fort Myer Drive11th FloorArlington, VA 22209 USAPhone: 703-528-7474Fax: 703-528-7480Email: [email protected] Internet: deliver.jsi.com
Harvard School of Public Health

iii
Contents
Acronyms ................................................................................................ vii
Acknowledgements .................................................................................. ix
Executive Summary .................................................................................. xi
Ghanaian Health Logistics System ..................................................... xi
Findings ........................................................................................... xii
Conclusion ...................................................................................... xiv
Study Objectives and Conceptual Framework ........................................... 1
Conceptual Framework ..................................................................... 1
Objectives of the Study ....................................................................... 2
Study Methodology ................................................................................... 3
Limitations of the Study ..................................................................... 5
Background ............................................................................................... 7
Ghana Health Sector Reforms ............................................................ 7
Ghana Health Logistics Systems ......................................................... 9
Findings .................................................................................................. 11
Analysis and Presentation ................................................................ 11
Financing ........................................................................................ 12
Cost Recovery .................................................................................. 16
General Planning and Budgeting ....................................................... 18
Product Selection .............................................................................. 20
Needs Quantification ........................................................................ 23
Procurement .................................................................................... 25
Inventory Control ............................................................................ 27
Storage .......................................................................................... 30
Transportation .................................................................................. 31
Logistic Management Information System ....................................... 33
Personnel/Human Resources ............................................................. 34
Supervision ....................................................................................... 35
Staff Training .................................................................................... 37
Organizational Support .................................................................... 39
Product Quality Assurance ............................................................... 39
Client Contact and Use ..................................................................... 41
Integration of Logistic Systems in Ghana .......................................... 43
Financing ......................................................................................... 43
Needs Quantification ........................................................................ 44

iv
Decentralization and the Health Logistics Systems in Ghana
Storage .......................................................................................... 44
Inventory Control ............................................................................. 45
Personnel ......................................................................................... 46
Comparisons with Data from Previous Years .......................................... 47
Stockouts of Essential Drugs ............................................................. 47
Purchases from Medical Stores and the Private Sector ...................... 47
Percentage of Generic Purchase from Public and Private Sector ........ 48
National EDL ................................................................................... 48
Comparison between Guatemala and Ghana .......................................... 49 Stockouts in Ghana and Guatemala .................................................. 50 Decision Space and Performance in Guatemala and Ghana .............. 51
Summary and Conclusions ...................................................................... 53
Annexes
Annex A: Detailed Degree of General and Variable Decentralization and Logistics System Performance, Ghana .............................................................................. 55
Annex B: Forecasting/Needs and Inventory Control ........................ 59
References ............................................................................................... 61
Figures 1. Logistics Cycle ............................................................................. 2
2. Stockouts Over the Last Six Months and at the Time of the Visit for Guatemala and Ghana ....................................... 51
Tables 1: Degree of General Decentralization and Logistics System Performance, Ghana ................................................................. xiii
2: Summary of Survey Information Sources .................................... 3
3: Decentralization Study Sample, Ghana 2002 ............................... 5
4: Variable Financing Decision Space and Performance Indicators .............................................................. 14
5: Relationship between Variable Decision Space for Financing and Cash and Stock Balances (2001–2002) ............... 15
6: Second Stage Correlation Results between Cash and Stock ....... 15
7: Variable Decision Space Indicators for Cost Recovery .............. 18
8: Variable Decision Space Indicators for General Planning and Budgeting ............................................................. 19
9: Relationship between Variable Decision Space Indicators for General Planning and Budgeting and Performance Variables ..... 20
10: Variable Decision Space for Product Selection and Related Performance Indicators ................................................. 22
11: Relationship between Variable Decision Space for Product Selection and Related Performance Indicators .............. 23
12: Decision Space for Needs Quantification and Related Performance Indicators .............................................................. 25
v
Executive Summary
13: Procurement Decision Space Indicators ...................................... 27
14: Relationship between Procurement Decision Space Indicators and Performance Variables ........................................ 27
15: Variable Decision Space for Inventory Control and Related Performance Indicators ................................................. 29
16: Inventory Control Performance Indicator: Stockouts in Last Six Months and Mean Duration (all products) ............... 29
17: Relationship between Decision Space for Inventory Control and Performance Indicator ........................................... 30
18: Storage Decision Space and Related Logistics Performance Indicators .............................................................. 31
19: Relationship between Storage Decision Space and Storage Conditions .................................................................... 31
20: Variable Transportation Decision Space and Performance Indicators .............................................................. 32
21: Variable LMIS Decision Space and Performance Variables ......... 33
22: Relationship between LMIS Decision Space and Performance Variables ............................................................... 34
23: Personnel Decision Space and Related Logistics Performance Indicator ............................................................... 35
24: Supervision Decision Space Indicators ....................................... 37
25: What Facilities Accomplish during Their Supervisory Visit ........ 37
26: Training Decision Space Indicators and Related Performance Indicator ............................................................... 38
27: Relationship between Training Decision Space and Logistics Training ..................................................................... 39
28: Decision Space Indicators for Product Quality Assurance .......... 40
29: Performance Indicators for Product Quality Assurance .............. 40
30: Decision Space Indicators for Client Contact and Use ................ 41
31: Performance Indicators for Client Contact and Use ................... 41
32: Relationship between Decision Space Indicators and Performance for Client Contact and Use .................................... 42
33: Integration for Financing ........................................................... 43
34: Integration for Forecasting ......................................................... 44
35: Integration for Storage ............................................................... 45
36: Integration for Inventory Control .............................................. 45
37: Integration for Personnel ........................................................... 46
38: Stockouts 1999 and 2002 .......................................................... 47
39: Public and Private Purchases 1995–2002 ................................... 47
40: Generic Purchases 1999 and 2002 ............................................. 48
41: Use of National EDL 1993, 1999, and 2002 .............................. 48
42: Comparison of General Decision Space for Guatemala and Ghana ................................................................................. 50
43: Higher Decision Space Association with Performance by Function ................................................................................ 52


vii
Acronyms
BMC Budget Management Centre
DANIDA Danish Agency for International Development
DFID Department for International Development (UK)
DHA District Health Administration
DHMT District Health Management Team
EDL essential drugs list (essential medicines list)
GAVI Global Alliance for Vaccines and Immunizations
GDP gross domestic product
GHS/HQ Ghana Health Service/Headquarters
GPRS Ghana Poverty Reduction Strategy
HSSP Health Sector Support Project
HMIS health management information system
HSPH Harvard School of Public Health
IDA International Development Agency
LIAT Logistics Indicator Assessment Tool
LMIS logistics management information system
MOH Ministry of Health
NGO nongovernmental organization
NEDL National Essential Drugs List
RDF revolving drug fund
RHA Regional Health Administration
RMS Regional Medical Stores
SPSS® Statistical Analysis Software
STATA® Statistical Analysis Software
SWAp sector wide approach
USAID United States Agency for International Development
WHO World Health Organization


ix
Acknowledgements
This report is the result of a collaborative effort by the research team at Harvard School of Public Health and the staff of the John Snow, Inc./DELIVER. Although the authors wrote the paper, they have incorporated crucial ideas and observations from experts on logistics systems from the DELIVER staff. A number of DELIVER staff provided tremendous support in the implementation of this study, in particular Jim Bates, Briton Beize, and Barbara Felling. We also received significant support for this activity from many officials of the Ministry of Health. Samuel Boateng, Director of Procurement and Stores of the Ministry of Health, Ghana deserves special mention because of his profound understanding of the logistics system of the health sector and his willingness to share his knowledge and experience; all were of tremendous help in implementing this study. The following DELIVER staff provided tremendous support in the implementation of this study: Nora Quesada, Bernardo Uribe, Jim Bates, and Blanka Homolova.
This paper reflects the views of the authors and does not necessarily reflect the views of John Snow, Inc./DELIVER or the United States Agency for International Development.


xi
Executive Summary
Decentralization and integration are often feared by logistics experts for their potentially disruptive effects on health logistics systems. DELIVER and the Harvard School of Public Health designed a series of studies to be implemented in six countries to assess the impact of decentralization on the performance of health logistics systems. The first study was in Guatemala. This report from Ghana presents the findings from the second country study in this series.
This study examined the impact of decentralization and integration of decision-making authority to regional and district levels on the logistics management and distribution of essential drugs, contraceptives, and vaccines. It used an approach and methodology for the study of decentral-ization of health systems that we call the decision space approach. This approach determines empirically the range of choice for different functions of the logistics system that officials at different levels of the system report experiencing. It then evaluates how the reported range of choice relates to the performance of the logistics system.
The study was initiated in 2002 and the survey was implemented by a local office of the firm of Deloitte and Touche in collaboration with DELIVER, Harvard School of Public Health, and officials from the Ghanaian Ministry of Health.
Ghanaian Health Logistics SystemThe health commodity supply chain in the public sector in Ghana is made up of a Central Medical Store, and a network of Regional Medical Stores in each of the 10 administrative regions of the country. Drugs and supplies, including contraceptives, are distributed through this supply chain to health facilities throughout the country.
A series of health system reforms began in the 1970s, including the creation of District Health Management Teams. In January 1992, the most far-reaching reform in the drug supply system was introduced with the establishment of Revolving Drug Accounts at all levels of the supply chain, and managed by the facility. This policy, called the cash-and-carry system required the full cost recovery for essential drugs. The policy was expanded in 1996 for non-drug supplies, and in 1997 user fees were intro-duced for contraceptives. Further decentralization of the health system was initiated in 1996 with the passing of the Ghana Health Service and Teaching Hospital Act (Act 525). Part of the provisions for this act was the delegation of day-to-day operational control to a semi-autonomous Ghana Health Service and within the GHS, the semi-autonomous Budget Manage-
xii
Decentralization and the Health Logistics Systems in Ghana
ment Centers (BMC). Ten Regional Health Administrations with 110 District Health Administrations were also created as part of the GHS.
Commodity distribution in the public health sector is based on a pull system with the lower facility withdrawing, as appropriate, based on its needs. With the introduction of the cash-and-carry system, each level is operating on a business model. All supplies are paid for, purchased from the higher level of the supply chain or from the open market, as needed. (Notwithstanding this arrangement, historically, some fresh capital has been necessary to sustain the system.) The costs for supplies are recov-ered from sales to clients. This requires that each level of the supply chain determine its needs and mobilize its resources to procure these, and make them available to support service delivery. This means that decisions around a number of key logistics functions are made at the local level.
A number of additional efforts were initiated to improve and strengthen the procurement systems in the health sector to support the cash-and-carry system; they included the development of new procurement procedures and a training program to implement the procedures at all BMCs. Ghana is also implementing a national essential drugs program and, under this, a national essential drug list is published and reviewed periodically, with the last edition published in 2000.
Findings Using a methodology called decision space analysis, this study assessed the degree of decentralization and integration of the logistics system using two survey instruments in a sample of 72 facilities, representing 5 of the 10 regions in Ghana. The instruments assessed the degree of decentraliza-tion and integration for 17 specific logistics functions, and evaluated the performance of the logistics system.
Although some functions still remain centralized, the decentralization process in Ghana has resulted in a considerable degree of local control in the logistics system, as perceived by informants in the system.
In this study, we distinguished between general decision space and variable decision space. General decision space was a comparative assessment by international and national experts of the general range of choice allowed for a specific function. For instance, in Ghana, the local authorities have a moderate range of choice over financing, while in Guatemala they have almost no choice over financing. However, within that moderate range of choice, some Ghanaian districts exercised more choice than other districts because they modified the national guidelines. This is an example of the variable decision space. We measured the difference in performance that came from this variation.
We assessed the impact of different levels of the variable decision space on selected performance variables associated with each of 16 functions of the logistic system. The performance variables were both specific to the function—for example, for financing, we examined cash and capital balances—and were also overall indicators for the logistics system—mean
xiii
Executive Summary
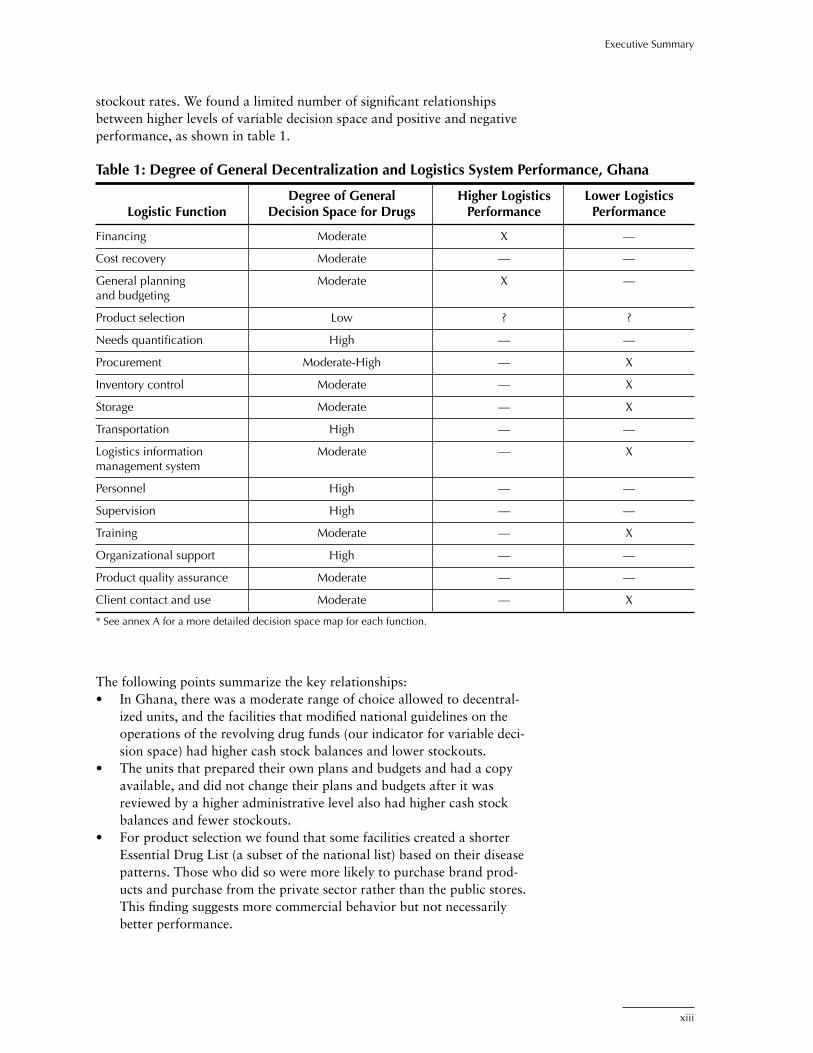
stockout rates. We found a limited number of significant relationships between higher levels of variable decision space and positive and negative performance, as shown in table 1.
Table 1: Degree of General Decentralization and Logistics System Performance, Ghana
Degree of General Higher Logistics Lower Logistics Logistic Function Decision Space for Drugs Performance Performance
Financing Moderate X —
Cost recovery Moderate — —
General planning Moderate X — and budgeting
Product selection Low ? ?
Needs quantification High — —
Procurement Moderate-High — X
Inventory control Moderate — X
Storage Moderate — X
Transportation High — —
Logistics information Moderate — X management system
Personnel High — —
Supervision High — —
Training Moderate — X
Organizational support High — —
Product quality assurance Moderate — —
Client contact and use Moderate — X
* See annex A for a more detailed decision space map for each function.
The following points summarize the key relationships:• In Ghana, there was a moderate range of choice allowed to decentral-
ized units, and the facilities that modified national guidelines on the operations of the revolving drug funds (our indicator for variable deci-sion space) had higher cash stock balances and lower stockouts.
• The units that prepared their own plans and budgets and had a copy available, and did not change their plans and budgets after it was reviewed by a higher administrative level also had higher cash stock balances and fewer stockouts.
• For product selection we found that some facilities created a shorter Essential Drug List (a subset of the national list) based on their disease patterns. Those who did so were more likely to purchase brand prod-ucts and purchase from the private sector rather than the public stores. This finding suggests more commercial behavior but not necessarily better performance.
xiv
Decentralization and the Health Logistics Systems in Ghana
• Decision space for procurement was generally high to moderate; those that used more of the decision space by making up their own procurement plans were more likely to purchase drugs that were not on the National Essential Drug List (NEDL). Slightly less than half the sample purchased drugs beyond the NEDL.
• Inventory control allowed moderate decision space; those facilities that chose not to use stock cards for control were less likely to have stock levels within the required maximum-minimum (max-min) levels.
• While decision space for storage was moderate, facilities that received guidelines for storage (i.e., had less variable decision space) were more likely to meet 100 percent of the storage conditions set for drugs.
• Facilities that did not use central LMIS forms (had more variable deci-sion space) were less likely to submit quarterly reporting of contracep-tives and monthly reporting of drug availability.
• For training, facilities that selected their own participants for courses rather than allowing the center to make the selections had fewer personnel trained in logistics functions for drugs.
• Facilities that modified national treatment protocols for service, represented by standard treatment guidelines, were more likely to have client complaints.
While we examined the relationship between degrees of integration of drugs, vaccines, and contraceptives, which were moderate to low for most functions, we did not find significant relationships.
ConclusionIn Ghana, we found that allowing greater decision space in financing and planning/budgeting results in better performance, while greater decision space results in poorer performance for procurement, inventory control, storage, LMIS, training, and client contact.
By comparing the Ghana and Guatemala studies, we found some consis-tent results. Some functions appeared to perform better if they remained relatively centralized, in part because there are limited choices for effective procedures. Inventory control, LMIS, storage, and product selection func-tions probably should be limited by central guidelines, and these guidelines should be enforced. However, decentralization of planning and budgeting was associated with improved performance in both countries, suggesting that better local information is needed for this function.

1
Study Objectives and Conceptual Framework
Improved availability of health commodities depends on effective logis-tics systems to move commodities down the supply chain to the service delivery points and, ultimately, to the end user. Initiatives of health reform, especially decentralizaiton of health systems, might possibly have an impact on logistics system performance. The United States Agency for International Development-funded DELIVER project seeks to determine how health system decentralization and integration might affect the perfor-mance of logistics system functions. As management systems are decentral-ized and/or integrated, findings from these studies may be used to design interventions that enhance the performance of health logistics systems. The findings will increase the information available locally in the study coun-tries and publicly to the international public health community. The first country studied in this series was Guatemala (Bossert et al. 2003).
This report presents the findings of the second country study, Ghana. Ghana was chosen based on a survey of DELIVER country representatives and advisors who reported on the levels of decentralization, the availability of previous studies on health reform, and the pharmaceutical sector that could be used to look at trends.
The report first presents a description of the study objectives and concep-tual framework, followed by a brief history of the Ghana health system and reforms. Most of the report presents the findings of the degree of decision space and integration and the relationship to the performance indicators for each of the key functions of the logistics system, including comparisons with the Guatemala study. The report concludes with an overall assessment of how increased decentralization is related to logistic system performance.
Conceptual Framework This exploratory study attempts to measure the extent of decentralization in the system by reviewing the reported local decision making at various levels of the health system. The health logistics system was analyzed by functions, and decision making in each of these functions was determined, while selected indicators of performance that relate to these functions was analyzed.
The conceptual framework for this study is based on the decision space approach to decentralization, which was developed by Thomas Bossert (1998) of the Harvard School of Public Health. This approach is grounded in the principal-agent framework used by ecnomists and political scientists to study diverse institutional issues that involve central and peripheral

2
Decentralization and the Health Logistics Systems in Ghana
actors, and it uses a comparative analytical tool that focuses on the range of choice allowed in the decentralization process. The conceptual base does not try to quantify formal decision space, but rather offers a prelimi-nary characterization of its range as narrow, moderate, and wide, within the array of health logistics system functions.
The logistics functions under study are derived from the logistics cycle, which identifies the critical functions in the cycle depicted in figure 1. From this cycle, a decision space map was developed to examine the effects of decision making on logistics.
Objectives of the StudyThe main objective of the study is to respond to the research questions posed by the study’s concept paper:
• How does health reform that includes decentralization of health systems and management affect the performance of logistics systems?a. Are different types of decentralization (devolved vs. deconcen-
trated) likely to affect the logistics system performance differently? How?
b. Are different degrees of decision space likely to affect the logistics system performance differently? How?
c. Are some elements of logistics functions—product selection, needs quantification, procurement, storage, distribution, use, and logistics information management—affected in different ways by decentralization? And, if so, how? (See table 1 for other functions.)
d. Are some elements of logistics system performance (e.g., availability vs. efficiency vs. affordability) more likely to be impacted by decentralization than by other elements?
Qua
lity M
onitoring
Quality Monitorin
g
Quality Monitoring
Quality Monitoring
ProductSelection
ServingCustomers
Inventory Management• Storage• Distribution
LMISPipeline Monitoring
Organization & StaffingBudgeting
SupervisionEvaluation
Forecasting&
Procurement
Figure 1. Logistics Cycle

3
Study Methodology
The Ghana study was a two-part survey. One part assessed the degree of decentralization of the current system using the Decision Space Assessment Questionnaire. Data collection on decision space involved semi-structured interviews with key participants in the logistics system at the central and local levels. The types of personnel interviewed are listed in table 2. The decision space approach was adapted by Harvard School of Public Health (HSPH), and DELIVER for this particular study to assess the degree of decision space granted and/or assumed in the logistics system. The study assessed the decision space in Ghana in relation to that found in Guatemala, and evaluated the variation of decision space that occurred within Ghana. There is no standard measure of decision space; measurement is empiri-cally determined. The findings of the HSPH DELIVER series is a cumulative process of assessing the degree of choice exercised in different conditions of decentralization. Each country study will contribute, which will set a comparative standard for the following studies. The surveys were developed with both international and local experts to create a pre-established set of possible responses that define whether a facility has a low, moderate, or high degree of choice in executing/managing each of the logistic system functions.
The second part of the survey obtained data on the current performance of the logistic system using DELIVER’s Logistics Indicators Assessment Tool (LIAT). The LIAT was modified to the Ghanaian situation by the team from HSPH, DELIVER, and staff the Ministry of Health (MOH) research and procurement units. (Completing the LIAT required information from a variety of data sources, including stock/tally cards; ledgers; periodic returns/reports; requisition and issue vouchers; and consumption and other transaction records, such as receipts, invoices, and waybills). Data were also collected through the direct observation of warehouse conditions and physical count of the health commodities in facility stores and clinics.
Table 2: Summary of Survey Information Sources
Data Collection Method Source of Information
Interviews Directors of Regional Health Services, Directors of District Health Services, Medical Superintendent, medical assistant i/c or head i/c, health services and hospital administrators, accountants, pharmacists, heads of programs—family planning, public health; storekeepers, supplies officer, and welfare officers.
Observations Storage sites for health commodities (storage conditions and stock inventory)
Document Review • Product stock/tally cards • Activity ledgers • Requisition and issue vouchers • Routine returns/reports • Receipts, invoices, and waybills
4
Decentralization and the Health Logistics Systems in Ghana
Ghana’s selection was based, in part, on the availability of previous system assessments conducted prior to or at the start of health sector reforms, thereby providing a baseline look at some shared indicators. Two such studies are the 1993 Rational Pharmaceutical Management (RPM) survey of the Ghana Pharmaceutical Sector and the 1999 MOH study on the pharmaceutical sector in Ghana. These studies had similar measures of logistics system performance to those being used in the present survey.
The local firm Deloitte and Touche (D&T) was asked to hire and train the data collectors, organizing and supervising data collection and data entry, and preparing a preliminary report. MOH staff were also facilitators in the training. Twelve experienced professionals conducted the interviews. D&T supervisors assigned to each regional team were responsible for verifying data quality and editing the interviews at the end of each day; ensuring that all tasks were carried out at the interview; and rescheduling visits, as needed. The two-day training course included an overview of the method-ology and study purpose, a detailed review and practice of the instruments, and instructions on how to conduct interviews. Following the training, the instruments were pilot-tested in nine facilities (two at each level and one nongovernmental organization [NGO]). Final revisions to the instruments were made by DELIVER, HSPH, and D&T.
Data collection was carried out during the first two weeks of December 2002. All data were coded and initially entered into SPSS®; a double-entry technique was used to ensure data quality. After data entry and verifi-cation, the data were transferred to STATA® for further analysis in the United States.
To allow for comparisons across time, the study team decided to include the same sample of facilities that was selected in the 1999 MOH phar-maceutical sector baseline study. The study was conducted as a baseline measure of the performance of the pharmaceutical sector prior to interven-tions being implemented under the Ghana National Drugs Programme. The 1999 MOH study was particularly well designed. It used a multi-stage sampling procedure that included the selection of regions, districts, and health facilities through a combination of purposive and random sampling. The present sample was increased to include Regional Health Administra-tions (RHA) and regional hospitals, and the number of randomly selected districts increased from two to five per region.
Table 3 compares the sample of the present study and the 1999 MOH study. A total of 97 offices and health facilities were included in this study, representing 17 percent of all facilities in the country. Five of the total 10 regions were represented: Greater Accra Region, Central Region, Eastern Region, Brong Ahafo Region, and Northern Region.
The decentralization tool was applied in 47 facilities and the LIAT in 72 facilities. Because the District Health Administration (DHA) undertakes substantial decision making for the health posts under their control, the decentralization tool was used with DHAs on behalf of the health posts. The LIAT tool was used at all levels, except the DHA. The performance indicators of the Regional Medical Stores are captured as Regional Health Administrations, explained in the study background of this report.

5
Study Methodology
Limitations of the StudyOne limitation is the standard limitation of surveys of opinions and attitudes. The reported decision space is based on perceptions of officials involved in the logistic system, as reported to interviewers, and is not veri-fied by a review of documents or other sources. While the questions have been designed to ask for specific concrete and factual responses, percep-tions often change and, in some cases, are open to different interpretations. A second limitation is that the relationships we found for the performance of functions were limited to the statistical significance of a small number of indicators for each function. While this limitation is apparent also in the Guatemala study, it is even more limiting in the Ghana study. The Ghana sample was smaller than the Guatemala study. The total sample size in Guatemala was 281 facilities; while the total sample size in Ghana was 57 (the data from the 40 health centers collapses into the DHA level). In Guatemala, this sample size represents 23 percent of all facilities, while in Ghana this represents only 17 percent of all facilities. The variation in implementation of different variable decision space among facilities was also much less than in Guatemala. This lack of variation and small sample size left many of the potential relationships with insufficient numbers for statistical significance.
Table 3: Decentralization Study Sample, Ghana 2002
2002 Sample: 1999 Survey 2002 Survey Percentage (%) of Facility Type Country Total (N) Sample Size Sample Size Total Facilities
Regional Health Administration 10 0 5 50
Regional Hospital 10 0 5 50
DHA 110 15 25* 23
District Hospital 106 11 22 21
Health Center/Posts 342 41 40 ** 12
Total 578 67 97 17
* LIAT data were not collected at this level. ** Decision space information was not collected at this level.

7
1. http://www.cia.gov/cia/publications/factbook/geos/gh.html
Background
Ghana Health Sector ReformsGhana’s population was estimated to be 20.244 million in 2002, with a growth rate of 1.7 percent. Per capita gross domestic product (GDP) (purchasing power parity) is estimated at $2015 in 2002. The country has a life expectancy at birth of 57.06 years and infant mortality rate of 55.64 deaths/1,000 live births, with the percentage of births attended by a skilled health staff reported at 44 percent. The country has an HIV/AIDS preva-lence rate of 3 percent.1
Contraceptive prevalence rate for 1995–2000 was reported to be 22 percent, based on data referring to married women aged 15–49.
Data based on statistical information from the World Health Organization (WHO) country and regional offices, and regional advisors, and through the World Drug Situation Survey carried out in 1998–1999, reported drug access at 0–49 percent.
The Ghana health Sector has been going through significant reforms, span-ning the past two decades. This has been part of a government effort to restructure public administration in the country to increase effectiveness and outputs. The major reforms of the health sector have been undertaken under the Medium-Term Health Strategy “Towards Vision 2020” and the Program of Work 1997–2001. This strategy was supported by several development partners; and bilateral and multilateral organizations, includ-ing the World Bank (IDA), USAID, DFID, DANIDA, Royal Netherlands Government, European Union, and the Nordic Fund, among others. The IDA contribution to the program was under the Health Sector Support Project (HSSP) Credit (Cr-29940), implemented from 1998–2002. This support was implemented through an innovative approach, the sector wide approach (SWAp). The objectives of the HSSP were identical to the objec-tives of the government’s program of work for health, and it included—
• improve health status by (a) increasing access to a basic package of health services, (b) improving the quality and efficiency of health services, and (3) forging linkages with other partners in health devel-opment;
• improve financing by increasing budgetary allocation to the health sector and donor funding, and by improving revenue generation from households
• reduce population growth
8
Decentralization and the Health Logistics Systems in Ghana
• reduce malnutrition• improve access to water and sanitation• reduce poverty.This HSSP, implemented as a flagship operation by the World Bank, has been touted as the most successful sector-wide operation in Africa2. This project formed the basis for the development of another five-year medium-term health strategy for 2002–2006, currently under implementation with similar management arrangement and a renewed thrust to consolidate earlier gains and institutionalize a number of reforms started in the health sector. The current medium-term health strategy, linked to the Ghana Poverty Reduction Strategy (GPRS), is ”Bridging the Inequalities Gap,” and it has the following health related objectives:3
• Bridging the equity gaps in access to quality health and nutrition services.
• Ensuring sustainable financing arrangements that protect the poor.• Enhancing efficiency in service delivery.
In response to these GPRS objectives, the health sector strategic objectives are to—
• Improve the quality of health services.• Increase access to health services.• Improve the efficiency of health services delivery.• Foster partnerships in improving health.• Improve financing of the health sector.
To achieve these objectives, a number of health reform initiatives were put in place, most notably, the decentralization of administration within the sector and the integration of supply systems to improve management effi-ciency. Some of these reforms were undertaken under that auspices of the Economic Recovery Programs (ERP I and II). These ERP and the follow-on Structural Adjustment Programs (SAP) were all done at the prompting of the international donor community, and led mainly by the IDA/IBRD of the World Bank. The most notable aspects of the reforms were to abolish previously free health care services and to introduce user fees.
Decentralization of the public health sector in Ghana began with incipient activities, including the creation of District Health Management Teams (DHMT) in the late 1970’s. It was given a major push in 1996 with the passing of the Ghana Health Service and Teaching Hospital Act. This resulted in the creation of 10 Regional Health Administrations and 110 District Health Administrations, as well as the delegation of day-to-day operational control to a semi-autonomous Ghana Health Service (GHS), and within the GHS, the creation of semi-autonomous Budget Manage-ment Centres (BMC).
2. Implementation Completion Report on IDA HSSP Credit. World Bank website3. The Second Health Sector 5 Year Programme of Work 2002–2006. Ministry of Health Ghana.

9
Background
Ghana Health Logistics SystemsThe health commodity supply chain in the public sector in Ghana is made up of a Central Medical Store, and a network of Regional Medical Stores (RMS) in each of the 10 administrative regions of the country. Drugs and supplies, including contraceptives, are managed through this supply chain to health facilities throughout the country. Health facilities are expected to get their supplies from the appropriate RMS, depending on their loca-tion. Vaccines are managed slightly separately through a network of cold storage warehouses in all regions and cold chain vehicles, which, in most cases, are located at the same place as the RMS. Each RMS is managed by the respective Regional Health Administration (RHA), and it provides a supply service to health facilities in the region. In this study, RMSs are classified as part of the RHA, and the performance levels of the RHA relate to the logistics functions performed by the RMS.
The study focused on commodity distribution in the public health sector. Four main supply systems can be identified in the Ghanaian health system, based on the types of commodities they managed. They are the (a) essen-tial drugs, (b) non-drug consumable items, (c) contraceptives, and (d) vaccines supply systems.
Essential drugs and non-drug consumables have, for the most part, been managed jointly, and for this study were considered to be in the same logistics system. There are, however, minor differences in the personnel and decision-making roles in the system. Contraceptives and vaccines, however, represent a significantly different category of products, both from the financing perspective and from the day-to-day commodity manage-ment perspective. The contraceptive logistics system is, for the most part, managed separately, and the fact that contraceptives are not managed on a full cost recovery or a cash-and-carry basis sets them apart. The resupply of contraceptive commodities is dependent on the submission of reports from the lower level of the distribution chain up the system; this is also true for vaccines.
The health commodity supply system has been based mainly on systems similar to those used in the management of all public sector stores in the country. Until recently, all public sector stores were considered part of the Ministry of Finance, and storekeeping practices and records have been managed by the use of sets of prescribed forms and documentation. During the past two decades, efforts have been made to modernize and adapt these systems to meet the peculiar needs of the health sector. Howev-er, these efforts fall short of a robust logistics management information system (LMIS), and dependence on this system for most of the data used in this study had a significant effect.
A number of reform interventions in the health logistics system were introduced, with the general reforms in the management of the health sector described above. In January 1992, the most far-reaching reform in the drug supply system was introduced with the establishment of the Revolving Drug Accounts at all levels of the supply chain, and managed by the facility. This policy, called the cash-and-carry system, required the
10
Decentralization and the Health Logistics Systems in Ghana
full cost recovery for essential drugs. The policy was expanded in 1996 for non-drug supplies, and, in 1997, user fees were introduced for contracep-tives. The basic logic of the cash-and-carry system used a commercial logic to improve the logistics system—encouraging local officials to become responsible for ensuring that their revenues were in some balance with expenditures, and that this financial basis should improve drug availability.
Prior to these reforms, drug supply was fully financed by the central government budget. Vaccines and contraceptives were financed separately through donor-funded vertical program. These separate programs continue today with funding from USAID and UNFPA for contraceptives (except for a shortfall in supply in one year that was covered by World Bank credit) and with funding by the GAVI fund for vaccines.
The health sector supply system, for the most part, is based on a pull system, with the lower facility withdrawing based on its need. With the introduction of the cash-and-carry system, each level operates as a busi-ness model. All supplies are fully paid for or purchased from the next higher level of the supply chain or the open market, as needed, and the cost recovered from its clients. This requires that each level of the supply chain determine its needs and mobilize resources to procure what it needs, and to make the resources available to support service delivery. This means that decisions around a number of key logistics functions are made at the local level.
Among the more recent reforms were efforts to improve and strengthen the procurement systems in the health sector, including the development of new procurement procedures and a training program to implement these at all BMCs. Ghana is also implementing a national essential drugs program and, under this, a national essential drug list has been published and will be reviewed periodically (the last edition was published in 2000).
The introduction of user fees and full cost recovery of product costs, coupled with the establishment and management of revolving funds at each facility, or BMC as the case may be, shifted considerable author-ity and responsibility to the BMC level. The Ministry of Health provided some training and a set of guidelines on the operations of these logis-tics systems. Procurement guidelines provided for the establishment of procurement committees, and included a recommended membership and defined roles. The BMCs were also subject to periodic audits and a super-visory system was put in place to monitor performance. A recommended fee structure was put in place for commodities and a system of reimburse-ment was introduced to cover costs incurred by the health facility in treat-ing patients who are exempt from payment of user fees, as specified in a government legislative instrument on hospital fees, LI 1313.
11
Findings
Analysis and Presentation Each logistics function is examined separately as shown in the logistics cycle:
1. Finance2. Cost Recovery3. General planning and budgeting4. Product selection5. Needs quantification/forecasting6. Procurement7. Inventory control8. Storage9. Transportation (distribution) 10. Logistics management information system (LMIS) 11. Human resources/personnel12. Supervision13. Training14. Organizational support15. Quality assurance16. Client contact and use
The analysis within each logistics function begins with a list of the decision space and logistic system performance indicators that were examined for that function. The analysis of decision space has two dimensions. One is a comparative assessment of the general degree of decision space for each function in relation to the potential decision space that might be avail-able. This general degree of decision space is based on expert judgment of international and local experts, and it forms the basis for cross-coun-try comparative analysis. This measure of decision space was used for comparisons between Ghana and Guatemala and showed, for instance, that for the financing function, Ghana had a moderate range of choices, while Guatemala had a limited range of choice because this function is fully centralized in Guatemala. But, the cash-and-carry policy grants Ghanaian facilities some choice, within a reasonable range. The second dimension is the variable decision space within Ghana. The variable deci-sion space will use indicators that are likely to vary from facility to facility. For instance, for the financing function within Ghana, some facilities were able to modify the central guidelines for the revolving drug fund (i.e., exercising greater decision space), while other facilities simply followed the central guidelines without making their own decisions. This variable deci-sion space is determined empirically by the responses of the respondents to the Decision Space Assessment survey.

12
Decentralization and the Health Logistics Systems in Ghana
In this report, the first indicators presented are the general degree of deci-sion space indicators for that function. The second is the variable deci-sion space that is a proxy measure for the degree of decentralization; it is dichotomized into high decision space and low decision space. The second indicators presented are related to—or are an outcome of—the particular function, and they measure how well an aspect of the logistics system is functioning at the time of the survey or recent past.
The relationship between the variable decision space for each function and each of the performance indicators is analyzed using a paired T-test on the equality of mean. (See description of a T-test below.) The number of facili-ties (N) included in the decision space analysis is shown for each function. Any N less than the total 57 means either that there were missing values (some facilities did not answer) or decision space in this function was not applicable to an entire level of facilities.
Using a T-test for statistical significance, the differences between means of two groups (different decision space categories) are compared. The null hypothesis for each test is that the mean of the outcome variable is equal for both groups. A value called a T-test and a p-value helps determine if this null hypothesis is statistically significant. If the T-test is large enough and the p-value is small enough, we can reject the null hypothesis and conclude that the means for the groups are statistically different. We will reject the null with certainty for any p-value of less than 0.10. When a T-test cannot be used, a correlation coefficient is presented which represents the overall positive or negative trend between two variables. A positive correlation coef-ficient signifies a positive trend while a negative correlation coefficient signi-fies a negative trend. The trend is significant for any p-value less than 0.10.4
Although we have tested all possible relationships between degrees of decentralization and logistics performance indicators, we report only those relationships that are shown to be statistically significant. For the perfor-mance indicators that were not significantly related to the decentralization or integration variables, we present a description of the variable and the frequencies found in the survey in order to provide information on the current performance of the system and for comparisons with other studies.
Financing The financing mechanisms for the health commodities in Ghana are quite complicated and vary for essential drugs, contraceptives, and vaccines. The major, but not the only, difference is that user fees charged for essen-tial drugs and related commodities at the user point are designed to cover the full costs of the commodities; while the charges for contraceptives are heavily subsidized and there are no charges for vaccines. These financing mechanisms have evolved over years and the mechanisms for financing essential drugs and related commodities has changed significantly over the past two decades. The general degree of decision space for financing of essential drugs is therefore moderate at all levels as funding for essen-
4. In financing, a correlation coefficient is used in place of a T-test due to the nature of the data.
13
Findings
tial drugs is now fully the local responsibility, within a set of guidelines provided by the central level. The general degree of decision space for contraceptives and vaccines is narrow.
Within this moderate range of choice for medicines, there was some varia-tion in that some facilities modified the guidelines that had been dissemi-nated by the central authorities. Therefore, this survey was able to assess one variable decision space indicator: Whether the facility modified the Revolving Drug Fund Guidelines. The facility was determined to have a high variable decision space if the facility reported that it modified the Revolving Drug Fund Guidelines.
Based on the description of the financing mechanisms above, it would be expected that local decision making and its influence on the logistics system would be related to certain performance indicators. First, financing should be related to the availability of financial resources that, in turn, will affect the commodity supply. For example, the first performance indica-tor below, an increase in the stock and cash balances, should indicate a favorable financing environment. We anticipated that while this may give a good impression of the financial health of the supply system, it may not present a complete picture because such increases may be artificial and supported by outstanding accounts payables. Therefore, our interest is in the second indicator of performance that adjusts the total capital for outstanding payments. Stockouts at the time of the visit and during the last six months are the two final performance indicators. Stockouts are often used as a general assessment of overall system performance. We include them in the evaluation of many functions to determine the potential rela-tionship between key functions and the performance of the whole system.
The four logistics system performance indicators used to assess the effects of local choices made in the financing include—
1. Percentage Increase in Stock and Cash Balances 2002 is the percent-age difference between stock and cash balances from 2001 to stock and cash balances from 2002.
2. Total Capital 2002 Adjusted for Outstanding Payments (Equity of Facility in Stock).
3. Total capital for 2002 (Equity of Facility in Stock) was defined as the total stock balances for 2002, plus the total cash balance for 2002, minus outstanding payments to top three suppliers, plus the amount owed by top three suppliers.
4. Mean percentage of drugs stocked out at the time of the visit. Stock-outs at the time of the visit are calculated using the Stock Status Table. A product in a facility is considered stocked out if there was no report-ed usable stock on hand according to the physical inventory. The percentage of products stocked out in each facility is then calculated by type of product. For example, RHAs reported a 3 percent stockout rate for medicines. This means that of the 11 possible products they could have had in stock at the time of the visit, on average, 3 percent of these products were stocked out.5
5.This calculation does not include products reported as missing values—assuming they do not carry this product at all.

14
Decentralization and the Health Logistics Systems in Ghana
5. Mean percentage of drugs stocked out in the last six months. Stock-outs in the last six months are calculated using the Stockout and Stock Data Quality Table. Each facility reported the number of stockouts in the last six months for each product. The percentage of products stocked out in each facility is then calculated by type of product.
While almost all facilities (88 percent) had guidelines for the Revolving Drug fund, only 17 percent of the facilities modified the guidelines (see table 4). Regional-level facilities were more likely to have modified the guidelines than district level facilities. This level also showed the highest percentage change in cash and stock balances.
Table 4: Variable Financing Decision Space and Performance Indicators
Decision Space Indicator (high DS facilities only) Performance Indicator (all facilities)
Percentage change in cash and stock Total capital Modify revolving balances from 2002 adjusted Stockout Stockout in drug fund 2001–2002 for outstanding on day of visit last 6 months Facility Type guidelines (%) (%) payments (cedis) (drugs) (%) (drugs) (%)
Regional HA 40 (2) 120 (5) 933,993,635 (5) 3 (5) 9 (4)
Regional Hospital 40 (2) 281 (5) 229,488,886 (5) 4 (4) 0.5 (2)
District HA 6 (1) 36 (12) 34,139,792 (15) 11 (15) 17 (13)
District Hospital 10 (2) 89 (21) 85,607,281 (22) 6 (22) 8 (15)
Total (N) 17 (8/48) 100 (43) 174,741,908 (47) 7 (46) 11 (34)
There was a statistically significant relationship between whether the facil-ity had modified the Revolving Fund Guidelines and the percentage change in cash-stock balances from 2001 to 2002 and the total capital in 2002 adjusted for outstanding payments.
Table 5 shows that facilities that modified their Revolving Drug Fund (RDF) guidelines (had higher variable decision space for financing) had a much higher percentage increase in stock and cash balances from 2001 to 2002 (233 percent) than facilities that did not modify their RDF guidelines (73 percent). We also found that facilities that modified their revolving fund guidelines had a higher capital in 2002 (adjusted for outstanding payments). There was no relationship between modifying the revolving drug fund guidelines and stockouts for essential drugs.

15
Findings
Although there was no direct relationship between variable decision space for financing and stockouts, there was an indirect relationship—through capital. It was hypothesized that facilities, by utilizing their higher vari-able decision space in financing to increase their capital, would have better drug availability (less stockouts). This hypothesis proved to be true in that we did find a relationship between the increase in cash and stock balances from 2001 to 2002 and stockouts at the time of the visit.
Facilities that had a higher increase in stock and cash balances had fewer stockouts at the time of the visit.
These results show that, although a higher variable decision space in financing does not lead directly to less stockouts, there appears to be an indirect, two-stage process. Stage one is the relationship between modify-ing the revolving drug guidelines, which leads to higher cash and stock balances and capital. Stage two is the relationship between higher cash and stock balances and capital and lower stockouts at the time of the visit. This finding is consistent with the general approach of the cash-and-carry system, which is to use a commercial logic to improve the logistics system by encouraging local officials to become responsible for ensuring that their revenues are in some balance with expenditures and this financial basis should improve drug availability.
Table 5: Relationship between Variable Decision Space for Financing and Cash and Stock Balances (2001–2002)
Percentage Change in Cash- Total Capital 2002 Adjusted for Decision Space Indicator stock Balance (2001–2002) (%) Outstanding Payments (cedis)
Modified Revolving Drug Fund 233 (8) 481,146,070 (8) guidelines (high DS)
Do not modify Revolving Drug 73 (32) 118,217,767 (32) Fund guidelines (low DS)
Ttest T= -2.28 p= 0.02 N=40 T= -2.1 p= 0.04 N=40
Table 6: Second Stage Correlation Results between Cash and Stock Balance and Stockouts
Second Stage Indicator Stockouts at the Time of Visit
Percentage change in cash-stock balance (2001–2002) Correlation Coefficient = -0.2832P=.07
Modified revolving time of the drug fund guidelines
Higher cash-stock balance and higher capital
Lower stockouts at the visit
Two-Stage Schematic:
16
Decentralization and the Health Logistics Systems in Ghana
Cost RecoveryGhana’s cost recovery program for health commodities is fundamental to the cash-and-carry program. This program provided seed capital for each facility in the form of commodity supplies over a period of time, during which the facilities recovered full costs of the commodities from clients and did not have to pay the higher level in the supply chain (RMS or CMS) for the supplies. This process built up both a cash reserve and a stockpile of commodities that facilities then used as their seed capital. For the Essential Drugs Supply System, this process of establishing a seed capital was implemented over a couple of years, ending in December 1991. A similar process of establishing a seed capital for non-drug consumable items was initiated and ended on or about 1996, after which health facili-ties needed to pay for the commodities they received. Initial training in revolving fund management at the Central, Regional, District, and Facility levels was provided to managers in the system. The cost recovery system is still in place for these commodities.
In the cash-and-carry system for contraceptives, there was some variation allowed because the MOH set guidelines for the percentage of markups that facilities are allowed to keep from the proceeds (1992).
This finding was confirmed in our study where we found that a few facili-ties (five) retained more than 50 percent of their funds from contraceptive fees.6
Based on a qualitative analysis, it was concluded that facilities have a moderate degree of general decision space over the cost recovery program for essential drugs, contraceptives, and non-drug consumables. However, for vaccines the degree of decision space is narrow because facilities must charge a standard price markup set by the MOH.
The basic logic of the cost recovery system is based on the assumption that local decision making in response to the ever diminishing resources in the health sector will cause local managers to adopt mechanisms to raise funds locally. Cost recovery or cost sharing with the clients or beneficiaries of the health care system is one such mechanism; this mechanism is expected to lead to actions to increase resource flow at the local level. Possible actions will include adding additional criteria to the GHS/HQ guidelines to ensure that loopholes in the exemption policies of the central government are closed and/or raising the percentage of revenue that the facility keeps from the sale of essential drugs. Under the current exemption policy, the govern-ment specifies that certain disease categories and age groups of patients are exempt from paying hospital fees, including the cost of commodities. It is known that the implementation of this policy is not uniform across the country; this indicates that modifications have been made in response to local conditions and other factors. The first variable decision space indicator examines the percentage of facilities that use their decision space to change the exemption guidelines. Other possible strategies to increase
6. Due to this small sample size, no further analysis was done using this finding.
17
Findings
resource flow for commodities at the local level are through increasing the price mark-up on product bought from both public and private supply sources. The second and third variable decision space indicators examine this level of mark-up of prices for drugs from the public (medical stores) and private sector.
The three variable decision space indicators were assessed to measure vari-able decision making for cost recovery:
1. Criteria added to the GHS/HQ guidelines on exemptions. Facilities were asked if they had found it necessary to include additional criteria to the GHS/HQ guidelines on exemptions as a result of their local needs/circumstances. High decision space is if a facilities added criteria.
2. Percentage price mark-up of drugs purchased from the Medical Stores: The percentage increase in price (markup) for each drug purchased from medical stores in the last four quarters. Percentage markup is calculated as the percentage increase between the last purchasing price for each drug and the current selling price, using the same unit in each calculation.
3. Percentage price mark-up of drugs purchased from the private sector: The percentage increase in price (markup) for each drug purchased from the private sector in the last four quarters. Percentage markup is calculated as the percentage increase between the last purchasing price for each drug and the current selling price, using the same unit in each calculation.
Based on the description of the cost recovery mechanisms above, it was expected that local decision making would be related to the same perfor-mance indicators measured for the financing function above. First, cost recovery should be related to the availability of financial resources that, in turn, will affect the commodity supply. For example, the first perfor-mance indicator below, an increase in the stock and cash balances, should indicate a favorable financing environment. We anticipate that while this may give a good impression of the financial health of the supply system, it may not present a complete picture because such increases may be artificial and supported by outstanding accounts payables. Our interest, therefore, is in the second indicator of performance that adjusts the total capital for outstanding payments. Similar to financing, we also used two additional logistics performance indicators, namely, stockouts at the time of the visit and during the last six months.
The same performance variables that were used to analyze financing were used to analyze cost recovery (See Financing function for complete details.):
• Percentage increase in stock and cash balances 2002• Total capital 2002 adjusted for outstanding payments (equity of
facility in stock)• Mean percentage of drugs stocked out at the time of the visit • Mean percentage of drugs stocked out in the last six months.
18
Decentralization and the Health Logistics Systems in Ghana
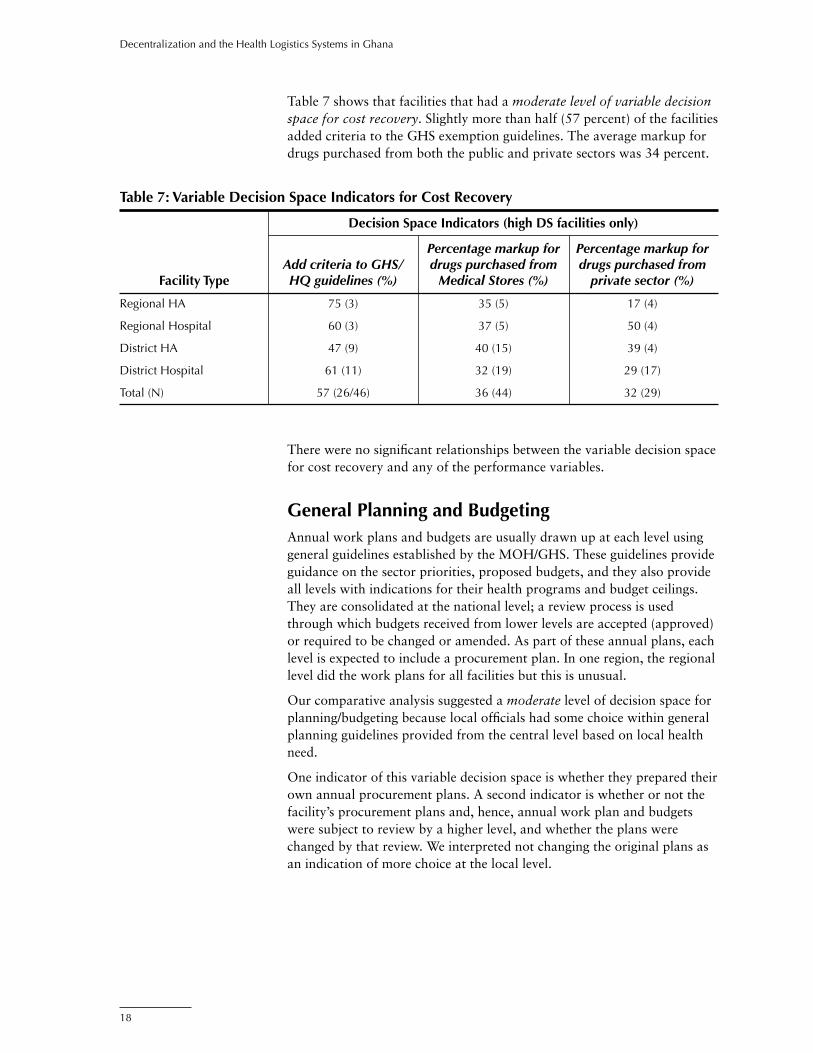
Table 7 shows that facilities that had a moderate level of variable decision space for cost recovery. Slightly more than half (57 percent) of the facilities added criteria to the GHS exemption guidelines. The average markup for drugs purchased from both the public and private sectors was 34 percent.
Table 7: Variable Decision Space Indicators for Cost Recovery
Decision Space Indicators (high DS facilities only)
Percentage markup for Percentage markup for Add criteria to GHS/ drugs purchased from drugs purchased from Facility Type HQ guidelines (%) Medical Stores (%) private sector (%)
Regional HA 75 (3) 35 (5) 17 (4)
Regional Hospital 60 (3) 37 (5) 50 (4)
District HA 47 (9) 40 (15) 39 (4)
District Hospital 61 (11) 32 (19) 29 (17)
Total (N) 57 (26/46) 36 (44) 32 (29)
There were no significant relationships between the variable decision space for cost recovery and any of the performance variables.
General Planning and BudgetingAnnual work plans and budgets are usually drawn up at each level using general guidelines established by the MOH/GHS. These guidelines provide guidance on the sector priorities, proposed budgets, and they also provide all levels with indications for their health programs and budget ceilings. They are consolidated at the national level; a review process is used through which budgets received from lower levels are accepted (approved) or required to be changed or amended. As part of these annual plans, each level is expected to include a procurement plan. In one region, the regional level did the work plans for all facilities but this is unusual.
Our comparative analysis suggested a moderate level of decision space for planning/budgeting because local officials had some choice within general planning guidelines provided from the central level based on local health need.
One indicator of this variable decision space is whether they prepared their own annual procurement plans. A second indicator is whether or not the facility’s procurement plans and, hence, annual work plan and budgets were subject to review by a higher level, and whether the plans were changed by that review. We interpreted not changing the original plans as an indication of more choice at the local level.

19
Findings
Two variable decision space indicators for General Planning/Budgeting were examined:
1. Prepare own annual plan and budgets. We defined high decision space as those that prepared their own plans and budgets and had an inspected copy. Low decision space was defined as those that may have prepared their own plans and budgets but did not have a copy.
2. Did not change work plan/budget after it is reviewed: We defined high decision space as not changing the plan even after review and low decision space as obeying higher authorities and changing the plan after review.
As shown in table 8, there is a high level of decision space for preparing their own annual plans and budgets (70 percent); however there is a low decision space (35 percent) if the plan/budget is not changed after it is reviewed. Most facilities do make the changes they are advised to make. Combining these two variable decision space indicators leads to a moder-ate level of variable decision space for General Planning/Budgeting.
Table 8: Variable Decision Space Indicators for General Planning and Budgeting
Decision Space Indicators (high DS facilities only)
Prepare own annual plans Did not change work plan/ Facility Type and budgets (%) budget after it is reviewed (%)
Regional HA 100 (5) 0 (0)
Regional Hospital 80 (4) 60 (3)
District HA 64 (16) 32 (8)
District Hospital 67 (14) 38 (8)
Total (N) 70 (39/56) 35 (19/54)
The same performance variables that were used to analyze financing and cost recovery were used to analyze general planning and budgeting:
1. Percentage increase in stock and cash balances 20022. Total capital 2002 adjusted for outstanding payments (equity of
facility in stock)3. Mean percentage of drugs stocked out at the time of the visit4. Mean percentage of drugs stocked out in the last six months.
There were two significant relationships between the variable decision space variables above and the four performance variables. As shown in the table 9, facilities that had a high variable decision space and did not change the work plan/budget even after it was reviewed had a higher increase in cash and stock balances.
As shown in table 6, an increase in stock and cash balances is also related to lower stockouts at the time of the visit.

20
Decentralization and the Health Logistics Systems in Ghana
The results in table 9 show that there is a second two-stage relationship occurring for General Planning and Budgeting. Similar to Financing, those who exercise higher variable decision space in budgeting and planning have higher cash and stock balances on hand, which leads directly to lower stockouts at the time of the visit.
Table 9: Relationship between Variable Decision Space Indicators for General Planning and Budgeting and Performance Variables
Decision Space Indicator Percentage Increase in Stock and Cash Balances 2002 (%)
Did not change work plan/budget after it is reviewed (high DS) 172 (14)
Did change work plan/budget after it is reviewed (low DS) 54 (27)
T-test T= -2.0 p= 0.04 N=41
Did not change work plan/time of the budget after review
Higher cash-stock balance Lower stockouts
at the visit
Two-Stage Schematic:
Product SelectionGhana is implementing a National Drug Policy that supports the concept of an Essential Drugs List. There is a National Essential Drug List (NEDL) in Ghana, first published in the 1980’s and revised regularly, with the last review in 2000. The NEDL, which applies only to the public health system, is designed to cover most of the health problems in the population.
Under the National Drug Policy, it is recommended that each health facility develop a shorter list of drugs, a drug formulary, tailored to the particular needs and the health problems prevalent among its clients. This will ensure that local formularies include drugs that are relevant to local needs. The NEDL is the inclusive list that defines the limits, and within which local formulary lists will be selected. Enforcement of this, however, is weak.
The NEDL is also categorized by level of care. The guidelines are proposed to confine the distribution of drugs to specific and appropriate settings and levels of health care delivery. This categorization, which is also related to the level of training of the health care providers at each level, is designed to make simple drugs available at the lower level and drugs requiring higher skills at the higher levels of the health care system.
Selection of contraceptives and vaccines, however, are done only at the central level and all products offered in the national programs are expected to be available at all levels. The only qualifier is that there is a trained provider at the level to use the products.

21
Findings
The general degree of decision space for Product Selection is considered to be low because there is a well-defined NEDL that seems to be respected. The list includes drugs, contraceptives, and vaccines.
For variable decision space, we hypothesized that local decision making will influence the type and range of drugs that are used at the facility, either in response to the profile of local health problems or other factors; and these local choices would lead to a local list of products. They may be adapted from the NEDL and contain only a subset of products on the national list, or they may also include extra products not appearing on the national list. The study hypotheses were that having a separate local EDL or making a shorter local EDL based on disease patterns might be related to a lower percent of generic purchases because generic drugs were more likely to be on the NEDL. We also hypothesized that having a separate local EDL or making a shorter local EDL based on disease patterns might be related to lower purchases off the NEDL.
In measuring the impact of product selection at the local level, we hypoth-esized that facilities that make a shorter list would be more likely to have selected drugs based on local health needs. However, the more often choices are implemented at the local level, the more likely it is that local preferences will not be consistent with the prescribed NEDL, based on a number of factors such as the desire to meet client preferences and the more commer-cial oriented behavior by the facility. We hypothesized that local choices will result in higher procurement of branded, rather than generic, drugs from private, rather than public, sources and higher procurement of drugs not on the NEDL. In other words, we expected more local choice to result in a shift from the centralized public sources (which may be a positive result) but also to choices that are not desirable—buying off the NEDL and an increased purchase of branded rather than generic drugs.
We measured two variable decision space indicators for Product Selection:
1. Having a separate local essential drug list (separate from the Ministry list)7
2. Making a shorter list of EDL based on disease patterns.
Three performance indicators:
1. Percentage of total products purchased from Medical Stores that were generic or brand
2. Percentage of total products purchased from private sector that was generic or brand
3. Purchased drugs from the EDL (assuming this is a NEDL).
As table 10 shows, very few facilities had their own EDL (only 17 percent). One of four District hospitals surveyed reported they had their own EDL. However, for the other question, 50 percent of facilities reported making a shorter EDL based on disease patterns. Combining the two variable decision space indicators for product selection leads to a low overall variable decision space.
7. This includes both having a copy on hand and just saying they have a local EDL.

22
Decentralization and the Health Logistics Systems in Ghana
The percentage of generic products purchased in the public sector (medi-cal stores) and private sector is high; the percentage of brand products purchased in either sector is low. Slightly less than half of the facilities (46 percent) purchased drugs off the National EDL.
Table 10: Variable Decision Space for Product Selection and Related Performance Indicators
Decision Space Indicator (high DS facilities only) Performance Indicators for Procurement
Shorter EDL based on Have their disease Generic Brand Generic Brand Purchased Facility own local patterns medical medical private private drugs off Type EDL (%) (%) stores (%) stores (%) sector (%) sector (%) EDL (%)
Regional HA 0 80 (4) 100 (5) 0 (5) 67 (3) 33 (3) 0
Regional 60 (3) 80 (4) 98 (5) 2 (5) 82 (4) 18 (4) 60 (3) Hospital
District HA 5 (1) 33 (6) 87 (15) 9 (15) 56 (4) 4 (4) 13 (2)
District 23 (5) 50 (10) 91 (19) 3 (19) 90 (16) 3 (16) 76 (16) Hospital
Total (N) 17 (9/52) 50 (24/48) 91 (44) 5 (44) 81 (27) 9 (27) 46 (21/46)
In examining the relationship between variable decision space for product selection and the performance indicators, we found that our hypotheses were partly true.
Those that created a shorter EDL based on local choices were more likely to purchase brand products (less likely to purchase generics) from the private sector. Those that did not create a shorter EDL based on local choices were also more likely to purchase brand products, but from the public sector (medical store) rather than the private sector. Both those that make a shorter EDL based on disease patterns and those that do not make a shorter list purchased brand products. However, those that made a shorter EDL list tended to purchase brand products from the private sector, while those that did not make a shorter list tended to purchase brand products only from the public sector.
This seemingly paradoxical finding is because not enough questions were asked or data collected to completely analyze the rationales for purchasing from the private sector or for purchasing branded products. It is possible that the two groups compared here, dichotomized solely on the basis of a local drug list, may be reporting the procurement of different products (brands), which would make the conclusions erroneous.
Local authorities that had a local EDL and/or created their own EDL based on disease pattern were not more likely to purchase off their EDLs (i.e., no significant difference between means for these two groups).

23
Findings
Needs QuantificationThis function of the logistics system relates to the determination of what products and what quantities are needed to maintain appropriate stock levels for each procurement or ordering cycle. Under the revolving drug funds, a recommended resupply period is defined for each level of the health care system that relates to the quantities to be maintained in inven-tory at each time to the rate of consumption. This, in theory, determined the max-min levels of stock to be held to avoid stockouts and/or over-stocking.
At each level, the stores management is responsible for determining the quantities of each item to procure each time commodities are ordered. Because they also had to mobilize financial resources to meet the needs made it imperative that the quantities be determined as accurately as possible. Needs quantification refers to the process of determining the quantities required for each procurement; this is different from forecast-ing, which refers to the projection of future needs over a longer duration, usually a year or more.
In general, no strict enforcement of a methodology or process for the needs quantification was established in the system. However, it was expected that by using past logistics data and monitoring consumption patterns needs quantification will be better.
The general decision space for needs quantification/forecasting for essential drugs were high because the cash-and-carry system required that each level develop their own estimates of need for drugs; there was no clear set of guidelines or methodology supplied by the central authorities.
General decision space was low for contraceptives and vaccines, which were all forecasted at the central level.
For other commodities, such as contraceptives and vaccines, there was the likelihood that higher levels of the system would do the needs quan-tification for the lower facilities. It was felt that variable decision space for this function might show differences that could affect performance. To measure the variable decision space for needs quantification, we asked personnel in each facility if they participated in the forecasting of their essential drug needs or if a higher authority did the forecasting for them. Therefore, the variable decision space indicator used for needs quantifica-tion was—Quantify annual requirements on their own. As shown below in
Table 11: Relationship between Variable Decision Space for Product Selection and Related Performance Indicators
Decision Space Indicator Brand Private Sector (%) Brand Medical Stores (%)
Shorter EDL based on disease patterns 19 (12) 0.7 (19) (high DS)
Did not create a shorter EDL based on 0 (11) 5 (19) disease patterns (low DS)
Ttest T= -1.8 p= 0.07 N=23 T= 1.8 p= 0.07 N=38

24
Decentralization and the Health Logistics Systems in Ghana
Table 12, almost all facilities (81 percent) quantify annual requirements on their own. (See annex B for decision space results for contraceptives and vaccines.)
The effectiveness of local decisions on needs quantification might be measured by whether they used the accepted best practice of using their own logistics data to do the needs quantification rather than other options (using data for reporting purposes only). Using logistics data was defined as collecting essential logistics data—consumption, losses, and adjust-ments, and stock on hand—and determining future needs based on these parameters. If not, their performance was expected to be poorer. If the facilities did their own needs quantification using non-standard or unac-ceptable methodologies, this could have affected the accuracy of these estimates. Poor estimates of needs might also result in more stockouts.
We hypothesized that facilities doing their own needs quantification would be able to determine more accurately what their requirements are because they have better information on their requirements. We also hypothesized that those using logistics-based information would have better forecasts leading to lower stockouts and improved logistics performance. Logistics information would also improve forecasting accuracy.
Four logistics system performance indicators were examined:
1. Use logistics data for needs quantification.2. Mean percentage of products were stocked out at the time of the visit
(presented previously as a performance indicator for other functions above).
3. Mean percentage of products were stocked out over the last six months (presented previously as a performance indicator for other functions above).
4. Forecasting accuracy for medicines. According to the LIAT, forecast-ing accuracy is defined as how much, more or less, in percentages, each facility forecasts over how much they actually consume. For example, if a facility forecasted that they needed 100 condoms for a given period and they only consumed 50 condoms during that period, then the forecasting accuracy for that period is [(100–50)/100] x 100 or 50%. This facility forecasted 50 percent more than they consumed. Similarly, facilities may forecast less than they consume, meaning their forecasting accuracy would be a negative percent.
Table 12 shows that there was a high level of decision space for needs quantification for essential drugs (81 percent). Almost all facilities use logistics data to do their drug need calculations. Product stockouts on the day of the visit was relatively low at all levels. However, in the past six months, 28 percent of facilities reported a stockout of one or more prod-ucts. Regional hospitals had the lowest stockout rates among all facilities. On average, all facilities are forecasting more than they consume, with an average of 94 percent more in terms of forecasting accuracy.
The small variation in the decision space variable for forecasting did not allow for any further analysis between forecasting decision space and performance indicators. However, the trends in the data in table 12 show

25
Findings
some interesting results. All facilities who quantify their own annual needs are using logistics data to make these calculations. However, despite the fact that all facilities are using logistics data and calculating their own needs, there are still stockouts in the system (both at the time of the visit and over the last six months). This suggests that there some other factor must be affecting stockouts besides forecasting. As mentioned in the financing section, cash and stock balances seem to have some effect on stockouts. Those facilities with a higher increase in stock and cash balances from 2001 to 2002 had fewer stockouts at the time of the visit. The final column of table 12 shows that all facilities are over-forecasting for drugs.
Procurement From a decision space analysis, procurement is a very interesting aspect of the logistics system in Ghana. In theory, the facilities use their revolving funds to purchase essential drugs from the public medical stores—Central Medical Stores, Regional Medical Stores, or District Medical Stores (CMS, RMS, or DMS). The facilities go directly to the medical stores to purchase, collect, and transport the drugs. However, in some cases, the medical stores may reject orders if they seen inappropriate (too much in volume for the target population of a facility, or non-essential drugs for that facility level, or if the facility does not have personnel skilled in use of that drug). Also, the stores may not be able to provide the drugs because they do not have them in stock. This last reason is supposed to result in issuing a Certificate of Non-Availability. This certificate authorizes the facility to purchase drugs from private providers. However, it is not clear that any of these theoretical steps are generally enforced. It is thought that if the medi-cal stores reject the orders, the facilities go directly to the private sector, whether they have a Certificate of Non-Availability or not.
Table 12: Decision Space for Needs Quantification and Related Performance Indicators
Decision Space Indicator (high DS facilities only) Performance Indicators (all facilities)
Use logistics Quantify own data to Stockout on Stockout in Forecasting annual needs calculate needs day of visit last 6 months accuracy Facility Type (drugs) (%) (drugs) (%) (drugs) (%) (drugs) (%) (drugs) (%)
Regional HA 100 (5) 100 (5) 3 (5) 9 (4) 107 (3)
Regional Hospital 100 (5) 100% (5) 4 (4) 0.5 (2) 144 (3)
District HA 87 (13) 100 (15) 11 (15) 17 (13) 105 (6)
District Hospital 68 (15) 95 (21) 6 (22) 8 (15) 58 (7)
Total (N) 81 (38/47) 97 (46) 7 (46) 11 (34) 94 (19)

26
Decentralization and the Health Logistics Systems in Ghana
It was determined that the general decision space for procurement was moderate to high because facilities were expected to develop plans that can be modified by central authorities. Facilities were expected to purchase from government medical stores, but they were also were allowed to purchase from the private sector if a certificate was granted or if there was evidence that the medical store could not fill the order. Even if purchases from the private sector were often made without the certificate, the general practice was to purchase from public stores, so it was felt that the decision space was not wide. It was found that procurement decisions for contra-ceptives and vaccines were centralized.
The fact that local managers of the health system make their own procure-ment decisions (most of the time) would dictate that the impact of their decision making on the logistics system is direct. The investigations of variable decision space in this area are designed to determine which deci-sion-making respondents indicated they have local choices and how those choices are used for procurement decisions.
We hypothesize that facilities that purchase more from outside the public sector would be more likely to purchase drugs that are not on the NEDL. This is because the public sector would not be able to meet the demand for drugs not on the NEDL because stocking in the public sector is based solely on the EDL. Facilities that wanted to use these drugs would, there-fore, have to obtain them from the private sector.
The variable decision space indicators for procurement are—
1. Have their own procurement plan: Facilities had high decision space if they had their own procurement plan.
2. Purchased from the private sector if order not filled: We asked what facilities/offices did when less than 100 percent of their last order was provided. High DS was defined as purchasing from the private sector; low decision space was if they reordered at a later date or did nothing.
3. Reprimanded for buying from private sector: Facilities were asked if in the last 12 months they had been reprimanded for purchasing from the private sector. High decision space was defined as not being repri-manded and low decision space as being reprimanded. (This qualifier on the decision space because we postulated that facilities who were reprimanded on decisions taken and choices made at the local level were, realistically, bound by higher level approvals and may not exer-cise as much decision space as those that were not reprimanded.)
One performance indicator was chosen to evaluate variable decision space on procurement. It was felt that if local decisions resulted in drugs purchased off the Essential Drug List8, then the local decisions on procure-ment were not following central norms. A little less than half the sample purchased drugs off the National EDL.
8. This includes both having a copy on hand and just saying they have a local EDL.

27
Findings
As hypothesized above, those that purchase from the private sector if their orders are not filled are also more likely to purchase drugs off the National EDL. However, those that are not reprimanded for purchasing from the private sector are not any more likely to purchase drugs off the National EDL than those who are reprimanded.9
Inventory Control Inventory control is the logistics function of product handling and the processes involved in its withdrawal or use, as well as the information management of the stocks. In health logistics, it is recommended that products be managed on a first-to-expire, first-out (FEFO) basis. This requires that products that will expire first be removed from inventory for use; this is the opposite of other inventory management systems that are based, for example, on first-in, first-out (FIFO). This, in turn, drives the
9. Because these results are insignificant, they are not reported.
Table 13: Procurement Decision Space Indicators
Performance Indicators for Variable Decision Space Indicators Procurement (high DS facilities only) (all facilities)
Purchased from Not reprimanded Have own private sector if for purchasing Purchased drugs procurement plan order not filled from private off National EDL Facility Type (%) (%) sector (%) (%)
Regional HA 100 (5) 20 (1) 75 (3) 0 (4)
Regional Hospital 100 (5) 60 (3) 100 (5) 60 (3)
District HA 72 (18) 18 (3) 100 (13) 13 (2)
District Hospital 82 (18) 74 (14) 85 (17) 76 (16)
Total (N) 81 (46/57) 46 (21/46) 90 (38/42) 46 (21/46)
Table 14: Relationship between Procurement Decision Space Indicators and Performance Variables
Decision Space Indicator Purchased Drugs Off National EDL (%)
Purchased from private sector if order not filled (high DS) 65 (20)
Did not purchase from private sector if order not filled (low DS) 32 (19)
Ttest T= -2.0 p= 0.03 N=39
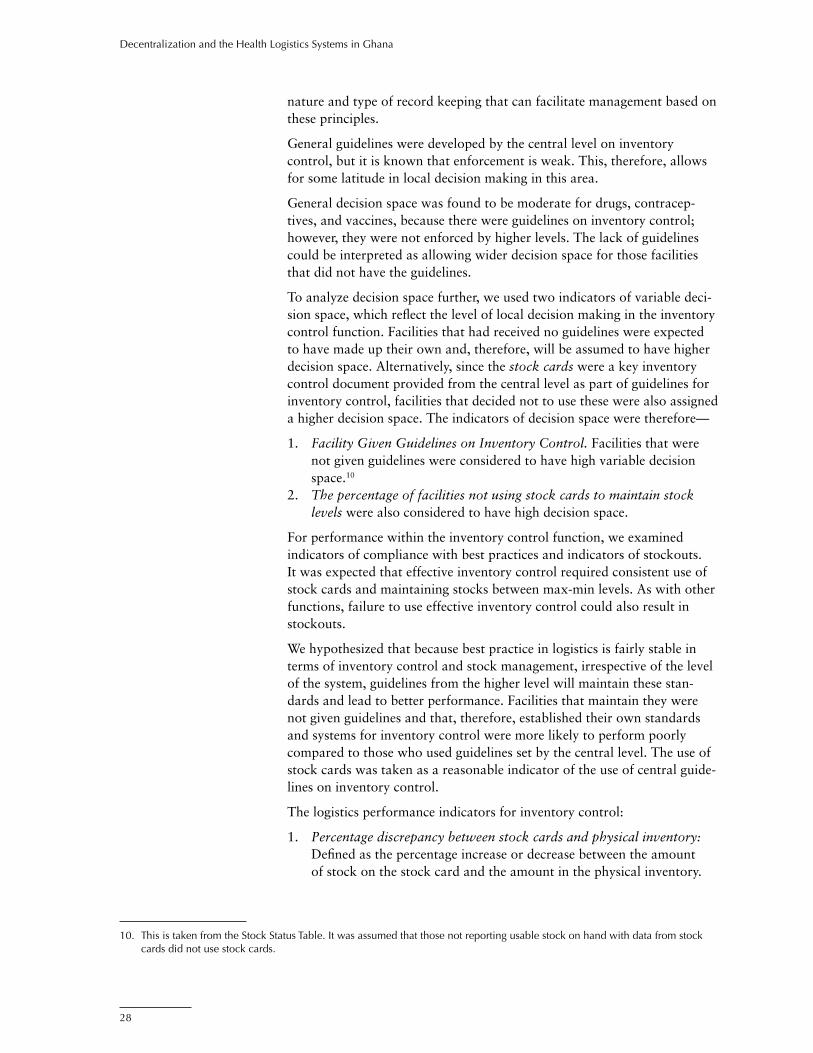
28
Decentralization and the Health Logistics Systems in Ghana
nature and type of record keeping that can facilitate management based on these principles.
General guidelines were developed by the central level on inventory control, but it is known that enforcement is weak. This, therefore, allows for some latitude in local decision making in this area.
General decision space was found to be moderate for drugs, contracep-tives, and vaccines, because there were guidelines on inventory control; however, they were not enforced by higher levels. The lack of guidelines could be interpreted as allowing wider decision space for those facilities that did not have the guidelines.
To analyze decision space further, we used two indicators of variable deci-sion space, which reflect the level of local decision making in the inventory control function. Facilities that had received no guidelines were expected to have made up their own and, therefore, will be assumed to have higher decision space. Alternatively, since the stock cards were a key inventory control document provided from the central level as part of guidelines for inventory control, facilities that decided not to use these were also assigned a higher decision space. The indicators of decision space were therefore—
1. Facility Given Guidelines on Inventory Control. Facilities that were not given guidelines were considered to have high variable decision space.10
2. The percentage of facilities not using stock cards to maintain stock levels were also considered to have high decision space.
For performance within the inventory control function, we examined indicators of compliance with best practices and indicators of stockouts. It was expected that effective inventory control required consistent use of stock cards and maintaining stocks between max-min levels. As with other functions, failure to use effective inventory control could also result in stockouts.
We hypothesized that because best practice in logistics is fairly stable in terms of inventory control and stock management, irrespective of the level of the system, guidelines from the higher level will maintain these stan-dards and lead to better performance. Facilities that maintain they were not given guidelines and that, therefore, established their own standards and systems for inventory control were more likely to perform poorly compared to those who used guidelines set by the central level. The use of stock cards was taken as a reasonable indicator of the use of central guide-lines on inventory control.
The logistics performance indicators for inventory control:
1. Percentage discrepancy between stock cards and physical inventory: Defined as the percentage increase or decrease between the amount of stock on the stock card and the amount in the physical inventory.
10. This is taken from the Stock Status Table. It was assumed that those not reporting usable stock on hand with data from stock cards did not use stock cards.

29
Findings
Table 16: Inventory Control Performance Indicator: Stockouts in Last Six Months and Mean Duration (all products)
Mean No. Days Stocked Out for Percentage of Products Stocked Out Each Stockout (among those in Last 6 Months reporting stockouts)11
Contraceptives Facility Type Drugs (%) (%) Vaccines (%) Drugs Contraceptives
Regional HA 9 (4) 11 (1) 0.5 (1) 15 (4) 7 (1)
Regional hospital 0.5 (2) 14 (2) - -- 16 (2)
District HA 17 (13) 14 (5) 4 (6) 23 (13) 23 (4)
District hospital 8 (15) 7 (2) 0.2 (2) 12 (15) 25 (1)
Total 11 (34) 12 (10) 3 (9) 17 (32) 20 (8)
A “0” is perfect; the facility has the exact same amount on the stock cards as in the physical inventory. An acceptable range of agreement is any figure between –5% and 5%.
2. Percentage of facilities with stock between max-min levels: Facilities should have at least one month and no more than three months of stock in their physical inventory.
3. Percentage of products (drugs) stocked out at the time of the visit.4. Percentage of products (drugs) stocked out in the last six months.5. Average number of days per stockout (in last six months).
Table 15 presents results of the one variable decision space indicator and three of the logistics performance indicators. (See annex B for results for contraceptives and vaccines.) Table 16 presents the remaining logistic performance indicators.
Table 15: Variable Decision Space for Inventory Control and Related Performance Indicators
Decision Space Indicator Logistics Performance Indicators for Drugs (high DS facilities only) (all facilities)
Not given Percentage Percentage of inventory Percentage not stock card Percentage products control using stock discrepancy within max-min stocked out on Facility Type guidelines (%) cards (%) (%) stock level (%) day of visit (%)
Regional HA 20 (1) 20 (5) -3 (5) 41 (5) 3 (5)
Regional Hospital 20(1) 40 (5) 12 (4) 38 (5) 4 (4)
District HA 24 (6) 53 (15) -2 (15) 36 (15) 11 (15)
District Hospital 41 (9) 45 (22) 23 (22) 36 (22) 6 (22)
Total 30 (17/57) 45 (21/47) 11 (46) 37 (47) 7 (46)
11. There were too many missing values to report figures for vaccines.
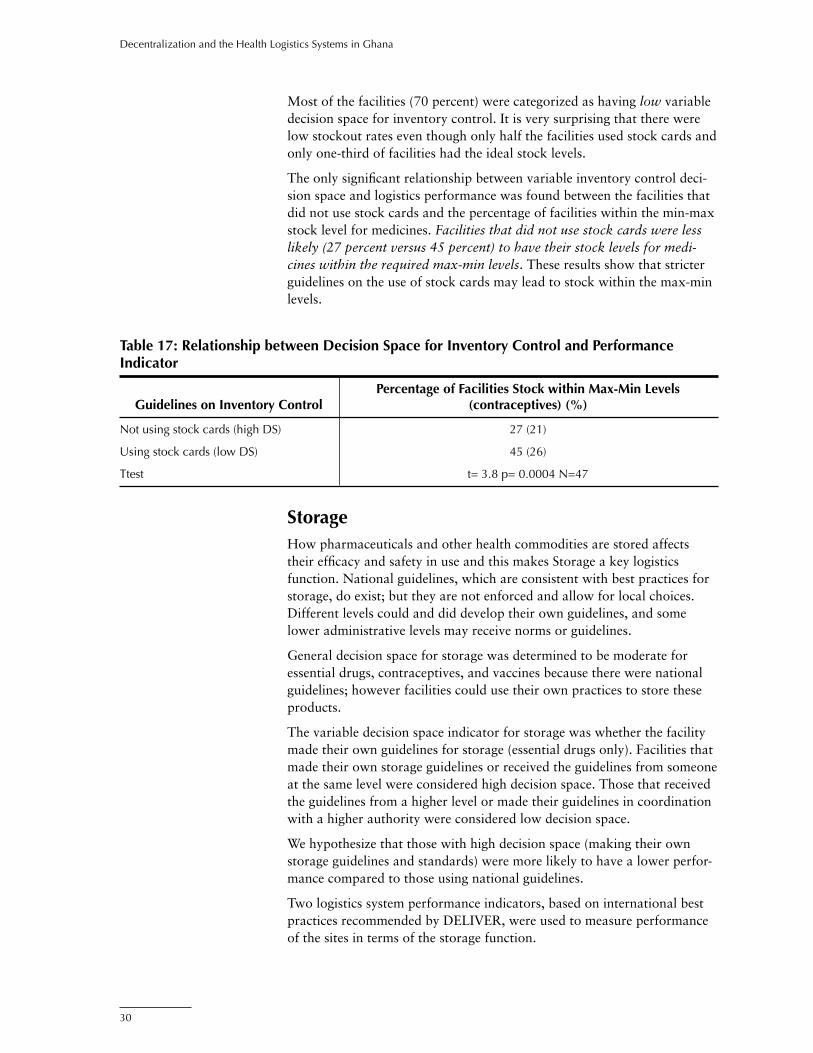
30
Decentralization and the Health Logistics Systems in Ghana
Most of the facilities (70 percent) were categorized as having low variable decision space for inventory control. It is very surprising that there were low stockout rates even though only half the facilities used stock cards and only one-third of facilities had the ideal stock levels.
The only significant relationship between variable inventory control deci-sion space and logistics performance was found between the facilities that did not use stock cards and the percentage of facilities within the min-max stock level for medicines. Facilities that did not use stock cards were less likely (27 percent versus 45 percent) to have their stock levels for medi-cines within the required max-min levels. These results show that stricter guidelines on the use of stock cards may lead to stock within the max-min levels.
Table 17: Relationship between Decision Space for Inventory Control and Performance Indicator
Percentage of Facilities Stock within Max-Min Levels Guidelines on Inventory Control (contraceptives) (%)
Not using stock cards (high DS) 27 (21)
Using stock cards (low DS) 45 (26)
Ttest t= 3.8 p= 0.0004 N=47
StorageHow pharmaceuticals and other health commodities are stored affects their efficacy and safety in use and this makes Storage a key logistics function. National guidelines, which are consistent with best practices for storage, do exist; but they are not enforced and allow for local choices. Different levels could and did develop their own guidelines, and some lower administrative levels may receive norms or guidelines.
General decision space for storage was determined to be moderate for essential drugs, contraceptives, and vaccines because there were national guidelines; however facilities could use their own practices to store these products.
The variable decision space indicator for storage was whether the facility made their own guidelines for storage (essential drugs only). Facilities that made their own storage guidelines or received the guidelines from someone at the same level were considered high decision space. Those that received the guidelines from a higher level or made their guidelines in coordination with a higher authority were considered low decision space.
We hypothesize that those with high decision space (making their own storage guidelines and standards) were more likely to have a lower perfor-mance compared to those using national guidelines.
Two logistics system performance indicators, based on international best practices recommended by DELIVER, were used to measure performance of the sites in terms of the storage function.

31
Findings
Table 18: Storage Decision Space and Related Logistics Performance Indicators
Decision Space Indicator (high DS facilities only) Performance Indicators (all facilities)
Made their own 100% of storage Percentage of cold Facility Type guidelines (%) standards met (%) chain standards met (%)
Regional HA 25 (1) 40 (2) 80 (4)
Regional Hospital 20(1) 60 (3) 50 (2)
District HA 12 (3) 13 (2) 40 (6)
District Hospital 60 (12) 23 (5) 44 (8)
Total (N) 31% (17/54) 26% (12/47) 48% (20/42)
1. Met 100 percent of storage standards: Twelve basic storage conditions considered necessary to maintain the quality and preserve the condi-tion of products for users.
2. Percentage of cold chain standards met: Primarily for vaccines, but can apply to other products that require refrigeration. The standards for cold chain were (1) refrigerators and thermo flasks available to protect the vaccines during transport, (2) appropriate temperature (between 0–8 centigrade) for all refrigerators, (3) appropriately graphed/record-ed the temperature on the day of the visit, and (4) a guide for the vaccination scheme on hand.
Facilities given guidelines were more likely to meet 100 percent of the storage conditions for drugs (see table 19). Similar to inventory control, stricter storage guidelines may lead to more facilities meeting storage conditions.
Transportation Transport forms a key link in any distribution system. In the health logistics system, the role of transportation in ensuring product availability cannot be overemphasized. Facilities may have their own vehicle for use in the transportation of commodities or they may need to rely on other sources. In some instances, it may be necessary to pay transportation costs from the revolving drug funds. Transport options available to facilities for transport of essential drugs and contraceptives were assessed. Facili-ties/offices can choose any type of transportation. Vaccines are transported separately using cold chain vehicles, but they may transport drugs and contraceptives together.
Table 19: Relationship between Storage Decision Space and Storage Conditions
Percentage of Facilities That Met 100% of Decision Space Indicator Storage Standards (drugs) (%)
Made own guidelines (high DS) 7 (15)
Receive guidelines from above (low DS) 34 (29)
T=2.0 p=0.04 N=44
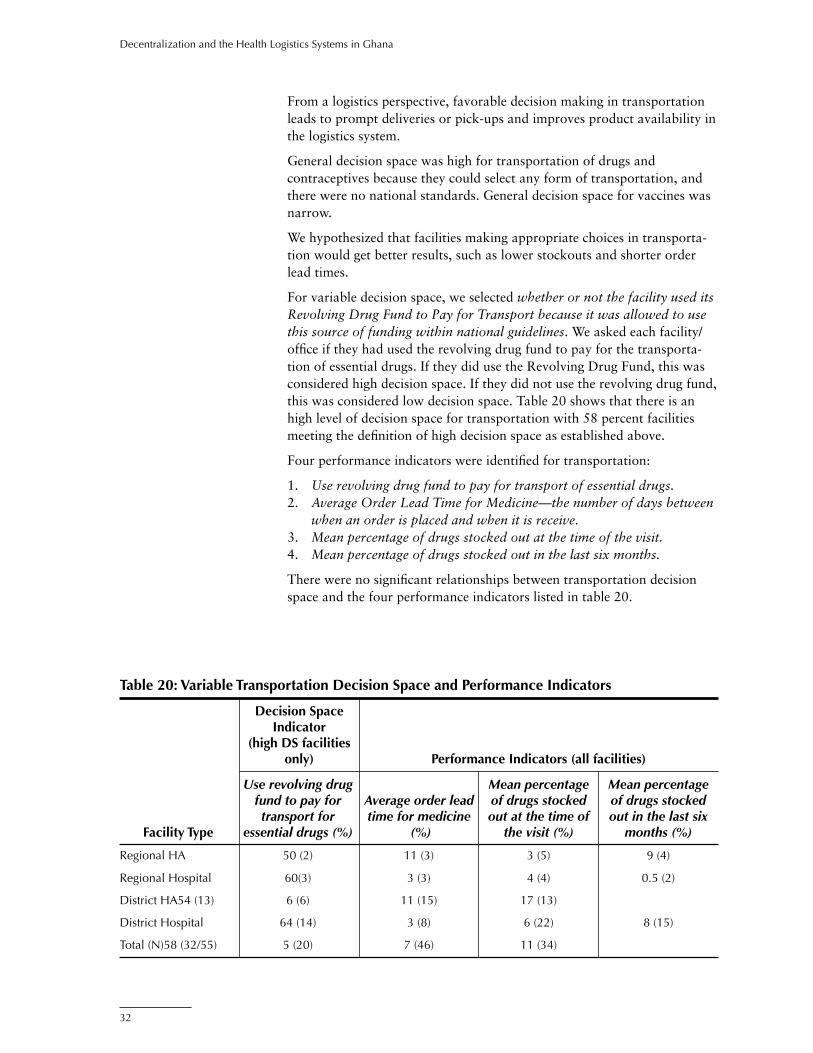
32
Decentralization and the Health Logistics Systems in Ghana
From a logistics perspective, favorable decision making in transportation leads to prompt deliveries or pick-ups and improves product availability in the logistics system.
General decision space was high for transportation of drugs and contraceptives because they could select any form of transportation, and there were no national standards. General decision space for vaccines was narrow.
We hypothesized that facilities making appropriate choices in transporta-tion would get better results, such as lower stockouts and shorter order lead times.
For variable decision space, we selected whether or not the facility used its Revolving Drug Fund to Pay for Transport because it was allowed to use this source of funding within national guidelines. We asked each facility/office if they had used the revolving drug fund to pay for the transporta-tion of essential drugs. If they did use the Revolving Drug Fund, this was considered high decision space. If they did not use the revolving drug fund, this was considered low decision space. Table 20 shows that there is an high level of decision space for transportation with 58 percent facilities meeting the definition of high decision space as established above.
Four performance indicators were identified for transportation:
1. Use revolving drug fund to pay for transport of essential drugs.2. Average Order Lead Time for Medicine—the number of days between
when an order is placed and when it is receive.3. Mean percentage of drugs stocked out at the time of the visit. 4. Mean percentage of drugs stocked out in the last six months.
There were no significant relationships between transportation decision space and the four performance indicators listed in table 20.
Table 20: Variable Transportation Decision Space and Performance Indicators
Decision Space Indicator (high DS facilities only) Performance Indicators (all facilities)
Use revolving drug Mean percentage Mean percentage fund to pay for Average order lead of drugs stocked of drugs stocked transport for time for medicine out at the time of out in the last six Facility Type essential drugs (%) (%) the visit (%) months (%)
Regional HA 50 (2) 11 (3) 3 (5) 9 (4)
Regional Hospital 60(3) 3 (3) 4 (4) 0.5 (2)
District HA 54 (13) 6 (6) 11 (15) 17 (13)
District Hospital 64 (14) 3 (8) 6 (22) 8 (15)
Total (N) 58 (32/55) 5 (20) 7 (46) 11 (34)

33
Findings
Logistic Management Information System In reporting logistics information, the regional levels report to national level on the RMS. National drugs reporting forms called Quarterly Returns for Drugs and Drug Availability Form as well as Contraceptives Returns Form and Vaccine Returns Form are also submitted. The forms are not always printed and circulated; but the store manager or pharmacist knows what information should be reported and it appears that they do so. The LMIS system in Ghana is generally not very strong and reporting is low, with little or no enforcement. In addition, some districts and regions may make up their own reports for additional information. All BMCs report general HMIS information on the whole system. A few indicators on the HMIS forms address logistics system issues.
General decision space was moderate for LMIS because there were nation-al forms, but some facilities developed their own forms.
We had one variable decision space for LMIS: whether facilities/offices have developed their own forms for managing drugs/contraceptives/vaccines in the last six months.
The performance indicators for the LMIS measured whether facilities submitted LMIS forms. Drugs, contraceptives, and vaccines have estab-lished and different forms. For essential drugs, the facilities report to districts, which also report to the region on a monthly basis. The regions report to national level on the performance of their respective Regional Medical Stores. The following four performance indicators were assessed:
1. Submitting quarterly forms for essential drugs.2. Submitting quarterly forms for contraceptives.3. Submitting quarterly forms for vaccines.4. Submitting monthly drug availability forms.
Table 21: Variable LMIS Decision Space and Performance Variables
Decision Space Indicator (high DS Performance Indicators facilities only) (all facilities)
Submit Submit quarterly Submit Develop own quarterly reporting of quarterly Submit monthly LMIS forms reporting of contraceptives reporting of report of drug Facility Type (%) drugs (%) (%) vaccines (%) availability (%)
Regional HA 20 (1) 60 (3) 100 (5) 100 (5) 80 (4)
Regional Hospital 60 (3) 80 (4) 100 (2) 67 (2) 60 (3)
District HA 13 (3) 89 (16) 96 (22) 96 (24) 86 (18)
District Hospital 19 (4) 79 (15) 100 (12) 87 (14) 69 (11)
Total (N) 20 (11/55) 81 (38/47) 98 (41) 92 (45/49) 77 (36/47)

34
Decentralization and the Health Logistics Systems in Ghana
Table 22: Relationship between LMIS Decision Space and Performance Variables
Submit Quarterly Reporting Submit Monthly Report of Drug Decision Space Indicator of Contraceptives (%) Availability (%)
Develop own LMIS forms 88 (34) 50 (10) (high DS)
Do not develop own LMIS forms 100 (8) 84 (37) (low DS)
T=2.2 p=0.03 N=42 T=2.3 p=0.02 N=47
We hypothesize that, in general, higher decision space for reporting would result in poorer performance. Facilities using the national forms and guidelines were expected to be more likely to submit their reports than those that made up heir own forms.
In examining the relationship between the variable decision space (devel-oping their own LMIS forms) and submission of different quarterly reports, we found the following results. Those facilities that developed their own LMIS forms were less likely to submit quarterly reporting of contraceptives and monthly reporting of drug availability. These results suggest that stricter guidelines for an LMIS may lead to a more efficient information system.
Personnel/Human ResourcesGeneral decision space for Personnel and Human resources is considered to be low. Although the reforms in the health sector was quite extensive and transferred reasonable control over most functions to the local level, not all functions are fully under the local management controls, most nota-bly remuneration and the hiring of full-time or permanent staff. Generally, human resource management is still ostensibly centralized with certain decision points located even outside the health sector. The health sector is still subject to the hiring and firing controls of the civil service. The hiring of full-term staff is still performed at the central level.
However, local health managers have some reasonable latitude in assign-ing staff to tasks at the local levels. The establishment of the Ghana Health Service gives some authority for hiring non-permanent staff. The non-permanent staff can be hired at the local level and compensated with internal funds.
General decision space for personnel was moderate to high because local officials can assign any personnel to logistics functions and can hire non-permanent staff.
Two variable decision space indicators for personnel were examined:
1. Transfer staff without approval: If the facility transferred personnel in the last year without approval from a higher level, this was considered high decision space. Transferring only with approval was considered low decision space.

35
Findings
2. Use internally generated funds to motivate staff: Facilities were asked if in the last year they had used internally generated funds to motivate or reward staff for performing logistics functions. If the facility used internal funds, it was considered to have high decision space.
We hypothesized that to maximize performance local choices aimed at improved logistics performance will cause local managers to train staff performing logistics functions. A measure of this could be the ratio of trained staff working in the logistics system.
One performance indicator was used: percentage of staff trained in key logistics functions. This is the number of staff trained in key logistics functions during the last two years. The areas include product selection, budgeting, ordering/procurement, inventory control, and LMIS.
For this function, we hypothesize that facilities with a wider decision space on human resource and personnel would be able to transfer or assign staff to logistics functions and also to use internally generated funds to motivate staff. We also hypothesize that these facilities would be more likely to train staff in the logistics functions for improved performance.
Table 23: Personnel Decision Space and Related Logistics Performance Indicator
Decision Space Indicator (high DS facilities only) Performance Indicator
Transfer staff without Percentage staff trained higher level approval Use internal funds in logistics functions Facility Type (%) to motivate staff (%) for drugs (%)
Regional HA 20 (1) 40 (2) 91 (4)
Regional Hospital 0 (0) 60 (3) 50 (2)
District HA 16 (4) 47 (8) 66 (13)
District Hospital 9 (2) 81 (17) 54 (17)
Total (N) 12 (7/57) 63 (30/48) 62 (36)
There was no clear pattern between human resource variable decision space and the performance indicators for human resource functions.
SupervisionSupervision systems in the logistics system are not well defined. In most instances, supervision of the lower levels come mainly from the regional level and is structured mainly along the vertical disease programs. General management supervisory trips are also organized from the regional level. In most regions, the concept of a team and integrated approach to supervi-sion is used. Teams are constituted from the higher level and these then monitor all the various programs and different units at the lower level. It is also designed to break the monotony of vertical supervision in which some programs receive supervisory support while others do not. Also, worthy

36
Decentralization and the Health Logistics Systems in Ghana
of mention is the concept of district-parenting when a senior manager at the regional level is assigned as a parent for each district. This ensures that there is continuity in the oversight of what happens at each district, and ensures there is a point person at the regional level for each district.
For these supervisory arrangements to work, supervision guides were developed that stated the specific issues to review on a supervision trip and the interventions to be made. There were no strict national guidelines for these interventions and, especially for the logistics area, local levels devel-oped their own guidelines.
General decision space for supervision was deemed to be high because there were no clear national guidelines for supervision specifically for logistics.
Three variable decision space indicators were chosen for supervision:
1. Develop supervision guides: Decision space is defined as high if the facilities or someone from their level designs the supervision guides. Decision space is low if a higher authority designs the guides for the facility.
2. Decide on supervision schedules: Decision space is defined as high if the facilities or someone from their level creates supervision schedules. Decision space is low if a higher authority creates the supervision schedules for the facility.
3. Assign staff to supervision: Decision space is defined as high if the facilities or someone from their level can assign their own staff to supervision. Decision space is low if a higher authority assigns staff to supervision for the facility.
We hypothesized that higher logistics performance would result from supervision that included specific logistics-related activities that a supervi-sor will observe or inspect. Facilities that exercise higher decision space in the design and implementation of their supervision would address logistics system functions as a component of these guidelines. These include check-ing stocks and inventory records, as well as validity of products in storage.
The following performance indicators were used to investigate these hypotheses:
1. If facilities made supervisory visits in the last month.2. If the facilities received a supervisory visit in the last month.3. If the following items were covered during their last supervisory visit
for drugs, contraceptives, and/or vaccines:a. supplies were checkedb. stock cards were checkedc. expired stock cards were checkedd. LMIS reports were checkede. on-the-job trainingf. other.
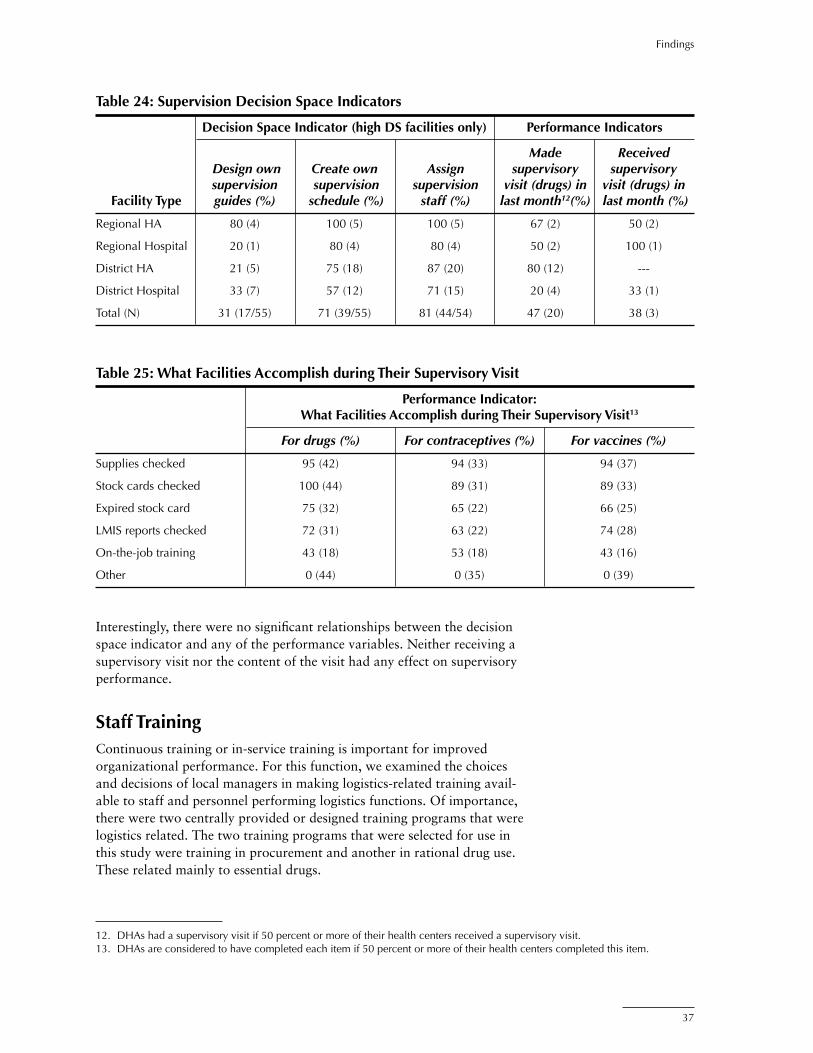
37
Findings
Interestingly, there were no significant relationships between the decision space indicator and any of the performance variables. Neither receiving a supervisory visit nor the content of the visit had any effect on supervisory performance.
Staff TrainingContinuous training or in-service training is important for improved organizational performance. For this function, we examined the choices and decisions of local managers in making logistics-related training avail-able to staff and personnel performing logistics functions. Of importance, there were two centrally provided or designed training programs that were logistics related. The two training programs that were selected for use in this study were training in procurement and another in rational drug use. These related mainly to essential drugs.
Table 24: Supervision Decision Space Indicators
Decision Space Indicator (high DS facilities only) Performance Indicators
Made Received Design own Create own Assign supervisory supervisory supervision supervision supervision visit (drugs) in visit (drugs) in Facility Type guides (%) schedule (%) staff (%) last month12(%) last month (%)
Regional HA 80 (4) 100 (5) 100 (5) 67 (2) 50 (2)
Regional Hospital 20 (1) 80 (4) 80 (4) 50 (2) 100 (1)
District HA 21 (5) 75 (18) 87 (20) 80 (12) ---
District Hospital 33 (7) 57 (12) 71 (15) 20 (4) 33 (1)
Total (N) 31 (17/55) 71 (39/55) 81 (44/54) 47 (20) 38 (3)
Table 25: What Facilities Accomplish during Their Supervisory Visit
Performance Indicator: What Facilities Accomplish during Their Supervisory Visit13
For drugs (%) For contraceptives (%) For vaccines (%)
Supplies checked 95 (42) 94 (33) 94 (37)
Stock cards checked 100 (44) 89 (31) 89 (33)
Expired stock card 75 (32) 65 (22) 66 (25)
LMIS reports checked 72 (31) 63 (22) 74 (28)
On-the-job training 43 (18) 53 (18) 43 (16)
Other 0 (44) 0 (35) 0 (39)
12. DHAs had a supervisory visit if 50 percent or more of their health centers received a supervisory visit.13. DHAs are considered to have completed each item if 50 percent or more of their health centers completed this item.

38
Decentralization and the Health Logistics Systems in Ghana
We examined the role or choices that local managers had in identifying training needs—conducting the required training using their own resources or selecting participants to be sent for training provided by the central or a higher level.
General decision space on staff training was moderate because there were national programs, but local officials could also design their own training programs.
We hypothesized that the number or ratio of people trained in logistics functions would be a reflection of the choices that local managers made. We expected that the more people trained in logistics functions in the last two years, the better the performance on the system.
Three variable training decision space indicators were examined:
1. Identify training needs: Facilities that identify their own training needs are considered as having high decision space.
2. Conduct training with their own resources: Facilities that would use their own resources to conduct training are considered as having high decision space.
3. Selection of participants for courses designed by higher authorities: High decision space was defined as those who select their own partici-pants or someone at their own level (regional or district level) selects the participants. Low decision space is if someone at a higher level selects the participants for the facility/office or the selection is coordi-nated with a higher level.
There was one performance indicator: Percentage of staff trained in key logistics functions.
Table 26: Training Decision Space Indicators and Related Performance Indicator
Performance Decision Space Indicator Indicators (high DS facilities only) (%) (all facilities) (%)
Percentage staff Identify own Conduct training Select participants trained in logistics Facility Type training needs with own resources for courses functions for drugs
Regional HA 100 (5) 50 (2) 60 (3) 91 (4)
Regional Hospital 100 (5) 80 (4) 20 (1) 50 (2)
District HA 84 (21) 65 (15) 2 (7) 66 (13)
District Hospital 91 (20) 74 (14) 21 (4) 54 (17)
Total (N) 89 (51/57) 31 (35/51) 28 (15/53) 62 (36)
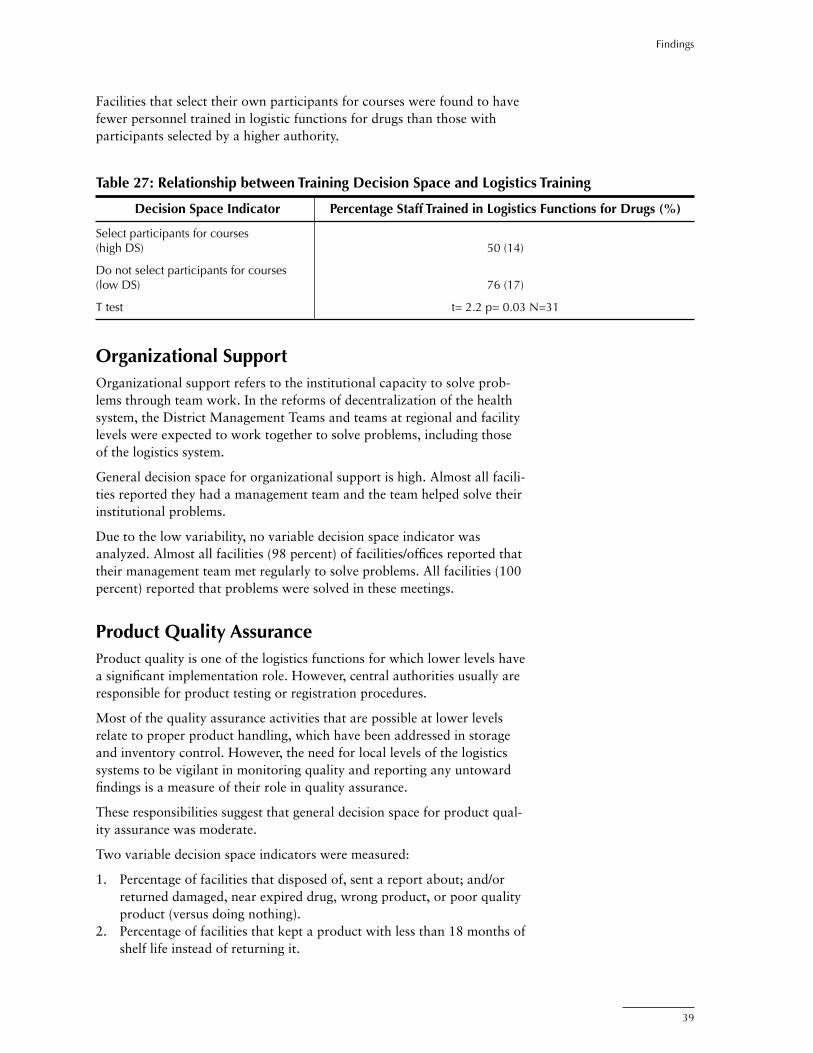
39
Findings
Facilities that select their own participants for courses were found to have fewer personnel trained in logistic functions for drugs than those with participants selected by a higher authority.
Table 27: Relationship between Training Decision Space and Logistics Training
Decision Space Indicator Percentage Staff Trained in Logistics Functions for Drugs (%)
Select participants for courses (high DS) 50 (14)
Do not select participants for courses (low DS) 76 (17)
T test t= 2.2 p= 0.03 N=31
Organizational SupportOrganizational support refers to the institutional capacity to solve prob-lems through team work. In the reforms of decentralization of the health system, the District Management Teams and teams at regional and facility levels were expected to work together to solve problems, including those of the logistics system.
General decision space for organizational support is high. Almost all facili-ties reported they had a management team and the team helped solve their institutional problems.
Due to the low variability, no variable decision space indicator was analyzed. Almost all facilities (98 percent) of facilities/offices reported that their management team met regularly to solve problems. All facilities (100 percent) reported that problems were solved in these meetings.
Product Quality AssuranceProduct quality is one of the logistics functions for which lower levels have a significant implementation role. However, central authorities usually are responsible for product testing or registration procedures.
Most of the quality assurance activities that are possible at lower levels relate to proper product handling, which have been addressed in storage and inventory control. However, the need for local levels of the logistics systems to be vigilant in monitoring quality and reporting any untoward findings is a measure of their role in quality assurance.
These responsibilities suggest that general decision space for product qual-ity assurance was moderate.
Two variable decision space indicators were measured:
1. Percentage of facilities that disposed of, sent a report about; and/or returned damaged, near expired drug, wrong product, or poor quality product (versus doing nothing).
2. Percentage of facilities that kept a product with less than 18 months of shelf life instead of returning it.
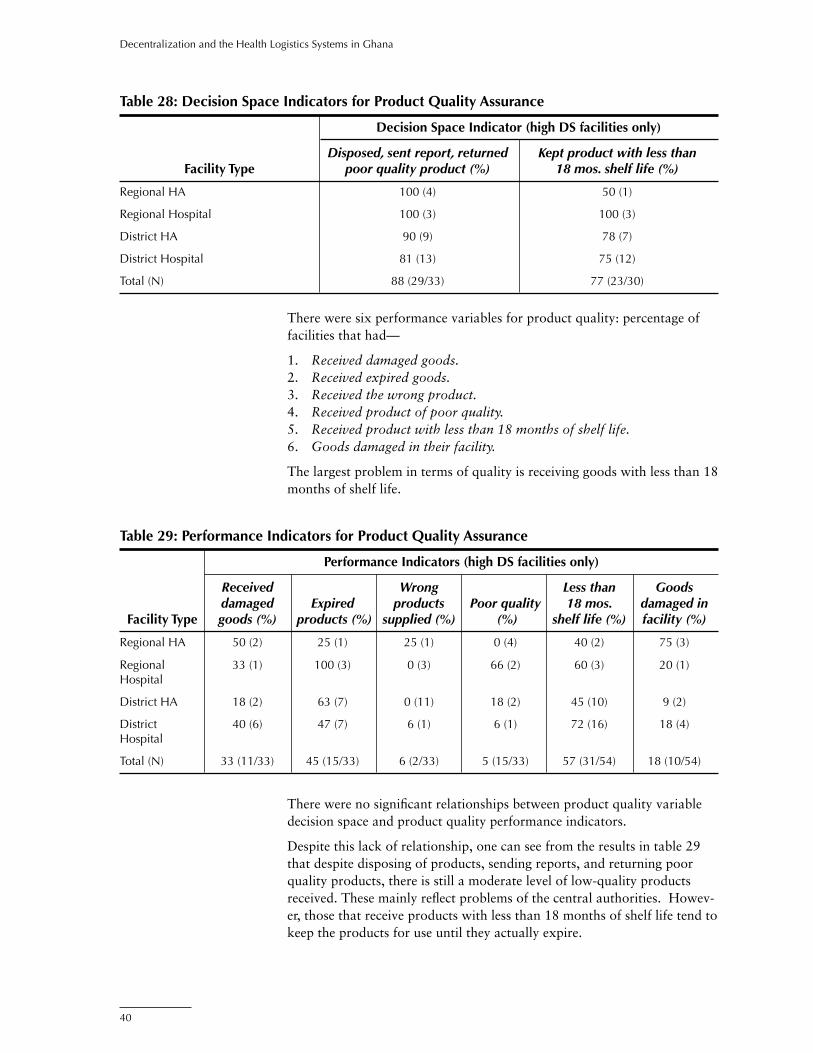
40
Decentralization and the Health Logistics Systems in Ghana
There were six performance variables for product quality: percentage of facilities that had—
1. Received damaged goods.2. Received expired goods.3. Received the wrong product.4. Received product of poor quality.5. Received product with less than 18 months of shelf life.6. Goods damaged in their facility.
The largest problem in terms of quality is receiving goods with less than 18 months of shelf life.
Table 28: Decision Space Indicators for Product Quality Assurance
Decision Space Indicator (high DS facilities only)
Disposed, sent report, returned Kept product with less than Facility Type poor quality product (%) 18 mos. shelf life (%)
Regional HA 100 (4) 50 (1)
Regional Hospital 100 (3) 100 (3)
District HA 90 (9) 78 (7)
District Hospital 81 (13) 75 (12)
Total (N) 88 (29/33) 77 (23/30)
Table 29: Performance Indicators for Product Quality Assurance
Performance Indicators (high DS facilities only)
Received Wrong Less than Goods damaged Expired products Poor quality 18 mos. damaged in Facility Type goods (%) products (%) supplied (%) (%) shelf life (%) facility (%)
Regional HA 50 (2) 25 (1) 25 (1) 0 (4) 40 (2) 75 (3)
Regional 33 (1) 100 (3) 0 (3) 66 (2) 60 (3) 20 (1) Hospital
District HA 18 (2) 63 (7) 0 (11) 18 (2) 45 (10) 9 (2)
District 40 (6) 47 (7) 6 (1) 6 (1) 72 (16) 18 (4) Hospital
Total (N) 33 (11/33) 45 (15/33) 6 (2/33) 5 (15/33) 57 (31/54) 18 (10/54)
There were no significant relationships between product quality variable decision space and product quality performance indicators.
Despite this lack of relationship, one can see from the results in table 29 that despite disposing of products, sending reports, and returning poor quality products, there is still a moderate level of low-quality products received. These mainly reflect problems of the central authorities. Howev-er, those that receive products with less than 18 months of shelf life tend to keep the products for use until they actually expire.
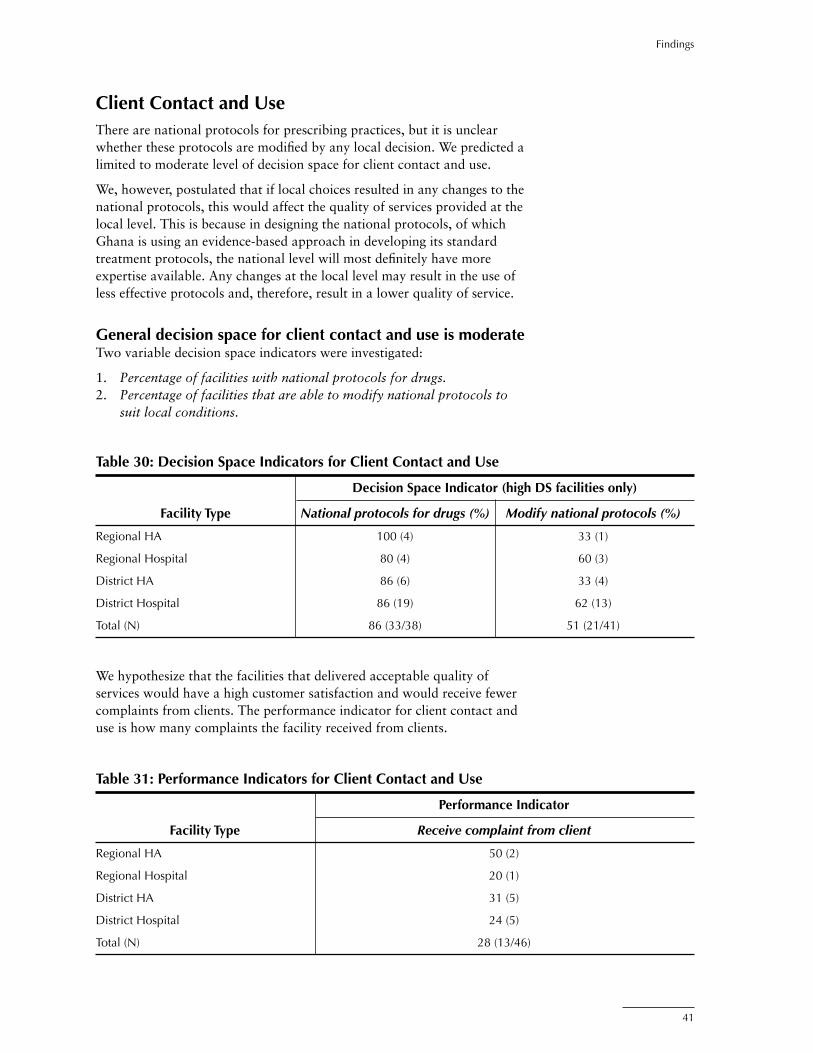
41
Findings
Client Contact and UseThere are national protocols for prescribing practices, but it is unclear whether these protocols are modified by any local decision. We predicted a limited to moderate level of decision space for client contact and use.
We, however, postulated that if local choices resulted in any changes to the national protocols, this would affect the quality of services provided at the local level. This is because in designing the national protocols, of which Ghana is using an evidence-based approach in developing its standard treatment protocols, the national level will most definitely have more expertise available. Any changes at the local level may result in the use of less effective protocols and, therefore, result in a lower quality of service.
General decision space for client contact and use is moderateTwo variable decision space indicators were investigated:
1. Percentage of facilities with national protocols for drugs.2. Percentage of facilities that are able to modify national protocols to
suit local conditions.
Table 30: Decision Space Indicators for Client Contact and Use
Decision Space Indicator (high DS facilities only)
Facility Type National protocols for drugs (%) Modify national protocols (%)
Regional HA 100 (4) 33 (1)
Regional Hospital 80 (4) 60 (3)
District HA 86 (6) 33 (4)
District Hospital 86 (19) 62 (13)
Total (N) 86 (33/38) 51 (21/41)
Table 31: Performance Indicators for Client Contact and Use
Performance Indicator
Facility Type Receive complaint from client
Regional HA 50 (2)
Regional Hospital 20 (1)
District HA 31 (5)
District Hospital 24 (5)
Total (N) 28 (13/46)
We hypothesize that the facilities that delivered acceptable quality of services would have a high customer satisfaction and would receive fewer complaints from clients. The performance indicator for client contact and use is how many complaints the facility received from clients.

42
Decentralization and the Health Logistics Systems in Ghana
As we hypothesized, we found that facilities that modified national proto-cols received more complaints from clients than those that did not modify protocols. These results suggest perhaps stronger control on client contact and protocols for prescribing practices; however, a more detailed investiga-tion of client satisfaction should be conducted to verify these results.
Table 32: Relationship between Decision Space Indicators and Performance for Client Contact and Use
Decision Space Indicator Receive Complaint from Client
Modify national protocols (high DS) 38 (19)
Do not modify national protocols (low DS) 11 (19)
T test t= -1.9 p= 0.05 N=38
It is important to note, however, that this indicator is based on reports from the facility and not on exit client interviews, which would have been more dependable. In addition, the use of this single indicator would clearly not address the quality of care issue completely. Within the constraints of the data collected in this study, though, this provides an interesting finding.

43
Findings
Integration of Logistic Systems in GhanaDecentralization of health systems is often accompanied by or follows another major organizational change—integration of health services—that may have an important impact on the effectiveness of a logistics system. Historically, health commodity groups tend to be managed in separate systems (vertically). Logistics systems are said to be integrated if different commodity groups are managed together using shared or the same resources and systems. This part of the study examines the impact of integration on the logistics performance.
For the three types of products, we reviewed the logistics functions where integration is possible. We could make a reliable measure of integration for only six functions: financing, product selection, forecasting, storage, inven-tory control, and personnel. Integration for all functions was less than 50 percent.
Financing We found a moderate level of integration for receiving funds for drugs and contraceptives. A facility is defined as integrated if the same entity (MOH, regional-level authority, District Assembly, or donors) provided funds for both drugs and contraceptives.
We examined the relationship between integration for financing and the four financing performance variables used for decentralization of financ-ing, cost recovery, and planning and budgeting:
1. Percentage increase in stock and cash balances 2002.2. Total capital 2002 adjusted for outstanding payments (equity of facil-
ity in stock).3. Mean percentage of drugs stocked out at the time of the visit. 4. Mean percentage of drugs stocked out in the last six months.
There was no clear relationship between the level of integration for financ-ing and any of the performance indicators listed above.
Table 33: Integration for Financing
Integration for Receiving Funds for Drugs and Contraceptives (%)
Regional HA 50 (2)
Regional Hospital 50 (4)
District HA 47 (17)
District Hospital 36 (17)
Total (N) 43 (40)

44
Decentralization and the Health Logistics Systems in Ghana
Needs QuantificationWe found a moderate level of integration for needs quantification. Integra-tion of needs quantification for annual requirement means that the facil-ity forecasts annual requirements for drugs, contraceptives, and vaccines together. Non-integration means that the facility forecasts annual require-ments for drugs, contraceptives, and vaccines separately.
Three of the same performance indicators for decentralization of needs quantification are used for integration of forecasting (due to low varia-tion the percentage that use logistic data for forecasting was not used as a performance indicator):
1. Mean percentage of products stocked out at the time of the visit (presented previously as a performance indicator for other functions above).
2. Mean percentage of products stocked out over the last six months (presented previously as a performance indicator for other functions above.
3. Forecasting accuracy for medicines.
There was no clear relationship between the level of integration for fore-casting and any of the performance indicators listed above.
StorageIntegration for storage was low. Integration of storage means that the facil-ity stores drugs, contraceptives, and vaccines in one warehouse. Non-inte-gration means that the facility stores drugs, contraceptives, and vaccines in different warehouses.
Table 34: Integration for Forecasting
Integration for Forecasting Annual Requirements (%)
Regional HA 100 (1)
Regional Hospital —
District HA 57 (23)
District Hospital 36 (17)
Total (N) 43 (40)

45
Findings
The same performance indicators used for decentralization of storage are used for the integration of storage:
1. Met 100 percent of storage standards: These are the twelve basic storage conditions considered necessary to maintain the quality and preserve the condition of products for users.
No significant relationships were found.
Inventory ControlIntegration of inventory control was moderate. Integration of inventory control guidelines distribution means that guidelines for drugs, contracep-tives, and vaccines are provided to each facility by the same entity (MOH, regional-level authority, District Assembly, or donors). Non-integration means that guidelines are provided by different entities.
The same performance indicators used for decentralization were used for integration of inventory control:
1. Percentage discrepancy between stock cards and physical inventory: Percentage discrepancy between stock cards and physical inventory is defined as the percentage increase or decrease between the amount of stock on the stock card and the amount in the physical inventory. A figure of “0” is perfect because the facility has the exact amount on the stock cards as in the physical inventory. An acceptable range of agreement is any figure between –5% and 5%.
Table 35: Integration for Storage
Integration for Storage Facilities
Regional HA 20 (5)
Regional Hospital 20 (5)
District HA 13 (24)
District Hospital 14 (24)
Total (N) 15 (55)
Table 36: Integration for Inventory Control
Integration for Provision of Guidelines for Inventory Control
Regional HA 80 (5)
Regional Hospital 25 (4)
District HA 56 (18)
District Hospital 29 (14)
Total (N) 46 (41)

46
Decentralization and the Health Logistics Systems in Ghana
Table 37: Integration for Personnel
Integration for Personnel Allocations
Regional HA 25 (4)
Regional Hospital 40 (5)
District HA 46 (24)
District Hospital 33 (21)
Total (N) 38 (54)
2. Percentage of facilities with stock between max-min levels: Facilities should have at least one month and no more than three months of stock in their physical inventory.
3. Percentage of products (drugs) stocked out at the time of the visit.4. Percentage of products (drugs) stocked out in the last six months.5. Average number of days per stockout (in last six months).
There was no clear relationship between the level of integration for inven-tory control and any of the performance indicators listed above.
Personnel Integration of personnel was low. Integration means that staffing decisions are made together for drugs, contraceptives, or vaccines (although we cannot distinguish between those decisions made together or in any combi-nation of two products). Non-integration means that staffing decisions were made for only one product at a time.
There was no clear relationship between the level of integration for personnel and any of the performance indicators listed above for inventory control.
Overall, integration in Ghana appears to be low to moderate. Of the six functions where we could measure integration, we found three to have a low level of integration (product selection, storage, and personnel) and three to have a moderate level of integration (financing, needs quantifica-tion, and inventory control). We did not find any significant relationships between the level of integration and any of our performance indicators.

47
In previous studies of Ghana’s logistics system, there were indicators of stockouts and types of purchases that were similar to the questions in the 2002 survey. We present the comparison of these data below.
Stockouts of Essential DrugsThe level of stockouts decreased from 1999 to 2002. The level of stock-outs according to the report Baseline Study on the Pharmaceutical Sector in Ghana 1999 was 17 percent. This is based on the availability of 30 trac-er drugs. The percentage of stockouts of essential drugs in 2002 decreased to 7 percent . The results of the 2002 study are based on the availability of 14 tracer drugs. The decrease in the stockout rate may be due to the lower number of tracer drugs in the most recent sample.
Comparisons with Data from Previous Years
Table 38: Stockouts 1999 and 2002
Year 1999 2002
Stock outs 17% 7%
Purchases from Medical Stores and the Private SectorThe Baseline Study on the Pharmaceutical Sector in Ghana 1999 provided data on purchases from medical stores and the private sector for 1995–1998. The data for 2001–2002 is taken from the Pharmaceutical Pricing Study done in Ghana by JSI. Our study provided the data from 2002. Purchases from the medical stores have fluctuated over the period. There was also an overall increase in purchases from the private sector during 1996–1998 that seemed to plateau between 40–45 percent. The private sector figure from the Pharmaceutical Pricing Study for 2001–2002 is significantly lower than figures for all other years.
Table 39: Public and Private Purchases 1995–2002
Year 1995 1996 1997 1998 2002
Medical Stores 67% 77% 71% 55% 57%
Private Sector 33% 23% 29% 45% 41%
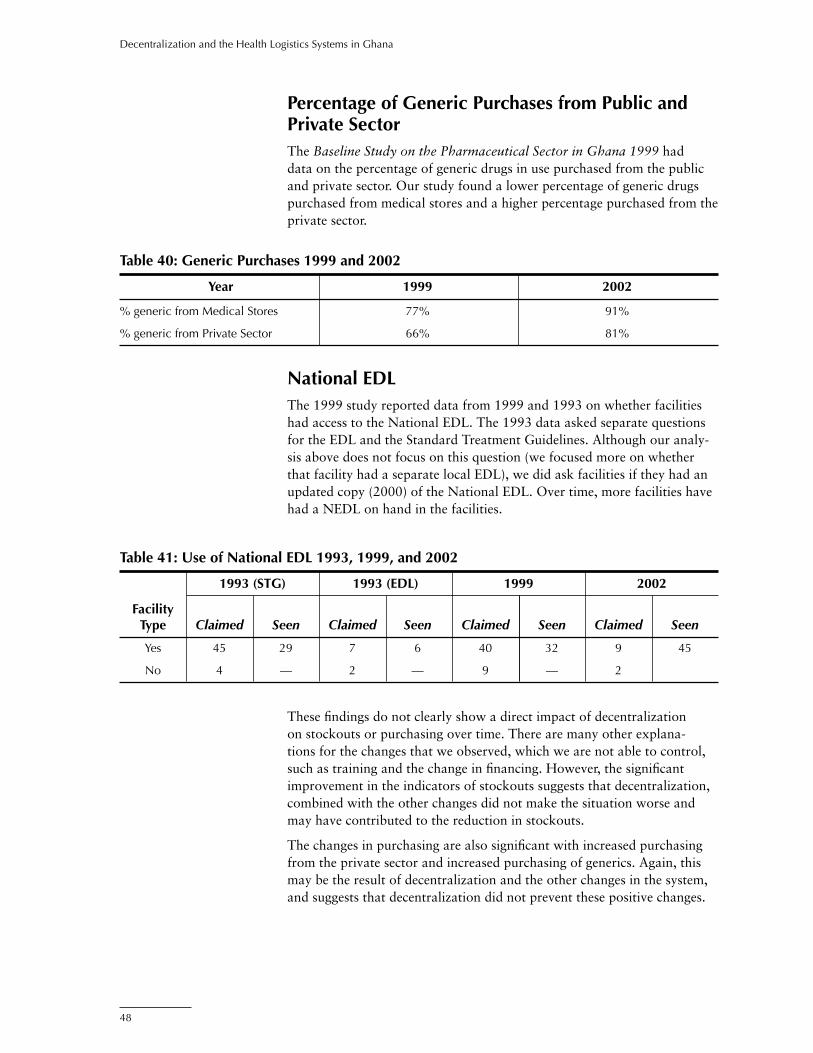
48
Decentralization and the Health Logistics Systems in Ghana
Percentage of Generic Purchases from Public and Private SectorThe Baseline Study on the Pharmaceutical Sector in Ghana 1999 had data on the percentage of generic drugs in use purchased from the public and private sector. Our study found a lower percentage of generic drugs purchased from medical stores and a higher percentage purchased from the private sector.
National EDLThe 1999 study reported data from 1999 and 1993 on whether facilities had access to the National EDL. The 1993 data asked separate questions for the EDL and the Standard Treatment Guidelines. Although our analy-sis above does not focus on this question (we focused more on whether that facility had a separate local EDL), we did ask facilities if they had an updated copy (2000) of the National EDL. Over time, more facilities have had a NEDL on hand in the facilities.
Table 40: Generic Purchases 1999 and 2002
Year 1999 2002
% generic from Medical Stores 77% 91%
% generic from Private Sector 66% 81%
These findings do not clearly show a direct impact of decentralization on stockouts or purchasing over time. There are many other explana-tions for the changes that we observed, which we are not able to control, such as training and the change in financing. However, the significant improvement in the indicators of stockouts suggests that decentralization, combined with the other changes did not make the situation worse and may have contributed to the reduction in stockouts.
The changes in purchasing are also significant with increased purchasing from the private sector and increased purchasing of generics. Again, this may be the result of decentralization and the other changes in the system, and suggests that decentralization did not prevent these positive changes.
Table 41: Use of National EDL 1993, 1999, and 2002
1993 (STG) 1993 (EDL) 1999 2002
Facility Type Claimed Seen Claimed Seen Claimed Seen Claimed Seen
Yes 45 29 7 6 40 32 9 45
No 4 — 2 — 9 — 2

49
This study is the second in a series of studies of decentralization of logistics systems being implemented by DELIVER. The first study of Guatemala was completed in October 2003 and the results offer the possibility of comparison with the current study of Ghana. While the logistics systems in both countries had similar functions and could be analyzed using the decision space framework, each had significantly different country contexts, and each had unique features. Guatemala is a larger country and this contributed to the larger sample and the greater variation in responses to the questionnaires, which gave more power to the relationships we reported there. Guatemala’s organizational culture based on a Latin American bureaucratic culture is likely to be different than Ghana’s heritage of British colonial bureaucracies. General economic conditions are relatively similar, but Guatemala is classified as a lower-middle income country, and Ghana is classified as a low income country, using the World Bank classifications.
Specific to the logistics systems, there were significant differences in two important innovations: the open contract system in Guatemala and the cash-and-carry system in Ghana. We have described Ghana’s cash-and-carry system in this report. Guatemala’s open contract system allowed for local drug purchases from pre-selected suppliers at relatively low, fixed prices. The Ministry of Health had open bidding for the right of suppliers to provide essential drugs to the public health system, and they allowed districts to procure their drugs directly from these suppliers.
Table 42 compares the levels of general decision space for the two coun-tries. The two countries had the same level of decision space for medicine, contraceptives, and vaccines for product selection, needs quantification, human resources/personnel, and organizational support. All the other functions had different degrees of decision space between the two coun-tries. For example, Guatemala had a higher decision space in budgeting for medicines and procurement for medicines. Ghana had a higher decision space in other areas, such as financing for medicines, budgeting for contra-ceptives and vaccines, inventory control, storage, transport for contracep-tives, LMIS, supervision, training, quality control, and client contact and use.
Comparison between Guatemala and Ghana

50
Decentralization and the Health Logistics Systems in Ghana
Table 42: Comparison of General Decision Space for Guatemala and Ghana
Function Guatemala Ghana
Financing Low (centralized) Moderate (m) (m,c&v) Low (c&v)
Cost Recovery No cost recovery Moderate (m&c) Low (v)
Budgeting High (m) Moderate (m,c&v) Low (c&v)
Product Selection Low (m,c&v) Low (m,c&v)
Needs Quantification (Forecasting) High (m) High (m) Low (c&v) Low (c&v)
Procurement High (m) Moderate-High (m) Low (c&v) Low (centralized) (c&v)
Inventory Control Low (m,c&v) Moderate (m,c&v)
Storage Low (centralized) Moderate (m,c&v)
Transportation High (m)Low (c&v) High (m&c)Low (v)
Logistics Management Information Low (m,c&v) Moderate (m,c&v) System (LMIS)
Human Resources/Personnel High (m,c&v) High (m,c&v)
Supervision Medium (m,c&v) High (m,c&v)
Training Low (m,c&v) Moderate (m,c&v)
Organizational Support High (m,c&v) High (m,c&v)
Quality Control Low (centralized) Moderate (m,c&v)
Client Contact and Use Low (m,c&v) Moderate (m,c&v)
Key: “m, c, v” represents medicines, contraceptives, vaccines respectively.
Stockouts in Ghana and GuatemalaFigure 2 shows the level of stockouts of medicines and contraceptives over the last six months and at the time of the visit for Guatemala and Ghana. Ghana has lower stockouts for both medicines and contraceptives, both at the time of the visit and over the last six months.
While it’s possible to suggest that the lessons from Ghana’s process of decentralization are more potent for reducing stockouts, this comparison is not valid. The data does not allow us to compare changes in the systems over time that might contribute to the differences we found for surveys in 2001–2002. The differences in stockouts before decentralization and before the unique open contract and cash-and-carry innovations may have been similar to the differences we found from the surveys.
The surveys show, however, that Ghana’s system is currently more effec-tive in the major indicators for stockouts and that other countries should look carefully at the Ghana system for possible policy lessons for improv-ing stockout rates. It is likely that the cash-and-carry system provides motivation and skills that reduce stockouts. The extent to which moder-ate decision space for financing, cost recovery, and planning/budgeting
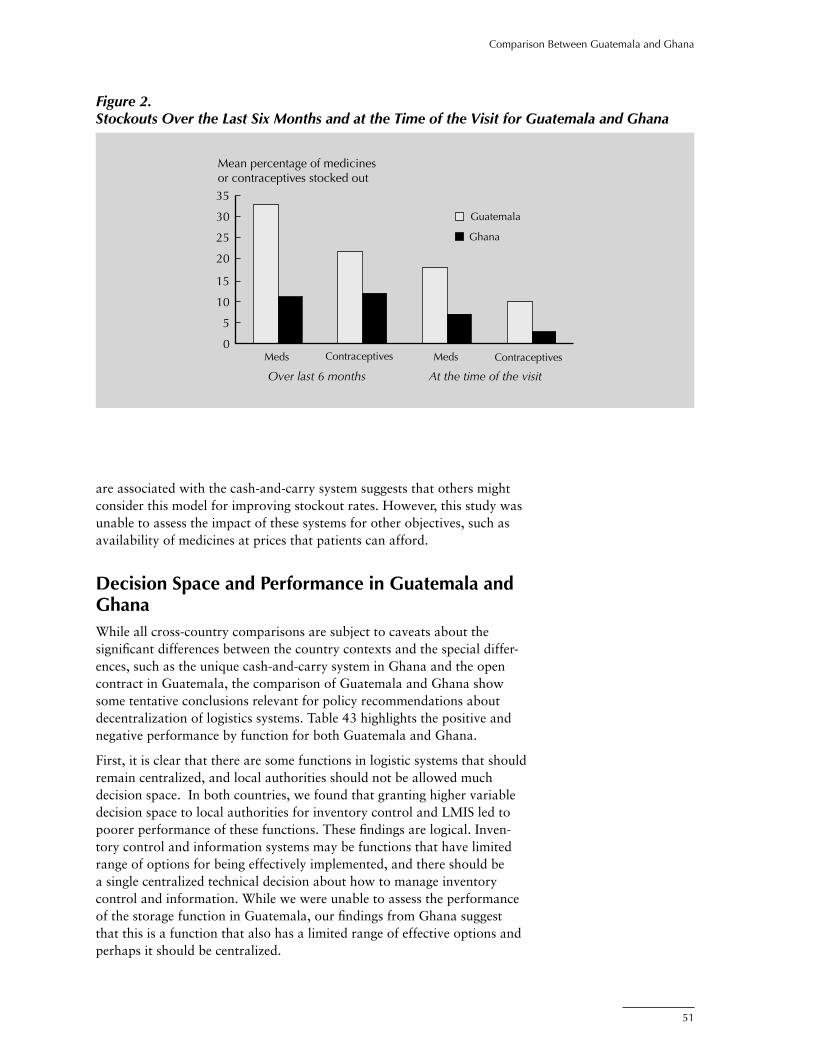
51
Comparison Between Guatemala and Ghana
Mean percentage of medicinesor contraceptives stocked out
0
5
10
15
20
25
30
35
Over last 6 months At the time of the visit
Guatemala
Ghana
Meds MedsContraceptives Contraceptives
Figure 2. Stockouts Over the Last Six Months and at the Time of the Visit for Guatemala and Ghana
are associated with the cash-and-carry system suggests that others might consider this model for improving stockout rates. However, this study was unable to assess the impact of these systems for other objectives, such as availability of medicines at prices that patients can afford.
Decision Space and Performance in Guatemala and GhanaWhile all cross-country comparisons are subject to caveats about the significant differences between the country contexts and the special differ-ences, such as the unique cash-and-carry system in Ghana and the open contract in Guatemala, the comparison of Guatemala and Ghana show some tentative conclusions relevant for policy recommendations about decentralization of logistics systems. Table 43 highlights the positive and negative performance by function for both Guatemala and Ghana.
First, it is clear that there are some functions in logistic systems that should remain centralized, and local authorities should not be allowed much decision space. In both countries, we found that granting higher variable decision space to local authorities for inventory control and LMIS led to poorer performance of these functions. These findings are logical. Inven-tory control and information systems may be functions that have limited range of options for being effectively implemented, and there should be a single centralized technical decision about how to manage inventory control and information. While we were unable to assess the performance of the storage function in Guatemala, our findings from Ghana suggest that this is a function that also has a limited range of effective options and perhaps it should be centralized.

52
Decentralization and the Health Logistics Systems in Ghana
While we were not able to find relationships between decision space for product selection and performance, we did find that both countries had implemented a national essential drug list that significantly limited the decision space for this function. Many other studies on essential drug lists suggest that it is likely that this function also should remain centralized.
We also find consistent evidence for at least one function to be decentral-ized with a moderate range of decision space. In both Guatemala and Ghana, we find evidence that moderate to high decision space for planning and budgeting should be granted to the local levels. Again, there is a logic to this finding that is consistent with the argument that centralized logistics systems do not have sufficient information to plan for the local demand for medicines, vaccines, and contraceptives.
For other functions, we were not able to assess differences because there were no relationships found in one or the other country. It should be noted here, however, that the Guatemala study found evidence that higher decision space was consistent with higher performance for budgeting, procurement, LMIS, and personnel, and some aspects of supervision. It is particularly important to note that in contrast to Ghana, higher decision space was associated with better performance for procurement in Guate-mala and may have been associated with the particular characteristics of the open contract system.
Table 43: Higher Decision Space Association with Performance by Function
Function High Performance Lower Performance
Financing (modifications) Ghana
Cost recovery — —
Budgeting Guatemala*, Ghana
Product selection — —
Needs quantification Guatemala
Procurement Guatemala Ghana
Inventory control Guatemalac Ghana, Guatemalam,v
Storage Ghana
Transportation Guatemalam Guatemalav
LMIS Guatemalav Guatemalam,c, Ghana
HR/personnel Guatemala
Training Ghana
Supervision Guatemala** Guatemala***
Organizational support — —
Quality control — —
Client contact and use Ghana
* DAS and hospitals only** Number of visits by DAS*** Reported quality of supervision visitsm=medicines, c=contraceptives, v=vaccines

53
The Ghana study shows some significant findings for logistic system decen-tralization. The facilities that used more of the moderate decision space for the financing and planning/budgeting function were associated with higher performance for these functions. This finding supports the general logic of the cash-and-carry system. Within the moderate range of choice generally allowed to decentralized authorities for financing and budgeting, the facili-ties that exercised more choice had better performance. The study showed that this emerges from a commercial logic. Those facilities that generated higher cash-stock balances and higher capital were associated with lower stockout rates. However, we also found that those facilities that made more use of their procurement choices were more likely to purchase drugs that are not on the NEDL—an undesirable outcome. This finding suggests that Ghana enforce its NEDL to improve the effectiveness of local procure-ments
The comparison with Guatemala suggests additional tentative policy conclusions. There are some functions that should remain relatively centralized. Inventory control and LMIS functions probably should be limited by central guidelines and these guidelines should be enforced. Stor-age, which has similar limited effective requirements should probably be centralized. The studies also suggest that product selection, using enforced national essential drug lists, should remain centralized.
However, reinforcing the findings for planning and budgeting in Ghana, we found that moderate decision space in Guatemala was also associated with better performance. It is likely that planning and budgeting requires greater flexibility to respond to local information.
These studies show the importance of looking at decentralization in terms of the decision space allowed for different functions. No logistics system is fully centralized or decentralized. What we have found are tentative conclusions about the advisability of granting more local choice over some functions and retaining central control over other functions. This study of Ghana has contributed to that knowledge by suggesting that moder-ate ranges of choice over financing and planning/budgeting are associated with higher performance for those functions. It also shows, along with the findings in Guatemala, that inventory control, LMIS, and storage should remain centralized.
Summary and Conclusion

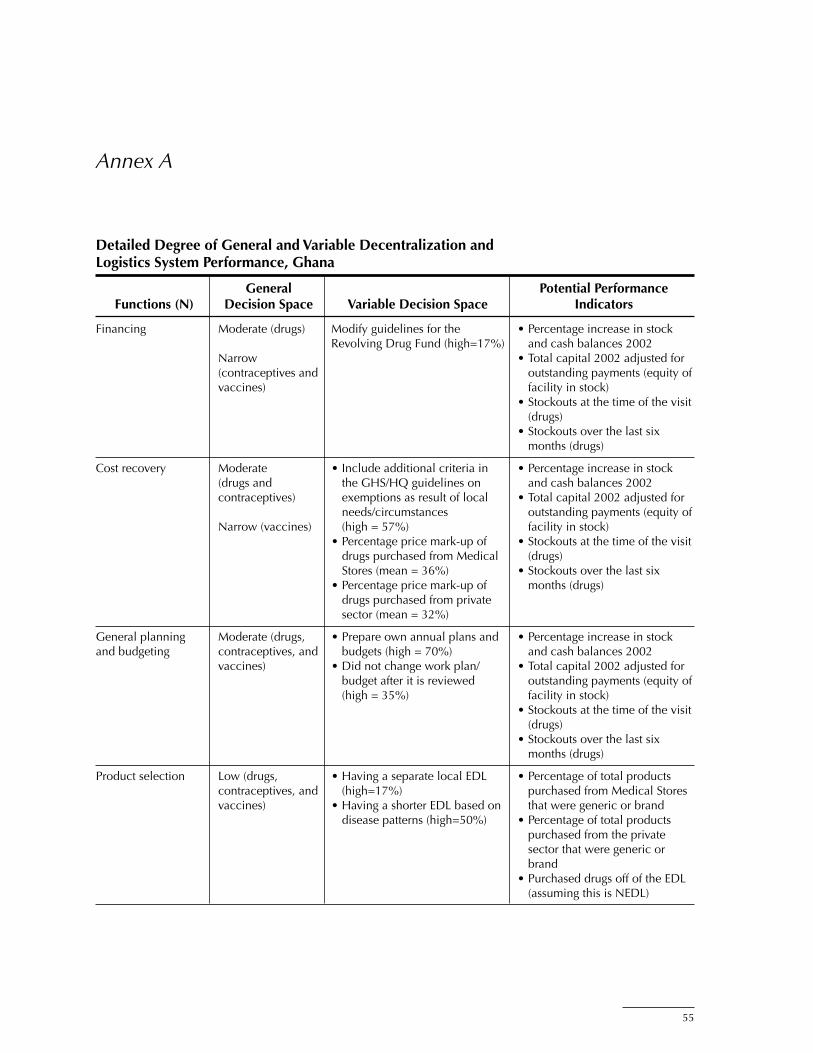
55
Annex A
Detailed Degree of General and Variable Decentralization and Logistics System Performance, Ghana
General Potential Performance Functions (N) Decision Space Variable Decision Space Indicators
Financing Moderate (drugs) Modify guidelines for the • Percentage increase in stock Revolving Drug Fund (high=17%) and cash balances 2002 Narrow • Total capital 2002 adjusted for (contraceptives and outstanding payments (equity of vaccines) facility in stock) • Stockouts at the time of the visit (drugs) • Stockouts over the last six months (drugs)
Cost recovery Moderate • Include additional criteria in • Percentage increase in stock (drugs and the GHS/HQ guidelines on and cash balances 2002 contraceptives) exemptions as result of local • Total capital 2002 adjusted for needs/circumstances outstanding payments (equity of Narrow (vaccines) (high = 57%) facility in stock) • Percentage price mark-up of • Stockouts at the time of the visit drugs purchased from Medical (drugs) Stores (mean = 36%) • Stockouts over the last six • Percentage price mark-up of months (drugs) drugs purchased from private sector (mean = 32%)
General planning Moderate (drugs, • Prepare own annual plans and • Percentage increase in stock and budgeting contraceptives, and budgets (high = 70%) and cash balances 2002 vaccines) • Did not change work plan/ • Total capital 2002 adjusted for budget after it is reviewed outstanding payments (equity of (high = 35%) facility in stock) • Stockouts at the time of the visit (drugs) • Stockouts over the last six months (drugs)
Product selection Low (drugs, • Having a separate local EDL • Percentage of total products contraceptives, and (high=17%) purchased from Medical Stores vaccines) • Having a shorter EDL based on that were generic or brand disease patterns (high=50%) • Percentage of total products purchased from the private sector that were generic or brand • Purchased drugs off of the EDL (assuming this is NEDL)
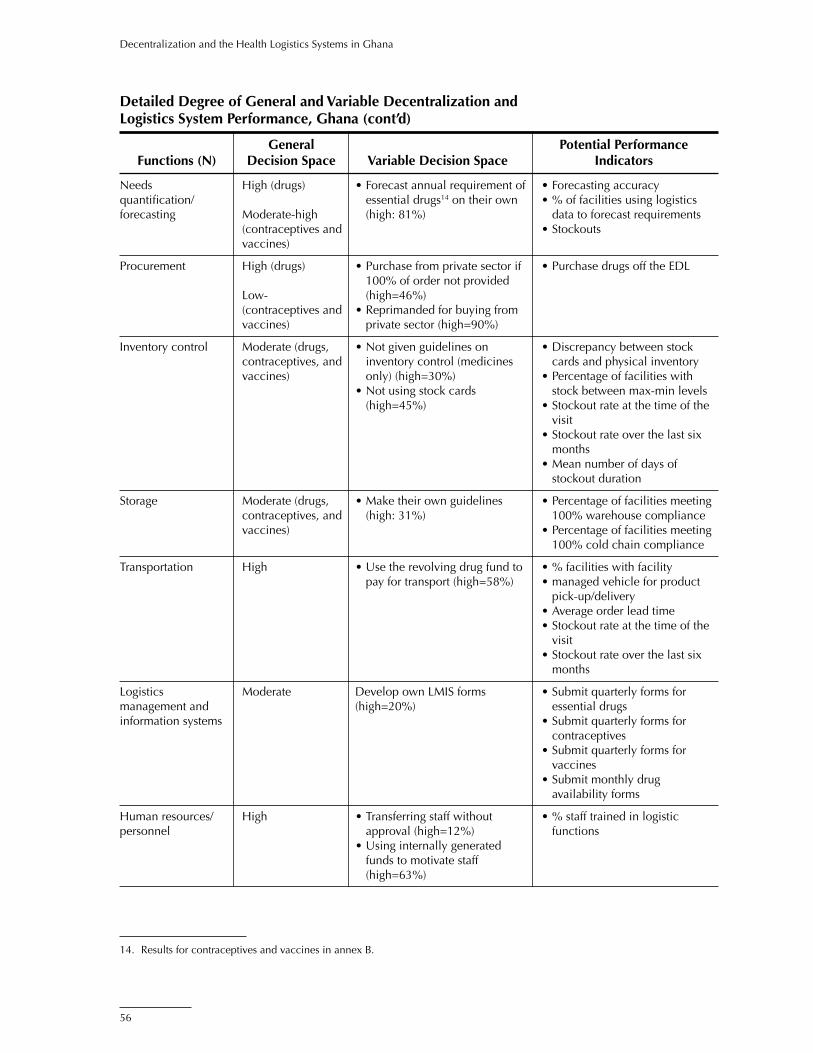
56
Decentralization and the Health Logistics Systems in Ghana
Detailed Degree of General and Variable Decentralization and Logistics System Performance, Ghana (cont’d)
General Potential Performance Functions (N) Decision Space Variable Decision Space Indicators
Needs High (drugs) • Forecast annual requirement of • Forecasting accuracy quantification/ essential drugs14 on their own • % of facilities using logistics forecasting Moderate-high (high: 81%) data to forecast requirements (contraceptives and • Stockouts vaccines)
Procurement High (drugs) • Purchase from private sector if • Purchase drugs off the EDL 100% of order not provided Low- (high=46%) (contraceptives and • Reprimanded for buying from vaccines) private sector (high=90%)
Inventory control Moderate (drugs, • Not given guidelines on • Discrepancy between stock contraceptives, and inventory control (medicines cards and physical inventory vaccines) only) (high=30%) • Percentage of facilities with • Not using stock cards stock between max-min levels (high=45%) • Stockout rate at the time of the visit • Stockout rate over the last six months • Mean number of days of stockout duration
Storage Moderate (drugs, • Make their own guidelines • Percentage of facilities meeting contraceptives, and (high: 31%) 100% warehouse compliance vaccines) • Percentage of facilities meeting 100% cold chain compliance
Transportation High • Use the revolving drug fund to • % facilities with facility pay for transport (high=58%) • managed vehicle for product pick-up/delivery • Average order lead time • Stockout rate at the time of the visit • Stockout rate over the last six months
Logistics Moderate Develop own LMIS forms • Submit quarterly forms for management and (high=20%) essential drugs information systems • Submit quarterly forms for contraceptives • Submit quarterly forms for vaccines • Submit monthly drug availability forms
Human resources/ High • Transferring staff without • % staff trained in logistic personnel approval (high=12%) functions • Using internally generated funds to motivate staff (high=63%)
14. Results for contraceptives and vaccines in annex B.

57
Annex A
Detailed Degree of General and Variable Decentralization and Logistics System Performance, Ghana (cont’d)
General Potential Performance Functions (N) Decision Space Variable Decision Space Indicators
Supervision and Wide • Design their own supervision • Made supervisory visits in the staff development guides (high=31%) last month • Create their own supervision • Received supervisory visit schedules (high=71%) within the last month • Assign staff on their own to • What facilities accomplish supervision (high=81%) during supervisory visit
Training Moderate • Identify training needs • % staff trained in logistic (high=89%) functions • Use own resources (high=31%) • Select their own participants (high=28%)
Organizational High No indicator • % whose management teams support met regularly • % who solved problems during meetings
Product quality Moderate • Percentage of facilities that • Percentage of facilities that had assurance disposed, sent a report, and/or received a damaged good returned (as opposed to doing • Percentage of facilities that had nothing damaged, near expired received an expired good drug, wrong product, or poor • Percentage of facilities that quality product (high=88%) had received the wrong • Percentage of facilities that kept product a product with less than 18 • Percentage of facilities that had months of shelf life in stead of received a product of poor returning it (high=77%) quality • Percentage of facilities that had received a product with less than 18 months of shelf life • Percentage of facilities that had had a good damaged in their facility
Treatment Moderate • Percentage of facilities with • Percentage of facilities that national protocols for drugs received complaints from (high=86%) clients • Percentage of facilities that are able to modify national protocols to suit local conditions (high=51%)

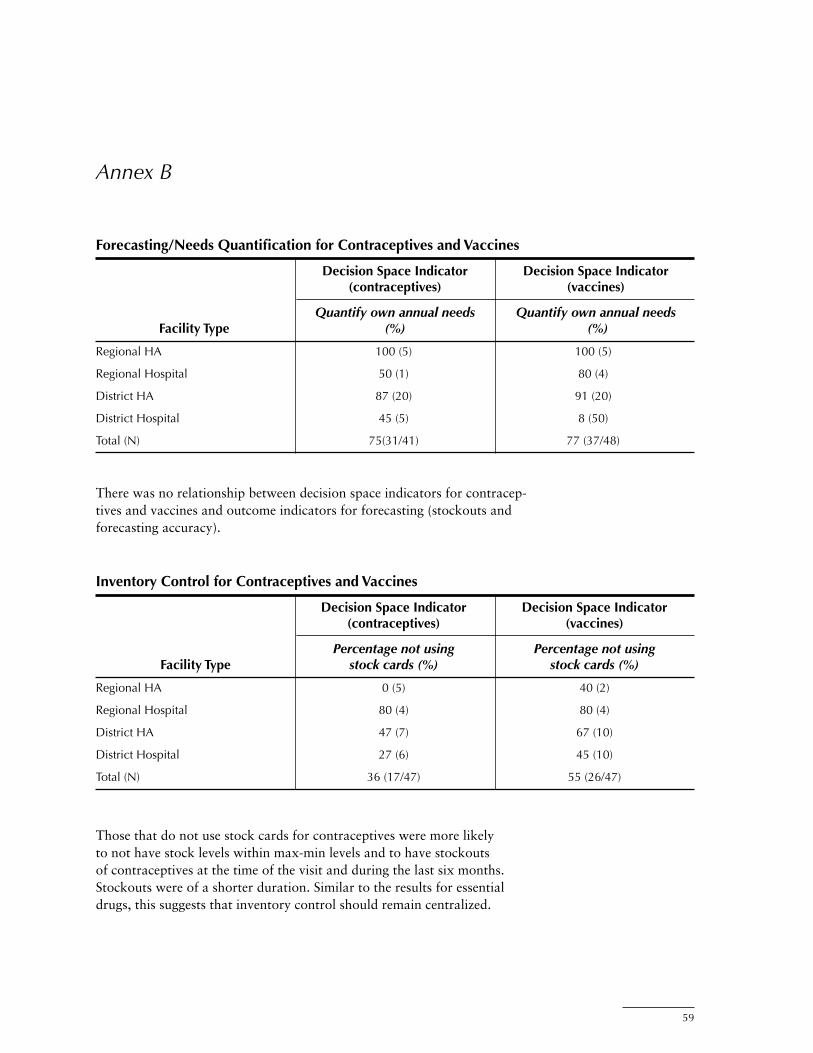
59
Inventory Control for Contraceptives and Vaccines
Decision Space Indicator Decision Space Indicator (contraceptives) (vaccines)
Percentage not using Percentage not using Facility Type stock cards (%) stock cards (%)
Regional HA 0 (5) 40 (2)
Regional Hospital 80 (4) 80 (4)
District HA 47 (7) 67 (10)
District Hospital 27 (6) 45 (10)
Total (N) 36 (17/47) 55 (26/47)
There was no relationship between decision space indicators for contracep-tives and vaccines and outcome indicators for forecasting (stockouts and forecasting accuracy).
Annex B
Forecasting/Needs Quantification for Contraceptives and Vaccines
Decision Space Indicator Decision Space Indicator (contraceptives) (vaccines)
Quantify own annual needs Quantify own annual needs Facility Type (%) (%)
Regional HA 100 (5) 100 (5)
Regional Hospital 50 (1) 80 (4)
District HA 87 (20) 91 (20)
District Hospital 45 (5) 8 (50)
Total (N) 75(31/41) 77 (37/48)
Those that do not use stock cards for contraceptives were more likely to not have stock levels within max-min levels and to have stockouts of contraceptives at the time of the visit and during the last six months. Stockouts were of a shorter duration. Similar to the results for essential drugs, this suggests that inventory control should remain centralized.
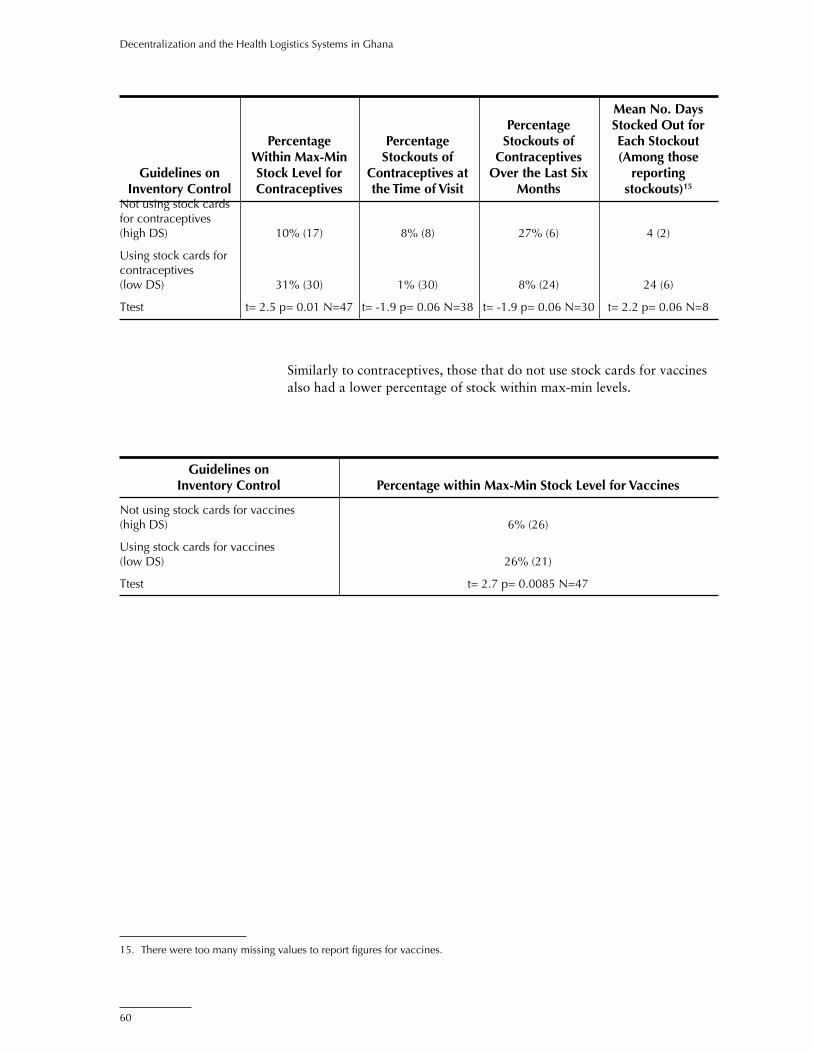
60
Decentralization and the Health Logistics Systems in Ghana
Similarly to contraceptives, those that do not use stock cards for vaccines also had a lower percentage of stock within max-min levels.
Mean No. Days Percentage Stocked Out for Percentage Percentage Stockouts of Each Stockout Within Max-Min Stockouts of Contraceptives (Among those Guidelines on Stock Level for Contraceptives at Over the Last Six reporting Inventory Control Contraceptives the Time of Visit Months stockouts)15
Not using stock cards for contraceptives (high DS) 10% (17) 8% (8) 27% (6) 4 (2)
Using stock cards for contraceptives (low DS) 31% (30) 1% (30) 8% (24) 24 (6)
Ttest t= 2.5 p= 0.01 N=47 t= -1.9 p= 0.06 N=38 t= -1.9 p= 0.06 N=30 t= 2.2 p= 0.06 N=8
Guidelines on Inventory Control Percentage within Max-Min Stock Level for Vaccines
Not using stock cards for vaccines (high DS) 6% (26)
Using stock cards for vaccines (low DS) 26% (21)
Ttest t= 2.7 p= 0.0085 N=47
15. There were too many missing values to report figures for vaccines.

61
Bossert, Thomas. 1998. “Analysing the decentralisation of health systems in developing countries: decision space, innovation and performance.” Social Science Medicine 47:1513–27.
Bossert, Thomas, Diana Bowser, Johnnie Amenyah, Dana Aronovich, Jim Bates, and Kay Quam. March 2002. Impact of Decentralization and Integration on the Performance of Health Logistics Systems: Concept Paper and Applied Research Protocol. Boston: Harvard School of Public Health. Arlington, Va.: JSI/DELIVER, for USAID.
Bossert, Thomas. October 2002. Trip Report for DELIVER Ghana Decentralization Project. Arlington, Va.: JSI/DELIVER.
Bossert, Thomas, Diana Bowser, Johnnie Amenyah, Rebecca Copeland, and GETSA. November 2003. Decentralization and Integration in the Health Logistic System in Guatemala Final Report. Boston: Harvard School of Public Health. Arlington, Va.: JSI/DELIVER, for USAID.
Sarley, David, Hany Abdallah, Raja Rao, Peter Gyimah, Joycelyn Azeez, and Bertha Garshong. 2002. Ghana Pharmaceutical Pricing Study Policy Analysis and Recommendations. Arlington, Va.: JSI/DELIVER, for USAID.
Ministry of Health (MOH), Ghana National Drug Programme. 1999. Baseline Study on the Pharmaceutical Sector in Ghana: Rational Use, procurement and financing of drugs. Accra: MOH/Ghana.
Rankin, James, Keith Johnson, Jean-Pierre Sallet, Dr. David Lee, Dr. David Ofori-Adjei. August 1993. Ghana Pharmaceutical Sector Assessment: Final Report. Accra: Ministry of Health of Ghana, Rational Pharmaceutical Management Project.
References