GFNORTE 1Q14 Results...Earnings per Share 1.35 1.31 11% 16% (11%) (3%) Million Pesos Million Pesos...
24
GFNORTE 1Q14 Results Conference Call April 25 th , 2014.
Transcript of GFNORTE 1Q14 Results...Earnings per Share 1.35 1.31 11% 16% (11%) (3%) Million Pesos Million Pesos...

GFNORTE
1Q14 Results
Conference Call April 25th, 2014.

2
GFNorte reached an agreement with Corporación GEO to restructure its liabilities.
On March 20, 2014 Corporación GEO announced it had reached a general agreement
with a group of 6 banks, including GFNorte, in order to restructure its liabilities. As a
result of this agreement, GEO filed for “bankruptcy with previous restructuring” in
order to achieve a financial restructuring to enable the company to continue
operating. As part of the agreements among GEO and the creditor banks, the
funding lines available to the company may be reactivated if it complies with the
terms and conditions of the restructuring agreement.
In this regard, as of March 31, 2014 the GFNorte's loan exposure to the three
troubled home developers (Urbi Desarrollos Urbanos, Corporación Geo and
Desarrolladora Homex) amounted to Ps 6.88 billion, 21.0% below the previous
quarter mainly due to the settlement of a past due loan. The three companies
represent 1.6% of our total loan portfolio compared to the 2.0% these represented in
December 2013. Of these loans, Ps 5.73 billion are past due, decreasing by Ps. 1.27
billion in 1Q14.
Material Events

3
Prepayment of of Subordinated Obligations.
As part of the use of proceeds from the Public Offering carried out in July 2013, on
April 21, Banorte settled the Preferred and Non-Convertible Subordinated
Obligations for an amount of Ps. 2.2 billion. These 10 year term obligations were
issued in March, 2009, maturing in March, 2019, and paid TIIE + 2.0%. The
prepayment of these obligations, will reduce Banorte´s servicing cost as well as
improve the equity profile of the Institution, as these instruments have lost
effectiveness to compute as regulatory capital, and were replaced by better quality
capital.
Material Events

4
Material Events
Fitch upgraded GFNorte's, Banorte's and other subsidiaries' international and
national long-term ratings with Stable outlook.
On March 21, 2014 Fitch Ratings upgraded GFNorte’s and other subsidiaries'
international and national long-term ratings from BBB to BBB +, maintaining their
stable outlook.
The upgrade in GFNorte’s ratings considered its consolidating franchises, the
improved business profile after recent acquisitions and the extinction of double
leverage after the public offering. As Banorte, the upgrade was driven by the
material improvement in the bank's capital structure, strengthening business,
growing competitive position, adequate financial performance and revenue
diversification.
Ratings for Arrendadora y Factor Banorte, Almacenadora Banorte and Casa de
Bolsa Banorte Ixe were improved given their core role in GFNorte’s strategy and
business profile.
5
Material Events
"Del Sol” and “Woolworth” became part of our third party correspondents.
After obtaining the CNBV authorization, in March “Del Sol” and “Woolworth”
started to receive Banorte and Ixe credit card payments under the third party
correspondent scheme. Banorte and Ixe clients and accountholders will be able
to pay in real time their credit cards 365 days of the year in more than 70 stores
located in 18 different states of the country.
Recognitions.
In February, Operadora de Fondos Banorte Ixe was awarded as the Best
Aggressive-Mixed Fund in Mexico 2014 by Morningstar.

6
Material Events
Organizational Changes.
Luis Fernando Orozco Mancera has been appointed as Chief Credit Officer
reporting directly to the CEO. He will be responsible for credit planning,
evaluation, management and follow-up.
Juan Jesus Viteri Alvarez was appointed as Managing Director of Internal
Communication, in charge of aligning and integrating the communication efforts
among the different areas in the organization. This position reports directly to the
Chief Operating Officer, Rafael Arana de la Garza.

Yearly Recap GFNorte
7
12.2%
2.72
4.0%
3,140
98.68
1.3%
15.1%
36.28
2.1%
53.8%
5.7%
1Q13 1Q14
2.19
4.1%
3,628
87.83
1.4%
13.3%
40.14
3.0%
48.5%
Performing Loan Growth
P/BV
Net Interest Margin
Net Income
Stock price (pesos)
ROA
ROE
Book Value per Share
Past Due Loan Ratio
Efficiency
1.35 1.31 Earnings per Share
11%
16%
(11%)
(3%)
Million Pesos

Million Pesos
Income Statement
8
QoQ YoY Change
4Q13 1Q14
Net Interest Income 9,532 (1%) 11%
Non Interest Income 4,590 21% (12%)
Service Fees 1,941 2% 14%
Recoveries 40 (72%) (83%)
FX & Trading 1,936 38% (9%)
Other Income (expenses) 673 85% (40%)
Total Income 14,122 5% 2%
Non Interest Expense (6,845) (3%) (8%)
Net Operating Income 7,277 15% 14%
Provisions (2,380) 30% 15%
Income Tax (1,500) 40% 22%
Subs & Minority Interest 230 15% 231%
Net Income 3,628 0% 16%
1Q13
8,613
5,194
1,708
238
2,132
1,116
13,807
(7,434)
6,373
(2,073)
(1,230)
70
3,140
9,604
3,809
1,895
145
1,405
364
13,413
(7,084)
6,329
(1,833)
(1,075)
201
3,622

Non Interest Expense
9
Efficiency Ratio
Billion Pesos
Total Expense 6.8 24%
1Q13 1Q14
7.4 (8%)
1Q13
53%
4Q13
54%
1Q14
48%
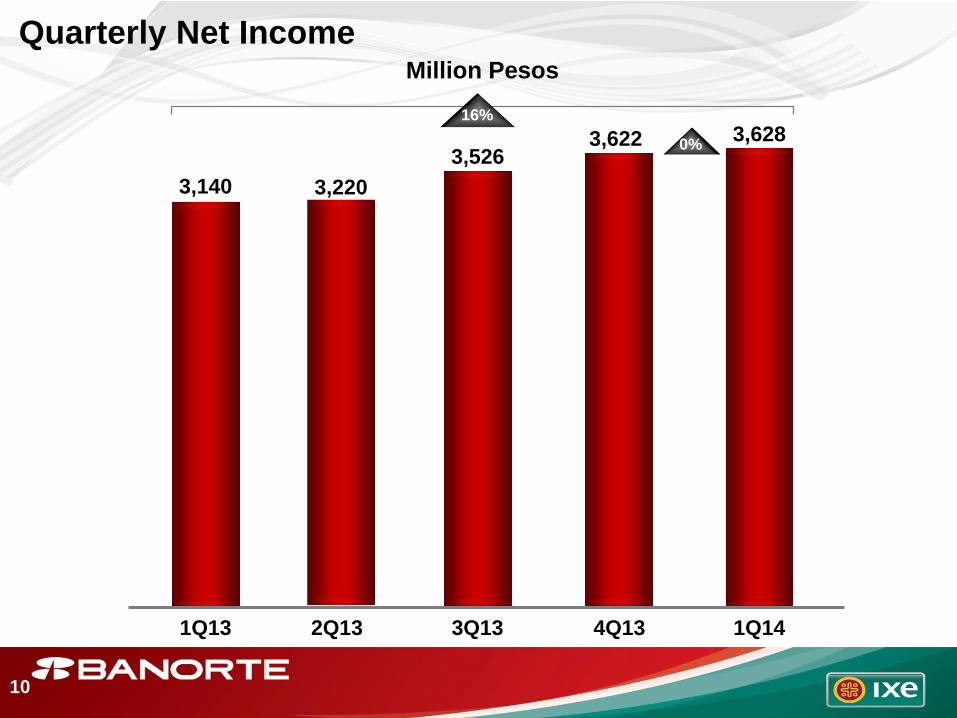
Quarterly Net Income
10
27%
4Q13 1Q13 3Q13 2Q13
3,628 0%
1Q14
16%
3,140 3,220
3,526 3,622
Million Pesos

11
ROTE and Return on Risk Weighted Assets
1Q13 4Q13 1Q14
Reported ROE 15.1% 12.9% 13.3%
Goodwill & Intangibles $20,380 $22,366 $21,893
Average Tangible Equity $59,886 $76,851 $83,209
ROTE 19.3% 17.6% 16.8%
Reported ROA 1.3% 1.5% 1.4%
Average Risk Weighted Assets $392,775 $444,462 $461,027
RRWA 2.9% 3.0% 3.0%
Return on Tangible Common Equity (ROTE) & Return on Risk Weighted Assets (RRWA)

Billion Pesos
Assets under Management
12
27%
Banking Sector
Afore XXI Banorte
Insurance and Annuities
507
593
110 63
556
1,829
1Q14 2012 1Q13 4Q13
547
122
75
554
1,869
499
569
99 60
245
1,471
569
536
112
71
542
1,829
572
Mutual Funds
Broker Dealer

Billion Pesos
Deposits
13
Mix
Demand
Time
Deposits 1Q14
Core Deposits
Demand
Time
1Q12 1Q13
186
116
302
61%
39%
100%
10%
9%
10% 205
126
331
62%
38%
100%
16%
4%
24% 254
132
386
66%
34%
100%

Billion Pesos
Performing Loan Portfolio
14
4Q13 1Q14
404
1Q13
427 425
QoQ
Change
YoY
Total 1%
1Q13
Commercial (1%)
Corporate (3%)
Government 3%
Consumer 2%
1Q14
425
114
76
96
6%
6%
(15%)
10%
17%
4Q13
140 143
427
112
73
99
122
404
106
86
90

Billion Pesos
Performing Consumer Loan Portfolio
15
QoQ
Change
YoY
Consumer 2%
1Q13
Car 1%
Credit Cards 0%
Pay Roll 8%
Mortgage 1%
1Q14
140
11
20
26
17%
9%
14%
42%
12%
4Q13
82 83
143
12
20
28
74
122
11
18
20
4Q13 1Q14
122
1Q13
143 140
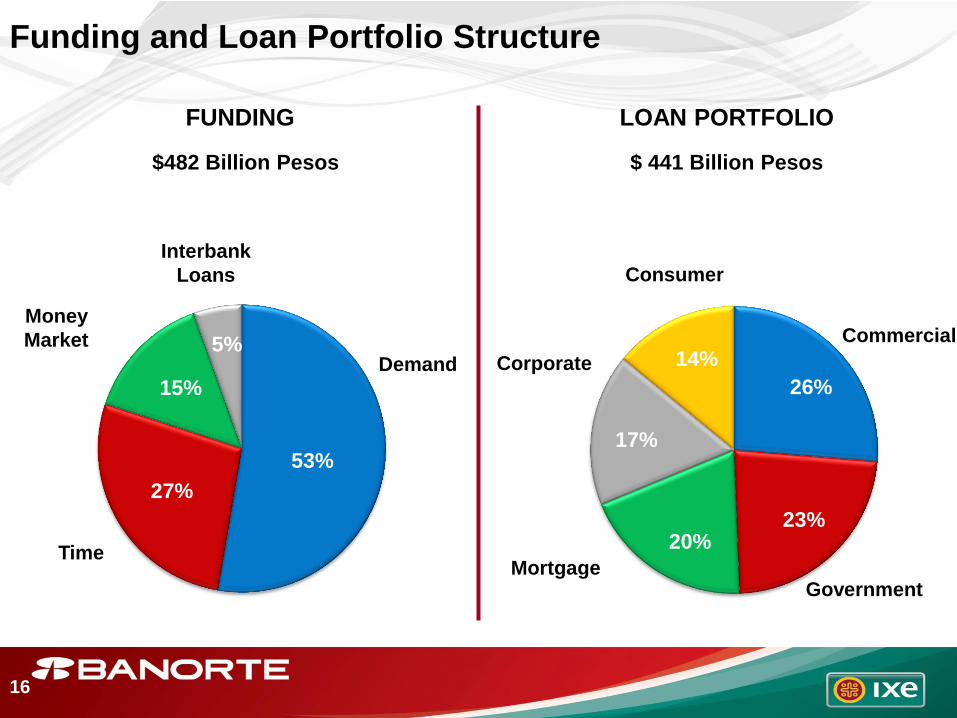
Funding and Loan Portfolio Structure
FUNDING LOAN PORTFOLIO
$482 Billion Pesos $ 441 Billion Pesos
Commercial
Consumer
Mortgage Government
Corporate Vista
Interbank
Loans
16
Demand
Time
Money
Market
53%
27%
15%
5%
26%
23% 20%
17%
14%

17
Asset Quality
PAST DUE LOAN
RATIO
COVERAGE RATIO
1Q14 1Q13 4Q13
3.0%
2.1%
3.1%
1Q14 1Q13 4Q13
106%
137%
105%

Past Due Loan Ratios
18
Credit Cards
Payrol
Car Loans
Mortgage
Commercial
Corporate
Government
Total NPL Ratio
1Q13 2Q13 4Q13 3Q13
6.2%
2.0%
1.3%
1.3%
3.6%
7.3%
0.0%
3.0%
1Q14
5.9%
2.3%
1.6%
1.3%
2.9%
8.6%
0.0%
3.1%
6.0%
2.3%
1.6%
1.3%
3.9%
7.5%
0.0%
3.2%
5.7%
2.2%
1.1%
1.1%
4.3%
1.6%
0.0%
2.1%
6.0%
2.4%
1.4%
1.2%
3.5%
2.6%
0.1%
2.2%

Capitalization and Liquidity
*RWA= Risk Weighted Assets
19
Total Tier 1: 13.1%
Banorte
(%)
RWA*
Liquidity Ratio
+9%
135%
+19%
137%
+18%
148%
+17%
137%
Basel III
4Q13
15.1%
11.5%
1Q13 2Q13 3Q13
11.8%
15.7%
11.8%
14.8%
11.0%
14.9%
11.1%
1Q14
148%
+16%
12.0%
15.2%

Branches ATM’s POS’s
Distribution Network
20
21% xxx
1Q13 1Q14 1Q13
6%
1Q14 1Q13 1Q14
(2%)
Ixe
1,320
6,696
146,320
117,632
28,688
Ixe 1,292
171
1,121
x%
Ixe 7,083
6,884
120,464
199

21
Subsidiaries March 2014
Million Pesos
Company Net Income
1Q14
Change vs.
1Q13
Banco Mercantil del Norte 1) 2,109 3%
Banorte – Ixe Tarjetas 376 43%
Leasing and Factoring 2)
171 30%
Warehousing 9 (32%)
Retirement Savings 282 (16%)
Insurance 478 232%
Annuities 55 123%
203 (17%)
1) Includes Ixe Banco and Fincasa due to its merger in May 2013.
2) Includes Ixe Automotriz due to its merger in May 2013. 3) Without Goodwill: 29.2%.
ROE
Long Term Savings
Banking Sector
Other Finance Companies
20.8%
13.2%
9.4% 3)
47.0%
17.3%
30.4% Broker Dealer
2,485 4% 14.0%

Net Income in Million Pesos
AUM
BILLION PESOS
Recovery Bank
22
Total
1Q14
151
1Q13
348 (57%)
Change
YoY
Proprietary Assets
Acquired Assets (1%)
34%
Total 6%
Managed Assets “Su Casita” (2%)
Ixe Assets N.A.
1Q13 1Q14
27.1
51.4
85.8
7.2
7.2 0
27.5
38.5
80.5
7.3

23
Million Dollars Inter National Bank
* Before Provisions
Pre-Tax Net Income*
22%
1Q13 1Q14
Provisions
Net Income
NIM
ROE
ROA
Efficiency
Total Deposits
Performing Loans
PDL Ratio USGAAP
Coverage Ratio USGAAP
2%
6.6
0.4
4.3
3.3%
4.1%
0.9%
61.8%
1,463
846
0.7%
254.5%
Classified Assets to Capital 12%
12.8% Leverage Ratio
(14%)
5.0
(0.1)
3.5
2.6%
3.3%
0.7%
72.3%
1,699
696
0.8%
258.3%
21%
10.4%

24