
Getting Students to Graduate: The National Context Thomas Bailey National Center for Postsecondary...
19
Getting Students to Graduate: The National Context Thomas Bailey National Center for Postsecondary Research Community College Research Center Teachers College, Columbia University Presented at Higher Education in Michigan: Looking Back and Looking Ahead Ann Arbor, Michigan December 10, 2009
-
date post
21-Dec-2015 -
Category
Documents
-
view
216 -
download
3
Transcript of Getting Students to Graduate: The National Context Thomas Bailey National Center for Postsecondary...

Getting Students to Graduate:The National Context
Thomas BaileyNational Center for Postsecondary Research
Community College Research CenterTeachers College, Columbia University
Presented at
Higher Education in Michigan: Looking Back and Looking Ahead
Ann Arbor, MichiganDecember 10, 2009

What is the Problem?
• International comparisons
• Skill needs of the contemporary economy Some college is necessary for access to
decent jobs Employer needs
• Continued inequality in higher ed access and completion for low income and minority students

Solution—Increase in Degrees and Certificates
• Obama Administration An additional 5 million CC awards by 2010
• Gates Foundation Double the percentage of low-income young people
who earn a post-secondary credential by age 26 (from 30 percent to 60 percent)
• Lumina Foundation Increase share of population with high quality
credentials from 40 to 60 percent by 2050
• Cherry Commission Double the number of graduates with degrees
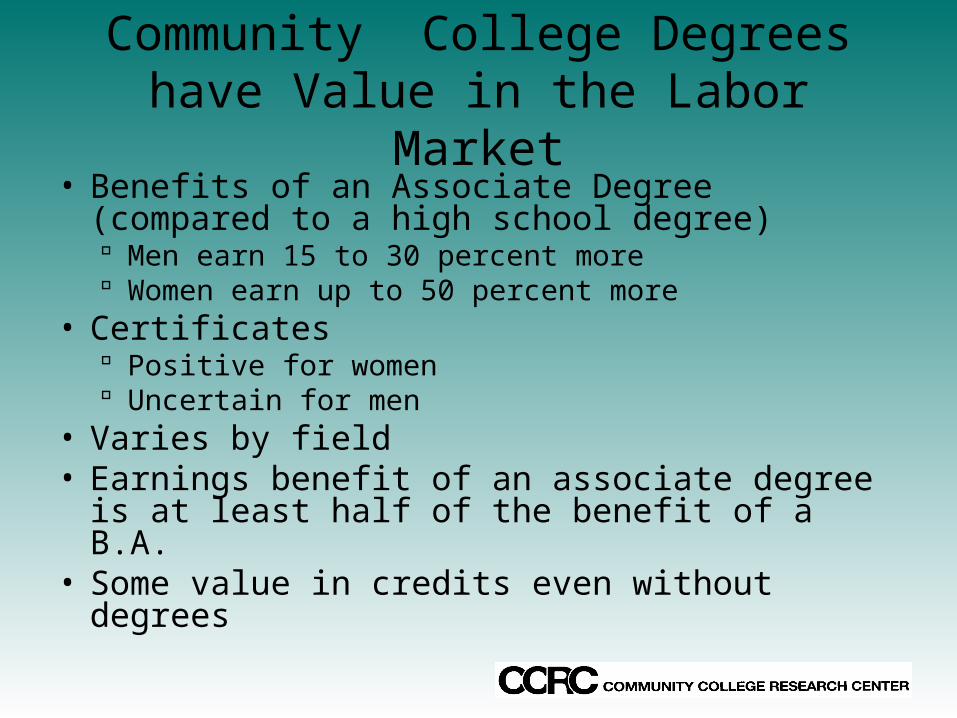
Community College Degrees have Value in the Labor Market
• Benefits of an Associate Degree (compared to a high school degree) Men earn 15 to 30 percent more Women earn up to 50 percent more
• Certificates Positive for women Uncertain for men
• Varies by field• Earnings benefit of an associate degree is at
least half of the benefit of a B.A.• Some value in credits even without degrees
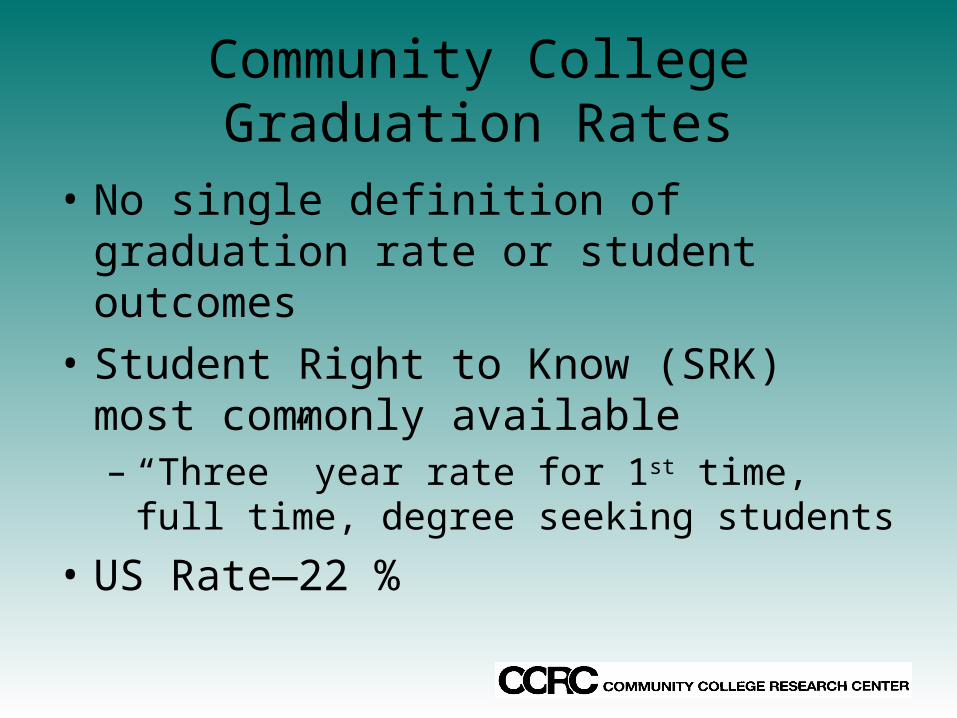
Community College Graduation Rates
• No single definition of graduation rate or student outcomes
• Student Right to Know (SRK) most commonly available– “Three” year rate for 1st time, full time, degree
seeking students
• US Rate—22 %

Michigan SRK Grad Rates
• State graduation rate—15.3% (2004)
• 2,700 out of almost 18,000 graduate
• Lowest—Bay Mills—5.7%
• Highest—Alpena—33.7%

Criticisms of SRK
• Only full time, first time students
• The time period is too short
• Institutional graduation rates count transfers (without graduation) as “non-completers”

Accuracy of the SRK Graduation Rate (National Data)
Institutional Rate
Individual Rate
Three year 22.9 % 25.5%
Six year 28.3% 45.7%
Source: BPS 96/2001

“CC First” PSE Students Total Credits Earned in All PSE Within Eight Years
(NELS)
02468
10121416182022
<10 10-<20
20-<30
30-<40
40-<50
50-<60
60-<70
70-<80
80-<90
90-<100
100-<110
110-<120
120-<130
130-<140
140-<150
150+

“CC First” PSE StudentsPercent Distribution by Highest Outcome in All PSE
Within Eight Years (NELS)Certificate
6%
Associate15%
Bachelors18%
<10 Credits (no deg/cert)17%
10+ Credits (no deg/cert/xfer)
33%
Transfer (no deg/cert)11%

“CC First” PSE Students in Lowest SES QuartilePercent Distribution by Highest Outcome in All PSE
Within Eight Years (NELS)
Certificate8%
Associate16%
Bachelors8%
Transfer (no deg/cert)5%
10+ Credits (no deg/cert/xfer)
47%
<10 Credits (no deg/cert)16%

“CC First” PSE Students in Various GroupsPercent Distribution by Highest Outcome in All PSE
Within Eight Years (NELS)
0
20
40
60
80
All LowIncome
Hispanic Black
Pre
cen
tag
e No Degree or Transfer
Transfer
Degree or Certif icate

Educational Access and SESExperience by 2000 for HS Class of 1992
0%
10%
20%
30%
40%
50%
60%
1 2 3 4
SES Quartile
Per
cen
tag
e No college
Two-year college
Four-year college

“CC First” PSE StudentsPercent Distribution by Highest Outcome in All
PSE Within Six Years (BPS96)Certificate
10%
Associate 16%
Bachelors 10%
No Longer Enrl (No Deg/Xfer)
43%
Transfer (No Deg) No Longer Enrl
4%
Still Enrl (No Deg/Xfer) 8%
Transfer (No Deg) Still Enrl 9%
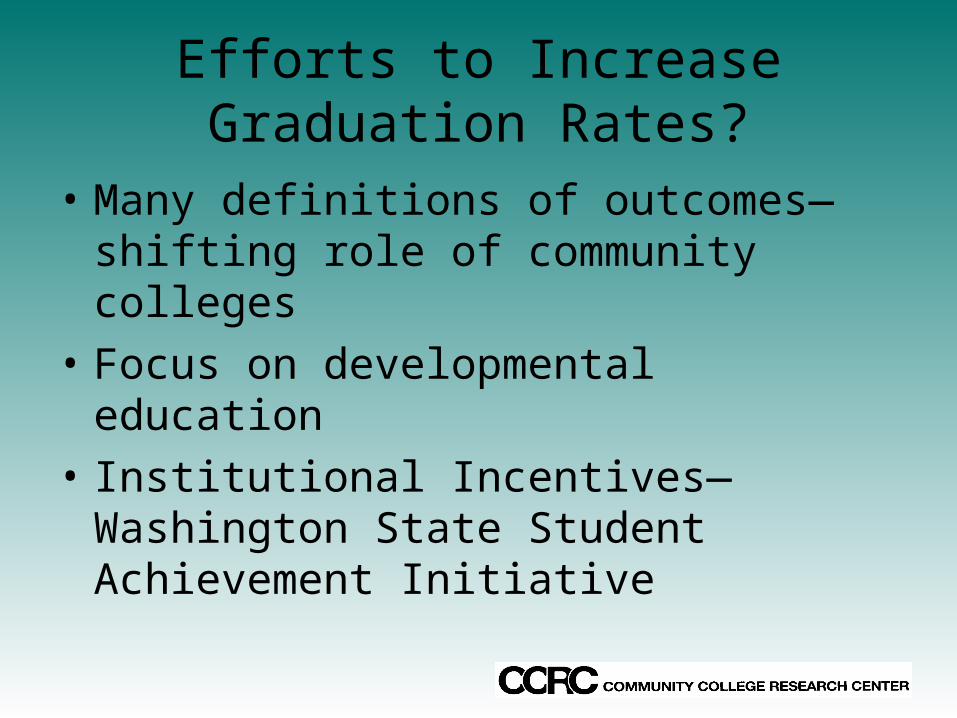
Efforts to Increase Graduation Rates?
• Many definitions of outcomes—shifting role of community colleges
• Focus on developmental education
• Institutional Incentives—Washington State Student Achievement Initiative

What is “Graduation?”
• Transfer programs growing faster than terminal programs
• Fast growth of certificates, non-credit, and certifications
• Many intermediate measures of performance consistent with varied goals of CC students

Many Alternative Outcome Measures
Source: Pete Ewell, NCHEMS, 2006.
“Milestone Events” in a Student Enrollment Pathway
GED ABEESL
First College Credit
X Credits –1 Term
College-Level[“College Path”]
Y Credits – 1 Year College-Level
[“Transfer Ready”][“Workforce Ready”]
Certificate Associate Degree
Employment[Field Earnings]
BA Degree
Basic Skills Conversion Rate
SRK Completion Rate
“Workforce Ready” Employment Rate
Skills-Deficient Completion Rate
Start Developmental
WorkReadingWritingMath
Complete Developmental
WorkReadingWritingMath
“College Path” Completion RateDevelopmental
Completion Rate

Washington State Research Partnership
• Study of ABE to college transition based on state longitudinal data base– Transition is rare– No detectable earnings benefit with less than 30
credits
• Introduction of IBEST—ABE to college initiative• Development of the Student Achievement
Initiative rewarding colleges for intermediate points
For more information:Please visit us on the web at
http://ccrc.tc.columbia.edu,where you can download presentations, reports,
CCRC Briefs, and sign-up for news announcements.
Community College Research CenterInstitute on Education and the Economy, Teachers College, Columbia University
525 West 120th Street, Box 174, New York, NY 10027 E-mail: [email protected]: 212.678.3091
CCRC funders include: Alfred P. Sloan Foundation, Lumina Foundation for Education, The Ford Foundation, National Science Foundation (NSF), Bill & Melinda Gates Foundationand Institute of Education Sciences of the U.S. Department of Education


![Response: Postsecondary Institution Ratings System [Docket ID ED–2013–IES–0151] Prepared by Tom Benghauser for The National Center for Education Statistics,](https://static.fdocuments.net/doc/165x107/5517142c55034603568b558c/response-postsecondary-institution-ratings-system-docket-id-ed2013ies0151-prepared-by-tom-benghauser-for-the-national-center-for-education-statistics.jpg)


