Getting Started With PROC LOGISTICrtsug.org/pdf/logistic.pdf• What’s new in SAS 9 Getting...
36
SAS is a registered trademark of SAS Institute, Inc. in the USA and other countries. ® indicates USA registration. This document copyright © 2004 by Sierra Information Services, Inc. All rights reserved, and may not be duplicated without the express written consent of the copyright holder. Getting Started With PROC LOGISTIC Andrew H. Karp Sierra Information Services, Inc. 19229 Sonoma Hwy. PMB 264 Sonoma, California 95476 707 996 7380 [email protected] www.SierraInformation.com Getting Started with PROC LOGISTIC • A tutorial presenting the core features of PROC LOGISTIC – not an exhaustive treatment of all aspects of the procedure, or of all topics related to models with categorical dependent variables – designed to help new users of the procedure
-
Upload
phungxuyen -
Category
Documents
-
view
241 -
download
1
Transcript of Getting Started With PROC LOGISTICrtsug.org/pdf/logistic.pdf• What’s new in SAS 9 Getting...

SAS is a registered trademark of SAS Institute, Inc. in the USA and other countries. ® indicates USA registration. This document copyright © 2004 by Sierra Information Services, Inc. All rights reserved, and may not be duplicated without the express written consent of the copyright holder.
Getting Started With PROC LOGISTIC
Andrew H. KarpSierra Information Services, Inc.19229 Sonoma Hwy. PMB 264 Sonoma, California 95476707 996 [email protected]
www.SierraInformation.com
Getting Started with PROC LOGISTIC
• A tutorial presenting the core features of PROC LOGISTIC
– not an exhaustive treatment of all aspects of the procedure, or of all topics related to models with categorical dependent variables
– designed to help new users of the procedure

SAS is a registered trademark of SAS Institute, Inc. in the USA and other countries. ® indicates USA registration. This document copyright © 2004 by Sierra Information Services, Inc. All rights reserved, and may not be duplicated without the express written consent of the copyright holder.
Getting Started With PROC LOGISTIC
• This tutorial gives an introduction to implementing several common forms of logistic regression model using PROC LOGISTIC. You will learn:– how to prepare your data for analysis by PROC
LOGISTIC– how to implement several forms of logistic regression
models using PROC LOGISTIC– Enhancements to PROC LOGISTIC in Version 8 of the
SAS System• What’s new in SAS 9
Getting Started with PROC LOGISTIC
• When do we use Logistic Regression ?• Logistic Regression is commonly used to predict
the probability that a unit under analysis will “acquire the event of interest” as a function of changes in values of one or more– continuous-level variables
– dichotomous (binary variables)or a combination of both continuous and binary independent
variables
• In many studies the “event” is a considered a dichotomous “outcome”

SAS is a registered trademark of SAS Institute, Inc. in the USA and other countries. ® indicates USA registration. This document copyright © 2004 by Sierra Information Services, Inc. All rights reserved, and may not be duplicated without the express written consent of the copyright holder.
Getting Started with PROC LOGISTIC
• “Binary outcomes” are of interest in many different fields of study:– Marketing: will the customer re-purchase the
product?– Medicine: will the patient live or die?– Sociology: will the professor receive or be denied
tenure?– Criminology: will the released convict commit
another crime?– Economics: will a woman return to the workplace
after giving birth?
Getting Started with PROC LOGISTIC:Coding the Dependent Variable
• In logistic regression, the dependent variable is dichotomous and is usuallycoded either:
– zero (event did not occur)– one (event did occur)
• The logistic function is used to estimate, as a function of unit changes in the independent variable(s) the probability that the event of interest will occur

SAS is a registered trademark of SAS Institute, Inc. in the USA and other countries. ® indicates USA registration. This document copyright © 2004 by Sierra Information Services, Inc. All rights reserved, and may not be duplicated without the express written consent of the copyright holder.
The Logistic Function
• The logistic function is:
and gives the probability of the event of interest (usually coded 1) of occurring.
nn22110
nn22110
X.....X+X
X.....X+X
1)1( ββββ
ββββ
+
+
+==
eeyp
Implementing a Logistic Regression Model
Using the SAS System for Logistic Regression
Logistic Regression Model
Plot of PROBPASS*SAT. Symbol used is '*'.
1 ˆ * * * * * * * * * * * * * * * * * * * *‚ * *‚ *‚‚ *‚
0.8 ˆ‚ *‚
PROBPASS ‚‚ *‚
0.6 ˆ‚‚ *‚‚‚
0.4 ˆ‚ *‚‚‚ *‚
0.2 ˆ‚ *‚‚ *‚ *‚ * *
0 ˆ * * * * * * * * * * * * * * * * * * * * * * * * * * *Šƒˆƒƒƒƒƒƒƒƒƒˆƒƒƒƒƒƒƒƒƒˆƒƒƒƒƒƒƒƒƒˆƒƒƒƒƒƒƒƒƒˆƒƒƒƒƒƒƒƒƒˆƒƒƒƒƒƒƒƒƒˆƒƒƒƒƒƒƒƒƒˆƒƒƒƒƒƒƒƒƒˆƒƒƒƒƒƒƒƒƒˆƒƒƒƒƒƒƒƒƒˆƒƒƒƒƒƒƒƒƒˆƒƒƒƒƒƒƒƒƒˆƒƒ200 250 300 350 400 450 500 550 600 650 700 750 800
SAT

SAS is a registered trademark of SAS Institute, Inc. in the USA and other countries. ® indicates USA registration. This document copyright © 2004 by Sierra Information Services, Inc. All rights reserved, and may not be duplicated without the express written consent of the copyright holder.
More About the Logistic Function
• Provides a statistically superior alternative to the General Linear Model in situations where the dependent variable is dichotomous rather than continuous– “Maps” or “translates” changes in values of the
independent variables into a probability that ranges between zero and one
– Exponentiation of the parameter estimates yields an easily interpretable value: the odds ratio
Implementation of Logistic Regression Techniques in the SAS System
• Logistic regression techniques are implemented in the LOGISTIC procedure, included in the STAT Module of SAS System Software
• Other tools for categorical data analysis are found in the:– FREQ, CATMOD– GENMOD, PHREG
procedures in the STAT Module

SAS is a registered trademark of SAS Institute, Inc. in the USA and other countries. ® indicates USA registration. This document copyright © 2004 by Sierra Information Services, Inc. All rights reserved, and may not be duplicated without the express written consent of the copyright holder.
• How you code the values of your dependent variable is important!– the zero/one coding scheme is the most
commonly used method to indicate non-event/event for the dependent variable
– by default, however, PROC LOGISTIC will attempt to model (that is, predict the probability of) the lower of the two values, which is usually not the desired result.
Preparing your data for use byPROC LOGISTIC
Effects of Coding theDependent Variable
• Example: Study of whether a customer responds to a product offer– 0 (zero): customer did not buy– 1 (one) : customer did buy– By default, PROC LOGISTIC will implement a model
to predict the probability of the event coded zero, not the event coded one.
– This is usually contrary to what we want PROC LOGISTIC to do!

SAS is a registered trademark of SAS Institute, Inc. in the USA and other countries. ® indicates USA registration. This document copyright © 2004 by Sierra Information Services, Inc. All rights reserved, and may not be duplicated without the express written consent of the copyright holder.
The DESCENDING Option
• If your data are coded zero/one, you can override the default attempt to predict the probability of non-event by:– re-coding the dependent variable in a Data Step– using a FORMAT where the ‘event’ group is ‘higher’ than
the ‘non-event’ group– using the DESCENDING option in the PROC LOGISTIC
statement• DESCENDING option added to the SAS System in Release 6.07
Implementing a Logistic Regression Equation
• Key points to remember:– Logistic regression creates a model which attempts to
predict the probability of an event of interestoccurring in the population from which the data under analysis are assumed to have been randomly sampled
– Changes in the values of the independent variablesare often expressed in the context of changes (if any) in the odds ratio
• how do unit increases in the independent variable(s) contained in the model increase or decrease the odds the outcome of interest will occur.

SAS is a registered trademark of SAS Institute, Inc. in the USA and other countries. ® indicates USA registration. This document copyright © 2004 by Sierra Information Services, Inc. All rights reserved, and may not be duplicated without the express written consent of the copyright holder.
Using PROC LOGISTIC to Implement a Logistic Regression Equation
• The structure and syntax of many statements in PROC LOGISTIC are similar to those used in PROC REG and PROC GLM. – The important difference is what is being estimated
and what the parameter estimates mean in a logistic regression vs. a linear regression model.
The general form of PROC LOGISTIC is:
PROC LOGISTIC DATA=dsn [DESCENDING] ;MODEL depvar = indepvar(s)/options;RUN;
Implementing a Logistic Regression Model
• Example: Customer Purchase Study
Outcome (dependent variable): Customer Purchased Product– 1 = “Bought” 0 = “Did not Buy”
• Independent variable: Number of Days Since Last Purchase (Recency)

SAS is a registered trademark of SAS Institute, Inc. in the USA and other countries. ® indicates USA registration. This document copyright © 2004 by Sierra Information Services, Inc. All rights reserved, and may not be duplicated without the express written consent of the copyright holder.
ods html close;ods listing;
ods html path= 'c:\wells\miner' (url=none)body ='model1.htm‘ style = styles.andrew5 ;
proc logistic data=miner.sample descending;model respond = DaysSinceLastPurchase;units DaysSinceLastPurchase=30 60 90 180 365;run;
ods html close;ods listing;
Implementing a Simple Logistic Regression Model
in Version 8 of the SAS System
Model InformationData Set WORK.SAMPLEResponse Variable respond Did Cust. RespondNumber of Response Levels 2Number of Observations 967Link Function LogitOptimization Technique Fisher's scoring
Response ProfileOrdered
Value respondTotal
Frequency1 1 4912 0 476
Model Convergence StatusConvergence criterion
(GCONV=1E-8) satisfied.
Implementing a Simple Logistic Regression Model
in Version 8 of the SAS System

SAS is a registered trademark of SAS Institute, Inc. in the USA and other countries. ® indicates USA registration. This document copyright © 2004 by Sierra Information Services, Inc. All rights reserved, and may not be duplicated without the express written consent of the copyright holder.
Model Fit Statistics
CriterionIntercept
Only
Interceptand
Covariates
AIC 1342.314 1312.646
SC 1347.188 1322.394
-2 Log L 1340.314 1308.646
Implementing a Simple Logistic Regression Model
in Version 8 of the SAS System
Implementing a Simple Logistic Regression Model
in Version 8 of the SAS System
Testing Global Null Hypothesis: BETA=0
Test Chi-Square DF Pr > ChiSq
Likelihood Ratio 31.6682 1 <.0001
Score 30.6215 1 <.0001
Wald 28.6970 1 <.0001

SAS is a registered trademark of SAS Institute, Inc. in the USA and other countries. ® indicates USA registration. This document copyright © 2004 by Sierra Information Services, Inc. All rights reserved, and may not be duplicated without the express written consent of the copyright holder.
Analysis of Maximum Likelihood Estimates
Parameter DF EstimateStandard
Error Chi-Square Pr > ChiSq
Intercept 1 0.3659 0.0889 16.9437 <.0001
DaysSinceLastPurchas 1 -0.00185 0.000344 28.6970 <.0001
Implementing a Simple Logistic Regression Model
in Version 8 of the SAS System
Odds Ratio Estimates
Effect Point Estimate95% Wald
Confidence Limits
DaysSinceLastPurchas 0.998 0.997 0.999
Implementing a Simple Logistic Regression Model
in Version 8 of the SAS System
SAS is a registered trademark of SAS Institute, Inc. in the USA and other countries. ® indicates USA registration. This document copyright © 2004 by Sierra Information Services, Inc. All rights reserved, and may not be duplicated without the express written consent of the copyright holder.
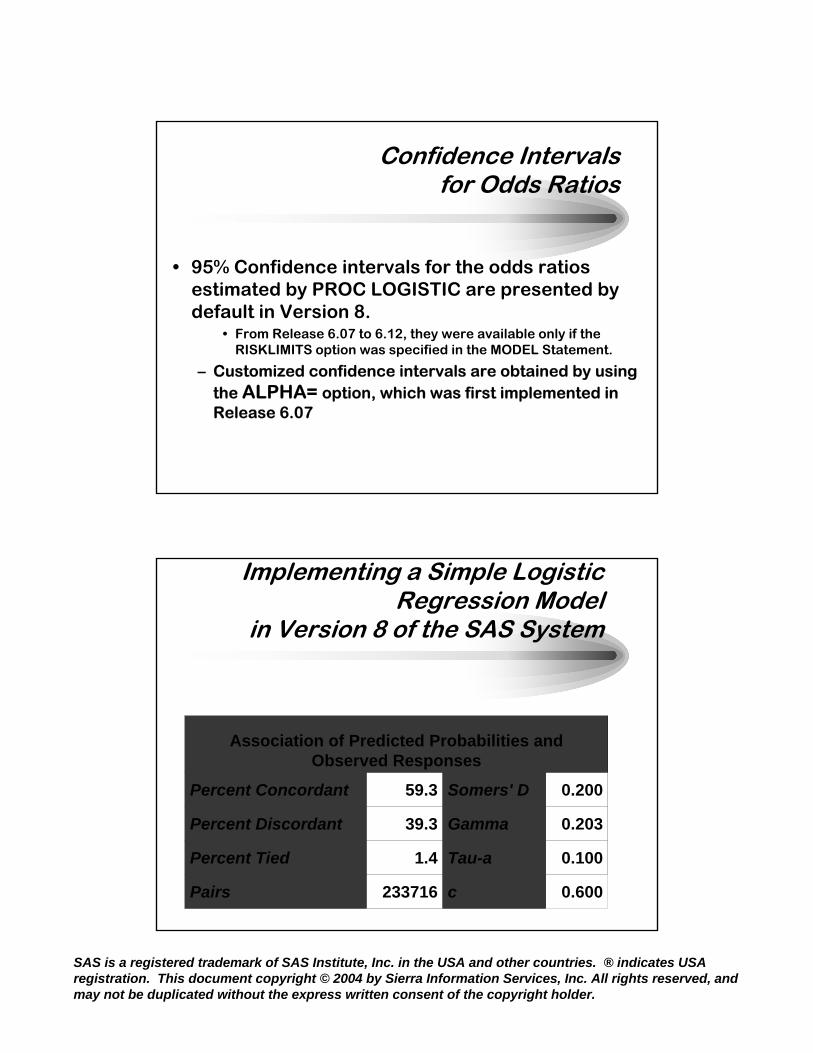
Confidence Intervals for Odds Ratios
• 95% Confidence intervals for the odds ratios estimated by PROC LOGISTIC are presented by default in Version 8.
• From Release 6.07 to 6.12, they were available only if the RISKLIMITS option was specified in the MODEL Statement.
– Customized confidence intervals are obtained by using the ALPHA= option, which was first implemented in Release 6.07
Implementing a Simple Logistic Regression Model
in Version 8 of the SAS System
Association of Predicted Probabilities andObserved Responses
Percent Concordant 59.3 Somers' D 0.200
Percent Discordant 39.3 Gamma 0.203
Percent Tied 1.4 Tau-a 0.100
Pairs 233716 c 0.600

SAS is a registered trademark of SAS Institute, Inc. in the USA and other countries. ® indicates USA registration. This document copyright © 2004 by Sierra Information Services, Inc. All rights reserved, and may not be duplicated without the express written consent of the copyright holder.
Interpretation of SAS System-generated Results
• -2 LOG L : tests global null hypothesis that none of the independent variables are related to probability of outcome event
• Parameter estimates/odds ratio:– presents ‘local’ tests of significance of parameters
under the null hypothesis that BETA = 0 (or, the odds ratio = 1) in the population
– the Odds Ratio column gives the exponentiation of the parameter estimate(s) for the independent variable(s) in the model. This aids in the interpretation of the results.
Using the UNITS Option for Customized Odds Ratios
• The UNITS option– Single unit changes in the values of the
independent variable may not be substantively relevant (or easily interpretable) to the analysis at hand
– The impact of changes or more than one unit in the independent variable can be obtained by using the UNITS option, which is available in Version 6.10 and above

SAS is a registered trademark of SAS Institute, Inc. in the USA and other countries. ® indicates USA registration. This document copyright © 2004 by Sierra Information Services, Inc. All rights reserved, and may not be duplicated without the express written consent of the copyright holder.
Using the UNITS Option for Customized Odds Ratios
proc logistic data=miner.sample descending;
model respond = DaysSinceLastPurchase;
units DaysSinceLastPurchase=
30 60 90 180 365;run;
Adjusted Odds Ratios
Effect Unit Estimate
DaysSinceLastPurchas 30.0000 0.946
DaysSinceLastPurchas 60.0000 0.895
DaysSinceLastPurchas 90.0000 0.847
DaysSinceLastPurchas 180.0 0.717
DaysSinceLastPurchas 365.0 0.510
Using the UNITS Option for Customized Odds Ratios

SAS is a registered trademark of SAS Institute, Inc. in the USA and other countries. ® indicates USA registration. This document copyright © 2004 by Sierra Information Services, Inc. All rights reserved, and may not be duplicated without the express written consent of the copyright holder.
Multiple Logistic Regression Model
• Implemented by placing additional independent variables to the right of the equals sign in the PROC LOGISTIC statement– Customized Odds Ratios for some (or all) of
the independent variables in a multiple logistic regression model are available through the UNITS option, with the DEFAULT = 1 statement used for those independent variables for which no customized odds ratios are desired.
proc logistic data=miner.sample descending namelen=25 outest=est1;
model respond= DaysSinceLastPurchase Club/lackfit rsquare ctable pprob = .50;
output out=new p = Predicted_Prob_of_Response; title2 'Logistic Regression Model with One Binary and One Continuous Level Variable';
Multiple Logistic Regression Model

SAS is a registered trademark of SAS Institute, Inc. in the USA and other countries. ® indicates USA registration. This document copyright © 2004 by Sierra Information Services, Inc. All rights reserved, and may not be duplicated without the express written consent of the copyright holder.
Model Fit Statistics
CriterionIntercept
Only
Interceptand
CovariatesAIC 1342.314 1297.483
SC 1347.188 1312.106
-2 Log L 1340.314 1291.483
LR Model with One Continuous and One Binary Independent Variable
AkaikeInformation Criterion
Association of Predicted Probabilities andObserved Responses
Percent Concordant 60.9 Somers' D 0.230
Percent Discordant 37.9 Gamma 0.233
Percent Tied 1.1 Tau-a 0.115
Pairs 233716 c 0.615
LR Model with One Continuous and One Binary Independent Variable
Area Under Curve

SAS is a registered trademark of SAS Institute, Inc. in the USA and other countries. ® indicates USA registration. This document copyright © 2004 by Sierra Information Services, Inc. All rights reserved, and may not be duplicated without the express written consent of the copyright holder.
Testing Global Null Hypothesis: BETA=0
Test Chi-Square DF Pr > ChiSq
Likelihood Ratio 48.8306 2 <.0001
Score 47.4276 2 <.0001
Wald 44.7818 2 <.0001
LR Model with One Continuous and One Binary Independent Variable
Analysis of Maximum Likelihood Estimates
Parameter DF EstimateStandard
Error Chi-Square Pr > ChiSq
Intercept 1 0.1558 0.1019 2.3375 0.1263
DaysSinceLastPurchase 1 -0.00141 0.000354 15.8228 <.0001
club 1 0.7526 0.1859 16.3846 <.0001
LR Model with One Continuous and One Binary Independent Variable

SAS is a registered trademark of SAS Institute, Inc. in the USA and other countries. ® indicates USA registration. This document copyright © 2004 by Sierra Information Services, Inc. All rights reserved, and may not be duplicated without the express written consent of the copyright holder.
Odds Ratio Estimates
Effect Point Estimate95% Wald
Confidence Limits
DaysSinceLastPurchase 0.999 0.998 0.999
club 2.122 1.474 3.056
LR Model with One Continuous and One Binary Independent Variable
Automated Optimal Subset Selection ofIndependent Variables
• PROC LOGISTIC also permits:– forward selection– backward elimination– forward stepwise
selection of ‘optimal subsets’ of independent variables– Default significance levels for entry into/removal from
the model can be modified by use of the SLENTRY and SLSTAY options
• Forced inclusion of some of the independent variables in the MODEL Statement.

SAS is a registered trademark of SAS Institute, Inc. in the USA and other countries. ® indicates USA registration. This document copyright © 2004 by Sierra Information Services, Inc. All rights reserved, and may not be duplicated without the express written consent of the copyright holder.
Assessing Model Fit
• PROC LOGISTIC provides several means of assessing model fit:– Hosmer and Lemeshow Goodness-Fit-Test– Akaike Information Criterion and SBC tests– R-square statistics– Classification Tables
• Sensitivity• Specificity• Proportion of Cases Correctly Classified• False Positive %• False Negative %
– Influence diagnostics
proc logistic data=miner.sample descending namelen=25 outest=est1;
model respond= DaysSinceLastPurchase Club/lackfit rsquare ctable pprob = .50;
output out=new p = Predicted_Prob_of_Response; title2 'Logistic Regression Model with One Binary and One Continuous Level Variable';
Assessing the Fit of a Logistic Regression Model

SAS is a registered trademark of SAS Institute, Inc. in the USA and other countries. ® indicates USA registration. This document copyright © 2004 by Sierra Information Services, Inc. All rights reserved, and may not be duplicated without the express written consent of the copyright holder.
Assessing Model Fit
• Hosmer and Lemeshow (1989) Goodness of Fit Test– described in their text, Applied Logistic Regression– also discussed in SAS Technical Report P-229– implemented via the LACKFIT option in the MODEL statement
• R-square ‘like’ statistics– generalization of the coefficient of determination to the logistic
regression model– implemented with the RSQUARE option
– provides two values: ‘R-Square’ and ‘Adjusted R-square’
• use ‘Adjusted R-square’ for models with one or more dichotomous independent variables
Assessing Model Fit:the Hosmer-Lemeshow Test
Partition for the Hosmer and Lemeshow Test
Group Totalrespond = 1 respond = 0
Observed Expected Observed Expected1 97 31 30.39 66 66.612 97 39 39.73 58 57.273 96 41 43.21 55 52.794 98 47 46.27 51 51.735 98 56 48.62 42 49.386 100 48 51.23 52 48.777 97 56 50.85 41 46.158 99 45 52.92 54 46.089 97 61 65.31 36 31.69
10 88 67 62.46 21 25.54

SAS is a registered trademark of SAS Institute, Inc. in the USA and other countries. ® indicates USA registration. This document copyright © 2004 by Sierra Information Services, Inc. All rights reserved, and may not be duplicated without the express written consent of the copyright holder.
Hosmer and Lemeshow Goodness-of-Fit
Test
Chi-Square DF Pr > ChiSq
8.5616 8 0.3806
Assessing Model Fit:the Hosmer-Lemeshow Test
Assessing Model Fit: “R-Square Like” Statisticcs
R-Square 0.0492 Max-rescaled R-Square 0.0657
Obtained from the
RSQUARE Option

SAS is a registered trademark of SAS Institute, Inc. in the USA and other countries. ® indicates USA registration. This document copyright © 2004 by Sierra Information Services, Inc. All rights reserved, and may not be duplicated without the express written consent of the copyright holder.
Assessing Model Fit
• Classification Tables– Implemented via the CTABLE option in the MODEL
statement
– best if the PPROB option is used with CTABLE to avoid unnecessary output
Assessing Model Fit
• Classification Tables, continued– provides a convenient way to determine the
• sensitivity• specificity• false positive rate• false negative rate• proportion of cases correctly classified
by the model at different (specified by the user, if PPROB option is used) prior probabilities of event occurrence

SAS is a registered trademark of SAS Institute, Inc. in the USA and other countries. ® indicates USA registration. This document copyright © 2004 by Sierra Information Services, Inc. All rights reserved, and may not be duplicated without the express written consent of the copyright holder.
Assessing Model Fit:the Classification Table Approach
• Remember, the value generated by PROC LOGISTIC is the predicted probability of event outcome.
• We need some rule to apply when deciding whether the model has predicted either ‘outcome’ or ‘non-outcome.’ That rule is the user-specified prior probability.
• Applying the prior probability set by the user is used to generate a classification table from which the– sensitivity– specificity
• and other assessments of model adequacy are computed
Assessing Model Fit:the Classification Table Approach
proc logistic data=miner.sample
descending namelen=25 outest=est1;
model respond= DaysSinceLastPurchase Club/
lackfit rsquare ctable pprob = .50;
output out=new p = Predicted_Prob_of_Response;
title2 'Logistic Regression Model with One Binary and One Continuous Level Variable';

SAS is a registered trademark of SAS Institute, Inc. in the USA and other countries. ® indicates USA registration. This document copyright © 2004 by Sierra Information Services, Inc. All rights reserved, and may not be duplicated without the express written consent of the copyright holder.
Obs AccountNumber
DidCust.
Respond
PredictedProbability
ofResponse
Recencyof
LastPurchase
(Days)
Belongsto
DiscountBuying
Club
1 1013165012 0 0.53817 2 0
2 1013918584 1 0.71266 0 1
3 1016390120 1 0.51081 80 0
4 1017474790 1 0.48655 149 0
5 1017963818 1 0.46585 208 0
6 1018173318 1 0.32974 615 0
7 1018214146 0 0.41186 364 0
8 1018314516 0 0.34611 563 0
9 1019547932 0 0.52135 50 0
10 1019974110 1 0.41016 369 0
11 1020227136 1 0.52380 43 0
12 1023526500 1 0.48690 148 0
13 1024521344 1 0.51046 81 0
14 1025260272 1 0.34484 567 0
15 1025482702 0 0.47461 183 0
Assessing Model Fit:Sensitivity and Specificity
Bought
Did NotBuy
The CUSTOMER Really............
The MODELPredicted the CUSTOMER.....
TRUEPOSITIVE
FALSEPOSITIVE
TRUENEGATIVE
FALSENEGATIVE
Note: Bought = ‘Positive’
BoughtDid Not Buy

SAS is a registered trademark of SAS Institute, Inc. in the USA and other countries. ® indicates USA registration. This document copyright © 2004 by Sierra Information Services, Inc. All rights reserved, and may not be duplicated without the express written consent of the copyright holder.
Assessing Model Fit:Sensitivity and Specificity
• Sensitivity:– Ability of the model to correctly predict the event of
interest among those in whom the event occurred• The model’s ability to correctly ‘rule in’ the condition
of interest– Of all the customers who made a purchase, what
proportion did the specified model predict would purchase?
Sensitivity = TRUE POS / (TRUE POS + FALSE NEG)
Assessing Model Fit:Sensitivity and Specificity
• Specificity:– Ability of the model to correctly predict “non-
event” among those in whom the event of interest did not occur
• The model’s ability to correctly ‘rule out’ the event of interest
– Of all the customers who did not purchase, what proportion were predicted by the specified model to not purchase
Specificity = TRUE NEG / (TRUE NEG + FP)

SAS is a registered trademark of SAS Institute, Inc. in the USA and other countries. ® indicates USA registration. This document copyright © 2004 by Sierra Information Services, Inc. All rights reserved, and may not be duplicated without the express written consent of the copyright holder.
Assessing Model Fit:the Classification Table Approach
proc logistic data=miner.sample
descending namelen=25 outest=est1;
model respond= DaysSinceLastPurchase Club/
lackfit rsquare ctable pprob = .50;
output out=new p = Predicted_Prob_of_Response;
title2 'Logistic Regression Model with One Binary and One Continuous Level Variable';
Classification Table
ProbLevel
Correct Incorrect Percentages
EventNon-
Event EventNon-
Event CorrectSensi-
tivitySpeci-
ficityFalsePOS
FalseNEG
0.500 295 254 222 196 56.8 60.1 53.4 42.9 43.6
Assessing Model Fit: Classification Table Approach

SAS is a registered trademark of SAS Institute, Inc. in the USA and other countries. ® indicates USA registration. This document copyright © 2004 by Sierra Information Services, Inc. All rights reserved, and may not be duplicated without the express written consent of the copyright holder.
Obtaining Parameter Estimates for the Logistic Regression Model
proc logistic data=miner.sample
descending namelen=25 outest=est1;
model respond= DaysSinceLastPurchase Club/
lackfit rsquare ctable pprob = .50;
output out=new p = Predicted_Prob_of_Response;
title2 'Logistic Regression Model with One Binary and One Continuous Level Variable';
Obs Linkfunction
Typeof
Statistics
Convergence
Status
RowNames
forParameterEstimates
andCovarianc
eMatrix
Intercept
Recencyof
LastPurchase
(Days)
Belongsto
DiscountBuying
Club
ModelLog
Likelihood
1 LOGIT PARMS 0 Converged respond 0.15577 -.001406693 0.75256 -645.742
Obtaining Parameter Estimates for the Logistic Regression Model

SAS is a registered trademark of SAS Institute, Inc. in the USA and other countries. ® indicates USA registration. This document copyright © 2004 by Sierra Information Services, Inc. All rights reserved, and may not be duplicated without the express written consent of the copyright holder.
Additional Functionalities Available inPROC LOGISTIC
• Among additional functionalities in PROC LOGISTIC are:
– outlier and influential observation detection– generation of values for a Receiver-Operator
Characteristics (ROC) curve in to an output SAS data set for subsequent plotting by PROCs PLOT and/or GPLOT
– generation of false positive and false negative rates using Baye’s Theorem
Using a Polytomous Independent Variable in a Logistic Regression Model
• A major enhancement to PROC LOGISTIC in Version 8 is the CLASS Statement, which permits introduction of categorical independent variables in to a logistic regression model without having to create dummy variables in a Data Step.
• The CLASS Statement also permits specification of a reference level. By default, the lowest level of the variable placed in the CLASS Statement is treated as the reference category.

SAS is a registered trademark of SAS Institute, Inc. in the USA and other countries. ® indicates USA registration. This document copyright © 2004 by Sierra Information Services, Inc. All rights reserved, and may not be duplicated without the express written consent of the copyright holder.
Using a Polytomous Independent Variable in a Logistic Regression Model
proc logistic data=miner.sample
descending namelen=25;
CLASS REGION;
model respond= DaysSinceLastPurchase Club REGION;
Type III Analysis of Effects
Effect DFWald
Chi-Square Pr > ChiSq
REGION 3 1.9986 0.5727
DaysSinceLastPurchase 1 16.2194 <.0001
club 1 16.5041 <.0001
Using a Polytomous Independent Variable in a Logistic Regression Model

SAS is a registered trademark of SAS Institute, Inc. in the USA and other countries. ® indicates USA registration. This document copyright © 2004 by Sierra Information Services, Inc. All rights reserved, and may not be duplicated without the express written consent of the copyright holder.
Analysis of Maximum Likelihood Estimates
Parameter DF EstimateStandard
Error Chi-Square Pr > ChiSq
Intercept 1 0.1624 0.1034 2.4661 0.1163
REGION CENTRAL 1 0.0916 0.1159 0.6242 0.4295
REGION EAST 1 0.0859 0.1150 0.5575 0.4553
REGION SOUTH 1 -0.1110 0.1061 1.0949 0.2954
DaysSinceLastPurchase 1 -0.00143 0.000355 16.2194 <.0001
club 1 0.7563 0.1862 16.5041 <.0001
Using a Polytomous Independent Variable in a Logistic Regression Model
Using a Polytomous Independent Variable in a Logistic Regression Model
Odds Ratio Estimates
Effect Point Estimate
95% WaldConfidence
LimitsREGION CENTRAL vsWEST 1.171 0.779 1.762
REGION EAST vs WEST 1.165 0.776 1.748
REGION SOUTH vs WEST 0.956 0.650 1.408
DaysSinceLastPurchase 0.999 0.998 0.999
club 2.130 1.479 3.068

SAS is a registered trademark of SAS Institute, Inc. in the USA and other countries. ® indicates USA registration. This document copyright © 2004 by Sierra Information Services, Inc. All rights reserved, and may not be duplicated without the express written consent of the copyright holder.
Including Interaction Effects in Models Fit by PROC LOGISTIC
• Another key enhancement in Version 8 is the ability to include interaction terms in a logistic regression model – Extensive Data Step manipulation is not required
• All possible interactions among several independent variables can also be tested very easily and with a minimum of coding.
Testing for Interactions Among the Independent Variables
proc logistic descending data=banking.training;
model respond = acctage ddabal dep checks ccbal sdb
dirdep phone teller atm moved
acctage | ddabal | dep | checks | ccbal | sdb |dirdep | phone | teller | atm | moved @2 ;
title3 'Examining All Possible Two Way Interactions Among the Independent Variables';
run;
The @2 symbol instructs PROC LOGISTIC to only consider all possible two way interactions

SAS is a registered trademark of SAS Institute, Inc. in the USA and other countries. ® indicates USA registration. This document copyright © 2004 by Sierra Information Services, Inc. All rights reserved, and may not be duplicated without the express written consent of the copyright holder.
Using Fast Backward Eliminationproc logistic data=logistic.training DESC;
model respond = ATM DDABAL DEP DIRDEP PHONE SDB TELLER ATM|DDABAL|DEP|DIRDEP|PHONE|SDB|TELLER @2/
INCLUDE = 7 SELECTION=Backward FAST SLSTAY = .01;
title2 'Fast Backward Elimination';
run;
This PROC LOGISTIC task calculates parameter estimates for all seven independent variables and the 21 unique pairwise combinations of them. It then performs “fast backward” elimination of all pairwise interaction effects whose P-values are greater than .01, the value set in the SLSTAY option. The INCLUDE option directs PROC LOGISTIC to keep the first seven variables listed in the MODEL Statement in every model it creates during execution of this task.
Summary and Conclusions
• PROC LOGISTIC implements many types of models where the dependent, or outcome, variable is categorical. Other procedures in the SAS System’s STAT module also provide tools for analyzing categorical data models.– PROC LOGISTIC’s structure and syntax is similar to
that of PROC REG– In many analytical situations a logistic, rather than
ordinary least squares approach, is appropriate

SAS is a registered trademark of SAS Institute, Inc. in the USA and other countries. ® indicates USA registration. This document copyright © 2004 by Sierra Information Services, Inc. All rights reserved, and may not be duplicated without the express written consent of the copyright holder.
Summary and Conclusions
• This presentation has addressed situations where the dependent variable is considered a dichotomous, or binary “outcome”
• How the binary outcome variable is coded is critical to how PROC LOGISTIC implements the model, and how you interpret the model’s results.
• Remember, the value predicted by PROC LOGISITC is the probability of event outcome.
Summary and Conclusions,continued
• Exponentiation of the model’s parameter estimates give us odds ratios, which are much more easy to interpret than the parameter estimates themselves.
• PROC LOGISITIC has had several key features and enhancements added since the first release of Version 6 SAS System software. You should read the most recent “changes and enhancements” volume to learn what is currently available in PROC LOGISITC.

SAS is a registered trademark of SAS Institute, Inc. in the USA and other countries. ® indicates USA registration. This document copyright © 2004 by Sierra Information Services, Inc. All rights reserved, and may not be duplicated without the express written consent of the copyright holder.
Coming to PROC LOGISTIC in SAS 9
• SCORE Statement (NEW)– Used to score new data sets using parameter
estimates generated from applying the model to another data set, without having to refit the model.
• Useful for validation or “scoring” new data sets
• New options in the CLASS Statement providing additional parameterization methods, including:– Ordinal, Orthogonal Effect, Orthogonal Reference
and Orthogonal Ordinal
Coming to PROC LOGISTIC in SAS 9
• Classification groups will be formed based on the ENTIRE formatted values of the variable– In previous releases of SAS Software only the first 16
characters of the format were used
• STRATA Statement permits conditional logistic regression on highly stratified data
• Output of design matrix available using the OUTDESIGN Option
• ODS Statistical Graphics (Experimental in 9.1)

SAS is a registered trademark of SAS Institute, Inc. in the USA and other countries. ® indicates USA registration. This document copyright © 2004 by Sierra Information Services, Inc. All rights reserved, and may not be duplicated without the express written consent of the copyright holder.
Learning More: Available from SAS Institute’s Publications Division
* Logistic Regression Examples Using the SAS System (1995)
* Stokes, Davis and Koch, Categorical Data Analysis Using the SAS System (1995, 2001)
• Allison, Logistic Regression Using the SAS System: Theory and Applications (1999)
Learning More: General References
• Hosmer and Lemeshow, Applied Logistic Regression, (1989,2001)
• Menard, Applied Logistic Regression Analysis, (1995)
• Kleinbaum, Logistic Regression: A Self-Learning Text (1996)
• Long, Regression Models for Categorical and Limited Dependent Variables (1997)

SAS is a registered trademark of SAS Institute, Inc. in the USA and other countries. ® indicates USA registration. This document copyright © 2004 by Sierra Information Services, Inc. All rights reserved, and may not be duplicated without the express written consent of the copyright holder.
Thanks for Attending !
• Questions?• Comments?• www.SierraInformation.com• [email protected]