Getting Started with Data Science€¦ · Big Data and Data Lakes Big Data is data characterized by...
26
© 2018 Verisk Analytics, Inc. All rights reserved. Confidential and Proprietary. Getting Started with Data Science Nabeel Azar Conexxus Conference August 15, 2018
Transcript of Getting Started with Data Science€¦ · Big Data and Data Lakes Big Data is data characterized by...

© 2018 Verisk Analytics, Inc. All rights reserved. Confidential and Proprietary.
Getting Started with
Data ScienceNabeel AzarConexxus ConferenceAugust 15, 2018
© 2018 Verisk Analytics, Inc. All rights reserved. Confidential and Proprietary.
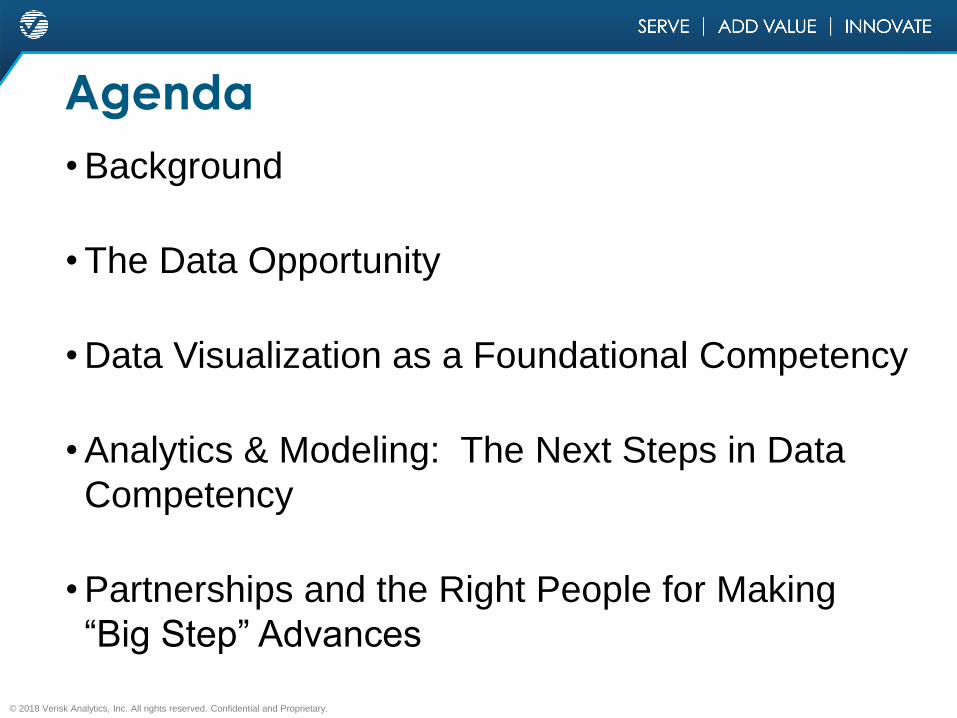
Agenda
• Background
• The Data Opportunity
• Data Visualization as a Foundational Competency
• Analytics & Modeling: The Next Steps in Data
Competency
• Partnerships and the Right People for Making
“Big Step” Advances

© 2018 Verisk Analytics, Inc. All rights reserved. Confidential and Proprietary.
BackgroundVerisk Analytics is the world’s most effective and responsible data analytics company in pursuit of our customers’ most strategic opportunities. We provide predictive analytics and decision support solutions to customers in specific vertical markets.
Property/Casualty
Insurance
Distinctives
Deep
Domain
Expertise
Steady Stream
of First-to-
Market
Innovations
Unique
Data
Assets
Property/Casualty
Insurance
Energy and
Specialized Markets
Financial
Services
Deep Integration
into Customer
Workflows
14Petabytesof information in
our data stores
Financial Services
Energy and
Specialized Markets
Property/Casualty
Insurance
Sample Solutions Advantages
6M
55M+ total consumer spend tracked each year on 140B unique
transactions, along with innovative delivery mechanisms to
inform retail partners and merchants
data points describing global upstream oil and gas assets
$6.7T
commercial properties and 26M businesses; ratings on ~46K fire protection areas

© 2018 Verisk Analytics, Inc. All rights reserved. Confidential and Proprietary.© 2018 Verisk Analytics, Inc. All rights reserved. Confidential and Proprietary
Data Assets

© 2018 Verisk Analytics, Inc. All rights reserved. Confidential and Proprietary.
The Data OpportunityEvery company produces data in the course of conducting its core business. This creates an opportunity to use that data to drive revenue, control costs, and manage profitability.
Below are key considerations to take into account during this process.
•Internal
•External
•Governance + Usage Rights
Identify Data + Source
•Collect and Normalize
•Data Lakes? Data Warehouse? Or even simpler?
Acquire or Gain Access
•Visualization to better understand basic trends, metrics, KPI
•Identify POC and potential uses
Data Exploration/Deeper
Understanding
•MIS/Flash Reports
•Descriptive Analytics
•Modeling
•Predictive Analytics
Use Cases
• Consider data from many different departments – POS.– HR, Finance, and Operational Teams.– Foot-traffic and consumer path data.– Video and information derived from it.
• Can you align data from different systems together? – Entity resolution.
• Identify Unique Opportunities– Linking data assets from many areas
gives you deeper insight into your business and its clients.

© 2018 Verisk Analytics, Inc. All rights reserved. Confidential and Proprietary.
Different Kinds of Data
• Raw data, also referred to as ‘source data’, comes directly from the system of record and has not been processed for use. It can come in many forms including binary, video, audio, or formatted text. Typically, raw data has to be transformed in some way to make it usable in systems and processes.
Raw vs. Processed
• Structured data is data which is highly organized, usually in a form that can be easily manipulated or searched. For example, data in a spreadsheet or relational database is structured. Unstructured data is data that is not structured, and can include audio, visual and written documents (such as magazine articles).
Structured vs. Unstructured
• Directly observed data is data that was explicitly described in the raw source data. Derived data is created from directly observed data by using some type of transformation such as math or logic. For example, the raw file for a point-of-sale (POS) transaction header may include the transaction total, but it may not include the item count. We can compute the item count (derived data) and insert it alongside the transaction total (directly observed data).
Directly Observed vs. Derived

© 2018 Verisk Analytics, Inc. All rights reserved. Confidential and Proprietary.
Big Data and Data LakesBig Data is data characterized by the 3 Vs:• Volume, Velocity, Variety
Big Data is best stored and managed using databases designed for it.
Data Lakes extend the concept of a Data Warehouse to store data in multiple forms, to be accessed in multiple ways. • The Data Lake contains data in its original form. • Tributaries running from the data lake store it in formats useful for
downstream projects or use cases.• End users can access data either directly in the lake, or from one of
the tributaries.
Do you have Structured Data? Structured databases, including relational DBs, can provide performance gains by taking advantage of that structure.
Most companies have a continuum of data, ranging from completely unstructured to highly structured.

© 2018 Verisk Analytics, Inc. All rights reserved. Confidential and Proprietary.
Characteristics of an Effective Data Management System
Supports downstream analysis • End users may need to access raw or unstructured data.• Should have the ability to derive their own data and link to
directly observed data.
Validation is a First-Class Process• Beginning-to-End/Walk-Through
– Can I reconcile today’s POS transactions with an EOD sales report?
• Over-time and time series validation– Is today’s value too different from yesterday’s value? Does today’s
value seem reasonable when compared to same-day-last-year?
• Business Rules– Does this value have the right number of decimal points?

© 2018 Verisk Analytics, Inc. All rights reserved. Confidential and Proprietary.
Common Challenges – Getting to Data
• Many Separate Data Environments– Often a result of growth by M&A, but organically develops with multiple
functional units. – Make this an advantage! Diverse data sets can be very powerful when
combined.– Top-down (exec sponsorship), bottom-up (grass roots), and a specific POC
helps make combining different data environments a reality. – Silo-Busting, as a recognized value and process, is critical to success.
• Different Data Storage Technology & Formats– DB (SQL, Oracle, …); files (Excel, csv, …); legacy (EBCDIC, mainframe). – Non-traditional data formats: Video, audio, written documents, handwritten
forms
• Restrictions on Data Use– These may come from regulatory or compliance requirements, or even internal
politics.– Important to have governance process in place that respects restrictions.
Permissions, security, audit trail. – Rather than barriers, these can serve as guiderails for how work should be
done. Very often, we can re-engineer a problem to avoid restrictions while still getting the desired value.

© 2018 Verisk Analytics, Inc. All rights reserved. Confidential and Proprietary.© 2018 Verisk Analytics, Inc. All rights reserved. Confidential and Proprietary
Data Visualization

© 2018 Verisk Analytics, Inc. All rights reserved. Confidential and Proprietary.
Data Visualization – A FoundationData Visualization is foundational to nearly all data related work.
For Analysts and End Users• Using BI Tools to allow analysts to view data, make
charts/graphs. • These can be used on the desktop and embedded into web
pages and web or mobile applications.
For Statisticians, Programmers, Quants• Using charting and graphing libraries found in programming
languages such as R or Python to plot and understand data.
For Application Developers• Using programmatic tools to embed visuals of data into existing
applications and dashboards.

© 2018 Verisk Analytics, Inc. All rights reserved. Confidential and Proprietary.
Data Visualization – Leverage BI Tools
BI Tools are plentiful in the market. They provide:• Easy ways to connect to multiple sources of data
(structured and unstructured, local and cloud based).• Interactive tools for exploring data and making
charts/graphs to identify patterns.
Many sources of training • Many college programs teach these tools to students
(esp data science programs)• Online communities, both vendor sponsored and
independent, provide training and troubleshooting resources.
• Vendor sponsored events and conferences.
Use cases/strategy:• Deploy analytics to internal + external client• Simplify development cycle.• Easy to customize.• New features provided by the BI vendors add to your
capabilities.
Some Popular BI Tools

© 2018 Verisk Analytics, Inc. All rights reserved. Confidential and Proprietary.
Data Visualization – ApplicationsEarly Phases• Enables data exploration and better
understanding of your data.• A vehicle for Descriptive Statistics –
lets you understand what’s happening now and what has happened.
Developed Usage• Typically the best way to visualize the
results of models, both outputs, validation, and model statistics.– Ex) Backtest results; predicted vs. actual
Mature/Advanced Strategies• Production deployment to clients
(internal and external).• Can be automated and deployed at
large scale.• Can be integrated into product
platform (including consistent UI/L&F).
• Track KPI, product quality. Identify cost savings and profit opportunities.
• Monitor gating points.
• Build dashboards, system monitors, project progress.
• Identify 1st + 2nd party fraud/theft.
Operational Improvement
• Visualize key performance metrics.
• Drilldowns into strategically important areas (ex: new business, new clients, new distribution channels).
Executive + MIS Dashboards
• Dashboards for clients, insights into information proprietary to your relationship with them.
• Delivery mechanism for value-add studies.
External Applications
• Enable individual teams to look at their own data.
• Gain benefits of data at scale.
• A few wins sets an example across the company; creates a culture of data visualization.
Democratize Data; Culture of Visualization

© 2018 Verisk Analytics, Inc. All rights reserved. Confidential and Proprietary.
Sample Visualizations & Applications
Geopolitical Risk Safety ViolationsStore Performance
Benchmark
Store ShipmentsCompetitive Insights
& Sales DriversMobile App Usage
& Store Loyalty

© 2018 Verisk Analytics, Inc. All rights reserved. Confidential and Proprietary.© 2018 Verisk Analytics, Inc. All rights reserved. Confidential and Proprietary
Analytics & Modeling

© 2018 Verisk Analytics, Inc. All rights reserved. Confidential and Proprietary.
Analytics & ModelingData visualization tools provide a basic level of descriptive analytics. A natural progression flows from descriptive analytics to predictive analytics. Modeling is a key part of predictive analytics.
Descriptive AnalyticsPredictive Analytics
• What happened?
• Who did it happen to?
• When did it happen
relative to other events?
• How did it happen?
• What might happen?
• Why might it happen?
• What changes can I make to
effect the outcome, and how
impactful would that be?
© 2018 Verisk Analytics, Inc. All rights reserved. Confidential and Proprietary.
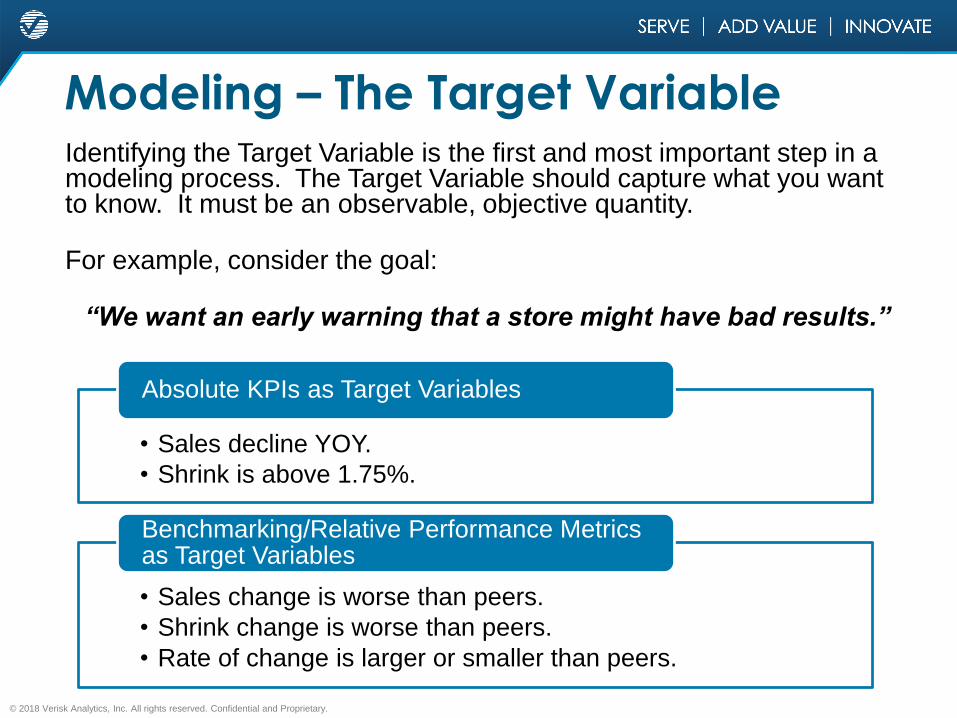
Modeling – The Target VariableIdentifying the Target Variable is the first and most important step in a modeling process. The Target Variable should capture what you want to know. It must be an observable, objective quantity.
For example, consider the goal:
“We want an early warning that a store might have bad results.”
• Sales decline YOY.
• Shrink is above 1.75%.
Absolute KPIs as Target Variables
• Sales change is worse than peers.
• Shrink change is worse than peers.
• Rate of change is larger or smaller than peers.
Benchmarking/Relative Performance Metrics as Target Variables

© 2018 Verisk Analytics, Inc. All rights reserved. Confidential and Proprietary.
Model Development – Typical Process
A typical engagement process is described below.
Deliver; Operationalize;
Maintain
•Deliverable based on preferred consumption method.
•Artifacts from model development, such as statistics, graphs, exploratory data, documentation.
• Implementation in production.
•Model updates/refresh.
•Training and education.
Develop the Model:
Data Science + SMEs
•Data collection, exploration, model construction including in and out-of-sample testing.
•Partnership with Subject Matter Experts (SMEs) is critical to building an effective model.
Identify Data Available:
The Data Opportunity
•Core data assets.
•Special data assets and business rules unique to your business.
•This is where points brought up in Data Opportunity slide begin to have an impact.
Define the Target and How
You Want to Consume the
Model
•What do you want to model?
•Work with SMEs to identify desired results and how you want to utilize those results.
•Many ways to consume models:
• Interactive dashboard
•Scored files
•Alerts

© 2018 Verisk Analytics, Inc. All rights reserved. Confidential and Proprietary.
Sample Internal & External Data Useful for LP Models
Store • Sales $
• Refund $
• Refund $ as % of Sales
• Void $ as % of Sales
• Price Change $ as % of
Sales
• High Risk Transaction $
• % of Cash Sales
• CNP Tenders
Employee• Individual sales activity
• Employee discount
activity
• High Risk transaction
alertsInternal Data
from Sales and HR
Public• Population Density
• Average Income
• Educational Level
• Violent Crime Data
• Non-Violent Crime Data
• Distance to nearest Police
Station
Consortia• Household Spend
• Return Statistics
• Competitor Sales
• Spend Migration YoY
External Data
&
Partner/Consortia Data

© 2018 Verisk Analytics, Inc. All rights reserved. Confidential and Proprietary.
Data Science and ModelingHow do Data Scientists fit into my modeling team?
– The role of a Data Scientist is to find business insights from your data, often using “data science” tools which may be both data intensive and computationally intensive.
– Data Scientists can be thought of as modelers (statisticians, engineers, computer scientists) who have data, mathematics, programming, and business acumen.
– The tools of data science (such as machine learning) are additional tools in your model-solving toolbox. But they should not be your only tools!
Why is Data Science Popular Now? – The data and computational power needed to make them work is now widely
available.
Is Data Science Just a Lot of Hype?– There are real advantages of searching for and recruiting expertise under the
category of Data Science.• Self-identified. • Know the tools. • Good blend of math, programming, presentation.
– But keep in mind that the ability to derive insights from data is a skill that can exist in other titles and degrees, don’t neglect current analytics and quantitative leaders..

© 2018 Verisk Analytics, Inc. All rights reserved. Confidential and Proprietary.
Considerations for Delivery & Ops
21
• Taking action from model results
• How to interpret model
• Model performance
• Model aging
• Data required
• Processing timing and constraints
• Dashboard
• Data feed
• Automated actions or notifications
Identify delivery
method of insight
Identify Requirements for Production
Training & Deployment
Identify Recalibration Checkpoints

© 2018 Verisk Analytics, Inc. All rights reserved. Confidential and Proprietary.© 2018 Verisk Analytics, Inc. All rights reserved. Confidential and Proprietary
Partnerships & People

© 2018 Verisk Analytics, Inc. All rights reserved. Confidential and Proprietary.
Partnerships & People
Partnerships
• The best partnerships allows you to merge data assets together to produce insights that could not exist without the partnership.
• Consortia are a powerful example of what strategic partnerships can yield. The analytics produced from consortia arrangements are extremely powerful, and extremely difficult to reproduce.
People
• The right data leadership is critical to identifying new opportunities for using the data that you have, and can help you identify the best opportunities for partnership.
• Examples include: Advisory or outside leadership; CDO

© 2018 Verisk Analytics, Inc. All rights reserved. Confidential and Proprietary.© 2018 Verisk Analytics, Inc. All rights reserved. Confidential and Proprietary
Contact Information

© 2018 Verisk Analytics, Inc. All rights reserved. Confidential and Proprietary.
Contact Information
Nabeel Azar
President, Verisk Retail
Managing Director, Verisk Financial Services
Chair, Verisk Data Science Excellence Program
914-307-0019
www.linkedin.com/in/nabeelazar/

© 2018 Verisk Analytics, Inc. All rights reserved. Confidential and Proprietary.