Getting Started - Petroleum - Rowan University - Personal...
104
Version 11.1
Transcript of Getting Started - Petroleum - Rowan University - Personal...

Version 11.1

Part Number: Aspen Plus 11.1September 2001Copyright (c) 1981-2001 by Aspen Technology, Inc. All rights reserved.
Aspen Plus®, Aspen Properties®, Aspen Engineering Suite, AspenTech®, ModelManager, the aspen leaf logo andPlantelligence are trademarks or registered trademarks of Aspen Technology, Inc., Cambridge, MA.
BATCHFRAC and RATEFRAC are trademarks of Koch Engineering Company, Inc.
All other brand and product names are trademarks or registered trademarks of their respective companies.
This manual is intended as a guide to using AspenTech's software. This documentation contains AspenTechproprietary and confidential information and may not be disclosed, used, or copied without the prior consent ofAspenTech or as set forth in the applicable license agreement. Users are solely responsible for the proper use of thesoftware and the application of the results obtained.
Although AspenTech has tested the software and reviewed the documentation, the sole warranty for the software maybe found in the applicable license agreement between AspenTech and the user. ASPENTECH MAKES NOWARRANTY OR REPRESENTATION, EITHER EXPRESSED OR IMPLIED, WITH RESPECT TO THISDOCUMENTATION, ITS QUALITY, PERFORMANCE, MERCHANTABILITY, OR FITNESS FOR APARTICULAR PURPOSE.
CorporateAspen Technology, Inc.Ten Canal ParkCambridge, MA 02141-2201USAPhone: (1) (617) 949-1021Toll Free: (1) (888) 996-7001Fax: (1) (617) 949-1724URL: http://www.aspentech.com
DivisionDesign, Simulation and Optimization SystemsAspen Technology, Inc.Ten Canal ParkCambridge, MA 02141-2201USAPhone: (617) 949-1000Fax:(617) 949-1030

Getting Started - Petroleum Contents •••• iii
Contents
About This Manual 1-1Modeling Petroleum Processes with Aspen Plus .............................................................1-2Simulations in this Book ..................................................................................................1-3Using Backup Files ..........................................................................................................1-3Related Documentation ....................................................................................................1-4
Getting Started Guides .........................................................................................1-4Installation Guide .................................................................................................1-4User Guide............................................................................................................1-4
Technical Support ............................................................................................................1-4World Wide Web .................................................................................................1-4Online Technical Support Center .........................................................................1-4Contacting Customer Support ..............................................................................1-5Hours ....................................................................................................................1-5Phone....................................................................................................................1-5Fax........................................................................................................................1-6E-mail ...................................................................................................................1-6
Blending Crude and Petroleum Fractions 2-1Petroleum Process Flowsheet...........................................................................................2-2Starting Aspen Plus ..........................................................................................................2-4
To Start Aspen Plus..............................................................................................2-4To Select the Template Option.............................................................................2-4To Specify the Application Type and Run Type..................................................2-4
Specifying Title and Global Options................................................................................2-5Specifying Components ...................................................................................................2-7Entering Assay Data .........................................................................................................2-8
Specify the Distillation Curve for OIL-1..............................................................2-8Specify the Light Ends Data for OIL-1 ................................................................2-9Specify the API Gravity Data for OIL-1 ..............................................................2-9Specify the Distillation Curve for OIL-2............................................................2-10Specify the Light Ends Data for OIL-2 ..............................................................2-11Specify the API Gravity Data for OIL-2 ............................................................2-11
Blending the Oils............................................................................................................2-13Generating Pseudocomponents ......................................................................................2-14Running the Simulation..................................................................................................2-15Examining Results .........................................................................................................2-15

iv •••• Contents Getting Started - Petroleum
Plotting Distillation Curves............................................................................................2-16To Locate the Curve Data for OIL-1 ..................................................................2-16To Plot the TBP Curve .......................................................................................2-17To Label This Curve for OIL-1 ..........................................................................2-17To Plot the TBP Curve for OIL-2.......................................................................2-18To Add This Curve to the Plot Containing the Curve for OIL-1 .......................2-18To Label This Curve for OIL-2 ..........................................................................2-18To Plot the BLEND Curve .................................................................................2-19To Add This Curve to the Plot ...........................................................................2-19To Label This Curve for MIXOIL......................................................................2-19To Combine Y-Axes ..........................................................................................2-20To Rename the Plot ............................................................................................2-20
Creating a Backup File ...................................................................................................2-21Exiting Aspen Plus .........................................................................................................2-21
Adding a Preflash Tower 3-1Preflash Tower Flowsheet ................................................................................................3-2Starting Aspen Plus ..........................................................................................................3-3Opening an Existing Run .................................................................................................3-3
Opening the Assay Data Analysis Simulation Created in Chapter 2 ...................3-3If Your Saved File blend.bkp Does Not Appear ..................................................3-3If You Did Not Create blend.bkp .........................................................................3-3
Saving a Run Under a New Name....................................................................................3-4Changing the Run Type....................................................................................................3-4Turning Off Automatic Naming of Blocks and Streams..................................................3-4Selecting a Distillation Model..........................................................................................3-5Defining the Graphical Simulation Flowsheet .................................................................3-6
To Choose a Different Icon for the Model ...........................................................3-6Place the Preflash Tower on the Flowsheet..........................................................3-6Place the Streams on the Flowsheet .....................................................................3-7
Specifying Properties .......................................................................................................3-7To Select the BK10 Property Method ..................................................................3-8
Entering Stream Data .......................................................................................................3-9Specifying the Preflash Unit...........................................................................................3-10
Specify Column Configuration ..........................................................................3-10Specify Stream Locations...................................................................................3-11Specify Column Pressure Profile .......................................................................3-11Specify Condenser Temperature ........................................................................3-12Specify Furnace Configuration...........................................................................3-12Create Design Specification ...............................................................................3-12
Modifying Pseudocomponents .......................................................................................3-13Running the Simulation..................................................................................................3-14Examining Simulation Results.......................................................................................3-15
To Examine Summary Results ...........................................................................3-15To Examine Distillate Rate Results ...................................................................3-15

Getting Started - Petroleum Contents •••• v
To Examine the Temperature Profile .................................................................3-16Plotting Results ..............................................................................................................3-17
To Plot the Temperature Profile.........................................................................3-17To Plot TBP Curves for PREFLASH Feed and Product Streams......................3-17To Select CDU-FEED and MIXCRUDE as Dependent Variables ....................3-18
Exiting Aspen Plus .........................................................................................................3-19
Adding an Atmospheric Crude Distillation Unit 4-1Atmospheric Crude Distillation Unit Flowsheet..............................................................4-2Starting Aspen Plus ..........................................................................................................4-4Opening an Existing Run .................................................................................................4-4
If You Saved the Preflash Flowsheet Simulation Created in Chapter 3...............4-4If Your Saved File preflash.bkp Does Not Appear ..............................................4-4Opening the Backup File preflash.bkp in the Examples Folder...........................4-4
Saving a Run Under a New Name....................................................................................4-5To Update the Title for This Run .........................................................................4-5
Adding the Crude Distillation Unit to the Flowsheet.......................................................4-5To Make Space for the New Tower .....................................................................4-5To Place and Connect the Distillation Unit on the Flowsheet .............................4-5To Connect to the Preflash Block Already on the Flowsheet ..............................4-6To Connect Other Streams ...................................................................................4-6
Specifying Steam Feeds to the Tower ..............................................................................4-7Specifying the Atmospheric Tower..................................................................................4-9
Specify the Main Column.....................................................................................4-9Specify the Side Strippers ..................................................................................4-11Specify the Pumparounds...................................................................................4-13Enter Design Specifications ...............................................................................4-14
Running the Simulation..................................................................................................4-18Examining Simulation Results.......................................................................................4-18
To Examine Furnace Duty Results.....................................................................4-18To Examine Pumparound Return Temperatures ................................................4-19
Examining the Product Streams .....................................................................................4-19To Review the Stream Results for the Crude Tower Products...........................4-19To Examine the Results for the Five Product Streams.......................................4-20To Examine the 5% and 95% Cutpoints and Product Yields.............................4-20
Plotting Distillation Curves............................................................................................4-20To Plot the Curves for the Product Streams.......................................................4-20
Exiting Aspen Plus .........................................................................................................4-22
Adding A Vacuum Unit 5-1Vacuum Unit Flowsheet...................................................................................................5-2Starting Aspen Plus ..........................................................................................................5-3Opening an Existing Run .................................................................................................5-3
If You Saved the Crude Flowsheet from Chapter 4 .............................................5-3If Your Saved File crude.bkp Does Not Appear ..................................................5-3

vi •••• Contents Getting Started - Petroleum
Opening the Backup File preflash.bkp in the Examples Folder...........................5-3Saving a Run Under a New Name....................................................................................5-4
To Update the Title for This Run .........................................................................5-4Adding a Vacuum Tower to the Flowsheet......................................................................5-5
To Make Space for the New Tower .....................................................................5-5To Place and Connect the Distillation Unit on the Flowsheet .............................5-5To Connect the Distillation Unit to the Crude Block...........................................5-5
Specifying the Steam Feed ...............................................................................................5-7Specifying the Vacuum Unit ............................................................................................5-8
Specify the Basic Column Configuration.............................................................5-8Specify the Pumparounds...................................................................................5-10Enter Design Specification.................................................................................5-11
Running the Simulation..................................................................................................5-12Examining Simulation Results.......................................................................................5-12
To Examine Column Profiles.............................................................................5-13To Examine Pumparound Results ......................................................................5-13
Plotting Distillation Curves............................................................................................5-14To Plot TBP Curves ...........................................................................................5-14
Examining Stream Results .............................................................................................5-15Exiting Aspen Plus .........................................................................................................5-16
Displaying Petroleum Stream Properties 6-1Starting Aspen Plus ..........................................................................................................6-2Opening an Existing Run .................................................................................................6-2
If You Saved the Simulation Created in Chapter 5 ..............................................6-2If Your Saved File vacuum.bkp Does Not Appear...............................................6-2Opening the Backup File preflash.bkp in the Examples Folder...........................6-2
Saving a Run Under a New Name....................................................................................6-3To Update the Title for This Run .........................................................................6-3
Adding Sulfur Content Data.............................................................................................6-3To Enter Sulfur Content for OIL-1.......................................................................6-3To Enter Sulfur Content for OIL-2.......................................................................6-4
Selecting Options for the Sulfur Property ........................................................................6-5Adding the Sulfur Property ..............................................................................................6-6
To Create the Property Set ...................................................................................6-6To Add the Property Set to the Stream Property List...........................................6-8
Running the Simulation....................................................................................................6-9Examining Results ...........................................................................................................6-9Leaving Aspen Plus........................................................................................................6-10
Connecting to the Aspen Plus Simulation Engine 7-1

Getting Started - Petroleum About This Manual •••• 1-1
About This Manual
Aspen Plus is a powerful tool that allows you to easily modelpetroleum processes. Use this book to learn the basics of how tobuild and run a process model of a simplified crude fractionationtrain. After completing the five simulations in this guide, you willbe able to perform basic simulations of petroleum processes.
This manual assumes you have:• Installed the Aspen Plus simulation engine and user interface.• Completed the tutorial simulations in Getting Started Building
and Running a Process Model, so that you are familiar with thebasics of how to use Aspen Plus.

1-2 •••• About This Manual Getting Started - Petroleum
Modeling Petroleum Processes withAspen PlusPetroleum refining processes are highly complex and integrated.They have unique characteristics that set them apart from otherchemical processes, including:• Process feedstocks, which consist of complex and wide-boiling
mixtures of hydrocarbons, whose exact compositions areunknown
• Highly-coupled and heat-integrated fractionation units, used toseparate feedstocks into a variety of products with differentspecifications
• Open steam and cooling water for stripping and heat recovery,giving rise to the presence of two liquid phases throughout therefining process
• Degree of separation specified in terms of distillationtemperatures, gaps, overlaps, and other properties
• Product specifications given in terms of stream properties suchas flash point, pour point, sulfur content, metal contents, andoctane number
Aspen Plus provides special features to handle the uniquecharacteristics of petroleum refining applications. With AspenPlus, develop a simulation model of your petroleum process, thenuse this model to study alternative modes of operation or optimizethe existing operation.
This manual guides you through some of the key petroleumfeatures in Aspen Plus. You can use these features with the widerange of other Aspen Plus capabilities, such as estimating andregressing physical properties, fitting plant data to simulationmodels, and optimizing your process.

Getting Started - Petroleum About This Manual •••• 1-3
Simulations in this BookThis book guides you in building a flowsheet that describes a crudefractionation train in a petroleum refinery. Each chapter contains atutorial simulation that builds one block of the flowsheet.Complete the entire flowsheet by following each chapter insuccession.
This book includes the following hands-on simulations:Complete this chapter To learn how to
2 Blending Crude andPetroleum Fractions
Define components, enter assay data for twocrude oils, and blend the crude oils into asingle process feed.
3 Adding a Preflash Tower Model a preflash tower.4 Adding an AtmosphericCrude Distillation Unit
Model a crude atmospheric unit.
5 Adding a Vacuum Unit Model a vacuum unit.6 Displaying PetroleumProperties
Use petroleum properties with your simulationmodel to obtain information about the process.
Using Backup FilesWe recommend that you perform all simulations sequentially inorder to build the entire model. However, skip chapters and workon the simulation of your choice, using backup files containingsimulation data.
Aspen Plus provides backup files containing all problemspecifications and results for each tutorial simulation. If you skip asimulation, you might need to load a backup file to supply missingdata. The chapter describes how to do this. If you perform eachtutorial simulation in order, use backup files to compare yourresults.

1-4 •••• About This Manual Getting Started - Petroleum
Related DocumentationIn addition to this document, a number of other documents areprovided to help users learn and use Aspen Plus. Thedocumentation set consists of the following:
Aspen Plus Getting Started Building and Running a Process Model
Aspen Plus Getting Started Modeling Processes with Solids
Aspen Plus Getting Started Modeling Processes with Electrolytes
Aspen Plus Getting Started Using Equation-Oriented Modeling
Aspen Plus Getting Started Customizing Unit Operation Models
AES Installation Manual
Aspen Plus User Guide
Technical SupportFor additional information about AspenTech products and services,visit the AspenTech World Wide Web homepage on the Internet at:
http://www.aspentech.com/
AspenTech customers with a valid license and softwaremaintenance agreement can register to access the OnlineTechnical Support Center at:
http://support.aspentech.com/
This web support site allows you to:• Access current product documentation• Search for tech tips, solutions and frequently asked questions
(FAQs)• Search for and download application examples• Submit and track technical issues• Send suggestions• Report product defects• Review lists of known deficiencies and defects
Registered users can also subscribe to our Technical Support e-Bulletins. These e-Bulletins are used to proactively alert users toimportant technical support information such as:• Technical advisories• Product updates and Service Pack announcements
Getting StartedGuides
Installation GuideUser Guide
World Wide Web
Online TechnicalSupport Center

Getting Started - Petroleum About This Manual •••• 1-5
Customer support is also available by phone, fax, and email forcustomers with a current support contract for this product. For themost up-to-date phone listings, please see the Online TechnicalSupport Center at http://support.aspentech.com.
Support Centers Operating Hours
North America 8:00 – 20:00 Eastern TimeSouth America 9:00 – 17:00 Local timeEurope 8:30 – 18:00 Central European timeAsia and Pacific Region 9:00 – 17:30 Local time
SupportCenters
Phone Numbers
1-888-996-7100 Toll-free from U.S., Canada, Mexico1-281-584-4357 North America Support Center
NorthAmerica
(52) (5) 536-2809 Mexico Support Center(54) (11) 4361-7220 Argentina Support Center(55) (11) 5012-0321 Brazil Support Center(0800) 333-0125 Toll-free to U.S. from Argentina(000) (814) 550-4084 Toll-free to U.S. from Brazil
SouthAmerica
8001-2410 Toll-free to U.S. from Venezuela(32) (2) 701-95-55 European Support CenterCountry specific toll-free numbers:Belgium (0800) 40-687Denmark 8088-3652Finland (0) (800) 1-19127France (0805) 11-0054Ireland (1) (800) 930-024Netherlands (0800) 023-2511Norway (800) 13817Spain (900) 951846Sweden (0200) 895-284Switzerland (0800) 111-470
Europe
UK (0800) 376-7903(65) 395-39-00 SingaporeAsia and
PacificRegion
(81) (3) 3262-1743 Tokyo
Contacting CustomerSupport
Hours
Phone
1-6 •••• About This Manual Getting Started - Petroleum
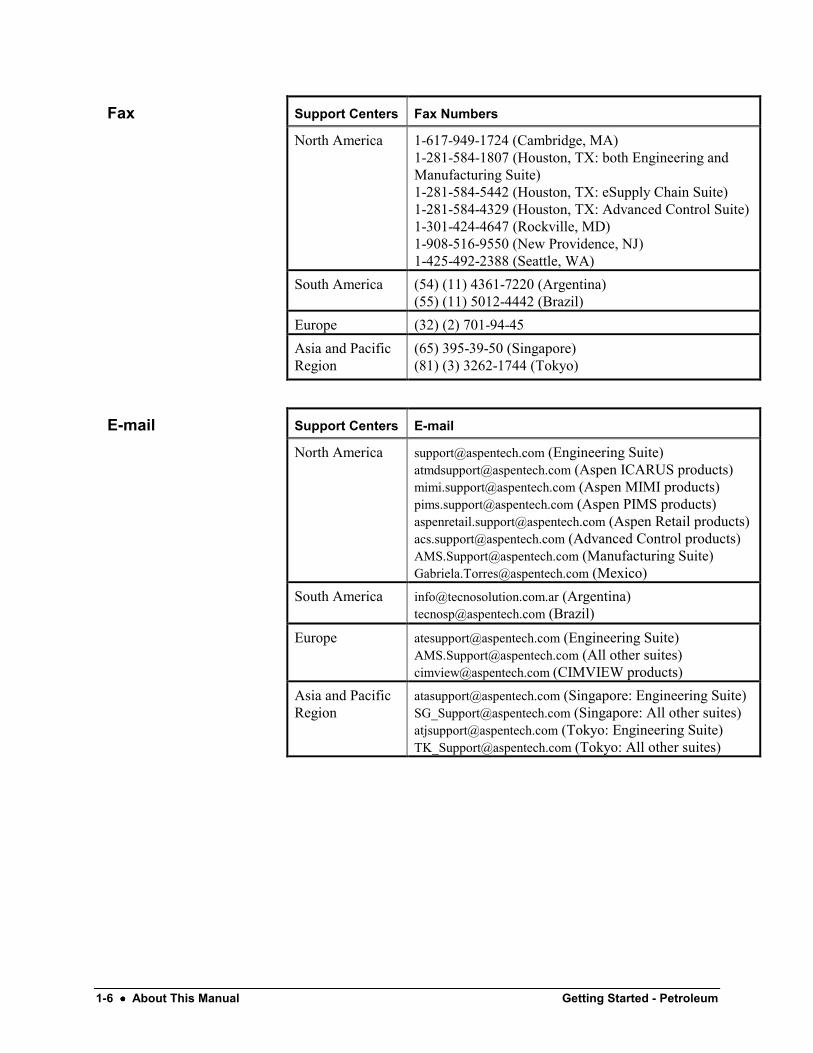
Support Centers Fax Numbers
North America 1-617-949-1724 (Cambridge, MA)1-281-584-1807 (Houston, TX: both Engineering andManufacturing Suite)1-281-584-5442 (Houston, TX: eSupply Chain Suite)1-281-584-4329 (Houston, TX: Advanced Control Suite)1-301-424-4647 (Rockville, MD)1-908-516-9550 (New Providence, NJ)1-425-492-2388 (Seattle, WA)
South America (54) (11) 4361-7220 (Argentina)(55) (11) 5012-4442 (Brazil)
Europe (32) (2) 701-94-45Asia and PacificRegion
(65) 395-39-50 (Singapore)(81) (3) 3262-1744 (Tokyo)
Support Centers E-mail
North America [email protected] (Engineering Suite)[email protected] (Aspen ICARUS products)[email protected] (Aspen MIMI products)[email protected] (Aspen PIMS products)[email protected] (Aspen Retail products)[email protected] (Advanced Control products)[email protected] (Manufacturing Suite)[email protected] (Mexico)
South America [email protected] (Argentina)[email protected] (Brazil)
Europe [email protected] (Engineering Suite)[email protected] (All other suites)[email protected] (CIMVIEW products)
Asia and PacificRegion
[email protected] (Singapore: Engineering Suite)[email protected] (Singapore: All other suites)[email protected] (Tokyo: Engineering Suite)[email protected] (Tokyo: All other suites)
Fax

Getting Started - Petroleum Blending Crude and Petroleum Fractions •••• 2-1
Blending Crude and PetroleumFractions
This tutorial contains five simulations to guide you through theprocess of building a model of a crude fractionation train typicallyfound in a petroleum refinery.
In this first simulation, begin building the model by defining thecrude feed to the process, using the Aspen Plus Assay DataAnalysis Run Type. Use this run type to analyze petroleum crudesbefore running a flowsheet simulation.
In this simulation you will:• Define components• Enter assay data for two crude oils• Blend the crude oils to produce the crude feed• Generate pseudocomponents for the blend• Run the Assay Data Analysis calculations• Examine results
Allow about 45 minutes to complete this simulation.

2-2 •••• Blending Crude and Petroleum Fractions Getting Started - Petroleum
Petroleum Process FlowsheetThe following illustration shows the petroleum process flowsheetyou will work with throughout this book:
Problem Definition: Crude Fractionation Train
The process consists of the following steps:1 The process feed (MIXCRUDE), consisting of a blend of two
crude oils (OIL-1 and OIL-2; see Tables 2.1 and 2.2), goes tothe preflash furnace.
2 The preflash tower (PREFLASH) removes light gases andsome naphtha from the partially vaporized feed.
3 Preflash bottoms (CDU-FEED) are further processed in thecrude distillation unit (CDU). The CDU consists of a crude unitfurnace and an atmospheric tower. First, the crude unit furnacepartially vaporizes the bottoms from the preflash. Then theatmospheric tower separates the preflash bottoms into five cuts:• Heavy naphtha (HNAPHTHA)• Kerosene (KEROSENE)• Diesel (DIESEL)• Atmospheric gas oil (AGO)• Reduced crude (RED-CRD)

Getting Started - Petroleum Blending Crude and Petroleum Fractions •••• 2-3
4 Reduced crude goes to the vacuum distillation unit (VDU) forfurther fractionation under vacuum conditions. The VDUconsists of a vacuum unit furnace and vacuum tower. Thevacuum tower produces the following additional cuts:• Overhead (OFF-GAS)• Light vacuum gas oil (LVGO)• Heavy vacuum gas oil (HVGO)• Asphaltic residue (RESIDUE)
TBP Distillation Light Ends Analysis API Gravity Curve
Liq. Vol. % Temp. (F) Component Liq. Vol.Frac.
Mid. Vol. % Gravity
6.8 130.0 Methane 0.001 5.0 90.010.0 180.0 Ethane 0.0015 10.0 68.030.0 418.0 Propane 0.009 15.0 59.750.0 650.0 Isobutane 0.004 20.0 52.062.0 800.0 N-Butane 0.016 30.0 42.070.0 903.0 2-Methyl-
Butane0.012 40.0 35.0
76.0 1000.0 N-Pentane 0.017 45.0 32.090.0 1255.0 50.0 28.5
60.0 23.070.0 18.080.0 13.5
Table 2.1OIL-1: (API = 31.4)

2-4 •••• Blending Crude and Petroleum Fractions Getting Started - Petroleum
TBP Distillation Light Ends Analysis API Gravity Curve
Liq. Vol. % Temp. (F) Component Liq. Vol.Frac.
Mid. Vol. % Gravity
6.5 120.0 Water 0.001 2.0 150.010.0 200.0 Methane 0.002 5.0 95.020.0 300.0 Ethane 0.005 10.0 65.030.0 400.0 Propane 0.005 20.0 45.040.0 470.0 Isobutane 0.01 30.0 40.050.0 550.0 N-Butane 0.01 40.0 38.060.0 650.0 2-Methyl-
Butane0.005 50.0 33.0
70.0 750.0 N-Pentane 0.025 60.0 30.080.0 850.0 70.0 25.090.0 1100.0 80.0 20.095.0 1300.0 90.0 15.098.0 1475.0 95.0 10.0100.0 1670.0 98.0 5.0
Starting Aspen Plus1 From your desktop, select Start and then select Programs.2 Select AspenTech | Aspen Engineering Suite | Aspen Plus
11.1 | Aspen Plus User Interface.The Aspen Plus Startup dialog box appears. Aspen Plusdisplays a dialog box whenever you must enter information ormake a selection before proceeding. In this simulation, use anAspen Plus template.
3 Select the Template option and click OK.The New dialog box appears.Specify the Application Type and the Run Type for the newrun. Aspen Plus uses the Application Type you choose toautomatically set various defaults appropriate to yourapplication. For this simulation, use the Petroleum with EnglishUnits template and the Assay Data Analysis Run Type.
4 Select the Petroleum with English Units template.
5 Click in the Run Type field to display the available runtypes.
Table 2.2OIL-2: (API = 34.8)
To Start Aspen Plus
To Select theTemplate Option
To Specify theApplication Type andRun Type

Getting Started - Petroleum Blending Crude and Petroleum Fractions •••• 2-5
6 Select Assay Data Analysis to specify an Assay DataAnalysis/PCS run.
7 Click OK to apply these options.
Note: If the Connect to Engine dialog box appears, see Chapter 7.
Wait a few seconds while Aspen Plus starts.The Aspen Plus graphical workspace is shaded because you donot use a graphical simulation flowsheet in specifying an AssayData Analysis run.Use the Aspen Plus expert guidance Next function to take youto the next required input specification.
8 In the toolbar, click .The Setup | Specifications | Global sheet appears.
Specifying Title and Global OptionsThe Setup | Specifications | Global sheet displays the defaultsAspen Plus uses for other forms. Use this sheet to:• Specify a title for your simulation• Review the global settings that were set when you selected the
Petroleum with English Units application type
Note: The run type Assay Data Analysis is already selected. Youdo not need to change this field.
It is always good practice to describe your simulation by entering atitle for the simulation.1 In the Title field, enter Getting Started With Petroleum --
Simulation 1.Since you chose the Petroleum with English Units applicationtype when you started this simulation, Aspen Plus has set thefollowing global defaults for input specifications:• ENGPETRO units (English Engineering units appropriate
for Petroleum applications, such as volume flow in barrelsper day)
• StdVol flow basis for all flow inputs• Free-water calculations

2-6 •••• Blending Crude and Petroleum Fractions Getting Started - Petroleum
The sheet is complete, and all the defaults set by the Petroleumwith English Units application type are appropriate for thissimulation:
2 Click to continue.The Components | Specifications | Selection sheet appears.

Getting Started - Petroleum Blending Crude and Petroleum Fractions •••• 2-7
Specifying ComponentsUse the Components Specifications Selection sheet to specifycomponents for the simulation.1 Enter the following component IDs and component names:
Component ID Component Name
H2O WATERC1 METHANEC2 ETHANEC3 PROPANEIC4 ISOBUTANENC4 N-BUTANEIC5 2-METHYL-BUTANENC5 N-PENTANE
You will also define two crude assays, OIL-1 and OIL-2.2 In the next Component ID field, enter OIL-1.
3 In the Type field for OIL-1, click and select Assay.4 In the next Component ID field, enter OIL-2 and identify it as
an Assay, in the same way as you did for OIL-1.The Components Specifications sheet is complete:
5 Click to continue.The Components | Assay/Blend | OIL-1 | Basic Data | DistCurve sheet appears.

2-8 •••• Blending Crude and Petroleum Fractions Getting Started - Petroleum
Entering Assay DataOn the Dist Curve sheet, enter the laboratory assay data for OIL-1(Table 2.1).
1 In the Distillation curve type field, click and select Trueboiling point (liquid volume basis).
Note: Select True boiling point to indicate that you are enteringdata for a TBP curve on a standard liquid volume basis.
2 In the Bulk gravity value area, select the API gravity option.3 In the API gravity field, enter 31.4.4 In the Percent Distilled and Temperature columns, enter the
following TBP distillation values for OIL-1:Percent Distilled Temperature F
6.8 13010.0 18030.0 41850.0 65062.0 80070.0 90376.0 100090.0 1255
The Components | Assay/Blend | OIL-1 | Basic Data | DistCurve sheet is complete:
Specify theDistillation Curve forOIL-1

Getting Started - Petroleum Blending Crude and Petroleum Fractions •••• 2-9
5 Select the Light Ends sheet.Use this sheet to enter light ends analysis data, given as afraction of the assay mixture.
6 In the Component and Fraction (StdVol) fields, enter thefollowing light ends analysis data:Component Fraction StdVol
C1 0.001C2 0.0015C3 0.009IC4 0.004NC4 0.016IC5 0.012NC5 0.017
The OIL-1 | Basic Data | Light Ends sheet is complete:
7 Select the Gravity/UOPK sheet.The OIL-1 | Basic Data | Gravity/UOPK sheet appears.
8 In the Type field, select the API gravity option.
Specify the LightEnds Data for OIL-1
Specify the APIGravity Data for OIL-1

2-10 •••• Blending Crude and Petroleum Fractions Getting Started - Petroleum
9 In the Mid percent distilled and API gravity fields, enter thefollowing API gravity curve data:Mid Percent Distilled API Gravity
5.0 90.010.0 68.015.0 59.720.0 52.030.0 42.040.0 35.045.0 32.050.0 28.560.0 23.070.0 18.080.0 13.5
The OIL-1 | Basic Data | Gravity/UOPK sheet is complete:
10 Click to continue.The OIL-2 | Basic Data | Dist Curve sheet appears.
1 In the Distillation Curve Type field, click and select Trueboiling point (liquid volume basis).
2 In the Bulk gravity value field, select the API gravity option.3 In the API gravity field, enter 34.8.
Specify theDistillation Curve forOIL-2

Getting Started - Petroleum Blending Crude and Petroleum Fractions •••• 2-11
4 In the Percent distilled and Temperature fields, enter thefollowing TBP distillation values:Percent Distilled Temperature F
6.5 120.010.0 200.020.0 300.030.0 400.040.0 470.050.0 550.060.0 650.070.0 750.080.0 850.090.0 1100.095.0 1300.098.0 1475.0100.0 1670.0
The OIL-2 | Basic Data | Dist Curve sheet is complete.5 Select the Light Ends sheet.
The OIL-2 | Basic Data | Light Ends sheet appears.6 In the Component and Fraction (StdVol) fields, enter the
following light ends analysis data:Component Fraction StdVol
H2O 0.001C1 0.002C2 0.005C3 0.005IC4 0.01NC4 0.01IC5 0.005NC5 0.025
The OIL-2 | Basic Data | Light Ends sheet is complete.7 Select the Gravity/UOPK sheet.
The OIL-2 | Basic Data | Gravity/UOPK sheet appears.8 In the Type field, select the API gravity option.
Specify the LightEnds Data for OIL-2
Specify the APIGravity Data for OIL-2

2-12 •••• Blending Crude and Petroleum Fractions Getting Started - Petroleum
9 In the Mid percent distilled and API gravity fields, enter thefollowing API gravity curve data:Mid percent Distilled API gravity
2.0 150.05.0 95.010.0 65.020.0 45.030.0 40.040.0 38.050.0 33.060.0 30.070.0 25.080.0 20.090.0 15.095.0 10.098.0 5.0
The OIL-2 | Basic Data | Gravity/UOPK sheet is complete.
10 Click to continue.The Required ADA/PCS Input Complete dialog box appears.

Getting Started - Petroleum Blending Crude and Petroleum Fractions •••• 2-13
Blending the Oils1 On the Required ADA/PCS Input Complete dialog box,
select Modify assay/blend specifications and click OK.The Components | Assay/Blend object manager appears.
2 Click New.The Create new ID dialog box appears.
3 In the Enter ID field, enter MIXOIL.
4 In the Select type field, click and select BLEND.5 Click OK.
The Components | Assay/Blend | MIXOIL | Mixture |Specifications sheet appears. Use this sheet to define thefractions for each crude oil in the blend.
6 In the Assay ID column, click and select OIL-1.7 In the Fraction (StdVol) field, enter 0.20.
8 In the next row of the Assay ID column, click and selectOIL-2.
9 In the Fraction (StdVol) field, enter 0.80.The MIXOIL | Mixture | Specifications sheet is complete:
10 Click to continue.The Required ADA/PCS Input Complete dialog box appears.

2-14 •••• Blending Crude and Petroleum Fractions Getting Started - Petroleum
Generating PseudocomponentsBy default, Aspen Plus generates a set of pseudocomponents foryour simulation based on all the assays and blends in yoursimulation. However, in this simulation, the pseudocomponentsshould be based on the blend only.1 From the Required ADA/PCS Input Complete dialog box,
select Specify options for generating pseudocomponents andclick OK.The Petro Characterization | Generation object managerappears.
2 Click New.The Create new ID dialog box appears.
3 In the Enter ID field, enter CRUDE and click OK.The Petro Characterization | Generation | CRUDE |Specifications sheet appears.
4 In the Assay/Blend ID field, click and select MIXOIL.
Note: The Weighting factor field automatically updates with theproper value based on the Assay/Blend ID you selected.
The Specifications sheet is complete.
5 Click to continue.The Required ADA/PCS Input Complete dialog box appears.
6 From the Required ADA/PCS Input Complete dialog box,select the default, Go to Next required input step and click OK.

Getting Started - Petroleum Blending Crude and Petroleum Fractions •••• 2-15
The Required Properties Input Complete dialog box appears.7 Click OK.
The Required Assay Data Analysis/PseudocomponentGeneration Input Complete dialog box appears.
Running the SimulationYou have entered the data and specifications for this simulation,and can now run the Assay Data Analysis.1 In the Required Assay Data Analysis/Pseudocomponent
Generation Input Complete dialog box, click OK.The Control Panel window appears. The Control Panel allowsyou to monitor and interact with the Aspen Plus simulationcalculations.As Aspen Plus performs the analysis, status messages displayin the Control Panel. The message Results Available appears inthe status bar at the bottom of the main window.
2 Examine the results of your analysis.
Examining ResultsAn ADA run calculates a wide variety of properties for the assays,blends, and generated pseudocomponents.
For this simulation, review pseudocomponent properties and TBPcurves for the oils and the blend.
1 From the Control Panel, click .The Results Summary | Run Status | Summary sheetappears. It indicates that calculations were completed normally.The main properties for each pseudocomponent appear on theComponents | Petro Characterization | Results | Summarysheet.
2 Use the Data Browser menu tree to navigate to theComponents | Petro Characterization | Results form.The Summary sheet appears.

2-16 •••• Blending Crude and Petroleum Fractions Getting Started - Petroleum
3 Use the horizontal and vertical scrollbars at the bottom andright of the sheet to scroll through the component properties.
Plotting Distillation CurvesPlot the TBP curves for the blend and each crude oil in a singleplot. The results for each assay or blend appear on theComponents | Assay/Blend | assay/blend name | Results sheet.1 Use the Data Browser menu tree to navigate to the
Components | Assay/Blend | OIL-1 | Results formThe Light Ends Analysis sheet appears.
To Locate the CurveData for OIL-1

Getting Started - Petroleum Blending Crude and Petroleum Fractions •••• 2-17
2 Select the Curves sheet.The Curves sheet for OIL-1 appears.
3 Select the Percent distilled column.4 From the Aspen Plus menu bar, select Plot | X-Axis Variable.5 Select the True boiling pt. (liquid volume) column.6 From the Aspen Plus menu bar, select Plot | Y-Axis Variable.7 From the Aspen Plus menu bar, select Plot | Display Plot.
The Components Assay/Blend Oil-1 Results Curves - Plotwindow appears.
8 Double-click the legend box.The Plot Legend Box dialog box appears.
9 Select True boiling pt (vol). True boiling pt (vol) appears in theLegend Text field.
10 In the Legend Text field, delete True boiling pt (vol) and enterTBP for OIL-1.
11 Click Replace, then click OK.
To Plot the TBPCurve
To Label This Curvefor OIL-1

2-18 •••• Blending Crude and Petroleum Fractions Getting Started - Petroleum
Now that you have plotted and labeled one curve, you can add theother curves to the plot.1 From the Data Browser, open the OIL-2 | Results form, and
select the Curves sheet.The Curves sheet for OIL-2 appears.
2 Select the Percent distilled column.3 From the Aspen Plus menu bar, select Plot | X-Axis Variable.4 Select the True boiling pt. (liquid volume) column.5 From the Aspen Plus menu bar, select Plot | Y-Axis Variable.6 From the Aspen Plus menu bar, select Plot | Add New Curve.
The Plot Window List dialog box appears.7 Select Components Assay/Blend OIL-1 Results Curves, and
click OK.The OIL-2 curve appears on the plot.
8 Double-click the legend box.The Plot Legend Box dialog box appears.
9 Select True boiling pt (vol). True boiling pt (vol) appears in theLegend Text field.
10 In the Legend Text field, delete True boiling pt (vol) and enterTBP for OIL-2.
11 Click Replace, then click OK.
To Plot the TBPCurve for OIL-2
To Add This Curve tothe Plot Containingthe Curve for OIL-1
To Label This Curvefor OIL-2

Getting Started - Petroleum Blending Crude and Petroleum Fractions •••• 2-19
1 In the Data Browser, open the MIXOIL | Results form, andselect the Curves sheet.The MIXOIL | Results | Curves sheet appears.
2 Select the Percent distilled column.3 From the Aspen Plus menu bar, select Plot | X-Axis Variable.4 Select the True boiling pt. (liquid volume) column.5 From the Aspen Plus menu bar, select Plot | Y-Axis Variable.6 From the Aspen Plus menu bar, select Plot | Add New Curve.
The Plot Window List dialog box appears.7 Select Components Assay/Blend OIL-1 Results Curves, and
click OK.The MIXOIL curve appears on the plot.
8 Double-click the legend box.The Plot Legend Box dialog box appears.
9 Select True boiling pt (vol).10 In the Legend Text field, delete True boiling pt (vol) and enter
TBP for Blend.11 Click Replace, then click OK.
To Plot the BLENDCurve
To Add This Curve tothe Plot
To Label This Curvefor MIXOIL

2-20 •••• Blending Crude and Petroleum Fractions Getting Started - Petroleum
Now you have all three curves in one plot window, but there aresome things you can do to make the plot look nicer.1 Double-click on the plot.
The PfsPlot 11.1 Control Properties dialog box appears.2 Select the AxisMap sheet.3 Click All in One and then click OK.4 Double-click the Components Assay/Blend OIL-1 Results
Curves title.The Plot Text Setting dialog box appears.
5 In the Title text field, delete the text and enter TBP Curves forCrude Oils and Blend.
6 Click OK.As the completed plot shows, the TBP curve for the blend isbetween the curves for each oil. Curve locations depend on theproportions of the two oils you define for the blend:
To Combine Y-Axes
To Rename the Plot

Getting Started - Petroleum Blending Crude and Petroleum Fractions •••• 2-21
Creating a Backup FileOnce satisfied with your Assay Data Analysis results, save thissimulation as a backup file. This allows you to use the developedassay data analysis in another Aspen Plus simulation.1 From the Aspen Plus menu bar, select File | Save As.
The Save As dialog box appears.
2 In the Save as type field, click and select Aspen PlusBackup Files (*.bkp).
3 In the File name field, enter BLEND and click Save.
Note: Your working directory appears in the Save in field.
The Aspen Plus dialog box appears and offers you theopportunity to save the simulation as an Aspen Plus Documentfile.
4 Click No.
Exiting Aspen Plus1 From the Aspen Plus menu bar, select File | Exit.
The Aspen Plus dialog box appears.2 Click Yes to save the simulation.
The Aspen Plus dialog box appears and offers you theopportunity to save the simulation as an Aspen Plus Documentfile.
3 Click No.
Note: The Chapter 3 simulation uses this run as the starting point.

2-22 •••• Blending Crude and Petroleum Fractions Getting Started - Petroleum

Getting Started - Petroleum Adding a Preflash Tower •••• 3-1
Adding a Preflash Tower
In this simulation, add a preflash tower to the simulation andspecify options for pseudocomponent generation.
You will:• Define the flowsheet graphically• Specify properties, feed streams, and preflash tower• Modify cuts specifications for pseudocomponents generation• Run the simulation• Examine simulation results
Allow about 45 minutes to complete this simulation.

3-2 •••• Adding a Preflash Tower Getting Started - Petroleum
Preflash Tower FlowsheetFigure 3.1 shows the process flowsheet for this simulation. Theprocess feed, consisting of the oil blend, goes first to the preflashfurnace where it is partially vaporized. The partially vaporized feedthen enters the preflash tower. Model the tower and the furnacesimultaneously with a single PetroFrac block.
Steam feeds to the bottom of the tower. The tower produces a widenaphtha cut as a distillate product.
Figure 3.1 Flowsheet for Preflash Tower
Simulate the tower with 10 theoretical stages, no reboiler, and apartial condenser. The condenser operates at 170 F and 39.7 psia,with a pressure drop of 2 psi. The tower pressure drop is 3 psi.
The tower is stripped with open steam in the bottom. The steamstream is at 400 F and 60 psia, and has a flow rate of 5,000 lb/hr.The furnace operates at a pressure of 50 psia and a temperature of450 F. The distillate rate is estimated at 15,000 bbl/day. Its value ismanipulated to produce a wide naphtha cut with an ASTM 95%temperature of 375 F.

Getting Started - Petroleum Adding a Preflash Tower •••• 3-3
Starting Aspen Plus1 From your desktop, select Start | Programs.2 Select AspenTech | Aspen Engineering Suite | Aspen Plus
11.1 | Aspen Plus User Interface.The Aspen Plus Startup dialog box appears. Aspen Plusdisplays a dialog box whenever you must enter information ormake a selection before proceeding. In this simulation, use anAspen Plus template.
Opening an Existing Run1 In the Aspen Plus Startup dialog box, select the Open an
Existing Simulation option.2 In the list, select blend.bkp and click OK.
1 In the list on the Aspen Plus Startup dialog box, double-clickMore Files.The Open dialog box appears.
2 Navigate to the directory containing your saved blend.bkp file.3 Select blend.bkp from the list of files, and click Open.
If you did not create the assay data analysis simulation in Chapter2, open the backup file blend.bkp in the Examples folder.1 In the list on the Aspen Plus Startup dialog box, double-click
More Files.The Open dialog box appears.
2 Click .By default, the Favorites list contains five folders that areprovided with Aspen Plus.
3 Double-click the Examples folder.4 Select the blend.bkp file, and click Open.
Note: If the Connect to Engine dialog box appears, see Chapter 7.
The Aspen Plus window appears.
Opening the AssayData AnalysisSimulation Created inChapter 2
If Your Saved Fileblend.bkp Does NotAppear
If You Did Not Createblend.bkp

3-4 •••• Adding a Preflash Tower Getting Started - Petroleum
Saving a Run Under a New NameBefore you create a new run adding a preflash tower, create andsave a copy of BLEND with a new Run ID, PREFLASH. Thenmake modifications under this new Run ID.1 From the Aspen Plus menu bar, select File | Save As.
The Save As dialog box appears.2 Select the directory where you want to save the simulation.3 In the File name field, enter PREFLASH.
4 In the Save as type field, click and select Aspen PlusBackup Files (*.bkp).
5 Click Save to save the simulation and continue.The Aspen Plus dialog box appears, asking if you want to savethe simulation as an Aspen Plus Document file.
6 Click No.The current Run ID, PREFLASH, appears in the title bar.
Changing the Run TypeIn Chapter 2, the BLEND run you performed was an Assay DataAnalysis run. In this simulation, perform a flowsheet simulation.First, you need to switch to the Flowsheet run type.1 In the Data Browser, open the Setup | Specifications| Global
sheet.
2 In the Run type field, click and select Flowsheet.3 In the Title field, enter Getting Started With Petroleum --
Simulation 2.The graphics workspace is now active and ready for you tobuild the flowsheet. No more changes to this sheet arenecessary.
Turning Off Automatic Naming ofBlocks and StreamsSince you will enter your own block and stream IDs, turn off thedefault options to create block and stream IDs automatically.1 From the Aspen Plus menu bar, select Tools | Options.
The Options dialog box appears.

Getting Started - Petroleum Adding a Preflash Tower •••• 3-5
2 Select the Flowsheet tab.3 Clear the checkboxes for the Automatically assign block
name with prefix and the Automatically assign stream namewith prefix options.Since you have deselected these options, Aspen Plus willprompt you for block and stream names.
4 Click OK to apply these changes.You are ready to build your flowsheet. Figure 3.1 shows theprocess flow diagram for this simulation. To review how todefine a flowsheet graphically, see Getting Started Buildingand Running a Process Model, Chapter 3.
Selecting a Distillation ModelAspen Plus offers several distillation models. To determine whichis appropriate for the preflash tower, use prompts and online help.1 Close the Data Browser. You are now in the Process
Flowsheet window.2 From the Model Library, select the Columns tab.

3-6 •••• Adding a Preflash Tower Getting Started - Petroleum
The list of available distillation columns appears.3 Select different models within the Model Library and read the
descriptions in the Status bar.From the prompts, it appears that PetroFrac is appropriate forthis petroleum problem. Obtain more extensive information onPetroFrac by reading the online help:
4 Select the PetroFrac model.5 Press F1 on the keyboard.
The Aspen Plus Help window appears, with detailedinformation about the PetroFrac model.
6 Review this information to confirm that PetroFrac is the bestchoice, then close the help window.
Defining the Graphical SimulationFlowsheetNow you will begin to build the process flowsheet by adding thepreflash distillation unit.1 From the Model Library, select the Columns tab.2 From the Columns tab, select PetroFrac (the unit operation
model to place in your process flowsheet).
3 Click next to the PetroFrac block icon to display all thePetroFrac model icons.
4 Move the mouse over the icons to see a name (or label) foreach.
5 Locate the PetroFrac icon PREFL1F in the first row of icons,and select it.
6 From the Columns tab, select the PetroFrac icon and drag it tothe Process Flowsheet window.
7 Release the icon in the desired location within the flowsheet.The Input dialog box appears.
8 In the Enter the Block ID field, enter PREFLASH and clickOK.
To Choose a DifferentIcon for the Model
Place the PreflashTower on theFlowsheet

Getting Started - Petroleum Adding a Preflash Tower •••• 3-7
Connect and name the streams, as shown in Figure 3.1. Use theport names shown below to connect to the appropriate port:Stream Port
MIXCRUDE Main Column FeedPF-STEAM Main Column FeedLIGHTS Vapor Distillate from Main ColumnPF-WATER Condenser Water Decant for Main ColumnNAPHTHA Liquid Distillate from Main ColumnCDU-FEED Bottoms Product from Main Column
9 Click .When you move the mouse to the flowsheet, the stream portsappear.
10 Select the Main Column Feed port and select it to create anew stream.
11 Point to a blank part of the window where you want the feed tooriginate and click.The Input dialog box appears.
12 In the Enter the Stream ID field, enter PF-STEAM and clickOK.
13 For the MIXCRUDE stream, click the feed port and then dragthe mouse to the desired location in front of the feed furnacebefore releasing the button.
14 Create the remaining streams in similar fashion.
15 When all streams are complete, click to continue.The Flowsheet Complete dialog box appears.
16 Click OK.The Properties | Specifications | Global sheet appears.
Specifying PropertiesUse the Properties | Specifications | Global sheet to select thethermodynamic methods used to calculate properties such as K-values, enthalpy, and density. Property methods in Aspen Plus arearranged according to process types. The BK10 property method(Braun K-10 method) is appropriate for most refining applicationsinvolving heavy petroleum fractions and low pressures.
Place the Streams onthe Flowsheet

3-8 •••• Adding a Preflash Tower Getting Started - Petroleum
1 In the Process type field, click and select REFINERY.
2 In the Base method field, and select BK10.Since you selected the Petroleum with English Unitsapplication type in Chapter 2, Aspen Plus selected theappropriate defaults for petroleum applications. Steam Tables(STEAM-TA) is the default method for calculating free-waterphase properties, as shown in the Free-water method field.Aspen Plus also selected Method 2 for the water solubilitydefault, as shown in the Water solubility field. The Watersolubility option controls the method for calculating thesolubility and K-value of water in the hydrocarbon phase.You do not need to change anything else on this sheet.
3 Click to continue.The Required Properties Input Complete dialog box appears.Correct representation of physical properties is essential toprocess modeling. For many simulations, the only physicalproperty specification you must provide is to select an optionset. The Required Properties Input Complete dialog box is areminder that the Aspen Plus physical property system hasmany optional capabilities that you can use to increase theaccuracy of physical property calculations.
4 Click OK.The Streams | MIXCRUDE | Input | Specifications sheetappears.
To Select the BK10Property Method

Getting Started - Petroleum Adding a Preflash Tower •••• 3-9
Entering Stream DataMIXCRUDE is the crude oil blend feed stream to the tower. Entercondition and flow rates for the MIXCRUDE stream.1 In the Temperature field, enter 200.
The default units F (Fahrenheit) are correct for this simulation.2 In the Pressure field, enter 60.
The default units (psi) are correct for this simulation.3 In the Composition section, use the scrollbar to access the
MIXOIL component.4 In the Value column of the MIXOIL component, enter 100000.
The Streams | MIXCRUDE | Input form is complete:
5 Click to continue.The PF-STEAM | Input | Specifications sheet appears. PF-STEAM is the steam feed to the tower.
6 In the Temperature field, enter 400 F.7 In the Pressure field, enter 60 psi.
8 In the Composition section, click and select Mass-Flow.9 In the Value column of the H2O component, enter 5000 lb/hr.
The PF-STEAM | Input | Specifications sheet is complete.
10 Click to continue.

3-10 •••• Adding a Preflash Tower Getting Started - Petroleum
Specifying the Preflash UnitUse the Blocks | PREFLASH | Setup | Configuration sheet toenter configuration and operating specifications for the column,including:
• Number of theoretical stages• Valid phases in the column• Distillate vapor fraction
1 In the Number of stages field, enter 10 for ten theoreticalstages.
2 In the Condenser field, click and select Partial-Vapor-Liquid. This indicates that there is a partial condenser with bothvapor and liquid distillate.In the Reboiler field, the default None-Bottom feed option isappropriate, since the column has no reboiler and there is abottom steam feed.
3 In the Distillate rate field, enter 15000 to specify an estimatefor the distillate rate of 15,000 bbl/day.The distillate rate will be manipulated to achieve aspecification on the ASTM 95% temperature for the naphthaproduct.The PREFLASH | Setup | Configuration sheet is complete:
4 Click to continue.
Specify ColumnConfiguration

Getting Started - Petroleum Adding a Preflash Tower •••• 3-11
The PREFLASH | Setup | Streams sheet appears.Enter feed locations and conventions for the PF-STEAM andMIXCRUDE streams.
5 In the Stage column for PF-STEAM, enter 10.
6 In the Convention column for PF-STEAM, click and selectOn-Stage.
7 In the Stage column for MIXCRUDE, enter 10.
8 In the Convention column for MIXCRUDE, click andselect Furnace to indicate that a furnace is attached to thetower on stage 10. The feed goes to the furnace first.The PREFLASH | Setup | Streams sheet is complete:
9 Click to continue.The PREFLASH | Setup | Pressure sheet appears. On thissheet, enter the column pressure profile, or specify a top stagepressure and a pressure drop or the rest of the column.
10 In the View field, click and select Top/Bottom.11 Enter the following pressure profile data:
Top Stage / Condenser Pressure 39.7 psi
Stage 2 Pressure 41.7 psi
Bottom Stage Pressure 44.7 psi
The PREFLASH Setup Pressure sheet is complete.
12 Click to continue.
Specify StreamLocations
Specify ColumnPressure Profile

3-12 •••• Adding a Preflash Tower Getting Started - Petroleum
The PREFLASH | Setup | Condenser sheet appears.13 Select the Temperature option.14 In the Temperature field, enter a value of 170 F.
The PREFLASH | Setup | Condenser sheet is complete.
15 Click to continue.The PREFLASH | Setup | Furnace sheet appears.
16 Select the Single stage flash option to specify the furnace type.
17 In the Furnace specification field, click and selectFurnace temperature.
18 In the Furnace temperature field, enter 450 F.19 In the Furnace pressure field, enter 50 psi.
These specifications model the furnace as a single-stage flash atthe specified conditions.The PREFLASH | Setup | Furnace sheet is complete:
20 Click to continue.The Required Input Complete dialog box appears.
21 Click Cancel.
Next, you need to set up a design specification for the productquality of the naphtha stream, using the ASTM 95% temperature.Manipulate the distillate rate to achieve this target.1 From the Data Browser, select the PREFLASH | Design Specs
folder.The Design Specs object manager appears.
Specify CondenserTemperature
Specify FurnaceConfiguration
Create DesignSpecification

Getting Started - Petroleum Adding a Preflash Tower •••• 3-13
2 Click New.The Create new ID dialog box appears.
3 In the Create new ID dialog box, click OK to accept thedefault ID of 1.The Design Specs | 1 | Specifications sheet appears.
4 Enter the following information for the naphtha product designspecification:Type ASTM D86 temperature (dry, liquid volume basis)
Target 375 F
Liquid % 95
5 Click to continue.The Design Specs | 1 | Feed/Product Streams sheet appears.
6 From the Available streams column, select the NAPHTHAstream and click to move the stream to the Selectedstream column.
7 Click to continue.The Design Specs | 1 | Vary sheet appears.
8 In the Type field, click and select Distillate flow rate.
9 Click to continue.The Required Input Complete dialog box appears.
10 Click Cancel.
Modifying PseudocomponentsIn Chapter 2, Aspen Plus generated all pseudocomponents usingdefault options. In this simulation, modify the number ofpseudocomponents generated for different temperature ranges.1 From the Data Browser, select the Components | Petro
Characterization | Generation folder.The Generation object manager appears.
2 Select the CRUDE line and then click Edit.The CRUDE | Specifications sheet appears.
3 Select the Cuts sheet.
4 In the Option for cut specifications field, click and selectRange and increments.

3-14 •••• Adding a Preflash Tower Getting Started - Petroleum
5 Enter the following temperature ranges and increments togenerate pseudocomponents for this problem. Note that Lowertemperature is filled in automatically for rows beyond thefirst.Lower temperature Upper temperature Increment
100 800 25800 1200 501200 1400 1001400 1640 120
The CRUDE | Cuts sheet is complete:
6 Click to continue.The Required ADA/PCS Input Complete dialog box appears.
7 Click OK.The Required Input Complete dialog box appears.
Running the Simulation1 From the Required Input Complete dialog box, click OK.
The Control Panel appears.As the run proceeds, status messages appear in the ControlPanel. It takes several seconds for Aspen Plus to process inputspecifications and perform the simulation. When thecalculations finish, the message Results Available appears inthe status bar at the bottom of the main window.
2 Use the vertical scroll bar to see the messages.

Getting Started - Petroleum Adding a Preflash Tower •••• 3-15
3 When the Results Available message appears in the toolbar,click at the top right corner of the Control Panel to close it.
4 From the Data Browser, click to close the Data Browser.5 Examine the results of your run.
Examining Simulation ResultsAspen Plus produces a wide variety of simulation results. In thissimulation examine:• Condenser duty• Distillate rate• Temperature profile• Crude TBP curves
Condenser duty results appear on the PREFLASH ResultsSummary sheet.1 From the Process Flowsheet window, select the PREFLASH
icon.2 Right-click to display the menu and select Results.
The PREFLASH | Results Summary | Summary sheetappears, providing a summary of all condenser and bottomstage results.
Distillate rate results appear on the PREFLASH | Design Specs | 1| Results sheet.3 From the Data Browser, click the + beside the Design Specs
folder and then select 1.
To Examine SummaryResults
To Examine DistillateRate Results

3-16 •••• Adding a Preflash Tower Getting Started - Petroleum
The Design Specs | 1 | Specifications sheet appears.4 Select the Results sheet.
The Results sheet appears, providing the distillate rate valuethat Aspen Plus calculated to satisfy the design specification.
The temperature profile for the column appears on thePREFLASH | Profiles | TPFQ sheet.5 From the Data Browser, select the Blocks | PREFLASH |
Profiles.The PREFLASH | Profiles | TPFQ sheet appears.
To Examine theTemperature Profile

Getting Started - Petroleum Adding a Preflash Tower •••• 3-17
Plotting Results1 From the Aspen Plus menu bar, select Plot | Plot Wizard.
The Plot Wizard Step 1 dialog box appears.
2 Click .The Plot Wizard Step 2 dialog box appears.
3 Select the Temp plot type and click .The Plot Wizard Step 3 dialog box appears.
4 Click .The Plot Wizard Step 4 dialog box appears.
5 Click Finish.The temperature profile plot appears.
6 Follow the same steps to display any other column profile.You may want to close some forms to make space for the newplots.
The true boiling point curves appear on the Stream Results |Vol.% Curves sheet.1 From the Data Browser, select the PREFLASH | Stream
Results form.The PREFLASH | Stream Results | Material sheet appears.
2 Select the Vol.% Curves sheet.
To Plot theTemperature Profile
To Plot TBP Curvesfor PREFLASH Feedand Product Streams

3-18 •••• Adding a Preflash Tower Getting Started - Petroleum
The Stream Results Vol.% Curves sheet appears.
3 Click at the top of the CDU-FEED column to select thecolumn.
4 Use the horizontal scrollbar, if necessary, to locate theMIXCRUDE column.
5 At the same time, press Ctrl and select the MIXCRUDEcolumn to select the column.At this time, both the MIXCRUDE and CDU-FEED columnsshould be highlighted.
6 From the Aspen Plus menu bar, select Plot | Y-Axis Variable.7 Select the Volume % column.8 From the Aspen Plus menu bar, select Plot | X-Axis Variable.9 From the Aspen Plus menu bar, select Plot | Display Plot.
To Select CDU-FEEDand MIXCRUDE asDependent Variables

Getting Started - Petroleum Adding a Preflash Tower •••• 3-19
10 Aspen Plus displays the following plot:
As expected, the preflash tower removes a significant portionof the light material from the process feed. This reduces theload for the subsequent atmospheric crude unit and increasesoverall process capacity.
11 When finished viewing the plot, close the plot window.
Exiting Aspen Plus1 From the Aspen Plus menu bar, select File | Exit.
The Aspen Plus dialog box appears.2 Click Yes to save the simulation.
The Aspen Plus dialog box appears and offers you theopportunity to save the simulation as an Aspen Plus Documentfile.
3 Click No.
The Chapter 4 simulation uses this run as the starting point.

3-20 •••• Adding a Preflash Tower Getting Started - Petroleum

Getting Started - Petroleum Adding an Atmospheric Crude Distillation Unit •••• 4-1
Adding an Atmospheric CrudeDistillation Unit
In this simulation, add an atmospheric crude distillation unit to thesimulation you ran in Chapter 3.
You will:• Add the atmospheric crude distillation unit to the flowsheet.• Specify additional feed streams.• Specify the atmospheric crude distillation unit.• Run the simulation.• Examine the results.
Allow about 45 minutes to complete this simulation.

4-2 •••• Adding an Atmospheric Crude Distillation Unit Getting Started - Petroleum
Atmospheric Crude Distillation UnitFlowsheetFigure 4.1 shows the process flowsheet you are developing in thissimulation. The topped crude from the preflash tower goes first tothe crude furnace, then to the atmospheric tower. Model the crudefurnace and the atmospheric tower units together, using a singlePetroFrac block. This approach enables you to adjust furnacevariables to achieve certain tower specifications, such as theoverflash.
The tower has:• A total condenser• Three coupled side strippers• Two pumparound circuits
Figure 4.1 Process Flowsheet: The Atmospheric Crude Distillation Unit
PetroFrac simulates the furnace and the atmospheric towersimultaneously, as a single unit. The furnace operates at a pressureof 24.18 psia and provides an overflash of 3% in the tower. Thefurnace outlet enters the atmospheric tower on stage 22 of the mainfractionator.
The main fractionator is modeled with 25 equilibrium stages. Theheavy naphtha product flow is estimated at 13,000 bbl/day, and ismanipulated to achieve an ASTM 95% temperature of 375 F. Thecondenser operates at 15.7 psia with a pressure drop of 5 psi. Thetower pressure drop is 4 psi.

Getting Started - Petroleum Adding an Atmospheric Crude Distillation Unit •••• 4-3
The main fractionator has 2 pumparound circuits. The followingtable summarizes the pumparound locations and specifications:Pumparound Location Specifications
1 From stage 8 to 6 Flow: 49,000 bbl/dayDuty: -40 MMBTU/hr
2 From stage 14 to 13 Flow: 11,000 bbl/dayDuty: -15 MMBTU/hr
The crude distillation unit has three sidestrippers. Their locationsand operating specifications are:Stripper Location Specifications
KEROSENE Liquid draw fromstage 6Vapor return to 5
Product rate: 11,700 bbl/daySteam stripping (CU-STM1)4 equilibrium stages
DIESEL Liquid draw fromstage 13Vapor return to 12
Product rate: 16,500 bbl/day(estimate)Steam stripping (CU-STM2)3 equilibrium stages
AGO Liquid draw fromstage 18Vapor return to 17
Product rate: 8,500 bbl/daySteam stripping (CU-STM3)2 equilibrium stages
The diesel flow rate is an estimate only. Manipulate it to achievean ASTM 95% temperature of 640 F for the diesel product.
All sidestrippers and the main fractionator use steam for stripping.The following table summarizes the steam flows and conditions:Stream Location Conditions and Flow
CU-STEAM Main tower 400 F, 60 psia, 12,000 lb/hrCU-STM1 Kerosene stripper 400 F, 60 psia, 3,300 lb/hrCU-STM2 Diesel stripper 400 F, 60 psia, 1,000 lb/hrCU-STM3 AGO stripper 400 F, 60 psia, 800 lb/hr

4-4 •••• Adding an Atmospheric Crude Distillation Unit Getting Started - Petroleum
Starting Aspen Plus1 From your desktop, select Start and then select Programs.2 Select AspenTech, then Aspen Plus 11.0, then Aspen Plus User
Interface.The Aspen Plus Startup dialog box appears. Aspen Plusdisplays a dialog box whenever you must enter information ormake a selection before proceeding.
Opening an Existing Run1 In the Aspen Plus Startup dialog box, select the radio button
next to Open an Existing Simulation.2 In the list, select preflash.bkp and click OK.
1 In the list box, double-click More Files….The Open dialog box appears.
2 Navigate to the directory containing your saved preflash.bkp.3 Select preflash.bkp from the list of files, and click Open.
Note: If you did not create the assay data analysis simulation inChapter 3, you can open the backup file preflash.bkp in theExamples folder.
1 From the Aspen Plus Startup dialog box, select Open anExisting Simulation.
2 Click OK.The Open dialog box appears.
3 Click .
Note: By default, the Favorites list contains five folders that areprovided with Aspen Plus.
4 Double-click the Examples folder.5 Select preflash.bkp and click Open.
Note: If the Connect to Engine dialog box appears, see Chapter 7.
The Aspen Plus window appears. Aspen Plus displays thegraphical flowsheet for the PREFLASH run.
If You Saved thePreflash FlowsheetSimulation Created inChapter 3
If Your Saved Filepreflash.bkp DoesNot Appear
Opening the BackupFile preflash.bkp inthe Examples Folder

Getting Started - Petroleum Adding an Atmospheric Crude Distillation Unit •••• 4-5
Saving a Run Under a New NameBefore creating a new run adding the atmospheric crude unit,create and save a copy of PREFLASH with a new Run ID,CRUDE. Then make modifications under this new Run ID.1 From the Aspen Plus menu bar, select File | Save As.
The Save As dialog box appears.2 Select the directory where you want to save the simulation.3 In the File name field, enter CRUDE.
4 In the Save as type field, click and select Aspen PlusBackup Files (*.bkp).
5 Click Save to save the simulation and continue.The Aspen Plus dialog box appears, asking if you want to savethe simulation as an Aspen Plus Document file.
6 Click No.
The current Run ID, CRUDE now appears in the title bar.1 From the Aspen Plus menu bar, select Data | Setup.
The Setup Specifications sheet appears.2 In the Title field, enter Getting Started with Petroleum --
Simulation 3.3 Close the Data Browser window.
The graphical workspace is now active and ready for you to addto the existing flowsheet.
Adding the Crude Distillation Unit tothe FlowsheetAdd the crude distillation unit to the flowsheet.1 Click and drag around the entire flowsheet.
This creates a region around the entire flowsheet.2 Click and hold the left mouse button within the region and drag
the flowsheet to the left.This makes room for the crude distillation unit, as shown inFigure 4.1.
1 Click the left mouse button outside the region to deactivate it.2 From the Model Library, select the Columns tab.
The list of available distillation columns appears.
To Update the Titlefor This Run
To Make Space forthe New Tower
To Place and Connectthe Distillation Uniton the Flowsheet

4-6 •••• Adding an Atmospheric Crude Distillation Unit Getting Started - Petroleum
3 Click next to the PetroFrac block icon.This displays all the icons available for the PetroFrac model.
4 Move the mouse over the list of icons to see a name (or label)for each.In this exercise, select the CDU10F PetroFrac icon.
5 Press the mouse button on the CDU10F PetroFrac icon, anddrag the icon to the Process Flowsheet window.
6 Release the icon in the desired location.The Input dialog box appears.
7 In the Enter the Block ID field, enter CRUDE and click OK.
1 Select the CDU-FEED stream.2 Right-click and from the menu select Reconnect Destination.3 Point to the Main Column Feed port at the bottom of the
column.4 Click to connect the CDU-FEED stream to the bottom feed
port and drag it to the desired location in front of the feedfurnace before releasing the mouse button.
1 If necessary, select View | Zoom | Zoom Full from the AspenPlus menu bar to display the entire flowsheet.
2 Connect, move, and name the streams as shown in Figure 4.1,using the names and ports in the table below.
Stream ID Port Name
CDU-FEED Main Column Feed (already connected)CU-STEAM Main Column FeedCU-STM1 Stripper Steam FeedsCU-STM2 Stripper Steam FeedsCU-STM3 Stripper Steam FeedsCU-WATER Condenser Water Decant for Main ColumnHNAPHTHA Liquid Distillate from Main ColumnKEROSENE Bottoms Product from StripperDIESEL Bottoms Product from StripperAGO Bottoms Product from StripperRED-CRD Bottoms Product from Main Column
To Connect to thePreflash BlockAlready on theFlowsheet
To Connect OtherStreams

Getting Started - Petroleum Adding an Atmospheric Crude Distillation Unit •••• 4-7
Note: In order to make the streams appear as in Figure 4.1, rotatesome feed icons and move some ports.
• To rotate an icon, select it, then right-click and select RotateIcon from the menu. Then select the appropriate rotation fromthe submenu.
• To move a port, first connect the stream to the port in the port'scurrent location. Then select the block. All the connectedstreams will show a blue or red highlighted line where theyconnect to the block. Click on this line for the stream you wishto move, and drag it to its new location. Zoom in (as above forselecting Zoom Full) if it is difficult to differentiate streams. Inthe figure below, the user is moving the port for stream AGO.
You have finished adding the distillation unit to the flowsheet.
3 Click .The Flowsheet Complete dialog box appears.
4 Click OK.The Streams | CU-STEAM | Input | Specifications sheetappears.
Specifying Steam Feeds to the TowerUse the CU-STEAM | Input | Specifications sheet to enter thespecifications for the steam feed to the main column.1 Enter the following state variable and component flow
specifications:Temperature 400 F
Pressure 60 psi
Composition Mass-Flow lb/hr
Value for H2O 12000 lb/hr

4-8 •••• Adding an Atmospheric Crude Distillation Unit Getting Started - Petroleum
The CU-STEAM | Input | Specifications sheet is complete.
2 Click .The CU-STM1 Input sheet appears.
3 Enter the following state variable and component flowspecifications:Temperature 400 F
Pressure 60 psi
Composition Mass-Flow lb/hr
Value for H2O 3300 lb/hr
4 Click .The CU-STM2 Input sheet appears.
5 Enter the following state variable and component flowspecifications:Temperature 400 F
Pressure 60 psi
Composition Mass-Flow lb/hr
Value for H2O 1000 lb/hr
6 Click .

Getting Started - Petroleum Adding an Atmospheric Crude Distillation Unit •••• 4-9
The CU-STM3 Input sheet appears.7 Enter the following state variable and component flow
specifications:Temperature 400 F
Pressure 60 psi
Composition Mass-Flow lb/hr
Value for H2O 800 lb/hr
You have finished entering steam feed specifications.
8 Click .The Blocks | CRUDE | Setup | Configuration sheet appears.
Specifying the Atmospheric TowerUse the CRUDE | Setup | Configuration sheet to specify the maincolumn configuration.1 Enter the following block configuration information:
Number of stages 25
Condenser Total
Reboiler None-Bottom Feed
Distillate rate 13000 bbl/day
The distillate flow rate is an estimate. This value will bemanipulated to achieve the desired ASTM 95% temperature forthe heavy naphtha stream.
Specify the MainColumn

4-10 •••• Adding an Atmospheric Crude Distillation Unit Getting Started - Petroleum
2 Click .The Blocks | CRUDE | Setup | Streams sheet appears.
3 Enter the following feed locations and conventions:Stage Convention
CDU-FEED 22 FurnaceCU-STEAM 25 On-Stage
The Furnace feed convention attaches a furnace to stage 22.This furnace is solved simultaneously with the mainfractionation column and strippers.
4 Click .The Blocks | CRUDE | Setup | Pressure sheet appears.
5 Enter the following pressures using the Top/Bottom View:Stage 1 / Condenser pressure 15.7 psi
Stage 2 Pressure 20.7 psi
Bottom stage pressure 24.7 psi
6 Click .The Blocks | CRUDE | Setup | Furnace sheet appears.
7 Select the Single stage flash option.8 From the Furnace specification list , select Fractional
overflash.9 Enter a StdVol Fractional overflash of 0.03 and a Furnace
pressure of 24.18 psi.

Getting Started - Petroleum Adding an Atmospheric Crude Distillation Unit •••• 4-11
The Blocks | CRUDE | Setup | Furnace sheet is nowcomplete:
You have completed specifications for the main column.
10 Click .
Note: Because you attached feed and product streams for threeside strippers in the graphical flowsheet, Aspen Plus automaticallyconfigured this block with three side strippers: S-1, S-2, and S-3.
The Blocks | CRUDE | Strippers | S-1 | Setup | Configurationsheet appears.1 Enter the following specifications:
Number of stages 4
Stripper product KEROSENE
Liquid draw 6
Overhead return 5
Stripping steam CU-STM1
Bottom product flow 11700 bbl/day
Specify the SideStrippers

4-12 •••• Adding an Atmospheric Crude Distillation Unit Getting Started - Petroleum
The S-1 | Setup | Configuration sheet is complete:
2 Click .The S-2 | Setup | Configuration sheet appears.
3 Enter the following specifications:Number of stages 3
Stripper product DIESEL
Liquid draw 13
Overhead return 12
Stripping steam CU-STM2
Bottom product flow 16500 bbl/day
The Blocks CRUDE Strippers S-2 Setup sheet is complete:
4 Click .The Blocks CRUDE Strippers S-3 Setup sheet appears.
5 Enter the following specifications:Number of stages 2
Stripper product AGO
Liquid draw 18
Overhead return 17
Stripping steam CU-STM3
Bottom product flow 8500 bbl/day

Getting Started - Petroleum Adding an Atmospheric Crude Distillation Unit •••• 4-13
The Blocks CRUDE Strippers S-3 Setup sheet is complete:
6 Click .The Required Input Complete dialog box appears.
7 Click Cancel.
Now supply specifications for Pumparound 1 and Pumparound 2.1 In the Data Browser, select the Blocks | CRUDE |
Pumparounds folder.The Pumparounds object manager appears.
2 Click New.3 In the Create new ID dialog box, click OK to accept the
default ID, P-1.The Pumparounds | P-1 | Specifications sheet appears.
4 Enter the following specifications for P-1:Draw stage 8
Return stage 6
Drawoff type Partial
StdVol Flow 49000 bbl/day
Heat duty -40.0 MMBtu/hr
To specify the heat duty, you will need to change Temperatureto Heat duty for the second operating specification.The Pumparounds P-1 Specifications sheet is complete:
5 Select the Blocks | CRUDE | Pumparounds folder to reopenthe Pumparounds object manager.
Specify thePumparounds

4-14 •••• Adding an Atmospheric Crude Distillation Unit Getting Started - Petroleum
6 Click New.7 In the Create new ID dialog box, click OK to accept the
default ID, P-2.The Pumparounds | P-2 | Specifications sheet appears.
8 Enter the following specifications for P-2:Draw stage 14
Return stage 13
Drawoff type Partial
StdVol Flow 11000 bbl/day
Heat duty -15.0 MMBtu/hr
9 Click .The Required Input Complete dialog box appears.
10 Click Cancel.
You have completed all required PetroFrac specifications.However, in this simulation, specify two design specifications, theASTM 95% temperature for HNAPHTHA and for DIESEL.1 From the Data Browser, select the Blocks | CRUDE | Design
Specs folder.The Design Specs object manager appears.
2 Click New.3 In the Create new ID dialog box, click OK to accept the
default ID, 1.The Blocks | CRUDE | Design Specs | 1 | Specifications sheetappears.Enter specifications to have PetroFrac manipulate the distillaterate to achieve an ASTM 95% temperature of 375 F forHNAPHTHA:
4 In the Type field, click and select ASTM D86 temperature(dry, liquid volume basis).
5 Enter the following specifications:Target 375 F
Liquid % 95
Enter DesignSpecifications

Getting Started - Petroleum Adding an Atmospheric Crude Distillation Unit •••• 4-15
6 Click .The Blocks | CRUDE | Design Specs | 1 | Feed/ProductStreams sheet appears.
7 From the Available streams column, select the HNAPHTHAstream and click to move the stream to the Selectedstream column.
8 Click .The Blocks | CRUDE | Design Specs | 1 | Vary sheet appears.
9 In the Type field, click and select Distillate flow rate.10 From the Data Browser, select the Blocks | CRUDE | Design
Specs folder to reopen the object manager.

4-16 •••• Adding an Atmospheric Crude Distillation Unit Getting Started - Petroleum
For the second design specification, enter specifications to havePetroFrac manipulate the DIESEL flow rate to reach an ASTM95% temperature of 640 F.The Design Specs Object Manager appears.
11 Click New.12 In the Create new ID dialog box, click OK to accept the
default ID, 2.The Blocks | CRUDE | Design Specs | 2 | Specifications sheetappears.
13 Enter the following specifications:Type ASTM D86 temperature (dry, liquid volume basis)
Target 640 F
Liquid % 95
14 Click .The Blocks | CRUDE | Design Specs | 2 | Feed/ProductStreams sheet appears.
15 From the Available streams column, select the DIESELstream and click to move the stream to the Selectedstream column.

Getting Started - Petroleum Adding an Atmospheric Crude Distillation Unit •••• 4-17
16 Click .The Blocks | CRUDE | Design Specs | 2 | Vary sheet appears.
17 In the Type field, click and select Bottoms flow rate.
18 In the Stripper name field, click and select S-2.The Block CRUDE Design Specs 2 Vary sheet is complete:
You have entered all the specifications for the atmospheric crudetower, without any initial profile estimates for tower temperatures,flow rates, or compositions. Aspen Plus can converge the columnwithout estimates for these variables.
19 In the Aspen Plus window, click .

4-18 •••• Adding an Atmospheric Crude Distillation Unit Getting Started - Petroleum
Running the Simulation1 In the Required Input Complete dialog box, click OK.
The Control Panel appears.As the run proceeds, status messages appear in the ControlPanel. It takes several seconds for Aspen Plus to process inputspecifications and perform the simulation. When thecalculations finish, the message Results Available appears inthe status bar at the bottom of the main window.
2 Use the vertical scrollbar to see the messages.3 When the Results Available message appears in the toolbar,
click at the top right corner of the Control Panel to close it.
4 Click at the top right corner of the Data Browser to close it.5 Examine the results of your run.
Examining Simulation ResultsThis run produces a wide variety of simulation results. In thissimulation examine:• Furnace duty• Pumparound return temperatures• Stream results for the atmospheric tower products• ASTM curves for the tower products
Furnace duty results appear on the CRUDE | Results Summary |Furnace sheet.1 From the Process Flowsheet window, select the CRUDE icon.2 Right-click to display the menu and select Results.
The Blocks | CRUDE | Results Summary | Summary sheetappears.
3 Select the Furnace sheet.
To Examine FurnaceDuty Results

Getting Started - Petroleum Adding an Atmospheric Crude Distillation Unit •••• 4-19
A summary of important furnace results appears:
4 From the Data Browser, select the CRUDE | Pumparoundsfolder.
5 Select the Results sheet.The Pumparounds | Results sheet appears:
Examining the Product Streams1 From the Data Browser, select the Blocks | CRUDE | Stream
Results form.The Blocks | CRUDE | Stream Results | Material sheetappears.
To ExaminePumparound ReturnTemperatures
To Review the StreamResults for the CrudeTower Products

4-20 •••• Adding an Atmospheric Crude Distillation Unit Getting Started - Petroleum
2 In the first column of results, click and selectHNAPHTHA.
3 In the next four columns, click and select KEROSENE,DIESEL, AGO, and RED-CRD.
4 Use the vertical scrollbar to locate *** DRY TOTAL*** andhave it display in the top line.From these results, you can see that the tower produces a largequantity of the diesel cut. By specifying a high ASTM 95%temperature (375 F), you also maximize the amount of heavynaphtha produced.Stream results for the crude tower products appear on theBlocks CRUDE Stream Results Material sheet:
5 Scroll and examine stream information for different products.
Plotting Distillation CurvesNext, examine and plot the ASTM curves for the products. TheASTM curves are on the Stream Results | Vol.% Curves sheet.6 Select the Vol.% Curves sheet.
The CRUDE | Stream Results | Vol.% Curves sheet appears.
7 In the Curve view field, click and select ASTM D86 curve.8 Select the Volume % column.9 From the Aspen Plus menu bar, select Plot | X-Axis Variable.
To Examine theResults for the FiveProduct Streams
To Examine the 5%and 95% Cutpointsand Product Yields
To Plot the Curves forthe Product Streams

Getting Started - Petroleum Adding an Atmospheric Crude Distillation Unit •••• 4-21
10 Select the HNAPHTHA column.11 At the same time, press Ctrl and select the RED-CRD,
KEROSENE, DIESEL, and AGO columns to select thecolumns.
Note: At this time, the HNAPHTHA, RED-CRD, KEROSENE,DIESEL, and AGO columns should be highlighted.
12 From the Aspen Plus menu bar, select Plot | Y-Axis Variable.13 From the Aspen Plus menu bar, select Plot | Display Plot.14 Resize the plot and drag the legend box as desired.
15 When finished viewing the plot, close the plot window.

4-22 •••• Adding an Atmospheric Crude Distillation Unit Getting Started - Petroleum
At this point, simulate other modes of operation, such asmaximizing kerosene production to satisfy a higher demand for jetfuel. Do this by:• Decreasing the ASTM 95% temperature for heavy naphtha to
325 F• Increasing the ASTM 95% temperature for kerosene to about
520 F• Introduce another design specification by manipulating the
kerosene flow rate
The product flow rates resulting from these specifications are:ASTM-D865%Temperature F
ASTM-D8695%Temperature F
Product Flow-Rate(m bbl/day)
HNAPHTHA 166 325 4.7KEROSENE 374 520 20.0DIESEL 502 640 10.9AGO 578 772 8.5RED-CRD 674 1358 35.6
The results show that the kerosene production goes up at theexpense of heavy naphtha and diesel.
Exiting Aspen Plus1 From the Aspen Plus menu bar, select File | Exit.
The Aspen Plus dialog box appears.2 Click Yes to save the simulation.
The Aspen Plus dialog box appears and offers you theopportunity to save the simulation as an Aspen Plus Documentfile.
3 Click No.
The Chapter 5 simulation uses this run as the starting point.

Getting Started - Petroleum Adding A Vacuum Unit •••• 5-1
Adding A Vacuum Unit
In this simulation, build on the simulation from the previoussimulation and install a vacuum unit to complete the processmodel.
You will:• Add a vacuum tower, steam feed, and product streams to the
flowsheet• Specify the steam feed• Specify the vacuum unit• Run the simulation• Examine the results
Allow about 30 minutes to complete this simulation.
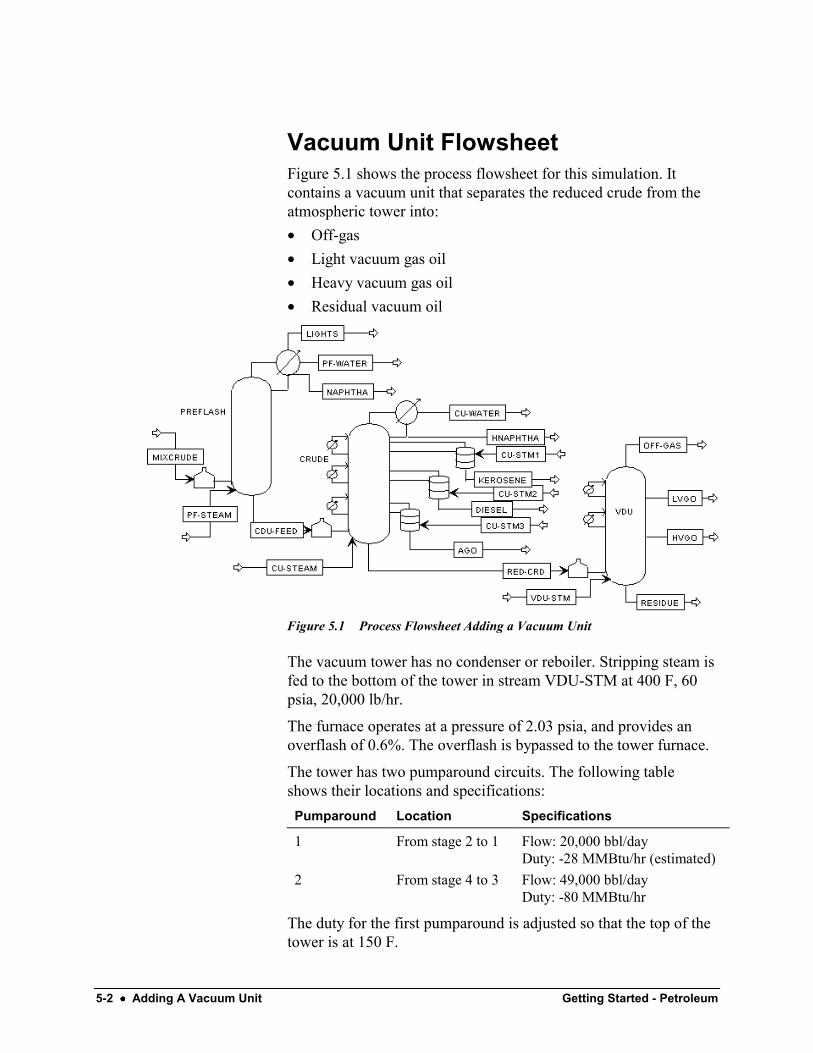
5-2 •••• Adding A Vacuum Unit Getting Started - Petroleum
Vacuum Unit FlowsheetFigure 5.1 shows the process flowsheet for this simulation. Itcontains a vacuum unit that separates the reduced crude from theatmospheric tower into:• Off-gas• Light vacuum gas oil• Heavy vacuum gas oil• Residual vacuum oil
Figure 5.1 Process Flowsheet Adding a Vacuum Unit
The vacuum tower has no condenser or reboiler. Stripping steam isfed to the bottom of the tower in stream VDU-STM at 400 F, 60psia, 20,000 lb/hr.
The furnace operates at a pressure of 2.03 psia, and provides anoverflash of 0.6%. The overflash is bypassed to the tower furnace.
The tower has two pumparound circuits. The following tableshows their locations and specifications:Pumparound Location Specifications
1 From stage 2 to 1 Flow: 20,000 bbl/dayDuty: -28 MMBtu/hr (estimated)
2 From stage 4 to 3 Flow: 49,000 bbl/dayDuty: -80 MMBtu/hr
The duty for the first pumparound is adjusted so that the top of thetower is at 150 F.

Getting Started - Petroleum Adding A Vacuum Unit •••• 5-3
You will model the tower with six equilibrium stages. The lightvacuum gas oil is taken out from stage 2 as a total draw. The flowis estimated at 8,000 bbl/day.
The second pumparound provides all the necessary reflux for thelower section of the tower. The heavy vacuum gas oil is withdrawnfrom stage 4 at 17,000 bbl/day.
Starting Aspen Plus1 From your desktop, select Start and then select Programs.2 Select AspenTech | Aspen Engineering Suite | Aspen Plus
11.1 | Aspen Plus User Interface.The Aspen Plus Startup dialog box appears.
Opening an Existing Run1 Select Open an Existing Simulation.2 In the list, select crude.bkp and click OK.
1 In the list box, double-click More Files.The Open dialog box appears.
2 Navigate to the directory containing your saved crude.bkp.3 Select crude.bkp from the list of files, and click Open.
Note: If you did not create the assay data analysis simulation inChapter 4, you can open the backup file crude.bkp in the Examplesfolder.
1 In the list box, double-click More Files.2 Click OK.
The Open dialog box appears.
3 Click .4 Double-click the Examples folder.5 Select crude.bkp and click Open.
Note: If the Connect to Engine dialog box appears, see Chapter 7.
The Aspen Plus window appears. Aspen Plus displays thegraphical flowsheet for the CRUDE run.
If You Saved theCrude Flowsheetfrom Chapter 4
If Your Saved Filecrude.bkp Does NotAppear
Opening the BackupFile preflash.bkp inthe Examples Folder

5-4 •••• Adding A Vacuum Unit Getting Started - Petroleum
Saving a Run Under a New NameBefore you create a new run adding the vacuum unit, create andsave a copy of CRUDE with a new Run ID, VACUUM. Thenmake modifications under this new Run ID.1 From the Aspen Plus menu bar, select File | Save As.
The Save As dialog box appears.2 Select the directory where you want to save the simulation.3 In the File name field, enter VACUUM.
4 In the Save as type field, click and select Aspen PlusBackup Files (*.bkp).
5 Click Save to save the simulation and continue.The Aspen Plus dialog box appears, asking if you want to savethe simulation as an Aspen Plus Document file.
6 Click No.The current Run ID, VACUUM now appears in the title bar.
1 From the Aspen Plus menu bar, select Data | Setup.The Setup | Specifications | Global sheet appears.
2 In the Title field, enter Getting Started with Petroleum --Simulation 4.
3 Close the Data Browser window.The graphical workspace is now active and ready for you to addto the existing flowsheet.
To Update the Titlefor This Run

Getting Started - Petroleum Adding A Vacuum Unit •••• 5-5
Adding a Vacuum Tower to theFlowsheetYou are ready to add the vacuum tower and steam feed to theflowsheet.1 From the Aspen Plus menu bar, select View | Zoom | Zoom
Full.2 Click and drag a region around the entire flowsheet.3 Press and hold the left mouse button within the region and drag
the flowsheet to the left.
Next, place and connect the vacuum unit on the flowsheet to createthe process flowsheet in Figure 5.1. If you need to review how tocreate a graphical simulation flowsheet, see Getting StartedBuilding and Running a Process Model, Chapter 3.1 From the Model Library, select the Columns tab.
The list of available distillation columns appears.
2 Click next to the PetroFrac block icon.3 Move the mouse over the list of icons to see a name (or label)
for each.4 Select the VACUUM1F PetroFrac icon, and drag the icon to
the Process Flowsheet window as shown in Figure 5.1.5 Release the icon in the desired location.
The Input dialog box appears.6 In the Enter the Block ID field, enter VDU and click OK.7 Select the RED-CRD stream.8 Right-click and from the menu select Reconnect Destination.9 Point to the Main Column Feed port at the bottom of the new
column.10 Click to connect the RED-CRD stream to the bottom feed port
and drag it to the desired location in front of the feed furnacebefore releasing the mouse button.
To Make Space forthe New Tower
To Place and Connectthe Distillation Uniton the Flowsheet
To Connect theDistillation Unit to theCrude Block

5-6 •••• Adding A Vacuum Unit Getting Started - Petroleum
Figure 5.2 The Vacuum Unit
11 Connect, move, and name the other streams as shown in Figure5.2.Use the table below to help you connect to the appropriate port.Stream ID Port Name
RED-CRD Main Column Feed (already connected)VDU-STM Main Column FeedOFF-GAS Vapor Distillate from Main ColumnLVGO Side Product from Main ColumnHVGO Side Product from Main ColumnRESIDUE Bottoms Product from Main Column
You have finished adding the distillation unit to the flowsheet.
12 Click .The Flowsheet Complete dialog box appears.
13 Click OK.The VDU-STM | Input | Specifications sheet appears.

Getting Started - Petroleum Adding A Vacuum Unit •••• 5-7
Specifying the Steam FeedUse the VDU-STM | Input | Specifications sheet to enter thespecifications for the steam feed to the main column.1 Enter the following state variable and component flow
specifications:Temperature 400 F
Pressure 60 psi
Composition Mass-Flow lb/hr
Value for H2O 20000 lb/hr
The VDU-STM | Input | Specifications sheet is complete.
2 Click .The Blocks | VDU | Setup | Configuration sheet appears.

5-8 •••• Adding A Vacuum Unit Getting Started - Petroleum
Specifying the Vacuum UnitUse the VDU | Setup | Configuration sheet to specify the maincolumn configuration.1 Enter the following block configuration information:
Number of stages 6
Condenser None-Top pumparound
Reboiler None-Bottom feed
2 Click .The Blocks VDU Setup Streams sheet appears.
3 Enter the following feed locations and connections:State Convention
RED-CRD 6 FurnaceVDU-STM 6 On-Stage
The Furnace feed convention attaches a furnace to stage 6. Thisfurnace is solved simultaneously with the vacuum tower.
4 Enter the following product location, phase, and ratespecifications:
Stage Phase Flow
LVGO 2 Total liquid 8000 bbl/day (estimate)HVGO 4 Liquid 17000 bbl/day
LVGO is a total liquid draw from stage 2.
Note: The flow rate you enter for LVGO is an estimate only.
The Blocks VDU Setup Streams sheet is complete:
Specify the BasicColumnConfiguration

Getting Started - Petroleum Adding A Vacuum Unit •••• 5-9
5 Click .The Blocks | VDU | Setup | Pressure sheet appears.
6 In the View field, click and select Pressure profile.Specify the pressure profile by entering stage numbers andcorresponding pressures on this sheet.
7 In the Pressure profile section, change the pressure units tommHg.
8 Enter the following values:Stage Pressure (mmHg)
1 606 70
The Blocks | VDU | Setup | Pressure sheet is complete.
9 Click .
The Blocks | VDU | Setup | Furnace sheet appears.10 In the Furnace type section, select the Single stage flash with
liquid runback option.
11 In the Furnace specification section, click and selectFractional overflash.
12 In the Fractional overflash field, enter a StdVol of 0.006.13 In the Furnace pressure field, enter 2.03 psi.
The single stage flash with liquid runback option models thefurnace as a single-stage flash with the overflash from the flashzone now bypassed to the furnace.The Blocks VDU Setup Furnace sheet is complete:
14 Click .

5-10 •••• Adding A Vacuum Unit Getting Started - Petroleum
The VDU | Pumparounds object manager appears.1 Click New.2 In the Create new ID dialog box, click OK to accept the
default ID P-1.The VDU | Pumparounds | P-1 | Specifications sheet appears.
3 Enter the following specifications for P-1:Draw stage 2
Return stage 1
Drawoff type Partial
StdVol Flow 20000 bbl/day
Heat duty -28.6 MMBtu/hr
Change Temperature to Heat duty in the second OperatingSpecification field to enter the heat duty.The VDU | Pumparounds | P-1| Specifications sheet iscomplete:
4 From the Data Browser, select the Pumparounds folder.The VDU | Pumparounds object manager appears.
5 Click New.6 In the Create new ID dialog box, click OK to accept the
default ID P-2.
Specify thePumparounds

Getting Started - Petroleum Adding A Vacuum Unit •••• 5-11
7 Enter the following specifications for P-2:Draw stage 4
Return stage 3
Drawoff type Partial (enter 2 specifications)
StdVol Flow 49000 bbl/day
Heat duty -80.0 MMBtu/hr
The VDU | Pumparounds | P-2 | Specifications sheet iscomplete:
8 Click .The Required Input Complete dialog box appears.
You have completed all required PetroFrac specifications.However, in this simulation you have a design specification–thetemperature specification for the top of the tower.1 Click Cancel.2 From the Data Browser, select the Blocks | VDU | Design
Specs folder.The Blocks | VDU | Design Specs object manager appears.
3 Click New.4 In the Create new ID dialog box, click OK to accept the
default ID 1.The Blocks | VDU | Design Specs | 1 | Specifications sheetappears.
Enter DesignSpecification

5-12 •••• Adding A Vacuum Unit Getting Started - Petroleum
5 Enter the following specifications:Type Stage temperature
Target 150 F
Stage 1
6 Click .The Blocks | VDU | Design Specs | 1 | Vary sheet appears.
7 In the Type field, click and select Pumparound duty.8 In the Pumparound name field, select P-1.
The Blocks | VDU | Design Specs | 1 | Vary sheet is complete.9 Close the Data Browser window.
10 In the Aspen Plus window, click .The Required Input Complete dialog box appears.
Running the Simulation1 In the Required Input Complete dialog box, click OK.
The Control Panel appears.As the run proceeds, status messages appear in the ControlPanel. It takes several seconds for Aspen Plus to process inputspecifications and perform the simulation. When thecalculations finish, the message Results Available in the statusbar at the bottom of the main window.
2 Use the vertical scrollbar to see the messages.3 When the Results Available message appears in the toolbar,
click at the top right corner of the Control Panel to close it.4 Examine the results of your run.
Examining Simulation ResultsThis run produces a wide variety of simulation results. Examinesimulation results for the vacuum tower that include:• Column profiles• Pumparound results• TBP curves• Stream results
Column profiles are on the VDU | Profiles form.

Getting Started - Petroleum Adding A Vacuum Unit •••• 5-13
1 From the Process Flowsheet window, select the VDU icon.2 Right-click to display the menu and select Results.
The Blocks | VDU | Results Summary | Summary sheetappears.
3 From the Data Browser, select the Blocks | VDU | Profilesform.
This sheet shows that the simulation calculated a bottomstemperature above 790 F. If this is higher than you want, youcan reduce the tower pressure in a later simulation case.Lowering the tower pressure also affects the gas oil yield.The pumparound results are on the VDU | Pumparounds |Results sheet.
4 From the Data Browser, select the Blocks | VDU |Pumparounds folder.
5 Select the Results sheet.
To Examine ColumnProfiles
To ExaminePumparound Results

5-14 •••• Adding A Vacuum Unit Getting Started - Petroleum
The Blocks VDU Pumparounds Results sheet appears:
6 Close the window.
Plotting Distillation CurvesNext, plot the TBP curve for streams LVGO, HVGO, andRESIDUE. The True Boiling Point curves appear on the StreamResults | Vol.% Curves sheet.1 From the Data Browser, select the VDU | Stream Results
form.The VDU | Stream Results | Material sheet appears.
2 Select the Vol.% Curves sheet.3 Plot the ASTM curves for streams LVGO, HVGO, and
RESIDUE following the same steps as in Chapter 4, PlottingDistillation Curves.
To Plot TBP Curves

Getting Started - Petroleum Adding A Vacuum Unit •••• 5-15
The simulation shows a good separation between the gas oilsand residue. However, the separation between the light andheavy gas oils is rather sloppy.
4 When finished viewing the plot, close the plot window.
Examining Stream Results1 From the Data Browser, select the VDU | Stream Results |
Material sheet.2 Use the horizontal scrollbar to locate the RESIDUE stream and
review the information accordingly.3 Use the vertical scrollbar to locate API Gravity.4 Use the horizontal scrollbar to locate the LVGO stream and
review the API Gravity information.The calculated value for LVGO product rate is different fromthe specified value of 8000 bbl/day. Since you specified a totaldraw, Aspen Plus treated the specified value as an initial guess.The final value is the one corresponding to the total draw fromthe stage.

5-16 •••• Adding A Vacuum Unit Getting Started - Petroleum
Exiting Aspen Plus1 From the Aspen Plus menu bar, select File | Exit.
The Aspen Plus dialog box appears.2 Click Yes to save the simulation.
The Aspen Plus dialog box appears and offers you theopportunity to save the simulation as an Aspen Plus Documentfile.
3 Click No.
The Chapter 6 simulation uses this run as the starting point.

Getting Started - Petroleum Displaying Petroleum Stream Properties •••• 6-1
Displaying Petroleum StreamProperties
It is important to monitor certain petroleum properties such assulfur content, PNA composition, octane number, flash point,metals content, and pour point when modeling refinery operations.Frequently, operating parameters are adjusted in order to achieve adesired product quality, expressed in terms of these petroleumproperties.
These properties are often available as part of the assay data for acrude feed. Aspen Plus enables you to enter these data as propertycurves. Once you enter these curves, Aspen Plus can calculatethese properties for any flowsheet stream.
Use the calculated stream properties as column specifications,access them in Fortran blocks, use them in optimizationconstraints, and so on.
In this simulation, as an example, include sulfur content in yourmodel.
You will:• Add a sulfur curve for each of the two crude oils• Select options for the property sulfur• Define a property set for the sulfur content• Run the simulation• Examine simulation results
Allow about 30 minutes to complete this simulation.

6-2 •••• Displaying Petroleum Stream Properties Getting Started - Petroleum
Starting Aspen Plus1 From your desktop, select Start and then select Programs.2 Select AspenTech | Aspen Engineering Suite | Aspen Plus
11.1 | Aspen Plus User Interface.The Aspen Plus Startup dialog box appears.
Opening an Existing Run1 In the Aspen Plus Startup dialog box, select Open an
Existing Simulation.2 In the list, select vacuum.bkp and click OK.
1 In the list box, double-click More Files.The Open dialog box appears.
2 Navigate to the directory containing your saved vacuum.bkp.3 Select vacuum.bkp from the list of files, and click Open.
The Aspen Plus window appears.
Note: If you did not create the assay data analysis simulation inChapter 5, you can open the backup file crude.bkp in the Examplesfolder.
1 From the Aspen Plus Startup dialog box, select Open anExisting Simulation.
2 Click OK.The Open dialog box appears.
3 Click .4 Double-click the Examples folder.5 Select vacuum.bkp and click Open.
Note: If the Connect to Engine dialog box appears, see Chapter 7.
The Aspen Plus window appears. Aspen Plus displays thegraphical flowsheet for the VACUUM run.
If You Saved theSimulation Created inChapter 5
If Your Saved Filevacuum.bkp Does NotAppear
Opening the BackupFile preflash.bkp inthe Examples Folder

Getting Started - Petroleum Displaying Petroleum Stream Properties •••• 6-3
Saving a Run Under a New NameBefore you create a new run adding sulfur content specifications,create and save a copy of VACUUM with a new Run ID, PPROP.Then make modifications under this new Run ID.1 From the Aspen Plus menu bar, select File | Save As.
The Save As dialog box appears.2 Select the directory where you want to save the simulation.3 In the File name field, enter PPROP.
4 In the Save as type field, click and select Aspen PlusBackup Files (*.bkp).
5 Click Save to save the simulation and continue.The Aspen Plus dialog box appears, asking if you want to savethe simulation as an Aspen Plus Document file.
6 Click No.The current Run ID, PPROP now appears in the title bar.
1 From the Aspen Plus menu bar, select Data | Setup.The Setup | Specifications | Global sheet appears.
2 In the Title field, enter Getting Started with Petroleum --Simulation 5.
3 Close the Data Browser window.The graphical workspace is now active. However, you will notmodify the flowsheet in this simulation.
Adding Sulfur Content DataIn Chapter 2 you defined and blended two crude oils, OIL-1 andOIL-2. Now enter the sulfur content (in weight percent) of theseoils into your simulation.1 From the Aspen Plus menu bar, select Data | Components.
The Data Browser appears, with the Components folder open.2 Double-click the Components | Assay/Blend folder.3 Double-click the OIL-1 folder.4 Select Property Curves.
The Assay/Blend | OIL-1 | Property Curves | PetroProperties sheet appears.
5 In the Property type field, click and select SULFUR.6 In the Bulk value field, enter 2.3.
To Update the Titlefor This Run
To Enter SulfurContent for OIL-1

6-4 •••• Displaying Petroleum Stream Properties Getting Started - Petroleum
7 In the Mid percent distilled and Property value fields, enterthe following sulfur content percentage values:Mid percent distilled Property value (wt% sulfur)
2.0 0.05.0 0.0110.0 0.01320.0 0.0530.0 1.1540.0 1.6245.0 1.9050.0 2.1560.0 2.5470.0 3.080.0 3.7
The OIL-1 | Property Curves | Petro Properties sheet iscomplete:
1 Double-click the Assay/Blend | OIL-2 folder.2 Select Property Curves.
The Assay/Blend | OIL-2 | Property Curves | PetroProperties sheet appears.
3 In the Property type field, click and select SULFUR.4 In the Bulk value field, enter 2.5.
To Enter SulfurContent for OIL-2

Getting Started - Petroleum Displaying Petroleum Stream Properties •••• 6-5
5 Enter the following sulfur content percentage values:Mid percent distilled Property value (wt% sulfur)
2.0 0.05.0 0.0110.0 0.01520.0 0.05630.0 1.340.0 1.745.0 2.050.0 2.360.0 2.770.0 3.280.0 3.8
The OIL-2 | Property Curves | Petro Properties sheet iscomplete.
Selecting Options for the SulfurPropertyFor a petroleum property, select calculation options such as theblending and extrapolation methods.1 From the Data Browser, double-click the Components | Petro
Characterization folder.2 Select the Analysis Options sheet.
The Petro Characterization | Analysis Options | AssayProcedures sheet appears.
3 Select the Blend Options sheet.4 In the first Property field select SULFUR.5 In the first Blend method field select Mass.
By default, Aspen Plus extrapolates to the 0 and 100% points ifthese values are missing from the curve.

6-6 •••• Displaying Petroleum Stream Properties Getting Started - Petroleum
The Petro Characterization | Analysis Options | BlendOptions sheet is complete:
6 Close the Data Browser window.
Adding the Sulfur PropertyIn order to include in the report the sulfur property you justdefined, create a property set.1 From the Aspen Plus menu bar, select Data | Properties.2 From the Properties folder, double-click the Prop-Sets folder.
The Prop-Sets object manager appears.3 Click New.4 In the Create new ID dialog box, click OK to accept the
default ID PS-1.5 Click Search.6 In the Search Physical Properties dialog box, enter Sulfur in
the first field and click Search.A list now appears in step 2 of the dialog box.
7 From the list of physical property names, select Sulfur content.8 Click Add.
Sulfur content now appears under the third section.
To Create theProperty Set

Getting Started - Petroleum Displaying Petroleum Stream Properties •••• 6-7
9 Click OK.SULFUR now appears as a selected physical property on theProp-Set Properties sheet:
10 Select the Qualifiers sheet.
11 In the Water basis field, click and select Dry.

6-8 •••• Displaying Petroleum Stream Properties Getting Started - Petroleum
The Prop-Sets PS-1 sheet is now complete:
12 Close the Data Browser window.1 From the Aspen Plus menu bar, select Data | Setup.2 From the Setup folder, select the Report Options form and
then select the Stream sheet.3 Click Property Sets.
The Property Sets dialog box appears.4 From the Available Property Sets column, select PS-1 and
click to move it to the Selected Property Sets column.
5 Click Close.
To Add the PropertySet to the StreamProperty List

Getting Started - Petroleum Displaying Petroleum Stream Properties •••• 6-9
The Setup Report Options sheet is now complete.6 Close the Data Browser window.
7 Click .The Required Input Complete dialog box appears.
Running the Simulation1 In the Required Input Complete dialog box, click OK.
The Control Panel appears.As the run proceeds, status messages appear in the ControlPanel. It takes several seconds for Aspen Plus to process inputspecifications and perform the simulation. When thecalculations finish, the message Results Available in the statusbar at the bottom of the main window.
2 Use the vertical scrollbar to see the messages.3 When the Results Available message appears in the toolbar,
click at the top right corner of the Control Panel to close it.
Examining ResultsReview the stream results for the crude tower products.
1 Click .The Results Summary | Run-Status form appears andindicates that the calculations were completed normally.
2 In the Data Browser, click .The Results Summary | Streams | Material sheet appears.
3 In the first column heading, click and select HNAPHTHA.
4 In the next four columns, click and select KEROSENE,DIESEL, AGO, and RED-CRD.
5 Use the vertical scrollbar to locate SULFUR percent.

6-10 •••• Displaying Petroleum Stream Properties Getting Started - Petroleum
The Results Summary Streams Material sheet displays sulfurcontent:
As expected, the sulfur content of the heavier products, such asRED-CRD, is higher than the sulfur content for the lighterproducts, such as HNAPHTHA. By following the sameprocedure described in this simulation, incorporate otherpetroleum stream properties into your model and track theirdistribution throughout the flowsheet.
Leaving Aspen Plus1 From the Aspen Plus menu bar, select File | Exit.
The Aspen Plus dialog box appears.2 Click Yes to save the simulation.
The Aspen Plus dialog box appears and offers you theopportunity to save the simulation as an Aspen Plus Documentfile.
3 Click No.

Getting Started - Petroleum Connecting to the Aspen Plus Simulation Engine •••• 7-1
Connecting to the Aspen PlusSimulation Engine
If either of the following conditions exist, you will be prompted tospecify the host computer for the Aspen Plus simulation engineafter you start the Aspen Plus User Interface:• The simulation engine is not installed on your PC.• The simulation engine is installed on your PC, but the
Activator security device is not connected to your PC.
In these cases, the Connect to Engine dialog box appears.
1 In the Server type field, click and select the type of hostcomputer for the simulation engine.
2 If you choose Local PC as the server for the simulation engine,you do not need to enter any more information into the dialogbox. Click OK to continue.If you choose Windows NT or 2000 server as the server for thesimulation engine, specify additional options.
3 In the Node name field, enter the name of the computer onwhich the Aspen Plus simulation engine will execute.
4 In the other fields, enter the following information:User name Your user name for the specified host/server.
Password Your password for the above user name.
Working directory The associated working directory.
5 Click OK.

7-2 •••• Connecting to the Aspen Plus Simulation Engine Getting Started - Petroleum
When the network connection is established, the messageConnection Established appears in the message box.
Note: If the Connection Established message does not appear, seeyour Aspen Plus system administrator for more information onnetwork protocols and host computers for the Aspen Plussimulation engine.