Getting started with salesforce- deploy and empower your users

Getting Started Guide for New Users
Programming the ISHMP Toolsuite V3.0 and Collecting Data with
Imote2s
Illinois Structural Health Monitoring Project
January, 2011

Getting Started Guide
January 2011 1 http://shm.cs.uiuc.edu
Table of Contents
Introduction .................................................................................................................................... 2
Step 1 – Setting up the Smart Sensor Directory ............................................................................. 3
Step 2 – Configuring Flash Constants ............................................................................................. 5
Step 3 – Configuring RemoteSensing for Nodes ............................................................................. 5
Step 4 – Setting up the Interface Board ......................................................................................... 6
4.1 Install the FTDI Drivers ..................................................................................................... 7
4.2 Determine the IIB Ports ................................................................................................... 7
Step 5 –Data Acquisition in the Laboratory .................................................................................. 10
5.1 RemoteSensing Setup .................................................................................................... 10
5.2 Running RemoteSensing ................................................................................................ 13
5.3 Data Output ................................................................................................................... 15
5.4 Time Synchronizing Gateway Node (Optional) .............................................................. 16
Step 6 – Deployment Considerations ........................................................................................... 18
6.1 Battery voltage ............................................................................................................... 18
6.2 External Antennas .......................................................................................................... 18
6.3 Assessing the Communication Environment with TestRadio .................................. 19
6.3.1 Configuration test .................................................................................. 19
6.3.2 Run TestRadio ................................................................................... 19
6.3.3 Maximum communication range ........................................................... 20
6.4 Radio Channel Selection ................................................................................................ 20
6.5 Sensor Installation ......................................................................................................... 22
6.5.1 Environmental Enclosure ....................................................................... 22
6.5.2 Antenna extension cable ....................................................................... 22
6.5.3 Mounting ................................................................................................ 22
6.6 Leaf Node Assembly ....................................................................................................... 23
Step 7 – Moving Beyond the Precompiled Imote2 ....................................................................... 24
Appendix A – General Trouble-shooting ...................................................................................... 26
Appendix B – BluSH Commands on Precompiled Imote2s ........................................................... 27
Appendix C – Overview of ISHMP Services Toolsuite ................................................................... 30

Getting Started Guide
January 2011 2 http://shm.cs.uiuc.edu
Introduction
This guide is designed for those who have Imote2s that are configured with the TinyOS boot
loader and have the ISM400 (formerly the SHM-A) sensor board. The steps in this guide will
help you install the Illinois Structural Health Monitoring Project (ISHMP) Services Toolsuite
Version 3.0 and acquire data with the Imote2 smart sensor platform using the ISM400 sensor
board. For those who need to update preconfigured Imote2s to the latest version of the data
acquisition software, please follow Steps 1-3.
Following the instructions in this guide will allow you to:
• Configure the necessary files on the PC to quickly start using preconfigured Imote2s
• Acquire acceleration data from a network of Imote2s using ISM400 sensor boards
• Deploy the Imote2s on full-scale structures
• Trouble-shoot the network
The hardware required to use this guide is:
• Computer running the Windows operating system
• USB to mini cable
• IPR2400 or IPR2420 Imote2 preconfigured with the TinyOS boot loader
• IIB2400 interface board
• IBB2400CA battery board
• ISM400 (formerly the SHM-A) sensor board
Several additional files, NewUser_Files.zip, are required to successfully follow this guide.
The files are available for download at the ISHMP website at:
http://shm.cs.uiuc.edu/files/NewUser_Files.zip.
You will need at least two Imote2s to create a “network.” One Imote2 will connect to the PC
via the USB and act as the gateway between the PC and your network of remote sensors. This
guide will refer to an Imote2 connected to the PC as a gateway node and nodes in the network
as leaf nodes.
Note that in this document, BluSH commands appear in Courier New font, Imote2
applications appear in the Italicized Calibri font, and file names and DOS commands appear in
the Lucida Console font.
If you have Imote2s that were not preconfigured with the TinyOS boot loader, you will need to
contact MEMSIC about having the boot loader installed or, buy a JTAG programmer and use it
to install the boot loader.
Comments and Questions:
If you have questions about the software or this guide, or run into problems, please join us on
the Imote2 discussion forum: http://vibration.shef.ac.uk/imote2_forum.

Getting Started Guide
January 2011 3 http://shm.cs.uiuc.edu
Step 1 – Setting up the Smart Sensor Directory
You will interact with the Imote2 via the MS-DOS command window that is native to Windows.
• Make a new folder in your C-drive:
o C:\shm
• Download NewUser_Files.zip from the ISHMP website
(http://shm.cs.uiuc.edu/NewUser.html) and extract it into the newly created directory
C:\shm. Four files (cygwin1.dll, autocom.exe, image1, image2, and
USBLoaderHost.exe) and one directory (FTDIDrivers) should be seen in C:\shm.
• Open a DOS command window by going to Start � Run…, as shown in Figure 1.
Figure 1. Start Menu.
• Run ‘cmd’ in the Run dialog box as shown in Figure 2. A DOS command window will
subsequently open as shown in Figure 3.
Figure 2. Run Dialog Box.

Getting Started Guide
January 2011 4 http://shm.cs.uiuc.edu
Figure 3. DOS command prompt window.
• The home directory for the command window is
C:\Documents and Setting\<user name>
• Go to the C:\shm directory by typing:
cd c:\shm
• Check that the current directory has the five files you placed in the directory from the
downloaded zip files using the ‘dir’ command. These files are shown in Figure 4.
Figure 4. Checking the C:C:C:C:\\\\shmshmshmshm directory.

Getting Started Guide
January 2011 5 http://shm.cs.uiuc.edu
Step 2 – Configuring Flash Constants
This step will configure the Flash constants (adjustable configuration parameters) on the
Imote2. Setup the Imote2 directly connected to the PC via USB mini cable, not via the
interface/debug board (IIB2400), as pictured in Figure 5. After plugging in, push the power
button on the Imote2 to turn it on.
Figure 5. Imote2 setup.
From the command prompt, run “USBLoaderHost.exe –p image1” to program the Imote2
and wait until the process finishes and the C:\shm> prompt appears again as shown in Figure
6. The flash constants will be written to the mote automatically. The LED will turn red for
several seconds as the flash constants are updated, then the mote will reboot and the LED will
stay green. Repeat this step for all Imote2s, including the gateway node.
Figure 6. Uploading WriteFlashConstant to the Imote2.
Step 3 – Configuring RemoteSensing for Nodes
In this step, the RemoteSensing application from the ISHMP Services Toolsuite V2.3.0, which
enables data collection, will be installed. As in Step 2, connect the Imote2 directly to the PC

Getting Started Guide
January 2011 6 http://shm.cs.uiuc.edu
through the USB port. Push the power button on the Imote2 to turn it on and run
“USBLoaderHost.exe –p image2” from the command prompt. Wait until programming
finishes and the C:\shm> prompt appears again. Repeat this step for all Imote2s, including the
gateway node. Demonstration of this step is shown in Figure 7.
Figure 7. Uploading the image to a node.
Step 4 – Setting up the Interface Board
This step sets up the interface/debug board (IIB2400, pictured in Figure 8 with and without the
Imote2), which is required to transfer data from the gateway node to the PC.

Getting Started Guide
January 2011 7 http://shm.cs.uiuc.edu
a) without the Imote2 b) with the Imote2
Figure 8. Interface board (IIB2400).
The Imote2 interface board (IIB2400) contains a dual port FTDI chip that provides two serial
port (UART) interfaces over a USB connection to your PC. One of the UART interfaces sends and
receives debug commands and output, and the other receives data.
4.1 Install the FTDI Drivers
To access the interface board, you must first install the FTDI Drivers as follows:
• Connect the IIB to your computer via a USB cable. When Windows prompts you for a
driver:
o Follow the installation instructions
o When asked where to look for the driver, specify the folder C:\shm\FTDIDrivers
o Two USB serial ports should be installed when the process is completed
4.2 Determine the IIB Ports
Now that the drivers and ports have been installed, you need to determine the port numbers
for each of the new ports:
• Open the Windows Control Panel. Select "System"; choose the "Hardware" tab; click
on "Device Manager". An example of “Device Manager” window is shown in
Figure 9.
• Expand the "Ports (COM & LPT)" category. You should see something like:
o USB Serial Port (COM4) o USB Serial Port (COM5)
• If you cannot see the installed ports in Device Manager or access the COM ports after
installing the drivers, reboot the computer.

Getting Started Guide
January 2011 8 http://shm.cs.uiuc.edu
Figure 9. Device Manager listing the COM ports for the Interface board.
• Write down the port values (COM4 and COM5 in this example). This guide will refer to
these ports later as "data UART" for the lower port number and "debug UART" for
the higher port number. You will need to know these identifiers to interact with the
Imote2.
• Note: If you have multiple IIBs, each new board you connect to the PC will create its
own set of COM ports so keep track of which COM ports belong to which board!
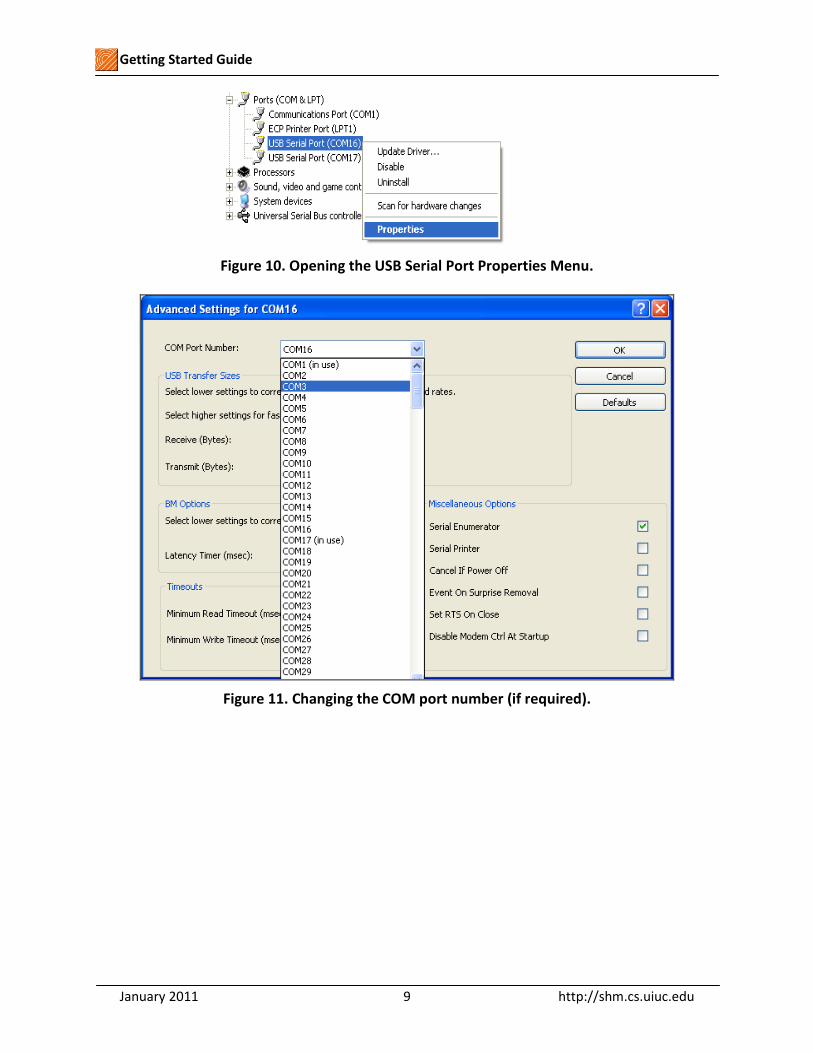
• Note: If either COM Port number is larger than COM16, the IIB interface board may not
function properly. You can change the COM Port number to a value less than 16 by
doing the following:
o Right click on the “USB Serial Port” to open Properties as shown in Figure
10.
o Open the “Port Settings” tab and click on “Advanced”.
o Choose a COM port number from 3 to 16 to assign to the UART port using the
“COM Port Number” drop down box as shown in Figure 11. The “(in
use)” label can be ignored; you can choose these port numbers as well if
between COM3 and COM16.
o Exit the “Device Manager” and then open it again to make sure that the
changes have been made to your COM port numbers.
Getting Started Guide
January 2011 9 http://shm.cs.uiuc.edu
Figure 10. Opening the USB Serial Port Properties Menu.
Figure 11. Changing the COM port number (if required).

Getting Started Guide
January 2011 10 http://shm.cs.uiuc.edu
Step 5 –Data Acquisition in the Laboratory
Completion of this step will allow you to acquire acceleration data from a network of Imote2s
using the ISM400 sensor boards.
5.1 RemoteSensing Setup
The autocomm tool will be used to interact with the RemoteSensing application running on the
Imote2. In the Imote2 BluSH shell, none of the commands present in the PC command shell are
available; the command 'ls' lists all of the available commands.
• In the command window, run:
o autocomm –d COMy
where COMy is the higher COM port. Press <enter> a few times until a BluSH> prompt
appears. If a BluSH> prompt does not appear, check if the correct COM port has been
entered. This step is shown in Figure 12.
Figure 12. Entering the BluSH environment using autocomm.
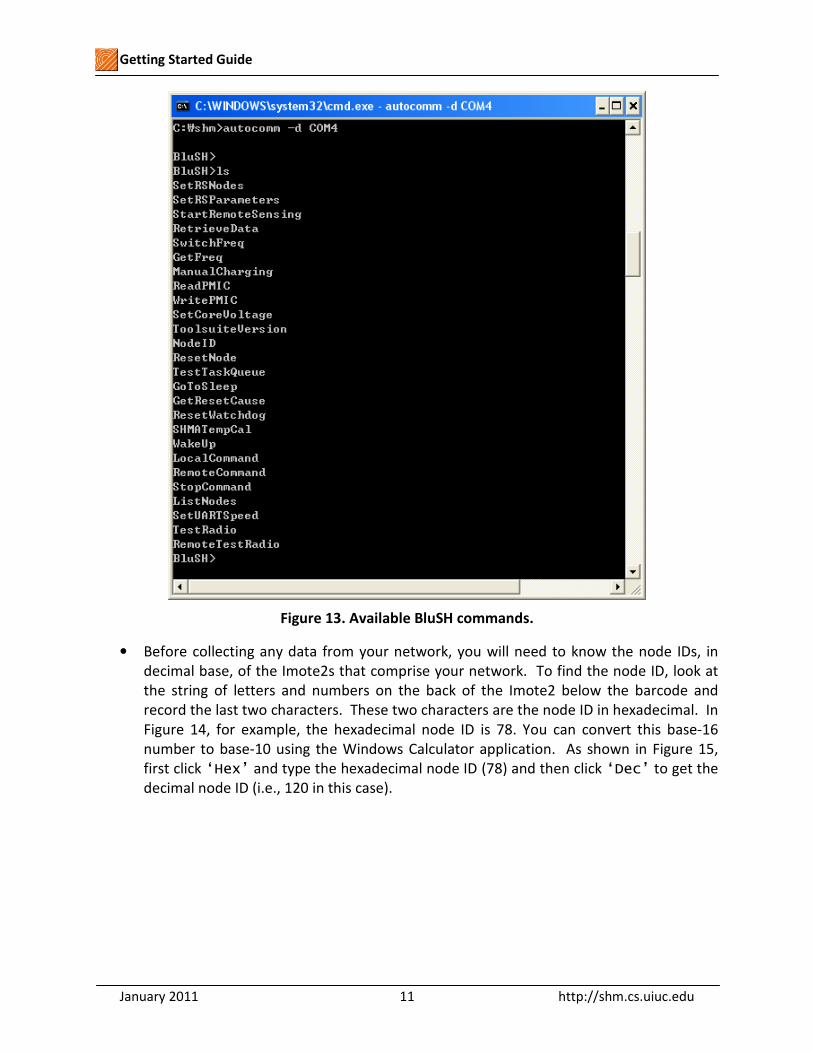
To see a list of the commands available on the Imote2, use the BluSH command ls. Some of
the available commands are directly used by interacting with the RemoteSensing application,
while others are utilities used in other applications available in the ISHMP Services Toolsuite.
Figure 13 shows the commands available from the precompiled ISHMP Services Toolsuite. See
Appendix B for detailed information about these commands.
Getting Started Guide
January 2011 11 http://shm.cs.uiuc.edu
Figure 13. Available BluSH commands.
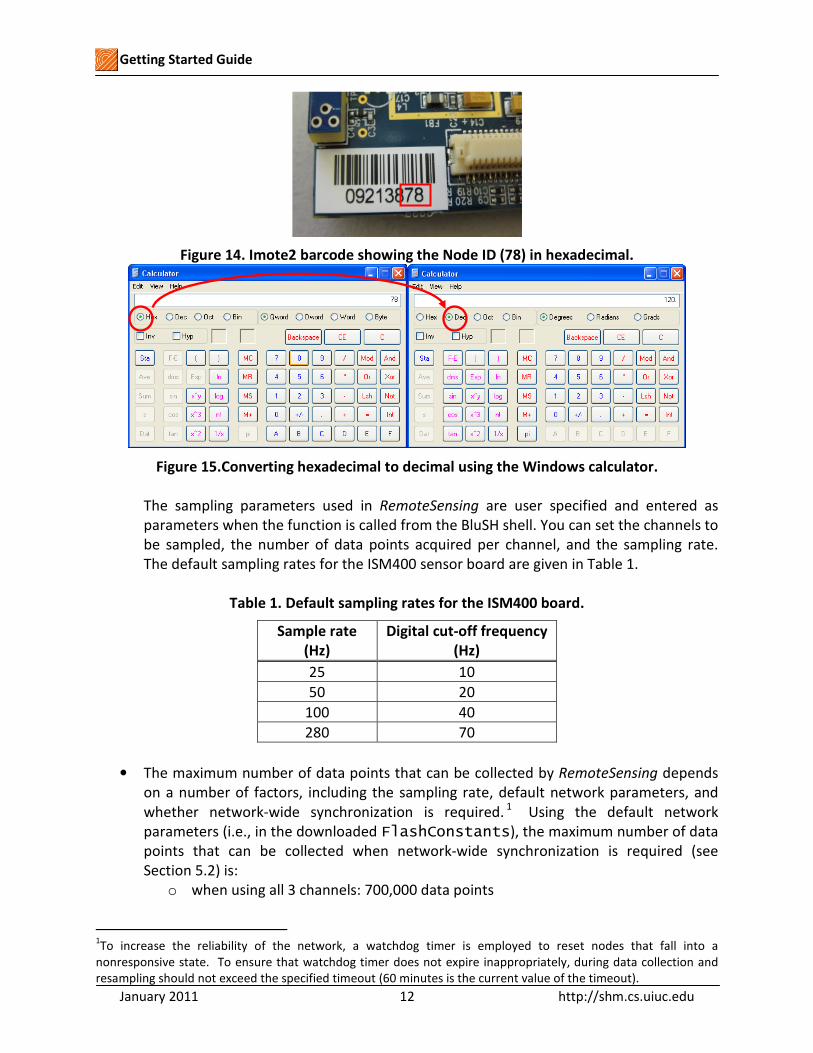
• Before collecting any data from your network, you will need to know the node IDs, in
decimal base, of the Imote2s that comprise your network. To find the node ID, look at
the string of letters and numbers on the back of the Imote2 below the barcode and
record the last two characters. These two characters are the node ID in hexadecimal. In
Figure 14, for example, the hexadecimal node ID is 78. You can convert this base-16
number to base-10 using the Windows Calculator application. As shown in Figure 15,
first click ‘Hex’ and type the hexadecimal node ID (78) and then click ‘Dec’ to get the
decimal node ID (i.e., 120 in this case).
Getting Started Guide
January 2011 12 http://shm.cs.uiuc.edu
Figure 14. Imote2 barcode showing the Node ID (78) in hexadecimal.
Figure 15.Converting hexadecimal to decimal using the Windows calculator.
The sampling parameters used in RemoteSensing are user specified and entered as
parameters when the function is called from the BluSH shell. You can set the channels to
be sampled, the number of data points acquired per channel, and the sampling rate.
The default sampling rates for the ISM400 sensor board are given in Table 1.
Table 1. Default sampling rates for the ISM400 board.
Sample rate
(Hz)
Digital cut-off frequency
(Hz)
25 10
50 20
100 40
280 70
• The maximum number of data points that can be collected by RemoteSensing depends
on a number of factors, including the sampling rate, default network parameters, and
whether network-wide synchronization is required.1
Using the default network
parameters (i.e., in the downloaded FlashConstants), the maximum number of data
points that can be collected when network-wide synchronization is required (see
Section 5.2) is:
o when using all 3 channels: 700,000 data points
1To increase the reliability of the network, a watchdog timer is employed to reset nodes that fall into a
nonresponsive state. To ensure that watchdog timer does not expire inappropriately, during data collection and
resampling should not exceed the specified timeout (60 minutes is the current value of the timeout).

Getting Started Guide
January 2011 13 http://shm.cs.uiuc.edu
When approximate synchronization is adequate (i.e., resampling is not employed; see
Section Error! Reference source not found.), the maximum number of points that
RemoteSensing can collect is:
o when using only 1 channel: 900,000 data points sampled at 280 Hz
o when using all 3 channels: 700,000 points per channel sampled at 280 Hz for a
total of 2,100,000 data points
Longer data records can be collected by adjusting the network parameters (see Step 7).
• To save the collected data to a file, you will need to open a second DOS command
window. In the new command window, use the cd command to change the directory to
the location within the C:\shm directory where the data will be saved and then type:
o autocomm –n –o out.txt COMx
where COMx is the lower COM port. The “-n” flag will cause the data to be written only
to the output file and not be shown on the screen. Using this flag minimizes “printing”
errors when writing to the saved file. Note that the date and time are automatically
inserted into the name of the output file (e.g., out.txt becomes out_date-
time.txt). Figure 16 demonstrates the execution of this command. Potential printing
problems are addressed further in Appendix A.
Figure 16. Executing the autocommautocommautocommautocomm command.
5.2 Running RemoteSensing
The application RemoteSensing will collect precisely synchronized data from the leaf nodes,
persistently store up to 9 data sets remotely, and transfer them back to the gateway node, and
write the output to the file specified in the second command window created in step 5.1.
• Before issuing any commands, make sure your leaf nodes are ready to collect data by
checking that the sensor boards are firmly attached, the antenna is tightened, the nodes
are turned on, and the red LEDs are shining.
• To collect synchronized data, go to the first command window and type the following
command at the BluSH> prompt:
o SetRSNodes <nodeId> [nodeId] [nodeId] …
where you list the decimal value of the node IDs of all the leaf nodes (see Figure 17).
• Next, input the sensing parameters as shown in Figure 18:
o SetRSParameters <channelMask> <numSamples> <samplingRate>
<syncSensing>

Getting Started Guide
January 2011 14 http://shm.cs.uiuc.edu
The GetData arguments are:
o channelMask: this parameter designates the combination of sensor channels
that will be collected, e.g.:
� 1 = channel 1
� 13 = channels 1 and 3
� 123 = channels 1, 2 and 3
o numSamples: number of request data samples
o samplingRate: sampling rate in Hz (see Table 1 for supported rates)
o syncSensing: user can select whether to perform time synchronization
before sensing or not
� 1 = Sensing after network time synchronization (Recommended when
you have multiple leaf nodes)
� 0 = Sensing without synchronization (Recommended when you have
single leaf node)
• The application is now configured; you can initiate data collection in the RemoteSensing
application by typing (see Figure 18):
o StartRemoteSensing <clearmetaData>
� 1 = Clear persistent data set metadata such that new data will be stored
in the first block.
� 0 = New data will be stored in the next available block.
• When synchronized sensing is selected, gateway node will begin to synchronize the
network at this point. Once network synchronization is complete, data collection will
begin and the LEDs on all of the nodes will turn green. When the leaf nodes are finished
sensing, their LEDs will turn off. Wait until some debug logs appears.
• When sensing is done, you can now collect the latest data by typing (see Figure 18):
o RetrieveData -1 <nodeId> [nodeId] [nodeId] …
If multiple data sets are stored in flash memory, they can be retrieved by replacing ‘-1’
to a data set index (1 through 9). Note that the maximum number of data sets can be
stored in flash memory is nine; if the tenth data set is collected with clearmetaData = 0,
it will overwrite the first data set.
• When all the leaf nodes have successfully sent their data to the gateway node and the
data has been written to the PC, the command window will return the message
"Finished writing output." Figure 18 shows an example of the commands
issued and the debug output that you will see in the debug UART command window.
• Note that Date and time appear in the debug log will be different from your Base Station
PC time. (See Step 5.4 to time synchronize the gateway node clock.)

Getting Started Guide
January 2011 15 http://shm.cs.uiuc.edu
Figure 17. Starting the RemoteSensing application (time synchronized).
Figure 18. Output from the RemoteSensing application.
5.3 Data Output
Now that you have successfully run the RemoteSensing application, you can view the collected
data in the program of your choice.
• Press <Ctrl-C> in both command windows to close the autocomm application.
• The output in "out_date-time.txt" located in the C:\shm directory will contain the
index and sensor data in a tab-delimited format that is suitable for importing into either
Excel or Matlab.
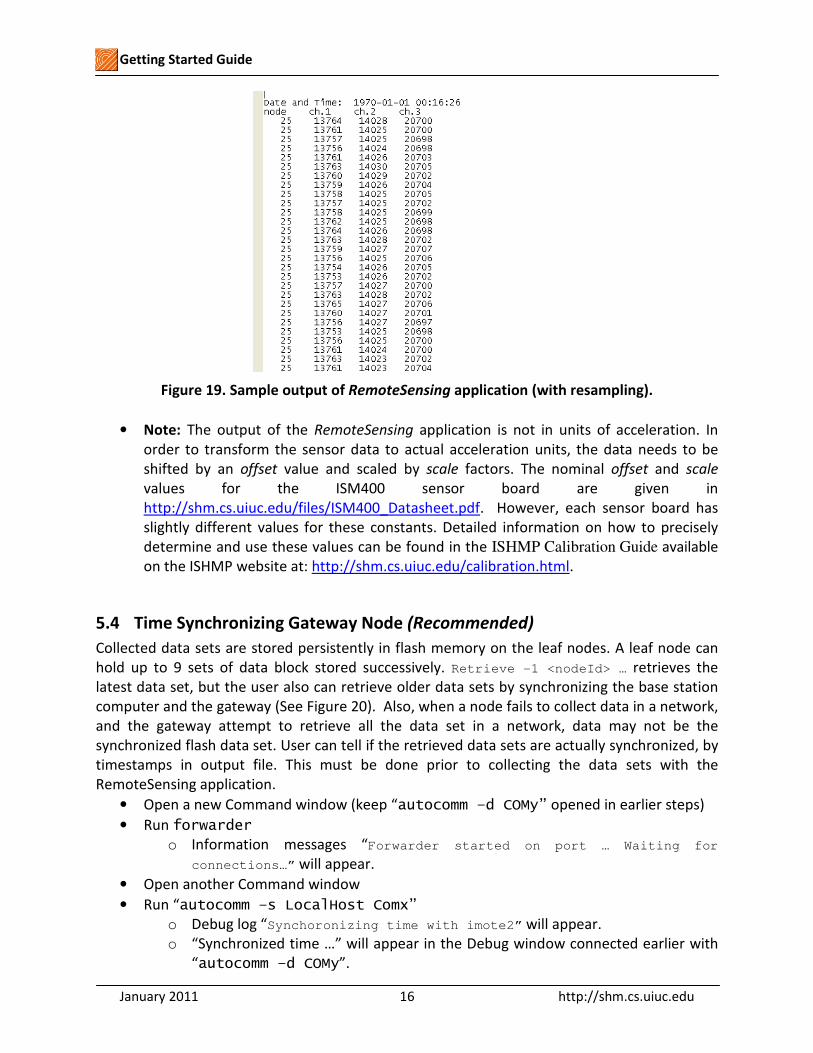
• As shown in Figure 19, the columns in the output file are:
o node – the Imote2 node ID
o ch. n – sensor data for accelerometer channel n
Getting Started Guide
January 2011 16 http://shm.cs.uiuc.edu
Figure 19. Sample output of RemoteSensing application (with resampling).
• Note: The output of the RemoteSensing application is not in units of acceleration. In
order to transform the sensor data to actual acceleration units, the data needs to be
shifted by an offset value and scaled by scale factors. The nominal offset and scale
values for the ISM400 sensor board are given in
http://shm.cs.uiuc.edu/files/ISM400_Datasheet.pdf. However, each sensor board has
slightly different values for these constants. Detailed information on how to precisely
determine and use these values can be found in the ISHMP Calibration Guide available
on the ISHMP website at: http://shm.cs.uiuc.edu/calibration.html.
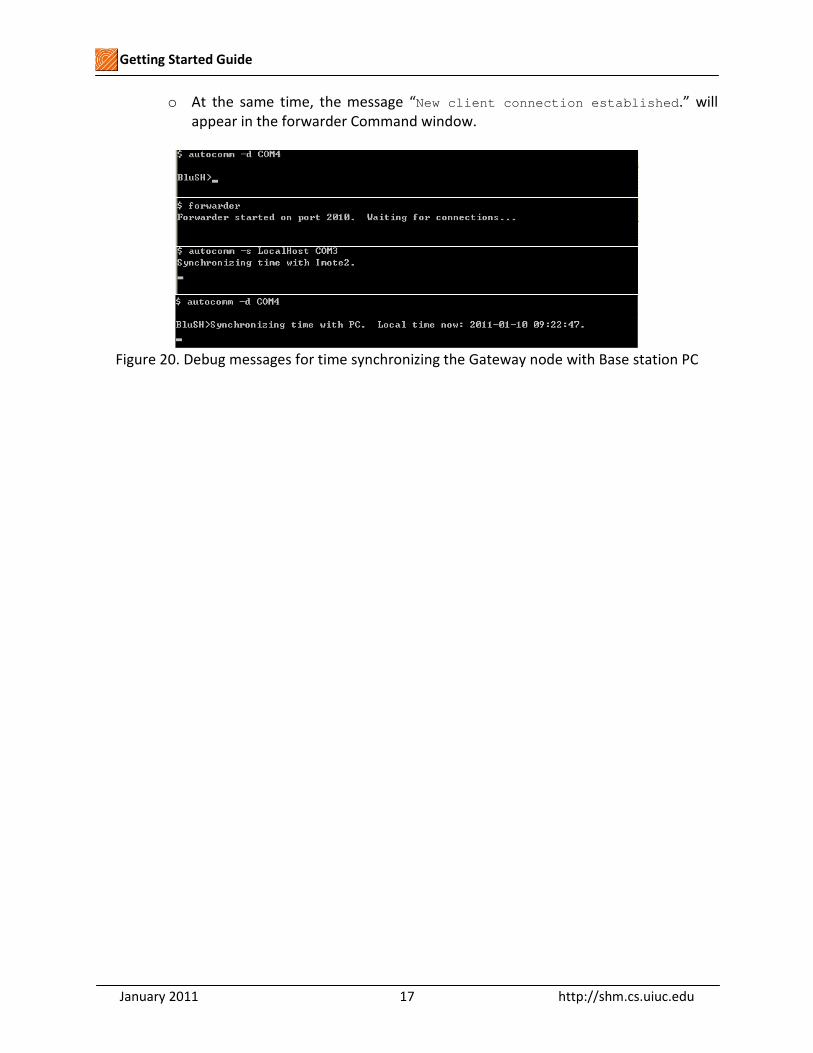
5.4 Time Synchronizing Gateway Node (Recommended)
Collected data sets are stored persistently in flash memory on the leaf nodes. A leaf node can
hold up to 9 sets of data block stored successively. Retrieve -1 <nodeId> … retrieves the
latest data set, but the user also can retrieve older data sets by synchronizing the base station
computer and the gateway (See Figure 20). Also, when a node fails to collect data in a network,
and the gateway attempt to retrieve all the data set in a network, data may not be the
synchronized flash data set. User can tell if the retrieved data sets are actually synchronized, by
timestamps in output file. This must be done prior to collecting the data sets with the
RemoteSensing application.
• Open a new Command window (keep “autocomm –d COMy” opened in earlier steps)
• Run forwarder
o Information messages “Forwarder started on port … Waiting for
connections…” will appear.
• Open another Command window
• Run “autocomm –s LocalHost Comx”
o Debug log “Synchoronizing time with imote2” will appear.
o “Synchronized time …” will appear in the Debug window connected earlier with
“autocomm –d COMy”.
Getting Started Guide
January 2011 17 http://shm.cs.uiuc.edu
o At the same time, the message “New client connection established.” will
appear in the forwarder Command window.
Figure 20. Debug messages for time synchronizing the Gateway node with Base station PC

Getting Started Guide
January 2011 18 http://shm.cs.uiuc.edu
Step 6 – Deployment Considerations
The need for environmental hardening and the longer communication distances required by
full-scale SHM deployments are just two of the considerations that should to be addressed
when moving from the laboratory to the real world. The following sections provide guidelines
on preparing for a full-scale deployment.
6.1 Battery voltage
The battery voltage for each Imote2 should be checked before testing. The nominal voltage of
one AAA battery is 1.5V, thus the nominal voltage supplied by three batteries is 4.5V. Typically
new AAA batteries initially have a voltage higher than the nominal voltage output. As a result,
three new AAA batteries often exceed the 4.7V maximum battery voltage allowed by the
IBB2400CA battery boards. If the voltage is too high, a safeguard mechanism on the battery
board prevents it from supplying power to the Imote2. In such a case, using one slightly used
battery with two newer batteries will reduce the voltage to within the allowable range. Other
important tips are:
• Keep the voltage level between 3.7 and 4.7V
o If the voltage exceeds 4.7V, the Imote2 will not turn on as discussed above.
o If the voltage is less than 3.7V, the ISM400 sensor board will not function.
o If the voltage is less than 3.4 V, the Imote2 will not turn on.
• You can check the battery voltage of any Imote2 remotely using the BluSh utility
command RemoteCommand Vbat <nodeID>. Note that the Vbat reading is
between 0.3V and 0.4V less than the actual battery voltage, because this voltage is
read after it passes the protection diode. Therefore, for operating nodes the Vbat
reading should fall between 3.3 and 4.4 V.
6.2 External Antennas
By default, MEMSIC configures the Imote2 to use the onboard antenna. However, using an
external antenna (e.g., the Antenova Mica 2.4 GHz SMD) is strongly recommended for full-scale
deployments as they not only provide longer communication range but they also provide more
consistent communication performance.2 When using an external antenna, the following
considerations should be taken into account for better communication:
• The antenna should be firmly screwed onto the connector to avoid unnecessary
voltage losses.
• The radiation pattern of the external antenna resembles a torus, which is typical of a
dipole antenna. Thus, if the antennas are parallel, the radiation patterns will overlap
for improved communication performance (see Figure 21). Orienting the antennas
perpendicular to one another should be avoided, as it results in poorer
communication performance.
• Avoid encasing the Imote2 in steel or glass
• Elevate the sensors at least 2 feet from the ground when possible
• Keep line-of-sight between the gateway node and the leaf nodes when possible
2Linderman L.E., Rice J.A., Barot S., Spencer Jr B.F., and Bernhard J.T. (2010). “Characterization of Wireless Smart
Sensor Performance.” Newmark Structural Engineering Report Series, University of Illinois at Urbana-Champaign, No. 21.

Getting Started Guide
January 2011 19 http://shm.cs.uiuc.edu
Figure 21. Recommended antenna orientations.
Note that orienting the antennas perpendicular to any metal surface (e.g., the flange of a steel
girder) also can help to reduce the signal attenuation due to the presence of metal.
6.3 Assessing the Communication Environment with TestRadio
Each deployment site has a different communication environment that can have multiple
sources of interference. For any successful deployment, an initial assessment of the
communication range and Imote2 performance should be conducted. The BluSH utility
command TestRadio is used to make this assessment by measuring the packet reception
rate between two sensors. The results of TestRadio are useful in determining the optimal
sensor placement. Leaf nodes that have better performance can be located farther from the
gateway node, while leaf nodes whose performance is less than perfect need to be located
close to a gateway node. This section provides an overview of how to use TestRadio to
determine node-to-node communication performance.
6.3.1 Configuration test
In this step, you will place the nodes in the positions they will occupy in the final deployment.
• Position the gateway node in a fixed location that is as close as possible to the desired
final location of the base station.
• Place the leaf nodes in their desired locations and turn them on.
• Position the antennas in what you believe to be their optimal configuration.
6.3.2 Run TestRadio
Bring up a BluSH> prompt for the gateway node and run:
• TestRadio <count> <nodeID> [nodeID][nodeID]
where count is the number of packets to be sent, and the node IDs are the IDs of up to ten
of the leaf nodes being tested (between 100 and 1000 packets make for a good test). When the
command is executed, the gateway node broadcasts the packets to the leaf nodes. The leaf
nodes then transmit, in turn, the packets they successfully received back to the gateway node.
The output of TestRadio is the round-trip packet reception rate. In TestRadio, the
commands are sent reliably; the test will not fail due to the TestRadio command not being
received unless communication between the gateway and leaf nodes in question is not possible.
The test packets are not sent reliably thus allowing for raw transmission loss to be determined.
Figure 22 shows the debug commands and output for a TestRadio run with two leaf nodes.

Getting Started Guide
January 2011 20 http://shm.cs.uiuc.edu
Figure 22. Sample command and output for TestRadio.
The results printed to the screen are:
• addr - the node ID of the node tested
• cnt - the total number of packets successfully returned from the leaf node back to the
gateway node
• %- the percentage of packets that were successfully returned from the leaf node back to
the gateway node
• rssi– received signal strength indicator (higher is better)
• lqi– link quality indicator (higher is better)
• rcnt – the number of packets that were successfully received by the leaf node
• r% – the percentage of packets successfully received by the leaf node
• rrssi–received signal strength indicator at the leaf node
• rlqi–link quality indicator at the leaf node
The round trip packet reception rate (%) gives an overall indication of the quality of the
communication between each remote and the gateway node. Values above 90% will perform
well in most cases using the reliable communication protocol imbedded in the ISHMP software.
The reliable communication protocol ensures that no data is lost, even when the packet
reception rate is below 100%. If the packet reception rates determined by TestRadio are too
low, the network topology should be reconfigured or the antenna positions changed to improve
the reception rates.
6.3.3 Maximum communication range
Under ideal conditions, the Imote2 nodes using external antennas can communicate at
distances of over 300m. Typical ranges when line-of-sight is possible are ~150m using point to
point communication (i.e., without multi-hop communication). The communication range is
directly related to the quality of the environmental conditions and sensor placement.
6.4 Radio Channel Selection
Selecting the proper communication channel for the network is critical in areas where an
802.11 (Wi-Fi) network is present. As illustrated in Figure 23, both Wi-Fi networks and the
Imote2 operate in the 2.4 GHz band. Wi-Fi generally uses 802.11 channels 1, 6 and 11 because
they do not overlap each other. Therefore, operating the Imote2s on channels 15, 20, 25 and 26
will cause the least interference with Wi-Fi. In the United States, Wi-Fi does not operate above

Getting Started Guide
January 2011 21 http://shm.cs.uiuc.edu
channel 11 though in Japan channels 12 through 14 are also used. Channel 26 has been
reported by ISHMP users to not be as reliable as other channels.
Figure 23. Wi-Fi and Imote2 channel overlap in the 2.4GHz frequency band.
Free networking software, such as NetStumbler (http://www.netstumbler.com/downloads/),
can help you determine the Wi-Fi channels operating near your network. Using Figure 23, you
can select the appropriate 802.15.4 channel for your Imote2 network to avoid interference with
the observed Wi-Fi channels. In general, channel 25 on the Imote2 is the preferred operating
channel and is set as the default in the ISHMP Services Toolsuite. The network’s channel may be
changed any time using the SetRadioChannel command. In the command window, run:
• autocomm –d COMy
where COMy is the higher COM port. At the BluSH> prompt, run the following commands:
• RemoteCommand SetRadioChannel <channel> <leaf nodeID>
This command sets the radio channel of the requested leaf node to the specified
channel. The set of valid radio channels is 11 through 26 inclusive.
• LocalCommand SetRadioChannel <channel>
This command sets the radio channel of the gateway node to the specified
channel. Again, the set of valid radio channels is 11 through 26 inclusive.
Always set the channel for the leaf nodes first so when the local channel is changed the
network can still communicate properly. If you set the gateway node’s channel before the leaf
nodes, you will not be able to communicate with the leaf nodes until you set the gateway
node’s channel back to its original setting. The Imote2 returns to the default radio channel
when it is turned off/on or is reset.
Multiple Imote2 sub-networks can operate in the same location if different radio channels are
selected for each sub-network.

Getting Started Guide
January 2011 22 http://shm.cs.uiuc.edu
6.5 Sensor Installation
Installing the Imote2s outdoors means that they must be protected from the elements through
environmental hardening.
6.5.1 Environmental Enclosure
Prior to deploying a network of Imote2s outdoors, they must be housed in enclosures that
protect against the elements like rain, wind, and dust. The enclosure should therefore have a lid
with a rubber gasket to make it waterproof. The enclosure should house the batteries used in
your deployment and an external antenna. Figure 24 gives an example of an enclosure that
adequately houses the imote2, sensor board, battery board, and 3 D-cell batteries.
Figure 24. Sample environmental enclosure.
6.5.2 Antenna extension cable
When choosing an enclosure, an antenna extension cable (e.g., Emerson Network Power part
#415-0031-006) may be required to connect the Imote2 to the external antenna mounted on
the enclosure wall. When needed, the extension cable should be as short and straight as
possible as the cable can introduce significant signal attenuation.
6.5.3 Mounting
The leaf nodes need to be properly mounted on the structure to get meaningful acceleration
data. Possible mounting methods include:
• Clamping a mounting plate attached to the enclosure to the structure (see Figure
25a).
• Using U-bends threaded through a mounting plate to attach the Imote2 enclosure to
a cable (see Figure 25b).
• Using magnetic mounts to attach the enclosure to steel structures (see Figure 25c.).
Tests have shown that the magnet has little effect on the Imote2’s communication
performance.
• For temporary attachment, using hot glue to attach an Imote2 in or out of its
enclosure has proven effective and useful (see Figure 25d).

Getting Started Guide
January 2011 23 http://shm.cs.uiuc.edu
a) using clamps b) using U-bend (for cable)
c) using magnets d) hot gluing to weight
Figure 25. Sample examples of mounting methods.
6.6 Leaf Node Assembly
Usually, the battery board (IBB2400CA) is connected to the Imote2, with the sensor board
stacked on top (see Figure 26a). Alternatively, the ISM400 board can be directly connected to
the battery board, with the Imote2 stacked on top of the ISM400 board (see Figure 26b). The
merits of the latter configuration are:
• The physical size of the assembled leaf node is reduced. Therefore the selection of an
enclosure (if required) is more flexible.
• The Imote2 can be installed in an enclosure and connected to an external antenna
through the enclosure wall without an antenna cable.
• A protrusion on the battery board interferes with the direct connection in the normal
stacking configuration (see red boxed region in Figure 26a).
a) Battery board + Imote2 + ISM400 b) Battery board + ISM400 + Imote2
Figure 26. Boards stacking order.

Getting Started Guide
January 2011 24 http://shm.cs.uiuc.edu
Step 7 – Moving Beyond the Precompiled Imote2 Software
The Imote2s that have been configured with the precompiled ISHMP Services Toolsuite’s data
acquisition software provides substantial functionality. The steps in this guide have shown you
how to acquire data with the Imote2 smart sensor platform using the ISM400 sensor board.
The full ISHMP Services Toolsuite offers much wider functionality (see Appendix C), including:
• SnoozeAlarm: This service provides sleep cycle functionality, which greatly reduces long-
term power consumption. Sensors sleep for a period of time and then wake up for a
relatively short period, during which they can interact with the network.
• ThresholdSentry: This service allows a subset of the network to act as “sentry” nodes
that are awakened periodically to sense data for a short period of time, determine if
an interesting event is in progress, and notify the base station.
• AutoMonitor: This application allows autonomous network operation that includes
sensing, data transfer, and ThresholdSentry operation according to a user-specified
policy, allowing the network to operate unattended.
• Reliable Multi-Hop Communication: This service provides the beta-implementation of
any-to-any reliable multi-hop routing for sensor network applications.
• Application services provide the numerical algorithms necessary to implement SHM
applications on the Imote2s and may also be used independently. Available
application services include Synchronized Sensing, CFE, CPSD, RD, ERA, SSI, FDD, SDLV,
and SDDLV.
• Change default settings, e.g.:
o Program a sampling rate that is not one of the default sampling rates
preconfigured for the ISM400 board
o Download new FlashConstants to increase the maximum number of data
points and network size
• Software necessary to use a rechargeable battery attached to a solar panel.
• Programming the Imote2 to accomplish your own tasks.
All of these software functions require installation of the full TinyOS environment and the
ISHMP Services Toolsuite on your PC. The installation process is too advanced to be covered in
this Getting Started Guide, but doing so will introduce you to a limitless world of smart sensor
networks. Instructions for the installation process are available in the guides listed below and
on the ISHMP website at http://shm.cs.uiuc.edu/documentation.html.
• Installation of TinyOS and the ISHMP Services Toolsuite
o Getting Started for Advanced Users and Developers
(http://shm.cs.uiuc.edu/AdvancedUser.html)
• Guides and Tutorials
o Imote2 for Structural Health Monitoring: User's Guide
(http://shm.cs.uiuc.edu/AdvancedUser.html)

Getting Started Guide
January 2011 25 http://shm.cs.uiuc.edu
o ISM400 Sensor board Rev. 4.0 Datasheet and User's Guide
(http://shm.cs.uiuc.edu/files/ISM400_Datasheet.pdf)
o ISHMP Calibration Guide
(http://shm.cs.uiuc.edu/calibration.html)
In addition to the above documents, the following reports provide detailed background
regarding the use of wireless smart sensor networks for structural health monitoring:
• Nagayama, T. and Spencer Jr., B.F. (2007). “Structural health monitoring using smart
sensors.”NSEL Report Series, No. 1, University of Illinois at Urbana-Champaign,
http://hdl.handle.net/2142/3521.
• Rice, J.A. and Spencer Jr., B.F. (2009). “Flexible Smart Sensor Framework for
Autonomous Full-scale Structural Health Monitoring.” NSEL Report Series, No. 18,
University of Illinois at Urbana-Champaign, http://hdl.handle.net/2142/13635.
Finally, the following report provides an excellent entry point for researchers wishing to begin
programming the Imote2:
• Sim, S-H. and Spencer Jr., B.F. (2009). “Decentralized Strategies for Monitoring
Structures using Wireless Smart Sensor Networks.” NSEL Report Series, No. 19,
University of Illinois at Urbana-Champaign, http://hdl.handle.net/2142/14280.

Getting Started Guide
January 2011 26 http://shm.cs.uiuc.edu
•
Appendix A – General Trouble-shooting
The following list gives some guidelines that will help improve the likelihood of success in
testing and deploying your Imote2s.
• If a node turns off its LED during the test or exhibits unexpected behavior you should
first check the battery voltage. Low batteries are easy to overlook and checking this
first may save a lot of frustration.
• If a node repeatedly exhibits unexpected behavior and the battery voltage is adequate,
it could simply be a hardware problem. Try to isolate the source of the hardware
problem by switching out the antenna, base station imote2, or sensor board.
• If you experience consistent difficulty with communication, such as RemoteSensing
application failing to collect data from several nodes, you should check the
communication environment using TestRadio as described in step 6.3. This test will
reveal if a particular node has communication problems or if the entire test
environment or network topology is not conducive to successful communication.
• If you have problems with printing data files, such as missing or corrupt output, you may
need to reduce the port speed used by the application. This consists of two steps: in
the Imote2’s BluSH shell, run “LocalCommand SetUARTSpeed 460800” before
starting the RemoteSensing application; on the PC, run “autocomm –b 460800 –n
–o out.txt COMx”.
• If printing problems persist after the above change, you may need to disable some
hardware drivers or system tray applications to alleviate the problem. In particular,
applications relating to USB devices (cameras, printers, music players) have been
known to cause problems. In some rare cases even with the minimal number of
processes running the PC may not be fast enough to print the data files correctly and a
different PC may need to be used.
• If the LEDs are blinking approximately every second, the Imote2 is likely rebooting
continuously. This rebooting cycle occurs when incorrect flash constants are loaded
on the Imote2. To fix this problem, a fresh set of flash constants must be written to
the Imote2 leaf nodes. Please follow Step 2 of this guide.
• If you plan to deploy your network in cold temperatures, be aware that battery
performance degrades as the temperature decreases and this may cause problems
with Imote2 functionality.

Getting Started Guide
January 2011 27 http://shm.cs.uiuc.edu
Appendix B – BluSH Commands on Precompiled Imote2s
The most useful BluSH commands available on the preconfigured Imote2s are described in this
section. Each of the commands is designed for a specific application (e.g., RemoteSensing) or
functionality (e.g., remotely resetting a node or reading voltage).
• RemoteSensing application
o SetRSNodes: used to set up leaf node IDs for synchronized or un-synchronized
sensing
o SetRSParameters: specifies sensing parameters of the sensing channel information,
the number of samples, and the sampling rate in Hz
o StartRemoteSensing: used to start network sensing once all parameters are
configured
o RetrieveData: used to retrieve data collected from leaf nodes
Step 5 of this document provides more detailed information regarding how to use the
RemoteSensing application.
• Utility commands
o RemoteCommand: provides remote access to leaf nodes for specific actions such as
reading voltage or making the leaf node sleep – RemoteCommand usage is as follows:
RemoteCommand <command> [arg] [arg] ...<nodeId> [nodeId]...
where the available commands include:
- SetRadioPower: To change radio power (valid power levels: 1 to 31)
- SetRadioChannel: To change radio channel (valid radio channels: 11 to 26)
- Vbat: To read the battery voltage level3
- Sleep: To make leaf nodes sleep for a predefined duration in seconds
- Reset: To make leaf nodes reset
- ChargeStatus: To read rechargeable battery status
- ReadTemp: To read temperature4
- ReadLight: To read light intensity5
- RestoreFC: To restore default flash constants
- WriteFC: To write user-specified flash constants
- ReadFC: To read current flash constants
o LocalCommand is the counterpart of the RemoteCommand for the locally connected
gateway node – LocalCommand usage is as follows:
LocalCommand <command> [arg] [arg] ...
3 The Vbat reading is between 0.3V and 0.4V less than the actual battery voltage, because this voltage is read after
it passes the protection diode. 4 Disregard the first readings of the temperature sensor, which takes approximately 12 seconds to warm up.
5 Disregard the first readings of the light sensor, which takes approximately 1 second to warm up.

Getting Started Guide
January 2011 28 http://shm.cs.uiuc.edu
where the available commands include:
- SetRadioPower: To change radio power(valid power levels: 1 to 31)
- SetRadioChannel: To change radio channel(valid radio channels: 11 to 26)
- Vbat: To read the battery voltage level3
- Sleep: To make leaf nodes sleep for a predefined duration in seconds
- Reset: To make leaf nodes reset
- ChargeStatus: To read rechargeable battery status
- ReadTemp: To read temperature6
- ReadLight: To read light intensity7
- RestoreFC: To restore default flash constants
- WriteFC: To write user-specified flash constants
- ReadFC: To read current flash
o StopCommand allows RemoteCommand and LocalCommand to stop during operation.
To stop a command, input:
StopCommand <command>
• General utility commands
o GetFreq: displays the current core and bus frequencies
o SetUARTSpeed: allows changing the baud rate for communication between the base
station and gateway node
o GoToSleep: makes the current node sleep for a specified amount of time
GoToSleep <sleep time in sec>
o ResetNode: resets the gateway node connected locally
o ToolsuiteVersion: displays the version of the ISHMP Services Toolsuite
o NodeID: displays the node Id of the gateway Imote2 node, which is locally connected
o ListNodes: displays the node IDs of the leaf nodes that are responsive.
o ResetWatchdog: resets the Watchdog timer that resets the Imote2 after a
predefined idle time
o TestRadio: assesses wireless communication performance by measuring the packet
reception rate between two sensors
TestRadio <count> <nodeID> [nodeID] ...
where count is the number of packets to be sent, and the nodeIDs are the IDs (up to
ten can be listed) of the leaf nodes being tested
o RemoteTestRadio: assesses wireless communication performance by measuring the
packet reception rate between a designated remote node and leaf node sensors.
6 Disregard the first readings of the temperature sensor, which takes approximately 12 seconds to warm up.
7 Disregard the first readings of the light sensor, which takes approximately 1 second to warm up.
Getting Started Guide
January 2011 29 http://shm.cs.uiuc.edu
RemoteTestRadio <count> <remoteNodeID> <nodeID> [nodeID] ...
where count is the number of packets to be sent,
o GetResetCause: displays what has caused the previous reset
o SetSHMS: SHM-S board parameter setting for strain measurement
SetSHMS <R2p> <R3p> <Gain> <V-offset> [nodeID] ...
o SHMSAutoBalance: automatic bridge balance of SHM-S board before sensing start
SHMSAutoBalance <sensing time in sec> <iteration> [nodeID] ...

Getting Started Guide
January 2011 30 http://shm.cs.uiuc.edu
o Appendix C – Overview of ISHMP Services Toolsuite
The ISHMP Services Toolsuite employs a Service-Oriented Architecture (SOA) that lends itself to
further expansion, customization, and development of WSSN applications for SHM. It provides
complete applications that facilitate common tasks throughout the design, testing, deployment,
and monitoring of the SHM system, while utilities offer a set of basic testing and debugging
commands to be included with existing applications. The SHM Services Toolsuite includes
utilities for resetting nodes remotely, listing the nodes within communication range of the local
node, testing radio communication performance, and changing the radio channel and power for
local and remote nodes. Specific services and tools available in Version 3.0 of the ISHMP
Services Toolsuite (http://shm.cs.uiuc.edu/software.html) include:
Foundation Services: The foundation services provide commonly used wireless sensor
functionalities that are required to support higher-level applications. These services include
basic communication and sensing functionalities.
o Unified Sensing is a TinyOS-based sensing interface for Imote2 that supports various
sensor boards including MEMSIC ITS400 and ISM400. Unified Sensing service provides
precise, variable-resolution time stamping of sensor data that can be used to
synchronize sensor data from different sensor nodes.
o Time Synchronization is a network-wide service for synchronizing the local clocks of
sensor nodes in the network.
o Reliable Communication ensures reliable data communication in a wireless sensor
network. Data loss, a common problem in wireless communication, is mitigated by the
Reliable Communication service.
o Reliable Serial Communication provides error-free data transfer between the gateway
Imote2 and the PC over the USB Virtual COM Port interface. Working on the same
principle as the Reliable Communication service, it provides end-to-end reliability for
serial port communication with the Imote2 network.
o Remote Command provides an efficient means for nodes to interact with each other. A
command message is delivered to receiver nodes that process the designated tasks, and
returns the list of responsive nodes and requested data to the sensor node. Remote
Command allows the fault tolerant features to easily be implemented in sensor
applications.
o Reliable Multi-Hop Communication provides the beta-implementation of any-to-any
reliable multi-hop routing for sensor network applications. Multi-hop communication is
essential for monitoring of large structures, where all sensors cannot be deployed within
direct communication range of a small number of base stations.
Application Services: The application services provide the numerical algorithms necessary to
implement SHM applications on the Imote2s and may also be used independently.
o Synchronized Sensing resamples the sensor data, providing synchronized data. Although
the local clocks are synchronized by the Time Synchronization service, the sensing start
time and the sampling rate vary from sensor to sensor with a certain amount of error.

Getting Started Guide
January 2011 31 http://shm.cs.uiuc.edu
The unsynchronized sensor data is synchronized by retroactive resampling using the
SyncSensing service.
o CFE estimates correlation functions between two arrays of synchronized data.
o CPSD estimates cross power spectral density between two arrays of synchronized data.
o RD performs the Random Decrement method to estimate unscaled impulse response
functions.
o ERA estimates modal properties (i.e., natural frequency, damping factor, and mode
shapes) using the Eigensystem Realization Algorithm (ERA). NExT allows the correlation
functions estimated from the CFE service to be used in the ERA service.
o SSI performs the covariance-driven Stochastic Subspace Identification (SSI) for modal
property estimation.
o FDD performs the Frequency Domain Decomposition (FDD) algorithm for modal
property estimation.
o SDLV performs the Stochastic Damage Locating Vector (SDLV) method for damage
localization.
o SDDLV performs the Stochastic Dynamic Damage Locating Vector (SDDLV) method for
damage localization.
Tools and Utilities: The tools and utilities provide network testing and debugging capabilities
that are necessary in any large-scale or long-term WSSN deployment. These tools facilitate
evaluation of the network conditions at the structure to determine appropriate values of
adjustable system parameters, and assess power consumption and longevity issues.
o autocomm is a terminal program that provides an interface between the PC and the
Imote2 through the MEMSIC IIB2400 interface board. This tool is frequently used to run
applications in the ISHMP Toolsuite.
o TestServices combines numerical services, CFE, ERA, and SDLV, and performs damage
detection from user-defined acceleration signals. TestServices is an application example
that illustrates how the numerical services can be combined.
o TestRadio allows testing the raw bi-directional communication between a gateway node
and leaf nodes.
o RemoteSensing is an implementation of the centralized data acquisition approach that
collects synchronized sensor data from a network of sensors to the base station. Time
Synchronization and Synchronized Sensing services are used in RemoteSensing for the
collection of synchronized sensor data.
o SensingUnit, a service component that performs synchronized or unsynchronized
sensing, is particularly useful for SHM application development.
o IndependentProcessingPSD is an implementation of the independent processing that
decentrally estimates the power spectral densities in each node.
o DecentralizedDataAggregation is an application for the data acquisition and processing
on decentralized hierarchical sensor network.
o AutoUtilCommand combines several utility remote commands, including Vbat,
ReadTemp, ChargeStatus and ReadLight. This application can be included in
AutoMonitor for periodically checking the above values.

Getting Started Guide
January 2011 32 http://shm.cs.uiuc.edu
Continuous and Autonomous Monitoring Services: These services provide for continuous and
autonomous WSSN operation while maintaining power efficiency.
o SnoozeAlarm provides sleep cycle functionality, which greatly reduces long-term power
consumption. Sensors sleep for a period of time and then wake up for a relatively short
period, during which they can interact with the network. The duty cycle is configurable
by the user.
o ThresholdSentry allows a subset of the network to act as “sentry” nodes that are
awakened periodically to sense data for a short period of time, determine if an
interesting event is in progress, and notify the base station.
o AutoMonitor is a high-level network management application that coordinates each of
its components in response to various events. It schedules sensing, data transfer, and
ThresholdSentry operation according to a user-specified policy, allowing the network to
operate unattended.
In addition, a library of supporting numerical functions that are common to many SHM
algorithms is provided including Fast Fourier transform (FFT), singular value decomposition,
eigenvalue analysis, etc. Documentation (http://shm.cs.uiuc.edu/documentation.html) is
provided for each service and test application, giving specific requirements and formats of the
inputs and outputs for the service. More detailed information regarding the service-oriented
architecture of the ISHMP Services Toolsuite can be found in the following report:
• Rice, J.A. and Spencer Jr., B.F. (2009). “Flexible Smart Sensor Framework for
Autonomous Full-scale Structural Health Monitoring.” NSEL Report Series, No. 18,
University of Illinois at Urbana-Champaign, http://hdl.handle.net/2142/13635.

Getting Started Guide
January 2011 33 http://shm.cs.uiuc.edu
Information provided in this document is connected to the Illinois Structural Health Monitoring Project
(ISHMP) Services Toolsuite developed at the University of Illinois at Urbana-Champaign. This software is
copyrighted by the Board of Trustees of the University of Illinois.
THE UNIVERSITY OF ILLINOIS MAKES NO REPRESENTATIONS ABOUT THE SUITABILITY OF THE SOFTWARE FOR
ANY PURPOSE. IT IS PROVIDED "AS IS" WITHOUT EXPRESS OR IMPLIED WARRANTY.
For inquiries, please contact:
Professor B.F. Spencer, Jr.
University of Illinois at Urbana-Champaign
Department of Civil and Environmental Engineering
2213 Newmark Civil Engineering Laboratory, MC-250
205 North Mathews Ave
Urbana, IL61801
USA
Or visit:
http://vibration.shef.ac.uk/imote2_forum
http://shm.cs.uiuc.edu


![Skaffold - storage.googleapis.com · [getting-started getting-started] Hello world! [getting-started getting-started] Hello world! [getting-started getting-started] Hello world! 5.](https://static.fdocuments.net/doc/165x107/5ec939f2a76a033f091c5ac7/skaffold-getting-started-getting-started-hello-world-getting-started-getting-started.jpg)