GET SOCIAL - etouches€¦ · GET SOCIAL Tweet, follow, share ... Gone with the Wind; ... A score...
37
1 © 2015 Experian Information Solutions, Inc. All rights reserved. Experian Public. GET SOCIAL Tweet, follow, share throughout the session. #vision2016 WITH US #vision2016
Transcript of GET SOCIAL - etouches€¦ · GET SOCIAL Tweet, follow, share ... Gone with the Wind; ... A score...

1 © 2015 Experian Information Solutions, Inc. All rights reserved. Experian Public.
GET SOCIAL Tweet, follow, share
throughout the session.
#vision2016
WITH US
#vision2016

© 2016 Experian Information Solutions, Inc. All rights reserved. Experian and the marks used herein are service marks or registered trademarks of Experian
Information Solutions, Inc. Other product and company names mentioned herein are the trademarks of their respective owners. No part of this copyrighted
work may be reproduced, modified, or distributed in any form or manner without the prior written permission of Experian. Experian Public.
#vision2016
Approve your
declines —
Reject Inference: Are you missing out on profit by declining good customers?

© 2016 Experian Information Solutions, Inc. All rights reserved.
Experian Public.
Introducing:
#vision2016
Steve Gilligan TD Retail Card Services
Mike Long Experian

4 © 2016 Experian Information Solutions, Inc. All rights reserved.
Experian Public. #vision2016
Reject
Inference
Fuzzy logic
is a logic whose
distinguishing features
are logical and fuzzy
and not exact.
“
” — Professor Lofti A. Zadeh

5 © 2016 Experian Information Solutions, Inc. All rights reserved.
Experian Public.
#vision2016
The reject inference classroom!
Academic theory
The real-world!
Common real-world approaches
Client case study – TD Retail Card Services
Are the bad all bad?
Key take aways
Q&A
Reject inference
Approve your declines

6 © 2016 Experian Information Solutions, Inc. All rights reserved.
Experian Public.
#vision2016
What is reject inference?
Approve your declines
Approved applications
Observation dates (Jul-Dec 2014) ------------------ Performance date (April 2016)
Jul
2014
April
2016
Performance
definitions
Bad Consumers who are 90+
days past due , charged
off or bankrupt during the
performance period
Good Consumers who are between
0 and 89 days past due, not
charged off and not bankrupt
during the performance period
Dec
2014 Application Dates
Known
performance

7 © 2016 Experian Information Solutions, Inc. All rights reserved.
Experian Public.
#vision2016
What is reject inference?
Approve your declines
Jul
2014
April
2016
Performance
definitions
Bad Consumers who are 90+
days past due , charged
off or bankrupt during the
performance period
Good Consumers who are between
0 and 89 days past due, not
charged off and not bankrupt
during the performance period
Dec
2014 Application Dates
Unknown
performance
Declined applications
Observation dates (Jul-Dec 2014) ------------------ Performance date (April 2016)

8 © 2016 Experian Information Solutions, Inc. All rights reserved.
Experian Public. #vision2016
The reject inference
classroom
Education is what remains after one has forgotten
everything they learned in school.
— Albert Einstein
“ ”

9 © 2016 Experian Information Solutions, Inc. All rights reserved.
Experian Public.
#vision2016
Academic theory
Approve your declines
Re-weighting
Apply full accept performance distribution by score
Augmentation
Family of methods used to “cluster” similar approved and declined applications together
Data mining (e.g., logistic regression, CHAID, neural networks, etc.)
Manual estimation
Otherwise known as “expert rules”
Use pre-existing knowledge to simulate performance of the declined population

10 © 2016 Experian Information Solutions, Inc. All rights reserved.
Experian Public.
#vision2016
Reclassification
Parceling
Heckman’s bias correction
Monte Carlo parceling
Etc.
Academic theory
Approve your declines
Use known
performance of
your approvals
To guestimate
what would
have happened
to your declines

11 © 2016 Experian Information Solutions, Inc. All rights reserved.
Experian Public.
#vision2016
12 © 2016 Experian Information Solutions, Inc. All rights reserved.
Experian Public.
#vision2016
Sampling
Accept some of the ‘better’ declines
Champion challenge
Compare swap in populations
Common real-world approaches
Approve your declines
13 © 2016 Experian Information Solutions, Inc. All rights reserved.
Experian Public.
#vision2016
Supplementary bureau
inference data
How did the declined population perform elsewhere?
Tradeline level data
Consumer level data
Opened date
Worst performance in past 24 months, 18 months, etc.
Spend
Estimated Interest Rate Calculator (EIRCSM)
Common real-world approaches
Approve your declines

14 © 2016 Experian Information Solutions, Inc. All rights reserved.
Experian Public. #vision2016
“
Client case study –
TD Retail Card
Services
JK Rowling’s first Harry
Potter was rejected 12 times.
Stephen King’s, Carrie; 30
times. Gone with the Wind;
38 times. I beat them all.
— Ashwin Sanghi, Novelist ”

15 © 2016 Experian Information Solutions, Inc. All rights reserved.
Experian Public.
#vision2016
Powers of inferred populations
View you are trying to disprove
Many lenders make the assumptions that booked populations always out perform any segment of the total population (approved, approved not booked and declined)
View is we know our customers best, have the best policy and best price
Other lender's models are inferior to ours
Other lender's process not as good as ours
We know the market the best

16 © 2016 Experian Information Solutions, Inc. All rights reserved.
Experian Public.
#vision2016
Powers of inferred populations
Reality is that is not the case
Inferred population can bring enlightenment into your credit adjudication process
Your assumptions may not be true about performance
Your credit policy may not have evolved as fast other lender's
Market may have shifted
Product offerings may be stall
Adverse selection does occur
Adverse selection could be in the riskiest segment
17 © 2016 Experian Information Solutions, Inc. All rights reserved.
Experian Public.
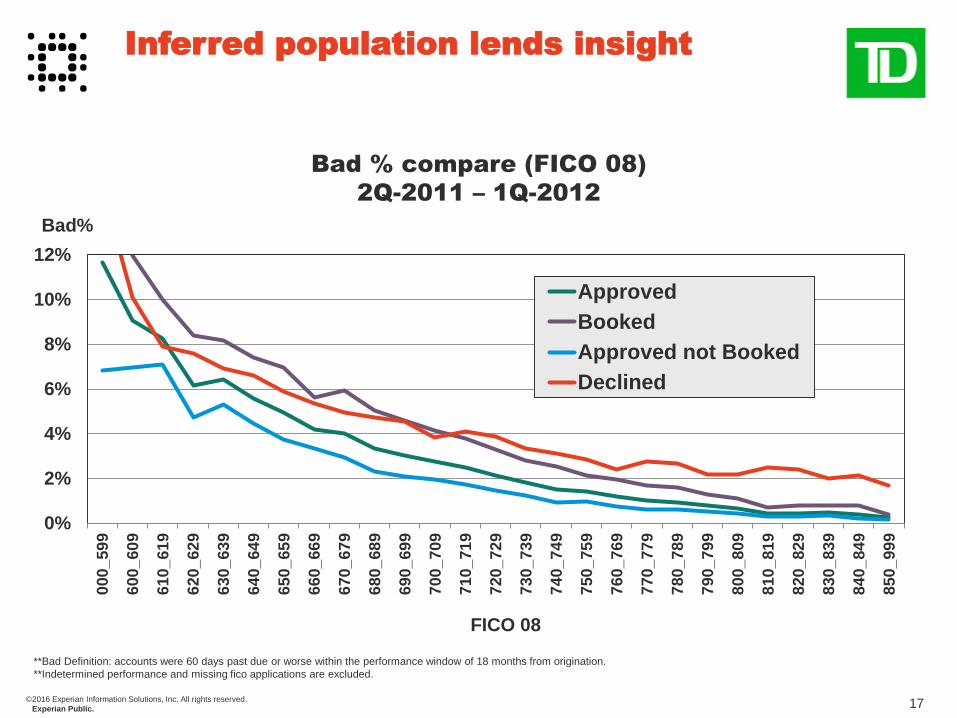
Inferred population lends insight
0%
2%
4%
6%
8%
10%
12%
000
_59
9
600
_60
9
610
_61
9
620
_62
9
630
_63
9
640
_64
9
650
_65
9
660
_66
9
670
_67
9
680
_68
9
690
_69
9
700
_70
9
710
_71
9
720
_72
9
730
_73
9
740
_74
9
750
_75
9
760
_76
9
770
_77
9
780
_78
9
790
_79
9
800
_80
9
810
_81
9
820
_82
9
830
_83
9
840
_84
9
850
_99
9
Bad%
FICO 08
Approved
Booked
Approved not Booked
Declined
**Bad Definition: accounts were 60 days past due or worse within the performance window of 18 months from origination.
**Indetermined performance and missing fico applications are excluded.
Bad % compare (FICO 08)
2Q-2011 – 1Q-2012

18 © 2016 Experian Information Solutions, Inc. All rights reserved.
Experian Public.
#vision2016
Model development used booked and inferred records
TDAF booked data was shared with Experian, with performance appended
TransUnion conducted bureau inferencing on the non-TDAF booked records, identified proxy tradelines, and captured performance
► The proxy tradelines that TransUnion captured and calculated performance represented new auto tradelines that opened within 60 days of application with TDAF
Used 18-month fixed performance window for model development
Inferred performance was weighted so that it represented 30% of the bad population to prevent model being developed on inferred population
Model development
and performance time periods

19 © 2016 Experian Information Solutions, Inc. All rights reserved.
Experian Public.
#vision2016
Model development
and performance time periods
Performance observation window
N
Development
sample
Accepted applications
Rejected applications
TodayN - n
Actual Good/Bad(not Defaulted/
Defaulted)
Inferred Good/Bad
April 2011 March 2012 18 months fixed

20 © 2016 Experian Information Solutions, Inc. All rights reserved.
Experian Public. #vision2016
Are the bad all bad?
The best people are always
the worst. — Criss Jami, Philosopher
“ ”

21 © 2016 Experian Information Solutions, Inc. All rights reserved.
Experian Public.
#vision2016
Are the bad all bad? – Data overview
Approve your declines
Input file
120,626 consumers
Approved & booked
74,916
Declined & booked elsewhere
14,806
Declined & not booked elsewhere
30,904
3,596 Bad
4.8%
3,597 Bad
24.3%
6,222 Bad
20.1%
35,891
Good consumers
Bad
Consumers who are
90+ days past due,
charged off or bankrupt

22 © 2016 Experian Information Solutions, Inc. All rights reserved.
Experian Public.
Estimation of a consumer’s liquid assets. Score range 1 – 999
A score of 999 means that the consumer is likely to have more liquid assets than 99.9% of the population
Credit score model. Predicts the likelihood that a consumer will go delinquent (90+ DPD) in the next 24 months
Score range 300-850: Super Prime 751-850; Prime 661-780; Near Prime 601-660; Sub-Prime 500-600; Deep Sub-Prime 300-499
Total dollar spend on charge / bank cards in most recent 12 months
Model predicting dollar amount of salaried income rounded to the nearest thousand
Output range $1K to $999K
Are the bad all bad? – Consumer profiling
Using Experian scoring models: Approve your declines
VantageScore® 3.0
Total Annual
Plastic Spend
(Experian TAPSSM
)
Asset Insight®
Income Insight W2SM

23 © 2016 Experian Information Solutions, Inc. All rights reserved.
Experian Public.
#vision2016
Are the bad all bad? – Consumer profiling
Using Experian scoring models: Approve your declines
Score averages
Score model All
consumers Approved
Declined /
booked
elsewhere
Declined /
not booked
elsewhere
VantageScore® 3.0 688 751 588 578
Total Annual
Plastic Spend
(Experian TAPSSM)
$20,106 $25,163 $9,917 $9,844
Asset Insight® 449 612 186 171
Income Insight W2SM $51,745 $57,883 $42,203 $40,954
Declined applicants
have a significantly
worse credit profile
More likely to default
Use a lot less plastic
Hold less liquid
assets
Have a lower salary

24 © 2016 Experian Information Solutions, Inc. All rights reserved.
Experian Public.
#vision2016
Picking the good from the bad
Approve your declines
37.3%
51.6%
73.5%
0%
10%
20%
30%
40%
50%
60%
10% 20% 30%
% B
ad
ac
co
un
ts
Worst Scoring
TAPS
Asset Insight
Income Ins W2
Percent of bads captured for the worst scoring consumers

25 © 2016 Experian Information Solutions, Inc. All rights reserved.
Experian Public.
0%
20%
40%
60%
80%
100%
0% 10% 20% 30% 40% 50% 60% 70% 80% 90% 100%
Cu
mu
tlati
ve
% b
ad
/ g
oo
d a
cc
ou
nts
Cumulative % all accounts
Cumulative % Bad Accounts Cumulative % Good Accounts
Worst
Scoring
Best
Scoring
KS = 23.4%
Picking the good from the bad
Approve your declines
= Point of
greatest
separation =
KS
statistic
Kolmogorov-Smirnov (KS) statistics

26 © 2016 Experian Information Solutions, Inc. All rights reserved.
Experian Public.
#vision2016
23.40%
11.75%
7.88%
0%
5%
10%
15%
20%
25%
TAPS Asset Insight Income Ins W2
Picking the good from the bad
Approve your declines
Kolmogorov-Smirnov (KS) statistics
27 © 2016 Experian Information Solutions, Inc. All rights reserved.
Experian Public.
0%
10%
20%
30%
40%
50%
10% 20% 30% 40% 50% 60% 70% 80% 90% 100% Exculsions
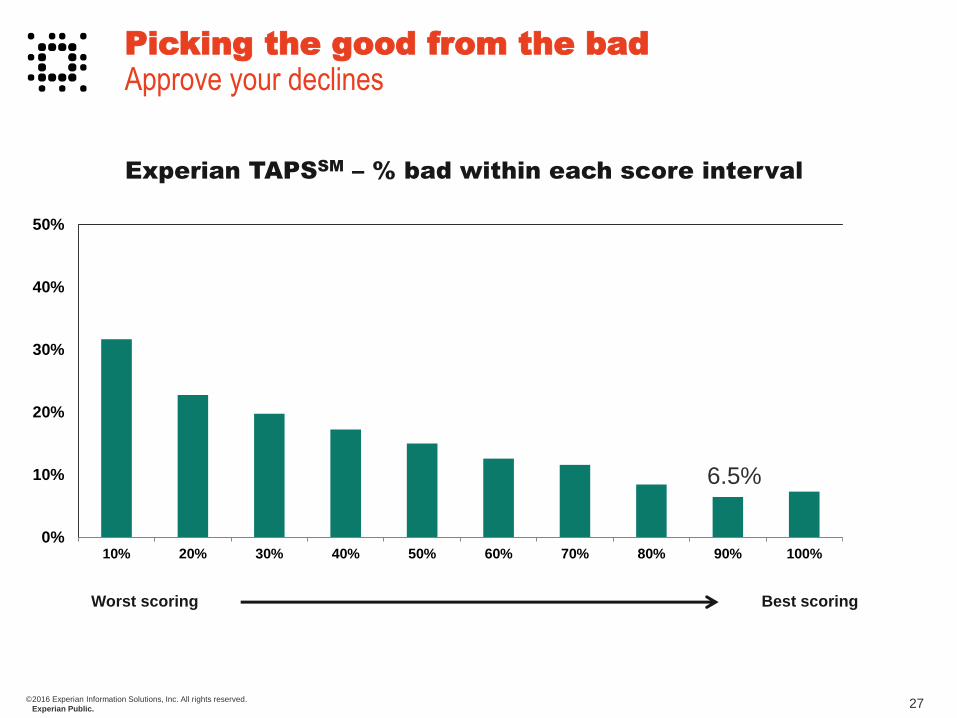
Picking the good from the bad
Approve your declines
Worst scoring Best scoring
Experian TAPSSM
– % bad within each score interval
6.5%

28 © 2016 Experian Information Solutions, Inc. All rights reserved.
Experian Public.
#vision2016
97.4% 99.9%
92.2%
Picking the good from the bad
Approve your declines
Combine VantageScore® 3.0 with Experian TAPS
SM
% bad within each score interval

29 © 2016 Experian Information Solutions, Inc. All rights reserved.
Experian Public.
#vision2016
Picking the good from the bad
Approve your declines
37.3%
51.6%
73.5%
0%
10%
20%
30%
40%
50%
60%
70%
10% 20% 30%
% B
ad
ac
co
un
ts
Worst scoring
TAPS
Asset Insight
Income Ins W2
TAPS with VantageScore 3.0
Percent of bads captured for the worst scoring consumers

30 © 2016 Experian Information Solutions, Inc. All rights reserved.
Experian Public.
#vision2016
Picking the good from the bad
Approve your declines
23.40%
11.75%
7.88%
36.11%
0%
5%
10%
15%
20%
25%
30%
35%
40%
TAPS Asset Insight Income Ins W2 TAPS withVantageScore 3.0
Kolmogorov-Smirnov (KS) statistics

31 © 2016 Experian Information Solutions, Inc. All rights reserved.
Experian Public.
Are the bad all bad?
Approve your declines
This population contains 6,628 declined consumers
6,310 good consumers (18% of the 35K)
► At a bad rate of 4.8%
Reduce
declines by
nearly 20%!!
Is there a declined population with a bad rate of 4.8%?

32 © 2016 Experian Information Solutions, Inc. All rights reserved.
Experian Public. #vision2016
Key take aways
Only those who risk going too far
can possibly find out how far one can go.
— T.S. Eliot
“ ”

33 © 2016 Experian Information Solutions, Inc. All rights reserved.
Experian Public.
Reject inference
Increases approval rates
Increases profits
Is essential to keep yourself ahead
Reject inference
Approve your declines
Multiple academic methodologies
► Using approval performance to guesstimate bad performance
Real-world approaches – sampling and supplemental bureau data
The bad are not all bad
► Bureau scores help pick the good declines from the bad
► Combining scores provides greater differentiation

34 © 2016 Experian Information Solutions, Inc. All rights reserved.
Experian Public.
#vision2016
Q&A

35 © 2016 Experian Information Solutions, Inc. All rights reserved.
Experian Public.
For additional information,
please contact:
@ExperianVision | #vision2016
Follow us on Twitter:
#vision2016 [email protected]
https://www.linkedin.com/in/michael-long-4a378b42/

36 © 2016 Experian Information Solutions, Inc. All rights reserved.
Experian Public.
Share your thoughts about Vision 2016!
Please take the time now to give us your feedback about this session. You can complete the survey in the mobile app or request a paper survey.
Select the breakout
session you attended
Select the Survey
button and complete 1 2
#vision2016

37 © 2016 Experian Information Solutions, Inc. All rights reserved.
Experian Public. #vision2016