Germany 50 2017 - Brand Valuation...
10
Germany 50 2017 The annual report on the most valuable German brands May 2017
-
Upload
trinhthuan -
Category
Documents
-
view
213 -
download
0
Transcript of Germany 50 2017 - Brand Valuation...

Germany 502017The annual report on the most valuable German brandsMay 2017

Brand Finance Germany 50 May 2017 3.Brand Finance Australia 100 March 2016 2. 3.Brand Finance Global 500 February 2016 2. Brand Finance Airlines 30 30 February 2015 2.
Brand Finance Germany 50 May 2017 2.
Foreword.
Foreword 2
Definitions 4
Methodology 6
Executive Summary 8
Full Table (EURm) 12
Full Table (USDm) 13
Understand Your Brand’s Value 14
How We Can Help 16
Contact Details 17
Contents
David Haigh, CEO, Brand Finance
What is the purpose of a strong brand; to attract customers, to build loyalty, to motivate staff? All true, but for a commercial brand at least, the first answer must always be ‘to make money’.
Huge investments are made in the design, launch and ongoing promotion of brands. Given their potential financial value, this makes sense. Unfortunately, most organisations fail to go beyond that, missing huge opportunities to effectively make use of what are often their most important assets. Monitoring of brand performance should be the next step, but is often sporadic. Where it does take place it frequently lacks financial rigour and is heavily reliant on qualitative measures poorly understood by non-marketers.
As a result, marketing teams struggle to communicate the value of their work and boards then underestimate the significance of their brands to the business. Skeptical finance teams, unconvinced by what they perceive as marketing mumbo jumbo may fail to agree necessary investments. What marketing spend there is can end up poorly directed as marketers are left to operate with insufficient financial guidance or accountability. The end result can be a slow but
steady downward spiral of poor communication, wasted resources and a negative impact on the bottom line.
Brand Finance bridges the gap between the marketing and financial worlds. Our teams have experience across a wide range of disciplines from market research and visual identity to tax and accounting. We understand the importance of design, advertising and marketing, but we also believe that the ultimate and overriding purpose of brands is to make money. That is why we connect brands to the bottom line.
By valuing brands, we provide a mutually intelligible language for marketers and finance teams. Marketers then have the ability to communicate the significance of what they do and boards can use the information to chart a course that maximises profits. Without knowing the precise, financial value of an asset, how can you know if you are maximising your returns? If you are intending to license a brand, how can you know you are getting a fair price? If you are intending to sell, how do you know what the right time is? How do you decide which brands to discontinue, whether to rebrand and how to arrange your brand architecture? Brand Finance has conducted thousands of brand and branded business valuations to help answer these questions.
Brand Finance’s recently conducted share price study revealed the compelling link between strong brands and stock market performance. It was found that investing in the most highly branded companies would lead to a return almost double that of the average for the S&P 500 as a whole. Acknowledging and managing a company’s intangible assets taps into the hidden value that lies within it. The following report is a first step to understanding more about brands, how to value them and how to use that information to benefit the business. The team and I look forward to continuing the conversation with you.

Brand Finance Germany 50 May 2017 5.Brand Finance Germany 50 May 2017 4.
Definitions
Definitions+ Enterprise Value – the value of the
entire enterprise, made up of multiple branded businesses
+ Branded Business Value – the value of a single branded business operating under the subject brand
+ Brand Contribution– The total economic benefit derived by a business from its brand
+ Brand Value – the value of the trade marks (and relating marketing IP and ‘goodwill’ attached to it) within the branded business
‘Branded Business’
‘Branded Enterprise’
E.g.Volkswagen
AG
E.g.Porsche
E.g.Porsche
‘Brand Value’
‘Branded Business’
‘Branded Enterprise’
‘Brand’ Contribution’
E.g.Porsche
Branded Business Value
A brand should be viewed in the context of the business in which it operates. For this reason Brand Finance always conducts a Branded Business Valuation as part of any brand valuation. Where a company has a purely mono-branded architecture, the business value is the same as the overall company value or ‘enterprise value’.
In the more usual situation where a company owns multiple brands, business value refers to the value of the assets and revenue stream of the business line attached to that brand specifically. We evaluate the full brand value chain in order to understand the links between marketing investment, brand tracking data, stakeholder behaviour and business value to maximise the returns business owners can obtain from their brands.
Brand Contribution
The brand values contained in our league tables are those of the potentially transferable brand asset only, but for marketers and managers alike, an assessment of overall brand contribution to a business provides powerful insights to help optimise performance.
Brand Contribution represents the overall uplift in shareholder value that the business derives from owning the brand rather than operating a generic brand.
Brands affect a variety of stakeholders, not just customers but also staff, strategic partners, regulators, investors and more, having a significant impact on financial value beyond what can be bought or sold in a transaction.
Brand Value
In the very broadest sense, a brand is the focus for all the expectations and opinions held by customers, staff and other stakeholders about an organisation and its products and services. However, when looking at brands as business assets that can be bought, sold and licensed, a more technical definition is required.
Brand Finance helped to craft the internationally recognised standard on Brand Valuation, ISO 10668. That defines a brand as “a marketing-related intangible asset including, but not limited to, names, terms, signs, symbols, logos and designs, or a combination of these, intended to identify goods, services or entities, or a combination of these, creating distinctive images and associations in the minds of stakeholders, thereby generating economic benefits/value”.
Brand Strength
Brand Strength is the part of our analysis most directly and easily influenced by those responsible for marketing and brand management. In order to determine the strength of a brand we have developed the Brand Strength Index (BSI). We analyse marketing investment, brand equity (the goodwill accumulated with customers, staff and other stakeholders) and finally the impact of those on business performance.
Following this analysis, each brand is assigned a BSI score out of 100, which is fed into the brand value calculation. Based on the score, each brand in the league table is assigned a rating between AAA+ and D in a format similar to a credit rating. AAA+ brands are exceptionally strong and well managed while a failing brand would be assigned a D grade.
Effect of a Brand on Stakeholders
PotentialCustomers
ExistingCustomers
Influencerse.g. Media
TradeChannels
StrategicAllies &
Suppliers Investors
Debt providers
Sales
Production
All OtherEmployees
MiddleManagers
Directors
Brand

Brand Finance Germany 50 May 2017 7.Brand Finance Germany 50 May 2017 6.
Methodology
Inputs StakeholderBehaviour PerformanceBrand Equity
Value DriversBrand
Contribution
Audit the impact of brand management and investment on brand equity
Run analytics to understand how perceptions link to behaviour
Link stakeholder behaviour with key financial value drivers
Model the impact of behaviour on core financial performance and isolating the value of the brand contribution
Brand Audit Trial & Preference Acquisition & Retention
Valuation Modelling
1 2 3 4
Brand Finance Typical Project ApproachBrand Finance calculates the values of the brands in its league tables using the ‘Royalty Relief approach’. This approach involves estimating the likely future sales that are attributable to a brand and calculating a royalty rate that would be charged for the use of the brand, i.e. what the owner would have to pay for the use of the brand—assuming it were not already owned.
Brand strength expressed as a BSI score out of 100.
BSI score applied to an appropriate sector royalty rate range.
Royalty rate applied to forecast revenues to derive brand values.
Post-tax brand revenues are discounted to a net present value (NPV) which equals the brand value.
The steps in this process are as follows:
1 Calculate brand strength on a scale of 0 to 100 based on a number of attributes such as emotional connection, financial performance and sustainability, among others. This score is known as the Brand Strength Index, and is calculated using brand data from the BrandAsset® Valuator database, the world’s largest database of brands, which measures brand equity, consideration and emotional imagery attributes to assess brand personality in a category agnostic manner.
Strong brand
Weak brand
Brand strength index(BSI)
Brand‘Royalty rate’
Brand revenues Brand value
Forecast revenues
Brand investment
Brand equity
Brand performance
2 Determine the royalty rate range for the respective brand sectors. This is done by reviewing comparable licensing agreements sourced from Brand Finance’s extensive database of license agreements and other online databases.
3 Calculate royalty rate. The brand strength score is applied to the royalty rate range to arrive at a royalty rate. For example, if the royalty rate range in a brand’s sector is 0-5% and a brand has a brand strength score of 80 out of 100, then an appropriate royalty rate for the use of this brand in the given sector will be 4%.
4 Determine brand specific revenues estimating a proportion of parent company revenues attributable to a specific brand.
5 Determine forecast brand specific revenues using a function of historic revenues, equity analyst forecasts and economic growth rates.
6 Apply the royalty rate to the forecast revenues to derive brand revenues.
7 Brand revenues are discounted post tax to a net present value which equals the brand value.
League Table Valuation Methodology
How We Help to Maximise Value
6. Build scale through licensing/franchising/partnerships
5. Build core business through market expansion
4. Build core business through product development
3. Portfolio management/rebranding Group companies
2. Optimise brand positioning and strength
1. Base-case brand and business valuation(using internal data), growth strategyformulation, target-setting, scorecard andtracker set-up
Evaluate ongoing performance
Current brand and business value
Target brand and business value
Max
imis
ing
a st
rong
bra
nd

Brand Finance Germany 50 May 2017 9.Brand Finance Germany 50 May 2017 8.
Nivea is Germany’s most powerful brand with a Brand Strength Index (BSI) score of 88. Nivea has developed high levels of consumer trust for the superior quality and reliability of its products but this has been complemented by increasingly innovative advertising. Its sunscreen has been promoted with creative campaigns including a doll that turns red in hot weather to remind children of the risk of sunburn, a waterslide that dispenses waterproof sunscreen and even a model seagull that dispenses sun cream from its rear end. Though derided by some, it is an example of the commitment to improving customer wellbeing that has built Nivea’s brand over many years.
That being said, its communications strategy has not always been so astute. Nivea attracted condemnation this year for its ‘white is purity’ campaign, perceived by many as racially insensitive. The strength of Nivea’s brand has
enabled it to ride out this misstep, however greater oversight of its marketing communications may be required to ensure it remains the nation’s most powerful brand.
Valued at €33 billion, BMW has maintained its position as the most valuable German brand for the third year in a row. BMW celebrated its 100th anniversary in 2016; its heritage is a key driver of demand and customer loyalty. At the same time, investments in innovation, such as the BMW i electric car sub-brand, are positioning BMW well for the future. 2016 saw BMW set new records with net profi t at €6.9 billion and revenue at €94.2 billion.
The automotive industry remains Germany’s top sector by brand value, with many other car brands placing highly. Mercedes-Benz claims third place in Brand Finance Germany 50 with a brand value of €31.6 billion. Record demand for
Germany50
Executive Summary
Rank 2017: 1 2016: 1 BV 2017: EUR 33,029m BV 2016: EUR 32,172mBrand Rating: AAA-
Rank 2017: 2 2016: 2 BV 2017: EUR 32,414m BV 2016: EUR 30,540mBrand Rating: AA+
Rank 2017: 5 2016: 4 BV 2017: EUR 20,541mBV 2016: EUR 17,483mBrand Rating: AAA-
1
2
5
+3%
+6%
Rank 2017: 6 2016: 7 BV 2017: EUR 16,007m BV 2016: EUR 14,364mBrand Rating: AAA-
Rank 2017: 7 2016: 6 BV 2017: EUR 13,521m BV 2016: EUR 15,113mBrand Rating: AA
Rank 2017: 8 2016: 10 BV 2017: EUR 13,486m BV 2016: EUR 8,379mBrand Rating: AA-
Rank 2017: 9 2016: 8 BV 2017: EUR 11,162m BV 2016: EUR 9,050mBrand Rating: AAA-
6
7
8
9
+11%
-11%
+23%
+17%
Rank 2017: 3 2016: 3 BV 2017: EUR 31,623mBV 2016: EUR 29,487mBrand Rating: AAA-
3
Rank 2017: 4 2016: 5 BV 2017: EUR 22,255m BV 2016: EUR 17,410mBrand Rating: AAA
4 +28%
Rank 2017: 10 2016: 18 BV 2017: EUR 11,029m BV 2016: EUR 4,106mBrand Rating: AAA
10+169%
+7% +61%
the brand’s vehicles since the launch of the new E-Class Saloon last year was a particular source of strength. Like BMW, Mercedes-Benz is preparing for the growing spending power of the millennial generation. A new marketing strategy has been announced, based on “human-centred innovation” and “customised agencies”. Its humorous Superbowl advert is one of the fi rst examples of the new approach. The more “casual” and “light-hearted” image is intended to make the brand more appealing to young people, for whom the technical specifi cations of Mercedes’ engineering excellence may be less relevant.
Volkswagen has a brand value of €22.255 billion, regaining traction after the 2015 emissions scandal. Other Volkswagen Group brands include Audi which is ninth, with a brand value of €11.2 billion, and Porsche which is tenth place with a brand value of €11 billion.
T (Deutsche Telekom) defends second place with a brand value of €32.4 billion. T is Europe’s most valuable telecoms brand (as noted in the Brand Finance Telecoms 500 report), though its growth can largely be attributed to performance outside the continent. In Q1 2017, new customer acquisitions in the US exceeded market expectations, continuing the rapid growth which saw 4.1 million new subscribers join the network in 2016. T is also reinforcing its brand at home however. It is investing in bringing faster internet connections to 1.4 million German households, and on promotions including creative projects such as the recently launched Lenz App, which reacts to anything magenta, the brand’s colour.
With a record brand value decline year on year of 43%, Deutsche Bank must hope that strong fi nancial results for the fi rst three months of 2017 are the fi rst signs of its long-awaited recovery.

Brand Finance Germany 50 May 2017 11.Brand Finance Germany 50 May 2017 10.
Executive Summary
BSI Score
87.6BSI Score
86.0BSI Score
84.9BSI Score
84.5BSI Score
83.4BSI Score
82.1BSI Score
82.0BSI Score
81.6BSI Score
80.3BSI Score
80.2
The 10 Most Powerful BrandsThese are the most powerful German brands, whose rating is based on Brand Finance’s Brand Strength Index (BSI).
0
5
10
15
20
25
30
35
Siemens
Volkswagen
Mercedes-Benz
T (Deutsche Telekom in Germany)
BMW
2017201620152014201320122011
Bra
nd
Val
ue
(EU
Rm
)
Brand Value Over Time
-4000.000000-2357.142857-714.285714928.5714292571.4285714214.2857145857.1428577500.000000
Deutsche Bank
Allianz
Lidl
Commerzbank
Metro Cash & Carry
EnBW
DZ Bank
Continental
Hugo Boss
DB
BMW
Bosch
T (Deutsche Telekom in Germany)
Audi
Mercedes-Benz
Adidas
Siemens
Volkswagen
SAP
Porsche 6,923
5,107
4,845
3,059
2,517
2,137
2,113
1,874
1,643
857
-65.0-38.5-12.014.541.067.594.0120.5147.0173.5200.0
Deutsche Bank
Commerzbank
EnBW
Metro Cash & Carry
Hugo Boss
DZ Bank
Allianz
Lidl
Continental
DB
Puma
Munich Re
Volkswagen
Infineon Technologies
Opel
MAN
Adidas
Hannover Re
SAP
Porsche
-211
-254
-259
-265
-462
-551
-801
-818
-1,592
-3,378
169%
61%
41%
39%
36%
33%
32%
28%
24%
24%
-7%
-7%
-10%
-11%
-11%
-11%
-16%
-23%
-32%
-43%
Brands – BV Change (EURm)
Brands – BV Change (%)
-4000.000000-2357.142857-714.285714928.5714292571.4285714214.2857145857.1428577500.000000
Deutsche Bank
Allianz
Lidl
Commerzbank
Metro Cash & Carry
EnBW
DZ Bank
Continental
Hugo Boss
DB
BMW
Bosch
T (Deutsche Telekom in Germany)
Audi
Mercedes-Benz
Adidas
Siemens
Volkswagen
SAP
Porsche 6,923
5,107
4,845
3,059
2,517
2,137
2,113
1,874
1,643
857
-65.0-38.5-12.014.541.067.594.0120.5147.0173.5200.0
Deutsche Bank
Commerzbank
EnBW
Metro Cash & Carry
Hugo Boss
DZ Bank
Allianz
Lidl
Continental
DB
Puma
Munich Re
Volkswagen
Infineon Technologies
Opel
MAN
Adidas
Hannover Re
SAP
Porsche
-211
-254
-259
-265
-462
-551
-801
-818
-1,592
-3,378
169%
61%
41%
39%
36%
33%
32%
28%
24%
24%
-7%
-7%
-10%
-11%
-11%
-11%
-16%
-23%
-32%
-43%
Colour Industry Total Value (EURm)
Proportion
Automobiles 115,503 34%
Engineering & Construction 40,285 12%
Telecoms 32,415 9%
Retail 30,626 9%
Insurance 20,883 6%
Technology 15,561 5%
Logistics 14,729 4%
Apparel 13,106 4%
Utilities 10,943 3%
Chemicals 10,399 3%
Others 37,598 11%
Total 342,048 100%
Total Brand Value by Sector 2017
Automobiles34%
Retail9%
Engineering & Construction
12%
Telecoms9%
Brand Finance Germany 50 May 2017 13.Brand Finance Germany 50 May 2017 12.
Top 50 most valuable German brands 1 - 50.
Rank2017
Rank2016 Brand name Sector Brand Value
(EURm)2017
%change
Brand Value (EURm)
2016
Brandrating2017
Brandrating2016
1 1 BMW Automobiles 33,030 3% 32,172 AAA- AAA2 2 T (Deutsche Telekom in Telecoms 32,415 6% 30,540 AA+ AA+3 3 Mercedes-Benz Automobiles 31,623 7% 29,486 AAA- AAA4 5 Volkswagen Automobiles 22,255 28% 17,410 AAA AA+5 4 Siemens Engineering & Construction 20,541 17% 17,482 AAA- AA+6 7 Bosch Engineering & Construction 16,006 11% 14,363 AAA- AAA-7 6 Allianz Insurance 13,521 -11% 15,113 AA AA8 10 SAP Technology 13,486 61% 8,378 AA- AA9 8 Audi Automobiles 11,162 23% 9,049 AAA- AAA-10 18 Porsche Automobiles 11,029 169% 4,106 AAA AAA11 9 DHL12 14 Adidas13 11 ALDI14 12 Lidl15 15 E.ON16 17 Nivea17 16 BASF18 20 Fresenius19 13 Deutsche Bank20 19 Bayer21 23 Edeka22 28 Munich Re23 24 TUI24 33 MAN25 21 Continental26 32 Opel27 25 RWE28 27 Deutsche Post29 22 Metro Cash & Carry30 34 Evonik Industries31 26 DB32 35 Thyssenkrupp33 29 Zalando34 39 HeidelbergCement35 New Kaufl and36 38 Schwarzkopf37 37 Ergo38 31 DZ Bank39 46 Infi neon Technologies40 36 Hugo Boss41 New Puma42 41 Lufthansa43 43 Media-Saturn44 45 Linde45 48 Hannover Re46 42 Otto47 30 Commerzbank48 40 EnBW49 47 BayWa50 New Osram
Brand Finance Germany 50 (EURm)
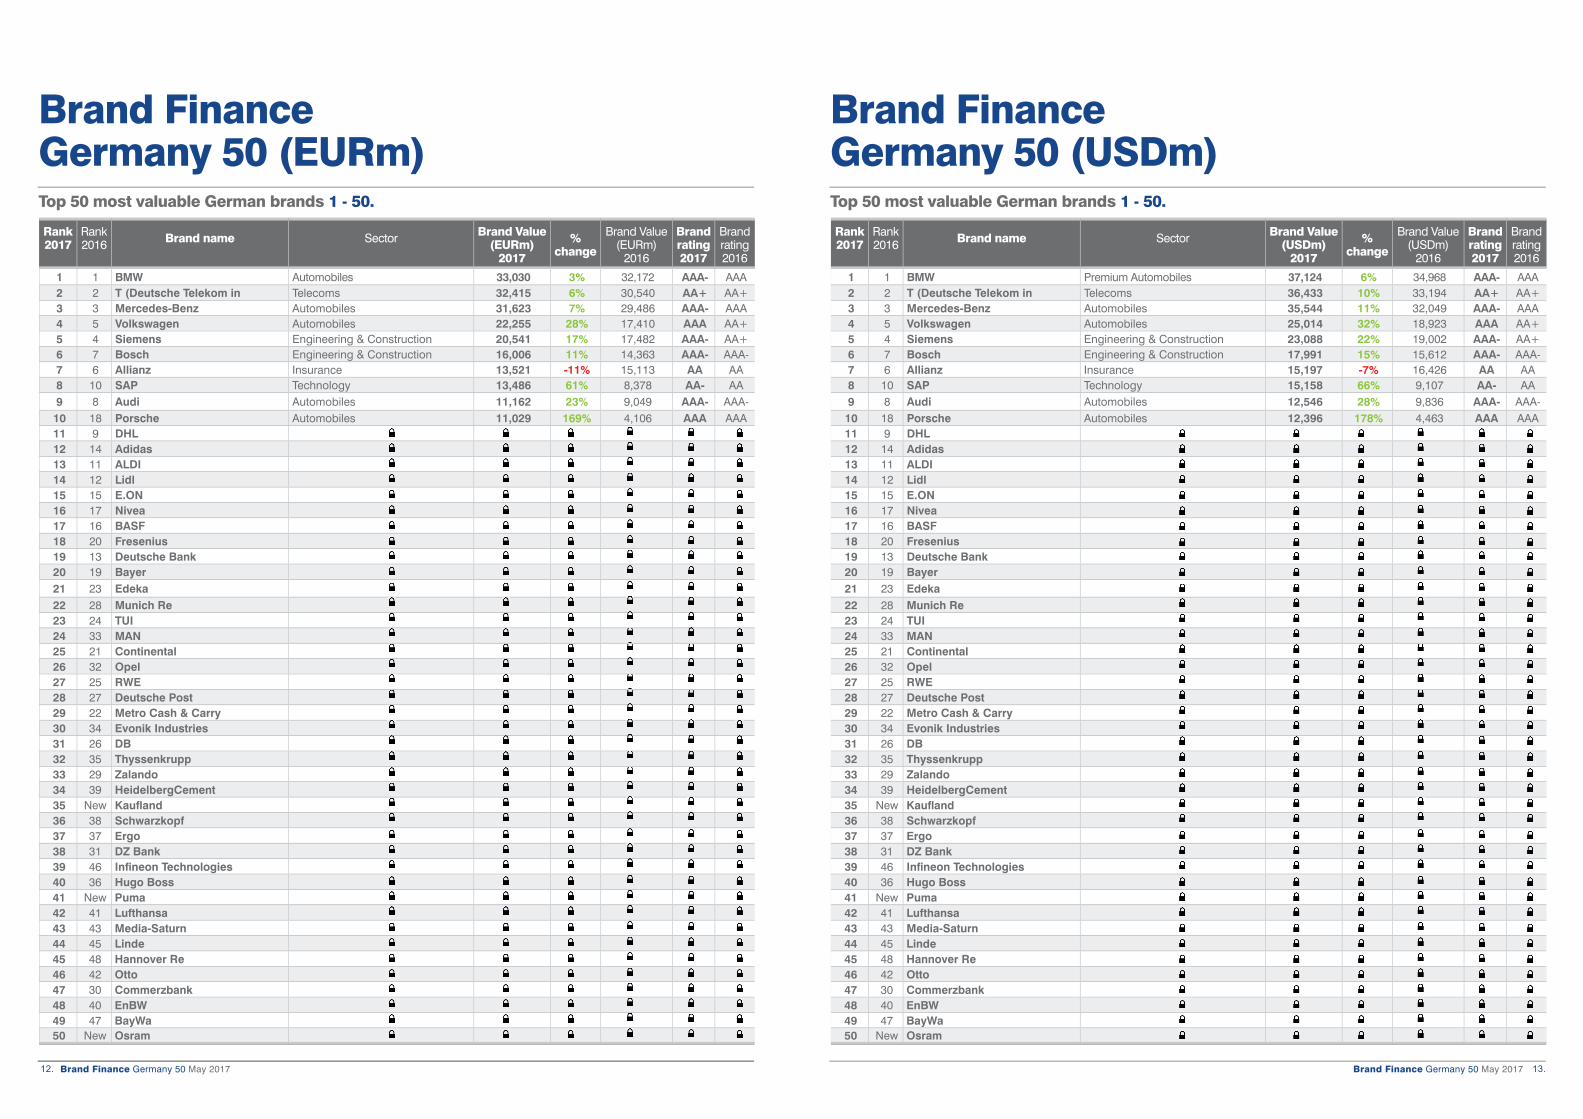
Top 50 most valuable German brands 1 - 50.
Rank2017
Rank2016 Brand name Sector Brand Value
(USDm)2017
%change
Brand Value (USDm)
2016
Brandrating2017
Brandrating2016
1 1 BMW Premium Automobiles 37,124 6% 34,968 AAA- AAA2 2 T (Deutsche Telekom in Telecoms 36,433 10% 33,194 AA+ AA+3 3 Mercedes-Benz Automobiles 35,544 11% 32,049 AAA- AAA4 5 Volkswagen Automobiles 25,014 32% 18,923 AAA AA+5 4 Siemens Engineering & Construction 23,088 22% 19,002 AAA- AA+6 7 Bosch Engineering & Construction 17,991 15% 15,612 AAA- AAA-7 6 Allianz Insurance 15,197 -7% 16,426 AA AA8 10 SAP Technology 15,158 66% 9,107 AA- AA9 8 Audi Automobiles 12,546 28% 9,836 AAA- AAA-10 18 Porsche Automobiles 12,396 178% 4,463 AAA AAA11 9 DHL12 14 Adidas13 11 ALDI14 12 Lidl15 15 E.ON16 17 Nivea17 16 BASF18 20 Fresenius19 13 Deutsche Bank20 19 Bayer21 23 Edeka22 28 Munich Re23 24 TUI24 33 MAN25 21 Continental26 32 Opel27 25 RWE28 27 Deutsche Post29 22 Metro Cash & Carry30 34 Evonik Industries31 26 DB32 35 Thyssenkrupp33 29 Zalando34 39 HeidelbergCement35 New Kaufl and36 38 Schwarzkopf37 37 Ergo38 31 DZ Bank39 46 Infi neon Technologies40 36 Hugo Boss41 New Puma42 41 Lufthansa43 43 Media-Saturn44 45 Linde45 48 Hannover Re46 42 Otto47 30 Commerzbank48 40 EnBW49 47 BayWa50 New Osram
Brand Finance Germany 50 (USDm)

Brand Finance Germany 50 May 2017 15.Brand Finance Germany 50 May 2017 14.
Understand Your Brand’s Value
$707
$6,265
$3,031 $2,328 $1,913
213 275
320
607
729
650
0
100
200
300
400
500
600
700
800
2011 2012 2013 2014 2015 2016
58%
37%
4%
Nutrition
Performance Materials
Other Activities
Brand Value Dashboard
$707m AA+78/100
$10,216m
Peer Group Comparison (USDm)Historic brand value performance
Brand Value by Product Segment
7%
Brand Value
€650mEnterprise Value
€9,399m(EUR) (EUR)
(EURm)
$882mBrand Value
€729m(EUR)[XXX]
[XXX]
A Brand Value Report provides a complete breakdown of the assumptions, data sources and calculations used to arrive at your brand’s value. Each report includes expert recommendations for growing brand value to drive business performance and offers a cost-effective way to gaining a better understanding of your position against competitors.
A full report includes the following sections which can also be purchased individually.
Brand Valuation Summary Overview of the brand valuation including executive summary, explanation of changes in brand value and historic and peer group comparisons.
+ Internal understanding of brand+ Brand value tracking+ Competitor benchmarking+ Historical brand value
Brand Strength Index
A breakdown of how the brand performed on various metrics of brand strength, benchmarked against competitor brands in a balanced scorecard framework.
+ Brand strength tracking+ Brand strength analysis+ Management KPI’s+ Competitor benchmarking
Brand PerformanceAn ideal balanced scorecard of fundamental brand related measures
Brand Performance
Brand Strength Index
The brand’s ability to drive a volume premium. Implied by current and future revenue.
The brand’s ability to drive a price premium. Implied by current and future margins.
The brand’s ability to improve business prospects across
various KPIs
Revenue Margin % Forecast Revenue Growth % Forecast Margin %
6.25% 6.25% 6.25%
Dow Akzo Nobel Du Pont
Effective Weighting
Best in Class
6.25%
Akzo Nobel
8.98.1
5.0
8.9
0.0
2.0
4.0
6.0
8.0
10.0
DSM Best in Class Competitor Average[XXX]
Drivers of ChangeThree key areas impact Brand Value (EURm)
Brand Strength
[XXX]’s brand strength has increased compared to last year.
As the brand continues its sustainability drive, [XXX] hasbeen improving across all CSR scores. It now has thehighest CSR scores it has had in the last four years acrossEnvironment, Employees and Governance.
The premium approach is also leading to significant marginadvantages – positively affecting “performance”.
Business Outlook
Brands drive higher revenues. An investor would thereforepay more for a brand that makes more money.
[XXX]’s revenue base and the 5 year forecast growth havefallen this year, resulting in a loss of $177m USD to totalbrand value.
However, it is important to note that this has arisen as aresult of the company divesting a number of divisions.
Economic Outlook
All future returns are subject to risk. If the risk of notreceiving the forecast returns is higher (increasing thediscount rate), the brand’s market is not growing as quicklyas expected (lower long term growth rate) or the tax rate inthe brand’s regions of operation is higher, then the brand’svalue is reduced and vice versa.
2016 2015
Discount Rate 9.1% 8.6%
Long Term Growth 3.2% 2.6%
Tax 28.9% 30.2%
2016 2015
5 Year Forecast Growth 2.6% 3.4%
Base Year Revenue (EURm) 8,205 9,570
2016 2015
BrandStrength 78 76
729 729 616 616 650
18 13134
2015 Brand Strength Business Performance External Changes 2016
Brand InvestmentProven inputs that drive the Brand Equity and financial results
Relative quality of the brand’s investment in its products. The measure can include R&D spend and capital expenditure.
Relative quality of a brand’s distribution network. It can include the quality of logistical infrastructure available to the brand, the quality of its online presence, or the number and quality of its retail outlets.
Relative quality of the human network supporting the brand. This may include the size of the support network, its likely future growth or the investment in workforce training and human resources.
Relative quality of the brand’s promotions. Marketing investment, the quality of visual identity and the effectiveness of the brand’s social media is covered by this measure.
Product Place People Promotion
Brand Investment
Brand Strength Index
6.25% 6.25% 6.25%
Du Pont Multiple Akzo Nobel
Effective Weighting
Best in Class
6.25%
[XXX]
7.7
9.3
5.36.4
0.0
2.0
4.0
6.0
8.0
10.0
DSM Best in Class Competitor Average[XXX]
Royalty Rates
Analysis of competitor royalty rates, industry royalty rate ranges and margin analysis used to determine brand specific royalty rate.
+ Transfer pricing+ Licensing/ franchising negotiation+ International licensing+ Competitor benchmarking
Cost of Capital
A breakdown of the cost of capital calculation, including risk free rates, brand debt risk premiums and the cost of equity through CAPM.
+ Independent view of cost of capital for internal valuations and project appraisal exercises
Trademark Audit
Analysis of the current level of protection for the brands word marks and trademark iconography highlighting areas where the marks are in need of protection.
+ Highlight unprotected marks + Spot potential infringement+ Trademark registration strategy
For more information regarding our Brand Value Reports, please contact:
Alex HaighDirector of League Tables, Brand Finance
+44 (0)20 7389 9400
Brand Strength Index 2016An ideal balanced scorecard of fundamental brand related measures
Widely recognised factors deployed by Marketers to create brand loyalty and market share. We therefore benchmark brands against relevant input measures by sector against each of these factors.
How do stakeholders feel about the brand vs. competitors?
• Brand equity accounts for 50% to reflect the importance of stakeholder perceptions to behaviour
• Brand Equity is important to all stakeholder groups with customers being the most important
Quantitative market, market share and financial measures resulting from the strength of the brand.
BSI Attributes
Product: R&D expenditure,Capital expenditure
Place: Website Ranking
People: Number of Employees,Employee Growth
Promotion: Marketing expenditure
FamiliarityConsiderationPreferenceSatisfactionRecommendation/NPS
Employee Score
Credit RatingAnalyst Recommendation
Environment ScoreCommunity ScoreGovernance Score
Revenue% Margin% Forecast Margin% Forecast Revenue Growth
Bra
nd S
tren
gth
Inde
x
35%
25%
5%
5%
5%
Effective Weighting
25%Brand
Investment
25%
BrandEquity
50%
BrandPerformance
25%
Customer
Outputs
Inputs
Staff
Financial
External
6.25%
6.25%6.25%
6.25%
5.00%7.50%7.50%7.50%7.50%
5.00%
2.50%2.50%
1.67%1.67%1.67%
6.25% 6.25% 6.25% 6.25%
Determining the Royalty RateIn order to apply the Brand Strength Index, a hypothetical royalty rate range needs to be set
Following the OECD guidelines, Brand Finance sets the hypothetical brand royalty rate ranges by reference to three tests:
• Comparable Agreements: A search of comparable licensing agreements for brands in each industry is conducted every year. The margin analysesare then compared against the royalty rates found in these agreements to analyse the importance of brand in the industry and set an appropriateaverage industry royalty rate.
• Industry Margins: An analysis of 25% to 40% of margins, generally accepted as rules of thumb for licensing rates for all intangible assets in acompany. These rates are adjusted to take into account the importance of brand in a given industry.
• Affordability: Thirdly, an analysis of the brand’s specific royalties is conducted. If the brand has been able to sustain extraordinary profits over anextended time it is likely that hypothetical brand owners would be willing to pay closer to the company’s margins than the industry average. In thecase of Brand Finance’s League Table models, affordability will be based on the forecast EBIT.
• Average industry royalty rate ranges can be seen below
High
Mid
Low
Brand Valuation AssumptionsUnderlying economic assumptions used in valuation
Brand value (EURm)
$650
Discount Rate
Earnings in the future are worth lessthan consumption now. This rate istherefore used to reduce futureearnings to their value today.
Long Term Growth Rate
After the explicit forecasts, the brandwill continue to grow. However, it isunlikely that the company will sustainextraordinary returns into the futureso forecast industry growth rates areapplied.
Revenue
Licensing payments for the use of abrand are derived from revenue.Increases or decreases in forecastedrevenue increase or decrease thefinal valuation.
Tax Rate
Forecasted royalties are reduced bythe tax rate to reflect the actualamount that would be received bythe brand owner after tax.
5 year Compound Annual Growth Rate (CAGR)
2015 2014
2.6% 3.4% -0.8%
Discount Rate
2015 2014
9.1% 8.6% +0.5%
Long Term Growth Rate
2015 2014
3.2% 2.6% +0.6%
Tax Rate
2015 2014
29% 30% -1.3%
Brand Investment
Brand Equity
Brand Performance
X = $Forecast revenues
%Strong brand
Weak brand
0.00% 0.00% 0.00% 0.00% 0.00% 0.00%
0.8% 0.8%
0.6%
0.8% 0.8%
1.2%
0.6% 0.6%
0.5%
0.6%0.7%
1.0%
DSM BASF Dow Du Pont Akzo Nobel Akzo Nobel
Competitor Royalty RatesCompetitor royalty rates will be different based on different strengths of the brand, having different operating segments and company-specific long term affordability
[XXX] BASF Dow Du Pont Akzo Nobel - Corporate Akzo Nobel – Paints and Coatings
78 78 80 80 82 82
[XXX]

Brand Finance Germany 50 May 2017 17.Brand Finance Germany 50 May 2017 16.
How we can help
MARKETING FINANCE TAX LEGAL
Contact usFor brand value report enquiries, please contact:Alex HaighDirector of League Tables Brand Finance [email protected]
For media enquiries, please contact:Robert HaighMarketing & Communications Director Brand Finance [email protected]
For all other enquiries, please contact:[email protected]+44 (0)207 389 9400
linkedin.com/company/brand-finance
facebook.com/brandfinance
twitter.com/brandfinance
For further information on Brand Finance®’s services and valuation experience, please contact your local representative:
Country Contact Email addressAustralia Mark Crowe [email protected] Pedro Tavares [email protected] Bill Ratcliffe [email protected] Minnie Fu [email protected] Nigel Cooper [email protected] Africa Jawad Jaffer [email protected] Victoire Ruault [email protected] Dr. Holger Mühlbauer h.mü[email protected] Ioannis Lionis [email protected] Marc Cloosterman [email protected] Ajimon Francis [email protected] Jimmy Halim [email protected] Massimo Pizzo [email protected] Samir Dixit [email protected] Laurence Newell [email protected] (exc. Brazil) Laurence Newell [email protected] East Andrew Campbell [email protected] Babatunde Odumeru [email protected] Pedro Tavares [email protected] Alexander Eremenko [email protected] Alexander Todoran [email protected] Samir Dixit [email protected] Africa Jeremy Sampson [email protected] Lorena Jorge ramirez [email protected] Lanka Ruchi Gunewardene [email protected] Victoire Ruault [email protected] Muhterem Ilgüner [email protected] Alex Haigh [email protected] Ken Runkel [email protected] Lai Tien Manh [email protected]
Contact detailsOur offices
Disclaimer
Brand Finance has produced this study with an independent and unbiased analysis. The values derived and opinions produced in this study are based only on publicly available information and certain assumptions that Brand Finance used where such data was deficient or unclear . Brand Finance accepts no responsibility and will not be liable in the event that the publicly available information relied upon is subsequently found to be inaccurate.
The opinions and financial analysis expressed in the report are not to be construed as providing investment or business advice. Brand Finance does not intend the report to be relied upon for any reason and excludes all liability to any body, government or organisation.
We help marketers to connect their brands to business performance by evaluating the return on investment (ROI) of brand based decisions and strategies.
+ Branded Business Valuation+ Brand Contribution+ Trademark Valuation+ Intangible Asset Valuation+ Brand Audit+ Market Research Analytics+ Brand Scorecard Tracking+ Return on Marketing Investment+ Brand Transition+ Brand Governance+ Brand Architecture & Portfolio Management+ Brand Positioning & Extension+ Franchising & Licensing
We provide financiers and auditors with an independent assessment on all forms of brand and intangible asset valuations.
+ Branded Business Valuation+ Brand Contribution+ Trademark Valuation+ Intangible Asset Valuation+ Brand Audit+ Market Research Analytics+ Brand Scorecard Tracking+ Return on Marketing Investment+ Brand Transition+ Brand Governance+ Brand Architecture & Portfolio Management+ Brand Positioning & Extension+ Mergers, Acquisitions and Finance Raising Due Diligence+ Franchising & Licensing+ Tax & Transfer Pricing+ Expert Witness
We help brand owners and fiscal authorities to understand the implications of different tax, transfer pricing and brand ownership arrangements.
+ Branded Business Valuation+ Brand Contribution+ Trademark Valuation+ Intangible Asset Valuation+ Brand Audit+ Market Research Analytics+ Franchising & Licensing+ Tax & Transfer Pricing+ Expert Witness
We help clients to enforce and exploit their intellectual property rights by providing independent expert advice in- and outside of the courtroom.
+ Branded Business Valuation+ Brand Contribution+ Trademark Valuation+ Intangible Asset Valuation+ Brand Audit+ Tax & Transfer Pricing+ Expert Witness
2. Analytics: How can I improve marketing effectiveness?
Analytical services help to uncover drivers of demand and insights. Identifying the factors which drive
consumer behaviour allow an understanding of how brands create bottom-line impact.
• Market Research Analytics • Brand Audits
• Brand Scorecard Tracking • Return on Marketing Investment
3. Strategy: How can I increase the value of my branded business?
Strategic marketing services enable brands to be leveraged to grow businesses. Scenario
modelling will identify the best opportunities, ensuring resources are allocated to those activities
which have the most impact on brand and business value.
• Brand Governance • Brand Architecture & Portfolio Management
• Brand Transition • Brand Positioning & Extension
4. Transactions: Is it a good deal? Can I leverage my intangible assets?
Transaction services help buyers, sellers and owners of branded businesses get a better deal by leveraging the value of their intangibles.
• M&A Due Diligence • Franchising & Licensing
• Tax & Transfer Pricing • Expert Witness
1. Valuation: What are my intangible assets worth?
Valuations may be conducted for technical purposes and to set a baseline against which potential strategic brand scenarios can be evaluated.
• Branded Business Valuation • Trademark Valuation
• Intangible Asset Valuation • Brand Contribution
2. ANALYTICS
3. STRATEGY 4.TRANSACTI
ON
1. V
ALUATION
Brand & Business Value

Contact us.
The World’s Leading Independent Branded Business Valuation and Strategy ConsultancyT: +44 (0)20 7389 9400E: v.ruault@brandfi nance.com www.brandfi nance.com
Bridging the gap between marketing and fi nance