Geranio - Competitiononlisting.pdf
38
1 Competition among stock exchanges: are listing services part of the deal? Manuela Geranio Università Bocconi, Via Rontgen 1, 20136 Milan, Italy and SDA Bocconi E-mail: [email protected] Valter Lazzari Università Carlo Cattaneo (LIUC), Corso Matteotti 22, 21053 Castellanza (VA), Italy and SDA Bocconi E-mail: [email protected] This version July 2012 Competition among exchanges is growing fast on trading services. Differently, competition for listing securities has so far been minimal, if not absent, especially in Europe. The purpose of this paper is to highlight the monopolistic position that many important and well renowned exchanges around the world still maintain on offering and pricing of listing services. We first try to clarify the content of listing services. We then quantify fees applied by different exchanges to companies according to their size. We consider both initial and annual fees. Our results show that US exchanges are more expensive for medium sized firms while EU markets apply higher fees to largest companies. Many exchanges, particularly in the EU, are still taking advantage of their exclusive control position by applying premium price policies to largest companies in order to cross subsidize smaller companies. JEL: G20; G29;N20 Keywords: Listing services, listing costs, stock exchanges competition, admission fees, annual fees.
Transcript of Geranio - Competitiononlisting.pdf

1
Competition among stock exchanges: are listing services part of the deal?
Manuela Geranio Università Bocconi, Via Rontgen 1, 20136 Milan, Italy and SDA Bocconi E-mail: [email protected]
Valter Lazzari Università Carlo Cattaneo (LIUC), Corso Matteotti 22, 21053 Castellanza (VA), Italy and SDA Bocconi E-mail: [email protected]
This version July 2012
Competition among exchanges is growing fast on trading services. Differently, competition
for listing securities has so far been minimal, if not absent, especially in Europe. The purpose
of this paper is to highlight the monopolistic position that many important and well renowned
exchanges around the world still maintain on offering and pricing of listing services. We first
try to clarify the content of listing services. We then quantify fees applied by different
exchanges to companies according to their size. We consider both initial and annual fees.
Our results show that US exchanges are more expensive for medium sized firms while EU
markets apply higher fees to largest companies. Many exchanges, particularly in the EU, are
still taking advantage of their exclusive control position by applying premium price policies
to largest companies in order to cross subsidize smaller companies.
JEL: G20; G29;N20
Keywords: Listing services, listing costs, stock exchanges competition, admission fees, annual
fees.

2
I. Introduction
Competition among stock exchanges increased largely on trading activity. In the US, the New
York Stock Exchange (NYSE) and the NASDAQ now retain only about a third of the total
trading on the stocks they list. In Europe, the LSE retains just above half of the trading in UK
shares, while Deutsche Börse (DB) and Euronext Paris do not exceed two-thirds of the trading
in their domestic stocks1
The traders’ mobility across trading venues is not matched by the mobility of issuers across
listing venues. Historically, listing shares has been a domestic business. Barring a few
exceptions, companies listed their stocks on their home country’s exchanges because of the
well-documented strong home bias of investors (Solnik, 1974; French and Poterba, 1991) and
the issuers’ need to cope with a coherent system of corporate law and market rules.
Admission to foreign exchanges was sometimes sought, but usually for marketing purposes
(i.e. the recent listing of Prada, the Italian luxury company, at the Hong Kong Stock
Exchange) or for bonding purposes (Ferris et al., 2009) and often in addition to the domestic
listing rather than as a replacement (for a review see Karolyi, 2006). Such trend is still alive,
particularly in the European case, as confirmed in 2009 NYSE Euronext Annual Report, (page
16) “In Europe we do not currently face significant competition in providing primary listing
services to issuers based in Euronext’s home markets because most issuing companies seek to
list their shares only once on their respective domestic exchange.”
Thanks to the investors’ home country bias and to the legal barriers created by corporate laws
and market rules fragmented across national borders, stock exchanges have long enjoyed a
monopolistic position in providing listing services to domestic companies. By law, they were
1 Data retrieved from www.fidessa.com

3
recognised as the domestic listing authority. Until a decade ago, the traditional not-for-profit,
cooperative and semi public organisational structure of the exchanges prevented the risk that
they could exploit their monopolistic power by charging issuers excessive listing fees. During
the past decade, however, exchanges around the world have turned into private corporations
with for-profit motives, often listed on the same stock market they manage. The risk of
excessive pricing for listing services has increased as the main exchange in many countries
demutualised despite retaining its traditional role as listing authority. Indeed, to mitigate this
risk, in 2001 the power of the UK’s listing authority was transferred from the London Stock
Exchange (LSE) to the Financial Service Authority (FSA) with the creation of a dedicated
department named the UK Listing Authority (UKLA).
Few contributions of the literature deal with listing services offered by stock exchanges. In the
late nineties two theoretical models by Focault and Parlour (1999) and Huddard, Hughes and
Brunnermeier (1999) focused on competition for listing among exchanges. In both models
listing and trading services were considered as activities offered jointly and exclusively by
stock exchanges. More recently, Chemmanur and Fulghieri (2006) proposed a further model,
which relates listing standards to the cost of information for investors in each market.
In a seminal paper of 2002, Macey and O’Hara raised several doubts on the survival of listing
fees in the US context, at least after the transformation of stock exchanges into public
companies. Similarly, Aggarwal (2002) expected a reduction of listing fees, as result of
increasing competition among exchanges and eventually the dismissal of the listing function
from exchanges to other entities. Karmel (2007) argued that merging with an European
exchange may be a way for US exchanges to recapture the listing fees and trading profits
reduced after the introduction of Sarbanes-Oxley Act of 2002.
Nowadays both Nasdaq and Nyse became public companies, as many other stock exchanges
did (see table 1). Did this change influence fees and policies adopted by exchanges in the

4
listing business, leading to an increase in competition? What are the specialties of the EU
context, given the existence of a common regulation for listing activity? What about the UK
choice to separate admission to listing from admission to trading?
We try to contribute to such discussion through the analysis of the pricing policies currently
adopted by major world stock exchanges for their listing services. First we discuss the actual
content of listing services, arguing that nowadays listed companies are basically paying for a
quality certification service, while access to liquidity has been reduced by the growth of
multilateral trading facilities. Second, we verify the relevance of listing fees in today’s
exchange markets activity. Third, we provide the first in-depth analysis of listing fees applied
by stock exchanges according to listed companies’ size, shading lights on potential
monopolistic behaviour applied by stock exchanges and on the effective impact of the
demutualisation on the listing business.
II. Listing Services
Traditionally, an exchange provided issuers with a quality certification and with the access to
a well-organised pool of liquidity. Nowadays, the surge of multiple trading venues eliminated
the monopoly of stock exchanges in trading activity. Consequently, listing should be
interpreted mainly as a quality certification service, as the access to a pool of liquidity might
be granted also by other providers, such as alternative trading venues.
The quality certification process implies that the entity where the issuer is seeking to be
admitted conducts a due diligence to assess that it is fit enough and has the attributes investors
are looking for. The result of this process, when positive, leads to the admission of the
company to listing. In the case of a negative outcome, moral suasion by the listing authority is
used to encourage the unsuitable issuer to withdraw its request.

5
The process of going public starts with an informal contact with the stock exchange which
usually promotes meetings, focus groups and conventions to illustrate the advantages of
listing, as well as its costs and obligations. Issuers usually appoint an advisor or a sponsor to
receive assistance in concluding the listing process successfully. As sponsors have recurrent
business relationships with the exchanges, their presence speeds up the listing process.
Exchanges often require their presence since they perform a preliminary screening of listing
applicants, preventing the applications with no merit.
The scrutiny performed by the listing department of an exchange can be detailed and
thorough. It pays attention to items such as the issuer’s financial structure, the competitive
position in its main sector of activity, the business plan presented and the reasonableness of
the underlying assumptions. This analysis usually leads to an issuer data form, describing the
main characteristics of the company. The timing for granting the admission varies widely
across countries. In Switzerland, a listing can be obtained in four weeks, whereas in Italy it
may take up to six months.
Once a company is admitted to listing, exchanges perform monitoring activities to guarantee
the fulfilment of all ongoing requirements by listed firms and the fairness in market trading.
As for the requirements of listed firms, the first obligation concerns price sensitive
information, which must be promptly filed with the authority, disseminated to the public and
stored in a central mechanism. Some exchanges provide network information systems to
facilitate the communication of such news to the appropriate authorities as well as to the
public. Exchanges also provide regulatory assistance to listed companies, as well as
educational services and investor relations support. Exchanges must monitor the trading
activity on listed issuers’ stocks to maintain a fair and orderly trading.
According to Macey and O’Hara (2002), listing fees and listing requirements are a part of a
complex relational contract between the stock exchange and listed companies. Authors argue

6
that the signalling role of listing is diminishing as other reputational intermediaries, such as
investment banks, rating agencies and regulators are providing quality certification signals.
Internet technology dramatically reduced the cost of research on traded companies. The
usefulness of monitoring provided by a listing activity has been reduced also by the increasing
role of institutional investors as more skilled than retail investors. As a consequence, in
efficient economic terms, stock exchanges would be better dropping listing requirements in
order to increase trading activity also on not listed firms.
Several arguments are mentioned to explain why listing fees and requirements are still
applied. The main reason was the mutual ownership structure of NYSE and NASDAQ at that
time, as in the short run a listing fee drop would have had a costly impact on exchange
members. In addiction, some companies may continue to pay listing fees for two further
reasons. First, while listing certification label might add low value to largest firms, smaller
enterprises and foreign companies, especially from less developed countries, might still find it
valuable. Second, the size of listing fees is small relative to potential delisting costs.
We argue that the signalling role of listing is all but exhausted, even after the demutualisation
of stock exchanges. Admission to listing can be considered as a quality label to a stock,
similar to what happens when granting a rating to a bond. As there is a scale of ratings, the
admission to the official list can also allow for a scale of different listing labels, signalling the
issuer’s commitment to complying with different governance and disclosure standards.
Indeed many stock exchanges today offer both standard listing and premium listing admission
programmes (i.e. London Stock Exchange, Deutsche Borse, Borsa Italiana and Nasdaq).
Usually, the first label certifies the issuer’s compliance with the basic requirements for
admission to listing, while the second label certifies, in addition, compliance with even higher
standards of governance and disclosure. Our interpretation is coherent with the contribution
by Chemmanur and Fulghieri (2006), which develop a theoretical model to show that

7
exchanges use their listing standards as a tool in competing for listing with other exchanges.
In such model competition among exchanges is expected to lead to a segmentation of the
market for listing, where high-reputation exchanges set high listing standards and become
first-tier stock markets, while low-reputation exchanges set lower listing standards and
become lower-tier markets.
The label “officially listed” is also still relevant to access liquidity, both inside the stock
exchange and outside. Admission to trading by regulated stock exchanges is usually granted
upon recognition of admission to listing by the competent authority. On the other side, the
access to large liquidity pools outside regulated exchanges is facilitated for listed companies,
as alternative trading systems such as Chi-X, Bats, Turquoise, etc., concentrate their activity
mainly on listed blue chips.
In the case of EU countries, also regulation indirectly recognises a value to the “officially
listed” label. First, admission to the official listing implies full compliance with the minimum
requirements of the Codified Listing Directive [2001/34/CE], which works as a minimum
harmonization tool. Second, according to EU regulation, admission to “official listing” can be
granted only by the entitled “Listing Authority”.
In practice, all main official stock exchanges tend to have more stringent admission
requirements than those implied by the listing directive (see table 2). We might interpret this
evidence as a way through which exchanges try to maintain the value of their quality
certification function and potentially differentiate their products according to targeted clients.
As for the Listing Authority, all EU continental countries have assigned such function to the
domestic stock exchange. By contrast, in the UK the historical stock exchange has lost the
power of Listing Authority, which is now assigned to a special section of the domestic
financial supervisory authority. In this case, admission to trading and admission to listing are
always two separate processes whose final decision lies respectively with the stock exchange

8
and the Listing Authority. The UK government recognised the principle that regulatory
powers should not be delegated to an exchange that competes for listing with other markets.
The choice adopted in the UK case aimed also at preserving the quality certification function
of listing free from conflict of interests that could arise in case of business relationship
between the exchange and the listed companies (see Carson, 2003) and preventing the risk of
excessive pricing for listing services. The creation of a Listed Authority separated from the
stock exchange favoured also the creation of new EU regulated markets (i.e. NYSE Euronext
London), leading to a potential increase of competition among UK’s exchanges.
The strong home bias of listed firms, combined in the EU case with the regulatory provisions
for the listing function, guarantees a monopolistic position to domestic exchanges. Moreover,
demutualised exchanges might have stronger incentives to manage listing fees (i.e.
discriminating their application between large and small cap), in order to maximize profits.
To sum up, we argue that pricing of listing fee is influenced by two main factors. On one side
more prestigious stock exchanges could apply premium policies which may be justified by
their signalling role. On the other side the monopolistic structure of the business could
encourage price discrimination policies regardless the quality of such signal.
In the following we will document the relevance of listing fees for exchanges revenues and
provide evidence on pricing policies applied by stock exchanges for their listing services.

9
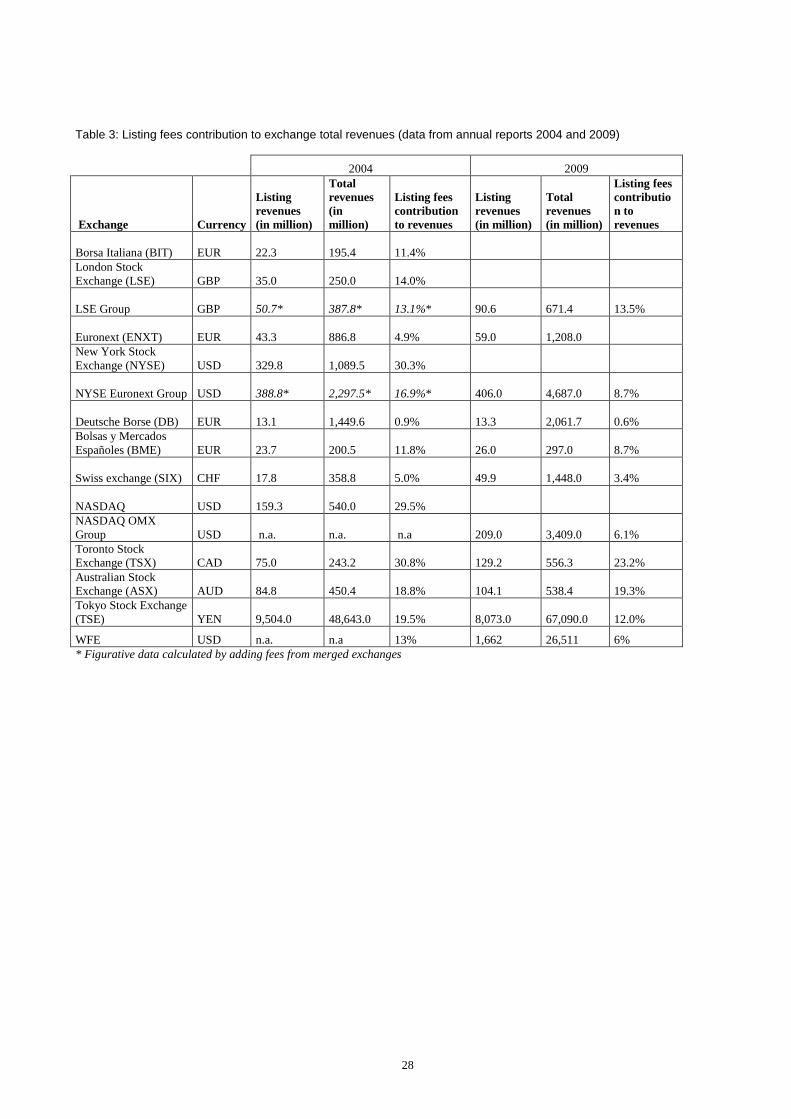
III. Listing fees contribution to exchanges revenues
Listing fees represent a traditional source of revenues for official exchanges, as they
remunerate the listing function which is reserved to regulated exchanges. According to the
World Federation of Exchanges (WFE), listing revenues2 accounted for 1.6 billion $ in 2009,
equivalent to 6.3% of total revenues for stock exchanges. Annual listing fees represent the
largest percentage of listing revenues (53%) followed by initial listing fees (36%) and other
listing fees (11%) concerning instruments such as warrants, ETFs, and other products. In 2004
listing fees represented 13% of total revenues, while they weighted 16% in 1999.
More detailed patterns can be appreciated from table 3, where data on individual markets are
presented. According to 2009 results, listing fees contribution to total revenues varies from
extremely reduced (0.6% at DB) to quite large (23.2% at TSX) values. Five years before, i.e.
in 2004, such range was even wider, spanning from 0.9% (DB) to 30.8% (TSX).
During the period 2004-2009 the contribution from listing activity remained quite stable in
the cases of London Stock Exchange and Borsa Italiana (now part of the same group), as well
as in the case of Deutsche Borse. The only exchange that increased the weight of listing fees
on total revenues was ASX. Slight reduction can be observed in the cases of BME and SIX,
while TSX and TSE assisted to a more pronounced reduction. Contribution from listing fees
halved in the cases of NYSE and Euronext (now part of the same group), while the most
relevant drop was registered in the case of Nasdaq.
In terms of absolute value, with the only exception of TSE, all exchanges observed an
increase of listing fees from 2004 to 2009. Such detail, combined with the impressive increase
of total revenues in many markets, reveals that the listing activity was not able to keep the
pace of the growth experienced by other business areas (in particular trading). In the same
period the overall number of listed companies changed slightly (0.18%), even if differences
2 Trading revenues accounted for 53.9%, while services contributed 32.4% to total revenues.

10
arise among exchanges (see table 4). SIX, Euronext and Nasdaq lost a significant number of
listed companies, while ASX increased the number of clients in the listing business.
To sum up, nowadays the overall contribution of listing fees to total exchange revenues has
diminished in comparison with the past. The reduction has been particularly heavy for the US
markets, while the impact on EU markets has been lower. Such pattern can be interpreted as
consequence of the fast growth of other business areas in the stock exchange industry,
combined, in some cases, with a reduction in the number of listed companies.
IV. Admission Fees: Rationale and Structure
Exchange markets charge listed companies in two ways. They first apply an admission fee
when companies are admitted to listing and trading. They will then charge an annual fee for
services provided to listed firms on an ongoing basis.
Comparing admission fees across exchanges involves comparing pricing functions rather than
prices. Almost all the main markets adopt complex, non-linear pricing rules to calculate fees
as a function of a parameter of the issuer’s size, while limiting the fee range with both a lower
(floor) and an upper bound (cap). Table 5 shows the different parameters upon which
admission fees are based.
The general preference is for an ad valorem measure, usually defined as the issuer’s market
cap upon admission. All major European exchanges opt for it, BME being the sole exception
since its pricing policy is based on the face value of the issuer’s equity capital. Outside
Europe, TSX and ASX differentiate their fees according to the issuers’ market cap. At TSE,
the fee depends on the Section of the main market where the issuer is admitted.
The preference for an ad valorem measure is not shared by the US exchanges, which base
their fees on the number of shares sold through the IPO.
Admission fees may depend positively on the issuer’s size because of either cost
considerations or price discrimination strategies. Under the first hypothesis, exchanges adopt

11
a “full cost rule” pricing policy and face a cost function for their listing services that increases
with the size of the issuers. However, for their verification processes, exchanges rely heavily
on the comprehensive documentation prepared by the issuers’ auditors, consultants and
bankers. Because it is based exclusively on deskwork, the cost for exchanges to evaluate
admission requests cannot be too sensitive to the issuers’ sizes and should not justify
excessive differences between the fee paid by small and large issuers.
Under the price discrimination strategy hypothesis, exchanges with strong oligopolistic
powers differentiate their admission fees to capture the greater surplus that large issuers enjoy
by having their shares traded on a public market compared with small issuers. Their greater
surplus may derive from higher savings in terms of cost of capital or from more valuable
strategic options made available by the public company status. If this is the case, an exchange
may greatly differentiate its admission fees across issuers, as permitted by its market power.
Alternatively, admission fees could be fixed below the marginal cost of admitting an issuer.
Exchanges are not mono product ventures. They run a series of businesses, strictly interrelated
with each other: listing issuers, matching traders’ orders, delivering market pre- and post-
trade information and, possibly, clearing and settling executed transactions. They may find it
profit maximising to set the floor below the marginal cost of the listing service if they expect
from such decision a positive contribution to future profits from any other activity they
engage into, giving rise to a cross-subsidization phenomenon.
This argument challenges the assumption that admitting issuers to a public stock market must
be a self-sustainable business. The listing activity may alternatively be interpreted as the
investment an exchange undertakes to secure future flows of profits from the order matching
activity and related clearing and settlement services, as well as from the sale of pre- and post-
trade real-time market information to the investor community. If so, admission fees could
even become negatively related to the size of the issuer since exchange profits from trading,

12
post-trading and information sales are higher for large caps than for small caps. This view of
the listing business would be appropriate if the exchange providing the original admission to
trading retained a competitive advantage in attracting order flows. The pattern of change in
the legal framework of the securities industry worldwide and advances in electronic trading
technology have made it more unlikely to treat the listing business as a feeder activity for
other exchange businesses. In the US, the National Market System (NMS) Regulation forces
orders to be executed on the trading venue that offers the best quote, with no advantage for
the exchange where the stock is listed. Despite the absence of an equivalent legal requirement,
a similar outcome is also increasingly becoming the norm in Europe, where traders and
brokers make use of smart order routing systems to direct orders to the venue offering the best
quote.
A Comprehensive Comparison of admission fees
To gain an effective insight into how different pricing functions compare when applied to
issuers of different sizes, we ranked all companies listed in a specific market by their market
caps. We then calculated admission fees for those placed at the 1st, 25th, 50th, 75th and 100th
percentiles, representing the cases of micro cap, small cap, medium cap, large cap and macro
cap stocks, respectively.
The market considered is the MTA managed by BIT. By the end of 2009, 264 ordinary shares
of Italian companies were listed. Some further assumptions are needed to obtain the
admission fees for BME, NYSE, NASDAQ and TSE. Since the pricing function of the
Spanish exchange is based on the face value of equity, the market cap is assumed equal to
either 3 or 10 times the face value of equity. Since the pricing function at NYSE and
NASDAQ is based on the size of the IPO, issuers are assumed to float either 30% or 60% of
their stocks. The results are shown in Table 6.

13
Many blanks appear in the first column because the market cap of the issuer in the lowest
percentile (€ 10 million) does not make it eligible for admission on the main markets at
Euronext, BIT, NYSE, NASDAQ, SIX, TSX and TSE. Where eligible, the admission fee
charged for the microcap ranges from € 4,745 in the Spanish market, should the share market
price be three times its face value, to a maximum around € 30,000 at ASX.
The second column of Table 6 gives the results for small caps based on an issuer that
capitalises € 53 million, with 46 million stocks outstanding, and that is eligible for admission
on all markets. TSE is the most expensive market (€ 120,000), followed by the North
American markets (from around € 80,000 to around €100,000). Markets in Europe are much
cheaper, with fees ranging from € 6,500 at BME (assuming the market cap is three times the
issued capital of the issuer) to around € 45,000 at LSE.
For the medium cap stock, as exemplified by an issuer whose market cap is € 170 million
divided into more than 430 million stocks, the North American exchanges are the most
expensive as they charge their cap (above € 170,000 at NYSE and NASDAQ; above €130,000
at TSX). For the US exchanges, this exemplification may overstate the actual listing fees for a
medium cap issuer since it is built on the case of a penny stock which would not be suitable
for listing there. ASX, LSE and Euronext cluster their admission fees at around € 90,000. The
remaining markets in continental Europe stick to a much lower price range. Even excluding
DB, which retains its uniform pricing of € 5,500, they charge from € 10,000 (SIX) to 25,000
(BIT), or to € 60,000, should we consider the case of a Spanish issuer with a market cap three
times larger than the face value of its issued capital.
The picture changes when considering a large issuer with a market cap approaching € 800
million and more than 300 million stocks outstanding. By capping their fees, the North
American exchanges are now about on par with LSE and cheaper than Euronext and ASX,
whose fees rise to € 314,000 and € 250,000. BME and BIT (€ 80,000, assuming that the

14
market cap is ten times the face value of the issued capital, and € 120,000) remain in a lower
price range, even though the gap with the previous markets starts to narrow in percentage
terms. The Swiss market hold onto very low admission fees (around € 17,000), still three
times higher than the uniform fee charged by DB.
When the macro cap is considered (€ 70 billion market cap and 4 billion shares), the ceiling is
triggered everywhere, making Europe the place with both the most expensive and the
cheapest venues of the world. At the upper end, even ignoring the hefty € 3 million bill
invoiced by Euronext, there are BIT and LSE. Their fees range from € 500,000 to € 400,000,
being about three times greater than the cap of the North American exchanges.
BME also shows a hefty admission fee as it does not have any cap. Similar to the case of
BME, the lack of an official cap on ASX fees results in an impressive nominal fee charged to
the largest companies. ASX, however, has discretionary power to discount very large fees.
The pricing of TSE does not materially change even considering the higher fee (around €
140,000) charged for admission to Section 1 of its main market, a more appropriate habitat for
macro caps. It is only slightly higher than the cap seen at TSX.
At the lower end, SIX and DB remain the cheapest exchanges. Even though the former
charges about eleven times as much as the latter (around € 64,000 vs. € 5,500), both fees are
minimal compared to any other.
Overall, thanks to its uniform pricing policy rule, DB is the cheapest listing venue for issuers
of all sizes. SIX remains close to DB in terms of price competitiveness regardless of the size
of the issuer. Its fee schedule starts low and increases slowly.
DB and TSE do not engage in any price segmentation strategy. While DB charge the same fee
to all issuers, the gap between the highest and the lowest fee at the TSE is around € 20,000
and depends exclusively on the segment of the market the issuer wants to enter upon listing.
The difference in the absolute fee level between these two cases of uniform pricing mirrors a

15
different policy concerning the allocation of the cost of the exchange infrastructure between
its two main groups of users: traders and issuers. DB favours the latter more than TSE does.
All other exchanges practice some form of price segmentation.
The North American markets pursue very moderate price segmentation strategies. Their
maximum fee is at most twice as much the minimum fee, as in the case of NYSE. Moreover,
in the US exchanges, the discrimination policy is only loosely correlated to the issuers’
market cap. Being based on the number of floating shares, their fees do not even always
increase in the issuers’ market cap.
European exchanges are used to more aggressive price segmentation policies. The Swiss
exchange shows more restraint than the others, as its maximum fee is just six times higher
than its minimum fee. This ratio grows to about 10 at LSE and to 20 at BIT. The case of BME
is more pronounced, even though the most extreme case of price segmentation occurs at
Euronext, whose fee cap is almost 90 times higher than its floor, reaching € 3 billion for
issuers with a market cap greater than € 26 billion.
V. Annual Fee: Rationale and Structure
An issuer admitted onto a public stock market must continuously comply with a set of
requirements concerning the governance of the company’s assets and the disclosure of
corporate information. When planning a corporate action, an issuer must agree the timetable
with the exchange to maintain an orderly and fair trading. The exchange provides the issuer
with the assistance needed to meet its obligations and to maintain a record of full and proper
compliance. Should this be the case, the exchange lets the issuer enjoy an ongoing quality
certification service and a continuous access to a well-organised pool of liquidity, where an
efficient process of stock price discovery can take place.
Because of this, exchanges charge issuers an annual fee. The rationale for the complex pricing
functions seen for admission fees also applies to annual fees. The parameter used to measure

16
the issuer’s size remains the issuer’s market cap at BIT, LSE, SIX, TSX and ASX. BME and
TSE switch to it as well, abandoning the face value of the equity capital and the policy of
uniform pricing used for their admission fees. NYSE and NASDAQ base their pricing on the
number of outstanding shares rather than on the floating shares only. Euronext does the same,
abandoning the pricing based on the issuer’s market cap which it uses when admitting new
stocks.
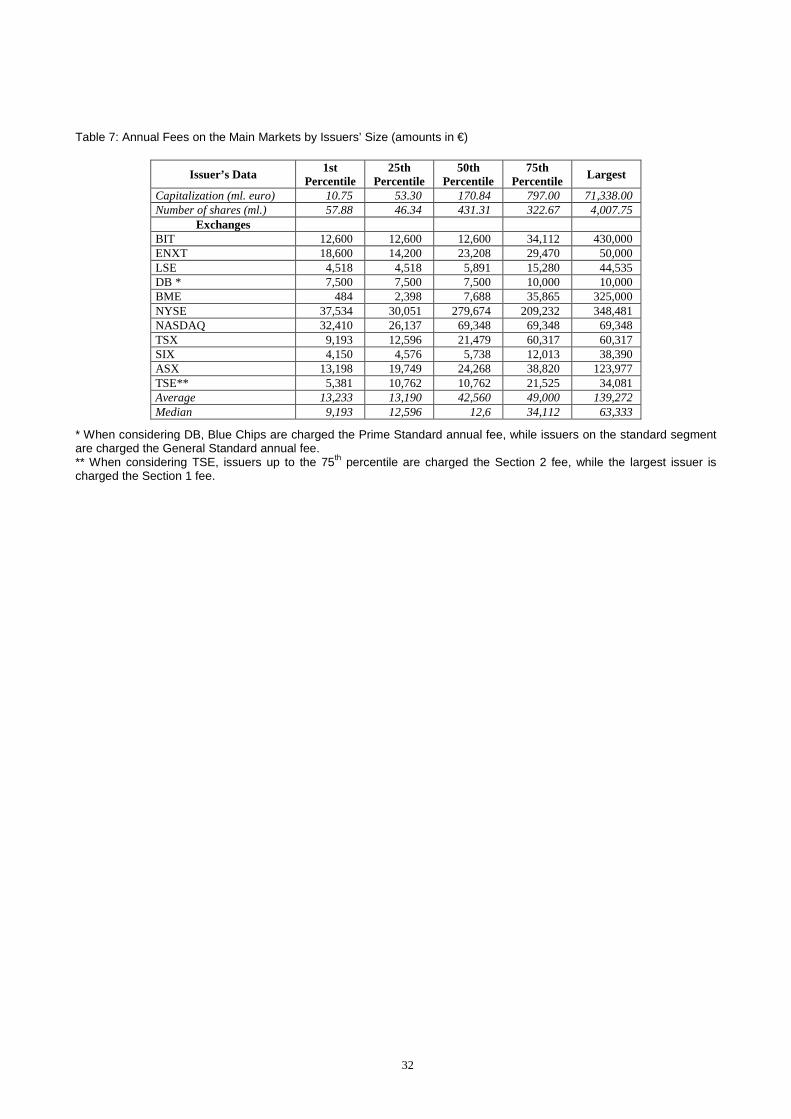
A Comprehensive Comparison of annual fees
To gain a better insight into how the different pricing functions of annual fees compare with
each other when applied to issuers of different sizes, we repeat the analysis of Section IV. In
this case, by knowing the capitalisation and the number of outstanding shares of the issuers,
fees can be calculated according to each pricing schedule without additional assumptions.
They are shown in Table 7.
Some exchanges are consistent in their pricing policies across admission and annual fees. DB
and NASDAQ retain their policies of uniform or limited price differentiation. BME and BIT
still practice strong price segmentation. TSX maintains its middle-of-the-road approach.
Other exchanges reverse their pricing policies. Euronext, LSE and ASX opt for less
pronounced price discrimination in the case of annual fees, as they impose a much lower
ceiling on them. SIX and NYSE switch to a more pronounced price discrimination strategy,
either lowering the minimum amount charged (SIX) or extending the range of annual fees at
both the lower and upper ends (NYSE). The same does TSE which implements a price
discrimination strategy based on the issuers’ market cap, while retaining its separate pricing
policy for Section 1 and 2 of its main market. The combined reading of Table 6 and Table 7
shows that annual fees are usually much lower than are admission fees. At Euronext and LSE,
the percentage discount is greater for large caps; at BIT, BME, SIX for small and medium
caps; at the remaining exchanges it is roughly comparable across all issuers’ sizes. DB and

17
NYSE are exceptions. DB charges higher annual fees than admission fees to all issuers.
NYSE does the same with respect to issuers with a large number of shares outstanding.
Consequently, DB does not retain the feature of being the cheapest venue for micro caps and
small caps, while BIT becomes the most expensive exchange for macro caps, ahead of BME
and NYSE.
The annual charges for micro caps are usually set between € 5,000 (SIX, LSE and TSE) and €
13,000 (ASX, BIT). There are, however, some exceptions. BME charges are negligible (€
500), while, Euronext, but especially NYSE and NASDAQ, may end up charging small caps a
fee in excess of €30,000, being their pricing based on the number of shares.
The fee pattern is roughly similar for small caps, even though the median fee is now slightly
higher (€ 12,500 instead of € 9,000).
Tokyo and most continental European exchanges charge medium sized stocks from € 6,000 to
€ 12,000 (SIX, London, DB, BME, Tokyo and BIT in ascending order). ASX, TSX and
Euronext are well above € 20,000. NASDAQ is close to € 70,000, constrained by its cap.
NYSE stands at around € 280,000.
For large stocks, a different pattern emerges. Only DB and SIX still charge around € 10,000,
whereas London and Tokyo set fees in the € 15,000 – € 20,000 range. Madrid, Milan and
ASX, whose fees are close to € 35,000, are more expensive than Euronext, whose pricing
remains at around € 30,000. The NYSE remains in a league of its own, with fees above €
200,000.
Macro caps find their best habitat in terms of annual fees at DB where they pay just € 10,000,
a third of the amount charged at SIX and TSE. London and Euronext are also reasonably
priced, with a fee cap at around € 50,000. The biggest jump in fees, however, is recorded at
BME, whose cap is at par with the cap at NYSE (about € 350,000), and close to the cap at
BIT (€ 430,000). Even though the main stock markets in Milan and London are part of the

18
same group, the former has twice the annual fees of the latter from micro caps to large caps,
and 10 times for macro caps.
Annual Listing Costs: total revenues ranking and discrimination policies
Table 8 provides a more complete picture of how the divergent annual fee schedules seen
around the world may affect the overall bill paid by a whole group of listed issuers. All fee
schedules were applied to 264 Italian ordinary shares listed on the Italian Stock Exchange at
the end of 2009. Market cap, number of stocks and exchange rates are those current at that
date.
NYSE would result as the most expensive market, with total revenues close to € 31 million,
i.e. 2.5 times the second most expensive market (NASDAQ). The third most expensive
market is Borsa Italiana, as the total bill would be very close to that of NASDAQ.
The fee schedules of all other exchanges are less onerous. The revenue collected according to
both DB and SIX schedules amounts to € 2.5 million. Even the pricing adopted by LSE, the
sister exchange of BIT, is more favourable to issuers, generating less than a third of the
revenue produced by BIT pricing (€ 3.4 million), in line with the outcome delivered by the
TSE schedule.
The gap remains large when BIT is compared with Euronext, whose fee schedule would
generate only half of the revenue BIT receives (€ 6.2 million) from its pricing. The gap starts
shrinking in comparison to TSX and ASX, which would record revenues of about € 8.3
million, but, most of all, in comparison to Madrid where the income generated by the annual
fee would be just short of € 11 million.
Table 8 shows also the shares of the total revenue contributed by each quartile according to
the different schedules. On average, the fee schedules are such that a little more than 10% of
the revenue is generated by the first quartile, around 15% by the second, more than 20% by
the third and more than 50% by the top quartile.

19
The most pronounced price discrimination strategy is found at BME. Its pricing allocates a
negligible share of total cost to the first two quartiles, less than half the average share to the
third quartile, while forcing the top quartile to account for more than 86% of the total revenue.
BIT follows closely, extracting 6.7% of the total revenue from the first two quartiles; 8.9%,
the lowest percentage among all pricing schedule, from the third quartile and 77% from the
top quartile. LSE and SIX also practice price discrimination strategies which are slightly more
pronounced than the average/median exchange.
At the other end of the spectrum, besides the obvious case of DB, the least discriminating
pricing functions are found at Euronext, TSE and especially at NASDAQ. They allocate to the
top quartile a share of the total fee that goes from 34% (NASDAQ) to 43% (Euronext, TSE),
shifting the burden onto either the lower two quartiles (NASDAQ and Euronext) or the third
quartile (TSE).
The NYSE, ASX and TSX schedules are more closely aligned to the median/average profile
of revenue generation.
In a recent paper Cetorelli and Peristiani (2009) ranked equity markets according to their
prestige for both ipo activity and trading flows. By comparing their ranking with our results
on costs (see table 8, last two columns) we observe that only in a few cases more expensive
markets deliver higher prestige. This is the case of the US markets. The expensive fees
charged by the Italian and the Spanish markets do not correspond to an outstanding prestige
ranking, while LSE and TSE seem to return higher value for the listing fees they receive.
VI. Fee Comparison over Time
Lazzari (2003) compares the admission and annual fee schedules which were current at the
beginning of the last decade. To appreciate the evolution through time of the pricing policies,
we repeat the analysis of Sections IV and V to quantify the amount which the same issuers

20
considered by Lazzari (2003) would pay according to the 2009 schedules. A comparison is
then made with his results to detect any fee change implemented since then.
Table 9 shows that, on average, since 2003 the admission fee schedules have overall remained
stable, if not edged slightly up. The privatisation of the exchanges, the productivity increase
stimulated by a higher competition and the economies of scales made possible by a more
intense securities market activity are all factors whose benefits have not trickled down in
terms of lower listing costs.
BIT has slightly reduced the fees charged to medium and large companies, but it has
increased those for small companies. LSE has increased admission fees for all companies,
particularly for medium and large caps. TSX has followed a similar path, increasing fees on
large companies by more than 60%. Euronext, NYSE and NASDAQ have kept their
admission fees constant.
DB reduced its fees significantly, except for micro caps, whose fees were increased by 40%,
as it shifted from a strategy of slight price discrimination anchored to the face value of the
equity capital to a policy of uniform pricing. The comparison overestimates the actual drop in
the fees, especially for large issuers, as Lazzari (2003) used the market cap as a proxy of the
face value of the equity capital.
According to Table 10, over the same period annual fees have increased on average for all
issuers. There are, however, some noticeable differences among exchanges. Changes have
been minimal at NYSE, as its fees have increased slightly only for small companies. LSE has
cut its charges for smaller and medium issuers following the OFT investigation, and raised
them for larger issuers. BIT has cut its fees across all class of issuers, but more so for the
macro caps. NASDAQ, TSX and Euronext have done the opposite. DB introduced annual
fees for all listed companies in 2003 with no further change so far. Prior to it, only issuers in

21
the now defunct Neuer Market and in the then premium segment for small companies
(SMAX) were charged the annual fee.
VII. Admission and Annual Fees in Self Regulated Markets
In EU countries issuers can also acquire the status of a public company by having their shares
admitted to a self regulated market, legally an MTF in the terminology of the MiFID
[2004/39/CE, section 3, articles 36–47]. These trading venues, which match orders sent by
several traders, are managed by a market operator, either an investment firm or an exchange,
in accordance with non discretionary rules.
Following the recent wave of new self regulated markets, any fee comparison would be
incomplete if such venues were excluded. The self regulated markets considered here are Aim
London, the first to be launched in 2004 by the LSE Group; Aim Italia launched by BIT;
Alternext and the Entry Standard run by NYSE-Euronext and DB (see table 11). These
markets aim to attract small and medium-sized issuers, offering them a lighter regulatory
regime compared with EU regulated markets.
Table 12 compares the admission fees charged to issuers of different sizes along the lines of
section IV. Macro caps are not considered since it is not plausible that an issuer with a market
cap of billions of euro to seek admission to a self regulated market. The higher floor fee
makes Aim Italia the most expensive venue for micro caps. For small, medium and large caps,
Alternext overtakes this position due to a pricing function that displays a higher rate of
growth. Aim London is more expensive than is Aim Italia for small and medium caps, but is
cheaper for large caps because its fee cap becomes binding at a lower market capitalisation.
Table 13 reports the annual fees with same approach used in section V. A uniform pricing
policy is applied not just at the Entry Standard, but also at Aim London. Both markets charge
similar fees, € 5,000 or slightly more, not even half the minimum fee charged by Aim Italia
and about twice the minimum fee at Alternext. In sum, Aim London and DB’s Entry Standard

22
have fee schedules that are more favourable to issuers than those of their respective main
markets. Alternext and Aim Italia, instead, have basically the same pricing as their respective
main markets.
VIII. Conclusions
The analysis of listing fees revealed that listing services are priced very differently around the
world.
Our admission fees survey revealed two main results. First, the divergence in pricing
schedules is more pronounced among European markets than it is among US markets.
Second, exchanges take a different approach towards price discrimination. In some cases,
discrimination is held at a minimum or is absent altogether. In other cases, the gap between
the highest and lowest fee paid to be admitted onto the same market runs into millions of
euro. Overall, the most expensive EU market for admission to listing is Euronext. For smaller
and medium size issuers, on average, the US markets are more expensive than are EU
markets.
The main US markets diverge in terms of annual fees as NYSE and NASDAQ have similar
floors but the cap at the former is five times higher than at the latter. Among EU exchanges,
some markets take advantage of their monopolistic power charging hefty fees to the largest
companies, possibly cross-subsidising smaller companies. Other markets keep their fees
closer to the actual costs they bear for the services offered to listed firms. Euronext is the most
expensive EU market in terms of annual fees for small and medium issuers, while BIT
replaces DB for large issuers.
If we consider the number of domestic and foreign listed companies (Table 4) as a proxy of
the signalling value of listing we might argue that US markets pricing policies can be
explained with the higher value associated with the label “listed in the US”. In particular,
NYSE is able to apply a premium price policy on an ongoing basis, as revealed by the level of

23
annual fees. Also prestige ranking provided by Cetorelli and Peristiani (2009) suggests such
interpretation. Differently, the explanation for large price discrimination applied by some
Continental European exchanges is more a story of monopolistic behaviour, as also the small
number of foreign listings and low prestige ranking confirm. Despite their diminishing
weight on total revenues of stock exchanges, listing fees represent still an important and stable
flow, particularly for EU exchanges.
When compared with the previous research (Lazzari 2003), the price of issuers services do not
show any relevant change. On the whole, admission fees have been roughly stable, while the
annual fees have increased in some markets (Euronext, NASDAQ and TSX). Only BIT has
decreased the annual fee, even though solely for the largest issuers. Therefore, contrary to
literature expectations (Aggarwal, 2002; Macey and O’Hara, 2002) demutualization of
exchanges did not result in lower listing costs, at least up to now.
In the EU context maybe stronger competition could be promoted in the future by the growth
of self regulated exchanges. By now only some exchanges price the admission to trading and
the permanence on their self regulated market less than the admission on their main market,
while others share the same pricing schedule of their respective main markets. However, this
is not a very supporting signal, should we believe that market forces alone will be able to
promote higher competition in the exchange industry.

24
References
Aggarwal, R. (2002), Demutualization and Corporate governance of Stock Exchanges. Journal of Applied
Corporate Finance, Vol. 15, no. 1, pp105-113
Carson, J.W. (2003), Can demutualized exchanges successfully manage them? World Bank Policy Research
Working Paper 3183
Cetorelli N., and Peristiani S. (2009), Prestigious Stock Exchanges: a network analysis of International financial
Centres, Federal Reserve Bank of New York, Staff Report No. 384
Chemmanur T.J. and Fulghieri P. (2006). Competition and cooperation among exchanges: A theory of cross-
listing and endogenous listing standards. Journal of financial Economics, vol. 82, pp 455-489
Ferris, S.P.; Kim, A. K.; Noronha .G. (2009). The effect of cross-listing on corporate Governance: a review of
the international evidence. Corporate Governance: an international review, vol. 17, n.3, pp. 338-352
Focault T. and Parlour C.A. (1999). Competition for listing. Working paper CEPR.
French, K. R. and Porterba J. M., (1991). Investor diversification and international equity markets. American
Economic Review, 81, 222-226.
Huddard S., Hughes J.S. and Brunnermeier M. (1999), Disclosure requirements and stock exchange listing
choice in an international context. Journal of Accounting and Economics, vol 26, pp 237-269
Karmel, R. (2007), The Once and Future New York Stock Exchange: The Regulation of Global Exchanges,
Brooklyn Law School Legal Studies Research Papers, Research Paper No. 70
Karolyi, G.A. (2006) The world of cross-listings and cross-listings of the world: Challenging conventional
wisdom. Review of Finance, 10: 99-152.
Lazzari V. (2003), A comparative analysis of stock exchange listing fees, mimeo.
Macey, J. and O’Hara, M., (2002)The Economics of Stock Exchange Listing Fees and Listing Requirements.
Journal of financial intermediation, vol. 11.
Solnik, B. H., 1974. Why not diversify internationally rather than domestically? Financial Analysts Journal, 30,
48-54.

25
Table 1: General statistics on regulated exchanges included in the analysis (Data from WFE at 31st December 2009)
Exchange
Governance Domestic companies Market
capitalisation ($ millions)
Average daily trading turnover
($ millions)
Borsa Italiana (BIT) Listed group (LSE) 655,848 3,487
Euronext (ENXT) Listed 2,869,393 7,740
London Stock Exchange (LSE) Listed 2,796,444 13,404
Deutsche Borse (DB) Listed 1,292,355 8,608
Bolsas y Mercados Españoles (BME) Listed 800,603 5,058
Swiss exchange (SIX) Private ltd company owned by members
1,064,687 3,025
New York Stock Exchange (NYSE) Listed 11,837,793 70,574
NASDAQ Listed 3,239,492 114,886
Toronto Stock Exchange (TSX) Listed 1,676,814 4,940
Australian Stock Exchange (ASX) Listed 1,261,909 3,668
Tokyo Stock Exchange (TSE) Demutualized but not publicly listed
3,306,082 16,424

26
Table 2. Comparison of listing requirements in main markets Listing requirements Ongoing requirements
Market operator
Market Name
Minimum free float
Minimum mkt cap
Track record Intermediaries Price sensitive information
Annual reports Relevant transactions
BIT Mta 25% 40 mil € 3 financial statements, last year
certified
Obligation to have a sponsor
Communicated to Borsa which then
make it available to the public
Quarterly, half-year and annual reports
certified
Obligation to communicate
ENXT Eurolist 25% 50 mil € 3 certified financial statements
Specialist required
News must be published on the
company web site and communicated to
euronext
Half yearly and annual audited financial report, quarterly
reports
Obligation to disclose shareholding held by an individual entity
exceeding 5%
DB Amtlicher 25% 1,25 mil € 3 years Obligatory and must be
recognised by the Admission
Office
Must be communicated Annual report and a note every six months
Must be communicated
BME Main market
At least 100 shareholders must own <
25%
1,5 million € 3 years audited accounts
n.a. Must be communicated Annual reports certified, half year
reports and quarterly notice
Obligation to disclose shareholding held by an individual entity
exceeding 5% LSE Main
market 25% 700,000£ 3 certified
statements of account
Obligation to have a sponsor
Market must be informed of all price-
sensistive info
Half year and annual reports certified
Obligation to communicate
EU Listing Directive Requirements
25% 1,5 million € 3 previous balance sheets to be deposited at
disposal of public
- - - -
SIX Main market
25% CHF 25 millions
3 years of certified statements of
accounts
One advisor must be
recognised by Six
All potential price sensitive facts must be
communicated
Annual reports and six months interim report
A listing application must be submittted to Six Admission office
before capital increases, splits and
share exchanges
NYSE Nyse 1,100,000
shares 60 mil $ free
float; minimum mkt value must be from 25 to 100
million $
3 years with positive earnings
Underwriter ensure the
offering meets Nyse’s
standards
Timely disclosure to the Nyse and the media
Annual and half year interim reports must be
filed with the Sec
Timely disclosure to the Nyse and the media

27
Listing requirements Ongoing requirements
Market operator
Market Name
Minimum free float
Minimum mkt cap
Track record Intermediaries Price sensitive information
Annual reports Relevant transactions
NASDAQ
Global select mkt
Global market Capital Market
1.250.000 shares
1.000.000 shares
500.000 shares
70 mill$ (free float)
8 mil $ (free float)
1 mil $ (free float)
3 years record of meeting financial
standards on revenues or earnings
Underwriter ensure the
offering meets Nasdaq’s standards
Timely disclosure to Nasdaq
Annual and half year audited interim reports
Timely disclosure to Nasdaq
TSX TSX At least 1,000,000
freely tradeable
shares having an aggregate
market value of Cad
$4,000,000
Industrial sector: Net
tangible assets 2 million Cad Mining: net
tangible assets1 of $4 million Cad Oil and gas:
proved developed
reserves32 of 7,5 million
Cad
Pre tax earnings Cad 200,000 in the previous year
Sponsorship of an applicant
company by a Participating
Organization of the Exchange is
required
Timely disclosure Annual and half year audited interim reports
Timely disclosure
TSE 1st section
2nd section
35%
30%
50 billion yen
2 billion yen
3 years of continued bsn recordsMin.
profit for the most recent 2 years:
1st : 100 million yen 2nd 400 million yen
n.a. Obligation to communicate
Annual, half year and quarterly reports
Obligation to communicate
ASX Official list
Minimum 400
investors and 25% held by
unrelated parties
A$10 million market
capitalisation or
A$2 million Net Tangible
Assets or A$1 million
net profit over past 3 years +A$400,000
net profit over last 12 months
3 years of certified statements of
accounts
Advisor must be appointed
Obligation to communicate
Annual reports and six months interim report
Obligation to communicate
28
Table 3: Listing fees contribution to exchange total revenues (data from annual reports 2004 and 2009)
2004 2009
Exchange Currency
Listing revenues (in million)
Total revenues (in million)
Listing fees contribution to revenues
Listing revenues (in million)
Total revenues (in million)
Listing fees contribution to revenues
Borsa Italiana (BIT) EUR 22.3
195.4 11.4%
London Stock Exchange (LSE) GBP
35.0
250.0 14.0%
LSE Group GBP 50.7*
387.8* 13.1%*
90.6
671.4 13.5%
Euronext (ENXT) EUR 43.3
886.8 4.9%
59.0
1,208.0
New York Stock Exchange (NYSE) USD
329.8
1,089.5 30.3%
NYSE Euronext Group USD 388.8*
2,297.5* 16.9%*
406.0
4,687.0 8.7%
Deutsche Borse (DB) EUR 13.1
1,449.6 0.9%
13.3
2,061.7 0.6%
Bolsas y Mercados Españoles (BME) EUR
23.7
200.5 11.8%
26.0
297.0 8.7%
Swiss exchange (SIX) CHF 17.8
358.8 5.0%
49.9
1,448.0 3.4%
NASDAQ USD 159.3
540.0 29.5%
NASDAQ OMX Group USD n.a. n.a. n.a
209.0
3,409.0 6.1%
Toronto Stock Exchange (TSX) CAD
75.0
243.2 30.8%
129.2
556.3 23.2%
Australian Stock Exchange (ASX) AUD
84.8
450.4 18.8%
104.1
538.4 19.3%
Tokyo Stock Exchange (TSE) YEN
9,504.0
48,643.0 19.5%
8,073.0
67,090.0 12.0%
WFE USD n.a. n.a 13% 1,662 26,511 6% * Figurative data calculated by adding fees from merged exchanges

29
Table 4: Number of companies listed on main exchanges (Data from WFE at 31st December 2004 and 2009)
2004 2009 % Change 2004-2009 Exchange Total Domestic
companies Foreign companies
Total Domestic companies
Foreign companies
Total Domestic companies
Foreign companies
BIT 278 269 9 296 291 5 6.47% 8.18% -44.44%
ENXT 1,333 999 334 1,160 990 170 -12.98% -0.90% -49.10%
LSE 2,837 2,486 351 2,792 2,179 613 -1.59% -12.35% 74.64%
DB 819 660 159 783 704 79 -4.40% 6.67% -50.31%
BME 229 200 29 233 200 33 1.7% 0% 13.80%
SIX 409 282 127 339 275 64 -17.11% -2.48% -49.61%
NYSE 2,293 1,834 459 2,327 1,832 495 1.48% -0.11% 7.84%
NASDAQ 3,229 2,889 340 2,852 2,569 283 -11.68% -11.08% -16.76%
TSX 3,604 3,572 32 3,700 3,624 76 2.66% 1.46% 137.50%
ASX 1,583 1,515 68 1,966 1,882 84 24.19% 24.22% 23.53%
TSE 2,306 2,276 30 2,335 2,320 15 1.26% 1.93% -50.00%
TOTAL 18,691 16,782 1,909 18,724 16,803 1,921 0.18% 0.13% 0.63%

30
Table 5: Parameters Used to Quantify Admission Fees
Exchange Parameter
Borsa Italiana (BIT) Market capitalization
Euronext (ENXT) Market capitalization
London Stock Exchange (LSE) Market capitalization
Deutsche Borse (DB) None
Bolsas y Mercados Españoles (BME) Face value
Swiss exchange (SIX) Market capitalization
New York Stock Exchange (NYSE) Number of shares offered
NASDAQ Number of shares offered
Toronto Stock Exchange (TSX) Market capitalization
Australian Stock Exchange (ASX) Market capitalization
Tokyo Stock Exchange (TSE) Market Segment

31
Table 6: Admission Fees on the Main Markets by Issuers’ Size (amounts in €)
Issuer’s Data 1st Percentile
25th Percentile
50th percentile
75th percentile Largest
Capitalization (ml. euro) 10.75 53.30 170.84 797.00 71,338.00
Number of shares (ml.) 57.88 46.34 431.31 322.67 4,007.75
Exchanges
BIT - 25,000 25,626 119,550 500,000
ENXT - 35,977 92,336 313,101 3,000,000
LSE 10,956 44,989 81,807 164,330 397,187
DB 5,500 5,500 5,500 5,500 5,500 BME* (mkt cap = 3xface value)
4,745 18,925 58,107 234,724 n.a.
BME* (mkt cap= 10xface value)
n.a. 6,490 18,244 80,860 921,540
SIX - 9,445 10,620 16,882 63,755
NYSE (IPO 30%)** - 87,115 174,310 174,310 174,310
NYSE (IPO 60%)** - 96,864 174,310 174,310 174,310
NASDAQ (IPO 30%)** - 104,544 174,310 156,872 174,310
NASDAQ (IPO 60%)** - 104,544 174,310 174,310 174,310
TSX - 83,185 133,333 133,333 133,333
ASX*** 30,949 56,146 92,346 244,049 12,916,992**
TSE**** - 119,582 119,582 119,582 142,003
AVERAGE***** 53,551 86,177 146,724 551,194
MEDIAN***** 44,989 92,336 157,792 174,310
* BME charges are set according to the face value of the issuers’ equity capital. The market cap is thus assumed to be either 3 or 10 times the face value of their issued capital. Only the first assumption is considered for the smallest issuer, while only the second assumption is plausible for the largest issuer. **The US exchanges charge on the basis of the number of shares offered in the IPO. We thus assume that either 30% or 60% of the shares outstanding are offered. *** Fee calculated according to the published fee schedule. ASX has the discretionary power to discount very large fees on a case by case basis. The reported value does not contribute to the average. **** TSE fees are obtained considering the admission to Section 2 of its main market for all but the largest issuer which has been considered admitted to Section 1. ***** BME and the US exchanges contribute with the average of the fee calculated under both the scenarios considered in each case.
32
Table 7: Annual Fees on the Main Markets by Issuers’ Size (amounts in €)
Issuer’s Data 1st Percentile
25th Percentile
50th Percentile
75th Percentile Largest
Capitalization (ml. euro) 10.75 53.30 170.84 797.00 71,338.00 Number of shares (ml.) 57.88 46.34 431.31 322.67 4,007.75
Exchanges BIT 12,600 12,600 12,600 34,112 430,000 ENXT 18,600 14,200 23,208 29,470 50,000 LSE 4,518 4,518 5,891 15,280 44,535 DB * 7,500 7,500 7,500 10,000 10,000 BME 484 2,398 7,688 35,865 325,000 NYSE 37,534 30,051 279,674 209,232 348,481 NASDAQ 32,410 26,137 69,348 69,348 69,348 TSX 9,193 12,596 21,479 60,317 60,317 SIX 4,150 4,576 5,738 12,013 38,390 ASX 13,198 19,749 24,268 38,820 123,977 TSE** 5,381 10,762 10,762 21,525 34,081 Average 13,233 13,190 42,560 49,000 139,272 Median 9,193 12,596 12,6 34,112 63,333
* When considering DB, Blue Chips are charged the Prime Standard annual fee, while issuers on the standard segment are charged the General Standard annual fee. ** When considering TSE, issuers up to the 75th percentile are charged the Section 2 fee, while the largest issuer is charged the Section 1 fee.

33
Table 8: Annual Fee Revenue Generated by Different Pricing Schedules: the Case of Italian Issuers (amounts in €)
Exchanges Total Fees
Breakdown by Quartile of Issuers Country ranking based on prestige
index***
First
Quartile (Small Cap)
Second Quartile
Third Quartile
Fourth Quartile
(Large Caps)
Ipo activity
Trading value flows
NYSE 31,383,478 9.0% 17.4% 24.0% 49.7% 1st 1st NASDAQ 12,713,498 16.1% 23.4% 27.1% 34,1% 1st 1st BIT 12,493,883 6.7% 6.7% 8.9% 77.7% 11th 7th BME 10,787,112 0.8% 2.8% 10.2% 86.3% 19th 10th ASX 8,448,686 12.3% 17.3% 23.3% 47.1% 9th 11th TSX 8,321,111 8.4% 12.8% 28.5% 50.2% 8th 8th ENXT 6,236,015 14.8% 19.0% 23.1% 43.1% 6th 5th TSE* 4,186,547 11.1% 17.2% 28.3% 43.4% 5th 2nd LSE 3,469,086 8.6% 9.6% 16.0% 65.8% 2nd 3rd SIX 2,806,995 10.2% 11.9% 18.2% 59.7% 17th 26th DB** 2,330,000 22.7% 23.8% 25.1% 28.3% 3rd 14th AVERAGE 9,379,674 11.0% 14.7% 21.2% 53.2%
MEDIAN 8,321,111 10.2% 17.2% 23.3% 49.7%
* When considering TSE, issuers in the first three quartiles are charged the Section 2 fees, while issuers in the top quartile are charged the Section 1 fees. ** When considering DB, Blue Chips are charged the Prime Standard annual fee, while issuers on the standard segment are charged the General Standard annual fee.
*** Reported from Cetorelli N. and Peristiani S.(2009).

34
Table 9: Admission Fees: Percentage Change 2003–2009
Exchange 1st Percentile 25th Percentile 50th Percentile 75th Percentile Largest BIT 25.00% 16.01% -19.51% -5.80% -1.96%
ENXT 0.00% 0.00% 0.00% 0.00% 0.00%
LSE 18.73% 43.10% 32.61% 25.77% 34.77%
DB* 41.03% -45.00% -57.69% -74.42% -99.13%
NYSE 0.00% 5.20% 0.00% 0.00% 0.00%
NASDAQ 0.00% 0.00% 0.00% 0.00% 0.00%
TSX -49.15% 42.64% 62.60% 62.60% 62.60%
Average 5.09% 8.85% 2.57% 1.16% -0.53%
Median 0.00% 5.20% 0.00% 0.00% 0.00%
* In 2003, DB switched from a pricing based on the face value of the issuers’ equity capital to a uniform pricing policy. The drop in the fees shown in the Table overestimates the actual drop as Lazzari (2003) proxied the face value of equity with the market cap.

35
Table 10: Annual Fees: Percentage Changes 2003–2009
Exchanges 1st Percentile 25th Percentile 50th Percentile 75th Percentile Largest BIT -3.08% -3.08% -3.08% -3.78% -14.00%
ENXT 9.23% 18.33% 43.30% 15.00% 150.00%
LSE -21.87% -23.25% -15.22% -21.00% -8.70%
DB 0.00% 0.00% 0.00% 0.00% 0.00%
NYSE 8.57% 8.57% 0.00% 0.00% 0.00%
NASDAQ 41.51% 25.76% 65.83% 48.33% 65.83%
TSX 46.42% 26.26% 9.76% 46.15% 46.15%
Average 11.54% 7.51% 14.37% 18.10% 34.18%
Median 8.57% 8.57% 0.00% 15.00% 0.00%

36
Table 11: General statistics on Self Regulated Markets (Data from WFE at 31st December 2009)
Self Regulated Markets
Market cap ($ million)
Number of listed
companies
Admission fees
parameter
Annual fees parameter
Aim London 91,445.2 1,293 Market
capitalization None
Aim Italia 680.0 5 Market
capitalization
Market capitalizatio
n
Euronext – Alternext 5,997.1 125 Market
capitalization Number of
shares DB – Entry standard 12,076.5 116 None None

37
Table 12: Admission Fees at Self Regulated Markets by Issuer’s Size (amounts in €)
Company Features 1st Percentile 25th Percentile 50th Percentile 75th Percentile
Capitalization (ml. euro) 10.75 53.30 170.84 797.00
Number of shares (ml.) 57.88 46.34 431.31 322.67
Self Regulated Markets
Aim London 10,493 24,295 43,618 81,444
Aim Italia 20,000 20,000 25,626 119,550
Euronext – Alternext 10,453 35,977 92,336 313,101
DB – Entry standard 750 / 1,500 750 / 1,500 750 / 1,500 750 / 1,500

38
Table 13: Annual Fees on Self Regulated Markets by Issuer’s Size (amounts in €)
Company Features 1st Percentile 25th Percentile 50th
Percentile 75th
Percentile Capitalization (ml. euro) 10.75 53.30 170.84 797.00
Number of shares (ml.) 57.88 46.34 431.31 322.67
Self Regulated Markets
Aim London 5,753 5,753 5,753 5,753
Aim Italia 12,600 12,600 12,600 34,112
ENXT – Alternext 18,600 14,200 23,208 29,470
DB – Entry standard 5,000 5,000 5,000 5,000