GEOVISUALIZING SPATIO-TEMPORAL PATTERNS IN TENNIS
39
GEOVISUALIZING SPATIO-TEMPORAL PATTERNS IN TENNIS: An Alternative Approach to Post-match Analysis @damiendemaj : Geospatial Product Engineer
-
Upload
damien-demaj -
Category
Sports
-
view
3.864 -
download
2
Transcript of GEOVISUALIZING SPATIO-TEMPORAL PATTERNS IN TENNIS

GEOVISUALIZING SPATIO-TEMPORAL PATTERNS IN TENNIS: An Alternative Approach to Post-match Analysis
@damiendemaj : Geospatial Product Engineer
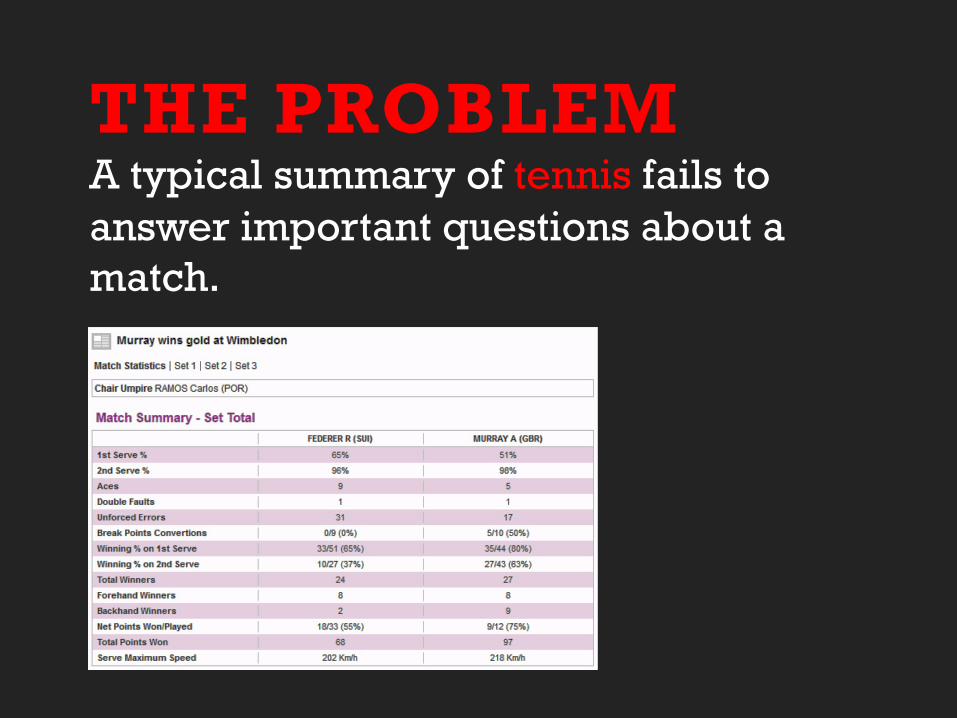
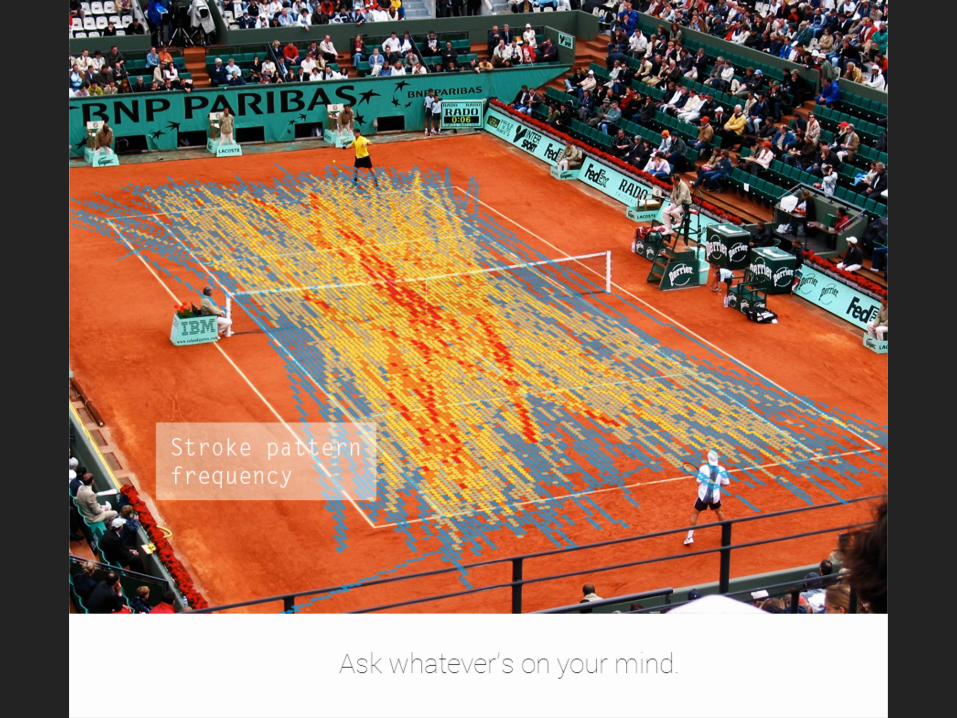
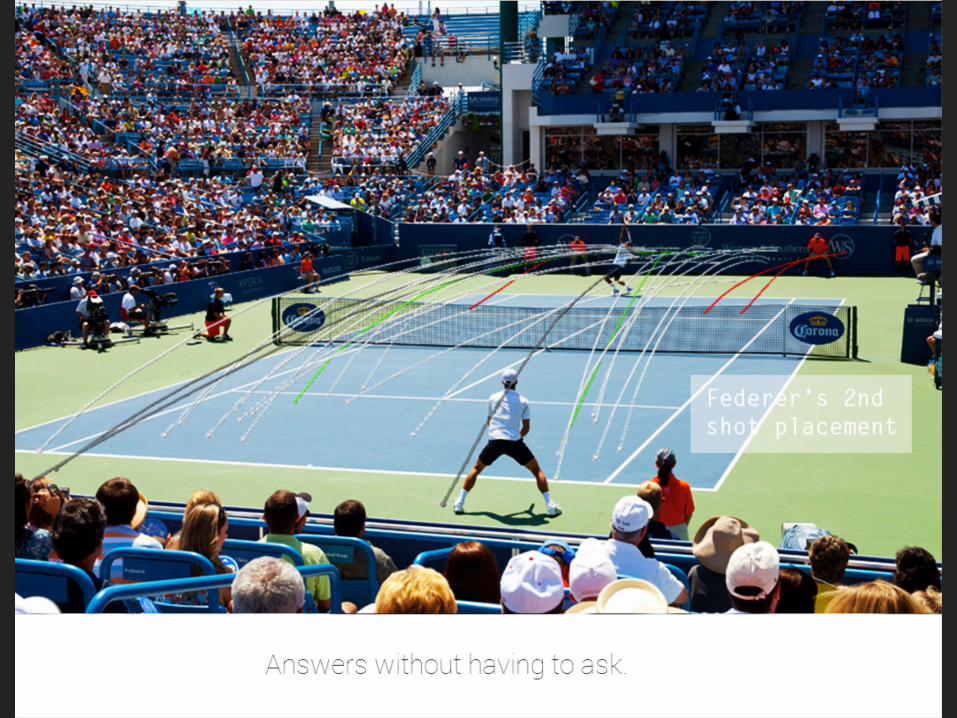
THE PROBLEM A typical summary of tennis fails to answer important questions about a match.

WHERE? WHEN? MAPS?

Geospatial and visual analysis. A real opportunity in tennis.

Within sport but outside of tennis, some spatio-temporal research has been completed.
In tennis however, spatio-temporal analytics is a relatively new area of study.

THE SERVE The most important shot in tennis?

Unpredictable differences in serve location makes your opponents life a lot more difficult.
“
”

The results of tennis matches are often determined by a small number of important points.
“
”

QUESTION Which player served with more
spatio-temporal variation at important points?

WHO? Roger Federer v Andy Murray
© Getty Images © Getty Images

WHERE? Olympic Gold Medal Match, London, UK Sunday Aug 5, 2012

DATA 1706 attributed spatial points Source: 3D GIS & streaming video


METHOD Plot x,y serve bounces in GIS 78 pts for Federer 86 pts for Murray
PART 1 of 4 Identify the visual structure of each serve pattern using K. Means algorithm tool in ArcGIS.

K. MEANS Algorithm
Looks for natural clusters in the data.

K. MEANS Algorithm Allows user to define similarity of serves by attribute (direction of serve) and number of groups. Federer = 11 Murray = 10

W B T
T B W
RESULT 1 of 4 Expected clusters in data. Classify data: Wide – Body – T

PART 2 of 4 Arrange the data into a temporal sequence to see who served with more spatial variation. Temporal sequence = service box, point #, shot #, game #, set #

Q: How do we measure spatial variation between serve locations?

Create
EUCLIDEAN LINES p1 (x1,y1) and p2 (x2,y2), p2 (x2,y2) and p3 (x3,y3), p3 (x3,y3) and p4 (x4,y4) etc
in each service court location

LARGE MEAN EUCLIDEAN distance = more spatial serve variation Small mean Euclidean distance = less spatial serve variation

RESULT 2 of 4 Federer served with greater spatial variation than Murray

PART 3 of 4 Tag the most ‘important’ serves Most important points in tennis: 30-40 and 40-Ad
Source: Morris 1977, [21]

SELECT Important points only Recalculate euclidean distance

RESULT 3 of 4 Murray served with more spatial variation at the most important points than Federer.

PART 4 of 4 Overlay successful serves onto important points to determine visual relationship.
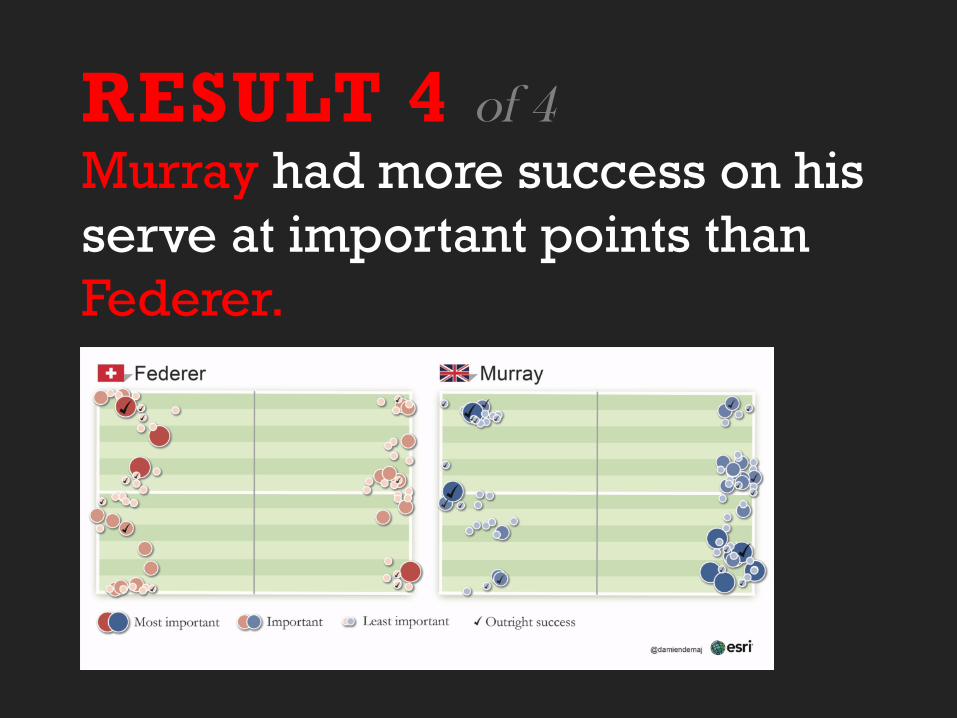
RESULT 4 of 4 Murray had more success on his serve at important points than Federer.

METHOD SUMMARY
1. Visual analytics
2. Introduced K Means Algorithm
3. Euclidean distances
4. Feature overlay

WRAP UP GIS provided an effective means to geovisualize spatio-temporal sports data. Reveal potential new patterns within sport.

NEXT STEP… Real-time authoritative data More data variables Integrate sports professionals

OTHER TECH OPPORTUNITIES…

GOOGLE GLASS in sport


REFERENCES
[1] M.J. Smith et el, “Geospatial Analysis, a comprehensive guide to principles, techniques and software tools”, Matador, 2007. [2] A. Mitchell, “The Esri guide to GIS Analysis”, Esri Press, 1999.
[3] J. Bertin, “Semiology of Graphics: Diagrams, Networks, Maps”, Esri Press, 2nd Edition, 2010. [4] Franc J.G.M. Klaassen and Jan R. Magnus, “Forecasting the winner of a tennis match”, European Journal of Operational Research, no. 148, pp.
257-267, Sept. 2003. [5] J.K Vis et el, “Tennis Patterns: Player, Match and Beyond”, In 22nd Benelux Conference on Artificial Intelligence (BNAIC 2010), Luxembourg,
25-26 October 2010. [6] T. Barnett and S.R. Clarke, “Combining player statistics to predict outcomes of tennis matches”, IMA Journal of Management and Mathematics,
vol. 16, pp. 113-120, 2005. [7] F. Radicchi, “Who is the best player ever? A complex network analysis of the history of professional tennis”, PLoS ONE 6(2): e17249. doi:
10.1371/journal.pone.0017249. [8] T. Barnett and S.R. Clarke, “Using Microsoft Excel to model a tennis match”, In Proceedings 6th Australian Conference on Mathematics and
Computers in Sport, Bond University, pp. 63-68, 2002. [9] B. Schroeder, “A methodology for pattern discovery in tennis rallys using the adaptive framework ANIMA”, In Second International Workshop
on Knowledge Discovery from Data Streams (IWKDDS), 2005. [10] A. Terroba et el, “Tactical analysis modeling through data mining, Pattern discovery in racket sports”, In International Conference on
Knowledge Discovery and Information Retreival (KDIR 2010), 2010. [11] A. Moore et el, “Sport and Time Geography: a good match?”, Presented at the 15th Annual Colloquium of the Spatial Information Research
Centre (SIRC 2003: Land, Place and Space), 2003. [12] A. Gatrell and P. Gould, “A micro-geography of team games: graphical explorations of structural relations”, Area, 11, 275-278.
[13] K. Goldsberry, “CourtVision: New Visual and Spatial Analytics for the NBA”, In Proceedings MIT Sloan Sports Analytics Conference, 2012. [14] United States Tennis Association, “Tennis tactics, winning patterns of play”, Human Kinetics, 1st Edition, 1996.
[15] G. E. Parker, “Percentage Play in Tennis”, In Mathematics and Sports Theme Articles, http://www.mathaware.org/mam/2010/essays/ [16] Hawk-Eye Innovations, http://www.hawkeyeinnovations.co.uk/
[17] J Ren, “Tracking the soccer ball using multiple fixed cameras”, Computer Vision and Image Understanding, vol. 113, pp. 633-642, 2009. [18] J.R. Wang and N. Parameswaran, “Survey of Sports Video Analysis: Research Issues and Applications”, In Proceedings of the Pan-Sydney area
workshop on Visualization, pp.87-90, 2005. [19] J. A. Hartigan and M. A. Wong, “Algorithm AS 136: A K-Means Clustering Algorithm”, Journal of the Royal Statistical Society. Series C (Applied
Statistics), vol. 28, No. 1, pp. 100-108, 1979. [20] ArcGIS Resources Help 10.1, http://resources.arcgis.com/en/help/main/10.1/index.html – /Grouping_Analysis/005p00000051000000/
[21] C. Morris, “The most important points in tennis”, In Optimal Strategies in Sports, vol 5 in Studies and Management Science and Systems, , North-Holland Publishing, Amsterdam, pp. 131-140, 1977.
[22] C.D. Lloyd, “Spatial data analysis, an introduction to for GIS users”, Oxford University Press, 1st edition, New York, 2010 [23] M. Lames, “Modeling the interaction in games sports – relative phase and moving correlations”, Journal of Sports Science and Medicine, vol
5, pp. 556-560, 2006

QUESTIONS? @damiendemaj gamesetmap.com
esri.com