Georgia Performance Standards High School Mathematics Research and
GPS Training Days 1, 2 and 3 Mathematics 1 Research and Resource Manual
1
Georgia Performance Standards
High School Mathematics
Research
and
Resource Manual
Spring 2007

GPS Training Days 1, 2 and 3 Mathematics 1 Research and Resource Manual
2
Use of This Manual
This training program was developed by the Georgia Department of Education as part of a series
of professional development opportunities to help teachers increase student achievement through
the use of the Georgia Performance Standards.
For more information on this or other GPS training, you may go to the math webpage through
the Georgia Department of Education website under Curriculum and Instruction or use the direct
link http://www.gadoe.org/ci_services.aspx?PageReq=CIServMath .
Training Materials
The module materials (guides, presentations, etc.) will be available electronically on
http://www.georgiastandards.org under the training tab after all trainings of Days 1, 2 and 3 have
occurred. Consult the trainer for availability.
GPS Training Days 1, 2 and 3 Mathematics 1 Research and Resource Manual
3
Organization of the Research and Resource Manual
The People Involved
Relevant and Supporting Research
Additional Research
Instructional Resources
Middle School Learning Tasks
Algebra Ladder
High School Learning Tasks
Article: Never Say Anything a Kid Can Say!
Article: Tips and Strategies for Co-teaching at the Secondary Level
The Equalizer
Four Parts of a Lesson
Co-Teaching Models Between General and Special Education Teachers
Georgia Student Achievement Pyramid of Interventions
Multiple Representations
Middle School GPS Mathematics Vertical Alignment Charts
High School GPS Mathematics Vertical Alignment Charts
Additional Instructional Resources
GPS Training Days 1, 2 and 3 Mathematics 1 Research and Resource Manual
4
The People involved
Expert Advisory Panel 2003-2004
The Expert Advisory Panel was charged with guiding and overseeing the writing of the
K-12 mathematics curriculum.
Dr. Sybilla Beckmann-Kazez
Department of Mathematics
University of Georgia
Dr. Michael N. Bleicher
Department of Mathematical
Sciences
Clark Atlanta University
Mr. Boon Boonyapat
Model Math Teacher
Atlanta Public Schools
Mr. Phil Daro
Director
The Public Forum on School
Accountability
Dr. Stanley DeJarnett
Superintendent
Morgan County Schools
Dr. Stephen Dolinger
Georgia Partnership for
Excellence in Education
Ms. Paula Gault
Superintendent
Forsyth County Schools
Dr. Fred Kiehle
Georgia Department of
Technical and Adult
Education
Dr. Barbara Lee
Principal
DeKalb County Schools
Dr. Judy Monsaas
Board of Regents
The University System of
Georgia
Mr. Mark Musick
President
Southern Regional Education
Board
Mr. Joe Redden
Superintendent
Cobb County Schools
Mr. Michael Sims
Principal, Parks Middle
School
Atlanta Public Schools
Dr. Sue Snow
Principal, Conyers Middle
School
Rockdale County Schools
Jeremy Kilpatrick, Ph.D.
Regents’ Professor
Mathematics Education
University of Georgia
Committee Chair, Reviewing
Research on Mathematics
Learning
National Research Council
Secondary Writing Team 2003-2004
The Secondary Writing Team was charged with writing the first draft of the secondary
mathematics curriculum with guidance from the Expert Advisory Panel.
Carolyn Baldree
Mathematics Specialist
Georgia Department of
Education
Mr. Boon Boonyapat
Model Math Teacher
Atlanta Public Schools
Carol J. Blackburn
Mathematics Department
Johnson High School
Hall County Public schools
Janet Davis
Mathematics Teacher
Starrs Mill High School
Fayette County Schools
Catherine Franklin
Mathematics Teacher
Columbus High School
Muscogee County Public
Schools
Past President, Georgia
Council of Teachers of
Mathematics
GPS Training Days 1, 2 and 3 Mathematics 1 Research and Resource Manual
5
Claire Pierce
Mathematics Specialist
Chattooga County Schools
Peggy Pool
Mathematics Teacher
Frieda Powell
Mathematics Specialist
Early County Public Schools
Dottie Whitlow
President, Georgia Council of
Teachers of Mathematics
National Center on Education
and the Economy
Mathematics Specialist
Palmer Middle School
Cobb County Public Schools
High School Advisory Committee 2004-2006
The High School Advisory Committee was charged with writing the final draft of the high
school mathematics curriculum adopted by the State Board of Education.
Shelly Allen
Mathematics Coordinator, K-
12
Richmond County Public
Schools
Diann Phillips Ash
Coordinator of Mathematics,
K-12
Atlanta Public Schools
Catherine C. Aust, Ph.D.
Professor of Mathematics
Clayton College & State
University
Past Chair,
Carol J. Blackburn
Mathematics Department
Chair
Johnson High School
Hall County Public schools
Sandy Blount
PRISM Program Specialist
College of Education
University of Georgia
Dr. Josephine D. Davis
Professor of Mathematics
Fort Valley State University
Janet Davis
Mathematics Teacher
Starrs Mill High School
Fayette County Public
Schools
Brad Findell, Ph.D.
Assistant Professor
Mathematics Education
University of Georgia
Christine Franklin, Ph.D.
Lecturer and Honors
Professor
Undergraduate Coordinator
Department of Statistics
University of Georgia
Chair, Writing Team for ―A
Curriculum Framework for
PreK-12 Statistics Education‖
American Statistical
Association
Catherine Franklin
Mathematics Teacher
Columbus High School
Muscogee County Public
Schools
Past President, Georgia
Council of Teachers of
Mathematics
Eric Greene
Executive Director
Georgia Coalition for
Science, Technology and
Mathematics Education
Jeremy Kilpatrick, Ph.D.
Regents’ Professor
Mathematics Education
University of Georgia
Committee Chair, Reviewing
Research on Mathematics
Learning
National Research Council
Katherine Miller
Mathematics Specialist
Northeast Georgia Regional
Education Services Agency
Tom Morley, Ph.D.
Professor of Mathematics
Georgia Institute of
Technology
Paul Ohme, Ph.D.
Director, Center for
Education Integrating
Science, Mathematics and
Computing
Georgia Institute of
Technology
GPS Training Days 1, 2 and 3 Mathematics 1 Research and Resource Manual
6
Tom Ottinger, Ph.D.
Associate Professor of
Mathematics
Reinhardt College
Past President, Georgia
Council of Teachers of
Mathematics
Claire D. Pierce
Mathematics Specialist
Georgia Department of
Education
Peggy Pool
Mathematics Teacher
Palmer Middle school
Cobb County Public Schools
Frieda Powell
Mathematics Specialist
Early County Public Schools
James E Pratt, Ed. D.
High School Mathematics
Coordinator
Cobb County Public Schools
Lynn Ridgeway
Mathematics Coordinator
Fayette County Public
Schools
James E. Smith, Ed. D.
Assistant Professor
Curriculum and Instruction
Fort Valley State University
L. Lynn Stallings, Ph.D.
Secondary and Middle
Grades Education
Kennesaw State University
Christine D. Thomas, Ph.D.
Associate Professor
Mathematics Education
Georgia State University
David Stone, Ph.D.
Professor of Mathematics
Georgia Southern University
Chair, Board of Directors
Georgia Coalition for
Science, Technology and
Mathematics Education
Marian Tillotson, Ph.D.
Mathematics Coordinator
Henry County Public schools
President, Georgia Council of
Supervisors of Mathematics
Dottie Whitlow
President, Georgia Council of
Teachers of Mathematics
Mathematics Specialist
National Center on Education
and the Economy
K-12 Advisory Committee 2006-2007
The K-12 Advisory committee is charged with advising and guiding the implementation of
the K-12 curriculum.
Shelly Allen Mathematics Coordinator, K-12
Richmond County Public
Schools
Catherine C. Aust, Ph.D.
Professor of Mathematics
Clayton College & State
University
Barbara Ferguson
Associate professor of
Mathematics
Kennesaw State University
President, Georgia Council of
Teachers of Mathematics
Brad Findell, Ph.D.
Assistant Professor
Mathematics Education
University of Georgia
Christine Franklin, Ph.D.
Undergraduate Coordinator
Department of Statistics
University of Georgia
Chair, Writing Team for ―A
Curriculum Framework for
PreK-12 Statistics Education‖
American Statistical
Association
Catherine Franklin
Mathematics Teacher
Columbus High School
Muscogee County Public
Schools
Past President, Georgia
Council of Teachers of
Mathematics
Jennifer Funderburk
Mathematics Coordinator
Colquitt County
Sheila Jones
Senior Executive Director of
P-16 Programs
University System of Georgia

GPS Training Days 1, 2 and 3 Mathematics 1 Research and Resource Manual
7
Fred Kiehle
Director
Instructional Support
Services
Georgia Department of
Technical and Adult
Education
Jeremy Kilpatrick, Ph.D.
Regents’ Professor
Mathematics Education
University of Georgia
Committee Chair, Reviewing
Research on Mathematics
Learning
National Research Council
Derek Lance
Mathematics Department
Head
Northwestern Technical
College
Diana Lossner
Mathematics Department
Chair
Pope High School
Cobb County Schools
Lynda Luckie
Mathematics Coordinator
Gwinnett County
President, Georgia Council of
Supervisors of Mathematics
Debra M. Lyons
Director
Governor's Office of
Workforce Development
Kaycie Maddox
Mathematics Consultant
Northeast Georgia RESA
Phyllis Martin
Mathematics Specialist
Georgia department of
Education
Denise Mewborn, Ph.D.
Professor and Department
Chair
Department of Mathematics
and Science Education
University of Georgia
Katherine Miller
Mathematics Specialist
Northeast Georgia Regional
Education Services Agency
Tom Morley, Ph.D.
Professor of Mathematics
Georgia Institute of
Technology
Mark Musick
Chairman
State Workforce Investment
Board
Paul Ohme, Ph.D.
Director, Center for
Education Integrating
Science, Mathematics and
Computing
Georgia Institute of
Technology
Tom Ottinger, Ph.D.
Associate Professor of
Mathematics
Reinhardt College
Past President, Georgia
Council of Teachers of
Mathematics
Carolyn G. Randolph
Mathematics Department
Chair
GAVS Coordinator
Kendrick High School
Muscogee County Schools
L. Lynn Stallings, Ph.D.
Secondary and Middle
Grades Education
Kennesaw State University
Dawn Souter
Mathematics Coordinator
Forsyth County Schools
Christine D. Thomas, Ph.D.
Associate Professor
Mathematics Education
Georgia State University
Mark Wilson
Principal
Morgan County High School
Morgan County Schools
Dr. Dorothy Zinsmeister
Assistant Vice Chancellor for
Academic Affairs
Associate Director for Higher
Education-PRISM Initiative
University System of Georgia
GPS Training Days 1, 2 and 3 Mathematics 1 Research and Resource Manual
8
Regional Education Service Agencies (RESA) Collaborative
Denise Huddlestun
Metropolitan RESA
Jonathan Laney
West Georgia RESA
Kaycie Maddox
Northeast Georgia RESA
Amy Mast
Georgia Department of
Education
Board of Regents,
University System of
Georgia
Samantha McGaw
Central Savannah River
Area RESA
Dr. Chandra Orrill
Learning and Performance
Support Laboratory
University of Georgia
Shari Quintero
Pioneer RESA
Betty Ray
Coastal Plains RESA
Robbie Ray
Oconee RESA
Linda Segars
Metropolitan RESA
Claire Smith
Okefenokee RESA
Kim White-Fredette
Griffin RESA
Lou Rodeheaver
Middle Georgia RESA
Marcia Williams
Pioneer RESA
K-2 Framework and Task Committee
Jean Anderson
Program Director
CEISMC
Theresa Banker
Department of Mathematics
Kennesaw State University
Jana Beanblossom
Consultant
SW-RESA
Krista Bennet
K-5 Mathematics Coach
Gwinnett County Public
Schools
Robin Berry
First Grade Teacher
Rockdale County Schools
Genie Brown
Literacy Specialist
Cobb County Schools
Lisa Bryan
Elementary School Teacher
on Special Assignment
Georgia Department of
Education
Karen Crider
K-5 Mathematics Coach
Houston County Public
Schools
Brenda Erwin
Mathematics Specialist
America’s Choice/Georgia’s
Choice
Jenny Funderburk
Curriculum Director
Colquitt County Public
Schools
Laura Grimwade
Mathematics Supervisor
Rockdale County Schools
Lyn Hart
Professor Mathematics
Education
Elizabeth Harrison
Title 1 Mathematics Lead
Teacher K-8
Houston County Schools
Lynda Holman
Marietta City Schools
Elementary EIP Teacher
GPS Training Days 1, 2 and 3 Mathematics 1 Research and Resource Manual
9
Amy Krause
K-5 Mathematics Supervisor
Cobb County Public Schools
Kelly McCurry
Kindergarten Teacher
Cobb County Schools
Terrell Moore
Third Grade Teacher
Henry County Public Schools
Lynne Moss
Kindergarten Teacher
Rockdale County Schools
Karen Murphy
Kindergarten Teacher
Barrow County Public
Schools
Darlene Pitts
Mathematics Specialist
Cobb County Schools
Susan Swars
K-12 Instructional Coach
Randolph County Public
Schools
Rachel Scott
Mathematics Facilitator
Cobb County Schools
Stephanie Smith
Assistant Professor
Mathematics Education
Georgia State University
Dawn Souter
K-12 Coordinator
Forsyth County Public
Schools
Laura Smith
Professor of Early Childhood
Education
Georgia State University
Leslie Willaford
First grade teacher
Rockdale County Schools
3-5 Framework and Mapping Committee Jane Barnard
Professor Mathematics
Education
Armstrong State University
Mathew Bryson
Special Education Teacher
Murray County Schools
Janie Cates
Mathematics Coordinator
Douglas County Schools
Greg Harrell
Professor of Mathematics
Valdosta State University
Mary Johnson
Elementary EIP Teacher
DeKalb County Schools
Greta Loeber
Mathematics Specialist
Gwinnett County Public
Schools
Lynda Luckie
Mathematics Coordinator
Gwinnett County
President, Georgia Council of
Supervisors of Mathematics
Alexia Luten
6th Grade EIP Teacher
Chatham County Schools
Helen Morris
Gwinnett County Public
Schools
Linda Oliver
6-8 Academic Coach
Chatham County Schools
Nathalie Roark
Special Education Teacher
Fayette County Public
Schools
Carmen Smith
Teacher on Special
Assignment
Georgia Department of
Education
Mark Smith
Mathematics K-12 Teacher
on Special Assignment
Cherokee County Schools
Sandra Trowell
Professor of Mathematics
Valdosta State University
Veronica Williams
4th Grade Mathematics
Teacher
DeKalb County Schools
Tad Watanabe
Professor of Mathematics
Kennesaw state University
GPS Training Days 1, 2 and 3 Mathematics 1 Research and Resource Manual
10
6th
Grade Framework Committee
Lisa Bryan
Teacher on Special
Assignment
Georgia Department of
Education
Laurel Bleich
Mathematics Teacher
The Westminster Schools
Sarah Ledford
Department of Mathematics
Kennesaw State University
Claire Pierce
Mathematics Specialist
Georgia Department of
Education
Peggy Pool
Teacher on Special
Assignment
Georgia Department of
Education
Wendy Sanchez
Department of Mathematics
Kennesaw State University
Dottie Whitlow
President, Georgia Council of
Teachers of Mathematics
Mathematics Specialist
National Center on Education
and the Economy
7th
Grade Framework Committee Cindy Apley
Shiloh Middle School
Gwinnett County
Dr. Thomas Banchoff
Professor of Mathematics
Brown University
Mary Garner
Professor of Mathematics
Kennesaw State University
Debbie Gober
Columbus State University
Cindy Henning
Columbus State University
Tom Ottinger
Reinhardt College
Frieda Powell
Early County Schools
Peggy Pool
Teacher on Special
Assignment
Georgia Department of
Education
Donna Saye
Georgia Southern University
Sharon Taylor
Georgia Southern University
8th
Grade Framework Committee Chris Harlow
The Westminster School
Annita Hunt
Clayton State University
Carla Modavan
Berry College
Linda Nash
Clayton State University
Kelli Nipper
Clayton State University
Peggy Pool
Teacher on Special
Assignment
Georgia Department of
Education
GPS Training Days 1, 2 and 3 Mathematics 1 Research and Resource Manual
11
Mathematics 1 Framework Committee
Cathie Aust, Ph.D.
Mathematics Professor
Clayton State College and
University
Barbara W. Ferguson, Ph.D.
Mathematics Professor
Kennesaw State University
Brad Findell, Ph.D.
Mathematics Education
University of Georgia
Sabrina Hancock
Mathematics Teacher
Mill Creek High School
Tom Morley, Ph.D.
Mathematics Professor
Georgia Institute of
Technology
Debbie Poss
Mathematics Teacher
Lassiter High School
Massie McAdoo, Ph.D.
Mathematics Teacher
Lakeside High School
Janet Davis
Mathematics Teacher
Starr’s Mill High School
Claire Pierce
Mathematics Program
Manager
Department of Education
Parent Letters and Concept Maps
Marsha Shrago
Program Director
Center for Education Integrating
Science Mathematics and Computing
Georgia Institute of Technology
Webcasts
Dr. Judy O’Neal
North Georgia College
Classroom Videos
Dr. Chandra Orrill
Learning and Performance Support Lab
University of Georgia
GPS Training Days 1, 2 and 3 Mathematics 1 Research and Resource Manual
12
High School Training Team Shelly Allen
Richmond County Schools
Mark Argo
Morgan County Schools
Laurel Bleich
The Westminster Schools
Angie Davis
White County Schools
Janet Davis
Fayette County Schools
Georgia Department of
Education
Tammy Donalson
Grady County Schools
Cathy Franklin
Muscogee County Schools
Jenny Funderburke
Colquitt County Schools
Lisa Gugino
Rockdale County Schools
Greg Harrell
Valdosta State University
Mark Henderson
Fayette County Schools
Nicole Ice
Kennesaw State University
Carol Johansen
Chattahoochee-Flint RESA
Diana Lossner
Cobb County Schools
Kaycie Maddox
Northeast Georgia RESA
Massie McAdoo
DeKalb County Schools
Georgia Department of
Education
Tom Ottinger
Reinhardt College
Peggy Pool
Cobb County Schools
Georgia Department of
Education
Debbie Poss
Cobb County Schools
Claire Pierce
Mathematics Program
Manager
Georgia Department of
Education
Robbie Ray
Oconee RESA
Lou Rodeheaver
Macon ETTC
Linda Segars
Metro RESA
Marsha Shrago
CEISMC
Bonnie Stoker
Houston County Schools
Anthony Stinson
DeKalb County Schools
Anita Sprayberry
Henry County Schools
Ann Schintzius
Gwinnett County Schools
Laura Speer
Cobb County Schools
Janet Tomlinson
Oconee County Schools
Sharon Taylor
Georgia Southern University
Sharquinta Tuggle
Rockdale County Schools
Lynn Stallings
Kennesaw State University
Kim White-Fredette
Griffin RESA
Partners
Board of Regents
University System of Georgia
Center for Education Integrating
Science Mathematics and Computing
Georgia Institute of Technology
Georgia Public Broadcasting
Learning and Performance Support Lab
University of Georgia
GPS Training Days 1, 2 and 3 Mathematics 1 Research and Resource Manual
13
Statement of the Mathematics Advisory Committee
The knowledge and skills that a Georgia high school graduate needs to be successful in college,
in the military, or on entry into a high-tech economy require access to the same rigorous
curriculum.
Jobs that are characterized as routine in nature, do not involve significant problem solving, and
do not involve creativity are jobs that are now being outsourced and will continue to be subject
to outsourcing to other countries or to be filled by unskilled labor. Consequently, Georgia
students finishing high school need to take responsibility for their own learning, be lifelong
learners, be creative, be problem solvers, be adaptable, and have a strong background in
mathematics, science, and technology.
Georgia has adapted from the Japanese mathematics curriculum the following characteristics:
1) fewer topics at each grade level
2) more rigor and depth
3) an integrated curriculum
4) a clear, focused path to higher (college) mathematics
The Georgia Performance Standards for mathematics are characterized by the four R’s:
1) Rigor
2) Relevance
3) Relationships, and
4) Reasoning
The Standards strike a balance between concepts, skills, and problem solving. The curriculum
provides more depth in concepts than its predecessor, presents real and relevant tasks, and
remains strong in computational skills. The Standards offer three sequences (core, regular, and
accelerated) that require students to attain a common level of mastery and allow students to
move from one sequence to another upon completion of periodic benchmarks.
The Standards require the mastery of the skills, fluency, understanding, and experience needed
for economic success regardless of a student’s potential choice of vocation or career.
Specifically, they provide a path that enables any student to achieve excellence in careers that
demand a high level of mathematical ability.
This revision of the high school GPS results from collaboration by master classroom teachers,
district and regional level mathematics leadership, and higher education faculty from both
mathematical science departments and colleges of education.
The committee is proud to present the proposed high school Georgia Performance Standards for
adoption.
GPS Training Days 1, 2 and 3 Mathematics 1 Research and Resource Manual
14
GPS Training Days 1, 2 and 3 Mathematics 1 Research and Resource Manual
15
How to Bring Our Schools Out of the 20th Century Sunday, Dec. 10, 2006 By CLAUDIA WALLIS, SONJA STEPTOE
JASON FULFORD AND PAUL SAHRE FOR TIME
Article Tools Print Email
Reprints
There's a dark little joke exchanged by educators with a dissident streak: Rip Van Winkle awakens in the 21st century after a
hundred-year snooze and is, of course, utterly bewildered by what he sees. Men and women dash about, talking to small
metal devices pinned to their ears. Young people sit at home on sofas, moving miniature athletes around on electronic
screens. Older folk defy death and disability with metronomes in their chests and with hips made of metal and plastic.
Airports, hospitals, shopping malls--every place Rip goes just baffles him. But when he finally walks into a schoolroom, the
old man knows exactly where he is. "This is a school," he declares. "We used to have these back in 1906. Only now the
blackboards are green."
American schools aren't exactly frozen in time, but considering the pace of change in other areas of life, our public schools
tend to feel like throwbacks. Kids spend much of the day as their great-grandparents once did: sitting in rows, listening to
teachers lecture, scribbling notes by hand, reading from textbooks that are out of date by the time they are printed. A
yawning chasm (with an emphasis on yawning) separates the world inside the schoolhouse from the world outside.
For the past five years, the national conversation on education has focused on reading scores, math tests and closing the
"achievement gap" between social classes. This is not a story about that conversation. This is a story about the big public
conversation the nation is not having about education, the one that will ultimately determine not merely whether some
fraction of our children get "left behind" but also whether an entire generation of kids will fail to make the grade in the global
economy because they can't think their way through abstract problems, work in teams, distinguish good information from
bad or speak a language other than English.
This week the conversation will burst onto the front page, when the New Commission on the Skills of the American
Workforce, a high-powered, bipartisan assembly of Education Secretaries and business, government and other education
leaders releases a blueprint for rethinking American education from pre-K to 12 and beyond to better prepare students to
thrive in the global economy. While that report includes some controversial proposals, there is nonetheless a remarkable
consensus among educators and business and policy leaders on one key conclusion: we need to bring what we teach and how
we teach into the 21st century.
Right now we're aiming too low. Competency in reading and math--the focus of so much No Child Left Behind (NCLB)
testing--is the meager minimum. Scientific and technical skills are, likewise, utterly necessary but insufficient. Today's
GPS Training Days 1, 2 and 3 Mathematics 1 Research and Resource Manual
16
economy demands not only a high-level competence in the traditional academic disciplines but also what might be called
21st century skills. Here's what they are:
Knowing more about the world. Kids are global citizens now, even in small-town America, and they must learn to act that
way. Mike Eskew, CEO of UPS, talks about needing workers who are "global trade literate, sensitive to foreign cultures,
conversant in different languages"--not exactly strong points in the U.S., where fewer than half of high school students are
enrolled in a foreign-language class and where the social-studies curriculum tends to fixate on U.S. history
Thinking outside the box. Jobs in the new economy--the ones that won't get outsourced or automated--"put an enormous
premium on creative and innovative skills, seeing patterns where other people see only chaos," says Marc Tucker, an author
of the skills-commission report and president of the National Center on Education and the Economy. Traditionally that's
been an American strength, but schools have become less daring in the back-to-basics climate of NCLB. Kids also must learn
to think across disciplines, since that's where most new breakthroughs are made. It's interdisciplinary combinations--design
and technology, mathematics and art--"that produce YouTube and Google," says Thomas Friedman, the best-selling author
of The World Is Flat.
Becoming smarter about new sources of information. In an age of overflowing information and proliferating media, kids
need to rapidly process what's coming at them and distinguish between what's reliable and what isn't. "It's important that
students know how to manage it, interpret it, validate it, and how to act on it," says Dell executive Karen Bruett, who serves
on the board of the Partnership for 21st Century Skills, a group of corporate and education leaders focused on upgrading
American education.
Developing good people skills. EQ, or emotional intelligence, is as important as IQ for success in today's workplace. "Most
innovations today involve large teams of people," says former Lockheed Martin CEO Norman Augustine. "We have to
emphasize communication skills, the ability to work in teams and with people from different cultures."
Can our public schools, originally designed to educate workers for agrarian life and industrial-age factories, make the
necessary shifts? The Skills commission will argue that it's possible only if we add new depth and rigor to our curriculum and
standardized exams, redeploy the dollars we spend on education, reshape the teaching force and reorganize who runs the
schools. But without waiting for such a revolution, enterprising administrators around the country have begun to update
their schools, often with ideas and support from local businesses. The state of Michigan, conceding that it can no longer
count on the ailing auto industry to absorb its poorly educated and low-skilled workers, is retooling its high schools,
instituting what are among the most rigorous graduation requirements in the nation. Elsewhere, organizations like the Bill
and Melinda Gates Foundation, the Carnegie Foundation for the Advancement of Teaching and the Asia Society are pouring
money and expertise into model programs to show the way.
What It Means to Be a Global Student
Quick! How many ways can you combine nickels, dimes and pennies to get 20¢? That's the challenge for students in a
second-grade math class at Seattle's John Stanford International School, and hands are flying up with answers. The students
sit at tables of four manipulating play money. One boy shouts "10 plus 10"; a girl offers "10 plus 5 plus 5," only it sounds like
this: "Ju, tasu, go, tasu, go." Down the hall, third-graders are learning to interpret charts and graphs showing how many
hours of sleep people need at different ages. "¿Cuantas horas duerme un bebé?" asks the teacher Sabrina Storlie.
This public elementary school has taken the idea of global education and run with it. All students take some classes in either
Japanese or Spanish. Other subjects are taught in English, but the content has an international flavor. The school pulls its
393 students from the surrounding highly diverse neighborhood and by lottery from other parts of the city. Generally, its
scores on state tests are at or above average, although those exams barely scratch the surface of what Stanford students
learn.
Before opening the school seven years ago, principal Karen Kodama surveyed 1,500 business leaders on which languages to
teach (plans for Mandarin were dropped for lack of classroom space) and which skills and disciplines. "No. 1 was
technology," she recalls. Even first-graders at Stanford begin to use PowerPoint and Internet tools. "Exposure to world
cultures was also an important trait cited by the executives," says Kodama, so that instead of circling back to the Pilgrims
GPS Training Days 1, 2 and 3 Mathematics 1 Research and Resource Manual
17
and Indians every autumn, children at Stanford do social-studies units on Asia, Africa, Australia, Mexico and South America.
Students actively apply the lessons in foreign language and culture by video-conferencing with sister schools in Japan, Africa
and Mexico, by exchanging messages, gifts and joining in charity projects.
Stanford International shows what's possible for a public elementary school, although it has the rare advantage of support
from corporations like Nintendo and Starbucks, which contribute to its $1.7 million-a-year budget. Still, dozens of U.S.
school districts have found ways to orient some of their students toward the global economy. Many have opened schools that
offer the international baccalaureate (I.B.) program, a rigorous, off-the-shelf curriculum recognized by universities around
the world and first introduced in 1968--well before globalization became a buzzword.
To earn an I.B. diploma, students must prove written and spoken proficiency in a second language, write a 4,000-word
college-level research paper, complete a real-world service project and pass rigorous oral and written subject exams. Courses
offer an international perspective, so even a lesson on the American Revolution will interweave sources from Britain and
France with views from the Founding Fathers. "We try to build something we call international mindedness," says Jeffrey
Beard, director general of the International Baccalaureate Organization in Geneva, Switzerland. "These are students who can
grasp issues across national borders. They have an understanding of nuances and complexity and a balanced approach to
problem solving." Despite stringent certification requirements, I.B. schools are growing in the U.S.--from about 350 in 2000
to 682 today. The U.S. Department of Education has a pilot effort to bring the program to more low-income students.
Real Knowledge in the Google Era
Learn the names of all the rivers in South America. That was the assignment given to Deborah Stipek's daughter Meredith in
school, and her mom, who's dean of the Stanford University School of Education, was not impressed. "That's silly," Stipek
told her daughter. "Tell your teacher that if you need to know anything besides the Amazon, you can look it up on Google."
Any number of old-school assignments--memorizing the battles of the Civil War or the periodic table of the elements--now
seem faintly absurd. That kind of information, which is poorly retained unless you routinely use it, is available at a keystroke.
Still, few would argue that an American child shouldn't learn the causes of the Civil War or understand how the periodic
table reflects the atomic structure and properties of the elements. As school critic E.D. Hirsch Jr. points out in his book, The
Knowledge Deficit, kids need a substantial fund of information just to make sense of reading materials beyond the grade-
school level. Without mastering the fundamental building blocks of math, science or history, complex concepts are
impossible.
Many analysts believe that to achieve the right balance between such core knowledge and what educators call "portable
skills"--critical thinking, making connections between ideas and knowing how to keep on learning--the U.S. curriculum
needs to become more like that of Singapore, Belgium and Sweden, whose students outperform American students on math
and science tests. Classes in these countries dwell on key concepts that are taught in depth and in careful sequence, as
opposed to a succession of forgettable details so often served in U.S. classrooms. Textbooks and tests support this approach.
"Countries from Germany to Singapore have extremely small textbooks that focus on the most powerful and generative
ideas," says Roy Pea, co-director of the Stanford Center for Innovations in Learning. These might be the key theorems in
math, the laws of thermodynamics in science or the relationship between supply and demand in economics. America's
bloated textbooks, by contrast, tend to gallop through a mind-numbing stream of topics and subtopics in an attempt to
address a vast range of state standards.
Depth over breadth and the ability to leap across disciplines are exactly what teachers aim for at the Henry Ford Academy, a
public charter school in Dearborn, Mich. This fall, 10th-graders in Charles Dershimer's science class began a project that
combines concepts from earth science, chemistry, business and design. After reading about Nike's efforts to develop a more
environmentally friendly sneaker, students had to choose a consumer product, analyze and explain its environmental impact
and then develop a plan for re-engineering it to reduce pollution costs without sacrificing its commercial appeal. Says
Dershimer: "It's a challenge for them and for me."
A New Kind of Literacy
GPS Training Days 1, 2 and 3 Mathematics 1 Research and Resource Manual
18
The juniors in Bill Stroud's class are riveted by a documentary called Loose Change unspooling on a small TV screen at the
Baccalaureate School for Global Education, in urban Astoria, N.Y. The film uses 9/11 footage and interviews with building
engineers and Twin Towers survivors to make an oddly compelling if paranoid case that interior explosions unrelated to the
impact of the airplanes brought down the World Trade Center on that fateful day. Afterward, the students--an ethnic mix of
New Yorkers with their own 9/11 memories--dive into a discussion about the elusive nature of truth.
Raya Harris finds the video more convincing than the official version of the facts. Marisa Reichel objects. "Because of a
movie, you are going to change your beliefs?" she demands. "Just because people heard explosions doesn't mean there were
explosions. You can say you feel the room spinning, but it isn't." This kind of discussion about what we know and how we
know it is typical of a theory of knowledge class, a required element for an international-baccalaureate diploma. Stroud has
posed this question to his class on the blackboard: "If truth is difficult to prove in history, does it follow that all versions are
equally acceptable?"
Throughout the year, the class will examine news reports, websites, propaganda, history books, blogs, even pop songs. The
goal is to teach kids to be discerning consumers of information and to research, formulate and defend their own views, says
Stroud, who is founder and principal of the four-year-old public school, which is located in a repurposed handbag factory.
Classes like this, which teach key aspects of information literacy, remain rare in public education, but more and more
universities and employers say they are needed as the world grows ever more deluged with information of variable quality.
Last year, in response to demand from colleges, the Educational Testing Service unveiled a new, computer-based exam
designed to measure information-and-communication-technology literacy. A pilot study of the test with 6,200 high school
seniors and college freshmen found that only half could correctly judge the objectivity of a website. "Kids tend to go to
Google and cut and paste a research report together," says Terry Egan, who led the team that developed the new test. "We
kind of assumed this generation was so comfortable with technology that they know how to use it for research and deeper
thinking," says Egan. "But if they're not taught these skills, they don't necessarily pick them up."
Learning 2.0
The chairman of Sun Microsystems was up against one of the most vexing challenges of modern life: a third-grade science
project. Scott McNealy had spent hours searching the Web for a lively explanation of electricity that his son could
understand. "Finally I found a very nice, animated, educational website showing electrons zooming around and tests after
each section. We did this for about an hour and a half and had a ball--a great father-son moment of learning. All of a sudden
we ran out of runway because it was a site to help welders, and it then got into welding." For McNealy the experience, three
years ago, provided one of life's aha! moments: "It made me wonder why there isn't a website where I can just go and have
anything I want to learn, K to 12, online, browser based and free."
His solution: draw on the Wikipedia model to create a collection of online courses that can be updated, improved, vetted and
built upon by innovative teachers, who, he notes, "are always developing new materials and methods of instruction because
they aren't happy with what they have." And who better to create such a site than McNealy, whose company has led the way
in designing open-source computer software? He quickly raised some money, created a nonprofit and--voilà!--Curriki.org
made its debut January 2006, and has been growing fast. Some 450 courses are in the works, and about 3,000 people have
joined as members. McNealy reports that a teenager in Kuwait has already completed the introductory physics and calculus
classes in 18 days.
Curriki, however, isn't meant to replace going to school but to supplement it and offer courses that may not be available
locally. It aims to give teachers classroom-tested content materials and assessments that are livelier and more current and
multimedia-based than printed textbooks. Ultimately, it could take the Web 2.0 revolution to school, closing that yawning
gap between how kids learn at school and how they do everything else. Educators around the country and overseas are
already discussing ways to certify Curriki's online course work for credit.
Some states are creating their own online courses. "In the 21st century, the ability to be a lifelong learner will, for many
people, be dependent on their ability to access and benefit from online learning," says Michael Flanagan, Michigan's
GPS Training Days 1, 2 and 3 Mathematics 1 Research and Resource Manual
19
superintendent of public instruction, which is why Michigan's new high school graduation requirements, which roll out next
year, include completing at least one course online.
A Dose of Reality
Teachers need not fear that they will be made obsolete. They will, however, feel increasing pressure to bring their methods--
along with the curriculum--into line with the way the modern world works. That means putting a greater emphasis on
teaching kids to collaborate and solve problems in small groups and apply what they've learned in the real world. Besides,
research shows that kids learn better that way than with the old chalk-and-talk approach.
At suburban Farmington High in Michigan, the engineering-technology department functions like an engineering firm, with
teachers as project managers, a Ford Motor Co. engineer as a consultant and students working in teams. The principles of
calculus, physics, chemistry and engineering are taught through activities that fill the hallways with a cacophony of nailing,
sawing and chattering. The result: the kids learn to apply academic principles to the real world, think strategically and solve
problems.
Such lessons also teach students to show respect for others as well as to be punctual, responsible and work well in teams.
Those skills were badly missing in recently hired high school graduates, according to a survey of over 400 human-resource
professionals conducted by the Partnership for 21st Century Skills. "Kids don't know how to shake your hand at graduation,"
says Rudolph Crew, superintendent of the Miami-Dade school system. Deportment, he notes, used to be on the report card.
Some of the nation's more forward-thinking schools are bringing it back. It's one part of 21st century education that sleepy
old Rip would recognize.
With reporting by Carolina A. Miranda
GPS Training Days 1, 2 and 3 Mathematics 1 Research and Resource Manual
20
Reprinted with permission from the American Educational Research Association
GPS Training Days 1, 2 and 3 Mathematics 1 Research and Resource Manual
21
GPS Training Days 1, 2 and 3 Mathematics 1 Research and Resource Manual
22
GPS Training Days 1, 2 and 3 Mathematics 1 Research and Resource Manual
23
GPS Training Days 1, 2 and 3 Mathematics 1 Research and Resource Manual
24
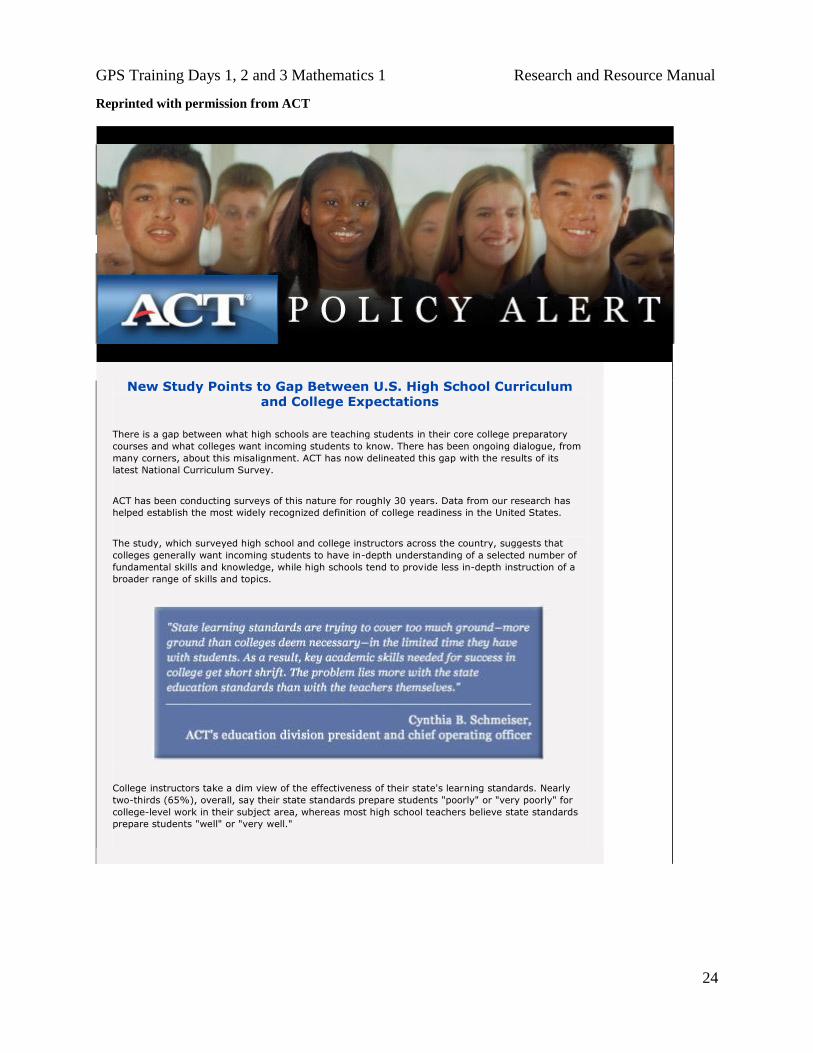
Reprinted with permission from ACT
New Study Points to Gap Between U.S. High School Curriculum
and College Expectations
There is a gap between what high schools are teaching students in their core college preparatory
courses and what colleges want incoming students to know. There has been ongoing dialogue, from
many corners, about this misalignment. ACT has now delineated this gap with the results of its
latest National Curriculum Survey.
ACT has been conducting surveys of this nature for roughly 30 years. Data from our research has
helped establish the most widely recognized definition of college readiness in the United States.
The study, which surveyed high school and college instructors across the country, suggests that
colleges generally want incoming students to have in-depth understanding of a selected number of
fundamental skills and knowledge, while high schools tend to provide less in-depth instruction of a
broader range of skills and topics.
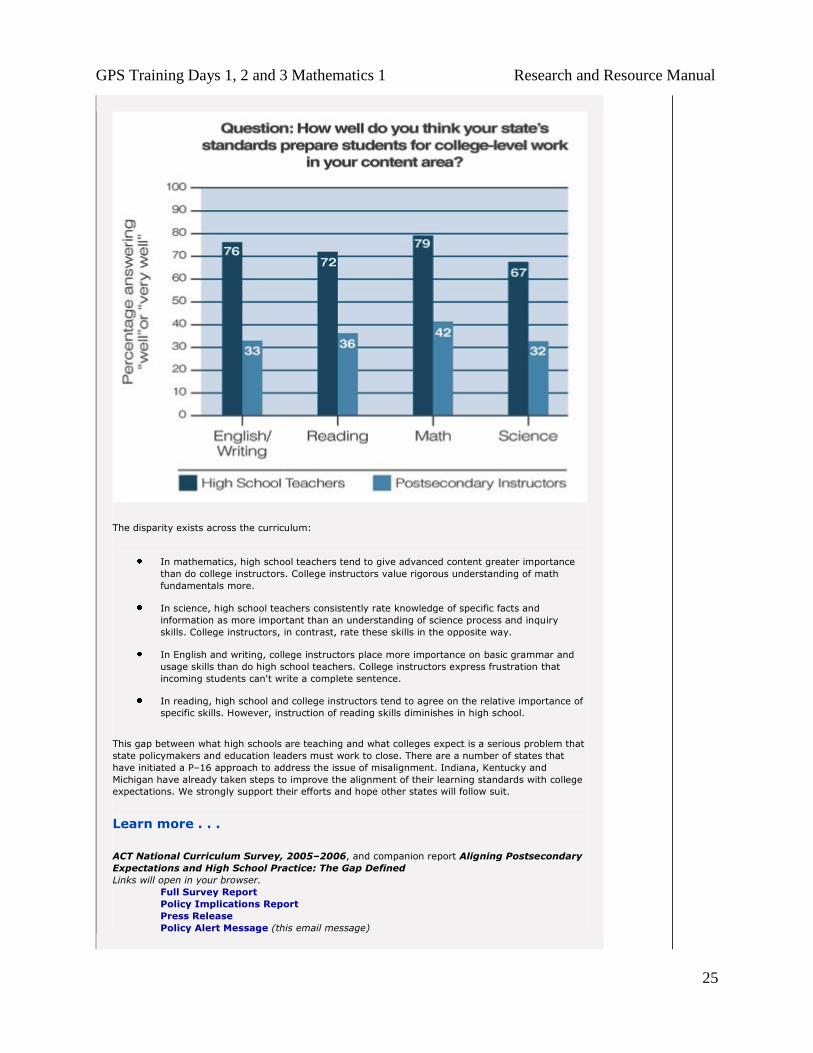
College instructors take a dim view of the effectiveness of their state's learning standards. Nearly
two-thirds (65%), overall, say their state standards prepare students "poorly" or "very poorly" for
college-level work in their subject area, whereas most high school teachers believe state standards
prepare students "well" or "very well."
GPS Training Days 1, 2 and 3 Mathematics 1 Research and Resource Manual
25
The disparity exists across the curriculum:
In mathematics, high school teachers tend to give advanced content greater importance
than do college instructors. College instructors value rigorous understanding of math
fundamentals more.
In science, high school teachers consistently rate knowledge of specific facts and
information as more important than an understanding of science process and inquiry
skills. College instructors, in contrast, rate these skills in the opposite way.
In English and writing, college instructors place more importance on basic grammar and
usage skills than do high school teachers. College instructors express frustration that
incoming students can't write a complete sentence.
In reading, high school and college instructors tend to agree on the relative importance of
specific skills. However, instruction of reading skills diminishes in high school.
This gap between what high schools are teaching and what colleges expect is a serious problem that
state policymakers and education leaders must work to close. There are a number of states that
have initiated a P–16 approach to address the issue of misalignment. Indiana, Kentucky and
Michigan have already taken steps to improve the alignment of their learning standards with college
expectations. We strongly support their efforts and hope other states will follow suit.
Learn more . . .
ACT National Curriculum Survey, 2005–2006, and companion report Aligning Postsecondary
Expectations and High School Practice: The Gap Defined
Links will open in your browser.
Full Survey Report
Policy Implications Report
Press Release
Policy Alert Message (this email message)
GPS Training Days 1, 2 and 3 Mathematics 1 Research and Resource Manual
26
from Integrated Mathematics Choices and Challenges:
―An integrated mathematics program is a holistic mathematics curriculum that-------
Consists of topics from a wide variety of mathematical fields and blends those
topics to emphasize the connections and unity among those fields;
Emphasizes the relationships among topics within mathematics as well as
between mathematics and other disciplines;
Each year, includes those topics at levels appropriate to students’ abilities;
Is problem centered and application based;
Emphasizes problem solving and mathematical reasoning;
Provides multiple contexts for students to learn mathematics concepts;
Provides continual reinforcement of concepts through successively expanding
treatment of those concepts;
Makes appropriate use of technology
According to Burkhardt, ―Nowhere else in the world would people contemplate the idea of a year
of algebra, a year of geometry, another year of algebra, and so on.‖ The following advantages of
integrated curricula are adapted from Burkhardt’s discussion (2001):
Integrated curricula build essential connections through active processing over an
extended period that first consists of weeks as the curriculum points out
fundamental links and then ultimately encompasses years as the concepts are used
in solving problems across a variety of contexts.
Integrated curricula help make mathematics more usable by making links with
practical contexts that give students opportunities to use their mathematics
successfully in increasingly challenging problems.
Integrated curricula avoid long gaps in learning that result from ―year-long
chunks of one-flavored curriculum.‖
Integrated curricula allow a balanced curriculum with the flexibility to include
newer as well as traditional topics of mathematics and to foster problem solving
that spans several aspects of mathematics.
Integrated curricula support equity because different branches of mathematics, for
example, algebra and geometry, favor different learning styles, so an entire school
year of one branch puts some students at a greater disadvantage than does a more
balanced curriculum that includes several areas of mathematics.‖
House, Peggy A. “Integrated Mathematics: An Introduction.” In Integrated Mathematics Choices and Challenges, edited by Sue Ann
McGraw, pp. 5-6. Reston, VA.: NCTM, 2003.
GPS Training Days 1, 2 and 3 Mathematics 1 Research and Resource Manual
27
―Merging areas of mathematics reaches its pinnacle when all mathematics is merged.
The idea of breaking down all notions of teaching a particular area of mathematics has had
proponents throughout the twentieth century. In 1901, E. H. Moore, the mathematics department
chair at the University of Chicago, recommended the traditional subject areas of school
mathematics---algebra, geometry, and trigonometry—be unified. In the first decades of this
century, a unified curriculum was developed by George W. Myers and later by Ernest Breslich at
the laboratory Schools at the University of Chicago. (Myers 1911; Breslich 1915, 1916, 1917;
Breslich et al. 1916; Senk 1981).
Since the 1960s, the School Mathematics Project (SMP) and other mathematics projects
in England have developed curricula in which topics from many different branches of
mathematics—probability and statistics, geometry, algebra, and functions—are found in almost
every year. Unifying ideas, such as set and logic and transformation, are found throughout, as
are real-world applications.
Beginning in the early 1990s, with support from the National Science Foundation, a
number of projects have developed materials for grades 9-12 in which the mathematics is
developed around broad problem situations. The ARISE curriculum ( Consortium on
Mathematics and Its Applications [COMAP] 1998) is organized around units or modules based
on such themes are fairness and apportionment, Landsat, and animation, with each module
designed to provide about a month’s worth of work in a school year. For instance, of the five
units in the first course, ―Patterns,‖ ―The Game of Pig,‖ ―Overland Trail,‖ ―The Pit and the
Pendulum,‖ and ―Shadows,‖ only the first and last hint at the mathematics involved. The
curriculum of the Systematic Initiative for Montana Mathematics and Science (SIMMS 1996) is
similar, except that its units are shorter, being about two to two-and-one-half weeks in duration.
These recent curricula exhibit unifying concepts from applied mathematics, including,
most important, mathematical modeling, and also simulation, estimation and approximation.
The idea that applied mathematics might supply unifying concepts for school mathematics
curricula is relatively recent, but the unity between mathematics and its applications has long
been recognized. The greatest mathematicians of all time, from Archimedes through Newton
and Euler to Gauss, worked in both pure and applied mathematics and back and forth from one to
the other.‖
Usiskin, Zalman. “The Integration of the School’s Mathematics Curriculum in the United States: History and Meaning.” In Integrated
Mathematics Choices and Challenges, edited by Sue Ann McGraw, pp. 19-20. Reston, VA.: NCTM, 2003.
GPS Training Days 1, 2 and 3 Mathematics 1 Research and Resource Manual
28
―The mathematics curriculum that we have today in U.S. high schools is, for all its ancient
subject matter, an artifact of the twentieth century. I used to assume that it had always been there, dating
back perhaps to the ancient Babylonians, until I discovered that it have actually evolved from the
decisions made by a committee of ten university academicians, known as the ―Committee of Ten,‖ in the
early 1900’s. Their motivation was to prepare students for college mathematics, which then meant
calculus. Today, despite a century of the greatest growth in knowledge that mathematics has ever
enjoyed, such preparation still means calculus; and so the core curriculum, defying all logic, endures in
much the same form as it took when our grandparents went to school. Because the books predated the
courses, a natural approach in those early days was to build the curriculum around subjects for which
individual primers already existed---algebra, geometry, trigonometry, analytic geometry, and calculus.
No book existed about all mathematics in 1900, and hence no template for an integrated course.
Many people tend to forget that obviously no books about all of geometry or algebra or calculus
existed either; we had books of selected topics that could serve only as introductions to those subjects.
After a century of repetition, those original topics have gradually become definitive, so that many people
now assume, for example, that a 900-page textbook entitled Geometry must surely contain everything that
is important about geometry. The mere fact that nobody ever planned it that way suggests that this
assumption is not likely to be true. Mathematicians should know that it is not even close.
While on the subject of circumstances that nobody ever planned, let me add that no mathematics
textbook in 1900 would have contained 900 pages, either. New discoveries and the needs of the
workplace have actually prompted some curricular reforms over the years, but, incredibly, they have
served only to add more material to what was already one of the most content-laden subjects in the high
school curriculum. The bloated textbooks of today consequently contain sections on applied matrix
algebra, descriptive statistics, transformational geometry, linear programming, computer programming,
game theory, graph theory, Boolean algebra, and optimization---topics that were unheard of forty years
ago---whereas only a few of the topics from forty years ago (log tables and trig tables come to mind) have
been dropped. The sad effect of adding these topics without regard to their effect on teachers and
students has been chaos, with teachers’ picking and choosing topics from textbooks that are far too
enormous from which to teach, often omitting, or shortchanging, the very topics that the bloated
textbooks were designed to preserve.
All this accumulation leads, I hope, to the conclusion that it is time to rethink the core
mathematics curriculum. Defending the current curriculum on the grounds that it has always been the
curriculum is not only specious but counterproductive. Defending the current curriculum on the grounds
that it is a product of careful design is historically inaccurate. Defending the current curriculum on the
grounds that it represents what mathematics ―is‖ is a trivialization of mathematics. We are teaching an
accident of evolution, a collection of topics that began as discrete nineteenth-century primers and
accumulated a disjointed bunch of modern topics along the way. We ought to be teaching an integrated
twenty-first-century primer that is the product of careful design. Doing so would mean, however,
throwing out some non-essential topics that some might consider sacred. It would entail getting back to
our mathematical roots, some of which are essential and deep but some of which are, to borrow a term
from algebra, extraneous.‖
Kennedy, Dan. “Getting Back to Our Non-Extraneous Roots.” In Integrated Mathematics Choices and Challenges, edited by Sue Ann
McGraw, pp. 34-36. Reston, VA.: NCTM, 2003.
GPS Training Days 1, 2 and 3 Mathematics 1 Research and Resource Manual
29
Additional Research
Articles:
NCTM’s Mathematics Education Dialogues series addressed Integrated Mathematics curriculum
in its January 2001 edition which is available on the Web site www.nctm.org. The most relevant
articles are:
Integrated Mathematics? Yes, but Teachers Need Support! By Bob Trammel
The Emperor’s Old Clothes, or How the World Sees It… by Hugh Burkhardt
Integrated Mathematics and High-Stakes Standardized Testing – They Do Go Together! By
Gabe McMillan
Universities and Integrated Mathematics – How They Interact by James Hershberger.
Prevost, F. J. ―Rethinking How We Teach: Learning Mathematical Pedagogy.‖ The Mathematics
Teacher; January 1993; 86, 1; Research Library pg. 75.
Sanchez, W. and Ice, N. ―Open-Ended Items Better Reveal Students' Mathematical Thinking.‖
NCTM News Bulletin, July/August 2004.
McTighe, J. and O’Connor, K. ―Seven Practice for Effective Learning.‖ Educational
Leadership; November 2005; 10-17.
Leahy, S., Lyon, C., Thompson, M., & Wiliam, D. ―Classroom Assessment Minute by Minute
Day by Day.‖ Educational Leadership; November 2005; 18-24.
Burns, M. ―Looking at How Students Reason.‖ Educational Leadership; November 2005;
26-31.
Books:
Goldsmith, L. T., Mark, J., & Kantrov, I. (2000). Choosing a standards-based mathematics
curriculum. Portsmouth, NH: Heinemann. ISBN 0-325-00163-4
This book offers research-based evidence on the effectiveness of a standards-
based curriculum.
Kilpatrick, J., Martin, W. G., & Schifter, D. (2003). A research companion to Principles and
Standards for School Mathematics. Reston, VA: The National Council of Teachers of
Mathematics. ISBN 0-87353-537-5
Offers extensive research on standards-based instruction – a number of articles
provide evidence on the effectiveness of the Process Standards (problem solving,
mathematical reasoning, communication, making connections, and use of multiple
representations).
GPS Training Days 1, 2 and 3 Mathematics 1 Research and Resource Manual
30
McGraw, S. A., ed. (2003). Integrated mathematics: Choices and challenges. Reston, VA:
The National Council of Teachers of Mathematics, Inc. ISBN 0-87353-530-9
Provides a number of articles on the planning, implementing, and assessing
integrated mathematics curriculum. The definitions of ―integration‖ vary (some
articles address cross curricular integration). Parts 1 and 4 are most applicable for
Georgia teachers. In addition, chapter 10 offers a view of integrated college
instruction through math modeling that may interest high school teachers.
Posamentier, A. S. & Jaye, D. (2006). What Successful Math Teachers Do, Grades 6 – 12.
Thousand Oaks, CA: Corwin Press. ISBN 1-4129-1619-4
Offers 79 research-based strategies that help students and teachers be successful
in mathematics – presents research, alignment to NCTM Standards, classroom
application, and possible pitfalls.
Senk, S. L. & Thompson, D. R., eds. (2003). Standards-based school mathematics curriculum.
Mahwah, NJ: Lawrence Erlbaum Associates. ISBN 0-8058-5028-7
Most of the research on integrated curriculum investigates specific curriculum
materials. This book provides historical background on reform efforts in
mathematics, as well as research on the implementation of various integrated
mathematics curricula, looking specifically at the effectiveness of reform
(integrated, performance-based) curricula compared to traditional curricula
materials.
Stein, M. L., Smith, M. S., Henningsen, M. A. and Silver, E. A. (2000). Implementing
Standards-based Mathematics Instruction. New York, NY: Teachers College Press.
ISBN 0-8077-3907-3
The book presents specific cases of mathematics instruction and instructional
strategies. Suggestions are made to teachers about how to cultivate a challenging,
cognitively rich, and exciting classroom environment that propels students toward
a deeper understanding and appreciation of mathematics.
Schoen,H. L., ed. (2006). Teaching Mathematics through Problem Solving. Reston, VA: The
National Council of Teachers of Mathematics. ISBN 0-87353-541-3
The goal of this book is to help students develop a deeper understanding of
mathematical concepts and methods by engaging them in trying to make sense of
problematic tasks in which the mathematics to be learned is embedded. This
volume and its companion for PreK-6 furnish the coherence and direction that
teachers need to use problem solving to teach mathematics.
GPS Training Days 1, 2 and 3 Mathematics 1 Research and Resource Manual
31
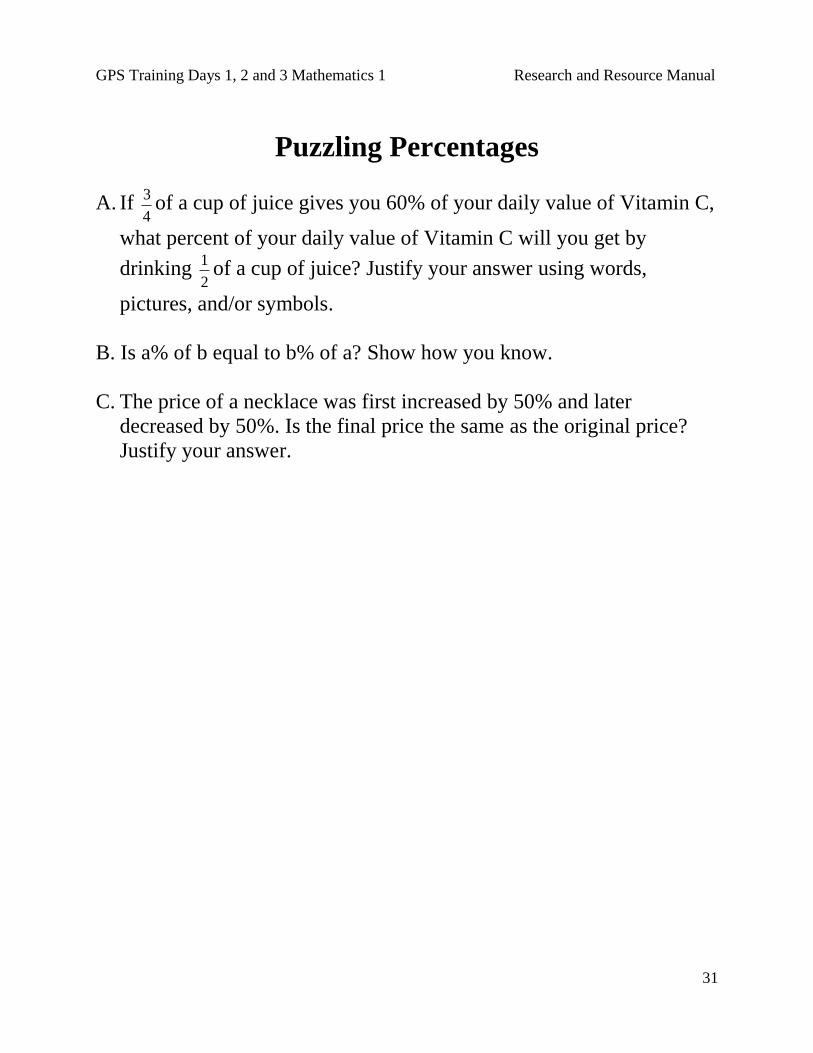
Puzzling Percentages
A. If 4
3of a cup of juice gives you 60% of your daily value of Vitamin C,
what percent of your daily value of Vitamin C will you get by
drinking 2
1of a cup of juice? Justify your answer using words,
pictures, and/or symbols.
B. Is a% of b equal to b% of a? Show how you know.
C. The price of a necklace was first increased by 50% and later
decreased by 50%. Is the final price the same as the original price?
Justify your answer.
GPS Training Days 1, 2 and 3 Mathematics 1 Research and Resource Manual
32
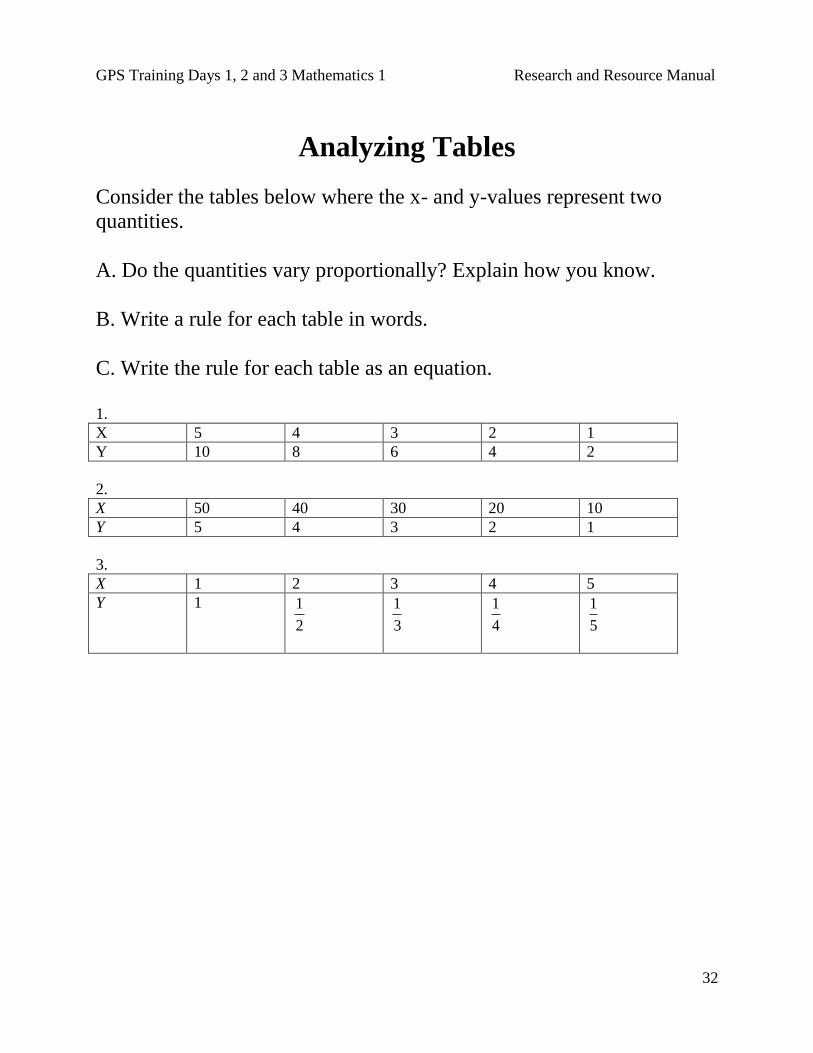
Analyzing Tables
Consider the tables below where the x- and y-values represent two
quantities.
A. Do the quantities vary proportionally? Explain how you know.
B. Write a rule for each table in words.
C. Write the rule for each table as an equation.
1.
X 5 4 3 2 1
Y 10 8 6 4 2
2.
X 50 40 30 20 10
Y 5 4 3 2 1
3.
X 1 2 3 4 5
Y 1
2
1
3
1
4
1
5
1
GPS Training Days 1, 2 and 3 Mathematics 1 Research and Resource Manual
33
Surprise Birthday Party
Sue decided to give Maria a surprise birthday party. She ordered a large
ice cream cake for the party, but is not sure how many people to invite.
A. How will the number of people attending the party affect the portion
of cake that each person gets?
B. Is there a relationship between the number of people attending the
party and the portion of the cake that each person gets? Explain your
answer and illustrate with pictures, a table, and a graph.
C. What is the constant of proportionality and what does it represent in
the context of this problem?

GPS Training Days 1, 2 and 3 Mathematics 1 Research and Resource Manual
34
A Staircase Task
A same-color staircase is made from Cuisenaire rods. Each time that a
rod is added to the staircase, it is offset by the space of a 1 unit rod. The
rods that are used to make the staircase are 3 units in length.
A. What is the surface area and volume of a staircase that is 3 units tall?
B. Predict the volume and surface area of a staircase that is 5 units high.
Find the actual surface area and volume, and compare them with your
answer. Explain any discrepancies that you found.
C. What will the volume and surface area be when you add the
hundredth rod?
C. Develop a general method or rule that can be used to determine the
volume and surface area for any number of rods. Explain your
thinking.
GPS Training Days 1, 2 and 3 Mathematics 1 Research and Resource Manual
35
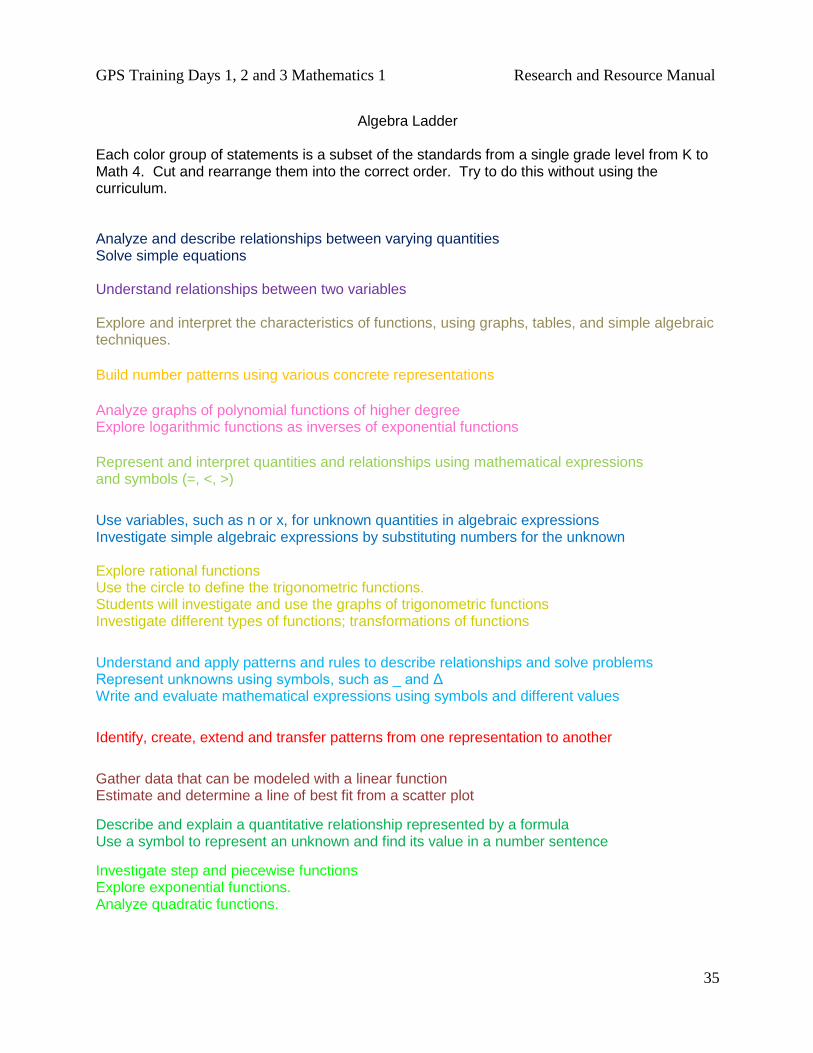
Algebra Ladder
Each color group of statements is a subset of the standards from a single grade level from K to Math 4. Cut and rearrange them into the correct order. Try to do this without using the curriculum. Analyze and describe relationships between varying quantities Solve simple equations Understand relationships between two variables Explore and interpret the characteristics of functions, using graphs, tables, and simple algebraic techniques.
Build number patterns using various concrete representations
Analyze graphs of polynomial functions of higher degree Explore logarithmic functions as inverses of exponential functions
Represent and interpret quantities and relationships using mathematical expressions and symbols (=, <, >)
Use variables, such as n or x, for unknown quantities in algebraic expressions Investigate simple algebraic expressions by substituting numbers for the unknown Explore rational functions Use the circle to define the trigonometric functions. Students will investigate and use the graphs of trigonometric functions Investigate different types of functions; transformations of functions
Understand and apply patterns and rules to describe relationships and solve problems Represent unknowns using symbols, such as _ and Δ Write and evaluate mathematical expressions using symbols and different values
Identify, create, extend and transfer patterns from one representation to another
Gather data that can be modeled with a linear function Estimate and determine a line of best fit from a scatter plot
Describe and explain a quantitative relationship represented by a formula Use a symbol to represent an unknown and find its value in a number sentence
Investigate step and piecewise functions Explore exponential functions. Analyze quadratic functions.
GPS Training Days 1, 2 and 3 Mathematics 1 Research and Resource Manual
36
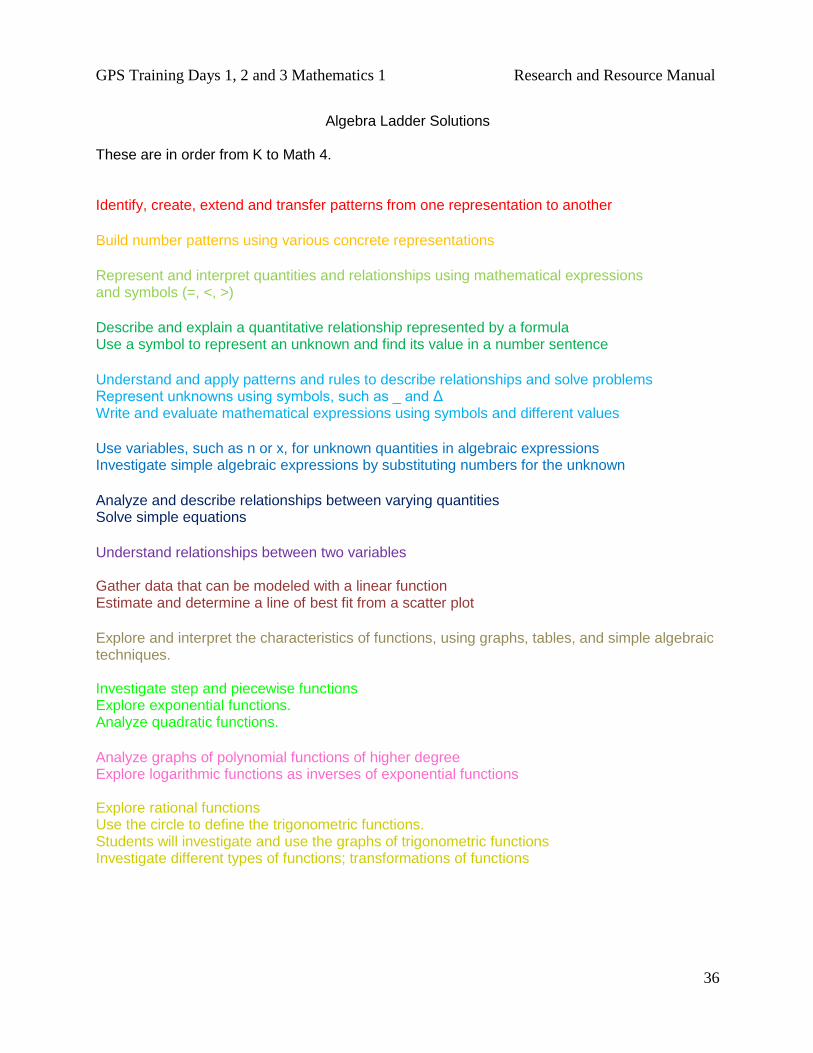
Algebra Ladder Solutions
These are in order from K to Math 4. Identify, create, extend and transfer patterns from one representation to another
Build number patterns using various concrete representations
Represent and interpret quantities and relationships using mathematical expressions and symbols (=, <, >)
Describe and explain a quantitative relationship represented by a formula Use a symbol to represent an unknown and find its value in a number sentence
Understand and apply patterns and rules to describe relationships and solve problems Represent unknowns using symbols, such as _ and Δ Write and evaluate mathematical expressions using symbols and different values
Use variables, such as n or x, for unknown quantities in algebraic expressions Investigate simple algebraic expressions by substituting numbers for the unknown
Analyze and describe relationships between varying quantities Solve simple equations
Understand relationships between two variables Gather data that can be modeled with a linear function Estimate and determine a line of best fit from a scatter plot
Explore and interpret the characteristics of functions, using graphs, tables, and simple algebraic techniques. Investigate step and piecewise functions Explore exponential functions. Analyze quadratic functions.
Analyze graphs of polynomial functions of higher degree Explore logarithmic functions as inverses of exponential functions Explore rational functions Use the circle to define the trigonometric functions. Students will investigate and use the graphs of trigonometric functions Investigate different types of functions; transformations of functions
GPS Training Days 1, 2 and 3 Mathematics 1 Research and Resource Manual
37
Function Learning Task (Function Notation)
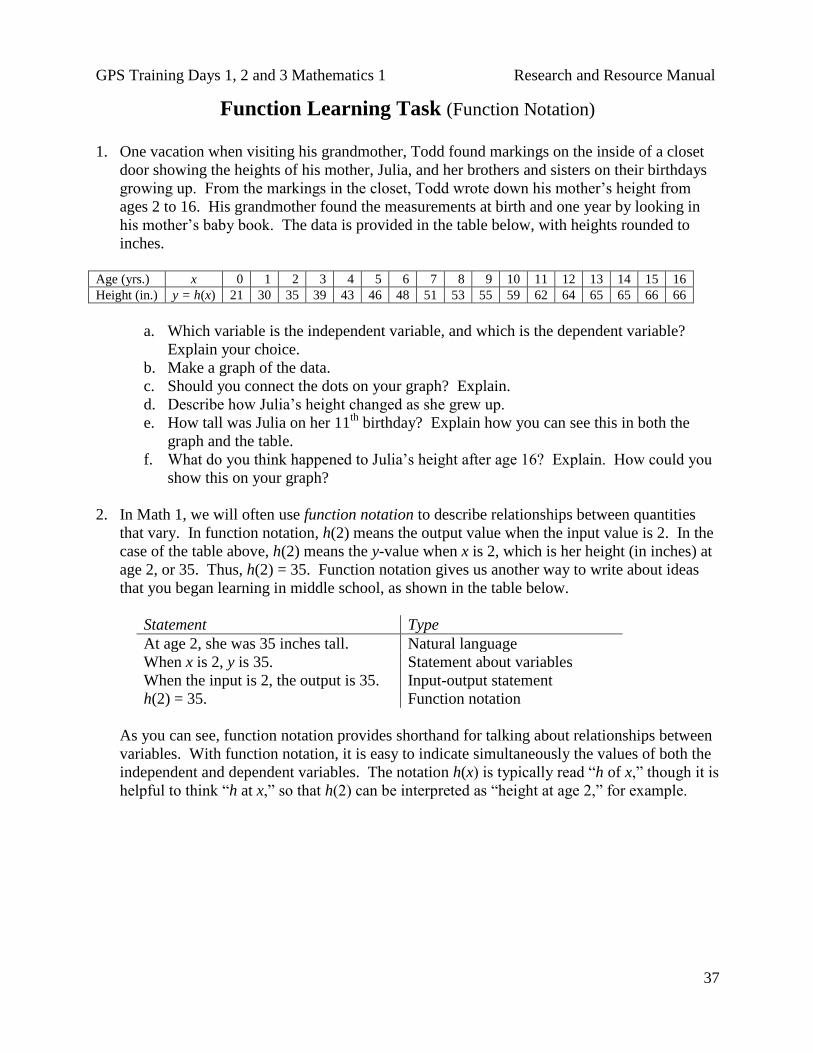
1. One vacation when visiting his grandmother, Todd found markings on the inside of a closet
door showing the heights of his mother, Julia, and her brothers and sisters on their birthdays
growing up. From the markings in the closet, Todd wrote down his mother’s height from
ages 2 to 16. His grandmother found the measurements at birth and one year by looking in
his mother’s baby book. The data is provided in the table below, with heights rounded to
inches.
Age (yrs.) x 0 1 2 3 4 5 6 7 8 9 10 11 12 13 14 15 16
Height (in.) y = h(x) 21 30 35 39 43 46 48 51 53 55 59 62 64 65 65 66 66
a. Which variable is the independent variable, and which is the dependent variable?
Explain your choice.
b. Make a graph of the data.
c. Should you connect the dots on your graph? Explain.
d. Describe how Julia’s height changed as she grew up.
e. How tall was Julia on her 11th
birthday? Explain how you can see this in both the
graph and the table.
f. What do you think happened to Julia’s height after age 16? Explain. How could you
show this on your graph?
2. In Math 1, we will often use function notation to describe relationships between quantities
that vary. In function notation, h(2) means the output value when the input value is 2. In the
case of the table above, h(2) means the y-value when x is 2, which is her height (in inches) at
age 2, or 35. Thus, h(2) = 35. Function notation gives us another way to write about ideas
that you began learning in middle school, as shown in the table below.
Statement Type
At age 2, she was 35 inches tall. Natural language
When x is 2, y is 35. Statement about variables
When the input is 2, the output is 35. Input-output statement
h(2) = 35. Function notation
As you can see, function notation provides shorthand for talking about relationships between
variables. With function notation, it is easy to indicate simultaneously the values of both the
independent and dependent variables. The notation h(x) is typically read ―h of x,‖ though it is
helpful to think ―h at x,‖ so that h(2) can be interpreted as ―height at age 2,‖ for example.
GPS Training Days 1, 2 and 3 Mathematics 1 Research and Resource Manual
38
Note: Function notation looks like an instruction to multiply, but the meaning is very
different. To avoid misinterpretation, be sure you know which letters represent functions.
For example, if g represents a function, then g(4) is not multiplication but rather the value of
―g at 4,‖ i.e., the output value of the function g when the input is value is 4.
a. What is h(11)? What does this mean?
b. When x is 3, what is y? Express this fact using function notation.
c. Find an x so that h(x) = 53. Explain your method. What does your answer mean?
d. From your graph or your table, estimate h(6.5). Explain your method. What does
your answer mean?
e. Estimate an x so that h(x) = 60. Explain your method. What does your answer mean?
f. Describe what happens to h(x) as x increases from 0 to 16.
g. What can you say about h(x) for x greater than 16?
h. Describe the similarities and differences you see between these questions and the
questions in the previous problem.
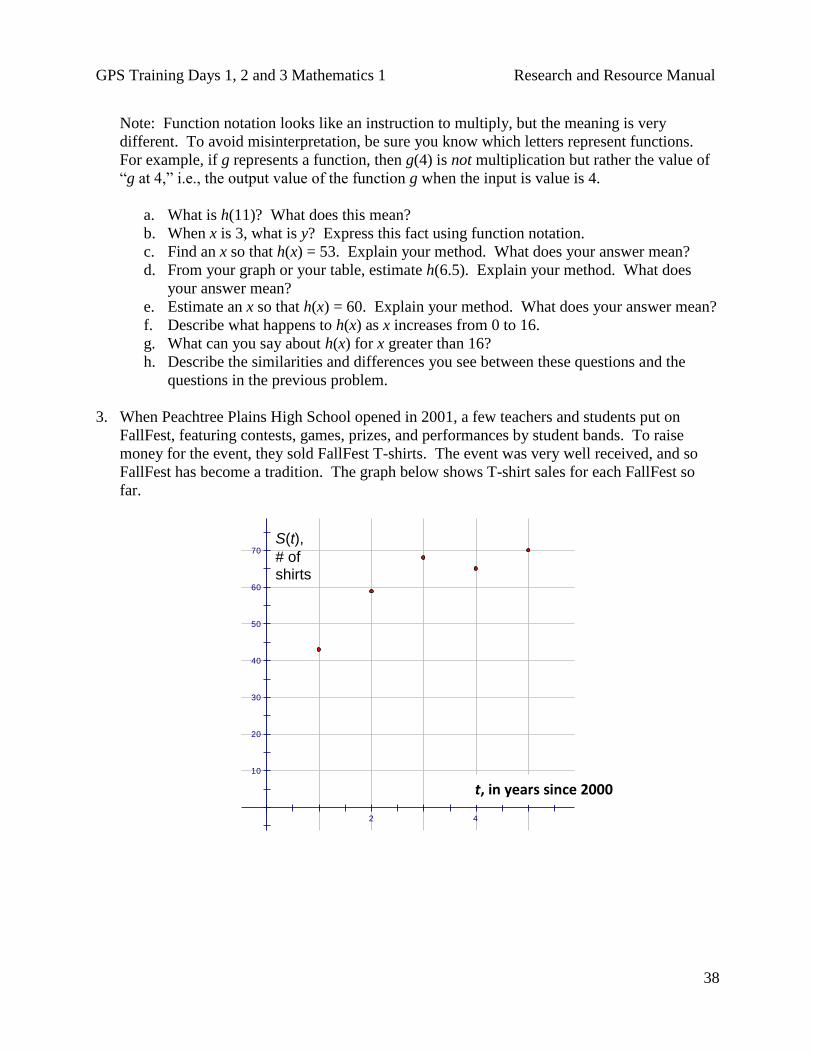
3. When Peachtree Plains High School opened in 2001, a few teachers and students put on
FallFest, featuring contests, games, prizes, and performances by student bands. To raise
money for the event, they sold FallFest T-shirts. The event was very well received, and so
FallFest has become a tradition. The graph below shows T-shirt sales for each FallFest so
far.
70
60
50
40
30
20
10
2 4
S(t),
# ofshirts
t, in years
t, in years since 2000
GPS Training Days 1, 2 and 3 Mathematics 1 Research and Resource Manual
39
a. What are the independent and dependent variables shown in the graph?
b. For which years does the graph provide data?
c. Does it make sense to connect the dots in the graph? Explain.
d. What were the T-shirt sales in 2001? Use function notation to express your result.
e. Find S(3), if possible, and explain what it means or would mean.
f. Find S(6), if possible, and explain what it means or would mean.
g. Find S(2.4), if possible, and explain what it means or would mean.
h. If possible, find a t such that S(t) = 65. Explain.
i. If possible, find a t such that S(t) = 62. Explain.
j. Describe what happens to S(t) as t increases, beginning at t = 1.
k. What can you say about S(t) for values of t greater than 6?
Note: As you have seen above, functions can be described by tables and by graphs. In high
school mathematics, functions are often given by formulas, but it is important to remember that
not all functions can be described by formulas.
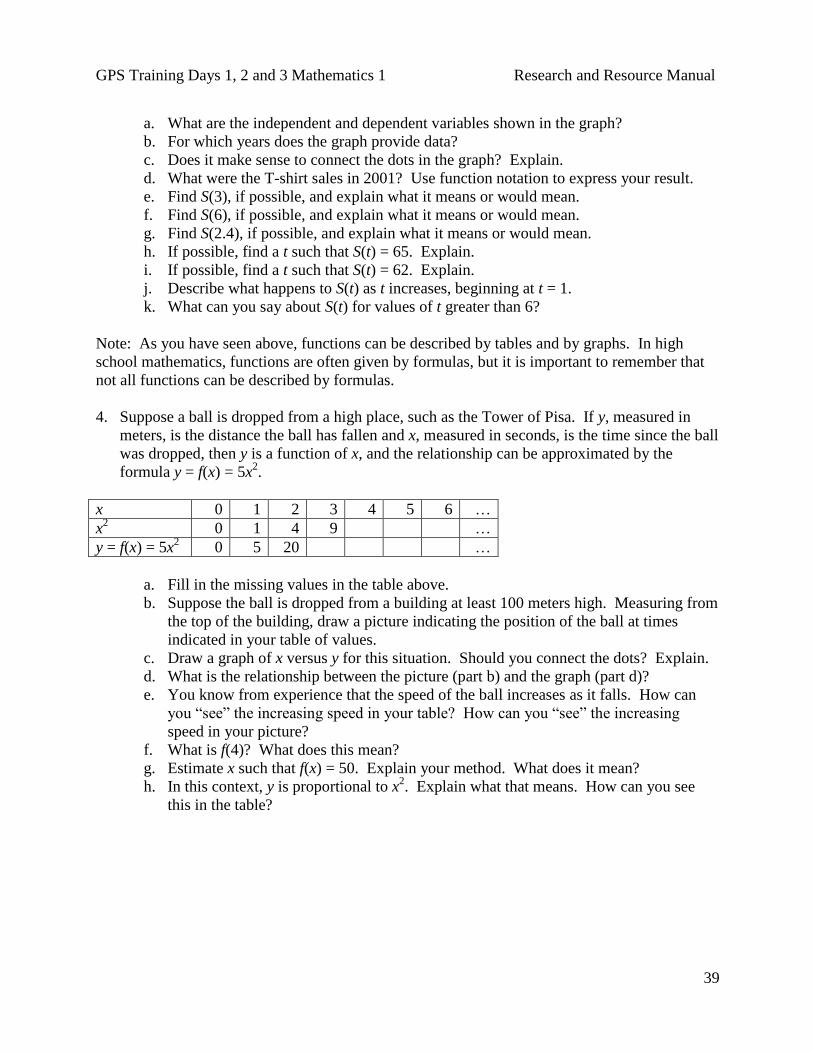
4. Suppose a ball is dropped from a high place, such as the Tower of Pisa. If y, measured in
meters, is the distance the ball has fallen and x, measured in seconds, is the time since the ball
was dropped, then y is a function of x, and the relationship can be approximated by the
formula y = f(x) = 5x2.
x 0 1 2 3 4 5 6 …
x2 0 1 4 9 …
y = f(x) = 5x2 0 5 20 …
a. Fill in the missing values in the table above.
b. Suppose the ball is dropped from a building at least 100 meters high. Measuring from
the top of the building, draw a picture indicating the position of the ball at times
indicated in your table of values.
c. Draw a graph of x versus y for this situation. Should you connect the dots? Explain.
d. What is the relationship between the picture (part b) and the graph (part d)?
e. You know from experience that the speed of the ball increases as it falls. How can
you ―see‖ the increasing speed in your table? How can you ―see‖ the increasing
speed in your picture?
f. What is f(4)? What does this mean?
g. Estimate x such that f(x) = 50. Explain your method. What does it mean?
h. In this context, y is proportional to x2. Explain what that means. How can you see
this in the table?
GPS Training Days 1, 2 and 3 Mathematics 1 Research and Resource Manual
40
5. Towanda is paid $7 per hour in her part-time job at the local Dairy Stop. Let t be the amount
time that she works, in hours, during the week, and let P(t) be her gross pay (before taxes), in
dollars, for the week.
a. Make a table showing how her gross pay depends upon the amount of time she works
during the week.
b. Make a graph illustrating how her gross pay depends upon the amount of time that she
works. Should you connect the dots? Explain.
c. Write a formula showing how her gross pay depends upon the amount of time that she
works.
d. What is P(9)? What does it mean? Explain how you can use the graph, the table, and
the formula to compute P(9).
e. If Towanda works 11 hours and 15 minutes, what will her gross pay be? Show how
you know. Express the result using function notation.
f. If Towanda works 4 hours and 50 minutes, what will her gross pay be? Show how
you know. Express the result using function notation.
g. One week Towanda’s gross pay was $42. How many hours did she work? Show how
you know.
h. Another week Towanda’s gross pay was $57.19. How many hours did she work?
Show how you know.
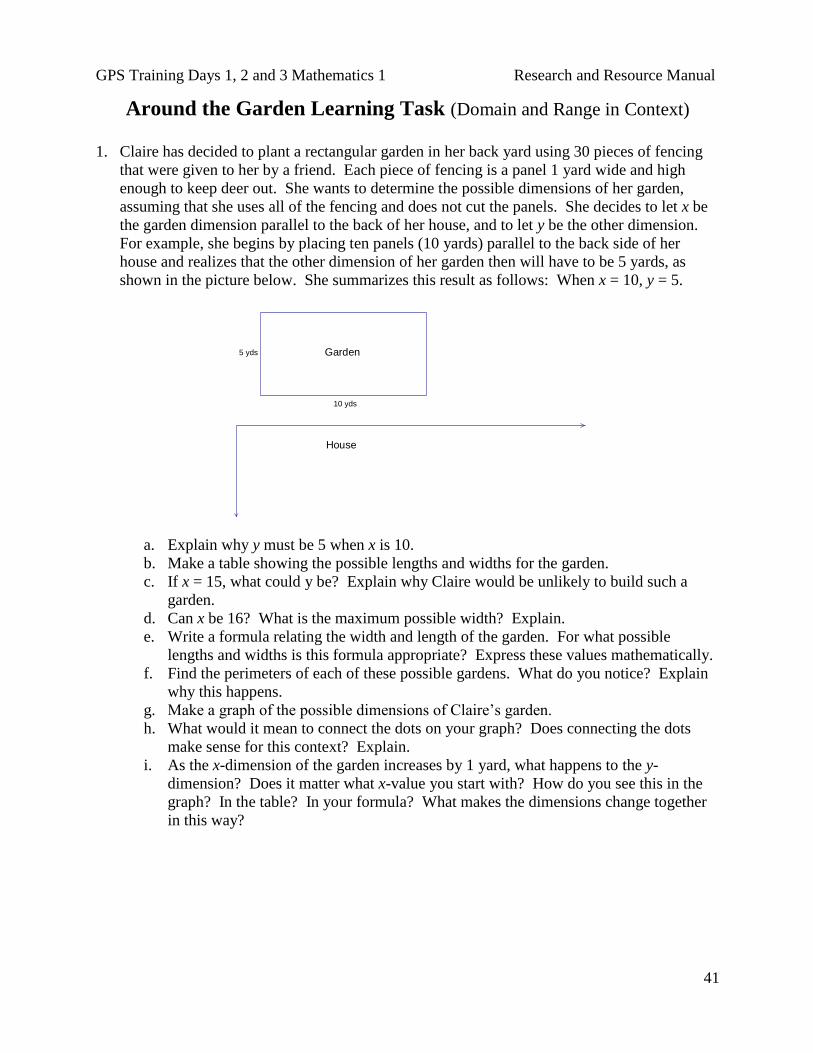
GPS Training Days 1, 2 and 3 Mathematics 1 Research and Resource Manual
41
Around the Garden Learning Task (Domain and Range in Context)
1. Claire has decided to plant a rectangular garden in her back yard using 30 pieces of fencing
that were given to her by a friend. Each piece of fencing is a panel 1 yard wide and high
enough to keep deer out. She wants to determine the possible dimensions of her garden,
assuming that she uses all of the fencing and does not cut the panels. She decides to let x be
the garden dimension parallel to the back of her house, and to let y be the other dimension.
For example, she begins by placing ten panels (10 yards) parallel to the back side of her
house and realizes that the other dimension of her garden then will have to be 5 yards, as
shown in the picture below. She summarizes this result as follows: When x = 10, y = 5.
10 yds
5 yds Garden
House
a. Explain why y must be 5 when x is 10.
b. Make a table showing the possible lengths and widths for the garden.
c. If x = 15, what could y be? Explain why Claire would be unlikely to build such a
garden.
d. Can x be 16? What is the maximum possible width? Explain.
e. Write a formula relating the width and length of the garden. For what possible
lengths and widths is this formula appropriate? Express these values mathematically.
f. Find the perimeters of each of these possible gardens. What do you notice? Explain
why this happens.
g. Make a graph of the possible dimensions of Claire’s garden.
h. What would it mean to connect the dots on your graph? Does connecting the dots
make sense for this context? Explain.
i. As the x-dimension of the garden increases by 1 yard, what happens to the y-
dimension? Does it matter what x-value you start with? How do you see this in the
graph? In the table? In your formula? What makes the dimensions change together
in this way?
GPS Training Days 1, 2 and 3 Mathematics 1 Research and Resource Manual
42
2. After listing the possible rectangular dimensions of the garden, Claire realizes that she needs
to pay attention to the area of the garden, because that is what determines how many plants
she will be able to grow.
a. Will the area of the garden change as the x-dimension changes? Make a prediction,
and explain your thinking.
b. Make a table showing all the possible x-dimensions for the garden and the
corresponding areas. (To facilitate your calculations, you might want to include the y-
dimensions in your table.)
c. Make a graph showing the relationship between the x-dimension and the area of the
garden. Should you connect the dots? Explain.
d. Write a formula showing how to compute the area of the garden, given its x-
dimension.
3. Because the area of Claire’s garden depends upon the x-dimension, we can say that the area is
a function of the x-dimension. Each x-dimension is an input value for the area function, and
the resulting area is the corresponding output value. The set of all possible input values for a
function is called the domain of the function. The set of all possible output values is called
the range of the function.
a. What is the domain of the area function for this context?
b. How is the question about domain related to the question about connecting the dots on
the graph?
c. What is the maximum area of the garden, and what are its dimensions? How do you
see this in your table? In your graph?
d. What is the minimum area of the garden, and what are its dimensions? How do you
see this in your table? In your graph?
e. What is the range of the area function for this context? How can you see the range in
your table? In your graph?
f. Claire’s neighbor Javier noticed that the graph is symmetric. Describe the symmetry,
specifically indicating the line of symmetry. What about the context causes this
symmetry?
g. As the x-dimension of the garden increases by 1 yard, what happens to the area?
Does it matter what x-dimension you start with? How do you see this in the graph?
In the table? Explain what you notice.
GPS Training Days 1, 2 and 3 Mathematics 1 Research and Resource Manual
43
4. Later that summer, Claire’s sister-in-law Kenya mentions that she wants to use 30 yards of
chain-link fence to build a pen for her pet rabbits. Claire experiences déjà vu and shares the
solution to her garden problem but then she realizes that Kenya’s problem is slightly
different.
a. In this case, Claire and Kenya agree that the x-dimension does not have to be a whole
number. Explain.
b. Despite the fact that the rabbit pen would not be useful with an x-dimension of 0, it is
often valuable, mathematically, to include such ―limiting cases,‖ when possible. Why
would a rabbit pen with an x-dimension of 0 be called a limiting case in this situation?
Why would the shape of the garden be called a ―degenerate rectangle‖?
c. Are there other limiting cases to consider in this situation? Explain.
d. Make a table for the area versus the x-dimension of Kenya’s garden. Be sure to
include some non-whole-number x-dimensions.
e. Make a graph of the area versus the x-dimension of Kenya’s garden. (Note, if the
limiting case is not included, the point is plotted in the graph as a small ―open circle.‖
If the limiting case is included the point is plotted in the graph as a small ―closed
circle.‖)
f. Write a formula showing how to compute the area of the rabbit pen, given its x-
dimension.
5. Kenya uses the table, graph, and formula to answer questions about the possibilities for her
rabbit pen.
a. Estimate the area of a rabbit pen of with an x-dimension of 10 feet (not yards).
Explain your reasoning.
b. Estimate the x-dimension of a rectangle with an area of 30 square yards. Explain your
reasoning.
c. What is the domain of the function relating the area of the rabbit pen to its x-
dimension. How do you see the domain in the graph?
d. What is the area and what are the dimensions of the pen with maximum area?
Explain. And what do you notice about the shape of the pen?
e. What is the range of the area function for the rabbit pen? How can you see the range
in the graph?
f. As the x-dimension of Kenya’s garden increases, sometimes the area increases and
sometimes the area decreases. For what x-values does the area increase as x
increases? For what x-values does the area decrease as x increases? [Note to
teachers: Do not use interval notation.]
When using tables and formulas we often look at a function a point or two at a time, but in high
school mathematics, it is important to begin to think about ―the whole function,‖ which is to say
all of the input-output pairs. A graph of a function is very useful for considering questions about
―whole functions,‖ but keep in mind that a graph might not show all possible input-output pairs.
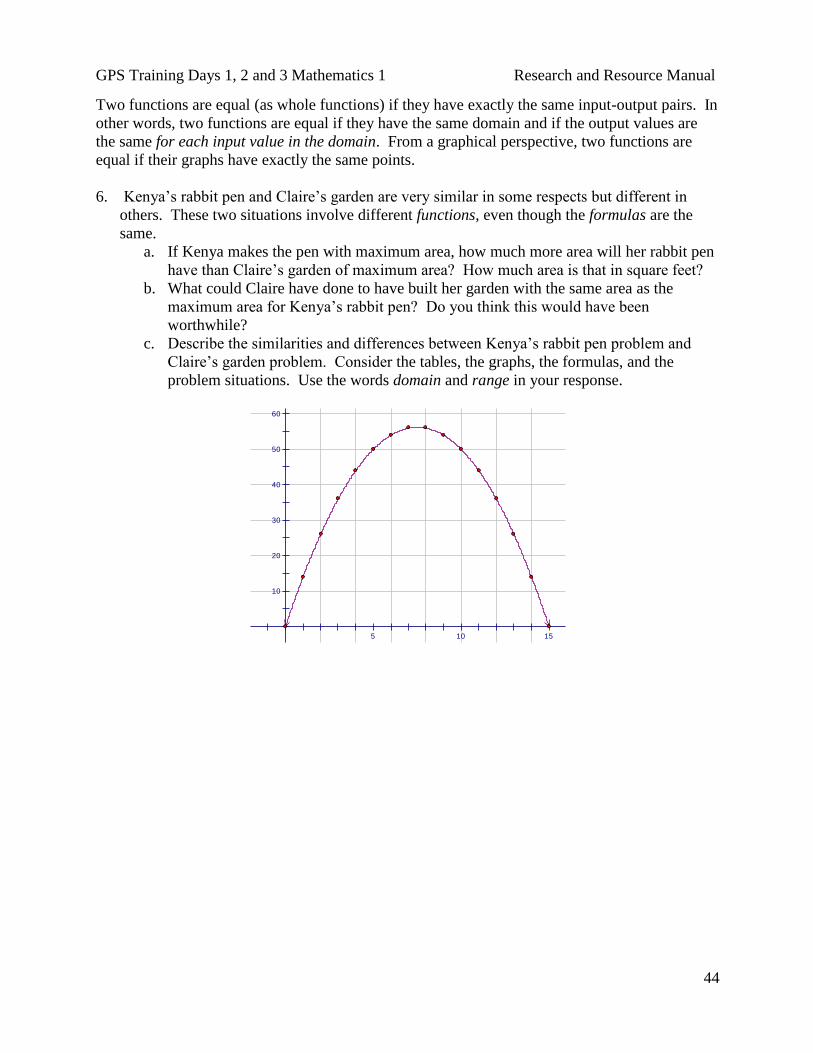
GPS Training Days 1, 2 and 3 Mathematics 1 Research and Resource Manual
44
Two functions are equal (as whole functions) if they have exactly the same input-output pairs. In
other words, two functions are equal if they have the same domain and if the output values are
the same for each input value in the domain. From a graphical perspective, two functions are
equal if their graphs have exactly the same points.
6. Kenya’s rabbit pen and Claire’s garden are very similar in some respects but different in
others. These two situations involve different functions, even though the formulas are the
same.
a. If Kenya makes the pen with maximum area, how much more area will her rabbit pen
have than Claire’s garden of maximum area? How much area is that in square feet?
b. What could Claire have done to have built her garden with the same area as the
maximum area for Kenya’s rabbit pen? Do you think this would have been
worthwhile?
c. Describe the similarities and differences between Kenya’s rabbit pen problem and
Claire’s garden problem. Consider the tables, the graphs, the formulas, and the
problem situations. Use the words domain and range in your response.
60
50
40
30
20
10
y
5 10 15
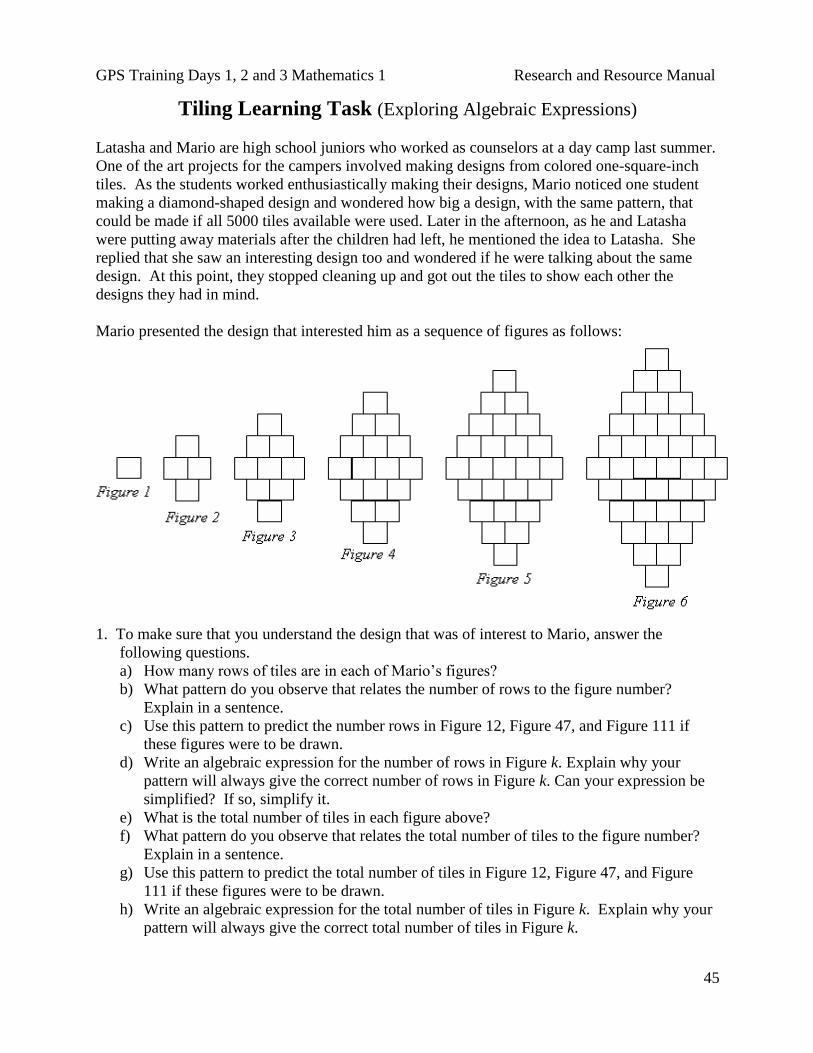
GPS Training Days 1, 2 and 3 Mathematics 1 Research and Resource Manual
45
Tiling Learning Task (Exploring Algebraic Expressions) Latasha and Mario are high school juniors who worked as counselors at a day camp last summer.
One of the art projects for the campers involved making designs from colored one-square-inch
tiles. As the students worked enthusiastically making their designs, Mario noticed one student
making a diamond-shaped design and wondered how big a design, with the same pattern, that
could be made if all 5000 tiles available were used. Later in the afternoon, as he and Latasha
were putting away materials after the children had left, he mentioned the idea to Latasha. She
replied that she saw an interesting design too and wondered if he were talking about the same
design. At this point, they stopped cleaning up and got out the tiles to show each other the
designs they had in mind.
Mario presented the design that interested him as a sequence of figures as follows:
1. To make sure that you understand the design that was of interest to Mario, answer the
following questions.
a) How many rows of tiles are in each of Mario’s figures?
b) What pattern do you observe that relates the number of rows to the figure number?
Explain in a sentence.
c) Use this pattern to predict the number rows in Figure 12, Figure 47, and Figure 111 if
these figures were to be drawn.
d) Write an algebraic expression for the number of rows in Figure k. Explain why your
pattern will always give the correct number of rows in Figure k. Can your expression be
simplified? If so, simplify it.
e) What is the total number of tiles in each figure above?
f) What pattern do you observe that relates the total number of tiles to the figure number?
Explain in a sentence.
g) Use this pattern to predict the total number of tiles in Figure 12, Figure 47, and Figure
111 if these figures were to be drawn.
h) Write an algebraic expression for the total number of tiles in Figure k. Explain why your
pattern will always give the correct total number of tiles in Figure k.
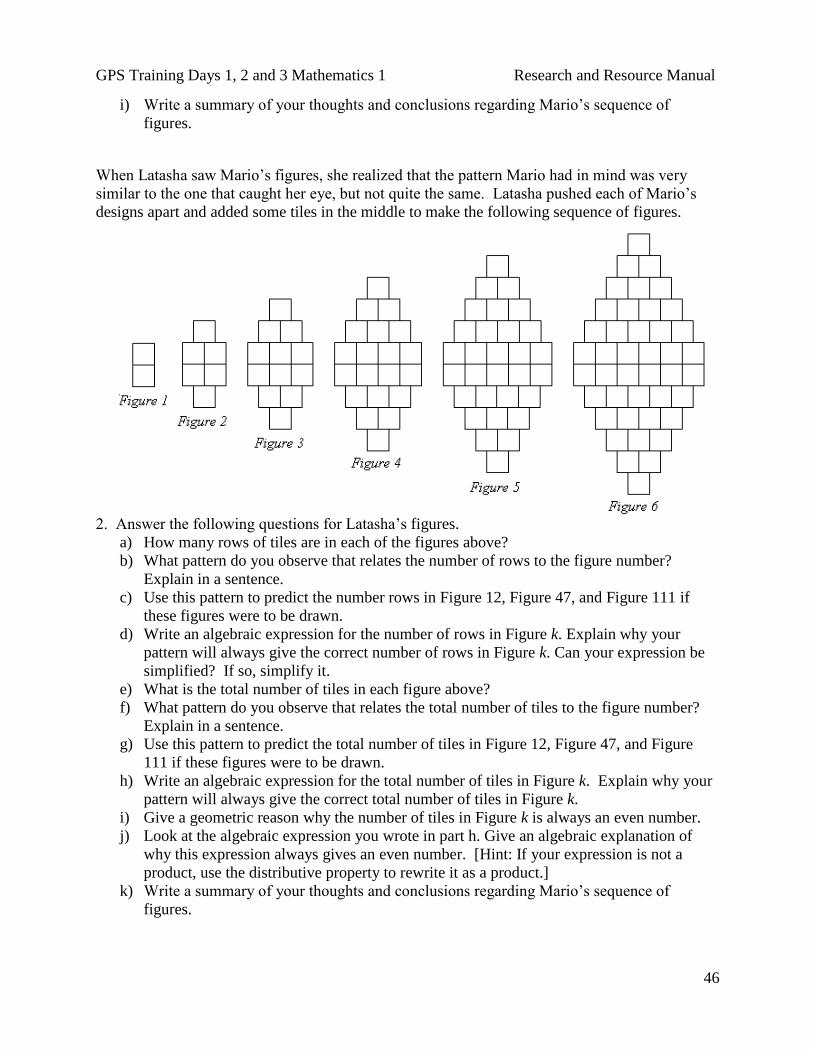
GPS Training Days 1, 2 and 3 Mathematics 1 Research and Resource Manual
46
i) Write a summary of your thoughts and conclusions regarding Mario’s sequence of
figures.
When Latasha saw Mario’s figures, she realized that the pattern Mario had in mind was very
similar to the one that caught her eye, but not quite the same. Latasha pushed each of Mario’s
designs apart and added some tiles in the middle to make the following sequence of figures.
2. Answer the following questions for Latasha’s figures.
a) How many rows of tiles are in each of the figures above?
b) What pattern do you observe that relates the number of rows to the figure number?
Explain in a sentence.
c) Use this pattern to predict the number rows in Figure 12, Figure 47, and Figure 111 if
these figures were to be drawn.
d) Write an algebraic expression for the number of rows in Figure k. Explain why your
pattern will always give the correct number of rows in Figure k. Can your expression be
simplified? If so, simplify it.
e) What is the total number of tiles in each figure above?
f) What pattern do you observe that relates the total number of tiles to the figure number?
Explain in a sentence.
g) Use this pattern to predict the total number of tiles in Figure 12, Figure 47, and Figure
111 if these figures were to be drawn.
h) Write an algebraic expression for the total number of tiles in Figure k. Explain why your
pattern will always give the correct total number of tiles in Figure k.
i) Give a geometric reason why the number of tiles in Figure k is always an even number.
j) Look at the algebraic expression you wrote in part h. Give an algebraic explanation of
why this expression always gives an even number. [Hint: If your expression is not a
product, use the distributive property to rewrite it as a product.]
k) Write a summary of your thoughts and conclusions regarding Mario’s sequence of
figures.
GPS Training Days 1, 2 and 3 Mathematics 1 Research and Resource Manual
47
3. Mario started the discussion with Latasha wondering whether he could make a version of the
diamond pattern that interested him that would use all 5000 tiles that they had in the art
supplies. What do you think? Explain your thoughts. If you can use all 5000 tiles, how
many rows will the design have? If a similar design cannot be made, what is the largest
design that can be made with the 5000 tiles, that is, how many rows will this design have and
how many tiles will be used? Explain your thoughts.
4. What is the largest design in the pattern Latasha liked that can be made with no more than
5000 tiles? How many rows does it have? Does it use all 5000 tiles? Justify your answers.
5. Let M1, M2, M3, M4, and so forth represent the sequence of numbers that give the total
number of tiles in Mario’s sequence of figures.
Let L1, L2, L3, L4 and so forth represent the sequence of numbers that give the total number of
tiles in Latasha’s sequence of figures.
Write an equation that expresses each of the following:
a) the relationship between L1 and M1 b) the relationship between L2 and M2
c) the relationship between L3 and M3 d) the relationship between L4 and M4
e) the general relationship between Lk and Mk, where k can represent any positive
integer.
Just Jogging Learning Task (Rational Expressions)
GPS Training Days 1, 2 and 3 Mathematics 1 Research and Resource Manual
48
For distances of 12 miles or less, a certain jogger can maintain an average speed of 6 miles per
hour while running on level ground.
1. If this jogger runs around a level track at an average speed of 6 mph, how long in hours will
the jogger take to run each of the following distances? [Express your answers as fractions of
an hour in simplest form, the decimal equivalent of that fraction, and the equivalent number
of minutes.] (a) 3 miles (b) 9 miles (c) 1 mile (d) 1
2mile (e)
1
10mile
2. Analyze your work in Question 1. Each answer can be found by using the number of miles, a
single operation, and the number 6. What operation should be used? Write an algebraic
expression for the time it takes in hours for this jogger to run x miles on level ground at an
average speed of 6 miles per hour.
3. Each day this jogger warms up with stretching exercises for 15 minutes, jogs for a while, and
then cools down for 15 minutes. How long would this exercise routine take, in hours, if the
jogger ran for 5 miles? [Express your answer as a fraction in simplest form.]
4. Let T represent the total time in hours it takes for this workout routine when the jogger runs
for x miles. Write a formula for calculating T given x, where, as in Question 2, x is number
of miles the jogger runs. Express the formula for T as a single algebraic fraction.
5. If the jogger skipped the warm-up and cool-down period and used this additional time to jog,
how many more miles would be covered? Does this answer have any connection to the
answer to question 4 above?
Suppose this same jogger decides to go to a local park and use one of the paths there for the
workout routine one day each week. This path is a gently sloping one that winds its way to the
top of a hill.
6. If the jogger can run at an average speed of 5.5 miles per hour up the slope and 6.5 miles per
hour going down the slope, how long, in hours, will it take for the jogger to cover 2 miles by
going uphill for 1 mile and then returning 1 mile back down the hill? Give an exact answer
expressed as a fraction in simplest terms and then give a decimal approximation correct to
three decimal places.
7. If the jogger can run at an average speed of 5.3 miles per hour up the slope and 6.7 miles per
hour going down the slope, how long, in hours, will it take for the jogger to cover 2 miles by
going uphill for 1 mile and then returning 1 mile back down the hill? Give an exact answer
expressed as a fraction in simplest terms and then give a decimal approximation correct to
three decimal places.
8. Write an algebraic expression for the total time, in hours, that it takes the jogger to cover 2
miles by going uphill for 1 mile and then returning 1 mile back down the hill if the jogger
GPS Training Days 1, 2 and 3 Mathematics 1 Research and Resource Manual
49
runs uphill at an average speed that is c miles per hour slower than the level-ground speed of
6 miles per hour and runs downhill at an average speed that is c miles per hour faster than the
level-ground speed of 6 miles per hour. Simplify your answer to a single algebraic fraction.
Verify that your expression gives the correct answers for Questions 6 and 7.
9. The average speed in miles per hour is defined to be the distance in miles divided by the time
in hours spent covering the distance.
(a) What is the jogger’s average speed for a two mile trip on level ground?
(b) What is the jogger’s average speed for the two mile trip in question 6?
(c) What is the jogger’s average speed for the two mile trip in question 7?
(d) Write an expression for the jogger’s average speed over the two-mile trip (one mile up
and one mile down) when the average speed uphill is c miles per hour slower than the
level-ground speed of 6 miles per hour and the average speed downhill at an average
speed that is c miles per hour faster than the level-ground speed of 6 miles per hour.
Express your answer as a simplified algebraic fraction.
(e) Use the expression in part (d) to recalculate your answers for parts (b) and (c)? What
value of c should you use in each part?
10. For what value of c would the jogger’s average speed for the two-mile trip (one mile up and
one mile down) be 4.5 miles per hour? For this value of c, what would be the jogger’s
average rate uphill and downhill?
Spinner Learning Task 1 (Equally Like Outcomes)
GPS Training Days 1, 2 and 3 Mathematics 1 Research and Resource Manual
50
Using only a compass and straight edge, construct a circle divided into 8 equal sectors.
Label each sector with a dollar amount in increments of $100, beginning with $100. Label the
sectors in any order you choose.
Now, place the clear plastic spinner over your circle to create your own personalized spinner.
Do you think that your homemade spinner is as fair as a store bought spinner? How can you tell?
If your spinner is fair and you made a dotplot for a specific number of spins, what do you think
the dotplot should look like?
Spin your spinner at least 50 times and record the outcomes on your paper. Make a dotplot of
your results.
Look at your dotplot. Is the shape consistent with the shape of a dotplot that would have been
produced from spinning a fair spinner? Justify your answer.
Based on the shape of your dotplot, do you think 50 spins are enough to determine whether or not
your spinner is fair? Explain your reasoning.
Use appropriate technology like the TI-83 Plus Probability Simulation or the National Library
of Virtual Manipulatives at nlvm.usu.edu/en/nav/vlibrary.html to generate a dotplot for an
increasingly greater number of spins on your spinner. At what number of spins is the shape of
your dotplot consistent with the shape of a dot plot produced using a fair spinner? Why?
Work under the assumption that your spinner is fair. Answer the following questions for your
spinner and explain your reasoning for each.
1) What is the probability of obtaining $800 on the first spin?
2) What is the probability of obtaining $400 on the first spin?
3) Is it just as likely to land on $100 as it is on $800?
4) What is the probability of obtaining at least $500 on the first spin?
5) What is the probability of obtaining less than $200 on the first spin?
6) What is the probability of obtaining at most $500 on the first spin?
7) If you spin the spinner twice, what is the probability that you will have a sum of $200?
8) If you spin the spinner twice, what is the probability that you will have a sum of at most
$400?
9) If you spin the spinner twice, what is the probability that you will have a sum of at least
$1500?

GPS Training Days 1, 2 and 3 Mathematics 1 Research and Resource Manual
51
10) If you spin the spinner twice, what is the probability that you will have a sum of at least
300?
11) Given that you landed on $100 on the first spin, what is the probability that the sum of
your two spins will be $200?
12) Given that you landed on $800 on the first spin, what is the probability that the sum of
your two spins will be at least $1000?
13) Write a summary of your thoughts and conclusions regarding spinner 1.
Spinner Learning Task 2 (Not Equally Likely Outcomes)
GPS Training Days 1, 2 and 3 Mathematics 1 Research and Resource Manual
52
Using a compass, protractor and straight edge, draw a circle with 8 sectors. Your sectors should
meet the following requirements:
You should have two sets of four congruent sectors.
The sectors in one set should be twice as large as the sectors in the other.
How can you be sure that your circle meets these requirements? Explain your thinking.
Label each sector with a dollar amount in increments of $100 beginning with $100 and ending
with $800. Place $200, $300, $400 and $800 in the larger sectors.
Now, place your clear plastic spinner over your circle to create your own personalized spinner.
Explain how this spinner is different from spinner 1.
Do you think that your homemade spinner is fair? How can you tell? Is the interpretation of fair
the same for spinner 1 and spinner 2? What should a dotplot for spinner 2 look like? How is it
different from the dotplot for spinner 1?
Spin your spinner at least 50 times and record the outcomes on your paper. Make a dotplot of
your results. Compare your dotplot to what you predicted. Discuss any differences.
Use appropriate technology like the TI-83 Plus Probability Simulation or the National Library
of Virtual Manipulatives at nlvm.usu.edu/en/nav/vlibrary.html to generate a dotplot for an
increasingly greater number of spins on your spinner. At what number of spins is the shape of
your dotplot consistent with the shape of a dot plot produced using a spinner designed
according to the specifications given above? Why?
Based on this spinner, answer the following questions and justify your thinking.
1) What is the probability of obtaining $800 on the first spin?
2) What is the probability of obtaining $500 on the first spin?
3) Is it just as likely to land on $100 as it is on $800?
4) What is the probability of obtaining at least $500 on the first spin?
5) What is the probability of obtaining less than $200 on the first spin?
6) What is the probability of obtaining at most $500 on the first spin?
7) If you spin the spinner twice, what is the probability that you will have a sum of $200?
8) If you spin the spinner twice, what is the probability that you will have a sum of at most
$400?
9) If you spin the spinner twice, what is the probability that you will have a sum of at least
$1500?
GPS Training Days 1, 2 and 3 Mathematics 1 Research and Resource Manual
53
10) Given that you landed on $100 on the first spin, what is the probability that the sum of
your two spins will be $200?
11) Given that you landed on $800 on the first spin, what is the probability that the sum of
your two spins will be at least $1500?
12) Write a summary of your thoughts and conclusions regarding spinner 2.

GPS Training Days 1, 2 and 3 Mathematics 1 Research and Resource Manual
54
Reprinted with permission from MATHEMATICS TEACHING IN THE MIDDLE SCHOOL
Copyright@ 2000 The National Council of Teachers of Mathematics, Inc. All rights reserved.
STEVEN C. REINHART
.478 MATHEMATICS TEACHING IN THE MIDDLE SCHOOL Copyright@ 2000 The National Council of Teachers of Mathematics, Inc. www.nctm.org. All rights reserved. This material may not be copied or distributed electronically or in any other, format without written permission from NCTM.
AFTER EXTENSIVE PLANNING, I PRESENTED
what should have been a masterpiece lesson. I worked
several examples on the overhead projector, answered
every student's question in great detail, and explained
the concept so clearly that surely my students
understood. The next day, however, it became
obvious that the students were totally confused. In my
early years of teaching, this situation happened all too
often. Even though observations by my principal
clearly pointed out that I was very good at explaining
mathematics to my students, knew my subject matter
well, and really seemed to be a dedicated and caring
teacher, something was wrong. My students were
capable of learning much more than they displayed.
Implementing Change over time THE LOW LEVELS OF ACHIEVEMENT ~ of many
students caused me to question ~ how I was teaching,
and my search for a ~ better approach began. Making
a commitment to change 10 percent of my if teaching
each year, I began to collect and use materials and
ideas gathered from supplements, workshops,
professional journals, and university classes. Each
year, my goal was simply to teach a single topic in a
better way than I had the year before.
STEVE REINHART, [email protected], teaches
mathematics at Chippewa Falls Middle School, ChiPpewa Falls,
WI 54729. He is interested in the teaching of algebraic thinking at
the middle school level and in the professional development of
teachers.
Before long, I noticed that the familiar teacher-
centered, direct-instruction model often did not fit
well with the more in-depth problems and tasks that I
was using. The information that I had gathered also
suggested teaching in nontraditional ways. It was not
enough to teach better mathematics; I also had to
teach mathematics better. Making changes in
instruction proved difficult because I had to learn to
teach in ways that I had never observed or
experienced, challenging many of the old teaching
paradigms. As I moved from traditional methods of
instruction to a more student-centered, problem-based
approach, many of my students enjoyed my classes
more. They really seemed to like working together,
discussing and sharing their ideas and solutions to the
interesting, often contextual, problems that I posed.
The small changes that I implemented each year
began to show results. In five years, I had almost
completely changed both what and how I was
teaching.
The Fundamental Flaw AT SOME POINT DURING THIS METAMORPHOSIS, I
concluded that a fundamental flaw existed in my
teaching methods. When I was in front of the class
demonstrating and explaining, I was learning a great
deal, but many of my students were not! Eventually, I
concluded that if my students were to ever really learn
mathematics, they would have to do the explaining,
and I, the listening. My definition of a good teacher
has since changed from "one who explains things so
well that students understand" to "one who gets
students to explain things so well that they can be
understood."
Getting middle school students to explain their
thinking and become actively involved in classroom
discussions can be a challenge. By nature, these
GPS Training Days 1, 2 and 3 Mathematics 1 Research and Resource Manual
55
students are self-conscious and insecure. This inse-
curity and the effects of negative peer pressure tend
to discourage involvement. To get beyond these and
other roadblocks, I have learned to ask the best
possible questions and to apply strategies that require
all students to participate. Adopting the goals and
implementing the strategies and questioning
techniques that follow have helped me develop and
improve my questioning skills. At the same time,
these goals and strategies help me create a classroom
atmosphere in which students are actively engaged in
learning mathematics and feel comfortable in sharing
and discussing ideas, asking questions, and taking
risks.
Questioning Strategies That Work for Me
ALTHOUGH GOOD TEACHERS PLAN
DETAILED lessons that focus on the mathematical
content, few take the time to plan to use specific
questioning techniques on a regular basis. Improving
questioning skills is difficult and takes time, practice,
and planning. Strategies that work once will work
again and again. Making a list of good ideas and
strategies that work, revisiting the list regularly, and
planning to practice selected techniques in daily
lessons will make a difference.
Create a plan.
The following is a list of reminders that I have
accumulated from the many outstanding teachers
with whom I have worked over several years. I revisit
this list often. None of these ideas is new, and I can
claim none, except the first one, as my own.
Although implementing any single suggestion from
this list may not result in major change, used
together, these suggestions can help transform a
classroom. Attempting to change too much too fast
may result in frustration and failure. Changing a little
at a time by selecting, practicing, and refining one or
two strategies or skills before moving on to others
can result in continual, incremental growth.
Implementing one or two techniques at a time also
makes it easier for students to accept and adjust to the
new expectations and standards being established.
1. Never say anything a kid can say! This one goal
keeps me focused. Although I do not think that I have
ever met this goal completely in anyone day or even
in a given class period, it has forced me to develop
and improve my questioning skills. It also sends a
message to students that their participation is
essential. Every time I am tempted to tell students
something, I try to ask a question instead.
2. Ask good questions. Good questions require more
than recalling a fact or reproducing a skill. By asking
good questions, I encourage students to think about, and
reflect on, the mathematics they are learning. A student
should be able to learn from answering my question, and
I should be able to learn something about what the
student knows or does not know from her or his re-
sponse. Quite simply, I ask good questions to get
students to think and to inform me about what they
know. The best questions are open ended, those for
which more than one way to solve the problem or more
than one acceptable response may be possible.
3. Use more process questions than product questions.
Product questions-those that require short answers or a
yes or no response or those that rely almost completely
on memory-provide little information about what a
student knows. To find out what a student understands, I
ask process questions that require the student to reflect,
analyze, and explain his or her thinking and reasoning.
Process questions require students to think at much
higher levels.
4. Replace lectures with sets of questions. When
tempted to present information in the form of a lecture, I
remind myself of this definition of a lecture: 'The transfer
of information from the notes of the lecturer to the notes
of the student without passing through the minds of
either." If I am still tempted, I ask myself the humbling
question ―What percent of my students will actually be
listening to me?‖
5. Be patient. Wait time is very important. Although
some students always seem to have their hands raised
immediately, most need more time to process their
thoughts. If I always call on one of the first students who
volunteers, I am cheating those who need more time to
think about, and process a response to, my question.
Even very capable students can begin to doubt their
abilities, and many eventually stop thinking about my
questions altogether. Increasing wait time to five seconds
or longer can result in more and better responses.
Good discussions take time; at first, I was un-
comfortable in taking so much time to discuss a single
question or problem. The urge to simply tell my students
and move on for the sake of expedience was
considerable. Eventually, I began to see the value in what
I now refer to as a "less is more" philosophy. I now
believe that all students learn more when I pose a high-
quality problem and give them the necessary time to
investigate, process their thoughts, and reflect on and
defend their findings.
VOL. 5, NO.8' APRIL 2000 479
GPS Training Days 1, 2 and 3 Mathematics 1 Research and Resource Manual
56
Share with students reasons for asking
questions. Students should understand that all their
statements are valuable to me, even if they are
incorrect or show misconceptions. I explain that I ask
them questions because I am continuously evaluating
what the class knows or does not know. Their
comments help me make decisions and. plan the next
activities.
Teach for success. If students are to value my
questions and be involved in discussions, I cannot use
questions to embarrass or punish. Such questions
accomplish little and can make it more difficult to
create an atmosphere in which students feel
comfortable sharing ideas and taking risks. If a
student is struggling to respond, I move on to another
student quickly. As I listen to student conversations
and observe their work, I also identify those who
have good ideas or comments to share. Asking a shy,
quiet student a question when I know that he or she
has a good response is a great strategy for building
confidence and self-esteem. Frequently, I alert the
student ahead of time: 'That's a great idea. I'd really
like you to share that with the class in a few
minutes."
Be nonjudgmental about a response or
comment. This goal is indispensable in encouraging
discourse. Imagine being in a classroom where the
teacher makes this comment: ''WOW! Brittni, that
was a terrific, insightful response! Who's next?" Not
many middle school students have the confidence to
follow a response that has been praised so highly by a
teacher. If a student's response reveals a miscon-
ception and the teacher replies in a negative way, the
student may be discouraged from volunteering again.
Instead, encourage more discussion and move on to
the next comment. Often, students disagree with one
another, discover their own errors, and correct their
thinking. Allowing students to listen to fellow
classmates is a far more positive way to deal with
misconceptions than announcing to the class that an
answer is incorrect. If several students remain
confused, I might say, "I'm hearing that we do not
agree on this issue. Your comments and ideas have
given me an idea for an activity that will help you
clarify your thinking." I then plan to revisit the
concept with another activity as soon as possible.
Try not to repeat students' answers. If students are
to listen to one another and value one another’s input,
I cannot repeat or try to improve on what they say. If
students realize that I will repeat or clarify what
another student says, they no longer have a reason to
listen. I must be patient and let students clarify their
own thinking and encourage them to speak to their
classmates, not just to me.
All students can speak louder - I have heard them in the
halls! Yet I must be careful not to embarrass someone
with a quiet voice. Because students know that I never
accept just one response, they think nothing of my asking
another student to paraphrase the soft-spoken comments
of a classmate.
Is this the right answer?” Students frequently ask
this question. My usual response to this question might
be that ―I’m not sure. Can you explain your thinking to
me?" As soon as I tell a student that the answer is
correct, thinking stops. If students explain their thinking
clearly, I ask a ''What if?" question to encourage them to
extend their thinking.
Participation is not optional! I remind my students
of this expectation regularly. Whether working in small
groups or discussing a problem with the whole class,
each student is expected to contribute his or her fair
share. Because reminding students of this expectation is
not enough, I also regularly apply several of the
following techniques:
1. Use the think-pair-share strategy. Whole-group
discussions are usually improved by using this technique.
When I pose a new problem; present a new project, task,
or activity; or simply ask a question, all students must
think and work independently first. In the past, letting
students begin working together on a task always
allowed a few students to sit back while others took over.
Requiring students to work alone first reduces this
problem by placing the responsibility for learning on
each student. This independent work time may vary from
a few minutes to the entire class period, depending on the
task.
After students have had adequate time to work
independently, they are paired with partners or join small
groups. In these groups, each student is required to report
his or her findings or summarize his or her solution
process. When teams have had the chance to share their
thoughts in small groups, we come together as a class to
share our findings. I do not call for volunteers but simply
ask one student to report on a significant point discussed
in the group. I might say, ''Tanya, will you share with the
class one important discovery your group made?" or
"James, please summarize for us what Adam shared with
you." Students generally feel much more confident in
stating ideas when the responsibility for the response is
being shared with a partner or group. Using the think-
pair-share strategy helps me send the message that
participation is not optional.
A modified version of this strategy also works in
whole-group discussions. If I do not get the responses
that I expect, either in quantity or quality, I give students
a chance to discuss the question in small groups. On the
basis of the difficulty of the question, they may have as
little as fifteen seconds or as long as
480 MATHEMATICS TEACHING IN THE MIDDLE SCHOOL
GPS Training Days 1, 2 and 3 Mathematics 1 Research and Resource Manual
57
several minutes to discuss the question with their
partners. This strategy has helped improve discus-
sions more than any others that I have adopted.
2. If students or groups cannot answer a question
or contribute to the discussion in a positive way, they
must ask a question of the class. I explain that it is all
right to be confused, but students are responsible for
asking questions that might help them understand.
3. Always require students to ask a question when
they need help. When a student says, "I don't get it,"
he or she may really be saying, "Show me an easy
way to do this so I don't have to think." Initially,
getting students to ask a question is a big im-
provement over "I don't get it." Students soon realize
that my standards require them to think about the
problem in enough depth to ask a question.
4. Require several responses to the same question.
Never accept only one response to a question.
Always ask for other comments, additions, clarifica-
tions, solutions, or methods. This request is difficult
for students at first because they have been condi-
tioned to believe that only one answer is correct and
that only one correct way is possible to solve a prob-
lem. I explain that for them to become better thinkers,
they need to investigate the many possible ways of
thinking about a problem. Even if two students use
the same method to solve a problem, they rarely
explain their thinking in exactly the same way.
Multiple explanations help other students understand
and clarify their thinking. One goal is to create a
student-centered classroom in which students are
responsible for the conversation. To accomplish this
goal, I try not to comment after each response. I
simply pause and wait for the next student to offer
comments. If the pause alone does not generate
further discussion, I may ask, "Next?" or ''What do
you think about _____________________________________________'s idea?"
5. No one in a group is finished until everyone in
the group can explain and defend the solution. This
rule forces students to work together, communicate,
and be responsible for the learning of everyone in the
group. The learning of any one person is of little
value unless it can be communicated to others, and
those who would rather work on their own often need
encouragement to develop valuable communication
skills.
6. Use hand signals often. Using hand signals -
thumbs up or thumbs down (a horizontal thumb
means "I'm not sure") - accomplishes two things.
First, by requiring all students to respond with hand
signals, I ensure that all students are on task. Second,
by observing the responses, I can find out how many
students are having difficulty or do not understand.
Watching students' faces as they think about how to
respond is very revealing.
7. Never carry a pencil. If I carry a pencil with me or
pick up a student's pencil, I am tempted to do the work
for the student. Instead, I must take time to ask thought-
provoking questions that will lead to understanding.
8. Avoid answering my own questions. Answering my
own questions only confuses students because it requires
them to guess which questions I really want them to
think about, and I want them to think about all my
questions. I also avoid rhetorical questions.
9. Ask questions of the whole group. As soon as I
direct a question to an individual, I suggest to the rest of
the students that they are no longer required to think.
10. Limit the use of group responses. Group responses
lower the level of concern and allow some students to
hide and not think about my questions.
11. Do not allow students to blurt out answers. A
student's blurted out answer is a signal to the rest of the
class to stop thinking. Students who develop this habit
must realize that they are cheating other students of the
right to think about the question.
Summary LIKE MOST TEACHERS, I ENTERED THE TEACHING
profession because I care about children. It is only
natural for me to want them to be successful, but by
merely telling them answers, doing things for them, or
showing them shortcuts, I relieve students of their
responsibilities and cheat them of the opportunity to
make sense of the mathematics that they are learning. To
help students engage in real learning, I must ask good
questions, allow students to struggle, and place the
responsibility for learning directly on their shoulders. I
am convinced that children learn in more ways than I
know how to teach. By listening to them, I not only give
them the opportunity to develop deep understanding but
also am able to develop true insights into what they
know and how they think.
Making extensive changes in curriculum and instruction
is a challenging process. Much can be learned about how
children think and learn, from recent publications about
learning styles, multiple intelligences, and brain research.
Also, several reform curriculum projects funded by the
National Science Foundation are now available from
publishers. The Connected Mathematics Project,
Mathematics in Context, and Math Scape, to name a few,
artfully address issues of content and pedagogy.
Bibliography Burns, Marilyn. Mathematics: For Middle School. New
Rochelle, N.Y.: Cuisenaire Co. of America, 1989.
Johnson, David R. Every Minute Counts. Palo Alto, Calif.:
Dale Seymour Publications, 1982.
National Council of Teachers of Mathematics (NCTM).
Professional Standards for Teaching Mathematics.
Reston, Va.: NCTM, 1991.
VOL. 5, NO.8. APRIL 2000 481
GPS Training Days 1, 2 and 3 Mathematics 1 Research and Resource Manual
58
The Article: Tips and Strategies for Co-Teaching at the Secondary Level,
Teaching Exceptional Children, Vol. 36, No. 5, pp. 52-58, could not be posted
online at this time.
For access please visit the Council for Exceptional Children Website at:
http://www.cec.sped.org/AM/Template.cfm?Section=Home&TPLID=26&CO
NTENTID=4723&THISPAGE=2&TEMPLATE=/TaggedPage/TaggedPageDi
splay.cfm&TPPID=1173
Please note that in order to download the article electronically you must be a
member of the Council for Exceptional Children which requires a payment of
annual dues.
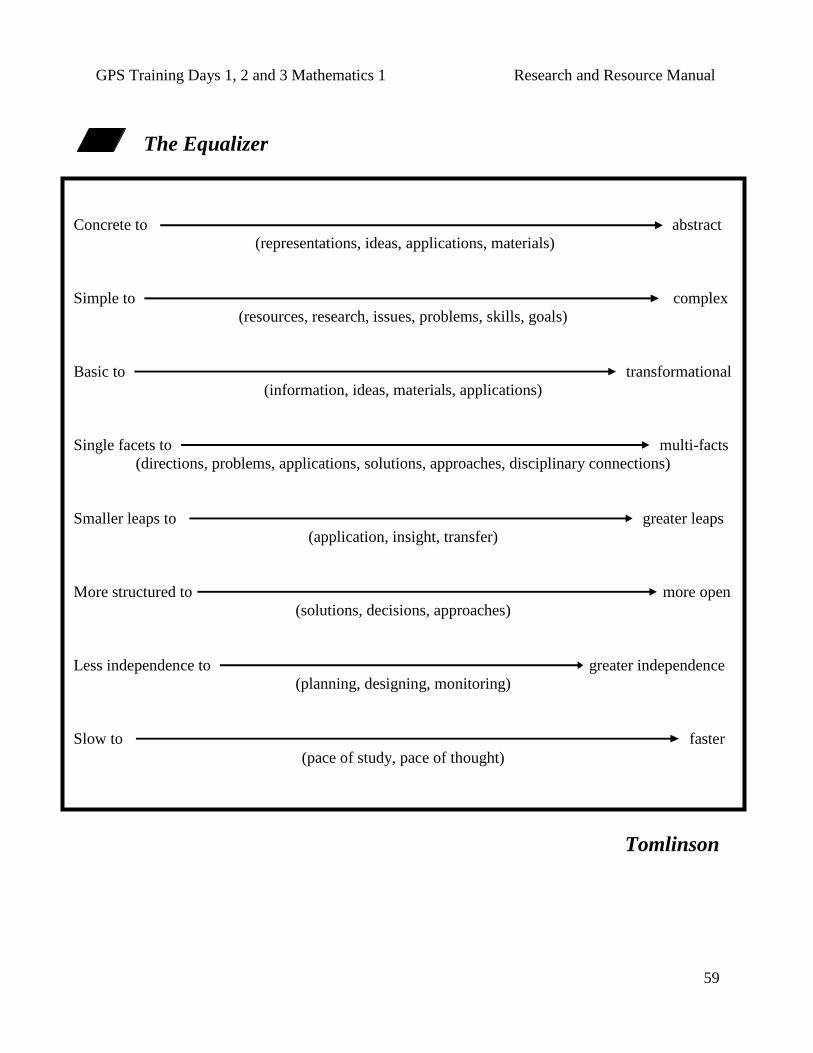
GPS Training Days 1, 2 and 3 Mathematics 1 Research and Resource Manual
59
The Equalizer
Tomlinson
Concrete to abstract
(representations, ideas, applications, materials)
Simple to complex
(resources, research, issues, problems, skills, goals)
Basic to transformational
(information, ideas, materials, applications)
Single facets to multi-facts
(directions, problems, applications, solutions, approaches, disciplinary connections)
Smaller leaps to greater leaps
(application, insight, transfer)
More structured to more open
(solutions, decisions, approaches)
Less independence to greater independence
(planning, designing, monitoring)
Slow to faster
(pace of study, pace of thought)
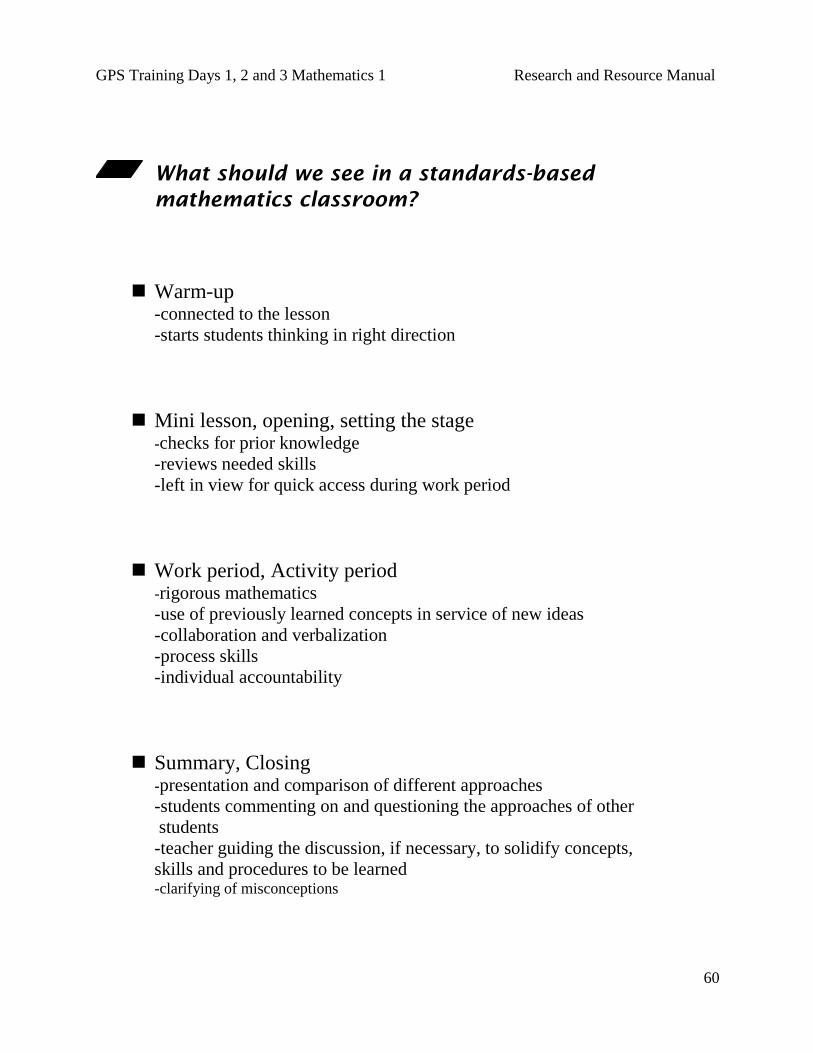
GPS Training Days 1, 2 and 3 Mathematics 1 Research and Resource Manual
60
What should we see in a standards-based
mathematics classroom?
Warm-up -connected to the lesson
-starts students thinking in right direction
Mini lesson, opening, setting the stage -checks for prior knowledge
-reviews needed skills
-left in view for quick access during work period
Work period, Activity period -rigorous mathematics
-use of previously learned concepts in service of new ideas
-collaboration and verbalization
-process skills
-individual accountability
Summary, Closing -presentation and comparison of different approaches
-students commenting on and questioning the approaches of other
students
-teacher guiding the discussion, if necessary, to solidify concepts,
skills and procedures to be learned -clarifying of misconceptions
GPS Training Days 1, 2 and 3 Mathematics 1 Research and Resource Manual
61
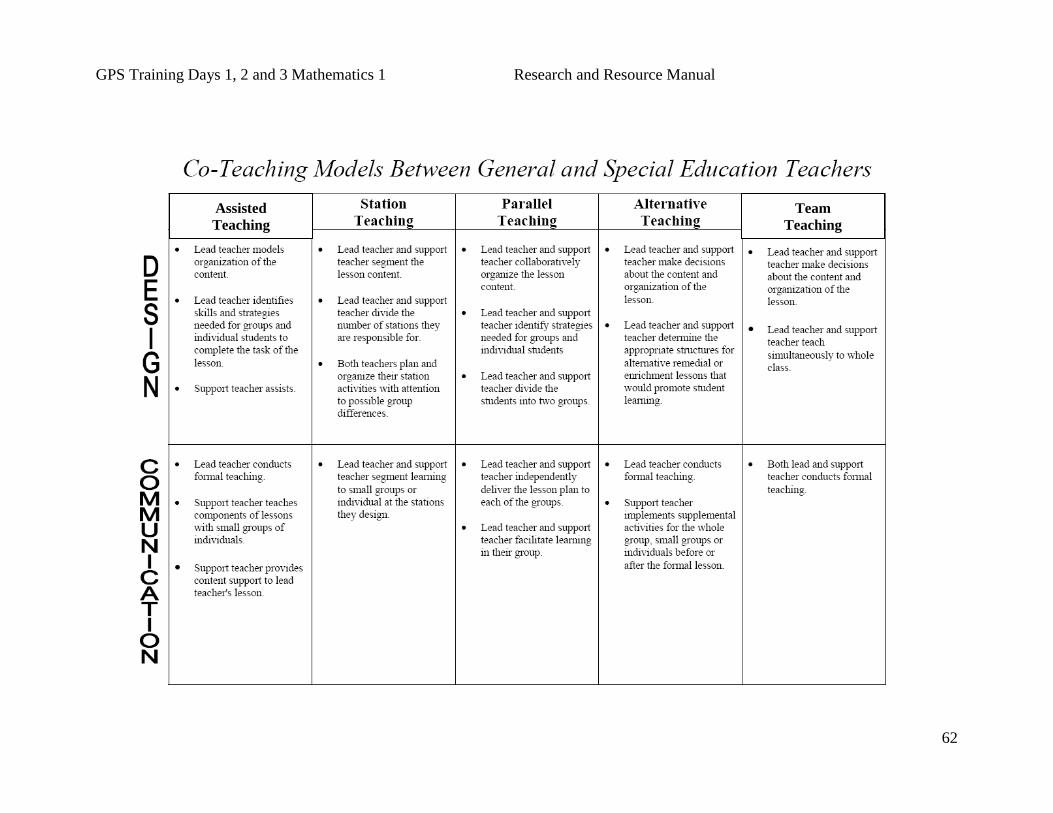
GPS Training Days 1, 2 and 3 Mathematics 1 Research and Resource Manual
62
Team
Teaching
Assisted
Teaching

GPS Training Days 1, 2 and 3 Mathematics 1 Research and Resource Manual
63
Team
Teaching
Assisted
Teaching
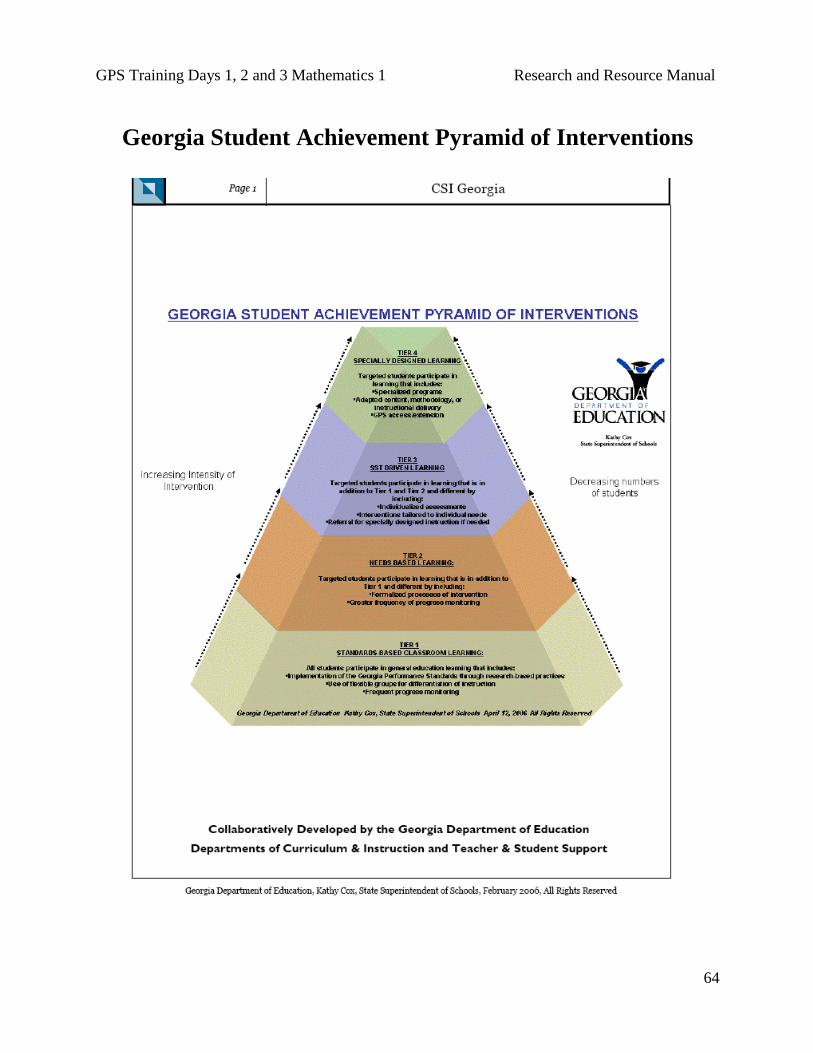
GPS Training Days 1, 2 and 3 Mathematics 1 Research and Resource Manual
64
Georgia Student Achievement Pyramid of Interventions
GPS Training Days 1, 2 and 3 Mathematics 1 Research and Resource Manual
65
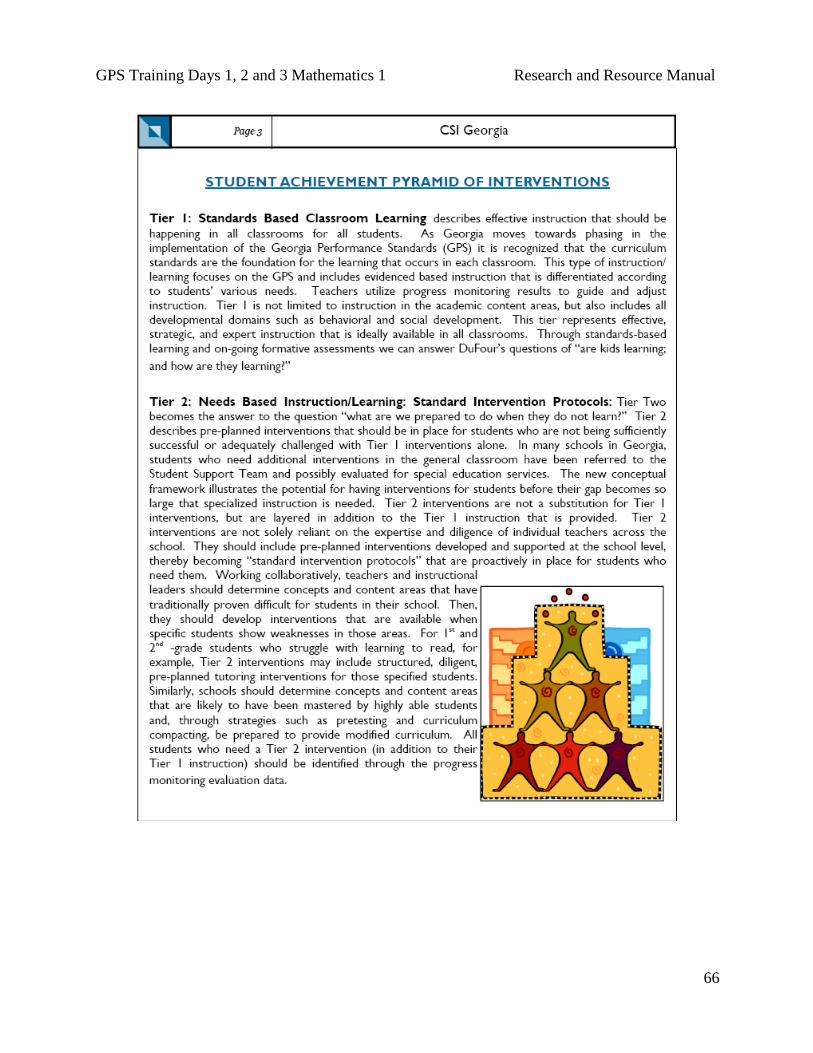
GPS Training Days 1, 2 and 3 Mathematics 1 Research and Resource Manual
66
GPS Training Days 1, 2 and 3 Mathematics 1 Research and Resource Manual
67

GPS Training Days 1, 2 and 3 Mathematics 1 Research and Resource Manual
68
Multiple Representations
Instructional programs from prekindergarten through grade 12 should enable all students to:
create and use representations to organize, record, and communicate mathematical ideas;
select, apply, and translate among mathematical representations to solve problems;
use representations to model and interpret physical, social, and mathematical phenomena.
If mathematics is the "science of patterns" (Steen 1988), representations are the means by which
those patterns are recorded and analyzed. As students become mathematically sophisticated, they
develop an increasingly large repertoire of mathematical representations and the knowledge of
how to use them productively. This knowledge includes choosing specific representations in
order to gain particular insights or achieve particular ends.
In grades 9–12, students' knowledge and use of representations should expand in scope and
complexity. As they study new content, for example, students will encounter many new
representations for mathematical concepts. They will need to be able to convert flexibly among
these representations. Much of the power of mathematics comes from being able to view and
operate on objects from different perspectives.
National Council of Teachers of Mathematics
Principles and Standards for School Mathematics (Representation Standards for Grades 9-12)
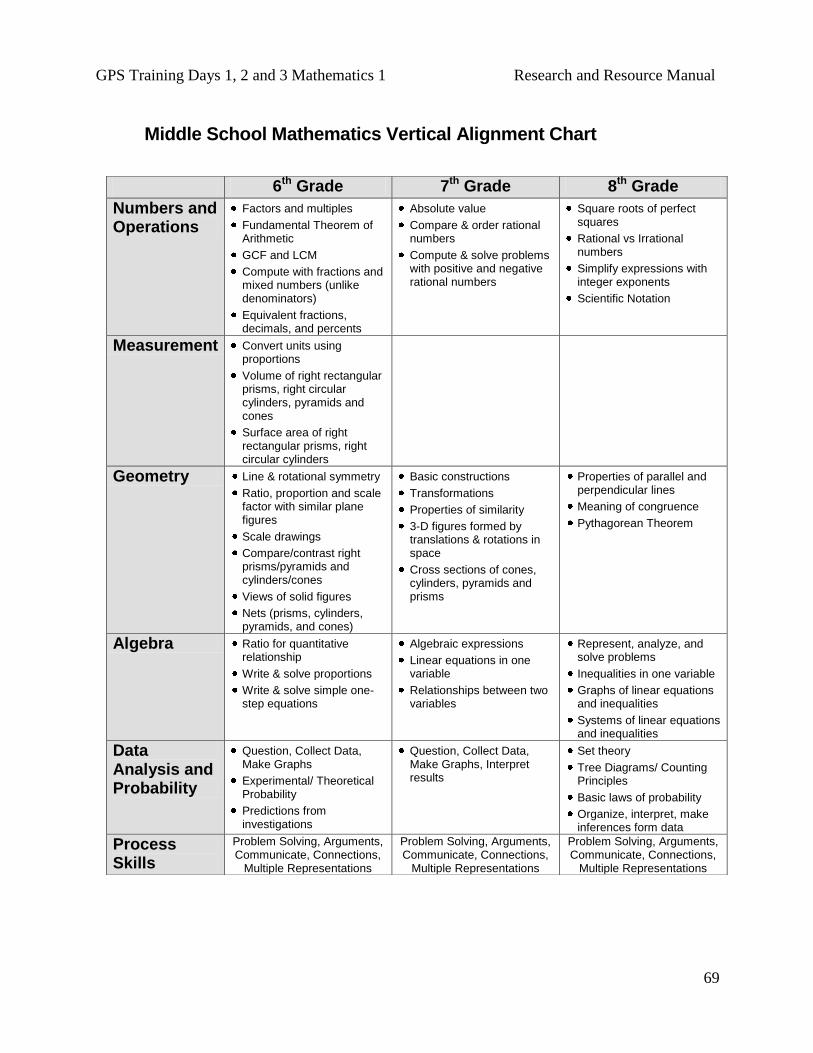
GPS Training Days 1, 2 and 3 Mathematics 1 Research and Resource Manual
69
Middle School Mathematics Vertical Alignment Chart
6th Grade 7th Grade 8th Grade
Numbers and Operations
Factors and multiples
Fundamental Theorem of Arithmetic
GCF and LCM
Compute with fractions and mixed numbers (unlike denominators)
Equivalent fractions, decimals, and percents
Absolute value
Compare & order rational numbers
Compute & solve problems with positive and negative rational numbers
Square roots of perfect squares
Rational vs Irrational numbers
Simplify expressions with integer exponents
Scientific Notation
Measurement Convert units using proportions
Volume of right rectangular prisms, right circular cylinders, pyramids and cones
Surface area of right rectangular prisms, right circular cylinders
Geometry Line & rotational symmetry
Ratio, proportion and scale factor with similar plane figures
Scale drawings
Compare/contrast right prisms/pyramids and cylinders/cones
Views of solid figures
Nets (prisms, cylinders, pyramids, and cones)
Basic constructions
Transformations
Properties of similarity
3-D figures formed by translations & rotations in space
Cross sections of cones, cylinders, pyramids and prisms
Properties of parallel and perpendicular lines
Meaning of congruence
Pythagorean Theorem
Algebra Ratio for quantitative relationship
Write & solve proportions
Write & solve simple one-step equations
Algebraic expressions
Linear equations in one variable
Relationships between two variables
Represent, analyze, and solve problems
Inequalities in one variable
Graphs of linear equations and inequalities
Systems of linear equations and inequalities
Data Analysis and Probability
Question, Collect Data, Make Graphs
Experimental/ Theoretical Probability
Predictions from investigations
Question, Collect Data, Make Graphs, Interpret results
Set theory
Tree Diagrams/ Counting Principles
Basic laws of probability
Organize, interpret, make inferences form data
Process Skills
Problem Solving, Arguments, Communicate, Connections,
Multiple Representations
Problem Solving, Arguments, Communicate, Connections,
Multiple Representations
Problem Solving, Arguments, Communicate, Connections,
Multiple Representations
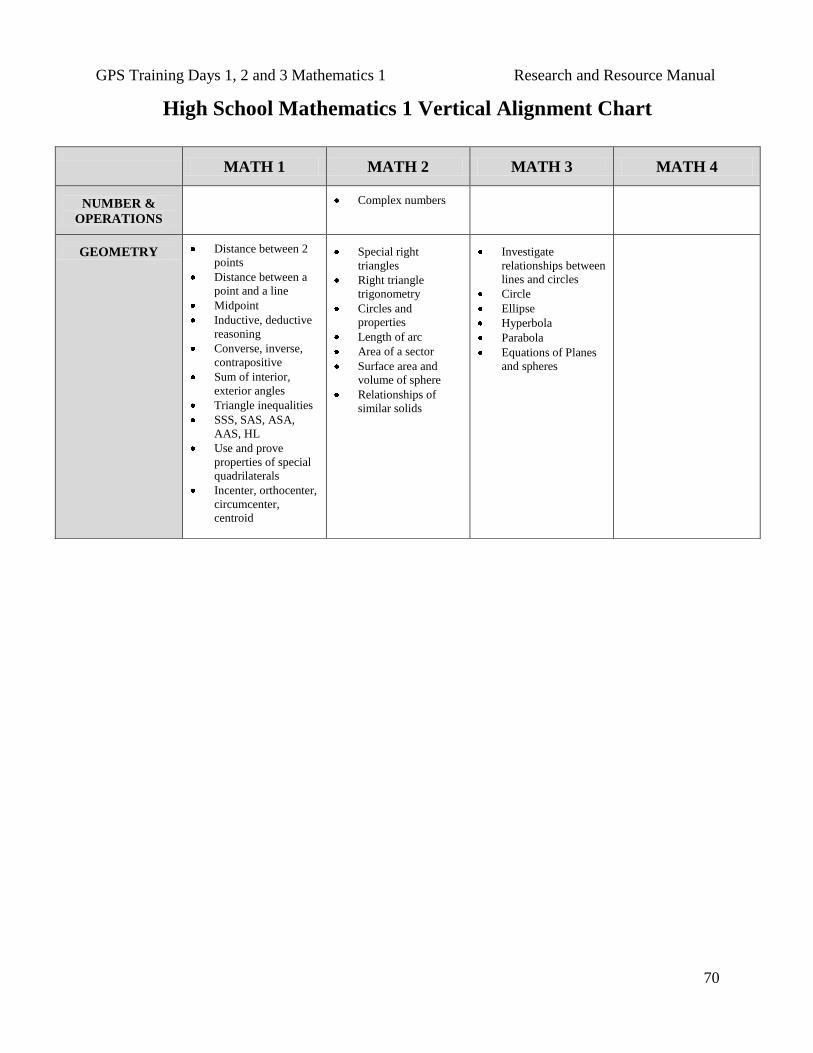
GPS Training Days 1, 2 and 3 Mathematics 1 Research and Resource Manual
70
High School Mathematics 1 Vertical Alignment Chart
MATH 1 MATH 2 MATH 3 MATH 4
NUMBER &
OPERATIONS
Complex numbers
GEOMETRY
Distance between 2
points
Distance between a
point and a line
Midpoint
Inductive, deductive
reasoning
Converse, inverse,
contrapositive
Sum of interior,
exterior angles
Triangle inequalities
SSS, SAS, ASA,
AAS, HL
Use and prove
properties of special
quadrilaterals
Incenter, orthocenter,
circumcenter,
centroid
Special right
triangles
Right triangle
trigonometry
Circles and
properties
Length of arc
Area of a sector
Surface area and
volume of sphere
Relationships of
similar solids
Investigate
relationships between
lines and circles
Circle
Ellipse
Hyperbola
Parabola
Equations of Planes
and spheres
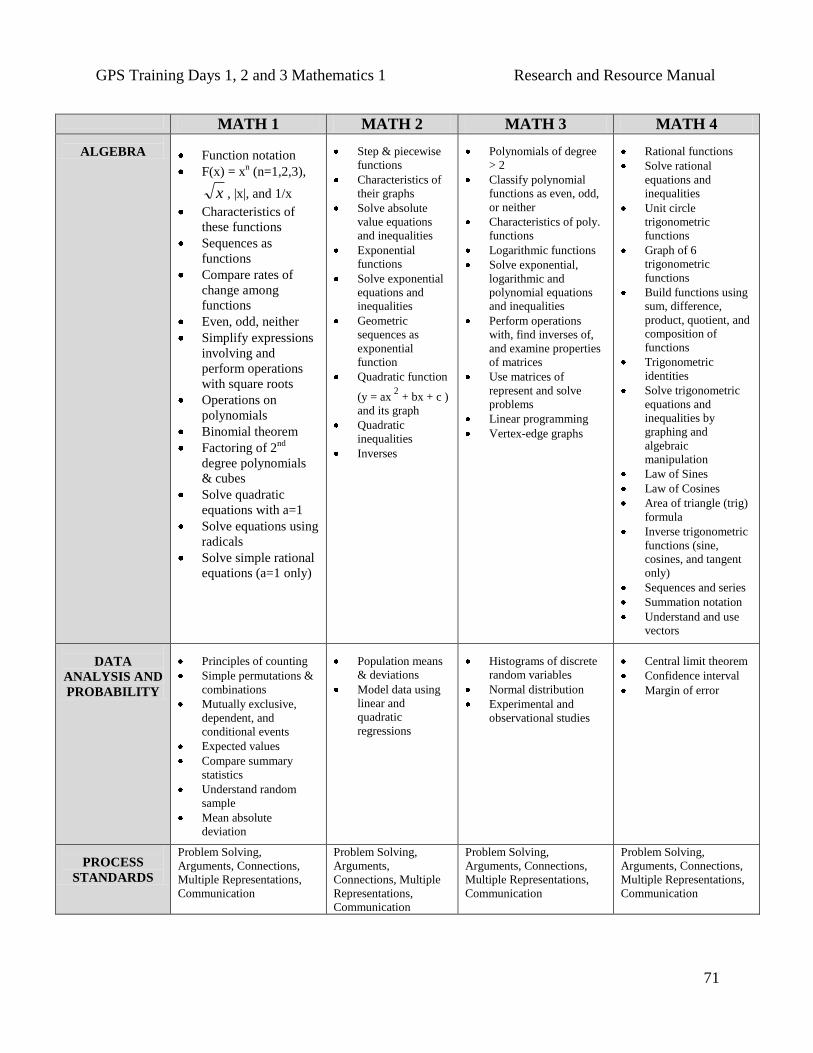
GPS Training Days 1, 2 and 3 Mathematics 1 Research and Resource Manual
71
MATH 1 MATH 2 MATH 3 MATH 4
ALGEBRA
Function notation
F(x) = xn (n=1,2,3),
x , |x|, and 1/x
Characteristics of
these functions
Sequences as
functions
Compare rates of
change among
functions
Even, odd, neither
Simplify expressions
involving and
perform operations
with square roots
Operations on
polynomials
Binomial theorem
Factoring of 2nd
degree polynomials
& cubes
Solve quadratic
equations with a=1
Solve equations using
radicals
Solve simple rational
equations (a=1 only)
Step & piecewise
functions
Characteristics of
their graphs
Solve absolute
value equations
and inequalities
Exponential
functions
Solve exponential
equations and
inequalities
Geometric
sequences as
exponential
function
Quadratic function
(y = ax2
+ bx + c )
and its graph
Quadratic
inequalities
Inverses
Polynomials of degree
> 2
Classify polynomial
functions as even, odd,
or neither
Characteristics of poly.
functions
Logarithmic functions
Solve exponential,
logarithmic and
polynomial equations
and inequalities
Perform operations
with, find inverses of,
and examine properties
of matrices
Use matrices of
represent and solve
problems
Linear programming
Vertex-edge graphs
Rational functions
Solve rational
equations and
inequalities
Unit circle
trigonometric
functions
Graph of 6
trigonometric
functions
Build functions using
sum, difference,
product, quotient, and
composition of
functions
Trigonometric
identities
Solve trigonometric
equations and
inequalities by
graphing and
algebraic
manipulation
Law of Sines
Law of Cosines
Area of triangle (trig)
formula
Inverse trigonometric
functions (sine,
cosines, and tangent
only)
Sequences and series
Summation notation
Understand and use
vectors
DATA
ANALYSIS AND
PROBABILITY
Principles of counting
Simple permutations &
combinations
Mutually exclusive,
dependent, and
conditional events
Expected values
Compare summary
statistics
Understand random
sample
Mean absolute
deviation
Population means
& deviations
Model data using
linear and
quadratic
regressions
Histograms of discrete
random variables
Normal distribution
Experimental and
observational studies
Central limit theorem
Confidence interval
Margin of error
PROCESS
STANDARDS
Problem Solving,
Arguments, Connections,
Multiple Representations,
Communication
Problem Solving,
Arguments,
Connections, Multiple
Representations,
Communication
Problem Solving,
Arguments, Connections,
Multiple Representations,
Communication
Problem Solving,
Arguments, Connections,
Multiple Representations,
Communication
GPS Training Days 1, 2 and 3 Mathematics 1 Research and Resource Manual
72
Additional Resources
Web sites for Learning Style and Multiple Intelligences surveys:
http://lookingahead.heinle.com/filing/l-styles.htm
Perceptual Learning Style Preference Questionnaire – hard copy survey for students
http://www.engr.ncsu.edu/learningstyles/ilsweb.html
online Learning Styles Questionnaire that provides immediate feedback in a variety of areas
http://www.humanmetrics.com/cgi-win/JTypes2.asp
online survey for Jungian-based profile – detailed information on types can be found at
http://typelogic.com/
http://www.thirteen.org/edonline/concept2class/mi/index.html
includes lots of information on Multiple Intelligences, including links to lessons for K-12
classrooms (be sure to click through Explanation-Demonstration-Exploration-Implementation at
the top)
http://www.thirteen.org/edonline/concept2class/mi/index.html
the Paragon Learning Style Inventory is also aligned with Jungian theory and a hard copy survey
and explanation is available here
http://surfaquarium.com/MI/inventory.htm
this site offers a hard-copy version of the MI test
http://www.mitest.com/o2ndary.htm
this site offers an online version of the MI test for ages 13 to 18 (only 7 of Gardner’s
intelligences are used)
http://www.mitest.com/o7inte~1.htm
this site offers an online version of the MI test for adults (only 7 of Gardner’s intelligences are
used)
http://www.literacyworks.org/mi/assessment/findyourstrengths.html
an online assessment for multiple intelligences
http://www.chaminade.org/inspire/learnstl.htm
this site presents a chart of learning styles (visual, auditory, tactile) – answer questions to
understand your own learning style better
GPS Training Days 1, 2 and 3 Mathematics 1 Research and Resource Manual
73
Resources for Differentiation:
Books that offer specific strategies, as well as lessons and units that incorporate differentiated
instruction:
Northey, S. S. (2005). Handbook on Differentiated Instruction for Middle and High Schools.
Larchmont, NY: Eye On Education. ISBN 1-930556-93-4
Nunley, K. F. (2006). Differentiating the High School Classroom. Thousand Oaks, CA:
Corwin Press. ISBN 1-4129-1716-6
Tilton, L. (2003). The Teacher’s Toolbox for Differentiating Instruction. Shorewood, MN:
Covington Cove Publications. ISBN 0-9653529-7-8
Tomlinson, C. A. (1999). The Differentiated Classroom: Responding to the Needs of All
Learners. Alexandria, VA: ASCD. ISBN 0-87120-342-1
Tomlinson, C. A., and Strickland, C. A. (2005). Differentiation in Practice: A Resource Guide
for Differentiated Instruction Grades 9 – 12. Alexandria, VA: ASCD.
ISBN 1-4166-0050-7
Resources for Co-Teaching:
Video: The Power of 2; by Marilyn Friend
Video: Collaborative Planning and Collaborative Teaching; by Richard Villa
Video: How to Co-teach to Meet Diverse Student Needs; by ASCD
http://www.powerof2.org
This website offers an array of support and information about collaboration. There are links,
online training, FAQs and articles.
http://wblrd.sk.ca/~bestpractice/index.html#
This website offers ideas for differentiated instructional strategies, including learning contracts,
tiered instruction, and anchor activities (click on INDEPENDENT STUDY at the left)
http://www.nichcy.org
Extensive information on disabilities and disability-related issues for families, teachers, and
others. The website includes fact sheets and research briefs on specific disabilities as well as
special education law. Many of the materials available for downloading are available in Spanish
as well as English.

GPS Training Days 1, 2 and 3 Mathematics 1 Research and Resource Manual
74
The National Association of the Deaf
http://www.nad.org/
The NAD advocates for people who are deaf or hard of hearing, provides information on topics
related to hearing loss, and serves individuals with these special needs.
Councils of Educators for Students with Disabilities
http://www.504idea.org/504resources.html
Wide variety of presentation materials and papers related to Section 504
@ctivTeen
http://www.disabilitycentral.com/activteen/about.htm
Managed by teenagers who have disabilities and designed especially for them. The site includes
an e-zine as well as message boards and activities pages.
Internet Resources for Special Children (IRSC)
http://www.irsc.org
Provides numerous links to resources about disabilities and special education issues.
Special Education Resources on the Internet (SERI)
http://www.seriweb.com/
Devoted to individuals with disabilities. Topics to explore on the site include legal resources,
parent resources, medical resources, and specific disability categories.
Federally-compiled annual reports to Congress on the implementation of IDEA
http://www.ed.gov/about/reports/annual/osep/index.html
Statistics about students with disabilities and how they receive their education services. Reports
available from the past several years. The reports begin with summaries on essential issues, but
also include extensive appendices with a wide variety of data tables.