
Georgia Department of Revenue county property tax digests, administration of the unclaimed property...
182
Transcript of Georgia Department of Revenue county property tax digests, administration of the unclaimed property...

Georgia Department of Revenue | Statistical Report FY2009
• Table 22: Three Economic Indicators by County with Rankings and Per Capita AmountsRevised June 18, 2010
• Table 23: Millage Rates by County - AlphabeticalRevised June 18, 2010
• Table 24: Millage Rates by County - NumericalRevised June 18, 2010
• SignificantAchievements-OtherHighlightsRevised July 13, 2010
• AdministrativeServicesDivisionHighlightsRevised July 13, 2010
Revisions

State of GeorgiaDepartment of Revenue
1800 Century Boulevard, Suite 15300 Atlanta, Georgia 30345
(404) 417-2100
February 2010
The Honorable Sonny Perdue, Governor Members of the Georgia Legislature100 State CapitolAtlanta, Georgia 30334
Dear Governor Perdue and Legislative Members:
This is the Annual Report of the Georgia Department of Revenue for the fiscal year ending June 30, 2009. Net collections for the past fiscal year totaled $15,619,041,000 compared to $17,449,859,000 for fiscal year 2008, a 10.49% decrease.
The 2009 fiscal year presented a number of challenges for government services. The Department of Revenue, like all other state agencies, was required to reduce its budget and spending for the fiscal year by nearly 10% or 12 million dollars. To obtain the reduction, the Department implemented a number of cost-saving measures, which included a nearly 18% reduction in staff. These reductions had a quantified impact on tax collection, service delivery, and processing.
The Department continues its efforts to provide enhancements in customer service through our Integrated Tax System and Tax Compliance Data Warehouse initiatives, increased usage of electronic processes that allow for more efficient return and payment processing and through our continuing efforts to develop a professional service organization. The customer front of these initiatives is the Georgia Tax Center where customers can review their account information online. To date, Sales and Use Tax and Withholding Tax have been implemented. Corporate Income Tax and Motor Fuel will go-live in Fall 2010. Our objectives are then to fully implement Individual Income Tax and other tax types during FY2011.
This Annual Report is designed to provide a glimpse into the scope of work needed to accomplish our mission: “To provide the best customer service and operational performance of any state taxing authority and the IRS.” The Department continues to be committed to administer Georgia’s tax laws in a fair and equitable manner through the dedication of our employees and the cooperation and support we receive from the executive and legislative branches. We look forward to serving you and all Georgians. Please let me know what additional or clarifying information may be of further assistance to you.
Respectfully submitted,
Bart L. GrahamState Revenue Commissioner
Bart L. GrahamCommissioner

Georgia Department of Revenue | Statistical Report FY2009
Georgia Department of Revenue
Mission StatementThe mission of the Georgia Department of Revenue is to provide the best customer service and operational performance of any state taxing authority and the IRS.

Table of Contents
Georgia Department of Revenue | Statistical Report FY2009
Organization Chart ................................................................................1Foreword ...............................................................................................3Significant Achievements.......................................................................4Integrated Tax Solution ..........................................................................5Directory ................................................................................................6Regional Offices ....................................................................................9FY2009 Sources of Tax Revenue ........................................................12Results and Performance Measures ...................................................13Administrative Services Division..........................................................20
Human Resources ............................................................................................................................... 21Table 1: Number of Department of Revenue Employees by Category ................................................ 21Office of Special Investigations ........................................................................................................... 21Office of Special Investigations Results and Performance Measures ................................................. 21Tax Law and Policy Division ................................................................................................................ 22Tax Law and Policy Division Results and Performance Measures ...................................................... 22Tax Law and Policy Seminars .............................................................................................................. 23
Taxpayer Services Division..................................................................24Taxpayer Services Division Results and Performance Measures ....................................................... 25Taxpayer Services Division Seminars ................................................................................................. 26Customer Contact Center (CCC) ......................................................................................................... 27Business Operations ........................................................................................................................... 27Table 2: Net Sales and Use Tax Collections by Month ........................................................................ 29Table 3.1: Sales and Use Tax Revenues by Business Group - Net Collections .................................. 30Table 3.2: Sales and Use Tax Revenues by Business Group - Percentage ........................................ 31Table 3.3: Sales and Use Tax Revenues by Business Group - Adjusted Total Revenues .................. 31Table 4: Growth in Sales and Use Tax Distributions to the General Fund and 1% to Counties .......... 32Table 5.1: CY2007 Domestic Corporation Income Tax Returns by Taxable Income Class ................. 33Table 5.2: CY2007 Foreign Corporation Income Tax Returns by Taxable Income Class .................... 34Table 5.3: CY2007 Corporation Income Tax Returns by Taxable Income Class ................................. 35Table 6: Net Corporate Tax Collections and Returns Processed Annually .......................................... 36Table 7: FY2009 Motor Fuel and Motor Carrier Detailed Revenue Data ............................................. 37Table 8: Number of Individual Income Tax Returns Processed and Net Individual Income Tax Collections .......................................................................................................................................... 38Table 9: Comparative Trends in Georgia’s Individual Income and State Income Tax Receipts ........... 39Table 10: Growth Trend of Individual Income Tax ................................................................................ 40Table 11: CY2007 Georgia Individual Income - Returns by Income Class .......................................... 41
Table of Contents
Tabl
e of
Con
tent
s Georgia Department of Revenue | Statistical Report FY2009
Table 12: Georgia, Southeast and United States Per Capita Income .................................................. 43Table 13: Per Capita Individual Income Percent Increase Comparison by Five Years Periods ........... 43Table 14: Georgia, Southeast Total Individual Income as a Percentage of United States ................... 44Table 15: Total Individual Income Percent Increase Comparison by Five Years Period ...................... 44Table 16: CY2007 Individual Income Tax Data by County of Residence ............................................. 45System Control Unit / Electronic Services ........................................................................................... 59Table 17: CY2009 Electronic Filing Results vs. Paper Returns ........................................................... 59
Local Government Services Division ...................................................60Local Government Services Division Results and Performance Measures ........................................ 61Local Government Services Division Seminars ................................................................................... 62Property Tax ........................................................................................................................................ 67Table 18: Summary of Net Property Tax Collections by Category ....................................................... 67Table 19: Taxable Values and Tax Rates, State of Georgia for General Property and Public Utilities . 68Table 20: Values of General Property, Public Utilities Dollars by Class of Property ............................ 69Table 21: CY2008 Selected Tax Statistics and Estimates by County .................................................. 70Table 22: Three Economic Indicators by County with Rankings and Per Capita Amounts .................. 77Table 23: Millage Rates by County - Alphabetical ............................................................................... 91Table 24: Millage Rates by County - Numerical ................................................................................... 97Homeowner’s Tax Relief Grant ............................................................................................................ 99Table 25: Net HTRG Revenue Totals .................................................................................................. 99
Motor Vehicle and Processing Center ...............................................100Motor Vehicle ..................................................................................................................................... 101Motor Vehicle Results and Performance Measures .......................................................................... 102Motor Vehicle Seminars ..................................................................................................................... 103Table 26.1: Number of Motor Vehicle Registrations and Tags Issued ............................................... 104Table 26.2: Number of Motor Vehicle Registrations Sold by Major Category .................................... 104Table 27: Summary of Revenues from Motor Vehicle Tag, Title, and Related Items ......................... 105Table 28: FY2009 Motor Vehicle Production Report - Tradeport Facility ........................................... 106Table 29: Lobby Customers at Tradeport Facility .............................................................................. 107Processing Center ............................................................................................................................. 108Processing Center Results and Performance Measures ................................................................... 109Table 30: Tax Returns Processed in Department of Revenue ............................................................110
Alcohol and Tobacco Division ............................................................ 111Alcohol and Tobacco Division Results and Performance Measures ..................................................112Alcohol Taxes .....................................................................................................................................113Tobacco Taxes ....................................................................................................................................114Table 31: Tax and Fee Collections by the Enforcement Unit of the Alcohol and Tobacco Division ....114Table 32: Alcohol and Tobacco Division Performance Figures ...........................................................115Table 33.1: Revenue from Selective Excise Taxes ............................................................................116
Table of Contents
Georgia Department of Revenue | Statistical Report FY2009
Table 33.2: Revenue from Business License Fees ............................................................................117
Compliance Division .......................................................................... 119Compliance Division Results and Performance Measures ................................................................ 120Table 34: Delinquent Tax Collections by Compliance Division Compared to Number of Accounts Processed .......................................................................................................................................... 121Table 35: Revenue from Collection Initiatives: September 2003 thru June 2009 .............................. 122
State Revenue Collections and Trends .............................................123Table 36: Cost of Collection Fees Collected ...................................................................................... 123Table 37: Comparison of Sales Tax Paid to the State Treasury and Sales Tax Distribution .............. 123Table 38: CY2009 Refund History by Months .................................................................................... 124Table 39: Net Revenue Collections by Georgia Department of Revenue .......................................... 125Table 40: Net Trends in Georgia’s State Tax Revenues by Major Sources ....................................... 126Table 41: Comparison of Net Collections and Population ................................................................. 127Table 42: Actual Department of Revenue Spending by Funding Source ........................................... 128Table 43.1: Changes in Major State Tax Revenues - Collections ...................................................... 128Table 43.2: Changes in Major State Tax Revenues - Percentage Changes ...................................... 129Table 43.3: Changes in Major State Tax Revenues - Absolute Changes .......................................... 130Table 44.1: Revenue Collections - Corporate Tax ............................................................................. 131Table 44.2: Revenue Collections - Individual Tax .............................................................................. 131Table 44.3: Revenue Collections - Other Taxes ................................................................................ 132Table 44.4: Revenue Collections - Business License Fees ............................................................... 133Table 44.5: Revenue Collections - Earnings - General Government ................................................. 133Table 44.6: Revenue Collections - Other Fees .................................................................................. 134Table 44.7: Revenue Collections - Total Revenue Collections .......................................................... 135Table 45: Trend in Georgia’s State Tax Revenues by Major Sources ............................................... 136
Legislative Summary for Enacted Legislation ...................................137Georgia Taxpayers’ Bill of Rights .......................................................144Historical Timeline .............................................................................149Revenue Commissioners ..................................................................151Appendix: Historical Data ..................................................................152FY2008 and FY2009 Table Comparison ...........................................171

Org
aniz
atio
n C
hart
1
Georgia Department of Revenue | Statistical Report FY2009
Organization Chart
Bart GrahamState Revenue Commissioner
Ed ManyDeputy Commissioner for Tax
Mack ChandlerDeputy Commissioner for
Administration
Tim ShieldsDirector
Motor Vehicle andProcessing Center
Denise SamuelDirector
Taxpayer Services
Howard TylerDirector
Alcohol and Tobacco
Vicki LambertDirector
Local Government Services
Frank O’ConnellDirector
Tax Law and Policy
Staci GuestDirector
Office of Special Investigations
JD GrantAssistant to Commissioner
Implementation and Facilities
Chris WalkerDirectorFinance
Linda Osborne-SmithDirector
Human Resources
Wes BrooksJeff Dalrymple
Co-DirectorsInformation Technology
- Audit (All tax types includingUnclaimed Property)
- Field Collections- Special Collection Programs
- Legislation/External Affairs- Facilities- Training- Taxpayer Advocate- Public Information
- MV Titling and Registration- MV Inspection Audit- MV Customer Service- Imaging- Depositing- Tax Data Capture and Verification- Return Processing
- Customer Service - Call Center- Examination, Notices and
Refunds- Licensing and Registration- E-file Administration
- Compliance- Citations- Licensing
- Digest Compliance and PublicUtility Valuation
- Distributions- Unclaimed Property- Tax Official/Agent Support and
Training
- Research and Analysis- Letter Rulings/Written Tax
Guidance- Protest Conferences and
Administrative Hearings- Regulations
- Fraud Detection- Criminal Investigations- Auto Crime - Title Fraud
- Facilities- Strategic Implementation
- Controller- Accounting- Banking- Budget- Procurement
- Human Resources- Payroll- EEO
Function
AdministrativeSupport
Support
- Infrastructure- Process Management- Telecom
Organization C
hart
2
Georgia Department of Revenue | Statistical Report FY2009
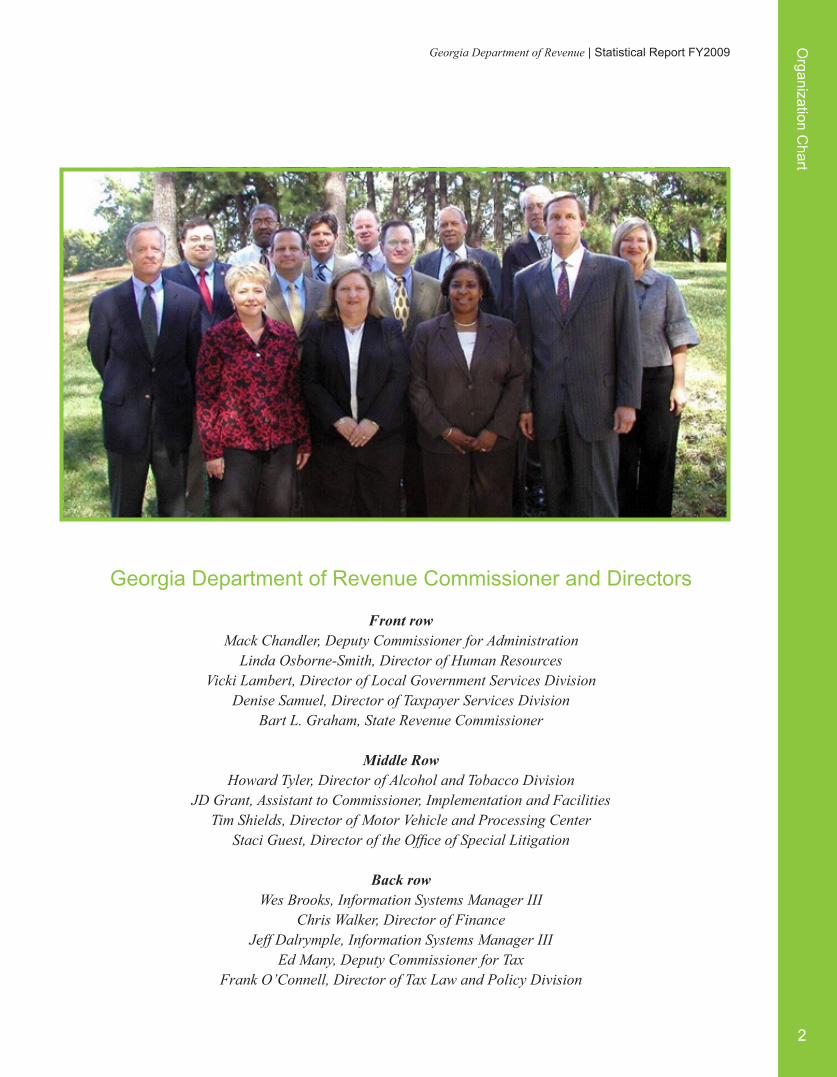
Georgia Department of Revenue Commissioner and Directors
Front rowMack Chandler, Deputy Commissioner for Administration
Linda Osborne-Smith, Director of Human ResourcesVicki Lambert, Director of Local Government Services Division
Denise Samuel, Director of Taxpayer Services DivisionBart L. Graham, State Revenue Commissioner
Middle RowHoward Tyler, Director of Alcohol and Tobacco Division
JD Grant, Assistant to Commissioner, Implementation and FacilitiesTim Shields, Director of Motor Vehicle and Processing Center
Staci Guest, Director of the Office of Special Litigation
Back rowWes Brooks, Information Systems Manager III
Chris Walker, Director of FinanceJeff Dalrymple, Information Systems Manager III
Ed Many, Deputy Commissioner for TaxFrank O’Connell, Director of Tax Law and Policy Division

Fore
wor
d
3
Georgia Department of Revenue | Statistical Report FY2009
ForewordThe Georgia Department of Revenue is responsible for the annual collection of taxes and fees, from both individuals and businesses, which together fund the daily operations of state government. The Department’s mission is to administer Georgia’s tax laws in a fair and equitable manner while providing a high level of customer service to ensure that every Georgia citizen pays their fair share of tax – and nothing more.
In fiscal year 2009, the Department collected approximately $22.5 billion in gross tax revenues and distributed over $4 billion in sales tax revenues to counties and municipalities. Utilizing advanced technology, the Department processed over 4 million individual income tax returns and issued more than 3 million individual refunds.
In addition to the collection of revenue, the Department performs a wide range of tasks that include the regulation and enforcement of alcohol and tobacco statutes, managing the taxation of interstate trucking, reviewing county property tax digests, administration of the unclaimed property program, and developing tax forms, instructions, and procedures with the goal of enhancing compliance efforts – across all tax types – while making the reporting and collection of taxes less onerous for Georgia taxpayers.
All figures included in this publication are unaudited unless otherwise noted.

SignificantA
chievements
4
Georgia Department of Revenue | Statistical Report FY2009
SignificantAchievements2009DepartmentofRevenueHighlights:• During Fiscal Year 2009, the Department’s net collections totaled $15,619,041,000.• Offset more than 59,000 federal refund checks recovering more than $27.2 million owed to the state by
individuals due to unpaid taxes.• Distributed $4.6 billion in sales and use tax to local tax authorities. • Awarded Governor’s Commendation for Excellence in Customer Service for Rapid Process
Improvement (RPI) efforts.• E-Services received a Governor’s Commendation for Excellence in Service for implementing the ACH-Debit
payment process.• Realignment of Motor Vehicle Division in April 2009, placed under leadership of Processing Center Director.
OtherHighlights:• Processed approximately 4 million individual tax returns.• Processed approximately 2.89 million individual electronic returns.• Processed approximately 2.9 million individual refunds.• Issued 73 tax guidance letters. • Blocked 28,887 fraudulent returns totaling $40 million.• Distributed approximately $429 million in Homeowner’s Tax Relief Grants to local governments.• 11Regionalofficesanswered400,305taxpayerassistancecallsandhadover66,000walk-intaxpayers.• Implemented Check21 software to allow the Department to electronically deposit payments.• Implemented the Sales Tax portion of the Integrated Tax System that allows the traveling auditor to use the
remote audit software package to complete the audit.• Implemented the Compliance Data Warehouse that will help identify non registered, underreporting, and
underpaying taxpayers.• In a 159 county statewide compliance check conducted by the Underage Investigations Group (UAIG), the
non-compliance rate decreased from 31% in 2008 to 17% in 2009. • InitiatedOn-lineMotorCarrierSystemEnhancementstoincludeGeorgiaUnifiedCarrierRegistration-Intra-
State(HB57),PaymentofAdValoremTaxesandInternationalRegistrationPlan(IRP)fleetmileage.• ExpandedontheElectronicLienandTitle(ELT)Programto3serviceprovidersand61financialinstitutions.• RedesignedtheSalesTaxCertificatetoaddadditionalsecuritysafeguards.• Analyzed and summarized 120 legislative bills. • Processed 106 consolidated return applications.• Reviewed and processed 859 tax exemption applications. • Promulgated 66 tax regulations. Revised July 13, 2010.
• 4,300 students attended property tax administration, collection and assessment training.• Implemented workforce initiatives designed to recruit, retainanddevelopqualifiedworkforce.Initiatives
included call center vestibule testing, supervisor training, leadership mentoring, and succession planning.• Completed the initial “Art of Exceptional Customer Service” training of over 1,400 DOR employees.

Georgia Department of Revenue | Statistical Report FY2009In
tegr
ated
Tax
Sol
utio
n
5
The Integrated Tax Solution will transform the Department’s current 23 disparate tax systems into a consolidated platform, which will provide agents with instant access to a taxpayer’s total tax picture. Instead of having to check various data bases, employees will have all pertinent information instantly available, which will result in more economical and comprehensive service to taxpayers when they need to interact with the Department.
This initiative will enhance the Department’s customer service to taxpayers. Coupled with the data warehouse initiative, the Integrated Tax Solution will significantly upgrade the Department’s compliance efforts.
The sales and use tax module of the Integrated Tax Solution became operational May 2009. Withholding became operational December 2009. Corporate and International Fuel Tax Agreement Tax (IFTA) are scheduled to become operational in early FY2011. Other tax types and functions will be implemented in future installations.
The Integrated Tax Solution has been successful for the sales and use implementation. Process improvements that were implemented in Phase I were the automated non-filer process, online request to update an account or location address, and automobile billing process. In Phase II the following on line improvements will be implemented: registration of a new sales and use or withholding account; single county sales and use tax return filing; request to protest or appeal an account liability; Withholding alliance with Federal/State Employment Taxes (FSET) transmissions which will become the standard in 2013.
Integrated Tax Solution

Directory
6
Georgia Department of Revenue | Statistical Report FY2009
DirectoryAdministrative Services Division1800 Century Boulevard, NE Atlanta, Georgia 30345
Commissioner Graham 404-417-2100
Deputy Commissioner for Administration, Mack Chandler Suite 15308 404-417-2100
Hearing Officer, Leisa Phillips Suite 15118 404-417-2211
Finance Director, Chris Walker Suite 17200 404-417-2222
Budget and Accounting Suite 17200 404-417-2222
Electronic Funds Transfer Suite 17235 404-417-2220
Human Resources and Payroll Director, Linda Osborne-Smith Suite 2225 404-417-2140
Facilities, JD Grant Suite 11216 404-417-6092
Office of Special Investigations Director, Staci Guest Suite 1175 404-417-2180
Public Information Suite 15114 404-417-2106
Tax Law and Policy Director, Frank O'Connell Suite 15202 404-417-2213
Taxpayer Advocate, Madeline Mangan Suite 15300 404-417-2273
Training Suite 4300 404-417-2262
Alcohol and Tobacco Division1800 Century Boulevard, NE Atlanta, Georgia 30345
Director, Howard Tyler Suite 4235 404-417-4900
Chief of Enforcement, David Dyal Suite 4235 404-417-4900
Chief of Operations, Scott Self Suite 4235 404-417-4900
Assistant Chief of Operations, Carter Leverette Suite 4235 404-417-4900
Revenue Regional Offices - Alcohol Special Agent Assignments
Albany - Assistant Special Agent in Charge, Matt Littleton 229-430-4404
Athens - Special Agent in Charge, Malcolm S. Bennett 706-542-9973
Augusta - Assistant Special Agent in Charge, David Toulson 706-737-1870
Columbus - Special Agent in Charge, Michael W. Earnest 770-732-5840
Douglas - Special Agent in Charge, Ronald Huckaby 912-353-3001
Lithia Springs - Special Agent in Charge, Michael W. Earnest 770-732-5840
Macon - Assistant Special Agent in Charge, Steve Jaramillo 478-751-6112
Northeast Metro - Assistant Special Agent in Charge, W.M. Ware 404-417-4851
Dire
ctor
y
7
Georgia Department of Revenue | Statistical Report FY2009
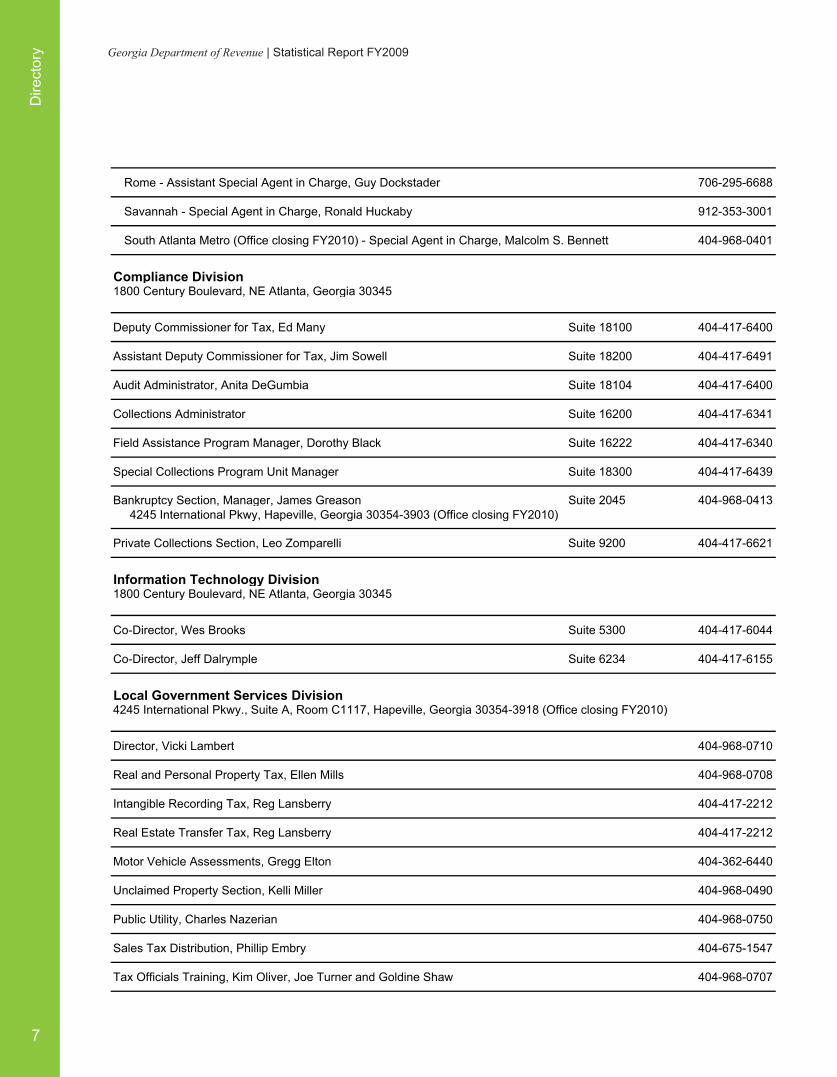
Rome - Assistant Special Agent in Charge, Guy Dockstader 706-295-6688
Savannah - Special Agent in Charge, Ronald Huckaby 912-353-3001
South Atlanta Metro (Office closing FY2010) - Special Agent in Charge, Malcolm S. Bennett 404-968-0401
Compliance Division1800 Century Boulevard, NE Atlanta, Georgia 30345
Deputy Commissioner for Tax, Ed Many Suite 18100 404-417-6400
Assistant Deputy Commissioner for Tax, Jim Sowell Suite 18200 404-417-6491
Audit Administrator, Anita DeGumbia Suite 18104 404-417-6400
Collections Administrator Suite 16200 404-417-6341
Field Assistance Program Manager, Dorothy Black Suite 16222 404-417-6340
Special Collections Program Unit Manager Suite 18300 404-417-6439
Bankruptcy Section, Manager, James Greason Suite 2045 404-968-0413 4245 International Pkwy, Hapeville, Georgia 30354-3903 (Office closing FY2010)
Private Collections Section, Leo Zomparelli Suite 9200 404-417-6621
Information Technology Division1800 Century Boulevard, NE Atlanta, Georgia 30345
Co-Director, Wes Brooks Suite 5300 404-417-6044
Co-Director, Jeff Dalrymple Suite 6234 404-417-6155
Local Government Services Division4245 International Pkwy., Suite A, Room C1117, Hapeville, Georgia 30354-3918 (Office closing FY2010)
Director, Vicki Lambert 404-968-0710
Real and Personal Property Tax, Ellen Mills 404-968-0708
Intangible Recording Tax, Reg Lansberry 404-417-2212
Real Estate Transfer Tax, Reg Lansberry 404-417-2212
Motor Vehicle Assessments, Gregg Elton 404-362-6440
Unclaimed Property Section, Kelli Miller 404-968-0490
Public Utility, Charles Nazerian 404-968-0750
Sales Tax Distribution, Phillip Embry 404-675-1547
Tax Officials Training, Kim Oliver, Joe Turner and Goldine Shaw 404-968-0707

Directory
8
Georgia Department of Revenue | Statistical Report FY2009
Motor Vehicle 1200 Tradeport Boulevard, Atlanta, Georgia 30354-1200
Director, Tim Shields Suite 1063 404-968-3690
Manager, Andrea Smith Suite 1114 404-968-3690
Manager, Robert Worle Suite 1114 404-968-3690
Tag and Title Information Suite 1153 404-968-3800
Processing Center 1200 Tradeport Boulevard, Atlanta, Georgia 30354-1200
Director, Tim Shields Suite 1063 404-675-1446
Assistant Director, Albert Burt Suite 1001 404-362-4577
Assistant Director, Lauraette Evans Suite 1038 404-362-2505
Taxpayer Services Division1800 Century Boulevard, NE Atlanta, Georgia 30345
Director, Denise Samuel Suite 8300 404-417-2400
Business Operations Manager 2, Ronald Johnson Jr. Suite 7100 404-417-4201
Corporate Tax Credits Problem Resolution Specialist, Beverley Bennett Suite 7102 404-417-2422
Sales Tax Problem Resolution Specialist, Summer Clifton Suite 7101 404-417-2395
Individual Income Tax Problem Resolution Specialist, Felicia Smith Suite 7110 404-417-2395
Amended Returns, Shelia Barnes Suite 7228 404-417-2347
Special Review, Tina West Suite 7218 404-417-2341
Business Review Unit Suite 8100 404-417-2425
Motor Fuel Tax Unit, Jeannie Hearn Suite 8200 404-417-6707
Registration and Licensing Unit, Christopher Luncheon Suite L-200 404-417-4332
Customer Contact Center Manager 2, Darcy Pyle Suite 3100 404-417-2167
Supervisor, Rhonda Stuldivant Suite 3208 404-417-4262
Supervisor, Nixie Gumbs Suite 3300 404-417-4283
Supervisor, Deloris Maxwell Suite 3200 404-417-4225
E-Services Group Manager, Rebecca Stensland Suite 7200 404-417-6450

Reg
iona
l Offi
ces
9
Georgia Department of Revenue | Statistical Report FY2009
Regional Offices
Rome
LithiaSprings
SouthAtlantaMetro
Athens
Columbus
NortheastMetro
Macon
DouglasAlbany
Augusta
Savannah
12
3
4
5
6 7
8
9 10
11

Regional O
ffices
10
Georgia Department of Revenue | Statistical Report FY2009
Numbers Regions Manager Regional Offices Phone
1 Rome Randy Holland 1401 Dean Street, Suite E, 706-295-6061Rome, GA 30161-6494
P.O. Box 1777, 30162-1777
2 Athens Kerry Herndon 3700 Atlanta Highway, Suite 268, 706-542-6058Athens, GA 30606-7428
3 Lithia Springs Judy Stanley 351 Thornton Road, Suite 101, 770-732-5812Lithia Springs, GA 30122-1589
P.O. Box 1079, 30122-7079
4 South Atlanta Metro Christy Bowens 4245 International Pkwy., Suite B, 404-968-0480(Office closing FY2010) Hapeville, GA 30354-3919
P.O. Box 16749, 30321-0749
5 Northeast Metro Jerry S. Sewell 1800 Century Center Blvd., NE, Suite 2206 404-417-6605Atlanta, GA 30345-3025
6 Columbus Peggy Watson 1501 13th Street, Suite A, 706-649-7451Columbus, GA 31901-2344P.O. Box 1698, 31902-1698
7 Macon Scott Purvis 630 North Ave., Suite B, 478-751-6055Macon, GA 31211-1493
P.O. Box 4368, 31208-4368
8 Augusta John Coleman 130 Davis Road 706-651-7600Martinez, GA 30907-2386
9 Albany Bennie Butler 1105-D W. Broad Ave. 229-430-4241Albany, GA 31707
P.O. Box 1357, 31702-1357
10 Douglas Marsha Gilliard North Point Plaza, Suite I, 912-389-40941214 N. Peterson
Douglas, GA 31533-2835P.O. Box 943, 31534-0943
11 Savannah Jon Galbraith 6606 Abercorn St., Suite 220, 912-356-2140Savannah, GA 31405-5831P.O. Box 13547, 31416-054

Georgia Department of Revenue | Statistical Report FY2009

Source of R
evenue Dollars
12
Georgia Department of Revenue | Statistical Report FY2009
FY2009 Sources of Tax Revenue
$15,619,041,000Total Taxes / Other Revenues
Tax Type Revenue(Thousands)
Property Tax 82,764$
Miscellaneous (Includes Estate Tax of $83k) 152,833$
Alcohol Beverages Tax 166,619$
Tobacco Tax 229,673$
Motor Vehicle - Tag, Title and Fees 287,528$
Motor Fuel Excise Tax 438,329$
Pre-Paid Motor Fuel Sales Tax 422,827$
Corporate Tax 694,714$
Sales and Use Tax 5,342,569$
Income Tax - Individual 7,801,185$
Total Taxes/Other Revenues 15,619,041$
Source: Accounting Unit, Finance Department, Georgia Department of Revenue - Monthly Press Release of Net Revenue Collections

Res
ults
and
Per
form
ance
Mea
sure
s
13
Georgia Department of Revenue | Statistical Report FY2009
Results and Performance MeasuresOffice of Special Investigations Results and Performance Measures
FY2005 FY2006 FY2007 FY2008 FY2009
Suspected fraudulent returns reviewed prior to release of funds 9,237 55,464 98,588 52,030 44,389
Number of fraudulent returns detected prior to release of funds 2,138 32,987 66,700 15,884 28,887
Funds not released due to detection of fraud (Millions) 2.8$ 26.9$ 42.0$ 16.5$ 40.0$
Source: Office of Special Investigations, Georgia Department of Revenue
Tax Law and Policy Division Results and Performance Measures
FY2005 FY2006 FY2007 FY2008 FY2009
Number of legislative bills analyzed and summarized 144 110 195 141 120
Number of tax guidance letters drafted 82 70 130 145 73
Number of consolidated return applications processed 53 50 76 42 106
Number of tax exemption applications reviewed and processed
442 400 719 826 859
Number of regulations updated or released 98 123 135 115 66
Number of taxpayer protests handled * * 72 54 33
Number of alcohol and tobacco citations issued * * 1,840 2,192 1,681
Estimated number of taxpayer emails handled * * 5,920 5,920 5,920
Estimated number of taxpayer phone calls handled * * 14,878 14,878 14,878
*Numbers not compiledSource: Tax Law and Policy Division, Georgia Department of Revenue

Results and P
erformance M
easures
14
Georgia Department of Revenue | Statistical Report FY2009
Taxpayer Services Division Results and Performance Measures
FY2005 FY2006 FY2007 FY2008 FY2009
Call Handling and Tracking
Number of inbound calls (Thousands) N/A 1,552 1,097 1,210 1,160
Number of calls answered (Thousands) N/A 477 618 640 557
Number of individual refund calls received (Thousands) 763 330 220 316 295
Number of individual refund calls answered (Thousands) 238 240 135 122 182
Correspondence Management
Number of protests received in response to individual income tax assessment notices (Thousands)
48 49 21 17 27
Percent of unresolved protests 120 days after filing 34% 30% 10% 13% 15%
Education and Assistance
Number of Education Seminars held 199 200 30 28 15
Source: Taxpayer Services Division, Georgia Department of Revenue

Res
ults
and
Per
form
ance
Mea
sure
s
15
Georgia Department of Revenue | Statistical Report FY2009
Local Government Services Division Results and Performance Measures
FY2005 FY2006 FY2007 FY2008 FY2009
Unclaimed Property
Value of unclaimed property returned to rightful owners or heirs (Millions)
6.8$ 8.0$ 12.0$ 14.0$ 17.2$
Grants and Distribution
● Local Sales Tax Distribution
Total local sales tax type (All counties combined) 456 457 467 465 470
Total returns (SUT) processed (Millions) 1.4 1.4 1.2 1.3 1.3
Distribution of sales tax revenues to local governments (Billions) 3.7$ 3.7$ 4.7$ 4.8$ 4.6$
● Homeowners Tax Relief Grants (HTRG)
Value of HTRG grants distributed (Millions) 412$ 418$ 425$ 429$ 429$
Number of local taxing jurisdictions receiving grants 419 430 430 440 454
Number of homesteads qualifying for grants (Millions) 7.1 7.3 7.3 7.1 7.4
Source: Local Government Services Division, Georgia Department of Revenue

Results and P
erformance M
easures
16
Georgia Department of Revenue | Statistical Report FY2009
Motor Vehicle Results and Performance Measures
FY2005 FY2006 FY2007 FY2008 FY2009
Salvage Inspection
Number of rebuilt salvage vehicle reinspections 22,618 23,208 20,991 17,437 16,545
Tag and Title Registration
● Commercial Truck Registration
Number of interstate commercial vehicle registrations - 45,102 45,526 43,751 51,926
● Motor Vehicle Registration
Number of Motor Vehicles tag registrations processed (Millions) - 8.2 8.4 8.5 8.5
Number of internet online motor vehicle title registrations - 232,917 401,273 459,361 474,167
● Titles
Amount of revenue generated from the issuance of motor vehicle tags and titles (Millions)
-$ 250$ 294$ 295$ 281$
Source: Motor Vehicle, Georgia Department of Revenue

Res
ults
and
Per
form
ance
Mea
sure
s
17
Georgia Department of Revenue | Statistical Report FY2009
Processing Center Results and Performance Measures
FY2005 FY2006 FY2007 FY2008 FY2009
Error Resolution
Number of Sales Tax returns processed through Error Resolution (Thousands)
787 700 572 636 458
Percent of Sales Tax returns processed through Error Resolution
56.3% 50.0% 48.0% 46.9% 36.1%
Total number of Error Resolution staff (All tax types) 100 90 82 78 68
Money Deposits
Average time lapse in days between receipts and deposit of check in a coupon payment
2.5 2.0 2.5 2.0 3.5
Average time lapse in days between receipts and deposit of check in a non-coupon payment
12.3 10.0 9.0 8.0 5.4
Amount of gross revenue collections deposited through electronic funds transfers (Billions)
12.5$ 13.0$ 17.3$ 17.7$ 17.3$
Returns Processing
Number of documents processed (Millions) (i)
7.9 7.9 7.9 8.7 7.7
Number of images created (Millions) (i)
52.6 54.0 54.0 80.0 62.0
Percent of Individual Income tax non-paper returns processed 59.8% 60.0% 68.2% 72.4% 73.1%
(i) Reduction in documents processed and images created due to reduction in Processing Center staff in FY2009.Source: Processing Center and Accounts Unit, Finance Department, Georgia Department of Revenue

Results and P
erformance M
easures
18
Georgia Department of Revenue | Statistical Report FY2009
Alcohol and Tobacco Division Results and Performance Measures
FY2005 FY2006 FY2007 FY2008 FY2009
Industry Regulations
● Amusement Machines
Number of amusement machines reviewed annually for compliance 8,764 8,312 2,130 1,743 1,482
Number of amusement machines seized due to non-compliance 301 193 197 397 102
● Law Enforcement
Number of citations issued 1,880 1,684 1,739 2,116 1,603
Percent of alcohol inspections where the operator is not in compliance with applicable law
18% 15% 12% 8% 8%
● Licenses and Permits
Number of alcohol license investigations conducted 1,338 1,387 1,499 1,523 1,469
Number of executive orders served after administrative hearings
1,663 1,658 1,372 1,505 2,137
Underage Investigation
Number of investigations of illegal alcohol sales to underage persons that lead to a sanction of some kind
285 448 774 1,243 659
Percent of retail vendors investigated who make illegal tobacco sales to underage persons
16% 18% 12% 8% 8%
Source: Alcohol and Tobacco Division, Georgia Department of Revenue
Res
ults
and
Per
form
ance
Mea
sure
s
19
Georgia Department of Revenue | Statistical Report FY2009
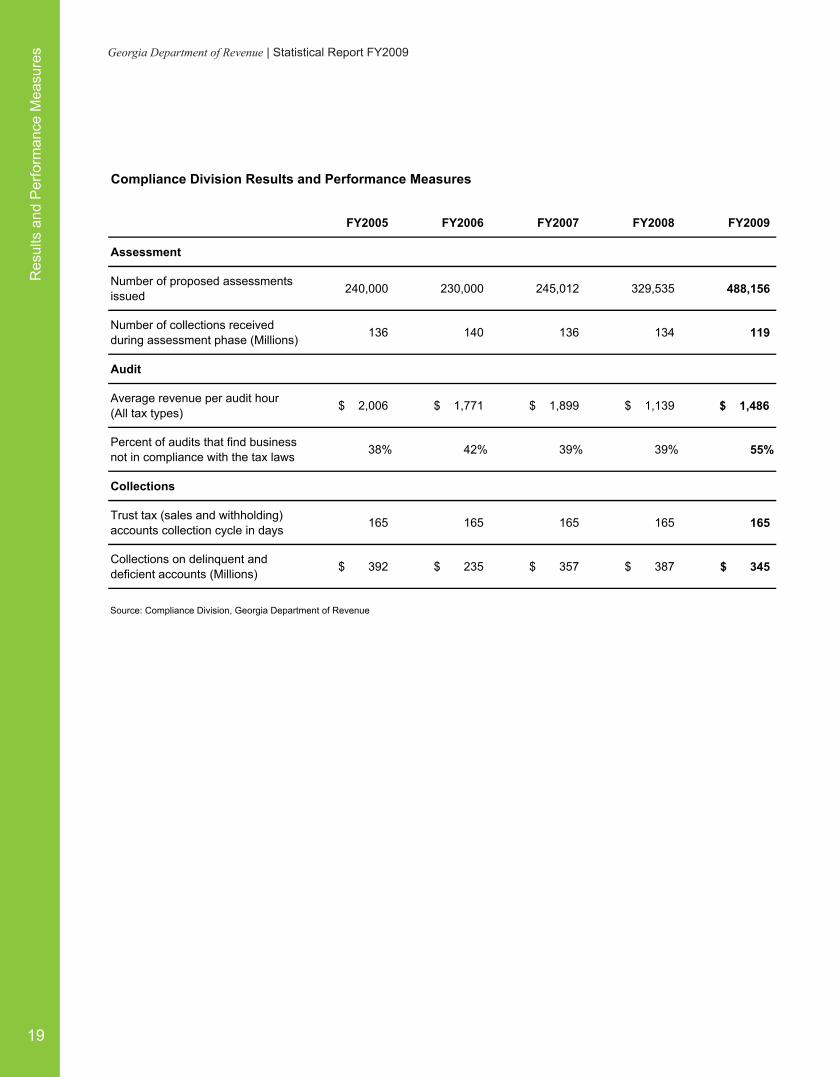
Compliance Division Results and Performance Measures
FY2005 FY2006 FY2007 FY2008 FY2009
Assessment
Number of proposed assessments issued 240,000 230,000 245,012 329,535 488,156
Number of collections received during assessment phase (Millions) 136 140 136 134 119
Audit
Average revenue per audit hour (All tax types) 2,006$ 1,771$ 1,899$ 1,139$ $ 1,486
Percent of audits that find business not in compliance with the tax laws 38% 42% 39% 39% 55%
Collections
Trust tax (sales and withholding) accounts collection cycle in days 165 165 165 165 165
Collections on delinquent and deficient accounts (Millions) 392$ 235$ 357$ 387$ 345$
Source: Compliance Division, Georgia Department of Revenue
Adm
inistrative Services D
ivision
20
Georgia Department of Revenue | Statistical Report FY2009
The Administrative Services Division provides administrative services for all department divisions including:
• AdministrativeHearingOffice• Facilities Management• Finance Department• HumanResources• Internal Audit/Strategic Planning and Implementation• OfficeofSpecialInvestigations• Procurement• PublicInformationOffice• Tax Law and Policy• TaxpayerAdvocate’sOffice• TrainingandOrganizationalDevelopmentUnit
Administrative Services Division
Administrative Services Division Highlights:
Human Resources• Developed and implemented workforce initiatives designed to recruit, retain and develop
qualified workforce. Initiatives included call center vestibule testing, supervisor training,leadership mentoring, and succession planning for middle management positions.
Office of Special Investigations• Blocked 28,887 fraudulent returns totaling $40 million.
Tax Law and Policy Division• Analyzed and summarized 120 legislative bills. • Issued 73 tax guidance letters. • Processed 106 consolidated return applications. • Reviewed and processed 859 tax exemption applications. • Promulgated 66 tax regulations. Revised July 13, 2010.
Training and Organizational Development Unit• Completed the initial “Art of Exceptional Customer Service” training of over 1,400 Department of
Revenue employees begun in 2007. This training is now ongoing to include any new employees.

Adm
inis
trativ
e S
ervi
ces
Div
isio
n
21
Georgia Department of Revenue | Statistical Report FY2009
Human Resources
Table 1
Office of Special Investigations
Office of Special Investigations Results and Performance Measures
FY2005 FY2006 FY2007 FY2008 FY2009
Suspected fraudulent returns reviewed prior to release of funds 9,237 55,464 98,588 52,030 44,389
Number of fraudulent returns detected prior to release of funds 2,138 32,987 66,700 15,884 28,887
Funds not released due to detection of fraud (Millions) 2.8$ 26.9$ 42.0$ 16.5$ 40.0$
Source: Office of Special Investigations, Georgia Department of Revenue
Number of Department of Revenue Employees by Category
FY2005 FY2006 FY2007 FY2008 FY2009
Temporary Employees 340 453 408 255 194
Full-Time Employees 936 1,214 1,267 1,265 1,211
Total Employees 1,276 1,667 1,675 1,520 1,405
Source: Human Resources, Georgia Department of Revenue
Established in 2005, the Office of Special Investigations is responsible for investigating potential criminal violations involving fraud and theft related to income tax, withholding tax, sales and use tax, excise tax, and property tax. The office is also responsible for conducting internal affairs investigations. The goal of these investigations is to develop cases which can be turned over to state legal representatives for prosecution in a court of law.
Since its inception, the Office of Special Investigations has developed cases against twelve individuals that resulted in guilty pleas.
The office is also responsible for the physical security of the Department’s facilities.
The Department’s Auto Crime - Title Fraud Unit, which is responsible for investigating motor vehicle title and registration fraud, is also a part of the Office of Special Investigations.

Adm
inistrative Services D
ivision
22
Georgia Department of Revenue | Statistical Report FY2009
Tax Law and Policy Division Results and Performance Measures
FY2005 FY2006 FY2007 FY2008 FY2009
Number of legislative bills analyzed and summarized 144 110 195 141 120
Number of tax guidance letters drafted 82 70 130 145 73
Number of consolidated return applications processed 53 50 76 42 106
Number of tax exemption applications reviewed and processed
442 400 719 826 859
Number of regulations updated or released 98 123 135 115 66
Number of taxpayer protests handled * * 72 54 33
Number of alcohol and tobacco citations issued * * 1,840 2,192 1,681
Estimated number of taxpayer emails handled * * 5,920 5,920 5,920
Estimated number of taxpayer phone calls handled * * 14,878 14,878 14,878
*Numbers not compiledSource: Tax Law and Policy Division, Georgia Department of Revenue
Tax Law and Policy Division
Tax Law and Policy Division implements tax policy for the state regarding all taxes collected and regulatory areas administered by the Department. The Section’s analysts handle designated areas of taxation or regulation and administer the following functions:
• Draft and analyze legislation • Handle certain taxpayer protests and refund claims• Conduct taxpayer conferences• Issue determinations concerning exemption-related requests • Issue policy statements and informational bulletins • Promulgate rules and regulations for the Department• Respond to letter ruling requests from taxpayers• Assist the State Economist and the Georgia Legislature with fiscal/tax policy research

Adm
inis
trativ
e S
ervi
ces
Div
isio
n
23
Georgia Department of Revenue | Statistical Report FY2009
Tax Law and Policy Division Seminars
Seminars Date Location Attendees
Association of Government Accountants May 21, 2009 Atlanta 45
Georgia Automobile Dealers Association November 18, 2008 Atlanta 20
Georgia Government Finance Officers January 26, 2009 Atlanta 75-100Association
Georgia Society of CPA's July 13, 2009 Atlanta 50-75
IPT Luncheon Series February 5, 2009 Atlanta 100
IPT/DOR Conference November 21, 2008 Atlanta 100
IRS Tax Forum July 3, 2008 Atlanta 75
NATP Conference September 22, 2008 Dillard 100

Taxpayer Services D
ivision
24
Georgia Department of Revenue | Statistical Report FY2009
The Taxpayer Services Division was created in 2004 through the merger of three former Divisions: Income Tax, Sales Tax, and Taxpayer Accounting. The three major functions of the Division are: customer contact center, business operations, and systems control unit electronic services.
Taxpayer Services Division
Taxpayer Services Division Highlights:
• E-Services received a Governor’s Commendation for Excellence in Service for implementing the ACH-Debit payment process.
• Redesigned the Sales Tax Certificate to add additional security safeguards.

Taxp
ayer
Ser
vice
s D
ivis
ion
25
Georgia Department of Revenue | Statistical Report FY2009
Taxpayer Services Division Results and Performance Measures
FY2005 FY2006 FY2007 FY2008 FY2009
Call Handling and Tracking
Number of inbound calls (Thousands) N/A 1,552 1,097 1,210 1,160
Number of calls answered (Thousands) N/A 477 618 640 557
Number of individual refund calls received (Thousands) 763 330 220 316 295
Number of individual refund calls answered (Thousands) 238 240 135 122 182
Correspondence Management
Number of protests received in response to individual income tax assessment notices (Thousands)
48 49 21 17 27
Percent of unresolved protests 120 days after filing 34% 30% 10% 13% 15%
Education and Assistance
Number of Education Seminars held 199 200 30 28 15
Source: Taxpayer Services Division, Georgia Department of Revenue

Taxpayer Services D
ivision
26
Georgia Department of Revenue | Statistical Report FY2009
Taxpayer Services Division Seminars
Seminars Date Location Attendees
Sales and Use Tax July 16, 2008 Lawrenceville 130
August 7, 2008 Valdosta 40
August 19, 2008 Carrollton 25
September 9, 2008 Augusta 55
September 18, 2008 Savannah 45
October 9, 2008 Decatur 150
October 15, 2008 Americus 12
November 7, 2008 Newnan 80
November 13, 2008 Athens 80
December 4, 2008 Macon 150
April 7, 2009 Kennesaw 150
April 15, 2009 Athens 45
May 6, 2009 Columbus 48
June 2, 2009 Atlanta 98
June 11, 2009 Albany 65

Taxp
ayer
Ser
vice
s D
ivis
ion
27
Georgia Department of Revenue | Statistical Report FY2009
Customer Contact Center (CCC)
The CCC is responsible for answering taxpayer telephone, face-to-face, and written inquiries. The Center consists of the TSD Call Center and the Century Center Customer Service Office. It is one of the largest call centers in Georgia state government, with approximately 557,000 calls answered in 2009. For 2009, the Call Center used a call analysis feature that determines the reason a call was made, which assisted in the development of new self-service solutions to provide better assistance to callers. This system also created opportunities to share resources with other Department of Revenue divisions and other Departments within state government, such as the Office of Customer Service which handles request for tax forms for the Department of Revenue.
Business Operations
The units under Business Operations include Registration and Licensing, Sales Tax Review, Withholding Review, Tax Credits and Incentives, Business (Corporate) Tax Review, Motor Fuel Review, Individual Review, Amended Returns, Account Maintenance, and Problem Resolution. These units are responsible for examination, refund, and problem resolution functions.
Registration and Licensing (R&L) UnitThis Unit registers all businesses with a nexus in Georgia and maintains a registration system for both business and individual taxpayers. Business registration includes sales and use tax, withholding tax, motor fuel distributor tax, retail tobacco, and alcohol (beer, wine, and liquor). R&L is responsible for annual renewals of retail and consumption-on-premise alcohol licenses, tobacco permits, and licenses and decals for amusement coin-operated machines. As the Department’s custodian of records, the Unit responds to taxpayer e-mail, written and telephone record retrieval inquiries, and other requests.
Business Review SectionThis Section is responsible for the review and examination of all business taxes including sales tax, withholding tax, tax credits and incentives, and corporate tax. It includes the following units:
• Sales Tax Review Unit - Responsible for making account adjustments to ensure that sales and use tax returns are processed and local sales taxes are distributed accurately to all taxing jurisdictions. Also reviews and processes refund waiver requests.
• Withholding Tax Review Unit - Responsible for making necessary adjustments to ensure accurate processing of returns that report taxes withheld by employers and payors of non-employee compensation. This includes tax withheld from wages, nonresident distributions, lottery winnings, pension and annuity payments, and other sources of income. Also reviews and processes refund requests.

Taxpayer Services D
ivision
28
Georgia Department of Revenue | Statistical Report FY2009
• Tax Credits and Incentives - Responsible for reviewing, approving and accurately processing all returns and requests pertaining to tax credits and incentives. Responsible for recording and monitoring the use of credits by individuals and corporations.
• Corporate Tax Review - Responsible for reviewing and examining corporate and S-Corporation tax returns. Reviews and processes refund requests.
Motor Fuel ReviewReviews and examines motor fuel distributor and motor carrier tax returns. Ensures that Motor Carrier taxes are administered in compliance with the International Fuel Tax Agreement (IFTA).
Individual ReviewReviews and examines individual income tax returns, returns claiming net operating loss, and composite returns. Also reviews and monitors pre-audit (special review), high dollar refunds, and fraudulent returns and filers.
Amended ReturnsResponsible for reviewing and examining all amended individual income tax returns. Also assists with the review and monitoring of fraudulent returns and filers.
Accounts MaintenanceResponsible for reviewing written taxpayer protests concerning corporate, withholding, sales and use and individual income tax return adjustments and/or assessments. Also reviews requests for penalty and interest waivers and responds to taxpayer inquiries.
Problem Resolution SpecialistsResponsible for resolving complex taxpayer issues that are not resolved through normal channels. The specialists provide high-level support to all Department business units and the Call Center. Assists with taxpayer education through seminars, classes and meetings, and manages the CPA hotline.

Taxp
ayer
Ser
vice
s D
ivis
ion
29
Georgia Department of Revenue | Statistical Report FY2009
Table 2Net Sales and Use Tax Collections by Month (Thousands)
CY2004 CY2005 CY2006 CY2007 CY2008
January 490,687$ 498,330$ 613,579$ 607,350$ 596,595$
February 476,431$ 430,129$ 384,925$ 524,128$ 511,639$
March 361,817$ 444,208$ 461,787$ 451,125$ 426,586$
April 454,471$ 434,495$ 429,094$ 529,955$ 532,842$
May 468,504$ 450,917$ 532,418$ 489,126$ 448,416$
June 509,733$ 504,319$ 537,639$ 561,206$ 463,871$
July 384,053$ 489,650$ 449,023$ 519,220$ 491,732$
August 474,231$ 494,815$ 476,761$ 521,027$ 460,509$
September 420,969$ 402,970$ 450,504$ 402,902$ 445,535$
October 431,305$ 489,518$ 462,009$ 416,407$ 486,744$
November 413,980$ 460,909$ 385,666$ 459,477$ 457,142$
December 407,973$ 472,624$ 528,666$ 481,885$ 435,256$
Total 5,294,154$ 5,572,884$ 5,712,071$ 5,963,808$ 5,756,867$
Source: Accounting Unit, Finance Department, Georgia Department of Revenue - Monthly Press Release of Net Revenue Collections

Taxpayer Services D
ivision
30
Georgia Department of Revenue | Statistical Report FY2009
Table 3.1Sales and Use Tax Revenues by Business Group - Net Collections (Thousands)
FY2005 FY2006 FY2007 FY2008 **FY2009
069,537dooF $ 819,634$ 819,441$ 845,618$ 815,033$
522,281lerappA $ 198,801$ 213,481$ 207,470$ 194,325$
085,007esidnahcreM lareneG $ 747,110$ 774,009$ 759,189$ 766,099$
327,208evitomotuA $ 852,560$ 896,204$ 847,972$ 627,651$
120,854emoH $ 526,192$ 533,673$ 500,312$ 424,237$
910,725rebmuL $ 591,547$ 587,397$ 471,709$ 329,606$
300,983ecivreS $ 431,632$ 442,189$ 484,621$ 504,260$
329,152srerutcafunaM $ 293,166$ 299,505$ 282,586$ 284,720$
532,695seitilitU $ 664,579$ 707,998$ 760,253$ 816,291$
425,025suoenallecsiM $ 615,590$ 634,977$ 625,189$ 535,641$
312,461,5latoT $ 5,740,811$ 5,908,874$ 5,784,919$ 5,297,863$
** On May 1, 2009, DOR implemented a new Sales Tax system that utilizes the North American Industry Classification System (NAICS), replacing the old commodity codes previously used.
Source: State Accounting Office of Georgia, Local Government Services Division and Finance Department, Georgia Department of Revenue
Taxp
ayer
Ser
vice
s D
ivis
ion
31
Georgia Department of Revenue | Statistical Report FY2009
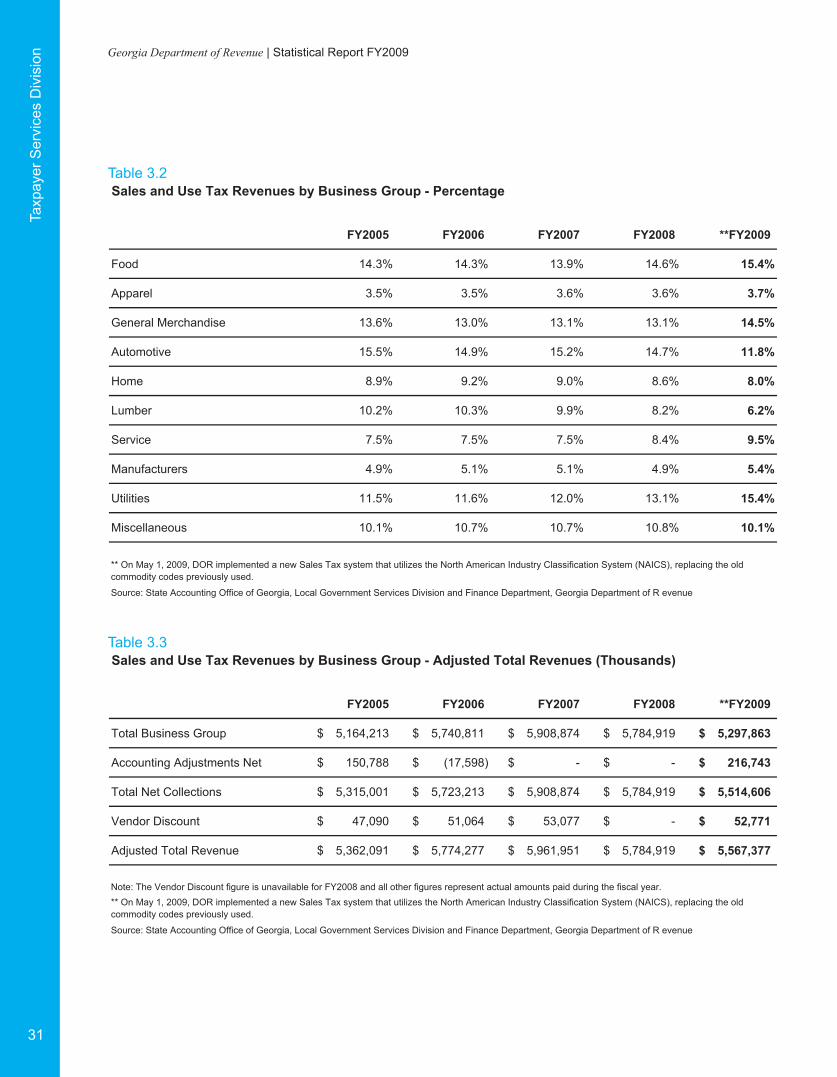
Table 3.2
Table 3.3
Sales and Use Tax Revenues by Business Group - Percentage
FY2005 FY2006 FY2007 FY2008 **FY2009
%6.41%9.31%3.41%3.41dooF 15.4%
%6.3%6.3%5.3%5.3lerappA 3.7%
%1.31%1.31%0.31%6.31esidnahcreM lareneG 14.5%
%7.41%2.51%9.41%5.51evitomotuA 11.8%
%6.8%0.9%2.9%9.8emoH 8.0%
%2.8%9.9%3.01%2.01rebmuL 6.2%
%4.8%5.7%5.7%5.7ecivreS 9.5%
%9.4%1.5%1.5%9.4srerutcafunaM 5.4%
%1.31%0.21%6.11%5.11seitilitU 15.4%
%8.01%7.01%7.01%1.01suoenallecsiM 10.1%
Source: State Accounting Office of Georgia, Local Government Services Division and Finance Department, Georgia Department of R evenue
** On May 1, 2009, DOR implemented a new Sales Tax system that utilizes the North American Industry Classification System (NAICS), replacing the old commodity codes previously used.
Sales and Use Tax Revenues by Business Group - Adjusted Total Revenues (Thousands)
FY2005 FY2006 FY2007 FY2008 **FY2009
Total Business Group 5,164,213$ 5,740,811$ 5,908,874$ 5,784,919$ 5,297,863$
Accounting Adjustments Net 150,788$ (17,598) - $ $ -$ 216,743$
Total Net Collections 5,315,001$ 5,723,213$ 5,908,874$ 5,784,919$ 5,514,606$
090,74tnuocsiD rodneV $ 51,064$ 53,077 - $ $ 52,771$
Adjusted Total Revenue 5,362,091$ 5,774,277$ 5,961,951$ 5,784,919$ 5,567,377$
Note: The Vendor Discount figure is unavailable for FY2008 and all other figures represent actual amounts paid during the fiscal year.
Source: State Accounting Office of Georgia, Local Government Services Division and Finance Department, Georgia Department of R evenue
** On May 1, 2009, DOR implemented a new Sales Tax system that utilizes the North American Industry Classification System (NAICS), replacing the old commodity codes previously used.

Taxpayer Services D
ivision
32
Georgia Department of Revenue | Statistical Report FY2009
Table 4Growth in Sales and Use Tax Distributions to the General Fund and 1% to Counties (Thousands)
FY2005 FY2006 FY2007 FY2008 FY2009 % CHG 08-09
5,281,929$ 5,772,352$ 5,948,545$ 5,780,867$ 5,342,569 %06.7- $
FY2005 FY2006 FY2007 FY2008 FY2009 % CHG 08-09
1,433,330$ 1,177,638$ 1,698,403$ 1,698,564$ 1,611,481 %01.5- $
Growth in Sales and Use Tax Deposits Paid to the State Treasury
Growth in One (1%) Local Option Sales Tax Paid to Counties
Source: Accounting Unit, Finance Department and Local Government Services Division, Georgia Department of Revenue
$-
$1,500,000
$3,000,000
$4,500,000
$6,000,000
$7,500,000
FY2005 FY2006 FY2007 FY2008 FY2009
$-
$400,000
$800,000
$1,200,000
$1,600,000
$2,000,000
FY2005 FY2006 FY2007 FY2008 FY2009

Taxp
ayer
Ser
vice
s D
ivis
ion
33
Georgia Department of Revenue | Statistical Report FY2009
Table 5.1
Number of Returns Percent of Returns Net Taxable Income Percent of Net Taxable Income
$0 or Less 190,603 91.41% 0.00%
$1 - $5,000 6,015 2.88% 10,181,813$ 0.27%
$5,000 - $10,000 1,970 0.94% 14,163,512$ 0.37%
$10,000 - $25,000 2,969 1.42% 48,144,616$ 1.26%
$25,000 - $50,000 2,278 1.09% 80,995,620$ 2.11%
$50,000 - $100,000 1,761 0.84% 120,251,154$ 3.14%
$100,000 - $250,000 1,245 0.60% 180,916,481$ 4.72%
$250,000 - $500,000 579 0.28% 180,078,329$ 4.70%
$500,000 - $1,000,000 397 0.19% 225,739,179$ 5.89%
Over $1,000,000 707 0.34% 2,972,581,862$ 77.55%
Total 208,524 100.00% 3,833,052,565$ 100.00%
Source: Information Technology Division, Georgia Department of RevenueNote: Figures represent 96.5% of returns processed as of December 2009.
CY2007 Domestic Corporation Income Tax Returns by Taxable Income Class

Taxpayer Services D
ivision
34
Georgia Department of Revenue | Statistical Report FY2009
Table 5.2
Number of Returns Percent of Returns Net Taxable Income Percent of Net Taxable Income
$0 or Less 36,677 73.74% 0.00%
$1 - $5,000 3,042 6.12% $ 4,624,396 0.04%
$5,000 - $10,000 931 1.87% $ 6,679,706 0.06%
$10,000 - $25,000 1,505 3.03% $ 24,293,104 0.21%
$25,000 - $50,000 1,264 2.54% $ 43,903,411 0.38%
$50,000 - $100,000 1,190 2.39% $ 81,830,571 0.71%
$100,000 - $250,000 1,544 3.10% $ 240,511,716 2.10%
$250,000 - $500,000 1,056 2.12% $ 356,935,098 3.12%
$500,000 - $1,000,000 846 1.70% $ 569,879,236 4.98%
Over $1,000,000 1,682 3.38% $ 10,123,843,724 88.40%
Total 49,737 100.00% 11,452,500,962$ 100.00%
Source: Information Technology Division, Georgia Department of RevenueNote: Figures represent 96.5% of returns processed as of December 2009.
CY2007 Foreign Corporation Income Tax Returns by Taxable Income Class

Taxp
ayer
Ser
vice
s D
ivis
ion
35
Georgia Department of Revenue | Statistical Report FY2009
Table 5.3
Number of Returns Percent of Returns Net Taxable Income Percent of Net Taxable Income
$0 or Less 227,280 88.00% -$ 0.00%
$1 - $5,000 9,057 3.51% 14,806,209$ 0.10%
$5,000 - $10,000 2,901 1.12% 20,843,218$ 0.14%
$10,000 - $25,000 4,474 1.73% 72,437,720$ 0.47%
$25,000 - $50,000 3,542 1.37% 124,899,031$ 0.82%
$50,000 - $100,000 2,951 1.14% 202,081,724$ 1.32%
$100,000 - $250,000 2,789 1.08% 421,428,196$ 2.76%
$250,000 - $500,000 1,635 0.63% 537,013,427$ 3.51%
$500,000 - $1,000,000 1,243 0.48% 795,618,416$ 5.21%
Over $1,000,000 2,389 0.93% 13,096,425,586$ 85.68%
Total 258,261 100.00% 15,285,553,527$ 100.00%
Source: Information Technology Division, Georgia Department of RevenueNote: Figures represent 96.5% of returns processed as of December 2009.
CY2007 Corporation Income Tax Returns by Taxable Income Class

Taxpayer Services D
ivision
36
Georgia Department of Revenue | Statistical Report FY2009
Table 6Net Corporate Tax Collections and Returns Processed Annually
FY2005 FY2006 FY2007 FY2008 FY2009
Corporate Tax Returns (Thousands) 237 241 250 239 365
Net Corporate Tax Collections (Millions) 712$ 890$ 1,017$ 943$ 695$
Source: Processing Center and Accounting Unit, Finance Department, Georgia Department of Revenue - Monthly Press Release of Net Revenue Collections Note: Return and collection figures for FY2007, FY2008, and FY2009 are unaudited.
Corporate Tax Returns (Thousands)
Net Corporate Tax Collections (Millions)
-
100
200
300
400
500
FY2005 FY2006 FY2007 FY2008 FY2009
$-
$300
$600
$900
$1,200
$1,500
FY2005 FY2006 FY2007 FY2008 FY2009

Taxp
ayer
Ser
vice
s D
ivis
ion
37
Georgia Department of Revenue | Statistical Report FY2009
Table 7FY2009 Motor Fuel and Motor Carrier Detailed Revenue Data
Gross Taxable Gallonage by Product (Thousands)
Gasoline 4,859,028
Diesel 1,396,810
Special Fuel 16,849
Aviation 5,649
Other: Propane (LPG) 4,575
Total Motor Fuel Gallons 6,282,911
Motor Fuel Collections by Product (Unaudited, Thousands)
Aviation 55$
Gasoline 351,135$
Special Fuel 770$
Diesel Operators - Bonded 99,733$
Other: (Undistributed by Fuel Type) 22,271$
Penalties and Interest 329$
Sub Total Motor Fuel Collections 474,293$
Less:
Expenses to Collect
Vendor Compensation -$
Refunds
Retail, Dealer and Agriculture (25,698)$
Total Expenses and Refunds (25,698)$
Motor Fuel Tax Revenue (Net of Commissions and Refunds) 448,595$
Prepaid Motor Fuel State Taxes
Prepaid Motor Fuel State Tax 422,826$
Motor Carrier Revenue
Motor Carrier Mileage Tax 12,331$
Adjustments (Motor Carrier Citations)
Total Motor Carrier Revenue 12,331$
Source: Alcohol and Tobacco Division, Georgia Department of Revenue and the State Accounting Office of Georgia

Taxpayer Services D
ivision
38
Georgia Department of Revenue | Statistical Report FY2009
Table 8Number of Individual Income Tax Returns Processed and Net Individual Income Tax Collections
FY2005 FY2006 FY2007 FY2008 FY2009
Number of Individual Returns Processed (Thousands) 3,816 3,861 4,084 4,360 2,721
Net Individual Income Tax Collections (Millions) 7,281$ 8,041$ 8,821$ 8,845$ 7,801$
Source: Processing Center and Accounting Unit, Finance Department, Georgia Department of Revenue - Monthly Press Release of Net Revenue Collections Note: Return and collection figures of FY2007, FY2008, and FY2009 are unaudited.
Number of Individual Returns Processed (Thousands)
Net Individual Income Tax Collections (Millions)
-
1,000
2,000
3,000
4,000
5,000
FY2005 FY2006 FY2007 FY2008 FY2009
$-
$2,000
$4,000
$6,000
$8,000
$10,000
FY2005 FY2006 FY2007 FY2008 FY2009

Taxp
ayer
Ser
vice
s D
ivis
ion
39
Georgia Department of Revenue | Statistical Report FY2009
Table 9Comparative Trends in Georgia's Individual Income and State Income Tax Receipts
FY2005 FY2006 FY2007 FY2008 FY2009
Total Individual Personal Income (i)
Amount (Millions) 284,216$ 300,891$ 318,950$ 329,555$ 326,970$
Change from Prior Year (%) 7.31% 5.87% 6.00% 3.32% -0.78%
Individual Income Tax Receipts
Net Amount (Thousands) 7,280,815$ 8,040,624$ 8,820,797$ 8,845,476$ 7,801,185$
Change from Prior Year (%) 7.31% 10.44% 9.70% 0.28% -11.81%
Income Elasticity Ratio (ii) 1.000 1.779 1.617 0.084 15.141
(i) Individual Income amounts are estimated figures that are restated every quarter.
A ratio of 1.0 would indicate an identical rate of change for income and tax yield.Source: Accounting Unit, Finance Department, Georgia Department of Revenue - Monthly Press Release of Net Revenue Collections and US Department of Commerce, Bureau of Economic Analysis, Released June 2009
(ii) The ratio is the percentage change in tax receipts to the percentage change in individual income. This measures the sensitivity of individual income tax revenue to changes in individual personal income.

Taxpayer Services D
ivision
40
Georgia Department of Revenue | Statistical Report FY2009
Table 10Growth Trend of Individual Income Tax (Thousands)
CY2003 CY2004 CY2005 CY2006 CY2007
Number of Returns 3,690 3,776 3,836 4,045 4,273
Adjusted Gross Income 153,771,193$ 165,421,204$ 172,975,112$ 193,127,039$ 202,746,898$
Taxable Net Income 112,028,551$ 122,448,097$ 129,060,396$ 144,979,006$ 151,026,391$
Tax Liability 6,104,844$ 6,712,680$ 7,100,396$ 8,026,610$ 8,373,271$
Annual Numerical Increase
Number of Returns 31 86 60 209 228
Adjusted Gross Income 4,566,472$ 11,650,011$ 7,553,908$ 20,151,927$ 9,619,859$
Taxable Net Income 3,751,867$ 10,419,546$ 6,612,299$ 15,918,610$ 6,047,385$
Tax Liability 224,952$ 607,836$ 387,716$ 926,214$ 346,661$
Annual Percentage Increase/Decrease
Number of Returns 0.85% 2.35% 1.57% 5.47% 5.64%
Adjusted Gross Income 3.06% 7.58% 4.57% 11.65% 4.98%
Taxable Net Income 3.47% 9.30% 5.40% 12.33% 4.17%
Tax Liability 3.83% 9.96% 5.78% 13.04% 4.32%
Source: Information Technology Division, Georgia Department of Revenue

Taxp
ayer
Ser
vice
s D
ivis
ion
41
Georgia Department of Revenue | Statistical Report FY2009
Table 11CY2007 Georgia Individual Income - Returns by Income Class
Georgia AGI Number of
Returns(Thousands)
Percent ofTotal Returns
NetTaxable Income
(Thousands)
Percent ofNet Taxable
Income
Average Net Taxable Income
(Thousands)
Total Tax (Thousands)
Over Million 9 0.21% $ 22,204,589 15% $ 2,487 $ 1,330,000
Over 500,000 17 0.39% $ 9,698,113 6% $ 579 $ 577,675
Over 100,000 392 9.18% $ 49,752,782 33% $ 127 $ 2,886,601
Over 50,000 700 16.38% $ 33,246,446 22% $ 48 $ 1,827,148
Over 30,000 649 15.19% $ 15,547,518 10% $ 24 $ 790,663
Over 25,000 244 5.71% $ 3,766,452 2% $ 16 $ 175,088
Over 20,000 277 6.47% $ 3,255,128 2% $ 12 $ 139,990
Over 15,000 306 7.16% $ 2,420,591 2% $ 8 $ 90,780
Over 14,000 65 1.51% $ 361,324 0% $ 6 $ 11,946
Over 13,000 64 1.50% $ 308,588 0% $ 5 $ 9,727
Over 12,000 70 1.63% $ 272,024 0% $ 4 $ 7,994
Over 11,000 71 1.67% $ 228,596 0% $ 3 $ 6,348
Over 10,000 65 1.52% $ 186,682 0% $ 3 $ 4,862
Over 9,000 67 1.56% $ 157,223 0% $ 2 $ 3,673
Over 8,000 80 1.88% $ 130,423 0% $ 2 $ 2,664
Over 7,000 69 1.62% $ 91,962 0% $ 1 $ 1,658
Over 6,000 69 1.60% $ 59,602 0% $ 1 $ 885
Over 5,000 70 1.65% $ 22,047 0% $ 0 $ 220
Over 4,000 71 1.65% $ 383 0% $ 0 $ 6
Over 3,000 73 1.70% $ 108 0% $ 0 $ 2
Over 2,000 68 1.58% $ 38 0% $ 0 $ 2
Over 1,000 63 1.48% $ 185 0% $ 0 $ 10
Under 1,000 716 16.75% $ 9,315,589 6% $ 13 $ 505,330
Totals 4,273 100.00% $ 151,026,391 100% $ 3,341 $ 8,373,271
*Note: Prior year returns filed during current year.Source: Information Technology Division, Georgia Department of Revenue, Reported October 8, 2009
Number of Return with no Net Taxable
Income
Percent of Total Returns
Average TaxableIncome
(Thousands)
Exemptions Title of Field Number of
Returns(Thousands)
Amount(Thousands)
14 0% $147,778 10 Federal AGI 4,181 $375,563
45 0% $ 34,385 20 ADJ to FED 803 $ (15,538)
666 0% $ 7,358 431 Georgia AGI 3,619 $202,747
3,322 0% $ 2,610 638 Itemized Deductions 1,578 $ 38,480
13,066 0% $ 1,218 554 Standard Deductions 2,330 $ 5,711
10,744 0% $ 718 235 Withheld 3,578 $ 7,968
17,807 0% $ 506 263 CR from EST 191 $ 1,602
29,951 1% $ 297 281 Low Income Credit 1,158 $ 29,606
7,673 0% $ 185 58 Total Credit 4,927 $ 9,601
10,339 0% $ 152 57 Taxpayer over 65 433
10,436 0% $ 115 65
10,653 0% $ 89 64
22,241 1% $ 75 47
20,532 0% $ 55 43
21,761 1% $ 33 51
31,680 1% $ 24 35
27,915 1% $ 13 29
27,103 1% $ 3 25
70,032 2% $ 0 22
72,361 2% $ 0 19
67,398 2% $ 0 15
63,211 1% $ 0 11
424,018 10% $ 706 300
962,968 23% $196,321 3,273

Taxpayer Services D
ivision
42
Georgia Department of Revenue | Statistical Report FY2009
CY2007 Georgia Individual Income - Returns by Income Class
Georgia AGI Number of
Returns(Thousands)
Percent ofTotal Returns
NetTaxable Income
(Thousands)
Percent ofNet Taxable
Income
Average Net Taxable Income
(Thousands)
Total Tax (Thousands)
Over Million 9 0.21% $ 22,204,589 15% $ 2,487 $ 1,330,000
Over 500,000 17 0.39% $ 9,698,113 6% $ 579 $ 577,675
Over 100,000 392 9.18% $ 49,752,782 33% $ 127 $ 2,886,601
Over 50,000 700 16.38% $ 33,246,446 22% $ 48 $ 1,827,148
Over 30,000 649 15.19% $ 15,547,518 10% $ 24 $ 790,663
Over 25,000 244 5.71% $ 3,766,452 2% $ 16 $ 175,088
Over 20,000 277 6.47% $ 3,255,128 2% $ 12 $ 139,990
Over 15,000 306 7.16% $ 2,420,591 2% $ 8 $ 90,780
Over 14,000 65 1.51% $ 361,324 0% $ 6 $ 11,946
Over 13,000 64 1.50% $ 308,588 0% $ 5 $ 9,727
Over 12,000 70 1.63% $ 272,024 0% $ 4 $ 7,994
Over 11,000 71 1.67% $ 228,596 0% $ 3 $ 6,348
Over 10,000 65 1.52% $ 186,682 0% $ 3 $ 4,862
Over 9,000 67 1.56% $ 157,223 0% $ 2 $ 3,673
Over 8,000 80 1.88% $ 130,423 0% $ 2 $ 2,664
Over 7,000 69 1.62% $ 91,962 0% $ 1 $ 1,658
Over 6,000 69 1.60% $ 59,602 0% $ 1 $ 885
Over 5,000 70 1.65% $ 22,047 0% $ 0 $ 220
Over 4,000 71 1.65% $ 383 0% $ 0 $ 6
Over 3,000 73 1.70% $ 108 0% $ 0 $ 2
Over 2,000 68 1.58% $ 38 0% $ 0 $ 2
Over 1,000 63 1.48% $ 185 0% $ 0 $ 10
Under 1,000 716 16.75% $ 9,315,589 6% $ 13 $ 505,330
Totals 4,273 100.00% $ 151,026,391 100% $ 3,341 $ 8,373,271
*Note: Prior year returns filed during current year.Source: Information Technology Division, Georgia Department of Revenue, Reported October 8, 2009
Number of Returns with
no Net Taxable Income
Percent of Total Returns Average Tax Exemptions Title of Field
Number of Returns
(Thousands)
Amount(Thousands)
14 0% $147,778 10 Federal AGI 4,181 $375,563
45 0% $ 34,385 20 ADJ to FED 803 $ (15,538)
666 0% $ 7,358 431 Georgia AGI 3,619 $202,747
3,322 0% $ 2,610 638 Itemized Deductions 1,578 $ 38,480
13,066 0% $ 1,218 554 Standard Deductions 2,330 $ 5,711
10,744 0% $ 718 235 Withheld 3,578 $ 7,968
17,807 0% $ 506 263 CR from EST 191 $ 1,602
29,951 1% $ 297 281 Low Income Credit 1,158 $ 29,606
7,673 0% $ 185 58 Total Credit 4,927 $ 9,601
10,339 0% $ 152 57 Taxpayer over 65 433
10,436 0% $ 115 65
10,653 0% $ 89 64
22,241 1% $ 75 47
20,532 0% $ 55 43
21,761 1% $ 33 51
31,680 1% $ 24 35
27,915 1% $ 13 29
27,103 1% $ 3 25
70,032 2% $ 0 22
72,361 2% $ 0 19
67,398 2% $ 0 15
63,211 1% $ 0 11
424,018 10% $ 706 300
962,968 23% $196,321 3,273
*Returns Receivedfor Other Years
Number of Returns
(Thousands)
Amount(Thousands)
Total Returns 169
Total Tax 45 $318,858
Total Withheld 123 $213,979
Other Penalty 10 $ 800
Filing Status Resident Returns
(Thousands)
Non-ResidentReturns
(Thousands)
Totals(Thousands)
Head of Household 831 31 862
MarriedFiling Joint 1,462 141 1,603
MarriedFiling Separate 81 18 99
Single 1,607 102 1,709
Total 3,981 292 4,273

Taxp
ayer
Ser
vice
s D
ivis
ion
43
Georgia Department of Revenue | Statistical Report FY2009
Table 12
Table 13
Georgia, Southeast and United States Per Capita Income (Thousands)
CY2004 CY2005 CY2006 CY2007 CY2008
9.92aigroeG 31.3 33.2 33.4 34.0
6.92tsaehtuoS 31.1 32.0 34.8 35.7
34.7 36.6 38.6 40.0
Source: U.S. Department of Commerce, Bureau of Economic Analysis, Released March 2009
-
10.0
20.0
30.0
40.0
50.0
CY2004 CY2005 CY2006 CY2007 CY2008
Per Capita Individual Income Percent Increase Comparison by Five Years Periods
CY1988 toCY1992
CY1992 toCY1996
CY1996 toCY2000
CY2000 toCY2004
CY2004 to CY2008
21.20% 20.29% 21.99% 6.19% 14.31%
22.28% 17.27% 20.91% 13.16% 19.14%
20.33% 15.93% 23.46% 11.09% 19.89%
Source: US Department of Commerce, Bureau of Economic Analysis, Released March 2009
0.00%
10.00%
20.00%
30.00%
40.00%
50.00%
CY1988 toCY1992
CY1992 toCY1996
CY1996 toCY2000
CY2000 toCY2004
CY2004 toCY2008
Georgia
Southeast
United States

Taxpayer Services D
ivision
44
Georgia Department of Revenue | Statistical Report FY2009
Table 14
Table 15
Georgia, Southeast Total Individual Income as a Percentage of United States
CY2004 CY2005 CY2006 CY2007 CY2008
%7.2%7.2%8.2%7.2aigroeG 2.7%
%7.22%7.22%6.22%5.22tsaehtuoS 22.6%
Source: U.S. Department of Commerce, Bureau of Economic Analysis, Released March 2009
0.0%
10.0%
20.0%
30.0%
40.0%
50.0%
CY2004 CY2005 CY2006 CY2007 CY2008
Total Individual Income Percent Increase Comparison by Five Years Periods
CY1988 toCY1992
CY1992 toCY1996
CY1996 toCY2000
CY2000 toCY2004
CY2004 to CY2008
Georgia 30.8% 32.4% 33.8% 15.0% 24.2%
Southeast 29.4% 25.1% 28.1% 18.7% 25.3%
United States 26.2% 21.7% 29.3% 15.3% 24.5%
Source: US Department of Commerce, Bureau of Economic Analysis, Released March 2009
0.0%
10.0%
20.0%
30.0%
40.0%
50.0%
CY1988 toCY1992
CY1992 toCY1996
CY1996 toCY2000
CY2000 toCY2004
CY2004 toCY2008

Taxp
ayer
Ser
vice
s D
ivis
ion
45
Georgia Department of Revenue | Statistical Report FY2009
Table 16CY2007 Individual Income Tax Data by County of Residence
Adjusted Gross Income Less Deficit
Total Per 100 Residents Total(Thousands)
Appling 17,902 7,058 39 $ 221,390
Atkinson 8,156 2,974 36 $ 77,877
Bacon 10,483 4,177 40 $ 124,272
Baker 3,774 1,333 35 $ 39,886
Baldwin 46,359 16,979 37 $ 576,288
Banks 16,518 7,483 45 $ 271,148
Barrow 66,928 27,680 41 $ 1,142,947
Bartow 92,561 41,186 44 $ 1,677,428
Ben Hill 17,659 6,954 39 $ 218,346
Berrien 16,692 6,904 41 $ 213,735
Bibb 154,806 66,478 43 $ 2,703,573
Bleckley 12,642 4,880 39 $ 171,919
Brantley 15,417 6,349 41 $ 192,119
Brooks 16,324 6,229 38 $ 175,095
Bryan 29,991 12,399 41 $ 632,604
Bulloch 66,184 23,398 35 $ 878,706
Burke 22,714 9,518 42 $ 295,414
Butts 23,658 9,321 39 $ 335,093
Calhoun 6,082 2,029 33 $ 61,089
Camden 47,109 16,989 36 $ 617,134
Candler 10,488 4,110 39 $ 126,659
Carroll 111,845 43,718 39 $ 1,825,338
Catoosa 62,120 24,412 39 $ 940,240
Charlton 10,613 3,463 33 $ 108,695
County 2007 Population Estimates
Number of Returns Tabulated Adjusted Gross Income Less Deficit
Average Per Returns (Actual)
Total(Thousands) Average Per Returns
$ 31,367 $ 143,050 $ 7,516 $ 1,065 116
$ 26,186 $ 48,517 $ 2,445 $ 822 139
$ 29,751 $ 80,748 $ 4,224 $ 1,011 128
$ 29,922 $ 27,047 $ 1,416 $ 1,062 125
$ 33,941 $ 375,470 $ 19,895 $ 1,172 96
$ 36,235 $ 180,680 $ 9,647 $ 1,289 405
$ 41,291 $ 759,060 $ 40,866 $ 1,476 402
$ 40,728 $ 1,099,943 $ 59,320 $ 1,440 273
$ 31,399 $ 147,025 $ 7,763 $ 1,116 97
$ 30,958 $ 144,992 $ 7,681 $ 1,112 135
$ 40,669 $ 1,864,424 $ 101,949 $ 1,534 80
$ 35,229 $ 118,990 $ 6,386 $ 1,308 114
$ 30,260 $ 128,125 $ 6,711 $ 1,057 243
$ 28,110 $ 115,361 $ 6,008 $ 964 169
$ 51,021 $ 452,132 $ 25,001 $ 2,016 493
$ 37,555 $ 596,435 $ 32,233 $ 1,378 253
$ 31,037 $ 194,127 $ 10,202 $ 1,072 137
$ 35,950 $ 210,647 $ 11,170 $ 1,198 220
$ 30,108 $ 39,485 $ 2,051 $ 1,011 93
$ 36,325 $ 423,610 $ 22,621 $ 1,332 347
$ 30,817 $ 82,814 $ 4,382 $ 1,066 187
$ 41,753 $ 1,263,069 $ 68,745 $ 1,572 217
$ 38,515 $ 654,806 $ 35,262 $ 1,444 240
$ 31,387 $ 72,827 $ 3,826 $ 1,105 156
Total AGI GrowthIndex 1987=100
Net Taxable Income (Thousands)
Amount of Tax Liability

Taxpayer Services D
ivision
46
Georgia Department of Revenue | Statistical Report FY2009
CY2007 Individual Income Tax Data by County of Residence
Adjusted Gross Income Less Deficit
Total Per 100 Residents Total(Thousands)
Appling 17,902 7,058 39 $ 221,390
Atkinson 8,156 2,974 36 $ 77,877
Bacon 10,483 4,177 40 $ 124,272
Baker 3,774 1,333 35 $ 39,886
Baldwin 46,359 16,979 37 $ 576,288
Banks 16,518 7,483 45 $ 271,148
Barrow 66,928 27,680 41 $ 1,142,947
Bartow 92,561 41,186 44 $ 1,677,428
Ben Hill 17,659 6,954 39 $ 218,346
Berrien 16,692 6,904 41 $ 213,735
Bibb 154,806 66,478 43 $ 2,703,573
Bleckley 12,642 4,880 39 $ 171,919
Brantley 15,417 6,349 41 $ 192,119
Brooks 16,324 6,229 38 $ 175,095
Bryan 29,991 12,399 41 $ 632,604
Bulloch 66,184 23,398 35 $ 878,706
Burke 22,714 9,518 42 $ 295,414
Butts 23,658 9,321 39 $ 335,093
Calhoun 6,082 2,029 33 $ 61,089
Camden 47,109 16,989 36 $ 617,134
Candler 10,488 4,110 39 $ 126,659
Carroll 111,845 43,718 39 $ 1,825,338
Catoosa 62,120 24,412 39 $ 940,240
Charlton 10,613 3,463 33 $ 108,695
County 2007 Population Estimates
Number of Returns Tabulated Adjusted Gross Income Less Deficit
Average Per Returns (Actual)
Total(Thousands) Average Per Returns
$ 31,367 $ 143,050 $ 7,516 $ 1,065 116
$ 26,186 $ 48,517 $ 2,445 $ 822 139
$ 29,751 $ 80,748 $ 4,224 $ 1,011 128
$ 29,922 $ 27,047 $ 1,416 $ 1,062 125
$ 33,941 $ 375,470 $ 19,895 $ 1,172 96
$ 36,235 $ 180,680 $ 9,647 $ 1,289 405
$ 41,291 $ 759,060 $ 40,866 $ 1,476 402
$ 40,728 $ 1,099,943 $ 59,320 $ 1,440 273
$ 31,399 $ 147,025 $ 7,763 $ 1,116 97
$ 30,958 $ 144,992 $ 7,681 $ 1,112 135
$ 40,669 $ 1,864,424 $ 101,949 $ 1,534 80
$ 35,229 $ 118,990 $ 6,386 $ 1,308 114
$ 30,260 $ 128,125 $ 6,711 $ 1,057 243
$ 28,110 $ 115,361 $ 6,008 $ 964 169
$ 51,021 $ 452,132 $ 25,001 $ 2,016 493
$ 37,555 $ 596,435 $ 32,233 $ 1,378 253
$ 31,037 $ 194,127 $ 10,202 $ 1,072 137
$ 35,950 $ 210,647 $ 11,170 $ 1,198 220
$ 30,108 $ 39,485 $ 2,051 $ 1,011 93
$ 36,325 $ 423,610 $ 22,621 $ 1,332 347
$ 30,817 $ 82,814 $ 4,382 $ 1,066 187
$ 41,753 $ 1,263,069 $ 68,745 $ 1,572 217
$ 38,515 $ 654,806 $ 35,262 $ 1,444 240
$ 31,387 $ 72,827 $ 3,826 $ 1,105 156
Total AGI GrowthIndex 1987=100
Net Taxable Income (Thousands)
Amount of Tax Liability
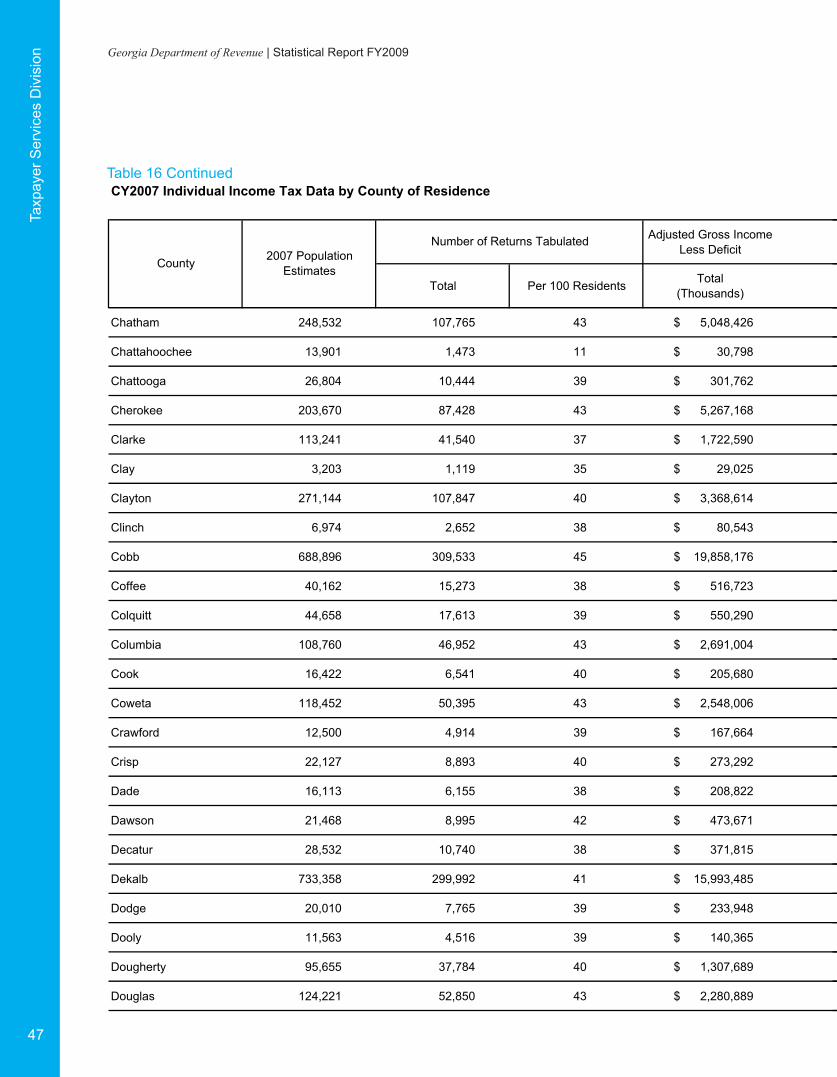
Taxp
ayer
Ser
vice
s D
ivis
ion
47
Georgia Department of Revenue | Statistical Report FY2009
Table 16 ContinuedCY2007 Individual Income Tax Data by County of Residence
Adjusted Gross Income Less Deficit
Total Per 100 Residents Total(Thousands)
County 2007 Population Estimates
Number of Returns Tabulated
Chatham 248,532 107,765 43 $ 5,048,426
Chattahoochee 13,901 1,473 11 $ 30,798
Chattooga 26,804 10,444 39 $ 301,762
Cherokee 203,670 87,428 43 $ 5,267,168
Clarke 113,241 41,540 37 $ 1,722,590
Clay 3,203 1,119 35 $ 29,025
Clayton 271,144 107,847 40 $ 3,368,614
Clinch 6,974 2,652 38 $ 80,543
Cobb 688,896 309,533 45 $ 19,858,176
Coffee 40,162 15,273 38 $ 516,723
Colquitt 44,658 17,613 39 $ 550,290
Columbia 108,760 46,952 43 $ 2,691,004
Cook 16,422 6,541 40 $ 205,680
Coweta 118,452 50,395 43 $ 2,548,006
Crawford 12,500 4,914 39 $ 167,664
Crisp 22,127 8,893 40 $ 273,292
Dade 16,113 6,155 38 $ 208,822
Dawson 21,468 8,995 42 $ 473,671
Decatur 28,532 10,740 38 $ 371,815
Dekalb 733,358 299,992 41 $ 15,993,485
Dodge 20,010 7,765 39 $ 233,948
Dooly 11,563 4,516 39 $ 140,365
Dougherty 95,655 37,784 40 $ 1,307,689
Douglas 124,221 52,850 43 $ 2,280,889
Adjusted Gross Income Less Deficit
Average Per Returns (Actual)
Total(Thousands) Average Per Returns
Total AGI GrowthIndex 1987=100
Net Taxable Income (Thousands)
Amount of Tax Liability
$ 46,847 $ 3,647,402 $ 201,973 $ 1,874 167
$ 20,908 $ 20,856 $ 1,038 $ 704 79
$ 28,893 $ 202,568 $ 10,539 $ 1,009 90
$ 60,246 $ 3,715,279 $ 207,490 $ 2,373 562
$ 41,468 $ 1,236,443 $ 67,733 $ 1,631 154
$ 25,938 $ 18,042 $ 922 $ 824 110
$ 31,235 $ 1,968,835 $ 100,818 $ 935 95
$ 30,370 $ 52,972 $ 2,782 $ 1,049 122
$ 64,155 $ 14,730,185 $ 832,870 $ 2,691 251
$ 33,832 $ 350,613 $ 18,721 $ 1,226 184
$ 31,243 $ 364,425 $ 19,242 $ 1,092 138
$ 57,314 $ 1,976,310 $ 110,457 $ 2,353 374
$ 31,445 $ 135,998 $ 7,136 $ 1,091 146
$ 50,561 $ 1,762,502 $ 97,024 $ 1,925 431
$ 34,120 $ 110,259 $ 5,816 $ 1,184 254
$ 30,731 $ 178,432 $ 9,441 $ 1,062 124
$ 33,927 $ 145,794 $ 7,770 $ 1,262 219
$ 52,659 $ 327,027 $ 18,135 $ 2,016 542
$ 34,620 $ 243,533 $ 12,986 $ 1,209 146
$ 53,313 $ 11,485,340 $ 639,800 $ 2,133 163
$ 30,129 $ 155,048 $ 8,158 $ 1,051 128
$ 31,082 $ 93,293 $ 4,912 $ 1,088 148
$ 34,610 $ 860,107 $ 46,011 $ 1,218 66
$ 43,158 $ 1,505,111 $ 81,378 $ 1,540 229

Taxpayer Services D
ivision
48
Georgia Department of Revenue | Statistical Report FY2009
CY2007 Individual Income Tax Data by County of Residence
Adjusted Gross Income Less Deficit
Total Per 100 Residents Total(Thousands)
County 2007 Population Estimates
Number of Returns Tabulated
Chatham 248,532 107,765 43 $ 5,048,426
Chattahoochee 13,901 1,473 11 $ 30,798
Chattooga 26,804 10,444 39 $ 301,762
Cherokee 203,670 87,428 43 $ 5,267,168
Clarke 113,241 41,540 37 $ 1,722,590
Clay 3,203 1,119 35 $ 29,025
Clayton 271,144 107,847 40 $ 3,368,614
Clinch 6,974 2,652 38 $ 80,543
Cobb 688,896 309,533 45 $ 19,858,176
Coffee 40,162 15,273 38 $ 516,723
Colquitt 44,658 17,613 39 $ 550,290
Columbia 108,760 46,952 43 $ 2,691,004
Cook 16,422 6,541 40 $ 205,680
Coweta 118,452 50,395 43 $ 2,548,006
Crawford 12,500 4,914 39 $ 167,664
Crisp 22,127 8,893 40 $ 273,292
Dade 16,113 6,155 38 $ 208,822
Dawson 21,468 8,995 42 $ 473,671
Decatur 28,532 10,740 38 $ 371,815
Dekalb 733,358 299,992 41 $ 15,993,485
Dodge 20,010 7,765 39 $ 233,948
Dooly 11,563 4,516 39 $ 140,365
Dougherty 95,655 37,784 40 $ 1,307,689
Douglas 124,221 52,850 43 $ 2,280,889
Adjusted Gross Income Less Deficit
Average Per Returns (Actual)
Total(Thousands) Average Per Returns
Total AGI GrowthIndex 1987=100
Net Taxable Income (Thousands)
Amount of Tax Liability
$ 46,847 $ 3,647,402 $ 201,973 $ 1,874 167
$ 20,908 $ 20,856 $ 1,038 $ 704 79
$ 28,893 $ 202,568 $ 10,539 $ 1,009 90
$ 60,246 $ 3,715,279 $ 207,490 $ 2,373 562
$ 41,468 $ 1,236,443 $ 67,733 $ 1,631 154
$ 25,938 $ 18,042 $ 922 $ 824 110
$ 31,235 $ 1,968,835 $ 100,818 $ 935 95
$ 30,370 $ 52,972 $ 2,782 $ 1,049 122
$ 64,155 $ 14,730,185 $ 832,870 $ 2,691 251
$ 33,832 $ 350,613 $ 18,721 $ 1,226 184
$ 31,243 $ 364,425 $ 19,242 $ 1,092 138
$ 57,314 $ 1,976,310 $ 110,457 $ 2,353 374
$ 31,445 $ 135,998 $ 7,136 $ 1,091 146
$ 50,561 $ 1,762,502 $ 97,024 $ 1,925 431
$ 34,120 $ 110,259 $ 5,816 $ 1,184 254
$ 30,731 $ 178,432 $ 9,441 $ 1,062 124
$ 33,927 $ 145,794 $ 7,770 $ 1,262 219
$ 52,659 $ 327,027 $ 18,135 $ 2,016 542
$ 34,620 $ 243,533 $ 12,986 $ 1,209 146
$ 53,313 $ 11,485,340 $ 639,800 $ 2,133 163
$ 30,129 $ 155,048 $ 8,158 $ 1,051 128
$ 31,082 $ 93,293 $ 4,912 $ 1,088 148
$ 34,610 $ 860,107 $ 46,011 $ 1,218 66
$ 43,158 $ 1,505,111 $ 81,378 $ 1,540 229

Taxp
ayer
Ser
vice
s D
ivis
ion
49
Georgia Department of Revenue | Statistical Report FY2009
Table 16 ContinuedCY2007 Individual Income Tax Data by County of Residence
Adjusted Gross Income Less Deficit
Total Per 100 Residents Total(Thousands)
County 2007 Population Estimates
Number of Returns Tabulated
Early 11,828 4,467 38 $ 145,516
Echols 4,061 1,184 29 $ 35,659
Effingham 50,784 20,555 40 $ 924,203
Elbert 20,520 9,167 45 $ 278,446
Emanuel 22,388 9,317 42 $ 256,555
Evans 11,436 4,344 38 $ 156,222
Fannin 22,504 9,459 42 $ 315,026
Fayette 105,810 46,291 44 $ 3,389,456
Floyd 95,364 39,719 42 $ 1,558,541
Forsyth 158,111 62,750 40 $ 5,121,534
Franklin 21,793 9,781 45 $ 297,206
Fulton 992,472 389,077 39 $ 34,464,998
Gilmer 28,310 11,117 39 $ 413,724
Glascock 2,761 1,085 39 $ 34,324
Glynn 74,666 34,031 46 $ 1,817,408
Gordon 51,820 22,656 44 $ 812,997
Grady 24,917 8,940 36 $ 299,629
Greene 15,643 6,978 45 $ 421,670
Gwinnett 771,466 324,463 42 $ 17,517,109
Habersham 42,129 17,033 40 $ 631,632
Hall 178,620 75,874 42 $ 3,796,160
Hancock 9,558 3,472 36 $ 93,294
Haralson 28,735 11,726 41 $ 423,441
Harris 29,014 12,337 43 $ 693,453
Adjusted Gross Income Less Deficit
Average Per Returns (Actual)
Total(Thousands) Average Per Returns
Total AGI GrowthIndex 1987=100
Net Taxable Income (Thousands)
Amount of Tax Liability
$ 32,576 $ 100,168 $ 5,362 $ 1,200 98
$ 30,117 $ 23,586 $ 1,229 $ 1,038 323
$ 44,962 $ 629,893 $ 34,210 $ 1,664 446
$ 30,375 $ 185,940 $ 9,820 $ 1,071 105
$ 27,536 $ 160,784 $ 8,321 $ 893 112
$ 35,963 $ 108,934 $ 5,887 $ 1,355 184
$ 33,304 $ 207,389 $ 11,183 $ 1,182 239
$ 73,221 $ 2,464,209 $ 140,010 $ 3,025 365
$ 39,239 $ 1,069,170 $ 58,062 $ 1,462 115
$ 81,618 $ 3,819,151 $ 217,636 $ 3,468 1,212
$ 30,386 $ 196,016 $ 10,389 $ 1,062 143
$ 88,581 $ 26,988,106 $ 1,555,605 $ 3,998 300
$ 37,215 $ 277,489 $ 15,004 $ 1,350 333
$ 31,635 $ 22,301 $ 1,169 $ 1,078 111
$ 53,404 $ 1,314,769 $ 73,619 $ 2,163 223
$ 35,884 $ 533,511 $ 28,328 $ 1,250 173
$ 33,516 $ 201,871 $ 10,748 $ 1,202 168
$ 60,428 $ 319,160 $ 18,091 $ 2,592 420
$ 53,988 $ 12,108,104 $ 671,571 $ 2,070 343
$ 37,083 $ 430,671 $ 23,197 $ 1,362 190
$ 50,032 $ 2,601,520 $ 143,381 $ 1,890 315
$ 26,870 $ 54,704 $ 2,747 $ 791 104
$ 36,111 $ 284,440 $ 15,279 $ 1,303 174
$ 56,209 $ 488,496 $ 27,228 $ 2,207 415

Taxpayer Services D
ivision
50
Georgia Department of Revenue | Statistical Report FY2009
CY2007 Individual Income Tax Data by County of Residence
Adjusted Gross Income Less Deficit
Total Per 100 Residents Total(Thousands)
County 2007 Population Estimates
Number of Returns Tabulated
Early 11,828 4,467 38 $ 145,516
Echols 4,061 1,184 29 $ 35,659
Effingham 50,784 20,555 40 $ 924,203
Elbert 20,520 9,167 45 $ 278,446
Emanuel 22,388 9,317 42 $ 256,555
Evans 11,436 4,344 38 $ 156,222
Fannin 22,504 9,459 42 $ 315,026
Fayette 105,810 46,291 44 $ 3,389,456
Floyd 95,364 39,719 42 $ 1,558,541
Forsyth 158,111 62,750 40 $ 5,121,534
Franklin 21,793 9,781 45 $ 297,206
Fulton 992,472 389,077 39 $ 34,464,998
Gilmer 28,310 11,117 39 $ 413,724
Glascock 2,761 1,085 39 $ 34,324
Glynn 74,666 34,031 46 $ 1,817,408
Gordon 51,820 22,656 44 $ 812,997
Grady 24,917 8,940 36 $ 299,629
Greene 15,643 6,978 45 $ 421,670
Gwinnett 771,466 324,463 42 $ 17,517,109
Habersham 42,129 17,033 40 $ 631,632
Hall 178,620 75,874 42 $ 3,796,160
Hancock 9,558 3,472 36 $ 93,294
Haralson 28,735 11,726 41 $ 423,441
Harris 29,014 12,337 43 $ 693,453
Adjusted Gross Income Less Deficit
Average Per Returns (Actual)
Total(Thousands) Average Per Returns
Total AGI GrowthIndex 1987=100
Net Taxable Income (Thousands)
Amount of Tax Liability
$ 32,576 $ 100,168 $ 5,362 $ 1,200 98
$ 30,117 $ 23,586 $ 1,229 $ 1,038 323
$ 44,962 $ 629,893 $ 34,210 $ 1,664 446
$ 30,375 $ 185,940 $ 9,820 $ 1,071 105
$ 27,536 $ 160,784 $ 8,321 $ 893 112
$ 35,963 $ 108,934 $ 5,887 $ 1,355 184
$ 33,304 $ 207,389 $ 11,183 $ 1,182 239
$ 73,221 $ 2,464,209 $ 140,010 $ 3,025 365
$ 39,239 $ 1,069,170 $ 58,062 $ 1,462 115
$ 81,618 $ 3,819,151 $ 217,636 $ 3,468 1,212
$ 30,386 $ 196,016 $ 10,389 $ 1,062 143
$ 88,581 $ 26,988,106 $ 1,555,605 $ 3,998 300
$ 37,215 $ 277,489 $ 15,004 $ 1,350 333
$ 31,635 $ 22,301 $ 1,169 $ 1,078 111
$ 53,404 $ 1,314,769 $ 73,619 $ 2,163 223
$ 35,884 $ 533,511 $ 28,328 $ 1,250 173
$ 33,516 $ 201,871 $ 10,748 $ 1,202 168
$ 60,428 $ 319,160 $ 18,091 $ 2,592 420
$ 53,988 $ 12,108,104 $ 671,571 $ 2,070 343
$ 37,083 $ 430,671 $ 23,197 $ 1,362 190
$ 50,032 $ 2,601,520 $ 143,381 $ 1,890 315
$ 26,870 $ 54,704 $ 2,747 $ 791 104
$ 36,111 $ 284,440 $ 15,279 $ 1,303 174
$ 56,209 $ 488,496 $ 27,228 $ 2,207 415
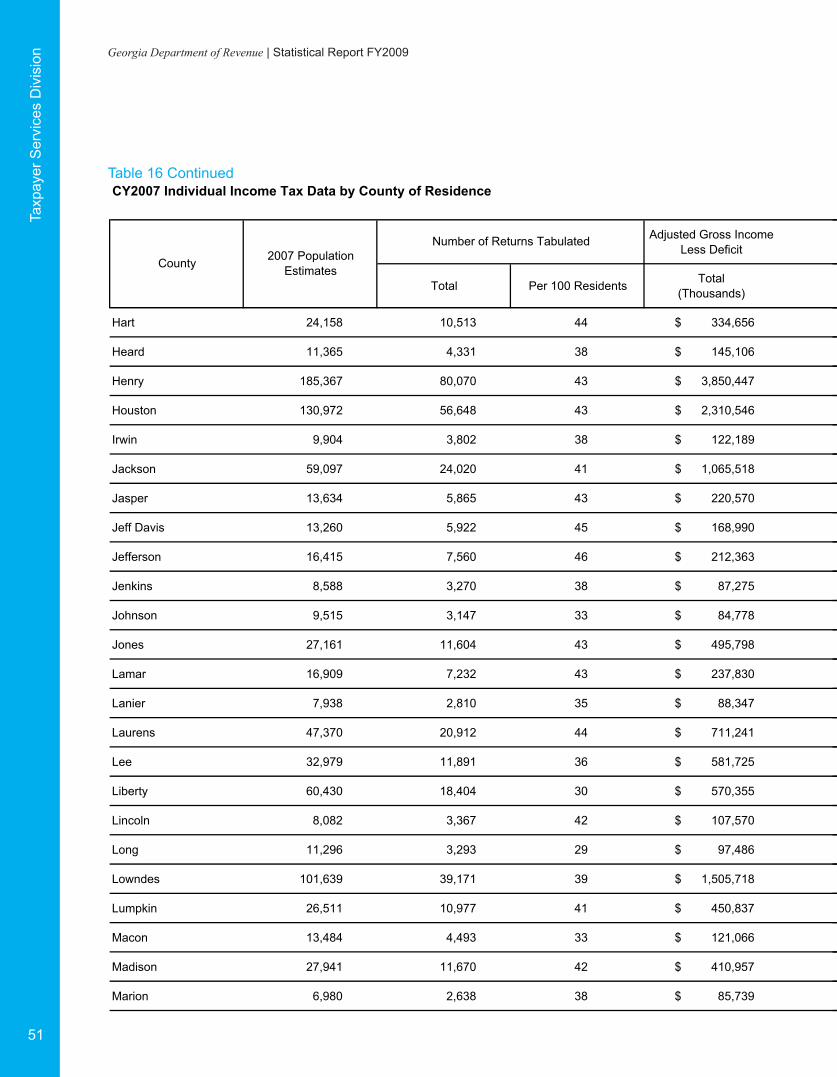
Taxp
ayer
Ser
vice
s D
ivis
ion
51
Georgia Department of Revenue | Statistical Report FY2009
Table 16 ContinuedCY2007 Individual Income Tax Data by County of Residence
Adjusted Gross Income Less Deficit
Total Per 100 Residents Total(Thousands)
County 2007 Population Estimates
Number of Returns Tabulated
Hart 24,158 10,513 44 $ 334,656
Heard 11,365 4,331 38 $ 145,106
Henry 185,367 80,070 43 $ 3,850,447
Houston 130,972 56,648 43 $ 2,310,546
Irwin 9,904 3,802 38 $ 122,189
Jackson 59,097 24,020 41 $ 1,065,518
Jasper 13,634 5,865 43 $ 220,570
Jeff Davis 13,260 5,922 45 $ 168,990
Jefferson 16,415 7,560 46 $ 212,363
Jenkins 8,588 3,270 38 $ 87,275
Johnson 9,515 3,147 33 $ 84,778
Jones 27,161 11,604 43 $ 495,798
Lamar 16,909 7,232 43 $ 237,830
Lanier 7,938 2,810 35 $ 88,347
Laurens 47,370 20,912 44 $ 711,241
Lee 32,979 11,891 36 $ 581,725
Liberty 60,430 18,404 30 $ 570,355
Lincoln 8,082 3,367 42 $ 107,570
Long 11,296 3,293 29 $ 97,486
Lowndes 101,639 39,171 39 $ 1,505,718
Lumpkin 26,511 10,977 41 $ 450,837
Macon 13,484 4,493 33 $ 121,066
Madison 27,941 11,670 42 $ 410,957
Marion 6,980 2,638 38 $ 85,739
Adjusted Gross Income Less Deficit
Average Per Returns (Actual)
Total(Thousands) Average Per Returns
Total AGI GrowthIndex 1987=100
Net Taxable Income (Thousands)
Amount of Tax Liability
$ 31,833 $ 224,369 $ 11,963 $ 1,138 152
$ 33,504 $ 94,855 $ 5,008 $ 1,156 821
$ 48,089 $ 2,506,916 $ 136,673 $ 1,707 586
$ 40,788 $ 1,619,944 $ 87,845 $ 1,551 198
$ 32,138 $ 82,503 $ 4,353 $ 1,145 168
$ 44,360 $ 712,666 $ 38,740 $ 1,613 392
$ 37,608 $ 140,285 $ 7,476 $ 1,275 277
$ 28,536 $ 108,168 $ 5,627 $ 950 101
$ 28,090 $ 132,388 $ 6,808 $ 900 90
$ 26,690 $ 54,612 $ 2,801 $ 857 94
$ 26,939 $ 53,160 $ 2,725 $ 866 74
$ 42,726 $ 331,748 $ 17,960 $ 1,548 249
$ 32,886 $ 152,914 $ 8,072 $ 1,116 164
$ 31,440 $ 58,023 $ 3,066 $ 1,091 202
$ 34,011 $ 474,749 $ 25,344 $ 1,212 143
$ 48,921 $ 403,309 $ 22,078 $ 1,857 443
$ 30,991 $ 376,494 $ 19,714 $ 1,071 304
$ 31,948 $ 71,259 $ 3,784 $ 1,124 136
$ 29,604 $ 62,168 $ 3,210 $ 975 326
$ 38,440 $ 1,044,855 $ 56,712 $ 1,448 192
$ 41,071 $ 308,239 $ 16,770 $ 1,528 420
$ 26,945 $ 77,452 $ 3,988 $ 888 62
$ 35,215 $ 274,953 $ 14,654 $ 1,256 173
$ 32,501 $ 57,119 $ 2,998 $ 1,136 183

Taxpayer Services D
ivision
52
Georgia Department of Revenue | Statistical Report FY2009
CY2007 Individual Income Tax Data by County of Residence
Adjusted Gross Income Less Deficit
Total Per 100 Residents Total(Thousands)
County 2007 Population Estimates
Number of Returns Tabulated
Hart 24,158 10,513 44 $ 334,656
Heard 11,365 4,331 38 $ 145,106
Henry 185,367 80,070 43 $ 3,850,447
Houston 130,972 56,648 43 $ 2,310,546
Irwin 9,904 3,802 38 $ 122,189
Jackson 59,097 24,020 41 $ 1,065,518
Jasper 13,634 5,865 43 $ 220,570
Jeff Davis 13,260 5,922 45 $ 168,990
Jefferson 16,415 7,560 46 $ 212,363
Jenkins 8,588 3,270 38 $ 87,275
Johnson 9,515 3,147 33 $ 84,778
Jones 27,161 11,604 43 $ 495,798
Lamar 16,909 7,232 43 $ 237,830
Lanier 7,938 2,810 35 $ 88,347
Laurens 47,370 20,912 44 $ 711,241
Lee 32,979 11,891 36 $ 581,725
Liberty 60,430 18,404 30 $ 570,355
Lincoln 8,082 3,367 42 $ 107,570
Long 11,296 3,293 29 $ 97,486
Lowndes 101,639 39,171 39 $ 1,505,718
Lumpkins 26,511 10,977 41 $ 450,837
Macon 13,484 4,493 33 $ 121,066
Madison 27,941 11,670 42 $ 410,957
Marion 6,980 2,638 38 $ 85,739
Adjusted Gross Income Less Deficit
Average Per Returns (Actual)
Total(Thousands) Average Per Returns
Total AGI GrowthIndex 1987=100
Net Taxable Income (Thousands)
Amount of Tax Liability
$ 31,833 $ 224,369 $ 11,963 $ 1,138 152
$ 33,504 $ 94,855 $ 5,008 $ 1,156 821
$ 48,089 $ 2,506,916 $ 136,673 $ 1,707 586
$ 40,788 $ 1,619,944 $ 87,845 $ 1,551 198
$ 32,138 $ 82,503 $ 4,353 $ 1,145 168
$ 44,360 $ 712,666 $ 38,740 $ 1,613 392
$ 37,608 $ 140,285 $ 7,476 $ 1,275 277
$ 28,536 $ 108,168 $ 5,627 $ 950 101
$ 28,090 $ 132,388 $ 6,808 $ 900 90
$ 26,690 $ 54,612 $ 2,801 $ 857 94
$ 26,939 $ 53,160 $ 2,725 $ 866 74
$ 42,726 $ 331,748 $ 17,960 $ 1,548 249
$ 32,886 $ 152,914 $ 8,072 $ 1,116 164
$ 31,440 $ 58,023 $ 3,066 $ 1,091 202
$ 34,011 $ 474,749 $ 25,344 $ 1,212 143
$ 48,921 $ 403,309 $ 22,078 $ 1,857 443
$ 30,991 $ 376,494 $ 19,714 $ 1,071 304
$ 31,948 $ 71,259 $ 3,784 $ 1,124 136
$ 29,604 $ 62,168 $ 3,210 $ 975 326
$ 38,440 $ 1,044,855 $ 56,712 $ 1,448 192
$ 41,071 $ 308,239 $ 16,770 $ 1,528 420
$ 26,945 $ 77,452 $ 3,988 $ 888 62
$ 35,215 $ 274,953 $ 14,654 $ 1,256 173
$ 32,501 $ 57,119 $ 2,998 $ 1,136 183

Taxp
ayer
Ser
vice
s D
ivis
ion
53
Georgia Department of Revenue | Statistical Report FY2009
Table 16 ContinuedCY2007 Individual Income Tax Data by County of Residence
Adjusted Gross Income Less Deficit
Total Per 100 Residents Total(Thousands)
County 2007 Population Estimates
Number of Returns Tabulated
McDuffie 21,504 9,516 44 $ 308,194
McIntosh 11,416 4,792 42 $ 158,674
Meriwether 22,741 9,278 41 $ 285,266
Miller 6,156 2,299 37 $ 76,470
Mitchell 24,135 9,080 38 $ 263,414
Monroe 25,103 10,754 43 $ 561,209
Montgomery 8,993 3,191 35 $ 114,409
Morgan 18,096 7,972 44 $ 399,876
Murray 40,534 15,419 38 $ 504,893
Muscogee 186,807 74,893 40 $ 3,199,206
Newton 95,723 39,153 41 $ 1,596,428
Oconee 31,225 13,820 44 $ 1,011,969
Oglethorpe 13,911 5,901 42 $ 212,990
Paulding 127,594 53,353 42 $ 2,531,492
Peach 26,188 10,599 40 $ 373,626
Pickens 30,453 12,960 43 $ 645,457
Pierce 17,831 7,558 42 $ 250,946
Pike 17,155 7,298 43 $ 316,589
Polk 41,382 17,100 41 $ 531,322
Pulaski 9,800 3,757 38 $ 136,064
Putnam 20,172 9,145 45 $ 418,965
Quitman 2,653 765 29 $ 19,041
Rabun 16,427 6,912 42 $ 256,466
Randolph 7,276 2,742 38 $ 74,565
Adjusted Gross Income Less Deficit
Average Per Returns (Actual)
Total(Thousands) Average Per Returns
Total AGI GrowthIndex 1987=100
Net Taxable Income (Thousands)
Amount of Tax Liability
$ 32,387 $ 198,468 $ 10,464 $ 1,100 123
$ 33,112 $ 102,361 $ 5,433 $ 1,134 212
$ 30,746 $ 179,154 $ 9,346 $ 1,007 110
$ 33,262 $ 50,622 $ 2,693 $ 1,171 99
$ 29,010 $ 171,421 $ 8,913 $ 982 129
$ 52,186 $ 395,121 $ 21,957 $ 2,042 355
$ 35,854 $ 79,071 $ 4,255 $ 1,333 195
$ 50,160 $ 277,737 $ 15,421 $ 1,934 317
$ 32,745 $ 334,509 $ 17,427 $ 1,130 161
$ 42,717 $ 2,215,173 $ 121,506 $ 1,622 139
$ 40,774 $ 1,025,661 $ 55,068 $ 1,406 351
$ 73,225 $ 743,691 $ 42,211 $ 3,054 577
$ 36,094 $ 142,860 $ 7,611 $ 1,290 249
$ 47,448 $ 1,671,630 $ 90,709 $ 1,700 715
$ 35,251 $ 244,972 $ 13,059 $ 1,232 133
$ 49,804 $ 450,112 $ 24,898 $ 1,921 347
$ 33,203 $ 168,107 $ 8,977 $ 1,188 222
$ 43,380 $ 207,483 $ 11,239 $ 1,540 321
$ 31,071 $ 346,093 $ 18,178 $ 1,063 107
$ 36,216 $ 92,147 $ 4,969 $ 1,323 141
$ 45,814 $ 273,459 $ 14,978 $ 1,638 334
$ 24,890 $ 12,059 $ 610 $ 798 168
$ 37,104 $ 169,325 $ 9,173 $ 1,327 235
$ 27,194 $ 47,358 $ 2,430 $ 886 82

Taxpayer Services D
ivision
54
Georgia Department of Revenue | Statistical Report FY2009
CY2007 Individual Income Tax Data by County of Residence
Adjusted Gross Income Less Deficit
Total Per 100 Residents Total(Thousands)
County 2007 Population Estimates
Number of Returns Tabulated
McDuffie 21,504 9,516 44 $ 308,194
McIntosh 11,416 4,792 42 $ 158,674
Meriwether 22,741 9,278 41 $ 285,266
Miller 6,156 2,299 37 $ 76,470
Mitchell 24,135 9,080 38 $ 263,414
Monroe 25,103 10,754 43 $ 561,209
Montgomery 8,993 3,191 35 $ 114,409
Morgan 18,096 7,972 44 $ 399,876
Murray 40,534 15,419 38 $ 504,893
Muscogee 186,807 74,893 40 $ 3,199,206
Newton 95,723 39,153 41 $ 1,596,428
Oconee 31,225 13,820 44 $ 1,011,969
Oglethorpe 13,911 5,901 42 $ 212,990
Paulding 127,594 53,353 42 $ 2,531,492
Peach 26,188 10,599 40 $ 373,626
Pickens 30,453 12,960 43 $ 645,457
Pierce 17,831 7,558 42 $ 250,946
Pike 17,155 7,298 43 $ 316,589
Polk 41,382 17,100 41 $ 531,322
Pulaski 9,800 3,757 38 $ 136,064
Putnam 20,172 9,145 45 $ 418,965
Quitman 2,653 765 29 $ 19,041
Rabun 16,427 6,912 42 $ 256,466
Randolph 7,276 2,742 38 $ 74,565
Adjusted Gross Income Less Deficit
Average Per Returns (Actual)
Total(Thousands) Average Per Returns
Total AGI GrowthIndex 1987=100
Net Taxable Income (Thousands)
Amount of Tax Liability
$ 32,387 $ 198,468 $ 10,464 $ 1,100 123
$ 33,112 $ 102,361 $ 5,433 $ 1,134 212
$ 30,746 $ 179,154 $ 9,346 $ 1,007 110
$ 33,262 $ 50,622 $ 2,693 $ 1,171 99
$ 29,010 $ 171,421 $ 8,913 $ 982 129
$ 52,186 $ 395,121 $ 21,957 $ 2,042 355
$ 35,854 $ 79,071 $ 4,255 $ 1,333 195
$ 50,160 $ 277,737 $ 15,421 $ 1,934 317
$ 32,745 $ 334,509 $ 17,427 $ 1,130 161
$ 42,717 $ 2,215,173 $ 121,506 $ 1,622 139
$ 40,774 $ 1,025,661 $ 55,068 $ 1,406 351
$ 73,225 $ 743,691 $ 42,211 $ 3,054 577
$ 36,094 $ 142,860 $ 7,611 $ 1,290 249
$ 47,448 $ 1,671,630 $ 90,709 $ 1,700 715
$ 35,251 $ 244,972 $ 13,059 $ 1,232 133
$ 49,804 $ 450,112 $ 24,898 $ 1,921 347
$ 33,203 $ 168,107 $ 8,977 $ 1,188 222
$ 43,380 $ 207,483 $ 11,239 $ 1,540 321
$ 31,071 $ 346,093 $ 18,178 $ 1,063 107
$ 36,216 $ 92,147 $ 4,969 $ 1,323 141
$ 45,814 $ 273,459 $ 14,978 $ 1,638 334
$ 24,890 $ 12,059 $ 610 $ 798 168
$ 37,104 $ 169,325 $ 9,173 $ 1,327 235
$ 27,194 $ 47,358 $ 2,430 $ 886 82

Taxp
ayer
Ser
vice
s D
ivis
ion
55
Georgia Department of Revenue | Statistical Report FY2009
Table 16 ContinuedCY2007 Individual Income Tax Data by County of Residence
Adjusted Gross Income Less Deficit
Total Per 100 Residents Total(Thousands)
County 2007 Population Estimates
Number of Returns Tabulated
Richmond 197,643 78,594 40 $ 2,554,741
Rockdale 81,650 34,574 42 $ 1,532,302
Schley 4,106 1,619 39 $ 62,759
Screven 15,043 6,238 41 $ 181,980
Seminole 9,053 3,642 40 $ 111,863
Spalding 62,960 27,130 43 $ 922,777
Stephens 25,221 11,178 44 $ 374,527
Stewart 4,642 1,680 36 $ 42,441
Sumter 32,613 12,287 38 $ 403,056
Talbot 6,599 2,700 41 $ 75,382
Taliaferro 1,876 705 38 $ 16,690
Tattnall 23,122 7,549 33 $ 232,822
Taylor 8,708 3,341 38 $ 104,628
Telfair 13,371 4,320 32 $ 115,933
Terrell 10,275 3,978 39 $ 124,703
Thomas 45,182 19,005 42 $ 775,248
Tift 41,988 16,806 40 $ 611,107
Toombs 27,746 11,003 40 $ 360,958
Towns 10,872 4,603 42 $ 161,011
Treutlen 6,961 2,420 35 $ 67,003
Troup 63,382 26,333 42 $ 1,061,064
Turner 9,278 3,801 41 $ 95,698
Twiggs 10,261 4,128 40 $ 118,325
Union 21,010 9,118 43 $ 315,453
Adjusted Gross Income Less Deficit
Average Per Returns (Actual)
Total(Thousands) Average Per Returns
Total AGI GrowthIndex 1987=100
Net Taxable Income (Thousands)
Amount of Tax Liability
$ 32,506 $ 1,719,355 $ 91,571 $ 1,165 71
$ 44,319 $ 1,012,538 $ 55,131 $ 1,595 174
$ 38,764 $ 43,853 $ 2,357 $ 1,456 196
$ 29,173 $ 118,096 $ 6,160 $ 987 110
$ 30,715 $ 72,404 $ 3,820 $ 1,049 113
$ 34,013 $ 589,700 $ 31,253 $ 1,152 107
$ 33,506 $ 261,705 $ 14,109 $ 1,262 107
$ 25,262 $ 26,982 $ 1,370 $ 816 53
$ 32,803 $ 261,583 $ 13,837 $ 1,126 98
$ 27,919 $ 44,977 $ 2,298 $ 851 107
$ 23,674 $ 10,183 $ 511 $ 725 62
$ 30,841 $ 153,428 $ 8,078 $ 1,070 138
$ 31,316 $ 67,316 $ 3,524 $ 1,055 111
$ 26,836 $ 72,166 $ 3,710 $ 859 71
$ 31,348 $ 80,121 $ 4,193 $ 1,054 96
$ 40,792 $ 550,245 $ 30,124 $ 1,585 163
$ 36,362 $ 416,429 $ 22,485 $ 1,338 144
$ 32,805 $ 238,548 $ 12,714 $ 1,156 118
$ 34,980 $ 109,434 $ 5,958 $ 1,294 310
$ 27,687 $ 40,976 $ 2,102 $ 868 116
$ 40,294 $ 720,127 $ 39,045 $ 1,483 134
$ 25,177 $ 58,112 $ 2,964 $ 780 90
$ 28,664 $ 75,603 $ 3,889 $ 942 120
$ 34,597 $ 212,523 $ 11,595 $ 1,272 377
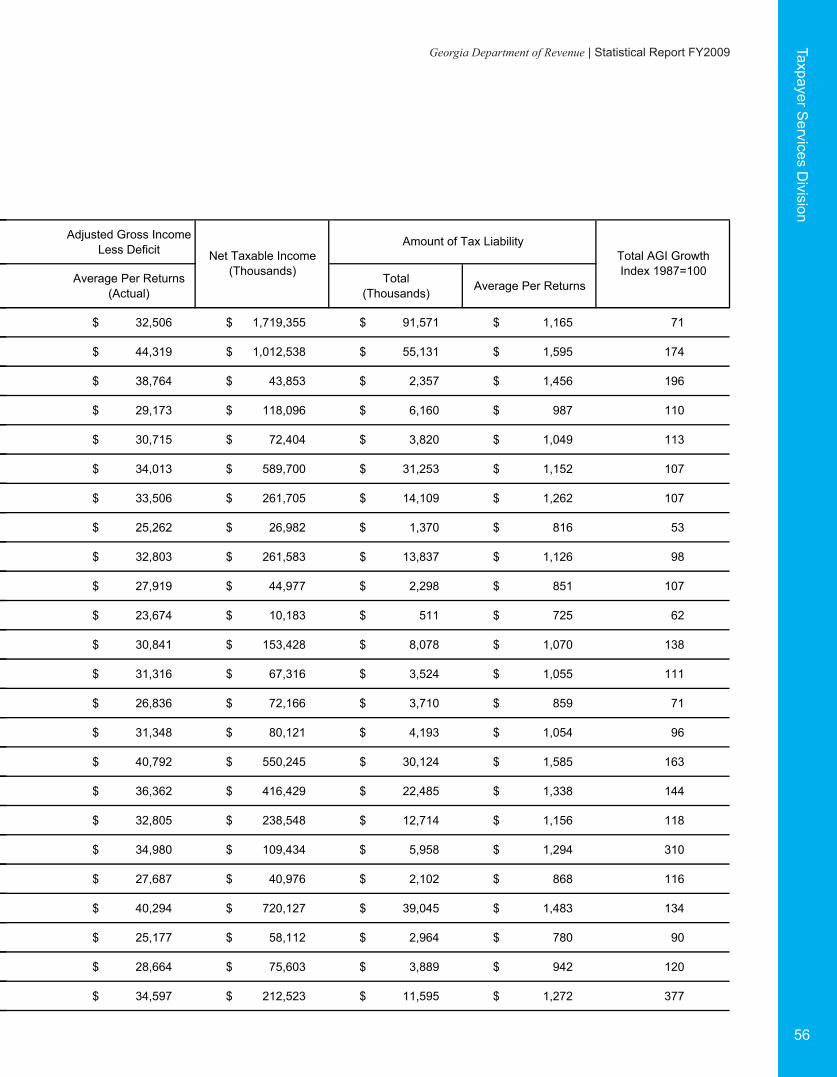
Taxpayer Services D
ivision
56
Georgia Department of Revenue | Statistical Report FY2009
CY2007 Individual Income Tax Data by County of Residence
Adjusted Gross Income Less Deficit
Total Per 100 Residents Total(Thousands)
County 2007 Population Estimates
Number of Returns Tabulated
Richmond 197,643 78,594 40 $ 2,554,741
Rockdale 81,650 34,574 42 $ 1,532,302
Schley 4,106 1,619 39 $ 62,759
Screven 15,043 6,238 41 $ 181,980
Seminole 9,053 3,642 40 $ 111,863
Spalding 62,960 27,130 43 $ 922,777
Stephens 25,221 11,178 44 $ 374,527
Stewart 4,642 1,680 36 $ 42,441
Sumter 32,613 12,287 38 $ 403,056
Talbot 6,599 2,700 41 $ 75,382
Taliaferro 1,876 705 38 $ 16,690
Tattnall 23,122 7,549 33 $ 232,822
Taylor 8,708 3,341 38 $ 104,628
Telfair 13,371 4,320 32 $ 115,933
Terrell 10,275 3,978 39 $ 124,703
Thomas 45,182 19,005 42 $ 775,248
Tift 41,988 16,806 40 $ 611,107
Toombs 27,746 11,003 40 $ 360,958
Towns 10,872 4,603 42 $ 161,011
Treutlen 6,961 2,420 35 $ 67,003
Troup 63,382 26,333 42 $ 1,061,064
Turner 9,278 3,801 41 $ 95,698
Twiggs 10,261 4,128 40 $ 118,325
Union 21,010 9,118 43 $ 315,453
Adjusted Gross Income Less Deficit
Average Per Returns (Actual)
Total(Thousands) Average Per Returns
Total AGI GrowthIndex 1987=100
Net Taxable Income (Thousands)
Amount of Tax Liability
$ 32,506 $ 1,719,355 $ 91,571 $ 1,165 71
$ 44,319 $ 1,012,538 $ 55,131 $ 1,595 174
$ 38,764 $ 43,853 $ 2,357 $ 1,456 196
$ 29,173 $ 118,096 $ 6,160 $ 987 110
$ 30,715 $ 72,404 $ 3,820 $ 1,049 113
$ 34,013 $ 589,700 $ 31,253 $ 1,152 107
$ 33,506 $ 261,705 $ 14,109 $ 1,262 107
$ 25,262 $ 26,982 $ 1,370 $ 816 53
$ 32,803 $ 261,583 $ 13,837 $ 1,126 98
$ 27,919 $ 44,977 $ 2,298 $ 851 107
$ 23,674 $ 10,183 $ 511 $ 725 62
$ 30,841 $ 153,428 $ 8,078 $ 1,070 138
$ 31,316 $ 67,316 $ 3,524 $ 1,055 111
$ 26,836 $ 72,166 $ 3,710 $ 859 71
$ 31,348 $ 80,121 $ 4,193 $ 1,054 96
$ 40,792 $ 550,245 $ 30,124 $ 1,585 163
$ 36,362 $ 416,429 $ 22,485 $ 1,338 144
$ 32,805 $ 238,548 $ 12,714 $ 1,156 118
$ 34,980 $ 109,434 $ 5,958 $ 1,294 310
$ 27,687 $ 40,976 $ 2,102 $ 868 116
$ 40,294 $ 720,127 $ 39,045 $ 1,483 134
$ 25,177 $ 58,112 $ 2,964 $ 780 90
$ 28,664 $ 75,603 $ 3,889 $ 942 120
$ 34,597 $ 212,523 $ 11,595 $ 1,272 377

Taxp
ayer
Ser
vice
s D
ivis
ion
57
Georgia Department of Revenue | Statistical Report FY2009
Table 16 ContinuedCY2007 Individual Income Tax Data by County of Residence
Adjusted Gross Income Less Deficit
Total Per 100 Residents Total(Thousands)
County 2007 Population Estimates
Number of Returns Tabulated
637,053$24486,11185,72nospU
783,698$14344,62124,46reklaW
664,926,1$14378,33059,28notlaW
788,444$24889,41518,53eraW
495,76$54526,2188,5nerraW
046,613$04883,8549,02notgnihsaW
118,973$73856,01989,82enyaW
063,82$34079432,2retsbeW
848,94$72738,1777,6releehW
759,283$24045,01639,42etihW
740,617,1$44409,04336,29dleiftihW
523,47$13646,2516,8xocliW
495,231$24833,4862,01sekliW
884,031$24081,4160,01nosnikliW
112,382$24838,8852,12htroW
308,039,5$606,953rehtO
898,647,202$54061,272,4792,325,9latoT
Net Total Average
Sources: Population Division, U.S. Census Bureau and Information Technology Division, Georgia Department of Revenue, Reported October 8, 2009
Adjusted Gross Income Less Deficit
Average Per Returns (Actual)
Total(Thousands) Average Per Returns
Total AGI GrowthIndex 1987=100
Net Taxable Income (Thousands)
Amount of Tax Liability
$ 30,018 $ 232,451 $ 12,231 $ 1,047 84
$ 33,899 $ 613,899 $ 32,662 $ 1,235 116
$ 48,105 $ 1,106,186 $ 60,746 $ 1,793 446
$ 29,683 $ 301,376 $ 16,032 $ 1,070 78
$ 25,750 $ 41,085 $ 2,076 $ 791 96
$ 37,749 $ 211,368 $ 11,399 $ 1,359 133
$ 35,636 $ 255,435 $ 13,700 $ 1,285 157
$ 29,237 $ 18,357 $ 945 $ 974 140
$ 27,135 $ 30,344 $ 1,547 $ 842 102
$ 36,334 $ 251,141 $ 13,529 $ 1,284 311
$ 41,953 $ 1,148,815 $ 62,072 $ 1,517 129
$ 28,090 $ 48,169 $ 2,493 $ 942 88
$ 30,566 $ 89,121 $ 4,708 $ 1,085 66
$ 31,217 $ 83,357 $ 4,345 $ 1,039 60
$ 32,045 $ 187,207 $ 9,882 $ 1,118 152
$ 44,715 $ 11,329,810 $ 623,677 $ 3,186 344
$ 151,026,398 $ 8,373,277 33,861
$ 47,458 $ 1,960

Taxpayer Services D
ivision
58
Georgia Department of Revenue | Statistical Report FY2009
CY2007 Individual Income Tax Data by County of Residence
Adjusted Gross Income Less Deficit
Total Per 100 Residents Total(Thousands)
County 2007 Population Estimates
Number of Returns Tabulated
637,053$24486,11185,72nospU
783,698$14344,62124,46reklaW
664,926,1$14378,33059,28notlaW
788,444$24889,41518,53eraW
495,76$54526,2188,5nerraW
046,613$04883,8549,02notgnihsaW
118,973$73856,01989,82enyaW
063,82$34079432,2retsbeW
848,94$72738,1777,6releehW
759,283$24045,01639,42etihW
740,617,1$44409,04336,29dleiftihW
523,47$13646,2516,8xocliW
495,231$24833,4862,01sekliW
884,031$24081,4160,01nosnikliW
112,382$24838,8852,12htroW
308,039,5$606,953rehtO
898,647,202$54061,272,4792,325,9latoT
Net Total Average
Sources: Population Division, U.S. Census Bureau and Information Technology Division, Georgia Department of Revenue, Reported October 8, 2009
Adjusted Gross Income Less Deficit
Average Per Returns (Actual)
Total(Thousands) Average Per Returns
Total AGI GrowthIndex 1987=100
Net Taxable Income (Thousands)
Amount of Tax Liability
$ 30,018 $ 232,451 $ 12,231 $ 1,047 84
$ 33,899 $ 613,899 $ 32,662 $ 1,235 116
$ 48,105 $ 1,106,186 $ 60,746 $ 1,793 446
$ 29,683 $ 301,376 $ 16,032 $ 1,070 78
$ 25,750 $ 41,085 $ 2,076 $ 791 96
$ 37,749 $ 211,368 $ 11,399 $ 1,359 133
$ 35,636 $ 255,435 $ 13,700 $ 1,285 157
$ 29,237 $ 18,357 $ 945 $ 974 140
$ 27,135 $ 30,344 $ 1,547 $ 842 102
$ 36,334 $ 251,141 $ 13,529 $ 1,284 311
$ 41,953 $ 1,148,815 $ 62,072 $ 1,517 129
$ 28,090 $ 48,169 $ 2,493 $ 942 88
$ 30,566 $ 89,121 $ 4,708 $ 1,085 66
$ 31,217 $ 83,357 $ 4,345 $ 1,039 60
$ 32,045 $ 187,207 $ 9,882 $ 1,118 152
$ 44,715 $ 11,329,810 $ 623,677 $ 3,186 344
$ 151,026,398 $ 8,373,277 33,861
$ 47,458 $ 1,960

Taxp
ayer
Ser
vice
s D
ivis
ion
59
Georgia Department of Revenue | Statistical Report FY2009
Systems Control Unit / Electronic Services
Systems Control Unit Maintains the schedule of system interfaces to run computer job requests for reports used throughout the Department. Also keeps a record of the schedule for direct deposit and refunds to taxpayers. Maintains a report of charitable contributions and handles various reports to expedite financial transaction processes.
Electronic Filing (e-File e-Pay)Georgia implemented its e-File and e-Pay system in March 2006. Initially, withholding tax was the only tax type available on the system. Since inception, the program has been expanded and now includes the ability to e-File and e-Pay sales and use tax. Additionally, payments of unregistered corporate and individual tax payments and payments of assessments and notices can be made using the e-Pay system.
Any business can participate in the program. Currently, it is mandatory for businesses that owe $5,000 or more on a single return to e-File and e-Pay. This threshold will be lowered to $1,000 effective January 1, 2010 and to $500 on January 1, 2011.
The advantages of e-File and e-Pay are: • Transactions are submitted electronically using a secure environment.• Convenience of filing and paying taxes from home or office.• Faster and more accurate processing of returns.• Taxpayer can view an e-history for all payments and returns submitted through the system.• Taxpayer can self-edit returns. • Immediate confirmation number provided when the return or payment is received.• Payments can be warehoused (similar to post dating a check) until a future date.• Program is free. A fee may be assessed by credit card vendors when a credit card is used to make
a payment. However, the Department does not assess any fees.
Table 17CY2009 Electronic Filing Results vs. Paper Returns (Thousands)
Individual IncomeTax
WithholdingTax
CorporateTax
Sales and UseTax Total Returns
E-filing 2,874 2,406 54 627 5,961
Paper returns 1,521 1,032 257 433 3,243
Total 4,395 3,438 311 1,060 9,204
Source: Information Technology Division, Georgia Department of Revenue - electronic returns
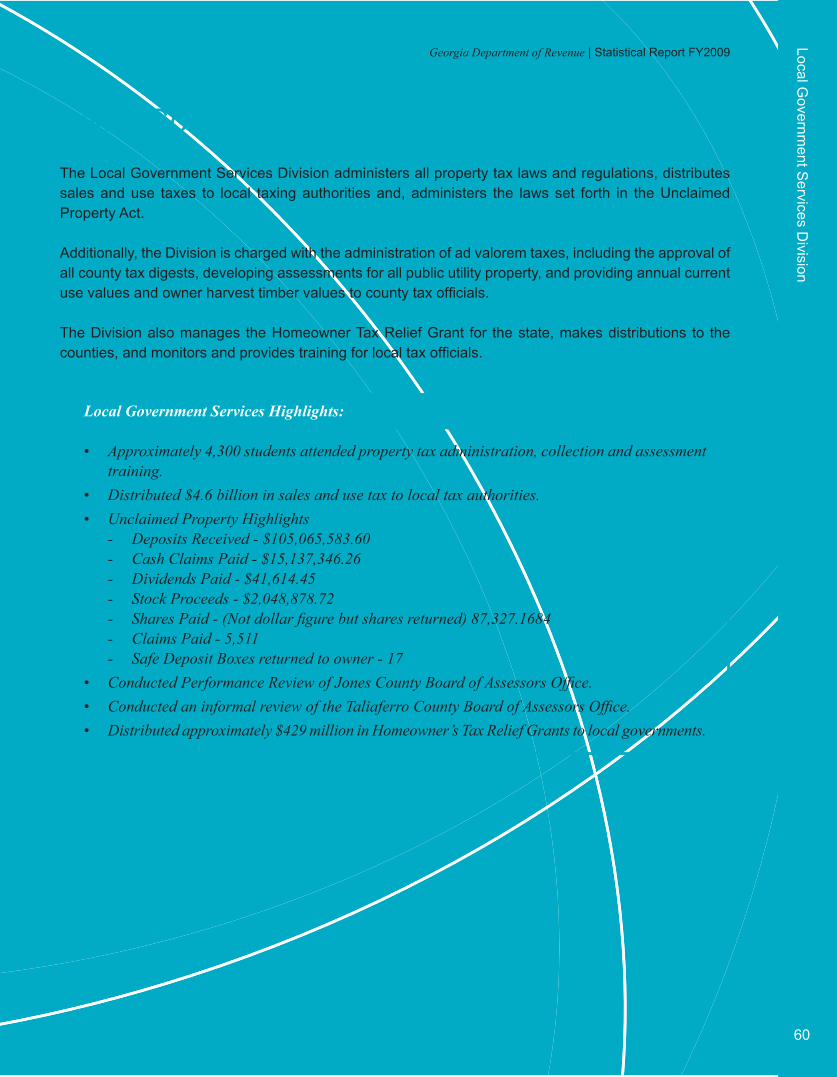
Local Governm
ent Services D
ivision
60
Georgia Department of Revenue | Statistical Report FY2009
The Local Government Services Division administers all property tax laws and regulations, distributes sales and use taxes to local taxing authorities and, administers the laws set forth in the Unclaimed Property Act.
Additionally, the Division is charged with the administration of ad valorem taxes, including the approval of all county tax digests, developing assessments for all public utility property, and providing annual current use values and owner harvest timber values to county tax officials.
The Division also manages the Homeowner Tax Relief Grant for the state, makes distributions to the counties, and monitors and provides training for local tax officials.
Local Government Services Highlights:
• Approximately 4,300 students attended property tax administration, collection and assessment training.
• Distributed $4.6 billion in sales and use tax to local tax authorities. • Unclaimed Property Highlights
- Deposits Received - $105,065,583.60 - Cash Claims Paid - $15,137,346.26 - Dividends Paid - $41,614.45 - Stock Proceeds - $2,048,878.72 - Shares Paid - (Not dollar figure but shares returned) 87,327.1684 - Claims Paid - 5,511 - Safe Deposit Boxes returned to owner - 17
• Conducted Performance Review of Jones County Board of Assessors Office. • Conducted an informal review of the Taliaferro County Board of Assessors Office.• Distributed approximately $429 million in Homeowner’s Tax Relief Grants to local governments.
Local Government Services Division

Loca
l Gov
ernm
ent S
ervi
ces
Div
isio
n
61
Georgia Department of Revenue | Statistical Report FY2009
Local Government Services Division Results and Performance Measures
FY2005 FY2006 FY2007 FY2008 FY2009
Unclaimed Property
Value of unclaimed property returned to rightful owners or heirs (Millions)
6.8$ 8.0$ 12.0$ 14.0$ 17.2$
Grants and Distribution
● Local Sales Tax Distribution
Total local sales tax type (All counties combined) 456 457 467 465 470
Total returns (SUT) processed (Millions) 1.4 1.4 1.2 1.3 1.3
Distribution of sales tax revenues to local governments (Billions) 3.7$ 3.7$ 4.7$ 4.8$ 4.6$
● Homeowners Tax Relief Grants (HTRG)
Value of HTRG grants distributed (Millions) 412$ 418$ 425$ 429$ 429$
Number of local taxing jurisdictions receiving grants 419 430 430 440 454
Number of homesteads qualifying for grants (Millions) 7.1 7.3 7.3 7.1 7.4
Source: Local Government Services Division, Georgia Department of Revenue
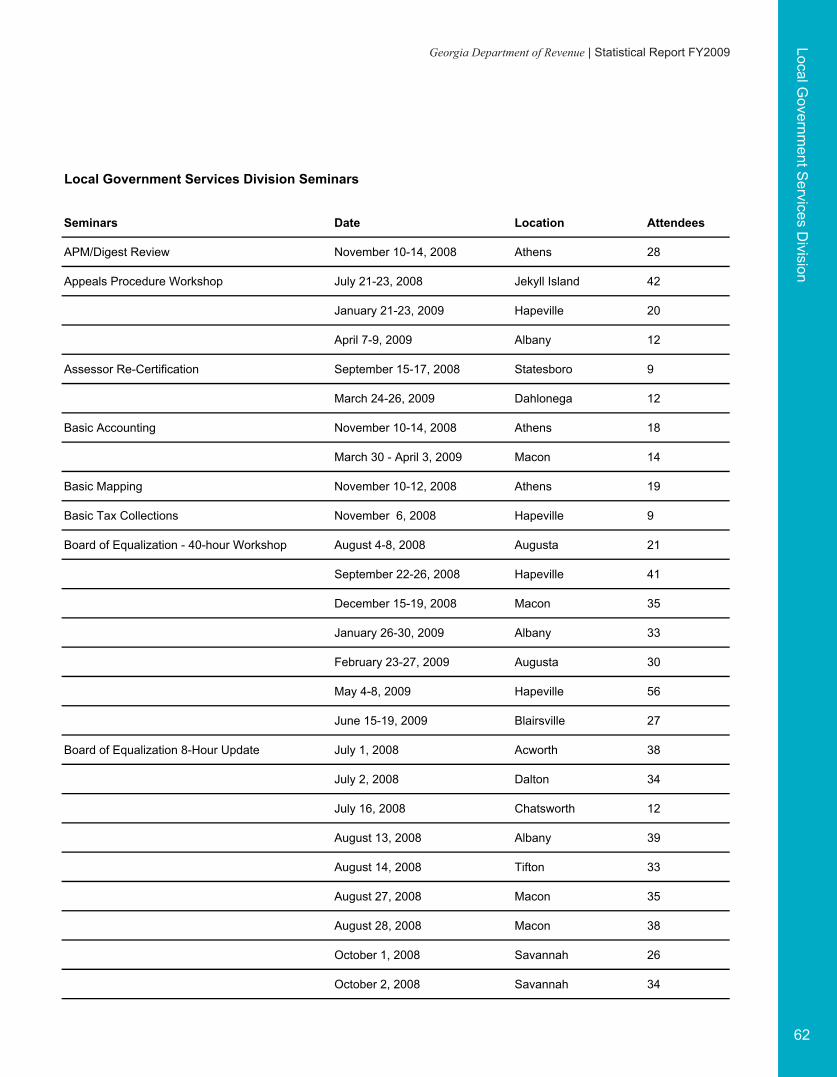
Local Governm
ent Services D
ivision
62
Georgia Department of Revenue | Statistical Report FY2009
Local Government Services Division Seminars
Seminars Date Location Attendees
APM/Digest Review November 10-14, 2008 Athens 28
Appeals Procedure Workshop July 21-23, 2008 Jekyll Island 42
January 21-23, 2009 Hapeville 20
April 7-9, 2009 Albany 12
Assessor Re-Certification September 15-17, 2008 Statesboro 9
March 24-26, 2009 Dahlonega 12
Basic Accounting November 10-14, 2008 Athens 18
March 30 - April 3, 2009 Macon 14
Basic Mapping November 10-12, 2008 Athens 19
Basic Tax Collections November 6, 2008 Hapeville 9
Board of Equalization - 40-hour Workshop August 4-8, 2008 Augusta 21
September 22-26, 2008 Hapeville 41
December 15-19, 2008 Macon 35
January 26-30, 2009 Albany 33
February 23-27, 2009 Augusta 30
May 4-8, 2009 Hapeville 56
June 15-19, 2009 Blairsville 27
Board of Equalization 8-Hour Update July 1, 2008 Acworth 38
July 2, 2008 Dalton 34
July 16, 2008 Chatsworth 12
August 13, 2008 Albany 39
August 14, 2008 Tifton 33
August 27, 2008 Macon 35
August 28, 2008 Macon 38
October 1, 2008 Savannah 26
October 2, 2008 Savannah 34

Loca
l Gov
ernm
ent S
ervi
ces
Div
isio
n
63
Georgia Department of Revenue | Statistical Report FY2009
Local Government Services Division Seminars
Seminars Date Location Attendees
Board of Equalization 8-Hour Update Continued December 10, 2008 Augusta 32
January 13, 2009 Vidalia 29
January 14, 2009 Statesboro 19
February 3, 2009 Waycross 18
February 4, 2009 Brunswick 22
February 18, 2009 Thomasville 37
February 19, 2009 Tifton 39
March 17, 2009 Macon 34
March 18, 2009 Macon 37
April 15, 2009 Dahlonega 38
April 16, 2009 Blairsville 38
April 29, 2009 Athens 36
April 30, 2009 Lawrenceville 38
May 13, 2009 Savannah 33
May 14, 2009 Savannah 40
June 10, 2009 Augusta 31
June 11, 2009 Augusta 29
June 24, 2009 Acworth 63
June 25, 2009 Dalton 37
CAVEAT for Assessors May 18-20, 2009 Athens
CAVEAT for Tax Commissioners May 13, 2009 Athens 88
May 14, 2009 Athens 69
Course I: Certification for Assessors September 8-12, 2008 Macon 41
October 13-17, 2008 Tifton 26
November 10-14, 2008 Athens 20
December 1-5, 2008 Statesboro 20

Local Governm
ent Services D
ivision
64
Georgia Department of Revenue | Statistical Report FY2009
Local Government Services Division Seminars
Seminars Date Location Attendees
Course I: Certification for Assessors Continued January 5-9, 2009 Augusta 10
March 9-13, 2009 Lawrenceville 34
June 1-5, 2009 Brunswick 40
Course IA: Assessment Fundamentals July 7-11, 2008 Dalton 19
August 4-8, 2008 Vidalia 16
September 8-12, 2008 Hapeville 40
December 1-5, 2008 Oakwood 37
January 12-16, 2009 Augusta 21
March 9-13, 2009 Americus 21
April 13-17, 2009 Brunswick 16
May 4-8, 2009 Milledgeville 15
Course II: Income Approach to Value August 18-22, 2008 Hapeville 29
December 8-12, 2008 Lawrenceville 29
February 9-13, 2009 Brunswick 19
Course III: Valuation of Personal Property August 4-8, 2008 Macon 32
December 8-12, 2008 Hapeville 37
March 2-6, 2009 Brunswick 13
June 8-12, 2009 Hapeville 32
Course IVA: Valuation of Urban Land November 10-14, 2008 Athens 31
April 20-24, 2009 Statesboro 17
Course IVB: Valuation of Rural Land September 8-12, 2008 Hapeville 30
March 9-13, 2009 Albany 15
Course V: Cost Approach to Value September 15-19, 2008 Hapeville 30
December 8-12, 2008 Oakwood 34
January 26-30, 2009 Statesboro 28
June 8-12, 2009 Brunswick 32

Loca
l Gov
ernm
ent S
ervi
ces
Div
isio
n
65
Georgia Department of Revenue | Statistical Report FY2009
Local Government Services Division Seminars
Seminars Date Location Attendees
Course VI: Management Development November 10-14, 2008 Athens 17
June 8-12, 2009 Hapeville 29
Delinquent Tax Collections May 13, 2009 Athens 109
Digest Submission May 13, 2008 Athens 111
May 28, 2009 Hapeville 39
Exemptions December 16, 2008 Hapeville 17
Exempt Properties August 25-27, 2008 Tifton 15
November 10-12, 2008 Athens 47
February 2-4, 2009 Hapeville 34
Forest Land Protection Act Seminar February 4, 2009 Tifton 100
February 18, 2009 Macon 170
March 4, 2009 Statesboro 60
March 17, 2009 Macon 98
March 18, 2009 Ringgold 49
Georgia Assessment Administration October 27-31, 2008 Dahlonega 15
February 9-13, 2009 Hapeville 24
April 20-24, 2009 Augusta 18
Manufacturing Housing November 12-14, 2008 Athens 10
March 23-25, 2009 Tifton 23
Manufactured Housing and Timber January 8, 1009 Macon 33
Newly Elected Tax Commissioner Workshop December 8-12, 2008 Athens 31
Penalties and Interest October 1, 2008 Ringgold 13
Property Tax - Question and Answer Session May 14, 2009 Athens 144
Records and Internal Controls February 10, 2009 Thomson 7
Regional Exams October 15-16, 2008 Acworth 146
December 17-18, 2008 Tifton 128

Local Governm
ent Services D
ivision
66
Georgia Department of Revenue | Statistical Report FY2009
Local Government Services Division Seminars
Seminars Date Location Attendees
Regional Exams Continued March 25-26, 2009 Hapeville 111
June 24-25, 2009 Hapeville 96
Review of Income September 30 - October 2, 2008 Acworth 27
March 4-6, 2009 Dublin 10
May 27-29, 2009 Hapeville 18
Specialized Assessment August 27-29, 2008 Tifton 24
November 12-14, 2008 Athens 37
February 4-6, 2009 Hapeville 40
May 6-8, 2009 Macon 34
Timber Regulations April 21-23, 2009 Jekyll Island 18
WinGAP Basic Data Entry August 4-8, 2008 Statesboro 18
October 20-24, 2008 Hapeville 22
November 3-7, 2008 Jesup 9
March 23-27, 2009 Waycross 15
May 11-15, 2009 Hapeville 7
WinGAP Commercial Schedules January 20-22, 2009 Hapeville 12
WinGAP Personal Property November 10-12, 2008 Athens 10
April 6-8, 2009 Hapeville 10
WinGAP Residential Pricing Schedules November 12-14, 2008 Athens 7
December 2-4, 2008 Tifton 13
WinGAP Technical October 13-17, 2008 Statesboro 12
February 23-27, 2009 Dublin 9
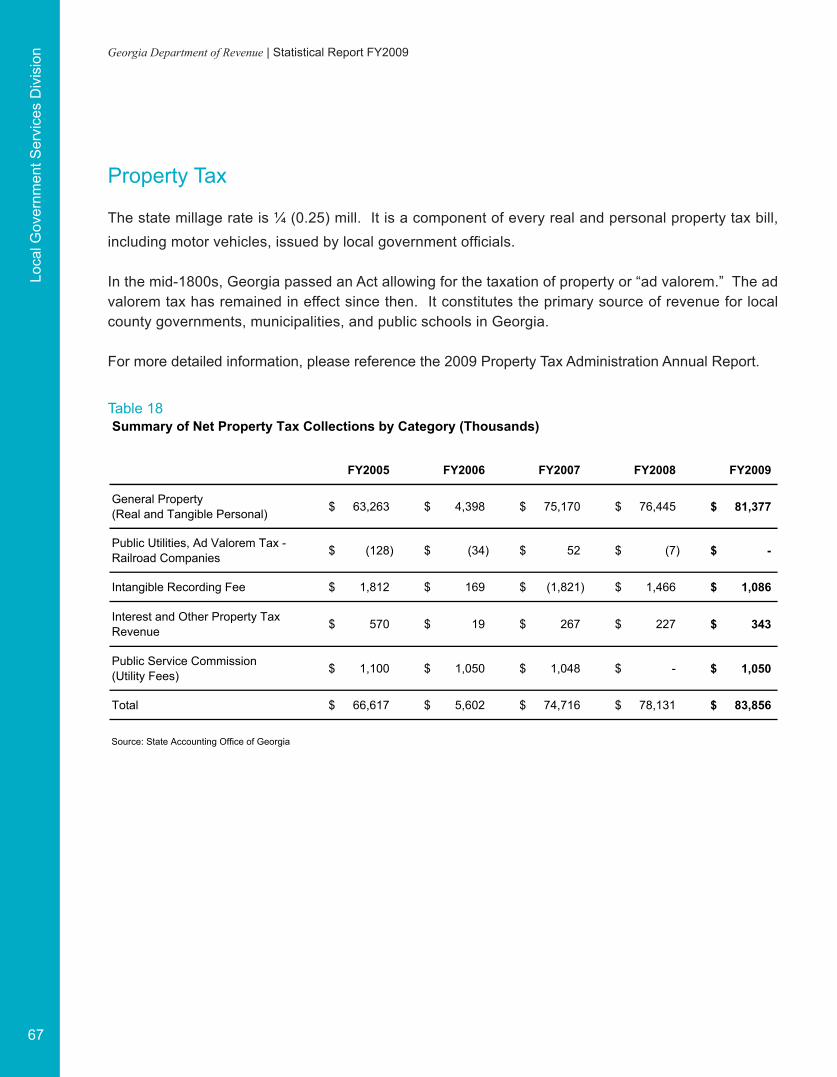
Loca
l Gov
ernm
ent S
ervi
ces
Div
isio
n
67
Georgia Department of Revenue | Statistical Report FY2009
Property Tax
The state millage rate is ¼ (0.25) mill. It is a component of every real and personal property tax bill, including motor vehicles, issued by local government officials.
In the mid-1800s, Georgia passed an Act allowing for the taxation of property or “ad valorem.” The ad valorem tax has remained in effect since then. It constitutes the primary source of revenue for local county governments, municipalities, and public schools in Georgia.
For more detailed information, please reference the 2009 Property Tax Administration Annual Report.
Table 18Summary of Net Property Tax Collections by Category (Thousands)
FY2005 FY2006 FY2007 FY2008 FY2009
General Property(Real and Tangible Personal) 63,263$ 4,398$ 75,170$ 76,445$ 81,377$
Public Utilities, Ad Valorem Tax - Railroad Companies (128)$ (34)$ 52$ (7)$ -$
Intangible Recording Fee 1,812$ 169$ (1,821)$ 1,466$ 1,086$
Interest and Other Property Tax Revenue 570$ 19$ 267$ 227$ 343$
Public Service Commission(Utility Fees) 1,100$ 1,050$ 1,048$ -$ 1,050$
Total 66,617$ 5,602$ 74,716$ 78,131$ 83,856$
Source: State Accounting Office of Georgia

Local Governm
ent Services D
ivision
68
Georgia Department of Revenue | Statistical Report FY2009
Table 19Taxable Values and Tax Rates, State of Georgia for General Property and Public Utilities
Net Taxable Values (Thousands)
FY2004 FY2005 FY2006 FY2007 FY2008
State Rate (per $1,000 value) 0.25 0.25 0.25 0.25 0.25
Grand Total
Grand Total 272,207,115$ 291,219,580$ 318,095,398$ 332,356,035$ 351,151,399$
10 Year Growth Rate 111% 114% 116% 111% 104%
20 Year Growth Rate 381% 360% 343% 306% 285%
Public Utilities
Public Utilities 11,330,385$ 11,549,924$ 12,135,793$ 11,962,961$ 12,094,511$
10 Year Growth Rate 20% 21% 24% 21% 22%
20 Year Growth Rate 118% 98% 71% 50% 39%
General Property (Net of Exemptions) (Thousands)
FY2004 FY2005 FY2006 FY2007 FY2008
Total 260,876,732$ 279,669,656$ 305,959,605$ 320,393,073$ 339,056,888$
10 Year Growth Rate 118% 121% 122% 117% 110%
20 Year Growth Rate 408% 386% 373% 333% 311%
Real Property 217,607,321$ 236,646,531$ 251,602,699$ 265,769,931$ 284,700,317$
10 Year Growth Rate 140% 149% 146% 142% 135%
20 Year Growth Rate 490% 476% 428% 400% 376%
Personal Property 43,269,408$ 43,023,125$ 54,356,906$ 54,623,142$ 54,356,572$
10 Year Growth Rate 49% 36% 55% 45% 34%
20 Year Growth Rate 199% 162% 220% 163% 138%
Source: Local Government Services Division, Georgia Department of Revenue
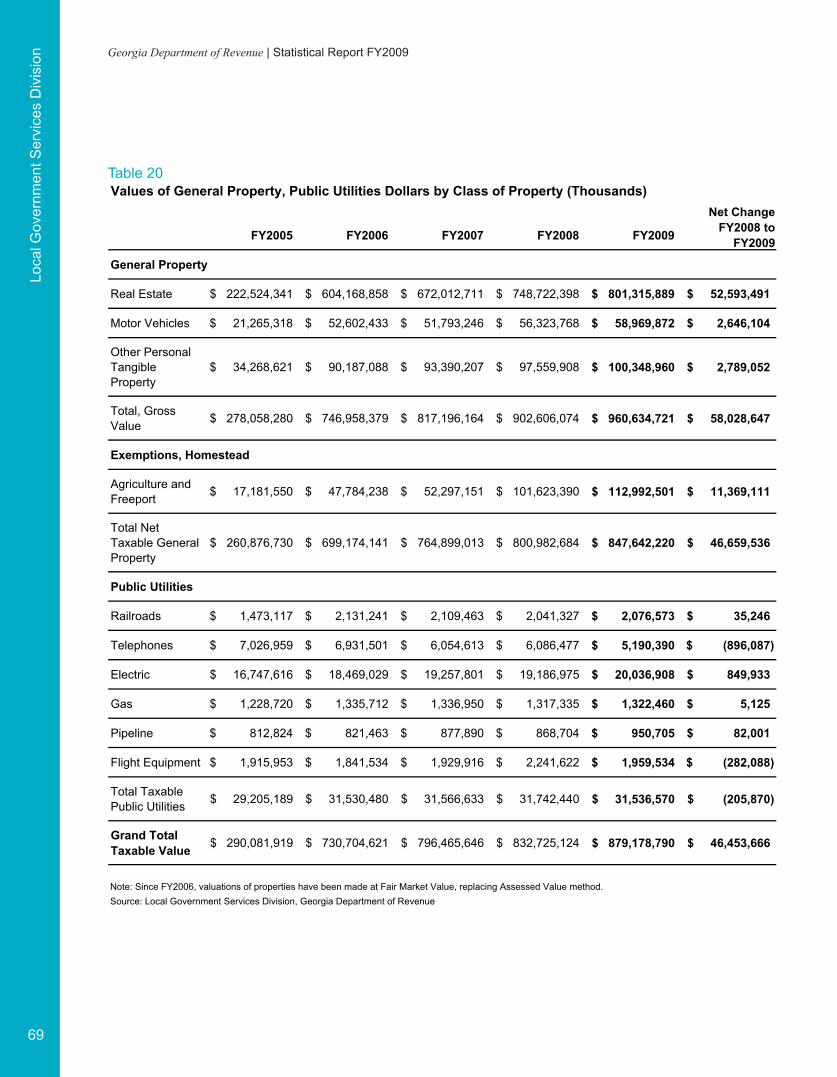
Loca
l Gov
ernm
ent S
ervi
ces
Div
isio
n
69
Georgia Department of Revenue | Statistical Report FY2009
Table 20
FY2005 FY2006 FY2007 FY2008 FY2009
General Property
Real Estate 222,524,341$ 604,168,858$ 672,012,711$ 748,722,398$ 801,315,889$ 52,593,491$
Motor Vehicles 21,265,318$ 52,602,433$ 51,793,246$ 56,323,768$ 58,969,872$ 2,646,104$
Other Personal TangibleProperty
34,268,621$ 90,187,088$ 93,390,207$ 97,559,908$ 100,348,960$ 2,789,052$
Total, Gross Value 278,058,280$ 746,958,379$ 817,196,164$ 902,606,074$ 960,634,721$ 58,028,647$
Exemptions, Homestead
Agriculture and Freeport 17,181,550$ 47,784,238$ 52,297,151$ 101,623,390$ 112,992,501$ 11,369,111$
Total Net Taxable General Property
260,876,730$ 699,174,141$ 764,899,013$ 800,982,684$ 847,642,220$ 46,659,536$
Public Utilities
Railroads 1,473,117$ 2,131,241$ 2,109,463$ 2,041,327$ 2,076,573$ 35,246$
Telephones 7,026,959$ 6,931,501$ 6,054,613$ 6,086,477$ 5,190,390$ (896,087)$
Electric 16,747,616$ 18,469,029$ 19,257,801$ 19,186,975$ 20,036,908$ 849,933$
Gas 1,228,720$ 1,335,712$ 1,336,950$ 1,317,335$ 1,322,460$ 5,125$
Pipeline 812,824$ 821,463$ 877,890$ 868,704$ 950,705$ 82,001$
Flight Equipment 1,915,953$ 1,841,534$ 1,929,916$ 2,241,622$ 1,959,534$ (282,088)$
Total Taxable Public Utilities 29,205,189$ 31,530,480$ 31,566,633$ 31,742,440$ 31,536,570$ (205,870)$
Grand Total Taxable Value 290,081,919$ 730,704,621$ 796,465,646$ 832,725,124$ 879,178,790$ 46,453,666$
Note: Since FY2006, valuations of properties have been made at Fair Market Value, replacing Assessed Value method. Source: Local Government Services Division, Georgia Department of Revenue
Values of General Property, Public Utilities Dollars by Class of Property (Thousands)Net Change
FY2008 to FY2009
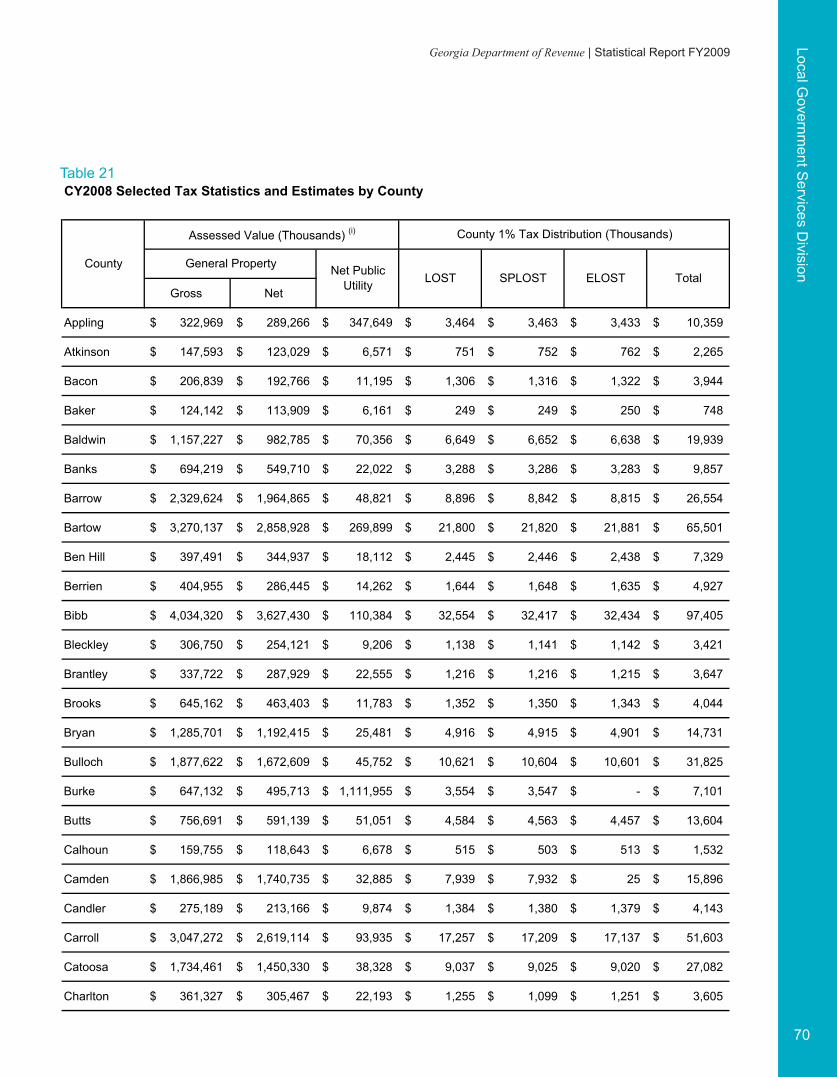
Local Governm
ent Services D
ivision
70
Georgia Department of Revenue | Statistical Report FY2009
Table 21CY2008 Selected Tax Statistics and Estimates by County
Gross Net
Appling $ 322,969 289,266$ 347,649$ 3,464$ 3,463$ 3,433$ 10,359$
Atkinson $ 147,593 123,029$ 6,571$ 751$ 752$ 762$ 2,265$
Bacon $ 206,839 192,766$ 11,195$ 1,306$ 1,316$ 1,322$ 3,944$
Baker $ 124,142 113,909$ 6,161$ 249$ 249$ 250$ 748$
Baldwin $ 1,157,227 982,785$ 70,356$ 6,649$ 6,652$ 6,638$ 19,939$
Banks $ 694,219 549,710$ 22,022$ 3,288$ 3,286$ 3,283$ 9,857$
Barrow $ 2,329,624 1,964,865$ 48,821$ 8,896$ 8,842$ 8,815$ 26,554$
Bartow $ 3,270,137 2,858,928$ 269,899$ 21,800$ 21,820$ 21,881$ 65,501$
Ben Hill $ 397,491 344,937$ 18,112$ 2,445$ 2,446$ 2,438$ 7,329$
Berrien $ 404,955 286,445$ 14,262$ 1,644$ 1,648$ 1,635$ 4,927$
Bibb $ 4,034,320 3,627,430$ 110,384$ 32,554$ 32,417$ 32,434$ 97,405$
Bleckley $ 306,750 254,121$ 9,206$ 1,138$ 1,141$ 1,142$ 3,421$
Brantley $ 337,722 287,929$ 22,555$ 1,216$ 1,216$ 1,215$ 3,647$
Brooks $ 645,162 463,403$ 11,783$ 1,352$ 1,350$ 1,343$ 4,044$
Bryan $ 1,285,701 1,192,415$ 25,481$ 4,916$ 4,915$ 4,901$ 14,731$
Bulloch $ 1,877,622 1,672,609$ 45,752$ 10,621$ 10,604$ 10,601$ 31,825$
Burke $ 647,132 495,713$ 1,111,955$ 3,554$ 3,547$ -$ 7,101$
Butts $ 756,691 591,139$ 51,051$ 4,584$ 4,563$ 4,457$ 13,604$
Calhoun $ 159,755 118,643$ 6,678$ 515$ 503$ 513$ 1,532$
Camden $ 1,866,985 1,740,735$ 32,885$ 7,939$ 7,932$ 25$ 15,896$
Candler $ 275,189 213,166$ 9,874$ 1,384$ 1,380$ 1,379$ 4,143$
Carroll $ 3,047,272 2,619,114$ 93,935$ 17,257$ 17,209$ 17,137$ 51,603$
Catoosa $ 1,734,461 1,450,330$ 38,328$ 9,037$ 9,025$ 9,020$ 27,082$
Charlton $ 361,327 305,467$ 22,193$ 1,255$ 1,099$ 1,251$ 3,605$
County 1% Tax Distribution (Thousands)
LOST SPLOST ELOST TotalCounty
Assessed Value (Thousands) (i)
General Property Net Public Utility

Loca
l Gov
ernm
ent S
ervi
ces
Div
isio
n
71
Georgia Department of Revenue | Statistical Report FY2009
Table 21 ContinuedCY2008 Selected Tax Statistics and Estimates by County
Gross Net
County 1% Tax Distribution (Thousands)
LOST SPLOST ELOST TotalCounty
Assessed Value (Thousands) (i)
General Property Net Public Utility
Chatham $ 14,384,906 12,478,504$ 220,742$ 62,297$ 62,196$ 61,543$ 186,036$
Chattahoochee $ 65,017 56,833$ 3,967$ 764$ 757$ 768$ 2,290$
Chattooga $ 653,161 549,513$ 17,323$ 2,422$ 2,424$ 2,427$ 7,273$
Cherokee $ 9,063,219 7,936,493$ 142,645$ -$ 29,397$ 29,528$ 58,926$
Clarke $ 3,818,389 3,334,213$ 70,871$ 21,051$ 21,030$ 21,000$ 63,082$
Clay $ 143,382 106,015$ 4,418$ 286$ 282$ 290$ 859$
Clayton $ 8,615,543 7,674,757$ 918,347$ 56,854$ 53,424$ 56,804$ 167,081$
Clinch $ 247,608 215,203$ 16,884$ 730$ 735$ 727$ 2,191$
Cobb $ 33,303,637 29,767,913$ 515,261$ -$ 129,646$ 130,334$ 259,980$
Coffee $ 1,013,751 790,178$ 32,565$ 5,811$ 5,809$ 5,782$ 17,403$
Colquitt $ 1,005,841 797,732$ 32,643$ 5,615$ 5,623$ 5,616$ 16,853$
Columbia $ 4,343,231 3,867,525$ 60,557$ 17,059$ 17,052$ 17,002$ 51,113$
Cook $ 433,511 310,398$ 15,916$ 2,110$ 2,114$ 2,108$ 6,332$
Coweta $ 4,444,318 3,912,109$ 183,730$ 20,899$ 20,903$ 20,813$ 62,616$
Crawford $ 309,711 269,759$ 12,972$ 606$ 606$ 438$ 1,650$
Crisp $ 619,323 516,524$ 12,223$ 4,397$ 4,426$ 4,426$ 13,249$
Dade $ 495,469 410,455$ 19,190$ 2,524$ 2,521$ 2,507$ 7,553$
Dawson $ 1,673,100 1,412,994$ 21,373$ 5,918$ 5,901$ 5,892$ 17,711$
Decatur $ 1,103,107 842,753$ 32,306$ 5,115$ 5,100$ 5,105$ 15,321$
Dekalb (ii) $ 26,900,160 24,739,823$ 494,095$ 95,278$ -$ 106,138$ 201,415$
Dodge $ 451,676 366,459$ 20,106$ 2,285$ 2,282$ 2,281$ 6,847$
Dooly $ 285,914 235,543$ 18,007$ 1,758$ 1,758$ 1,748$ 5,264$
Dougherty $ 2,352,353 2,108,004$ 65,455$ 18,074$ 17,950$ 18,011$ 54,036$
Douglas $ 4,789,990 4,187,533$ 104,940$ 22,411$ 717$ 22,350$ 45,478$
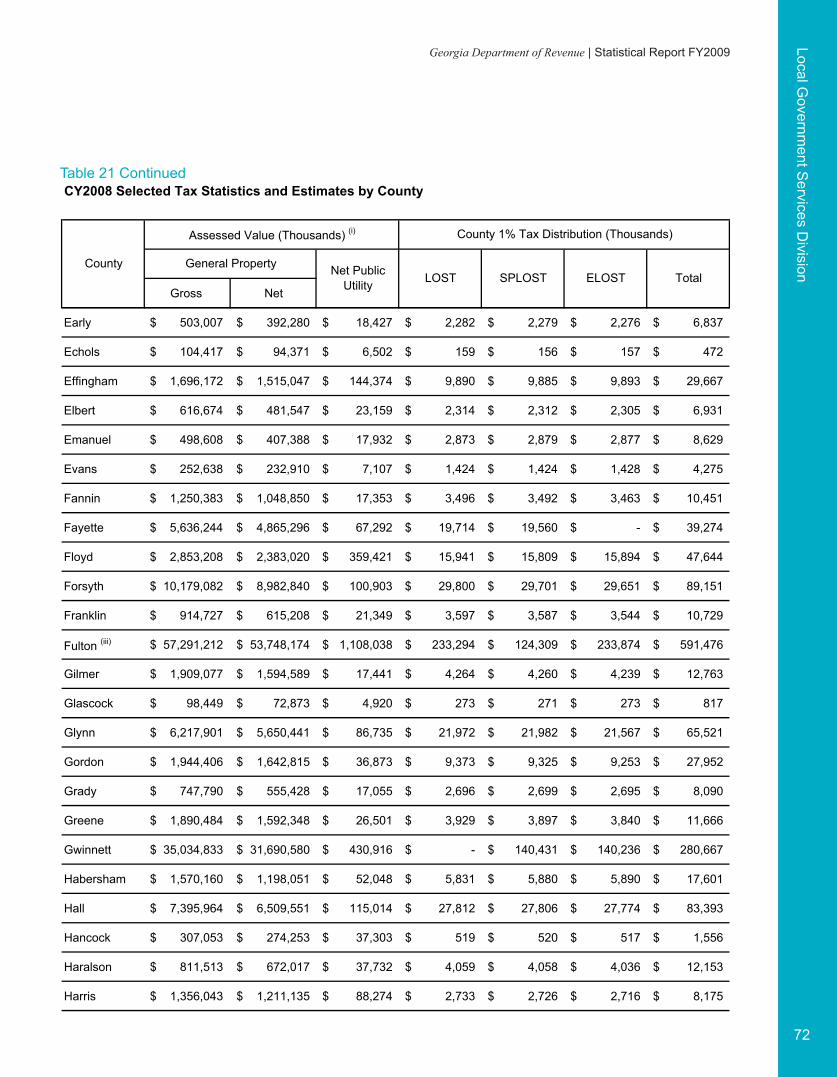
Local Governm
ent Services D
ivision
72
Georgia Department of Revenue | Statistical Report FY2009
Table 21 ContinuedCY2008 Selected Tax Statistics and Estimates by County
Gross Net
County 1% Tax Distribution (Thousands)
LOST SPLOST ELOST TotalCounty
Assessed Value (Thousands) (i)
General Property Net Public Utility
Early $ 503,007 392,280$ 18,427$ 2,282$ 2,279$ 2,276$ 6,837$
Echols $ 104,417 94,371$ 6,502$ 159$ 156$ 157$ 472$
Effingham $ 1,696,172 1,515,047$ 144,374$ 9,890$ 9,885$ 9,893$ 29,667$
Elbert $ 616,674 481,547$ 23,159$ 2,314$ 2,312$ 2,305$ 6,931$
Emanuel $ 498,608 407,388$ 17,932$ 2,873$ 2,879$ 2,877$ 8,629$
Evans $ 252,638 232,910$ 7,107$ 1,424$ 1,424$ 1,428$ 4,275$
Fannin $ 1,250,383 1,048,850$ 17,353$ 3,496$ 3,492$ 3,463$ 10,451$
Fayette $ 5,636,244 4,865,296$ 67,292$ 19,714$ 19,560$ -$ 39,274$
Floyd $ 2,853,208 2,383,020$ 359,421$ 15,941$ 15,809$ 15,894$ 47,644$
Forsyth $ 10,179,082 8,982,840$ 100,903$ 29,800$ 29,701$ 29,651$ 89,151$
Franklin $ 914,727 615,208$ 21,349$ 3,597$ 3,587$ 3,544$ 10,729$
Fulton (iii) $ 57,291,212 53,748,174$ 1,108,038$ 233,294$ 124,309$ 233,874$ 591,476$
Gilmer $ 1,909,077 1,594,589$ 17,441$ 4,264$ 4,260$ 4,239$ 12,763$
Glascock $ 98,449 72,873$ 4,920$ 273$ 271$ 273$ 817$
Glynn $ 6,217,901 5,650,441$ 86,735$ 21,972$ 21,982$ 21,567$ 65,521$
Gordon $ 1,944,406 1,642,815$ 36,873$ 9,373$ 9,325$ 9,253$ 27,952$
Grady $ 747,790 555,428$ 17,055$ 2,696$ 2,699$ 2,695$ 8,090$
Greene $ 1,890,484 1,592,348$ 26,501$ 3,929$ 3,897$ 3,840$ 11,666$
Gwinnett $ 35,034,833 31,690,580$ 430,916$ -$ 140,431$ 140,236$ 280,667$
Habersham $ 1,570,160 1,198,051$ 52,048$ 5,831$ 5,880$ 5,890$ 17,601$
Hall $ 7,395,964 6,509,551$ 115,014$ 27,812$ 27,806$ 27,774$ 83,393$
Hancock $ 307,053 274,253$ 37,303$ 519$ 520$ 517$ 1,556$
Haralson $ 811,513 672,017$ 37,732$ 4,059$ 4,058$ 4,036$ 12,153$
Harris $ 1,356,043 1,211,135$ 88,274$ 2,733$ 2,726$ 2,716$ 8,175$

Loca
l Gov
ernm
ent S
ervi
ces
Div
isio
n
73
Georgia Department of Revenue | Statistical Report FY2009
Table 21 ContinuedCY2008 Selected Tax Statistics and Estimates by County
Gross Net
County
Assessed Value (Thousands) (i)
General Property Net Public Utility
County 1% Tax Distribution (Thousands)
LOST SPLOST ELOST Total
Hart $ 1,094,688 858,291$ 31,313$ 3,016$ 3,025$ 3,019$ 9,060$
Heard $ 328,760 257,936$ 171,143$ 6,841$ 6,837$ 6,835$ 20,512$
Henry $ 8,007,686 6,815,501$ 112,019$ 28,399$ 28,347$ 28,352$ 85,098$
Houston $ 3,689,385 3,390,010$ 91,207$ 21,146$ 21,128$ 21,092$ 63,366$
Irwin $ 280,310 188,735$ 16,554$ 719$ 718$ 714$ 2,152$
Jackson $ 2,704,991 2,230,797$ 69,948$ 9,478$ 9,447$ 9,406$ 28,331$
Jasper $ 659,370 431,997$ 26,531$ 1,021$ 1,011$ 1,012$ 3,044$
Jeff Davis $ 274,031 245,804$ 13,122$ 2,061$ 2,066$ 2,065$ 6,192$
Jefferson $ 502,695 379,218$ 24,340$ 2,276$ 2,274$ 2,282$ 6,832$
Jenkins $ 232,521 200,198$ 13,516$ 752$ 753$ 748$ 2,253$
Johnson $ 217,907 153,215$ 7,273$ 610$ 605$ 604$ 1,819$
Jones $ 832,037 715,413$ 47,313$ 2,428$ 2,426$ 2,438$ 7,293$
Lamar $ 555,747 451,645$ 16,688$ 1,635$ 1,639$ 1,640$ 4,915$
Lanier $ 189,859 156,405$ 6,788$ 583$ 583$ 583$ 1,749$
Laurens $ 1,354,469 1,142,046$ 43,372$ 9,009$ 8,948$ 8,941$ 26,897$
Lee $ 900,882 803,873$ 19,111$ 3,674$ 3,674$ 3,661$ 11,009$
Liberty $ 1,263,232 1,139,936$ 42,184$ 8,163$ 8,171$ 8,170$ 24,504$
Lincoln $ 346,928 295,464$ 7,762$ 753$ 749$ 744$ 2,247$
Long $ 242,589 214,329$ 9,753$ 479$ 482$ 483$ 1,445$
Lowndes $ 2,969,468 2,586,412$ 78,142$ 23,924$ 23,880$ 23,780$ 71,583$
Lumpkin $ 1,520,264 1,150,976$ 21,881$ 3,265$ 3,255$ 3,253$ 9,773$
Macon $ 397,432 288,406$ 24,737$ 1,314$ 1,312$ 1,311$ 3,938$
Madison $ 766,358 589,132$ 44,333$ 2,043$ 2,040$ 2,035$ 6,118$
Marion $ 261,902 214,323$ 8,896$ 474$ 470$ 473$ 1,417$
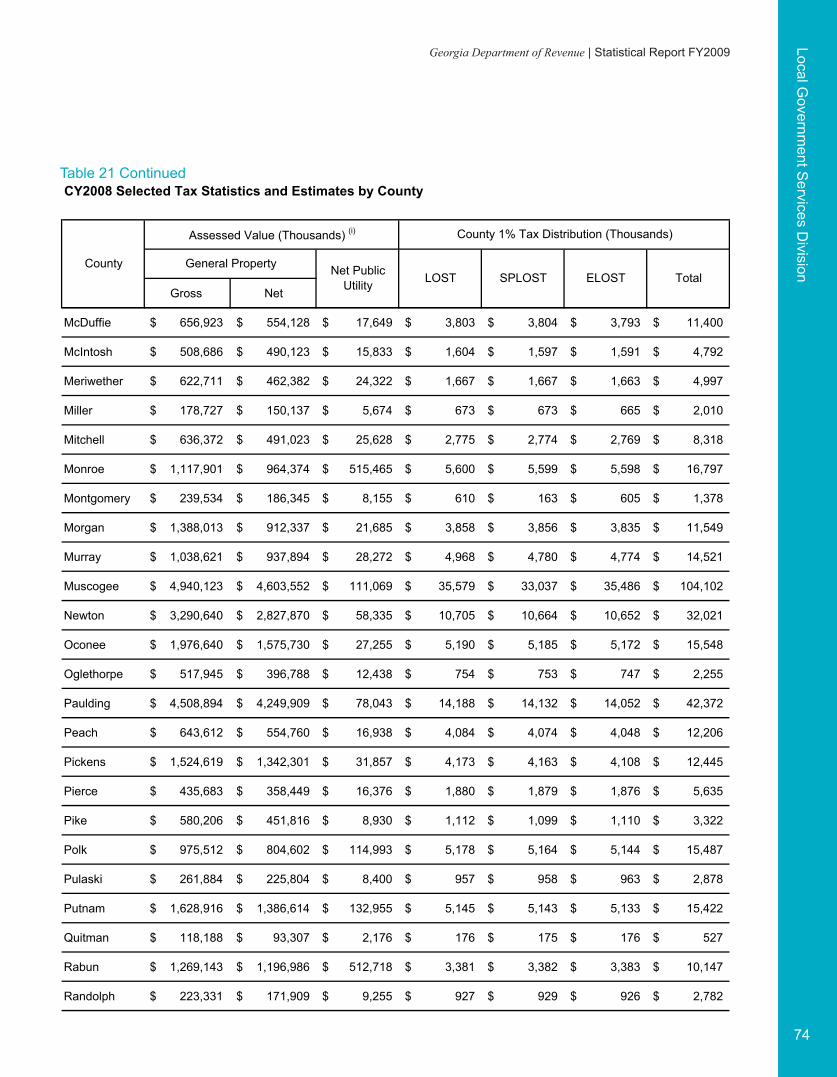
Local Governm
ent Services D
ivision
74
Georgia Department of Revenue | Statistical Report FY2009
Table 21 ContinuedCY2008 Selected Tax Statistics and Estimates by County
Gross Net
County 1% Tax Distribution (Thousands)
LOST SPLOST ELOST TotalCounty
Assessed Value (Thousands) (i)
General Property Net Public Utility
McDuffie $ 656,923 554,128$ 17,649$ 3,803$ 3,804$ 3,793$ 11,400$
McIntosh $ 508,686 490,123$ 15,833$ 1,604$ 1,597$ 1,591$ 4,792$
Meriwether $ 622,711 462,382$ 24,322$ 1,667$ 1,667$ 1,663$ 4,997$
Miller $ 178,727 150,137$ 5,674$ 673$ 673$ 665$ 2,010$
Mitchell $ 636,372 491,023$ 25,628$ 2,775$ 2,774$ 2,769$ 8,318$
Monroe $ 1,117,901 964,374$ 515,465$ 5,600$ 5,599$ 5,598$ 16,797$
Montgomery $ 239,534 186,345$ 8,155$ 610$ 163$ 605$ 1,378$
Morgan $ 1,388,013 912,337$ 21,685$ 3,858$ 3,856$ 3,835$ 11,549$
Murray $ 1,038,621 937,894$ 28,272$ 4,968$ 4,780$ 4,774$ 14,521$
Muscogee $ 4,940,123 4,603,552$ 111,069$ 35,579$ 33,037$ 35,486$ 104,102$
Newton $ 3,290,640 2,827,870$ 58,335$ 10,705$ 10,664$ 10,652$ 32,021$
Oconee $ 1,976,640 1,575,730$ 27,255$ 5,190$ 5,185$ 5,172$ 15,548$
Oglethorpe $ 517,945 396,788$ 12,438$ 754$ 753$ 747$ 2,255$
Paulding $ 4,508,894 4,249,909$ 78,043$ 14,188$ 14,132$ 14,052$ 42,372$
Peach $ 643,612 554,760$ 16,938$ 4,084$ 4,074$ 4,048$ 12,206$
Pickens $ 1,524,619 1,342,301$ 31,857$ 4,173$ 4,163$ 4,108$ 12,445$
Pierce $ 435,683 358,449$ 16,376$ 1,880$ 1,879$ 1,876$ 5,635$
Pike $ 580,206 451,816$ 8,930$ 1,112$ 1,099$ 1,110$ 3,322$
Polk $ 975,512 804,602$ 114,993$ 5,178$ 5,164$ 5,144$ 15,487$
Pulaski $ 261,884 225,804$ 8,400$ 957$ 958$ 963$ 2,878$
Putnam $ 1,628,916 1,386,614$ 132,955$ 5,145$ 5,143$ 5,133$ 15,422$
Quitman $ 118,188 93,307$ 2,176$ 176$ 175$ 176$ 527$
Rabun $ 1,269,143 1,196,986$ 512,718$ 3,381$ 3,382$ 3,383$ 10,147$
Randolph $ 223,331 171,909$ 9,255$ 927$ 929$ 926$ 2,782$

Loca
l Gov
ernm
ent S
ervi
ces
Div
isio
n
75
Georgia Department of Revenue | Statistical Report FY2009
Table 21 ContinuedCY2008 Selected Tax Statistics and Estimates by County
Gross Net
County 1% Tax Distribution (Thousands)
LOST SPLOST ELOST TotalCounty
Assessed Value (Thousands) (i)
General Property Net Public Utility
Richmond $ 4,976,856 4,260,931$ 129,257$ 37,902$ 37,914$ 37,874$ 113,691$
Rockdale (iv) $ 3,206,304 2,843,379$ 71,237$ 13,834$ 15,430$ 15,412$ 44,676$
Schley $ 93,956 79,682$ 2,874$ 394$ 393$ 388$ 1,175$
Screven $ 459,265 371,790$ 20,011$ 1,434$ 1,435$ 1,440$ 4,309$
Seminole $ 325,520 233,891$ 9,827$ 1,152$ 830$ 1,152$ 3,134$
Spalding $ 1,667,288 1,397,993$ 28,046$ 8,919$ 8,884$ 8,903$ 26,706$
Stephens $ 817,211 654,061$ 29,303$ 3,836$ 3,823$ 3,795$ 11,454$
Stewart $ 141,731 130,905$ 7,398$ 401$ 400$ 404$ 1,205$
Sumter $ 771,918 647,220$ 32,644$ 4,494$ 4,474$ 4,487$ 13,455$
Talbot $ 255,141 197,081$ 19,282$ 553$ 548$ 545$ 1,647$
Taliaferro $ 109,466 77,182$ 3,367$ 93$ 98$ 98$ 289$
Tattnall $ 456,355 391,883$ 18,802$ 1,894$ 1,893$ 1,893$ 5,680$
Taylor $ 283,484 202,216$ 17,501$ 916$ 917$ 919$ 2,752$
Telfair $ 306,830 244,696$ 11,364$ 1,191$ 1,190$ 1,191$ 3,571$
Terrell $ 297,682 222,984$ 11,707$ 999$ 999$ 995$ 2,994$
Thomas $ 1,867,468 1,570,343$ 25,801$ 7,431$ 7,356$ 7,388$ 22,175$
Tift $ 1,124,929 909,121$ 36,586$ 8,875$ 8,876$ 8,838$ 26,588$
Toombs $ 634,360 549,857$ 26,493$ 4,772$ 4,770$ 4,776$ 14,318$
Towns (v) $ 1,019,359 895,947$ 11,105$ 1,887$ 1,941$ 1,890$ 5,718$
Treutlen $ 139,542 105,067$ 7,025$ 486$ 489$ 488$ 1,462$
Troup $ 2,126,119 1,801,101$ 39,772$ 11,225$ 11,190$ 11,192$ 33,606$
Turner $ 299,913 196,901$ 14,583$ 903$ 906$ 899$ 2,707$
Twiggs $ 203,856 176,635$ 17,198$ 890$ 889$ 30$ 1,808$
Union $ 1,448,550 1,214,169$ 15,415$ 3,255$ 3,236$ 3,234$ 9,725$

Local Governm
ent Services D
ivision
76
Georgia Department of Revenue | Statistical Report FY2009
Table 21 ContinuedCY2008 Selected Tax Statistics and Estimates by County
Gross Net
County 1% Tax Distribution (Thousands)
LOST SPLOST ELOST TotalCounty
Assessed Value (Thousands) (i)
General Property Net Public Utility
Upson $ 754,364 602,872$ 28,592$ 3,238$ 3,232$ 3,231$ 9,701$
Walker $ 1,516,023 1,274,776$ 34,721$ 5,432$ 5,425$ 5,415$ 16,272$
Walton $ 3,245,553 2,740,487$ 70,214$ 9,416$ 9,352$ 9,349$ 28,117$
Ware $ 691,674 605,650$ 57,234$ 7,181$ 7,172$ 7,161$ 21,514$
Warren $ 183,395 142,308$ 13,639$ 650$ 649$ 649$ 1,949$
Washington $ 839,115 714,314$ 44,908$ 3,918$ 3,917$ 3,906$ 11,741$
Wayne $ 924,937 759,578$ 31,582$ 4,206$ 4,205$ 38$ 8,448$
Webster $ 113,304 82,830$ 4,177$ 192$ 198$ 197$ 588$
Wheeler $ 150,037 116,681$ 9,684$ 428$ 119$ 422$ 969$
White $ 1,180,340 1,004,226$ 21,128$ 3,126$ 3,121$ 3,117$ 9,364$
Whitfield $ 3,564,044 3,377,658$ 71,526$ 18,612$ 14,982$ 18,625$ 52,219$
Wilcox $ 156,839 133,700$ 7,957$ 477$ 476$ 479$ 1,432$
Wilkes $ 436,547 323,828$ 12,808$ 1,183$ 1,169$ 1,177$ 3,528$
Wilkinson $ 370,457 336,512$ 22,522$ 1,976$ 1,974$ 1,967$ 5,918$
Worth $ 517,701 407,656$ 18,561$ 1,656$ 1,661$ 1,660$ 4,977$
State Total $384,541,415 339,344,415$ 12,094,511$ 1,342,811$ 1,405,296$ 1,615,444$ 4,363,551$
Source: Local Government Services Division, Georgia Department of Revenue
(v) $1,941 in OTHER LOST for Towns County is located in SPLOST column.
(i) Net Digest amounts reflect state homestead exemption requirements only. Some counties have expanded homestead exemptions for local taxing purposes.(ii) $95,278 in HOST for DeKalb is located in LOST column.(iii) $124,309 in OTHER LOST for Fulton is located in SPLOST column.(iv) $13,834 in HOST for Rockdale County located in LOST column.

Loca
l Gov
ernm
ent S
ervi
ces
Div
isio
n
77
Georgia Department of Revenue | Statistical Report FY2009
Table 22 - Revised June 18, 2010
(Thousands) Rank (Thousands)
Appling 17,902 85 $ 10,359 75 $ 221,390
Atkinson 8,156 141 $ 2,265 130 $ 77,877
Bacon 10,483 126 $ 3,944 114 $ 124,272
Baker 3,774 153 $ 748 155 $ 39,886
Baldwin 46,359 49 $ 19,939 45 $ 576,288
Banks 16,518 86 $ 9,857 77 $ 271,148
Barrow 66,928 33 $ 26,554 40 $ 1,142,947
Bartow 92,561 22 $ 65,501 15 $ 1,677,428
Ben Hill 17,659 99 $ 7,329 89 $ 218,346
Berrien 16,692 110 $ 4,927 107 $ 213,735
Bibb 154,806 13 $ 97,405 9 $ 2,703,573
Bleckley 12,642 116 $ 3,421 120 $ 171,919
Brantley 15,417 114 $ 3,647 116 $ 192,119
Brooks 16,324 106 $ 4,044 113 $ 175,095
Bryan 29,991 50 $ 14,731 57 $ 632,604
Bulloch 66,184 34 $ 31,825 31 $ 878,706
Burke 22,714 75 $ 7,101 92 $ 295,414
Butts 23,658 71 $ 13,604 60 $ 335,093
Calhoun 6,082 147 $ 1,532 144 $ 61,089
Camden 47,109 41 $ 15,896 52 $ 617,134
Candler 10,488 121 $ 4,143 112 $ 126,659
Carroll 111,845 24 $ 51,603 22 $ 1,825,338
Catoosa 62,120 37 $ 27,082 36 $ 940,240
Charlton 10,613 120 $ 3,605 117 $ 108,695
Three Economic Indicators by County with Rankings and Per Capita Amounts
County 2007 Population Estimates
MasterEconomic Rank
2008 County 1% Distribution2007
AGI Reported on Georgia Returns

Local Governm
ent Services D
ivision
78
Georgia Department of Revenue | Statistical Report FY2009
(Thousands) Rank (Thousands)
Appling 17,902 85 $ 10,359 75 $ 221,390
Atkinson 8,156 141 $ 2,265 130 $ 77,877
Bacon 10,483 126 $ 3,944 114 $ 124,272
Baker 3,774 153 $ 748 155 $ 39,886
Baldwin 46,359 49 $ 19,939 45 $ 576,288
Banks 16,518 86 $ 9,857 77 $ 271,148
Barrow 66,928 33 $ 26,554 40 $ 1,142,947
Bartow 92,561 22 $ 65,501 15 $ 1,677,428
Ben Hill 17,659 99 $ 7,329 89 $ 218,346
Berrien 16,692 110 $ 4,927 107 $ 213,735
Bibb 154,806 13 $ 97,405 9 $ 2,703,573
Bleckley 12,642 116 $ 3,421 120 $ 171,919
Brantley 15,417 114 $ 3,647 116 $ 192,119
Brooks 16,324 106 $ 4,044 113 $ 175,095
Bryan 29,991 50 $ 14,731 57 $ 632,604
Bulloch 66,184 34 $ 31,825 31 $ 878,706
Burke 22,714 75 $ 7,101 92 $ 295,414
Butts 23,658 71 $ 13,604 60 $ 335,093
Calhoun 6,082 147 $ 1,532 144 $ 61,089
Camden 47,109 41 $ 15,896 52 $ 617,134
Candler 10,488 121 $ 4,143 112 $ 126,659
Carroll 111,845 24 $ 51,603 22 $ 1,825,338
Catoosa 62,120 37 $ 27,082 36 $ 940,240
Charlton 10,613 120 $ 3,605 117 $ 108,695
Three Economic Indicators by County with Rankings and Per Capita Amounts
County 2007 Population Estimates
MasterEconomic Rank
2008 County 1% Distribution2007
AGI Reported on Georgia Returns
Rank (Thousands) Rank
98 $ 636,915 79 $ 579 $ 12,367 $ 35,578
141 $ 129,600 147 $ 278 $ 9,548 $ 15,890
123 $ 203,960 137 $ 376 $ 11,855 $ 19,456
152 $ 120,071 150 $ 198 $ 10,569 $ 31,815
50 $ 1,053,140 59 $ 430 $ 12,431 $ 22,717
90 $ 571,732 86 $ 597 $ 16,415 $ 34,613
31 $ 2,013,687 32 $ 397 $ 17,077 $ 30,087
24 $ 3,128,828 23 $ 708 $ 18,122 $ 33,803
100 $ 363,050 109 $ 415 $ 12,365 $ 20,559
101 $ 300,707 118 $ 295 $ 12,805 $ 18,015
13 $ 3,737,814 19 $ 629 $ 17,464 $ 24,145
109 $ 263,327 120 $ 271 $ 13,599 $ 20,830
106 $ 310,485 116 $ 237 $ 12,462 $ 20,139
108 $ 475,186 94 $ 248 $ 10,726 $ 29,110
45 $ 1,217,897 54 $ 491 $ 21,093 $ 40,609
39 $ 1,718,361 35 $ 481 $ 13,277 $ 25,963
85 $ 1,607,667 41 $ 313 $ 13,006 $ 70,779
75 $ 642,190 78 $ 575 $ 14,164 $ 27,145
149 $ 125,321 149 $ 252 $ 10,044 $ 20,605
47 $ 1,773,620 34 $ 337 $ 13,100 $ 37,649
121 $ 223,040 131 $ 395 $ 12,077 $ 21,266
20 $ 2,713,048 28 $ 461 $ 16,320 $ 24,257
35 $ 1,488,657 45 $ 436 $ 15,136 $ 23,964
130 $ 327,660 112 $ 340 $ 10,242 $ 30,873
Per Capita Amounts of Three Indicators
2008 County 1% Distribution
2007 Income Reported Net Digest
2008 Net Property and Utility Digest2007
AGI Reported on Georgia Returns

Loca
l Gov
ernm
ent S
ervi
ces
Div
isio
n
79
Georgia Department of Revenue | Statistical Report FY2009
(Thousands) Rank (Thousands)
Three Economic Indicators by County with Rankings and Per Capita Amounts
County 2007 Population Estimates
MasterEconomic Rank
2008 County 1% Distribution2007
AGI Reported on Georgia Returns
Chatham 248,532 5 $ 186,036 5 $ 5,048,426
Chattahoochee 13,901 148 $ 2,290 129 $ 30,798
Chattooga 26,804 89 $ 7,273 91 $ 301,762
Cherokee 203,670 10 $ 58,926 19 $ 5,267,168
Clarke 113,241 21 $ 63,082 17 $ 1,722,590
Clay 3,203 154 $ 859 153 $ 29,025
Clayton 271,144 7 $ 167,081 6 $ 3,368,614
Clinch 6,974 133 $ 2,191 134 $ 80,543
Cobb 688,896 3 $ 259,980 3 $ 19,858,176
Coffee 40,162 57 $ 17,403 48 $ 516,723
Colquitt 44,658 55 $ 16,853 49 $ 550,290
Columbia 108,760 18 $ 51,113 23 $ 2,691,004
Cook 16,422 107 $ 6,332 97 $ 205,680
Coweta 118,452 16 $ 62,616 18 $ 2,548,006
Crawford 12,500 124 $ 1,650 141 $ 167,664
Crisp 22,127 83 $ 13,249 62 $ 273,292
Dade 16,113 95 $ 7,553 88 $ 208,822
Dawson 21,468 48 $ 17,711 46 $ 473,671
Decatur 28,532 63 $ 15,321 56 $ 371,815
Dekalb 733,358 4 $ 201,415 4 $ 15,993,485
Dodge 20,010 98 $ 6,847 94 $ 233,948
Dooly 11,563 115 $ 5,264 104 $ 140,365
Dougherty 95,655 28 $ 54,036 20 $ 1,307,689
Douglas 124,221 20 $ 45,478 25 $ 2,280,889
Table 22 Continued - Revised June 18, 2010

Local Governm
ent Services D
ivision
80
Georgia Department of Revenue | Statistical Report FY2009
(Thousands) Rank (Thousands)
Three Economic Indicators by County with Rankings and Per Capita Amounts
County 2007 Population Estimates
MasterEconomic Rank
2008 County 1% Distribution2007
AGI Reported on Georgia Returns
Chatham 248,532 5 $ 186,036 5 $ 5,048,426
Chattahoochee 13,901 148 $ 2,290 129 $ 30,798
Chattooga 26,804 89 $ 7,273 91 $ 301,762
Cherokee 203,670 10 $ 58,926 19 $ 5,267,168
Clarke 113,241 21 $ 63,082 17 $ 1,722,590
Clay 3,203 154 $ 859 153 $ 29,025
Clayton 271,144 7 $ 167,081 6 $ 3,368,614
Clinch 6,974 133 $ 2,191 134 $ 80,543
Cobb 688,896 3 $ 259,980 3 $ 19,858,176
Coffee 40,162 57 $ 17,403 48 $ 516,723
Colquitt 44,658 55 $ 16,853 49 $ 550,290
Columbia 108,760 18 $ 51,113 23 $ 2,691,004
Cook 16,422 107 $ 6,332 97 $ 205,680
Coweta 118,452 16 $ 62,616 18 $ 2,548,006
Crawford 12,500 124 $ 1,650 141 $ 167,664
Crisp 22,127 83 $ 13,249 62 $ 273,292
Dade 16,113 95 $ 7,553 88 $ 208,822
Dawson 21,468 48 $ 17,711 46 $ 473,671
Decatur 28,532 63 $ 15,321 56 $ 371,815
Dekalb 733,358 4 $ 201,415 4 $ 15,993,485
Dodge 20,010 98 $ 6,847 94 $ 233,948
Dooly 11,563 115 $ 5,264 104 $ 140,365
Dougherty 95,655 28 $ 54,036 20 $ 1,307,689
Douglas 124,221 20 $ 45,478 25 $ 2,280,889
Rank (Thousands) Rank
Per Capita Amounts of Three Indicators
2008 County 1% Distribution
2007 Income Reported Net Digest
2008 Net Property and Utility Digest2007
AGI Reported on Georgia Returns
7 $ 12,699,246 5 $ 749 $ 20,313 $ 51,097
155 $ 60,800 159 $ 165 $ 2,216 $ 4,374
82 $ 566,837 88 $ 271 $ 11,258 $ 21,147
5 $ 8,079,138 8 $ 289 $ 25,861 $ 39,668
22 $ 3,405,084 22 $ 557 $ 15,212 $ 30,069
156 $ 110,433 152 $ 268 $ 9,062 $ 34,478
11 $ 8,593,104 7 $ 616 $ 12,424 $ 31,692
140 $ 232,088 128 $ 314 $ 11,549 $ 33,279
2 $ 30,283,174 3 $ 377 $ 28,826 $ 43,959
55 $ 822,743 70 $ 433 $ 12,866 $ 20,486
53 $ 830,375 68 $ 377 $ 12,322 $ 18,594
14 $ 3,928,082 18 $ 470 $ 24,743 $ 36,117
105 $ 326,313 113 $ 386 $ 12,525 $ 19,871
16 $ 4,095,838 17 $ 529 $ 21,511 $ 34,578
111 $ 282,731 119 $ 132 $ 13,413 $ 22,619
89 $ 528,747 89 $ 599 $ 12,351 $ 23,896
104 $ 429,645 98 $ 469 $ 12,960 $ 26,664
58 $ 1,434,366 47 $ 825 $ 22,064 $ 66,814
72 $ 875,059 67 $ 537 $ 13,032 $ 30,669
4 $ 25,233,918 4 $ 275 $ 21,809 $ 34,409
96 $ 386,565 107 $ 342 $ 11,692 $ 19,319
117 $ 253,550 123 $ 455 $ 12,139 $ 21,928
30 $ 2,173,460 31 $ 565 $ 13,671 $ 22,722
19 $ 4,292,473 16 $ 366 $ 18,362 $ 34,555

Loca
l Gov
ernm
ent S
ervi
ces
Div
isio
n
81
Georgia Department of Revenue | Statistical Report FY2009
(Thousands) Rank (Thousands)
Three Economic Indicators by County with Rankings and Per Capita Amounts
County 2007 Population Estimates
MasterEconomic Rank
2008 County 1% Distribution2007
AGI Reported on Georgia Returns
Early 11,828 104 $ 6,837 95 $ 145,516
Echols 4,061 155 $ 472 158 $ 35,659
Effingham 50,784 35 $ 29,667 32 $ 924,203
Elbert 20,520 91 $ 6,931 93 $ 278,446
Emanuel 22,388 92 $ 8,629 83 $ 256,555
Evans 11,436 118 $ 4,275 111 $ 156,222
Fannin 22,504 70 $ 10,451 74 $ 315,026
Fayette 105,810 15 $ 39,274 28 $ 3,389,456
Floyd 95,364 26 $ 47,644 24 $ 1,558,541
Forsyth 158,111 6 $ 89,151 10 $ 5,121,534
Franklin 21,793 81 $ 10,729 73 $ 297,206
Fulton 992,472 1 $ 591,476 1 $ 34,464,998
Gilmer 28,310 53 $ 12,763 63 $ 413,724
Glascock 2,761 156 $ 817 154 $ 34,324
Glynn 74,666 14 $ 65,521 14 $ 1,817,408
Gordon 51,820 36 $ 27,952 35 $ 812,997
Grady 24,917 87 $ 8,090 87 $ 299,629
Greene 15,643 54 $ 11,666 68 $ 421,670
Gwinnett 771,466 2 $ 280,667 2 $ 17,517,109
Habersham 42,129 44 $ 17,601 47 $ 631,632
Hall 178,620 9 $ 83,393 12 $ 3,796,160
Hancock 9,558 130 $ 1,556 143 $ 93,294
Haralson 28,735 65 $ 12,153 66 $ 423,441
Harris 29,014 59 $ 8,175 86 $ 693,453
Table 22 Continued - Revised June 18, 2010

Local Governm
ent Services D
ivision
82
Georgia Department of Revenue | Statistical Report FY2009
(Thousands) Rank (Thousands)
Three Economic Indicators by County with Rankings and Per Capita Amounts
County 2007 Population Estimates
MasterEconomic Rank
2008 County 1% Distribution2007
AGI Reported on Georgia Returns
Early 11,828 104 $ 6,837 95 $ 145,516
Echols 4,061 155 $ 472 158 $ 35,659
Effingham 50,784 35 $ 29,667 32 $ 924,203
Elbert 20,520 91 $ 6,931 93 $ 278,446
Emanuel 22,388 92 $ 8,629 83 $ 256,555
Evans 11,436 118 $ 4,275 111 $ 156,222
Fannin 22,504 70 $ 10,451 74 $ 315,026
Fayette 105,810 15 $ 39,274 28 $ 3,389,456
Floyd 95,364 26 $ 47,644 24 $ 1,558,541
Forsyth 158,111 6 $ 89,151 10 $ 5,121,534
Franklin 21,793 81 $ 10,729 73 $ 297,206
Fulton 992,472 1 $ 591,476 1 $ 34,464,998
Gilmer 28,310 53 $ 12,763 63 $ 413,724
Glascock 2,761 156 $ 817 154 $ 34,324
Glynn 74,666 14 $ 65,521 14 $ 1,817,408
Gordon 51,820 36 $ 27,952 35 $ 812,997
Grady 24,917 87 $ 8,090 87 $ 299,629
Greene 15,643 54 $ 11,666 68 $ 421,670
Gwinnett 771,466 2 $ 280,667 2 $ 17,517,109
Habersham 42,129 44 $ 17,601 47 $ 631,632
Hall 178,620 9 $ 83,393 12 $ 3,796,160
Hancock 9,558 130 $ 1,556 143 $ 93,294
Haralson 28,735 65 $ 12,153 66 $ 423,441
Harris 29,014 59 $ 8,175 86 $ 693,453
Rank (Thousands) Rank
Per Capita Amounts of Three Indicators
2008 County 1% Distribution
2007 Income Reported Net Digest
2008 Net Property and Utility Digest2007
AGI Reported on Georgia Returns
115 $ 410,706 102 $ 578 $ 12,303 $ 34,723
153 $ 100,873 153 $ 116 $ 8,781 $ 24,839
36 $ 1,659,421 38 $ 584 $ 18,199 $ 32,676
88 $ 504,706 92 $ 338 $ 13,569 $ 24,596
92 $ 425,320 101 $ 385 $ 11,460 $ 18,998
114 $ 240,017 125 $ 374 $ 13,661 $ 20,988
80 $ 1,066,203 58 $ 464 $ 13,999 $ 47,378
10 $ 4,932,588 12 $ 371 $ 32,033 $ 46,617
27 $ 2,742,441 27 $ 500 $ 16,343 $ 28,758
6 $ 9,083,743 6 $ 564 $ 32,392 $ 57,452
84 $ 636,558 80 $ 492 $ 13,638 $ 29,209
1 $ 54,856,212 1 $ 596 $ 34,726 $ 55,272
64 $ 1,612,030 40 $ 451 $ 14,614 $ 56,942
154 $ 77,792 158 $ 296 $ 12,432 $ 28,175
21 $ 5,737,177 11 $ 878 $ 24,340 $ 76,838
40 $ 1,679,688 37 $ 539 $ 15,689 $ 32,414
83 $ 572,483 84 $ 325 $ 12,025 $ 22,976
62 $ 1,618,849 39 $ 746 $ 26,956 $ 103,487
3 $ 32,121,496 2 $ 364 $ 22,706 $ 41,637
46 $ 1,250,099 52 $ 418 $ 14,993 $ 29,673
9 $ 6,624,565 10 $ 467 $ 21,253 $ 37,087
135 $ 311,557 115 $ 163 $ 9,761 $ 32,596
61 $ 709,749 74 $ 423 $ 14,736 $ 24,700
43 $ 1,299,409 51 $ 282 $ 23,901 $ 44,786

Loca
l Gov
ernm
ent S
ervi
ces
Div
isio
n
83
Georgia Department of Revenue | Statistical Report FY2009
(Thousands) Rank (Thousands)
Three Economic Indicators by County with Rankings and Per Capita Amounts
County 2007 Population Estimates
MasterEconomic Rank
2008 County 1% Distribution2007
AGI Reported on Georgia Returns
Hart 24,158 78 $ 9,060 82 $ 334,656
Heard 11,365 88 $ 20,512 44 $ 145,106
Henry 185,367 8 $ 85,098 11 $ 3,850,447
Houston 130,972 17 $ 63,366 16 $ 2,310,546
Irwin 9,904 131 $ 2,152 135 $ 122,189
Jackson 59,097 31 $ 28,331 33 $ 1,065,518
Jasper 13,634 108 $ 3,044 123 $ 220,570
Jeff Davis 13,260 111 $ 6,192 98 $ 168,990
Jefferson 16,415 102 $ 6,832 96 $ 212,363
Jenkins 8,588 134 $ 2,253 132 $ 87,275
Johnson 9,515 143 $ 1,819 138 $ 84,778
Jones 27,161 76 $ 7,293 90 $ 495,798
Lamar 16,909 100 $ 4,915 108 $ 237,830
Lanier 7,938 140 $ 1,749 140 $ 88,347
Laurens 47,370 42 $ 26,897 37 $ 711,241
Lee 32,979 61 $ 11,009 72 $ 581,725
Liberty 60,430 45 $ 24,504 41 $ 570,355
Lincoln 8,082 128 $ 2,247 133 $ 107,570
Long 11,296 136 $ 1,445 146 $ 97,486
Lowndes 101,639 25 $ 71,583 13 $ 1,505,718
Lumpkin 26,511 62 $ 9,773 78 $ 450,837
Macon 13,484 119 $ 3,938 115 $ 121,066
Madison 27,941 84 $ 6,118 99 $ 410,957
Marion 6,980 139 $ 1,417 148 $ 85,739
Table 22 Continued - Revised June 18, 2010

Local Governm
ent Services D
ivision
84
Georgia Department of Revenue | Statistical Report FY2009
(Thousands) Rank (Thousands)
Three Economic Indicators by County with Rankings and Per Capita Amounts
County 2007 Population Estimates
MasterEconomic Rank
2008 County 1% Distribution2007
AGI Reported on Georgia Returns
Hart 24,158 78 $ 9,060 82 $ 334,656
Heard 11,365 88 $ 20,512 44 $ 145,106
Henry 185,367 8 $ 85,098 11 $ 3,850,447
Houston 130,972 17 $ 63,366 16 $ 2,310,546
Irwin 9,904 131 $ 2,152 135 $ 122,189
Jackson 59,097 31 $ 28,331 33 $ 1,065,518
Jasper 13,634 108 $ 3,044 123 $ 220,570
Jeff Davis 13,260 111 $ 6,192 98 $ 168,990
Jefferson 16,415 102 $ 6,832 96 $ 212,363
Jenkins 8,588 134 $ 2,253 132 $ 87,275
Johnson 9,515 143 $ 1,819 138 $ 84,778
Jones 27,161 76 $ 7,293 90 $ 495,798
Lamar 16,909 100 $ 4,915 108 $ 237,830
Lanier 7,938 140 $ 1,749 140 $ 88,347
Laurens 47,370 42 $ 26,897 37 $ 711,241
Lee 32,979 61 $ 11,009 72 $ 581,725
Liberty 60,430 45 $ 24,504 41 $ 570,355
Lincoln 8,082 128 $ 2,247 133 $ 107,570
Long 11,296 136 $ 1,445 146 $ 97,486
Lowndes 101,639 25 $ 71,583 13 $ 1,505,718
Lumpkin 26,511 62 $ 9,773 78 $ 450,837
Macon 13,484 119 $ 3,938 115 $ 121,066
Madison 27,941 84 $ 6,118 99 $ 410,957
Marion 6,980 139 $ 1,417 148 $ 85,739
Rank (Thousands) Rank
Per Capita Amounts of Three Indicators
2008 County 1% Distribution
2007 Income Reported Net Digest
2008 Net Property and Utility Digest2007
AGI Reported on Georgia Returns
76 $ 889,603 66 $ 375 $ 13,853 $ 36,824
116 $ 429,079 99 $ 1,805 $ 12,768 $ 37,754
8 $ 6,927,520 9 $ 459 $ 20,772 $ 37,372
18 $ 3,481,217 20 $ 484 $ 17,642 $ 26,580
124 $ 205,289 136 $ 217 $ 12,337 $ 20,728
32 $ 2,300,745 30 $ 479 $ 18,030 $ 38,932
99 $ 458,527 97 $ 223 $ 16,178 $ 33,631
110 $ 258,926 121 $ 467 $ 12,744 $ 19,527
103 $ 403,559 105 $ 416 $ 12,937 $ 24,585
137 $ 213,714 134 $ 262 $ 10,162 $ 24,885
139 $ 160,488 142 $ 191 $ 8,910 $ 16,867
57 $ 762,726 72 $ 268 $ 18,254 $ 28,082
95 $ 468,333 95 $ 291 $ 14,065 $ 27,697
136 $ 163,193 141 $ 220 $ 11,130 $ 20,558
42 $ 1,185,418 55 $ 568 $ 15,015 $ 25,025
49 $ 822,984 69 $ 334 $ 17,639 $ 24,955
51 $ 1,182,120 56 $ 406 $ 9,438 $ 19,562
131 $ 303,226 117 $ 278 $ 13,310 $ 37,519
133 $ 224,082 129 $ 128 $ 8,630 $ 19,837
29 $ 2,664,553 29 $ 704 $ 14,814 $ 26,216
59 $ 1,172,858 57 $ 369 $ 17,006 $ 44,240
125 $ 313,143 114 $ 292 $ 8,978 $ 23,223
65 $ 633,465 81 $ 219 $ 14,708 $ 22,672
138 $ 223,219 130 $ 203 $ 12,283 $ 31,980

Loca
l Gov
ernm
ent S
ervi
ces
Div
isio
n
85
Georgia Department of Revenue | Statistical Report FY2009
(Thousands) Rank (Thousands)
Three Economic Indicators by County with Rankings and Per Capita Amounts
County 2007 Population Estimates
MasterEconomic Rank
2008 County 1% Distribution2007
AGI Reported on Georgia Returns
McDuffie 21,504 82 $ 11,400 71 $ 308,194
McIntosh 11,416 105 $ 4,792 109 $ 158,674
Meriwether 22,741 94 $ 4,997 105 $ 285,266
Miller 6,156 144 $ 2,010 136 $ 76,470
Mitchell 24,135 90 $ 8,318 85 $ 263,414
Monroe 25,103 46 $ 16,797 50 $ 561,209
Montgomery 8,993 138 $ 1,378 149 $ 114,409
Morgan 18,096 64 $ 11,549 69 $ 399,876
Murray 40,534 58 $ 14,521 58 $ 504,893
Muscogee 186,807 11 $ 104,102 8 $ 3,199,206
Newton 95,723 29 $ 32,021 30 $ 1,596,428
Oconee 31,225 40 $ 15,548 53 $ 1,011,969
Oglethorpe 13,911 113 $ 2,255 131 $ 212,990
Paulding 127,594 19 $ 42,372 27 $ 2,531,492
Peach 26,188 77 $ 12,206 65 $ 373,626
Pickens 30,453 51 $ 12,445 64 $ 645,457
Pierce 17,831 103 $ 5,635 103 $ 250,946
Pike 17,155 97 $ 3,322 121 $ 316,589
Polk 41,382 56 $ 15,487 54 $ 531,322
Pulaski 9,800 123 $ 2,878 125 $ 136,064
Putnam 20,172 52 $ 15,422 55 $ 418,965
Quitman 2,653 158 $ 527 157 $ 19,041
Rabun 16,427 67 $ 10,147 76 $ 256,466
Randolph 7,276 137 $ 2,782 126 $ 74,565
Table 22 Continued - Revised June 18, 2010

Local Governm
ent Services D
ivision
86
Georgia Department of Revenue | Statistical Report FY2009
(Thousands) Rank (Thousands)
Three Economic Indicators by County with Rankings and Per Capita Amounts
County 2007 Population Estimates
MasterEconomic Rank
2008 County 1% Distribution2007
AGI Reported on Georgia Returns
McDuffie 21,504 82 $ 11,400 71 $ 308,194
McIntosh 11,416 105 $ 4,792 109 $ 158,674
Meriwether 22,741 94 $ 4,997 105 $ 285,266
Miller 6,156 144 $ 2,010 136 $ 76,470
Mitchell 24,135 90 $ 8,318 85 $ 263,414
Monroe 25,103 46 $ 16,797 50 $ 561,209
Montgomery 8,993 138 $ 1,378 149 $ 114,409
Morgan 18,096 64 $ 11,549 69 $ 399,876
Murray 40,534 58 $ 14,521 58 $ 504,893
Muscogee 186,807 11 $ 104,102 8 $ 3,199,206
Newton 95,723 29 $ 32,021 30 $ 1,596,428
Oconee 31,225 40 $ 15,548 53 $ 1,011,969
Oglethorpe 13,911 113 $ 2,255 131 $ 212,990
Paulding 127,594 19 $ 42,372 27 $ 2,531,492
Peach 26,188 77 $ 12,206 65 $ 373,626
Pickens 30,453 51 $ 12,445 64 $ 645,457
Pierce 17,831 103 $ 5,635 103 $ 250,946
Pike 17,155 97 $ 3,322 121 $ 316,589
Polk 41,382 56 $ 15,487 54 $ 531,322
Pulaski 9,800 123 $ 2,878 125 $ 136,064
Putnam 20,172 52 $ 15,422 55 $ 418,965
Quitman 2,653 158 $ 527 157 $ 19,041
Rabun 16,427 67 $ 10,147 76 $ 256,466
Randolph 7,276 137 $ 2,782 126 $ 74,565
Rank (Thousands) Rank
Per Capita Amounts of Three Indicators
2008 County 1% Distribution
2007 Income Reported Net Digest
2008 Net Property and Utility Digest2007
AGI Reported on Georgia Returns
81 $ 571,777 85 $ 530 $ 14,332 $ 26,589
113 $ 505,955 91 $ 420 $ 13,899 $ 44,320
86 $ 486,704 93 $ 220 $ 12,544 $ 21,402
142 $ 155,811 144 $ 327 $ 12,422 $ 25,310
91 $ 516,652 90 $ 345 $ 10,914 $ 21,407
52 $ 1,479,840 46 $ 669 $ 22,356 $ 58,951
128 $ 194,500 138 $ 153 $ 12,722 $ 21,628
67 $ 934,022 63 $ 638 $ 22,097 $ 51,615
56 $ 966,166 61 $ 358 $ 12,456 $ 23,836
12 $ 4,714,621 13 $ 557 $ 17,126 $ 25,238
26 $ 2,886,205 25 $ 335 $ 16,678 $ 30,152
34 $ 1,602,985 42 $ 498 $ 32,409 $ 51,337
102 $ 409,226 104 $ 162 $ 15,311 $ 29,417
17 $ 4,327,952 15 $ 332 $ 19,840 $ 33,920
71 $ 571,698 87 $ 466 $ 14,267 $ 21,831
44 $ 1,374,158 49 $ 409 $ 21,195 $ 45,124
94 $ 374,825 108 $ 316 $ 14,074 $ 21,021
78 $ 460,746 96 $ 194 $ 18,455 $ 26,858
54 $ 919,595 64 $ 374 $ 12,839 $ 22,222
118 $ 234,204 127 $ 294 $ 13,884 $ 23,898
63 $ 1,519,570 44 $ 765 $ 20,770 $ 75,331
158 $ 95,482 154 $ 199 $ 7,177 $ 35,990
93 $ 1,709,704 36 $ 618 $ 15,612 $ 104,079
144 $ 181,164 140 $ 382 $ 10,248 $ 24,899

Loca
l Gov
ernm
ent S
ervi
ces
Div
isio
n
87
Georgia Department of Revenue | Statistical Report FY2009
(Thousands) Rank (Thousands)
Three Economic Indicators by County with Rankings and Per Capita Amounts
County 2007 Population Estimates
MasterEconomic Rank
2008 County 1% Distribution2007
AGI Reported on Georgia Returns
Richmond 197,643 12 $ 113,691 7 $ 2,554,741
Rockdale 81,650 27 $ 44,676 26 $ 1,532,302
Schley 4,106 152 $ 1,175 151 $ 62,759
Screven 15,043 109 $ 4,309 110 $ 181,980
Seminole 9,053 127 $ 3,134 122 $ 111,863
Spalding 62,960 38 $ 26,706 38 $ 922,777
Stephens 25,221 72 $ 11,454 70 $ 374,527
Stewart 4,642 150 $ 1,205 150 $ 42,441
Sumter 32,613 66 $ 13,455 61 $ 403,056
Talbot 6,599 142 $ 1,647 142 $ 75,382
Taliaferro 1,876 159 $ 289 159 $ 16,690
Tattnall 23,122 101 $ 5,680 102 $ 232,822
Taylor 8,708 129 $ 2,752 127 $ 104,628
Telfair 13,371 122 $ 3,571 118 $ 115,933
Terrell 10,275 125 $ 2,994 124 $ 124,703
Thomas 45,182 39 $ 22,175 42 $ 775,248
Tift 41,988 47 $ 26,588 39 $ 611,107
Toombs 27,746 73 $ 14,318 59 $ 360,958
Towns 10,872 93 $ 5,718 101 $ 161,011
Treutlen 6,961 149 $ 1,462 145 $ 67,003
Troup 63,382 32 $ 33,606 29 $ 1,061,064
Turner 9,278 132 $ 2,707 128 $ 95,698
Twiggs 10,261 135 $ 1,808 139 $ 118,325
Union 21,010 69 $ 9,725 79 $ 315,453
Rank (Thousands) Rank
Per Capita Amounts of Three Indicators
2008 County 1% Distribution
2007 Income Reported Net Digest
2008 Net Property and Utility Digest2007
AGI Reported on Georgia Returns
15 $ 4,390,188 14 $ 575 $ 12,926 $ 22,213
28 $ 2,914,617 24 $ 547 $ 18,767 $ 35,696
148 $ 82,556 156 $ 286 $ 15,285 $ 20,106
107 $ 391,802 106 $ 286 $ 12,097 $ 26,045
129 $ 243,718 124 $ 346 $ 12,357 $ 26,921
37 $ 1,426,038 48 $ 424 $ 14,657 $ 22,650
70 $ 683,365 75 $ 454 $ 14,850 $ 27,095
151 $ 138,303 146 $ 260 $ 9,143 $ 29,794
66 $ 679,864 76 $ 413 $ 12,359 $ 20,846
143 $ 216,363 133 $ 250 $ 11,423 $ 32,787
159 $ 80,549 157 $ 154 $ 8,897 $ 42,936
97 $ 410,685 103 $ 246 $ 10,069 $ 17,762
132 $ 219,717 132 $ 316 $ 12,015 $ 25,232
127 $ 256,061 122 $ 267 $ 8,670 $ 19,150
122 $ 234,691 126 $ 291 $ 12,137 $ 22,841
41 $ 1,596,145 43 $ 491 $ 17,158 $ 35,327
48 $ 945,707 62 $ 633 $ 14,554 $ 22,523
73 $ 576,350 83 $ 516 $ 13,009 $ 20,772
112 $ 907,052 65 $ 526 $ 14,810 $ 83,430
147 $ 112,092 151 $ 210 $ 9,625 $ 16,103
33 $ 1,840,872 33 $ 530 $ 16,741 $ 29,044
134 $ 211,484 135 $ 292 $ 10,315 $ 22,794
126 $ 193,833 139 $ 176 $ 11,532 $ 18,890
79 $ 1,229,584 53 $ 463 $ 15,014 $ 58,524
Table 22 Continued - Revised June 18, 2010

Local Governm
ent Services D
ivision
88
Georgia Department of Revenue | Statistical Report FY2009
(Thousands) Rank (Thousands)
Three Economic Indicators by County with Rankings and Per Capita Amounts
County 2007 Population Estimates
MasterEconomic Rank
2008 County 1% Distribution2007
AGI Reported on Georgia Returns
Richmond 197,643 12 $ 113,691 7 $ 2,554,741
Rockdale 81,650 27 $ 44,676 26 $ 1,532,302
Schley 4,106 152 $ 1,175 151 $ 62,759
Screven 15,043 109 $ 4,309 110 $ 181,980
Seminole 9,053 127 $ 3,134 122 $ 111,863
Spalding 62,960 38 $ 26,706 38 $ 922,777
Stephens 25,221 72 $ 11,454 70 $ 374,527
Stewart 4,642 150 $ 1,205 150 $ 42,441
Sumter 32,613 66 $ 13,455 61 $ 403,056
Talbot 6,599 142 $ 1,647 142 $ 75,382
Taliaferro 1,876 159 $ 289 159 $ 16,690
Tattnall 23,122 101 $ 5,680 102 $ 232,822
Taylor 8,708 129 $ 2,752 127 $ 104,628
Telfair 13,371 122 $ 3,571 118 $ 115,933
Terrell 10,275 125 $ 2,994 124 $ 124,703
Thomas 45,182 39 $ 22,175 42 $ 775,248
Tift 41,988 47 $ 26,588 39 $ 611,107
Toombs 27,746 73 $ 14,318 59 $ 360,958
Towns 10,872 93 $ 5,718 101 $ 161,011
Treutlen 6,961 149 $ 1,462 145 $ 67,003
Troup 63,382 32 $ 33,606 29 $ 1,061,064
Turner 9,278 132 $ 2,707 128 $ 95,698
Twiggs 10,261 135 $ 1,808 139 $ 118,325
Union 21,010 69 $ 9,725 79 $ 315,453
Rank (Thousands) Rank
Per Capita Amounts of Three Indicators
2008 County 1% Distribution
2007 Income Reported Net Digest
2008 Net Property and Utility Digest2007
AGI Reported on Georgia Returns
15 $ 4,390,188 14 $ 575 $ 12,926 $ 22,213
28 $ 2,914,617 24 $ 547 $ 18,767 $ 35,696
148 $ 82,556 156 $ 286 $ 15,285 $ 20,106
107 $ 391,802 106 $ 286 $ 12,097 $ 26,045
129 $ 243,718 124 $ 346 $ 12,357 $ 26,921
37 $ 1,426,038 48 $ 424 $ 14,657 $ 22,650
70 $ 683,365 75 $ 454 $ 14,850 $ 27,095
151 $ 138,303 146 $ 260 $ 9,143 $ 29,794
66 $ 679,864 76 $ 413 $ 12,359 $ 20,846
143 $ 216,363 133 $ 250 $ 11,423 $ 32,787
159 $ 80,549 157 $ 154 $ 8,897 $ 42,936
97 $ 410,685 103 $ 246 $ 10,069 $ 17,762
132 $ 219,717 132 $ 316 $ 12,015 $ 25,232
127 $ 256,061 122 $ 267 $ 8,670 $ 19,150
122 $ 234,691 126 $ 291 $ 12,137 $ 22,841
41 $ 1,596,145 43 $ 491 $ 17,158 $ 35,327
48 $ 945,707 62 $ 633 $ 14,554 $ 22,523
73 $ 576,350 83 $ 516 $ 13,009 $ 20,772
112 $ 907,052 65 $ 526 $ 14,810 $ 83,430
147 $ 112,092 151 $ 210 $ 9,625 $ 16,103
33 $ 1,840,872 33 $ 530 $ 16,741 $ 29,044
134 $ 211,484 135 $ 292 $ 10,315 $ 22,794
126 $ 193,833 139 $ 176 $ 11,532 $ 18,890
79 $ 1,229,584 53 $ 463 $ 15,014 $ 58,524

Loca
l Gov
ernm
ent S
ervi
ces
Div
isio
n
89
Georgia Department of Revenue | Statistical Report FY2009
(Thousands) Rank (Thousands)
Three Economic Indicators by County with Rankings and Per Capita Amounts
County 2007 Population Estimates
MasterEconomic Rank
2008 County 1% Distribution2007
AGI Reported on Georgia Returns
Upson 27,581 80 $ 9,701 80 $ 350,736
Walker 64,421 43 $ 16,272 51 $ 896,387
Walton 82,950 30 $ 28,117 34 $ 1,629,466
Ware 35,815 60 $ 21,514 43 $ 444,887
Warren 5,881 145 $ 1,949 137 $ 67,594
Washington 20,945 74 $ 11,741 67 $ 316,640
Wayne 28,989 79 $ 8,448 84 $ 379,811
Webster 2,234 157 $ 588 156 $ 28,360
Wheeler 6,777 151 $ 969 152 $ 49,848
White 24,936 68 $ 9,364 81 $ 382,957
Whitfield 92,633 23 $ 52,219 21 $ 1,716,047
Wilcox 8,615 146 $ 1,432 147 $ 74,325
Wilkes 10,268 117 $ 3,528 119 $ 132,594
Wilkinson 10,061 112 $ 5,918 100 $ 130,488
Worth 21,258 96 $ 4,977 106 $ 283,211
Other $ 5,930,803
Total 9,523,297 $ 4,363,551 $ 202,746,898
Aggregated Per Capita Amounts
Note: Population figures are estimated as at July 1, 2008 and counties are listed alphabetically.Sources: Population Division, U.S. Census Bureau (accessed October 8, 2009) and Local Government Services and Information Technology Division, Georgia Department of Revenue
Table 22 Continued - Revised June 18, 2010

Local Governm
ent Services D
ivision
90
Georgia Department of Revenue | Statistical Report FY2009
(Thousands) Rank (Thousands)
Three Economic Indicators by County with Rankings and Per Capita Amounts
County 2007 Population Estimates
MasterEconomic Rank
2008 County 1% Distribution2007
AGI Reported on Georgia Returns
Upson 27,581 80 $ 9,701 80 $ 350,736
Walker 64,421 43 $ 16,272 51 $ 896,387
Walton 82,950 30 $ 28,117 34 $ 1,629,466
Ware 35,815 60 $ 21,514 43 $ 444,887
Warren 5,881 145 $ 1,949 137 $ 67,594
Washington 20,945 74 $ 11,741 67 $ 316,640
Wayne 28,989 79 $ 8,448 84 $ 379,811
Webster 2,234 157 $ 588 156 $ 28,360
Wheeler 6,777 151 $ 969 152 $ 49,848
White 24,936 68 $ 9,364 81 $ 382,957
Whitfield 92,633 23 $ 52,219 21 $ 1,716,047
Wilcox 8,615 146 $ 1,432 147 $ 74,325
Wilkes 10,268 117 $ 3,528 119 $ 132,594
Wilkinson 10,061 112 $ 5,918 100 $ 130,488
Worth 21,258 96 $ 4,977 106 $ 283,211
Other $ 5,930,803
Total 9,523,297 $ 4,363,551 $ 202,746,898
Aggregated Per Capita Amounts
Note: Population figures are estimated as at July 1, 2008 and counties are listed alphabetically.Sources: Population Division, U.S. Census Bureau (accessed October 8, 2009) and Local Government Services and Information Technology Division, Georgia Department of Revenue
Rank (Thousands) Rank
Per Capita Amounts of Three Indicators
2008 County 1% Distribution
2007 Income Reported Net Digest
2008 Net Property and Utility Digest2007
AGI Reported on Georgia Returns
74 $ 631,465 82 $ 352 $ 12,717 $ 22,895
38 $ 1,309,497 50 $ 253 $ 13,915 $ 20,327
25 $ 2,810,701 26 $ 339 $ 19,644 $ 33,884
60 $ 662,884 77 $ 601 $ 12,422 $ 18,509
146 $ 155,948 143 $ 331 $ 11,494 $ 26,517
77 $ 759,223 73 $ 561 $ 15,118 $ 36,248
69 $ 791,160 71 $ 291 $ 13,102 $ 27,292
157 $ 87,007 155 $ 263 $ 12,695 $ 38,947
150 $ 126,364 148 $ 143 $ 7,355 $ 18,646
68 $ 1,025,354 60 $ 376 $ 15,358 $ 41,119
23 $ 3,449,185 21 $ 564 $ 18,525 $ 37,235
145 $ 141,658 145 $ 166 $ 8,627 $ 16,443
119 $ 336,636 111 $ 344 $ 12,913 $ 32,785
120 $ 359,033 110 $ 588 $ 12,970 $ 35,686
87 $ 426,217 100 $ 234 $ 13,323 $ 20,050
$ 351,438,926
$ 458 $ 21,290 $ 36,903

Loca
l Gov
ernm
ent S
ervi
ces
Div
isio
n
91
Georgia Department of Revenue | Statistical Report FY2009
Table 23 - Revised June 18, 2010Millage Rates by County - Alphabetical
CY2005 CY2006 CY2007 CY2008 CY2009
Appling 26.700 28.510 28.420 28.340 28.340
Atkinson 27.999 27.909 30.002 32.422 32.422
Bacon 27.250 26.639 27.750 28.725 28.738
Baker 26.370 26.260 24.610 24.600 20.765
Baldwin 24.620 23.620 25.120 24.960 24.960
Banks 21.368 20.353 20.298 21.798 21.798
Barrow 26.666 28.359 28.086 28.088 28.088
Bartow 27.940 27.390 26.680 25.990 25.950
Ben Hill 28.530 29.420 29.420 29.330 29.360
Berrien 26.250 32.250 32.250 32.250 32.250
Bibb 32.787 32.787 35.287 34.272 34.272
Bleckley 24.040 24.040 26.550 22.902 22.902
Brantley 37.050 29.848 31.868 36.636 36.760
Brooks 27.968 29.040 30.773 22.678 23.601
Bryan 23.492 20.337 20.733 21.287 23.687
Bulloch 19.170 19.170 20.640 20.590 20.590
Burke 21.702 21.577 22.491 22.826 22.826
Butts 32.116 33.232 33.232 33.169 35.669
Calhoun 35.490 35.010 25.345 27.950 27.836
Camden 27.128 27.000 27.000 26.700 26.700
Candler 28.630 27.159 24.239 22.654 23.693
Carroll 24.850 24.850 26.850 26.850 26.850
Catoosa 18.961 21.377 22.206 22.135 22.397
Charlton 41.536 41.602 32.450 34.640 36.870
Chatham 32.859 31.199 28.877 28.486 28.486
Chattahoochee 20.720 22.360 26.561 25.290 25.287
Chattooga 19.502 18.657 19.047 18.432 18.333
Cherokee 26.839 26.497 26.250 26.223 26.803
Clarke 33.050 33.050 33.050 33.200 33.450
Clay 30.076 30.076 30.076 27.377 27.377

Local Governm
ent Services D
ivision
92
Georgia Department of Revenue | Statistical Report FY2009
Table 23 Continued - Revised June 18, 2010Millage Rates by County - Alphabetical
CY2005 CY2006 CY2007 CY2008 CY2009
Clayton 30.847 32.914 32.521 32.948 35.586
Clinch 37.060 41.230 30.878 30.241 30.241
Cobb 29.870 29.750 28.750 28.750 28.750
Coffee 22.560 22.574 23.464 23.311 23.311
Colquitt 26.689 26.712 26.403 24.614 24.614
Columbia 26.810 26.810 26.977 26.977 26.977
Cook 23.465 23.965 23.965 25.965 25.965
Coweta 26.490 27.490 28.490 28.310 28.740
Crawford 31.250 31.250 25.833 25.831 26.284
Crisp 30.360 29.609 28.789 28.789 28.789
Dade 18.790 17.230 19.230 19.100 19.100
Dawson 22.434 22.434 22.434 22.434 22.434
Decatur 21.840 21.650 21.650 20.520 21.520
Dekalb 38.710 39.300 39.300 39.300 40.090
Dodge 20.500 19.050 19.950 19.700 22.000
Dooly 31.662 31.662 31.662 33.082 33.082
Dougherty 40.183 40.156 37.875 37.861 37.861
Douglas 26.899 28.790 27.811 27.776 29.532
Early 29.020 31.750 22.800 25.790 26.950
Echols 32.058 32.470 30.420 34.830 35.185
Effingham 30.552 30.754 29.911 29.729 28.083
Elbert 26.005 24.603 25.230 25.985 25.916
Emanuel 22.913 23.842 23.575 23.689 28.731
Evans 18.650 18.640 19.650 20.630 20.600
Fannin 20.169 20.169 17.360 18.310 18.310
Fayette 30.882 30.194 30.378 32.109 31.609
Floyd 29.761 29.679 29.359 29.938 29.938
Forsyth 22.883 22.631 22.528 23.858 23.934
Franklin 19.535 18.990 21.216 21.463 23.502
Fulton 34.733 35.558 34.283 33.692 36.192
Gilmer 21.263 21.663 21.163 18.650 21.500

Loca
l Gov
ernm
ent S
ervi
ces
Div
isio
n
93
Georgia Department of Revenue | Statistical Report FY2009
Table 23 Continued - Revised June 18, 2010Millage Rates by County - Alphabetical
CY2005 CY2006 CY2007 CY2008 CY2009
Glascock 33.820 33.820 27.530 27.530 27.530
Glynn 24.968 24.031 22.920 22.679 22.648
Gordon 24.400 27.223 26.726 27.278 24.331
Grady 23.802 21.802 22.550 23.650 23.650
Greene 19.061 14.239 14.622 15.512 15.853
Gwinnett 32.270 32.100 31.880 31.770 34.050
Habersham 23.373 23.173 22.847 21.870 21.870
Hall 24.660 25.550 23.770 24.430 24.430
Hancock 39.630 39.340 40.180 39.640 39.640
Haralson 25.049 25.029 24.949 27.109 27.600
Harris 24.710 24.710 24.278 22.950 23.450
Hart 17.833 17.316 18.250 18.246 18.246
Heard 22.573 23.573 22.559 22.460 22.460
Henry 36.950 37.509 37.510 37.279 37.279
Houston 24.850 23.260 23.350 23.350 25.220
Irwin 30.780 30.780 28.440 29.266 29.266
Jackson 32.651 32.580 32.225 32.099 32.172
Jasper 27.220 28.600 28.710 27.110 28.140
Jeff Davis 23.930 24.976 24.970 24.970 25.880
Jefferson 27.490 26.120 26.250 27.250 26.764
Jenkins 27.670 26.500 20.300 23.700 23.846
Johnson 25.961 25.998 21.917 21.917 21.926
Jones 29.568 31.518 29.618 29.618 31.368
Lamar 23.722 25.192 24.992 24.992 24.992
Lanier 34.140 36.140 30.500 30.490 31.490
Laurens 19.946 18.501 18.479 18.489 18.489
Lee 32.240 27.766 27.766 28.416 28.416
Liberty 33.480 32.851 33.534 32.930 32.930
Lincoln 26.854 24.483 24.132 25.827 26.697
Long 33.870 34.270 24.776 24.776 31.074
Lowndes 24.259 24.259 24.955 24.510 24.510

Local Governm
ent Services D
ivision
94
Georgia Department of Revenue | Statistical Report FY2009
Table 23 Continued - Revised June 18, 2010Millage Rates by County - Alphabetical
CY2005 CY2006 CY2007 CY2008 CY2009
Lumpkin 22.903 23.012 19.209 19.161 20.597
Macon 29.790 29.780 29.010 29.060 28.900
Madison 27.604 29.977 29.374 30.208 30.155
Marion 25.220 24.354 23.311 23.396 22.916
McDuffie 23.350 23.350 23.350 25.240 25.240
McIntosh 22.688 24.250 26.500 26.477 29.423
Meriwether 30.820 31.250 30.472 30.467 30.467
Miller 32.297 32.297 35.521 38.508 37.067
Mitchell 32.222 30.073 30.573 31.573 31.573
Monroe 24.950 24.950 25.350 22.781 23.381
Montgomery 25.583 27.083 23.170 23.173 23.196
Morgan 26.950 26.935 21.415 21.324 20.889
Murray 22.145 22.145 22.145 21.550 21.550
Muscogee 41.530 41.530 41.530 41.530 41.530
Newton 31.699 31.671 31.633 31.633 31.633
Oconee 25.380 26.180 24.730 24.436 24.436
Oglethorpe 24.120 25.065 25.994 27.590 26.619
Paulding 24.780 24.216 30.239 31.122 32.372
Peach 30.088 30.087 30.087 30.087 30.805
Pickens 21.530 21.730 20.853 20.615 22.480
Pierce 22.590 22.630 22.040 22.600 23.520
Pike 28.021 29.043 27.607 27.514 26.075
Polk 25.542 25.542 26.042 26.042 26.380
Pulaski 25.005 24.565 26.066 26.050 27.063
Putnam 20.354 18.739 17.014 14.400 15.900
Quitman 25.823 27.475 27.288 26.005 28.440
Rabun 17.648 17.858 17.690 17.460 17.326
Randolph 29.931 22.748 24.685 27.455 28.925
Richmond 27.806 29.201 29.611 30.148 30.148
Rockdale 36.550 36.080 36.080 35.980 35.980
Schley 30.510 30.840 33.000 34.470 30.980

Loca
l Gov
ernm
ent S
ervi
ces
Div
isio
n
95
Georgia Department of Revenue | Statistical Report FY2009
Table 23 Continued - Revised June 18, 2010Millage Rates by County - Alphabetical
CY2005 CY2006 CY2007 CY2008 CY2009
Screven 25.952 21.065 21.073 25.745 25.759
Seminole 28.279 27.917 27.140 26.121 25.871
Spalding 35.560 35.500 35.990 35.960 37.160
Stephens 27.100 27.090 28.400 29.970 29.970
Stewart 27.190 27.009 25.845 25.447 25.447
Sumter 27.963 29.131 29.885 31.024 30.612
Talbot 30.574 30.079 30.079 30.079 29.979
Taliaferro 26.620 30.260 31.720 29.330 39.620
Tattnall 29.002 28.999 28.936 24.713 24.791
Taylor 24.360 24.210 24.710 20.560 20.510
Telfair 24.532 23.389 24.532 29.759 29.439
Terrell 31.780 34.780 30.591 30.534 31.534
Thomas 22.546 22.444 26.522 21.220 21.130
Tift 28.094 27.207 27.207 27.707 27.707
Toombs 19.610 17.800 21.376 21.272 22.341
Towns 9.639 9.359 8.537 9.831 11.069
Treutlen 26.675 24.250 24.607 24.607 24.607
Troup 29.660 29.660 29.660 29.660 29.660
Turner 32.949 32.949 33.449 30.269 30.269
Twiggs 36.430 36.430 36.430 38.750 30.450
Union 16.122 14.300 14.229 14.098 14.588
Upson 27.020 27.390 28.000 27.270 27.270
Walker 21.296 22.331 22.236 22.133 22.072
Walton 29.154 30.254 30.251 30.245 31.582
Ware 32.311 32.311 31.844 31.844 31.844
Warren 33.230 30.750 30.000 31.400 31.400
Washington 28.896 29.317 26.116 26.018 24.809
Wayne 34.593 37.750 39.750 31.220 31.220
Webster 38.016 37.934 27.769 28.147 28.521
Wheeler 31.235 29.129 31.915 32.211 32.115
White 22.019 22.234 22.680 24.429 24.429
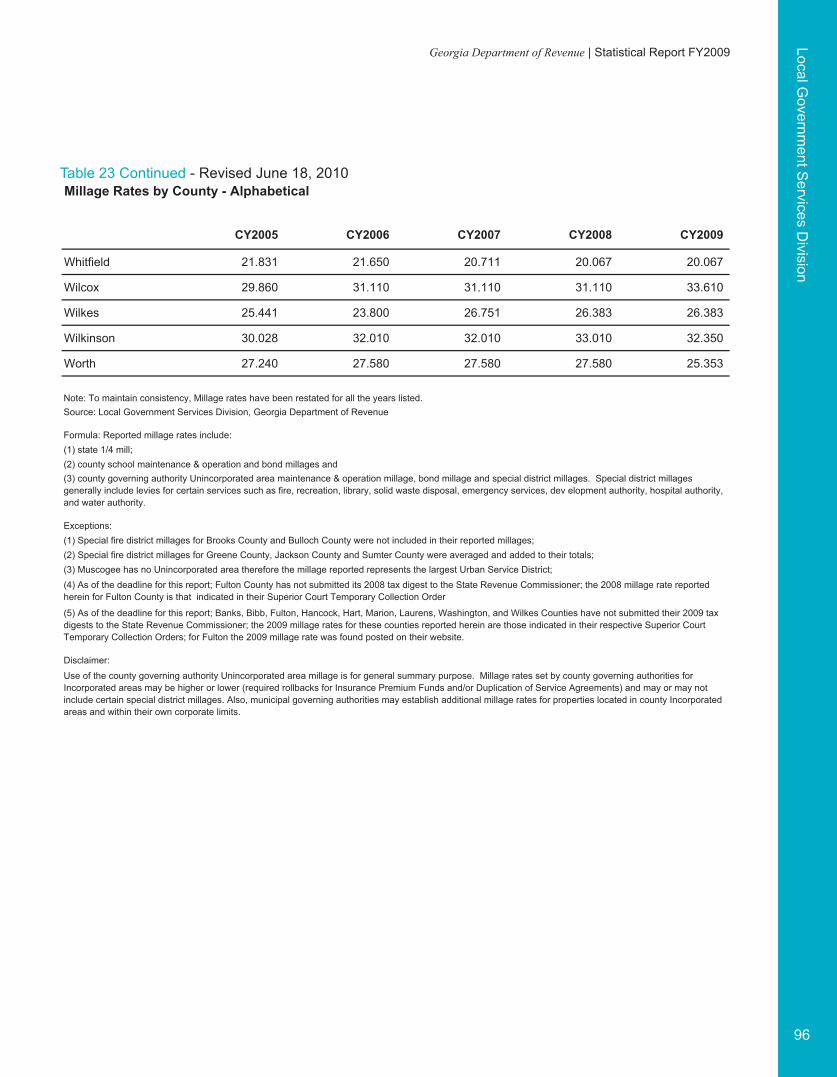
Local Governm
ent Services D
ivision
96
Georgia Department of Revenue | Statistical Report FY2009
Table 23 Continued - Revised June 18, 2010Millage Rates by County - Alphabetical
CY2005 CY2006 CY2007 CY2008 CY2009
138.12dleiftihW 21.650 20.711 20.067 20.067
068.92xocliW 31.110 31.110 31.110 33.610
144.52sekliW 23.800 26.751 26.383 26.383
820.03nosnikliW 32.010 32.010 33.010 32.350
042.72htroW 27.580 27.580 27.580 25.353
Note: To maintain consistency, Millage rates have been restated for all the years listed.
Formula: Reported millage rates include:(1) state 1/4 mill;(2) county school maintenance & operation and bond millages and
Exceptions:(1) Special fire district millages for Brooks County and Bulloch County were not included in their reported millages; (2) Special fire district millages for Greene County, Jackson County and Sumter County were averaged and added to their totals;(3) Muscogee has no Unincorporated area therefore the millage reported represents the largest Urban Service District;
Disclaimer:
Source: Local Government Services Division, Georgia Department of Revenue
(3) county governing authority Unincorporated area maintenance & operation millage, bond millage and special district millages. Special district millages generally include levies for certain services such as fire, recreation, library, solid waste disposal, emergency services, dev elopment authority, hospital authority, and water authority.
Use of the county governing authority Unincorporated area millage is for general summary purpose. Millage rates set by county governing authorities for Incorporated areas may be higher or lower (required rollbacks for Insurance Premium Funds and/or Duplication of Service Agreements) and may or may not include certain special district millages. Also, municipal governing authorities may establish additional millage rates for properties located in county Incorporated areas and within their own corporate limits.
(4) As of the deadline for this report; Fulton County has not submitted its 2008 tax digest to the State Revenue Commissioner; the 2008 millage rate reported herein for Fulton County is that indicated in their Superior Court Temporary Collection Order
(5) As of the deadline for this report; Banks, Bibb, Fulton, Hancock, Hart, Marion, Laurens, Washington, and Wilkes Counties have not submitted their 2009 tax digests to the State Revenue Commissioner; the 2009 millage rates for these counties reported herein are those indicated in their respective Superior Court Temporary Collection Orders; for Fulton the 2009 millage rate was found posted on their website.

Loca
l Gov
ernm
ent S
ervi
ces
Div
isio
n
97
Georgia Department of Revenue | Statistical Report FY2009
Table 24 - Revised June 18, 2010Millage Rates by County - Numerical
CY2009 CY2009 CY2009 CY2009
Towns 11.069 Catoosa 22.397 Tattnall 24.791 Pulaski 27.063
Union 14.588 Dawson 22.434 Washington 24.809 Upson 27.270
Greene 15.853 Heard 22.460 Baldwin 24.960 Clay 27.377
Putnam 15.900 Pickens 22.480 Lamar 24.992 Glascock 27.530
Rabun 17.326 Glynn 22.648 Houston 25.220 Haralson 27.600
Hart 18.246 Burke 22.826 McDuffie 25.240 Tift 27.707
Fannin 18.310 Bleckley 22.902 Chattahoochee 25.287 Calhoun 27.836
Chattooga 18.333 Marion 22.916 Worth 25.353 Effingham 28.083
Laurens 18.489 Montgomery 23.196 Stewart 25.447 Barrow 28.088
Dade 19.100 Coffee 23.311 Screven 25.759 Jasper 28.140
Whitfield 20.067 Monroe 23.381 Seminole 25.871 Appling 28.340
Taylor 20.510 Harris 23.450 Jeff Davis 25.880 Lee 28.416
Bulloch 20.590 Franklin 23.502 Elbert 25.916 Quitman 28.440
Lumpkin 20.597 Pierce 23.520 Bartow 25.950 Chatham 28.486
Evans 20.600 Brooks 23.601 Cook 25.965 Webster 28.521
Baker 20.765 Grady 23.650 Pike 26.075 Emanuel 28.731
Morgan 20.889 Bryan 23.687 Crawford 26.284 Bacon 28.738
Thomas 21.130 Candler 23.693 Polk 26.380 Coweta 28.740
Gilmer 21.500 Jenkins 23.846 Wilkes 26.383 Cobb 28.750
Decatur 21.520 Forsyth 23.934 Oglethorpe 26.619 Crisp 28.789
Murray 21.550 Gordon 24.331 Lincoln 26.697 Macon 28.900
Banks 21.798 White 24.429 Camden 26.700 Randolph 28.925
Habersham 21.870 Hall 24.430 Jefferson 26.764 Irwin 29.266
Johnson 21.926 Oconee 24.436 Cherokee 26.803 Ben Hill 29.360
Dodge 22.000 Lowndes 24.510 Carroll 26.850 McIntosh 29.423
Walker 22.072 Treutlen 24.607 Early 26.950 Telfair 29.439
Toombs 22.341 Colquitt 24.614 Columbia 26.977 Douglas 29.532

Local Governm
ent Services D
ivision
98
Georgia Department of Revenue | Statistical Report FY2009
Table 24 Continued - Revised June 18, 2010Millage Rates by County - Numerical
9002YC9002YC9002YC9002YC
Troup 29.660 Jones 31.368 Wilkinson 32.350 Rockdale 35.980
Floyd 29.938 Warren 31.400 Paulding 32.372 Fulton 36.192
Stephens 29.970 Long 31.074 Berrien 32.250 Brantley 36.760
Talbot 29.979 Wayne 31.220 Atkinson 32.422 Charlton 36.870
Richmond 30.148 Lanier 31.490 Liberty 32.930 Miller 37.067
Madison 30.155 Terrell 31.534 Dooly 33.082 Spalding 37.160
Clinch 30.241 Mitchell 31.573 Clarke 33.450 Henry 37.279
Turner 30.269 Walton 31.582 Wilcox 33.610 Dougherty 37.861
Twiggs 30.450 Fayette 31.609 Gwinnett 34.050 Taliaferro 39.620
Meriwether 30.467 Newton 31.633 Bibb 34.272 Hancock 39.640
Sumter 30.612 Ware 31.844 Echols 35.185 Dekalb 40.090
Peach 30.805 Wheeler 32.115 Clayton 35.586 Muscogee 41.530
Schley 30.980 Jackson 32.172 Butts 35.669
Source: Local Government Services Division, Georgia Department of Revenue
Formula: Reported millage rates include:(1) state 1/4 mill;(2) county school maintenance & operation and bond millages and
Exceptions:(1) Special fire district millages for Brooks County and Bulloch County were not included in their reported millages; (2) Special fire district millages for Greene County, Jackson County and Sumter County were averaged and added to their totals;(3) Muscogee has no Unincorporated area therefore the millage reported represents the largest Urban Service District;
Disclaimer:
(3) county governing authority Unincorporated area maintenance & operation millage, bond millage and special district millages. Special district millages generally include levies for certain services such as fire, recreation, library, solid waste disposal, emergency services, dev elopment authority, hospital authority, and water authority.
(4) As of the deadline for this report; Banks, Bibb, Fulton, Hancock, Hart, Marion, Laurens, Washington, and Wilkes Counties have not submitted their 2009 tax digests to the State Revenue Commissioner; the 2009 millage rates for these counties reported herein are those indicated in their respective Superior Court Temporary Collection Orders; for Fulton the 2009 millage rate was found posted on their website.
Use of the county governing authority Unincorporated area millage is for general summary purpose. Millage rates set by county governing authorities for Incorporated areas may be higher or lower (required rollbacks for Insurance Premium Funds and/or Duplication of Service Agreements) and may or may not include certain special district millages. Also, municipal governing authorities may establish additional millage rates for properties located in county Incorporated areas and within their own corporate limits.

Loca
l Gov
ernm
ent S
ervi
ces
Div
isio
n
99
Georgia Department of Revenue | Statistical Report FY2009
Homeowner’s Tax Relief Grant
Georgia’s Homeowner’s Tax Relief Grant was passed by the Georgia legislature in 1999. It provides homeowners with property tax relief for state, county, school, special district and city property taxes.
The total credit amount is deducted directly from a homeowner’s property tax bill. The enabling legislation requires the following statement be printed on each tax bill: “This reduction in your bill is the result of homeowner’s tax relief enacted by the Governor and the General Assembly of the State of Georgia.”
Homeowners who qualify for homestead exemption are automatically eligible to receive the homeowner’s tax relief credit. The Local Government Services Division manages the Homeowner Tax Relief Grant for the state and makes distributions to the local taxing authorities.
Since its inception, state government has reimbursed local taxing authorities for the revenue lost due to the tax credit.
Table 25Net HTRG Revenue Totals (Millions)
FY2005 FY2006 FY2007 FY2008 FY2009
Net HTRG Revenue 399$ 414$ 421$ 425$ 429$
School Revenue 211$ 217$ 221$ 224$ 226$
County Revenue 146$ 154$ 156$ 157$ 157$
City Revenue 42$ 43$ 44$ 45$ 42$
State Revenue 4$ 4$ 4$ 3$ 3$
Notes: In FY2005 thru FY2008, grant was based on $8,000 values to the home owner.
Source: Local Government Services Division and Accounting Unit, Finance Department, Georgia Department of Revenue - Monthly Press Release of Net Revenue Collections

Motor Vehicle and P
rocessing Center
100
Georgia Department of Revenue | Statistical Report FY2009
Motor Vehicle and Processing Center
Motor Vehicle and Processing Center Highlights:
Motor Vehicle• Awarded Governor’s Commendation for Excellence in Customer Service for Rapid Process
Improvement (RPI) efforts.• Manufactured New Revenue Sharing plates:
- Atlanta Falcons - Feline Friend-Dog and Cat Sterilization - Georgia Aquarium - Georgia Junior Golf Foundation - Georgia Soccer Association - Jekyll Island Sea Turtle Center
• Initiated Motor Carrier System Enhancements: - Online Georgia Unified Carrier Registration-IntraState (HB 57) - Pay Ad Valorem Taxes and Invoices over the Web for International Registration Plan (IRP) - Enter Fleet Mileage over the Web
• Expanded on Electronic Lien and Title (ELT) Program to - Three service providers - Sixty One financial institutions - Titles electronically sent to financial institution
• Eliminates titles lost in mail• Eliminates at least one printed title in the title history• Enhances security• Saves stationery, envelopes, and postage costs
• Initiated upgrade for Interactive Voice Recognition (IVR) utilized by financial institutions. - Eliminates A Call into the Call Center. - Allows 24/7 access to General Vehicle information for faster Vehicle loan processing. - Enhanced Customer Service.
• Realignment of Motor Vehicle Division in April 2009. - Placed under leadership of Processing Center Director. - Co-Directors realigned with Tax Law & Policy and Facilities to further support legislative,
policy, inventory, and warehousing functions.
Processing Center• Processed approximately 4 million individual tax returns.• Processed approximately 2.89 million individual electronic returns.• Processed approximately 2.9 million individual refunds.• Implemented Check21 software to allow the Department to electronically deposit payments.

Mot
or V
ehic
le a
nd P
roce
ssin
g C
ente
r
101
Georgia Department of Revenue | Statistical Report FY2009
Motor Vehicle
The Motor Vehicle Division issues license plates, Georgia Certificates of Title, and records liens and security interest information on all vehicles registered in Georgia.
Processing UnitMonitors fraudulent title activity and examines legal documents for issuance of titles such as Georgia and Out-of-State Titles, court orders and judgments, title bonds, and salvage inspections. It transmits vehicle information to the National Crime Information Center, and other vendors, as applicable.
Dealer Registration UnitProcesses Motor Vehicle Dealer license plates and registration. It manages Motor Vehicle tent sale authority for dealerships.
Sponsor/Special Tags UnitProcesses requests for Sponsor or Commemorative license plates for Sponsor organizations and higher learning institutions.
Commercial Vehicle UnitRegisters motor carriers operating motor vehicles weighing 26,001 pounds or more that travel in two or more states under the International Registration Plan. The Unit is also responsible for registering motor carriers operating under the International Fuel Tax Agreement and issuing intrastate permits such as a Motor Carrier of Property Permit and a Class IE Permit.
Inspection UnitConducts inspections for a “salvage,” “rebuilt,” and “restored,” vehicles.
Motor Vehicle Call CenterReceives more than 1,000 calls daily requesting assistance in interpreting and complying with state and federal laws concerning Georgia title and registration.

Motor Vehicle and P
rocessing Center
102
Georgia Department of Revenue | Statistical Report FY2009
Motor Vehicle Results and Performance Measures
FY2005 FY2006 FY2007 FY2008 FY2009
Salvage Inspection
Number of rebuilt salvage vehicle reinspections 22,618 23,208 20,991 17,437 16,545
Tag and Title Registration
● Commercial Truck Registration
Number of interstate commercial vehicle registrations - 45,102 45,526 43,751 51,926
● Motor Vehicle Registration
Number of Motor Vehicles tag registrations processed (Millions) - 8.2 8.4 8.5 8.5
Number of internet online motor vehicle title registrations - 232,917 401,273 459,361 474,167
● Titles
Amount of revenue generated from the issuance of motor vehicle tags and titles (Millions)
-$ 250$ 294$ 295$ 281$
Source: Motor Vehicle, Georgia Department of Revenue
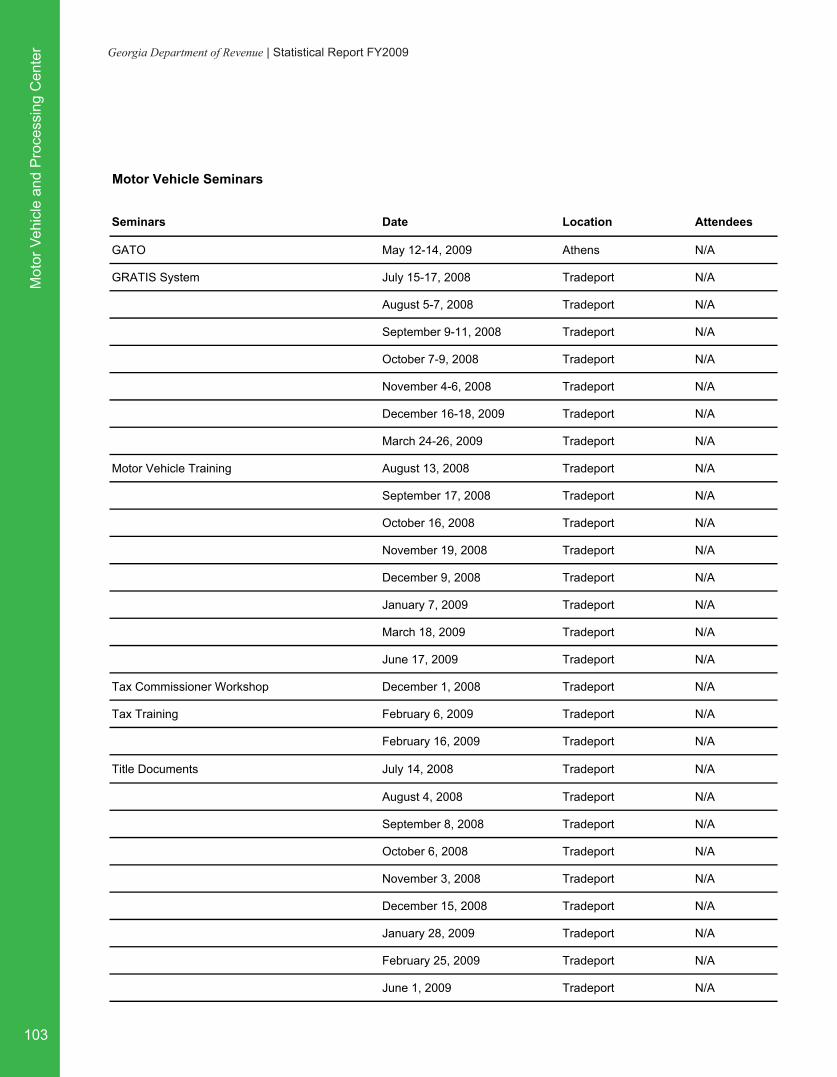
Mot
or V
ehic
le a
nd P
roce
ssin
g C
ente
r
103
Georgia Department of Revenue | Statistical Report FY2009
Motor Vehicle Seminars
Seminars Date Location Attendees
GATO May 12-14, 2009 Athens N/A
GRATIS System July 15-17, 2008 Tradeport N/A
August 5-7, 2008 Tradeport N/A
September 9-11, 2008 Tradeport N/A
October 7-9, 2008 Tradeport N/A
November 4-6, 2008 Tradeport N/A
December 16-18, 2009 Tradeport N/A
March 24-26, 2009 Tradeport N/A
Motor Vehicle Training August 13, 2008 Tradeport N/A
September 17, 2008 Tradeport N/A
October 16, 2008 Tradeport N/A
November 19, 2008 Tradeport N/A
December 9, 2008 Tradeport N/A
January 7, 2009 Tradeport N/A
March 18, 2009 Tradeport N/A
June 17, 2009 Tradeport N/A
Tax Commissioner Workshop December 1, 2008 Tradeport N/A
Tax Training February 6, 2009 Tradeport N/A
February 16, 2009 Tradeport N/A
Title Documents July 14, 2008 Tradeport N/A
August 4, 2008 Tradeport N/A
September 8, 2008 Tradeport N/A
October 6, 2008 Tradeport N/A
November 3, 2008 Tradeport N/A
December 15, 2008 Tradeport N/A
January 28, 2009 Tradeport N/A
February 25, 2009 Tradeport N/A
June 1, 2009 Tradeport N/A

Motor Vehicle and P
rocessing Center
104
Georgia Department of Revenue | Statistical Report FY2009
Table 26.1
Table 26.2
Number of Motor Vehicle Registrations and Tags Issued
FY2005 FY2006 FY2007 FY2008 FY2009
Registrations Issued 7,945,267 8,201,511 8,467,856 8,528,319 8,515,900
Tags Issued 2,320,689 2,910,967 2,851,018 2,692,263 1,673,948
Source: Motor Vehicle, Georgia Department of Revenue
Number of Motor Vehicle Registrations Sold by Major Category
FY2005 FY2006 FY2007 FY2008 FY2009
Passenger Cars 5,016,645 5,173,865 5,342,863 5,382,277 5,372,048
Motorcycles 140,771 157,781 172,200 186,719 195,776
Trucks 1,868,887 1,916,680 1,950,507 1,936,915 1,901,475
Trailers 889,943 921,636 967,470 985,871 1,008,660
Bus 28,779 31,318 34,614 36,331 37,743
Other 242 231 202 206 198
Total 7,945,267 8,201,511 8,467,856 8,528,319 8,515,900
Source: Motor Vehicle, Georgia Department of Revenue

Mot
or V
ehic
le a
nd P
roce
ssin
g C
ente
r
105
Georgia Department of Revenue | Statistical Report FY2009
Table 27Summary of Revenues from Motor Vehicle Tag, Title, and Related Items
FY2005 FY2006 FY2007 FY2008 FY2009
Registration
County collected Registration and Fees
195,432,438.40$ 196,131,501.55$ 190,592,800.89$ 193,437,010.13$ 186,574,202.78$
DOR collected Registration and Fees
162,481.00$ 927,878.00$ 978,934.25$ 1,078,096.00$ 1,220,741.00$
Refunds from Registration and Title Fees
(116,873.20)$ (182,594.00)$ (168,689.61)$ (157,417.85)$ (248,339.22)$
Sub-total 195,478,046.20$ 196,876,785.55$ 191,403,045.53$ 194,357,688.28$ 187,546,604.56$
Titles
County collected Title Fees 40,369,933.00$ 42,233,647.00$ 42,720,035.00$ 40,525,048.00$ 34,269,752.50$
DOR collectedTitle Fees 10,056,016.00$ 10,298,124.00$ 9,884,023.35$ 9,497,026.00$ 8,886,193.00$
Tag and Title CompliancePenalties
760,500.00$ 754,250.00$ 123,450.00$ 668,560.00$ 1,817,410.00$
Sub-total 51,186,449.00$ 53,286,021.00$ 52,727,508.35$ 50,690,634.00$ 44,973,355.50$
Total Amount ofNet Revenue * 246,664,495.20$ 250,162,806.55$ 244,130,553.88$ 245,048,322.28$ 232,519,960.06$
* Net revenue amounts are amended for account refunds, commissions retained by county tag agents and other accounting adjustments.
FY2009 (Registration Refunds) Thirty Four (34) Sponsor license plates failed to meet requirements for manufacture-all revenue refunded to applicants. Authority O.C.G.A. § 40-2-60.1
FY2009 (Tag Compliance Penalties) Significant increase in insurance compliance penalty revenue. Authority O.C.G.A. § 40-2-137Source: Motor Vehicle, Georgia Department of Revenue

Motor Vehicle and P
rocessing Center
106
Georgia Department of Revenue | Statistical Report FY2009
Table 28FY2009 Motor Vehicle Production Report - Tradeport Facility
Division/Section/Unit # of Phone CallsReceived Annually
# of Written CorrespondenceReceived and/or Sent
# of Email Correspondence Received and/or Sent
Title Processing 9,582 46,096 312
Commercial Vehicles (IRP) 41,839 4,332 1,070
Quality Assurance 25 7,986 15
MVD Call Center 266,813 219,374 24
County Help Desk 84,197 11,703 626
Help Desk Administration 160 480 5,020
GRATIS Training 50 - 100
Dealer Registration /Special Tags 16,634 54,667 5,500
Research 2,280 63,780 402
Grand Totals 421,580 408,418 13,069
Source: Motor Vehicle, Georgia Department of Revenue
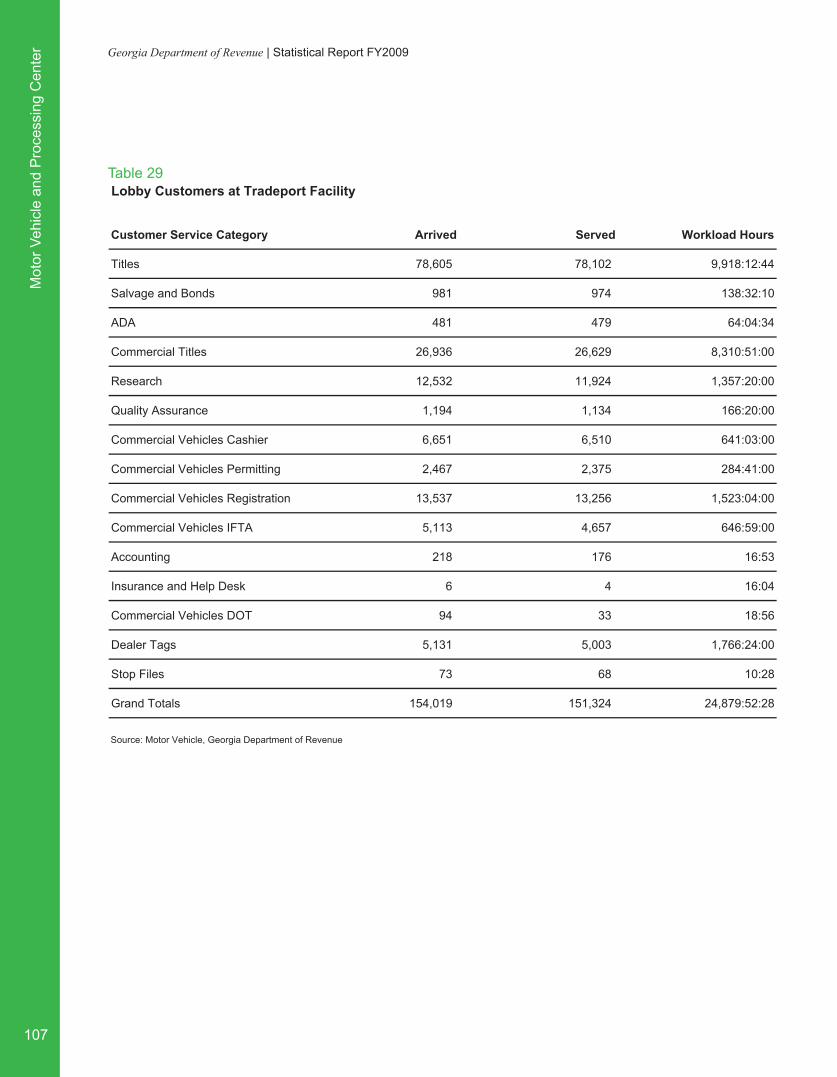
Mot
or V
ehic
le a
nd P
roce
ssin
g C
ente
r
107
Georgia Department of Revenue | Statistical Report FY2009
Table 29Lobby Customers at Tradeport Facility
Customer Service Category Arrived Served Workload Hours
Titles 78,605 78,102 9,918:12:44
Salvage and Bonds 981 974 138:32:10
ADA 481 479 64:04:34
Commercial Titles 26,936 26,629 8,310:51:00
Research 12,532 11,924 1,357:20:00
Quality Assurance 1,194 1,134 166:20:00
Commercial Vehicles Cashier 6,651 6,510 641:03:00
Commercial Vehicles Permitting 2,467 2,375 284:41:00
Commercial Vehicles Registration 13,537 13,256 1,523:04:00
Commercial Vehicles IFTA 5,113 4,657 646:59:00
Accounting 218 176 16:53
Insurance and Help Desk 6 4 16:04
Commercial Vehicles DOT 94 33 18:56
Dealer Tags 5,131 5,003 1,766:24:00
Stop Files 73 68 10:28
Grand Totals 154,019 151,324 24,879:52:28
Note: Park Research figures are unavailable for FY2008.
Source: Motor Vehicle, Georgia Department of Revenue

Motor Vehicle and P
rocessing Center
108
Georgia Department of Revenue | Statistical Report FY2009
Processing Center
The Processing Center performs frontline processing of all tax documents and paper check payments. On an annual basis, 8 million tax returns are received and processed, 60 million pages of documents have images created, and approximately $5 billion in tax payments are deposited.
Additionally, more than 6 million pieces of outgoing mail are distributed annually. Included in this effort are refund checks, motor vehicle titles, and tax notices.
The Processing Center has a staff of 120 employees and augments staffing during peak periods with seasonal temporary labor.
The Processing Center’s functions are performed in the following business units:
• Mail Center – receiving of incoming mail and processing of outgoing mail.• Mail Processing – opening, sorting, extracting and scanning of mail.• Imaging – high speed scanning of incoming mail.• Payment Processing – remittance processing and depositing of all paper check payments.• Data Entry – data capture of all tax returns via keying from paper and image.• Tax Verification – verification and error correction of tax returns.
The processing of taxpayer payments, the capturing of data, and the imaging of documents are the primary responsibilities of the Processing Center. The images and data captured are made available in various databases to the Department’s customer service representatives. Processing Center technology includes optical and intelligent character recognition, two-dimensional bar code, automated mail extraction and scanning equipment, high speed scanners, magnetic ink character recognition and encoding scanners, multi-line optical character reader mail sorting equipment, and electronic image cash letter depositing via Check21 software.
In addition, the Processing Center receives and processes all electronically filed returns.

Mot
or V
ehic
le a
nd P
roce
ssin
g C
ente
r
109
Georgia Department of Revenue | Statistical Report FY2009
Processing Center Results and Performance Measures
FY2005 FY2006 FY2007 FY2008 FY2009
Error Resolution
Number of Sales Tax returns processed through Error Resolution (Thousands)
787 700 572 636 458
Percent of Sales Tax returns processed through Error Resolution
56.3% 50.0% 48.0% 46.9% 36.1%
Total number of Error Resolution staff (All tax types) 100 90 82 78 68
Money Deposits
Average time lapse in days between receipts and deposit of check in a coupon payment
2.5 2.0 2.5 2.0 3.5
Average time lapse in days between receipts and deposit of check in a non-coupon payment
12.3 10.0 9.0 8.0 5.4
Amount of gross revenue collections deposited through electronic funds transfers (Billions)
12.5$ 13.0$ 17.3$ 17.7$ 17.3$
Returns Processing
Number of documents processed (Millions) (i)
7.9 7.9 7.9 8.7 7.7
Number of images created (Millions) (i)
52.6 54.0 54.0 80.0 62.0
Percent of Individual Income tax non-paper returns processed 59.8% 60.0% 68.2% 72.4% 73.1%
(i) Reduction in documents processed and images created due to reduction in Processing Center staff in FY2009.Source: Processing Center and Accounts Unit, Finance Department, Georgia Department of Revenue
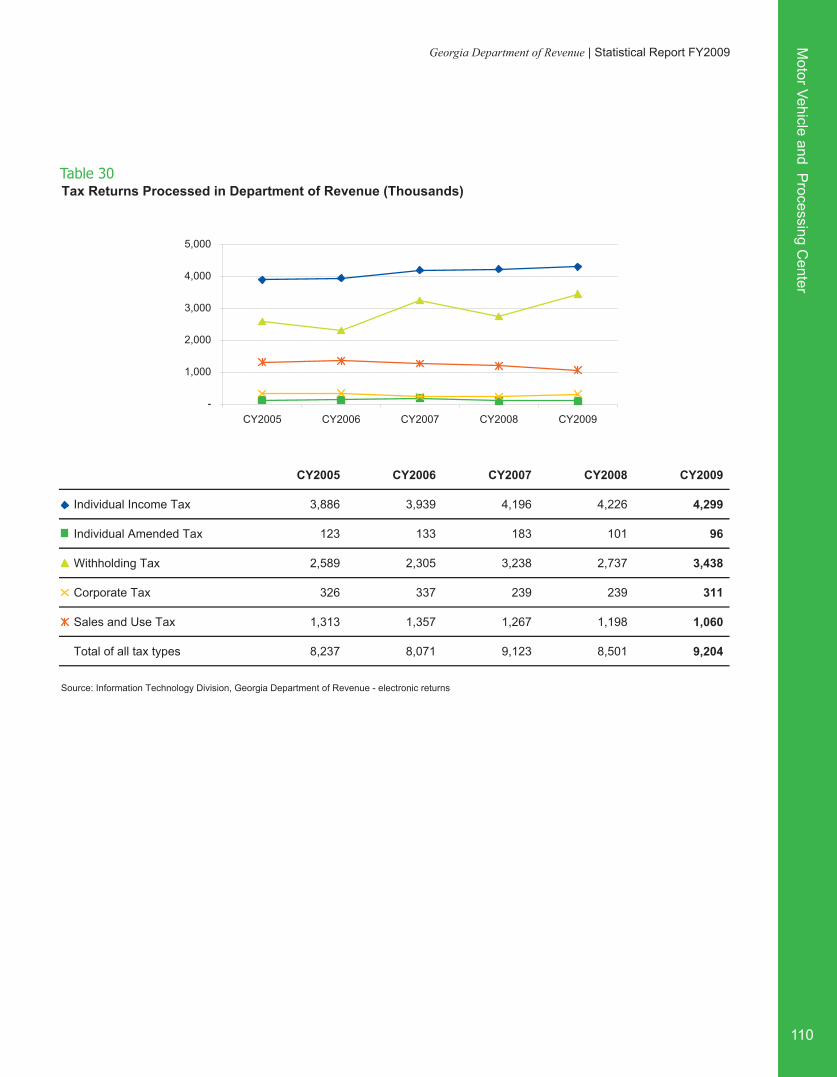
Motor Vehicle and P
rocessing Center
110
Georgia Department of Revenue | Statistical Report FY2009
Table 30Tax Returns Processed in Department of Revenue (Thousands)
CY2005 CY2006 CY2007 CY2008 CY2009
Individual Income Tax 3,886 3,939 4,196 4,226 4,299
Individual Amended Tax 123 133 183 101 96
Withholding Tax 2,589 2,305 3,238 2,737 3,438
Corporate Tax 326 337 239 239 311
Sales and Use Tax 1,313 1,357 1,267 1,198 1,060
Total of all tax types 8,237 8,071 9,123 8,501 9,204
Source: Information Technology Division, Georgia Department of Revenue - electronic returns
-
1,000
2,000
3,000
4,000
5,000
CY2005 CY2006 CY2007 CY2008 CY2009

Alc
ohol
and
Tob
acco
Div
isio
n
111
Georgia Department of Revenue | Statistical Report FY2009
The Alcohol and Tobacco Division is composed of two units: Law Enforcement Section and Licenses and Permits Section.
The Law Enforcement Section enforces all laws and regulations pertaining to the manufacture, possession, transportation and sale of legal and illegal alcoholic beverages, tobacco products, and the possession and operation of coin-operated amusement machines within the state. The Section also enforces the state’s motor fuel and motor carrier laws. Criminal investigators conduct specialized investigations regarding licensing background checks and licensing violations, sales of alcoholic beverages and tobacco products to minors, and excise tax evasion on alcohol, tobacco, and certain motor fuel products. The agents also assist other state, local, and federal enforcement agencies in related investigative matters.
The Licenses and Permits Section is charged with receiving, processing, collecting, and maintaining excise tax reports for malt beverages, wines, distilled spirits, cigarettes, cigars, little cigars, and loose or smokeless tobacco. It is also responsible for receiving and processing applications for wholesalers, importers, brokers, and manufacturers of alcoholic beverages and tobacco products. Alcoholic beverage brand registrations and keg registration forms and decals are also processed by this section.
Alcohol and Tobacco Division
Alcohol and Tobacco Highlight:
• In FY2008, the Underage Alcohol Investigations Group (UAIG) conducted a statewide initiative to perform compliance checks in all 159 counties, resulting in a non-compliance rate of 31%. During FY2009 the UAIG conducted another statewide initiative in all 159 counties which resulted in a non-compliance rate of 17%, a reduction of 14%.

Alcohol and Tobacco D
ivision
112
Georgia Department of Revenue | Statistical Report FY2009
Alcohol and Tobacco Division Results and Performance Measures
FY2005 FY2006 FY2007 FY2008 FY2009
Industry Regulations
● Amusement Machines
Number of amusement machines reviewed annually for compliance 8,764 8,312 2,130 1,743 1,482
Number of amusement machines seized due to non-compliance 301 193 197 397 102
● Law Enforcement
Number of citations issued 1,880 1,684 1,739 2,116 1,603
Percent of alcohol inspections where the operator is not in compliance with applicable law
18% 15% 12% 8% 8%
● Licenses and Permits
Number of alcohol license investigations conducted 1,338 1,387 1,499 1,523 1,469
Number of executive orders served after administrative hearings
1,663 1,658 1,372 1,505 2,137
Underage Investigation
Number of investigations of illegal alcohol sales to underage persons that lead to a sanction of some kind
285 448 774 1,243 659
Percent of retail vendors investigated who make illegal tobacco sales to underage persons
16% 18% 12% 8% 8%
Source: Alcohol and Tobacco Division, Georgia Department of Revenue

Alc
ohol
and
Tob
acco
Div
isio
n
113
Georgia Department of Revenue | Statistical Report FY2009
Alcohol Taxes
Georgia alcohol taxes are collected by the wholesaler at time of delivery to the retailer. The wholesaler remits all taxes collected to the Revenue Department. Georgia taxes alcoholic beverages as follows:
• Distilled Spirits - Distilled spirits (less than 190 proof) manufactured within Georgia are taxed at 50 cents (excise tax) per liter. Distilled spirits manufactured outside Georgia are taxed at $1 per liter. Alcohol (any product over 190 proof) manufactured inside Georgia is taxed at 70 cents per liter. Alcohol manufactured outside Georgia is taxed at $1.40 per liter. Some localities collect a local tax, which can be up to 22 cents per liter.
• Beer - The tax is $1.08 per standard case of 24 twelve-ounce containers (4 ½ cents per can) plus a uniform local beer tax of $1.20 per standard case (5 cents per can).
• Wine - Table wines (14 percent or less alcohol by volume) manufactured inside Georgia are taxed at 11 cents per liter. Table wines manufactured outside Georgia are taxed at 40 cents per liter. Dessert wines (more than 14 percent, but not more than 21 percent alcohol by volume) manufactured inside Georgia are taxed at 27 cents per liter. Dessert wines manufactured outside the state are taxed at 67 cents per liter. Wine fortified with distilled spirits, which results in an alcohol content of more than 21 percent alcohol by volume, is taxed as distilled spirits. Some localities collect a local tax, which can be up to 22 cents per liter.
The licensed sale of alcoholic beverages commenced in Georgia in the mid-1930s following the nationwide repeal of Prohibition. Georgia is a “local option” state for the licensing and sale of alcoholic beverages. Any city or county that wants to provide for the licensing and sale of distilled spirits can do so legally only after an affirmative vote of its citizens. Upon approval of the voters, the licensing, sale, and manufacture of distilled spirits is permitted provided the manufacturer, wholesaler, or retailer obtains an alcohol beverage license from the Department of Revenue and complies with all local licensing requirements.

Alcohol and Tobacco D
ivision
114
Georgia Department of Revenue | Statistical Report FY2009
Tobacco Taxes
Georgia’s state excise tax on cigarettes is 37 cents per pack of 20 ($3.70 per carton). The state excise tax on cigars is 23 percent of the wholesaler’s cost. The state excise tax on loose or smokeless tobacco is 10 percent of the wholesaler’s cost.
State taxation of cigars and cigarettes began in 1923. The rate on cigarettes increased gradually to 5 cents per pack in 1955. By 1971, it was 12 cents per pack. Effective July 1, 2003, the state excise tax on a pack of 20 cigarettes increased to the present rate of 37 cents. On a scale of 1 to 50 with the former representing the highest rate of tax, Georgia currently ranks 41st nationwide.
In July 2003, the state began imposing an excise tax on loose and smokeless tobacco. It is based upon 10 percent of the wholesale cost price. Effective July 2003, the tax rate on “little cigars” (weighing not more than 3 pounds per thousand) increased from 2 mills to 2.5 mills each. The tax on all other cigars increased from 13 percent to 23 percent of the wholesale cost price.
Table 31Tax and Fee Collections by the Enforcement Unit of the Alcohol and Tobacco Division (Thousands)
FY2005 FY2006 FY2007 FY2008 FY2009
Delinquent Tax Collections 6,900$ 5,869$ 10,385$ 11,631$ 11,377$
Fee Collections 142$ 123$ 118$ 137$ 138$
Executive Orders /Administrative Penalties / Fines 733$ 576$ 520$ 528$ 966$
Total Collections and Fines Paid 7,775$ 6,568$ 11,023$ 12,296$ 12,481$
Source: Alcohol and Tobacco Division, Georgia Department of Revenue

Alc
ohol
and
Tob
acco
Div
isio
n
115
Georgia Department of Revenue | Statistical Report FY2009
Table 32Alcohol and Tobacco Division Performance Figures
FY2005 FY2006 FY2007 FY2008 FY2009
Number of Alcohol Agents 32 30 30 28 24
Alcohol Inspections 3,247 3,630 3,561 4,085 4,192
Alcohol Investigations 1,334 1,377 1,499 1,523 1,469
Alcohol Citations 1,861 1,659 1,716 2,094 1,603
Underage Alcohol Investigations 1,851 2,530 2,556 4,202 3,641
Underage Alcohol Citations 284 537 774 1,154 615
Liquor License Investigations 1,921 2,530 2,652 1,523 1,469
Still Seizures 2 4 - - -
Tobacco Inspections 2,049 2,552 2,456 2,902 3,178
Tobacco Investigations 4 9 9 11 13
Tobacco Citations 18 25 23 22 37
Underage Tobacco Investigations 553 1,008 1,568 2,095 1,782
Executive Orders 1,663 1,658 1,372 1,505 2,137
Game Inspections 8,764 8,312 2,130 1,743 1,482
Felony Arrests 13 9 3 1 19
Misdemeanor Arrests 202 260 196 211 221
Dyed Fuel Inspections - 2,006 4,349 5,253 6,252
Dyed Fuel Violations - 115 158 151 158
Source: Alcohol and Tobacco Division, Georgia Department of Revenue

Alcohol and Tobacco D
ivision
116
Georgia Department of Revenue | Statistical Report FY2009
Table 33.1Revenue from Selective Excise Taxes (Thousands)
FY2005 FY2006 FY2007 FY2008 FY2009
Beer
Beer Taxes 82,175$ 86,313$ 85,956$ 88,260$ 87,821$
Fines and Forfeitures 528$ 638$ 603$ 293$ 62$
Refunds (5)$ 2$ (3)$ (8)$ (7)$
Total 82,698$ 86,953$ 86,556$ 88,545$ 87,876$
Tobacco
Stamp Sales 249,016$ 243,680$ 242,805$ 239,796$ 229,704$
Fines and Forfeitures 167$ 3$ 150$ 5$ 577$
Refunds (127)$ (141)$ (6)$ (178)$ (31)$
Total 249,056$ 243,542$ 242,949$ 239,623$ 230,250$
Liquor
Liquor Taxes 43,819$ 43,973$ 48,385$ 47,602$ 49,485$
Fines and Forfeitures 163$ 12$ 58$ 251$ 27$
Refunds (5)$ (8)$ (1)$ (8)$ (18)$
Pre-License Investigations 85$ 47$ 289$ 69$ 104$
Total 44,062$ 44,024$ 48,731$ 47,914$ 49,598$
Motor Fuel
Total 461,391$ 433,329$ 493,449$ 473,046$ 438,329$
Wine
Wine Taxes 24,061$ 25,854$ 25,733$ 28,880$ 29,344$
Fines and Forfeitures 34$ 2$ 13$ -$ -$
Refunds (4)$ (4)$ (2)$ (7)$ (6)$
Total 24,091$ 25,852$ 25,744$ 28,873$ 29,338$
Selective Excise Taxes Total 861,298$ 833,700$ 897,429$ 878,001$ 835,391$
(i) Commercial Business Licenses figures were unavailable for FY2008 and FY2009. Selective Taxes have been adjusted for fines, penalties, forfeiture receipts and refunds.(ii) Retailer Licenses has been restated to include multiple licenses sold, now broken out into their respective alcohol types for ease of reference.Source: Alcohol and Tobacco, Taxpayer Services and Information Technology Divisions, Georgia State Department of Revenue

Alc
ohol
and
Tob
acco
Div
isio
n
117
Georgia Department of Revenue | Statistical Report FY2009
Table 33.2Revenue from Business License Fees (Thousands)
FY2005 FY2006 FY2007 FY2008 FY2008
Beer Dealers
License and Brand Registration 2$ N/A 1$ -$ -$
Wholesaler Licenses 15$ N/A 21$ 31$ 48$
Retailer Licenses (ii) 559$ 281$ 397$ 441$ 502$
Special Permits 34$ N/A 26$ 1$ -$
Total 610$ 281$ 445$ 473$ 550$
Cigar and Cigarette Dealers
Wholesaler, Manufacturer and Importer Licenses 14$ (231)$ 11$ 18$ 15$
Manufacturer Representative Licenses -$ -$ -$ -$ -$
Total 14$ (231)$ 11$ 18$ 15$
Liquor Dealers
License and Brand Registration 22$ 16$ 20$ 20$ -$
Wholesaler Licenses and Permits 15$ 5$ 47$ 31$ 73$
Retailer Licenses (ii) 417$ 194$ 486$ 880$ 896$
Special Permits 39$ 23$ 32$ -$ -$
Retail In-Room Service License Fees N/A N/A 2$ -$ -$
Total 493$ 238$ 587$ 931$ 969$
Wine Dealers
License and Brand Registration 2$ 1$ 1$ -$ -$
Wholesaler Licenses and Permits 20$ 13$ 31$ 38$ 47$
Retailer Licenses (ii) 478$ 205$ 349$ 481$ 442$
Special Permits -$ -$ -$ -$ -$
Special Order Shipping 5$ 2$ 14$ 16$ 27$
Total 505$ 221$ 395$ 535$ 516$

Alcohol and Tobacco D
ivision
118
Georgia Department of Revenue | Statistical Report FY2009
Table 33.2 ContinuedRevenue from Business License Fees (Thousands)
FY2005 FY2006 FY2007 FY2008 FY2008
Coin-Operated Amusement Machines
Annual Licenses and Permit Fees 1,260$ 775$ 1,855$ 1,862$ 1,930$
Refunds (3)$ -$ -$ (10)$ (4)$
Total 1,257$ 775$ 1,855$ 1,852$ 1,926$
Commercial Business Licenses (i)
Licenses -$ 46,512$ 39,733$ -$ -$
Refunds -$ (13,082)$ (9,870)$ -$ -$
Total -$ 33,430$ 29,863$ -$ -$
Business Licenses Fees Total 2,879$ 34,714$ 33,156$ 3,809$ 3,976$
(i) Commercial Business Licenses figures were unavailable for FY2008 and FY2009. Selective Taxes have been adjusted for fines, penalties, forfeiture receipts and refunds.(ii) Retailer Licenses has been restated to include multiple licenses sold, now broken out into their respective alcohol types for ease of reference.
Source: Alcohol and Tobacco, Taxpayer Services and Information Technology Divisions, Georgia State Department of Revenue

Com
plia
nce
Div
isio
n
119
Georgia Department of Revenue | Statistical Report FY2009
The Compliance Division is responsible for ensuring taxpayer compliance with Georgia’s tax laws. It is comprised of three units: Audit Unit, Collections Unit and Special Collections Unit. The Division also oversees the Department’s 11 regional offices and conducts education seminars designed to educate taxpayers so they have a better understanding of Georgia’s tax laws.
Compliance Division
Compliance Division Highlights:
• Offset more than 59,000 federal refund checks recovering more than $27.2 million owed to the state by individuals due to unpaid taxes.
• The11Regionalofficesanswered400,305taxpayerassistance calls and had over 66,000 walk-in taxpayers.
• Implemented the Sales Tax portion of the Integrated Tax System that allows the traveling auditor to use the remote audit software package to complete the audit.
• Implemented the Compliance Data Warehouse that will help identify non registered, under-reporting, and underpaying taxpayers.

Com
pliance Division
120
Georgia Department of Revenue | Statistical Report FY2009
Compliance Division Results and Performance Measures
FY2005 FY2006 FY2007 FY2008 FY2009
Assessment
Number of proposed assessments issued 240,000 230,000 245,012 329,535 488,156
Number of collections received during assessment phase (Millions) 136 140 136 134 119
Audit
Average revenue per audit hour (All tax types) 2,006$ 1,771$ 1,899$ 1,139$ $ 1,486
Percent of audits that find business not in compliance with the tax laws 38% 42% 39% 39% 55%
Collections
Trust tax (sales and withholding) accounts collection cycle in days 165 165 165 165 165
Collections on delinquent and deficient accounts (Millions) 392$ 235$ 357$ 387$ 345$
Source: Compliance Division, Georgia Department of Revenue

Com
plia
nce
Div
isio
n
121
Georgia Department of Revenue | Statistical Report FY2009
Audit Unit
Performs audits within and outside Georgia. The types of tax audits include: individual and corporate income, international fuel tax agreement, motor fuel, sales and use, unclaimed property and withholding.
Collection Unit
Continually examines taxpayer registrations, compliance with filing deadlines and collects delinquent accounts. The Unit is responsible for tax compliance for special events which often involve out-of-state-based or other businesses that are not registered in Georgia for the collection of sales and use tax. Each regional office monitors events in its region to ensure that sales and use tax is being properly collected and remitted.
Special Collections Unit
Responsible for installment payment agreements, processing, offer in compromise applications, problem resolution, bankruptcy, and the Compliance Call Center. The Unit also provides taxpayer assistance with free income tax return preparations at various locations during the tax season.
Table 34Delinquent Tax Collections by Compliance Division Compared to Number of Accounts Processed
FY2005 FY2006 FY2007 FY2008 FY2009
Number of Accounts Processed (Actual) 667,053 661,193 637,948 582,499 526,919
Collections by Compliance (Thousands) 216,972$ 225,353$ 231,296$ 211,226$ 186,021$
Source: Compliance Division, Georgia Department of Revenue

Com
pliance Division
122
Georgia Department of Revenue | Statistical Report FY2009
The Compliance Division coordinates specialized initiatives designed to increase compliance utilizing the various collection tools available to the Department. The program(s) began in June 2004 and as of June 30, 2009, these initiatives have collected $501.8 million. The initiatives include:
• Alcohol and Automobile Dealer License Renewal Programs - Money collected as a result of holding liquor license and automobile dealer license renewals until any outstanding tax obligation is satisfied.
• Treasury Offset Program - Department forwards a list of delinquent taxpayers to the US Department
of Treasury, which manages the program. Treasury in turn sends the Department all or part of an individual’s federal income tax refund to satisfy the outstanding Georgia tax obligation.
• Private Collection Agencies - Companies under contract with the Department to collect delinquent liabilities.
• Private Collection Agency Call Center - Responsible for taking calls from taxpayer accounts assigned to a private collection agency. A series of notices are mailed which is the last action taken prior to forwarding the receivable to a private collection agency.
• Internet List Collections - Money collected as a result of posting names of delinquent taxpayers (individuals and businesses) on the Department’s website.
• Individual Income Tax Delinquent Program - Phase three of the Initiative Program concentrates on increasing individual income tax delinquent investigations.
• Tax Incentive Examination Program - Phase four of the Initiative Program that increases corporate income tax audits focusing on tax credit.
Table 35Revenue from Collection Initiatives (Millions): September 2003 thru June 2009
Alcohol Program 86.6$
Treasury (IRS) Offset Program 161.4$
Private Collection Agencies and Call center 150.7$
Internet listing of delinquent taxpayers 61.2$
Individual Income Tax 26.0$
Tax Incentive Program 15.9$
Total 501.8$
Source: Compliance Division, Georgia Department of Revenue
Individual Income Tax$26.0
Tax Incentive Program$15.9
Alcohol Program$86.6
Treasury (IRS) Offset Program$161.4
Private Collection Agencies and Call Center
$150.7
Internet listing ofdelinquent taxpayers
$61.2
Total: $501.8
Source: Compliance Division, Georgia Department of Revenue

Sta
te R
even
ue C
olle
ctio
ns a
nd T
rend
s
123
Georgia Department of Revenue | Statistical Report FY2009
Table 36
Table 37
State Revenue Collections and Trends
Cost of Collection Fees Collected (Thousands)
FY2005 FY2006 FY2007 FY2008 FY2009
Cost of Collection Fees Collected 9,697$ 10,989$ 12,012$ 11,806$ 11,298$
Source: Accounting Unit, Finance Department, Georgia Department of Revenue - Monthly Press Release of Net Revenue Collections
$-
$3,000
$6,000
$9,000
$12,000
$15,000
FY2005 FY2006 FY2007 FY2008 FY2009
Comparison of Sales Tax Paid to the State Treasury and Sales Tax Distribution (Millions)
FY2005 FY2006 FY2007 FY2008 FY2009
Net State Collection 5,282$ 5,745$ 5,949$ 5,781$ 5,342$
Distributions 3,745$ 4,311$ 4,725$ 4,832$ 4,360$
Source: Accounting Unit, Finance Department, Georgia Department of Revenue - Monthly Press Release of Net Revenue Collections
$-
$2,000
$4,000
$6,000
$8,000
$10,000
FY2005 FY2006 FY2007 FY2008 FY2009

State R
evenue Collections and Trends
124
Georgia Department of Revenue | Statistical Report FY2009
Table 38CY2009 Refund History by Month
Month
Individual Corporate Other (Sales Taxes)
Refunds(Thousands)
Number of Accounts
Refunds(Thousands)
Number of Accounts
Refunds(Thousands)
Number of Accounts
January $ 97,774 188,328 $ 34,221 650 $ 2,514 172
February $ 558,495 977,062 $ 13,558 1,007 $ 2,917 182
March $ 435,618 651,493 $ 37,573 943 $ 2,334 160
April $ 398,472 530,370 $ 34,605 784 $ 7,157 214
May $ 137,471 166,897 $ 21,113 675 $ 3,604 46
June $ 126,077 159,058 $ 10,309 1,433 $ 2,848 233
July $ 190,997 257,462 $ 13,920 1,272 $ 7,829 268
August $ 162,241 200,716 $ 21,206 1,084 $ 3,189 230
September $ 58,332 48,091 21,597$ 2,339 $ 8,492 250
October $ 105,434 65,975 35,118$ 2,543 $ 7,082 228
November $ 66,041 32,987 $ 14,287 1,164 $ 5,300 279
December $ 39,405 17,013 $ 32,203 799 $ 1,533 183
Source: Accounting Unit, Finance Department, Georgia Department of Revenue - Monthly Press Release of Net Revenue Collections

Sta
te R
even
ue C
olle
ctio
ns a
nd T
rend
s
125
Georgia Department of Revenue | Statistical Report FY2009
Table 39Net Revenue Collections by Georgia Department of Revenue (Unaudited and Thousands)
FY2005 FY2006 FY2007 FY2008 FY2009
Fiscal Year Collections
Amount 14,693,214$ 16,393,752$ 17,639,834$ 17,449,859$ 15,619,041$
Monthly Collections
July 870,867$ 1,093,198$ 1,176,085$ 1,299,683$ 1,213,291$
August 1,237,074$ 1,296,959$ 1,275,942$ 1,353,788$ 1,259,631$
September 1,343,923$ 1,460,918$ 1,564,037$ 1,561,749$ 1,632,334$
October 1,153,479$ 1,304,776$ 1,360,901$ 1,388,598$ 1,386,860$
November 1,148,740$ 1,208,629$ 1,278,362$ 1,408,993$ 1,419,543$
December 1,377,758$ 1,539,857$ 1,634,397$ 1,624,867$ 1,489,148$
January 1,578,151$ 1,795,724$ 1,978,077$ 1,837,297$ 1,575,265$
February 705,841$ 886,113$ 961,225$ 965,846$ 629,448$
March 1,110,105$ 1,200,704$ 1,174,222$ 1,155,087$ 987,986$
April 1,270,517$ 1,334,743$ 1,309,159$ 1,761,180$ 1,399,047$
May 1,451,619$ 1,673,929$ 2,140,232$ 1,473,892$ 1,262,138$
June 1,445,140$ 1,598,202$ 1,787,195$ 1,618,879$ 1,364,350$
Source: Accounting Unit, Finance Department, Georgia Department of Revenue - Monthly Press Release of Net Revenue Collections

State R
evenue Collections and Trends
126
Georgia Department of Revenue | Statistical Report FY2009
Table 40Net Trends in Georgia's State Tax Revenues by Major Sources (Thousands)
FY2005 FY2006 FY2007 FY2008 FY2009
Other Sources 557,883$ 883,973$ 968,045$ 1,003,093$ 945,952$
Selective Sales Tax 860,319$ 833,010$ 918,288$ 877,381$ 834,621$
General Sales and Use Tax 5,281,884$ 5,745,409$ 5,915,519$ 5,780,867$ 5,342,569$
Individual and Corporate Tax 7,993,128$ 8,931,360$ 9,837,982$ 9,788,518$ 8,495,899$
Total Taxes/Other Revenues 14,693,214$ 16,393,752$ 17,639,834$ 17,449,859$ 15,619,041$
Note: Selective Sales Taxes includes Motor Fuel Excise Tax and all Tobacco and Alcohol Taxes.The above figures are extracted from the Department of Revenue's annual Revenue Collection Press Releases published during the relevant years.Source: Accounting Unit, Finance Department, Georgia Department of Revenue - Monthly Press Release of Net Revenue Collections
$-
$2,000,000
$4,000,000
$6,000,000
$8,000,000
$10,000,000
FY2005 FY2006 FY2007 FY2008 FY2009

Sta
te R
even
ue C
olle
ctio
ns a
nd T
rend
s
127
Georgia Department of Revenue | Statistical Report FY2009
Table 41Comparison of Net Collections and Population
GA Population (Thousands)
Net Collections (Millions)
FY2005 FY2006 FY2007 FY2008 FY2009
GA Population (Thousands) 8,911 9,094 9,319 9,523 9,686
Net Collections (Millions) 14,693$ 16,394$ 17,640$ 17,450$ 15,619$
Note: All population figures are estimated figures and restated each year.Source: Accounting Unit, Finance Department, Georgia Department of Revenue - Monthly Press Release of Net Revenue Collections and US Department of Commerce, Bureau of Economic Analysis, Released July 2008 (accessed October 2009)
$-
$4,000
$8,000
$12,000
$16,000
$20,000
FY2005 FY2006 FY2007 FY2008 FY2009
-
2,000
4,000
6,000
8,000
10,000
FY2005 FY2006 FY2007 FY2008 FY2009

State R
evenue Collections and Trends
128
Georgia Department of Revenue | Statistical Report FY2009
Table 43.1Changes in Major State Tax Revenues (Millions) - Collections
FY2005 FY2006 FY2007 FY2008 FY2009
Net Revenue Collections 14,693$ 16,394$ 17,640$ 17,450$ 15,619$
General Sales and Use Tax 5,282$ 5,745$ 5,916$ 5,781$ 5,342$
Motor Fuel Tax 461$ 433$ 493$ 473$ 438$
Prepaid Motor Fuel Sale Tax 330$ 368$ 446$ 538$ 423$
Individual Income Tax 7,281$ 8,041$ 8,821$ 8,845$ 7,801$
Corporate Tax 712$ 890$ 1,017$ 943$ 695$
Liquor, Beer, and Wine Tax 150$ 156$ 182$ 165$ 167$
Cigar and Cigarette Tax 249$ 244$ 243$ 240$ 230$
Motor Vehicle Fees -$ 299$ 290$ 296$ 287$
Other Revenues 228$ 217$ 232$ 169$ 236$
Note: The above figures are extracted from the Department of Revenue's annual Revenue Collection Press Releases published during the relevant years. Georgia Department of Revenue began collecting and reporting Motor Vehicle Tags, Title and Fees on July 1, 2005. These revenues were previously reported by the now disbanded Department of Motor Vehicle Safety (DMVS).
Source: Accounting Unit, Finance Department, Georgia Department of Revenue - Monthly Press Release of Net Revenue Collections
Table 42Actual Department of Revenue Spending by Funding Source (Thousands)
FY2005 FY2006 FY2007 FY2008 FY2009
Other Funds 6,687$ 9,529$ 11,141$ 4,164$ 18,033$
Collection Fees 9,706$ 10,985$ 10,938$ 10,039$ 10,299$
Modernization 2,121$ -$ -$ -$ -$
State Funds 78,941$ 109,512$ 111,523$ 114,545$ 114,448$
Source: Accounting Unit, Finance Department, Georgia Department of Revenue - Monthly Press Release of Net Revenue Collections

Sta
te R
even
ue C
olle
ctio
ns a
nd T
rend
s
129
Georgia Department of Revenue | Statistical Report FY2009
Table 43.2Changes in Major State Tax Revenues - Percentage Changes
FY04-05 FY05-06 FY06-07 FY07-08 FY08-09
Net Revenue Collections 8.18% 11.58% 7.60% -1.08% -10.49%
General Sales and Use Tax 7.31% 8.77% 2.98% -2.28% -7.59%
Motor Fuel Tax -13.99% -6.07% 13.86% -4.06% -7.40%
Prepaid Motor Fuel Sale Tax 50.00% 11.52% 21.20% 20.63% -21.38%
Individual Income Tax 10.60% 10.44% 9.70% 0.27% -11.80%
Corporate Tax 43.84% 21.21% 17.84% -7.28% -26.30%
Liquor, Beer, and Wine Tax 0.00% 4.00% 16.67% -9.34% 1.21%
Cigar and Cigarette Tax 9.69% -2.01% -0.41% -1.23% -4.17%
Motor Vehicle Fees - - -3.01% 2.07% -3.04%
Other Revenues -49.22% -4.82% 6.91% -27.16% 39.64%
Note: The above figures are extracted from the Department of Revenue's annual Revenue Collection Press Releases published during the relevant years. Georgia Department of Revenue began collecting and reporting Motor Vehicle Tags, Title and Fees on July 1, 2005. These revenues were previously reported by the now disbanded Department of Motor Vehicle Safety (DMVS).
Source: Accounting Unit, Finance Department, Georgia Department of Revenue - Monthly Press Release of Net Revenue Collections

State R
evenue Collections and Trends
130
Georgia Department of Revenue | Statistical Report FY2009
Table 43.3Changes in Major State Tax Revenues (Millions) - Absolute Changes
FY04-05 FY05-06 FY06-07 FY07-08 FY08-09
Net Revenue Collections 1,111$ 1,701$ 1,246$ (190)$ (1,831)$
General Sales and Use Tax 360$ 463$ 171$ (135)$ (439)$
Motor Fuel Tax (75)$ (28)$ 60$ (20)$ (35)$
Prepaid Motor Fuel Sale Tax 110$ 38$ 78$ 92$ (115)$
Individual Income Tax 698$ 760$ 780$ 24$ (1,044)$
Corporate Tax 217$ 151$ 154$ (74)$ (248)$
Liquor, Beer, and Wine Tax -$ 6$ 26$ (17)$ 2$
Cigar and Cigarette Tax 22$ (5)$ (1)$ (3)$ (10)$
Motor Vehicle Fees -$ 299$ (9)$ 6$ (9)$
Other Revenues (221)$ (11)$ 15$ (63)$ 67$
Note: The above figures are extracted from the Department of Revenue's annual Revenue Collection Press Releases published during the relevant years. Georgia Department of Revenue began collecting and reporting Motor Vehicle Tags, Title and Fees on July 1, 2005. These revenues were previously reported by the now disbanded Department of Motor Vehicle Safety (DMVS).
Source: Accounting Unit, Finance Department, Georgia Department of Revenue - Monthly Press Release of Net Revenue Collections

Sta
te R
even
ue C
olle
ctio
ns a
nd T
rend
s
131
Georgia Department of Revenue | Statistical Report FY2009
Table 44.1
Table 44.2
Revenue Collections (Thousands) - Corporate Tax
FY2005 FY2006 FY2007 FY2008 FY2009
Corporate Net Worth Tax (i) 30,799$ 36,114$ 31,872$ 41,733$ 30,944$
Corporate Income Tax 840,065$ 1,009,762$ 1,174,181$ 1,048,669$ 881,267$
Corporate Income Tax Refunds (173,654)$ (171,278)$ (205,215)$ (163,789)$ (234,219)$
Financial Institution Business Occupation Tax 15,103$ 16,138$ 16,347$ 16,429$ 16,722$
Total Corporate Tax 712,313$ 890,736$ 1,017,185$ 943,042$ 694,714$
(i) At the time of this report, most of the returns have been processed. A projection is made to determine the net worth for all returns based on prior year returns. This projection is based on returns filed in the fiscal year and not on actual collections.
Note: Georgia Department of Revenue collects Corporate Net Worth Tax in conjunction with Corporate Returns and Estimated Corporate payments on a daily basis. This is done with the intention to ease the burden on taxpayers and the Georgia Department of Revenue Processing Center.
Source: Georgia Department of Revenue Corporate Tax System as of July 23, 2009
Revenue Collections (Thousands) - Individual Tax
FY2005 FY2006 FY2007 FY2008 FY2009
Individual Tax Returns 528,520$ 626,390$ 712,367$ 719,081$ 521,716$
Individual Income Tax Assessments 158,257$ 152,862$ 167,640$ 208,527$ 145,918$
Individual Estimated Payments 1,066,191$ 1,330,220$ 1,500,497$ 1,434,783$ 996,155$
Individual Withholding 6,974,600$ 7,552,705$ 8,128,838$ 8,400,700$ 8,132,199$
Non-ResidentComposite Income Tax 43,408$ 43,988$ 61,026$ 75,654$ 71,454$
Estimate Non-ResidentComposite Income Tax -$ 3,179$ 21,389$ (55)$ -$
Individual Income Tax Refunds (1,510,768)$ (1,693,953)$ (1,801,914)$ (2,031,471)$ (2,081,539)$
Fiduciary 20,607$ 25,233$ 30,954$ 38,257$ 15,282$
Total Individual Tax 7,280,815$ 8,040,624$ 8,820,797$ 8,845,476$ 7,801,185$
Source: Accounting Unit, Finance Department, Georgia Department of Revenue - Monthly Press Release of Net Revenue Collections

State R
evenue Collections and Trends
132
Georgia Department of Revenue | Statistical Report FY2009
Table 44.3Revenue Collections (Thousands) - Other Taxes
FY2005 FY2006 FY2007 FY2008 FY2009
Estate Tax 42,656$ 10,316$ 1,426$ 12$ 83$
Property Tax 65,919$ 73,023$ 77,842$ 81,218$ 82,764$
Sales and Use Taxes - Gross 5,281,884$ 10,205,112$ 10,770,909$ 10,693,537$ 9,752,210$
Local Distributions -$ (4,345,970)$ (4,757,333)$ (4,831,802)$ (4,359,855)$
Sales Tax Refunds/Adjustments -$ (113,733)$ (98,057)$ (80,868)$ (49,786)$
Prepaid Motor Fuel Tax 330,386$ 368,009$ 445,586$ 538,156$ 422,827$
Motor Fuel Excise Tax 461,391$ 433,329$ 493,449$ 473,046$ 438,329$
Malt Beverage Excise Tax 82,169$ 86,331$ 85,953$ 88,251$ 87,814$
Liquor Excise Tax 43,814$ 43,966$ 69,877$ 47,593$ 49,467$
Wine Excise Tax 24,055$ 25,846$ 25,732$ 28,872$ 29,338$
Tobacco Taxes 248,890$ 243,538$ 243,277$ 239,619$ 229,673$
Motor Vehicle - Tag, Title, Fees -$ 299,387$ 289,932$ 295,568$ 287,528$
Total Other Taxes 6,581,164$ 7,329,154$ 7,648,593$ 7,573,202$ 6,970,392$
Source: Accounting Unit, Finance Department, Georgia Department of Revenue - Monthly Press Release of Net Revenue Collections

Sta
te R
even
ue C
olle
ctio
ns a
nd T
rend
s
133
Georgia Department of Revenue | Statistical Report FY2009
Table 44.4
Table 44.5
Revenue Collections (Thousands) - Business License Fees
FY2005 FY2006 FY2007 FY2008 FY2009
Malt Beverage Licenses 611$ 280$ 445$ 594$ 550$
Liquor Licenses 498$ 240$ 585$ 933$ 969$
Undistributed Liquor Licenses -$ -$ -$ -$ -$
Wine Licenses 509$ 228$ 396$ 535$ 516$
Tobacco Licenses 15$ (229)$ 11$ 16$ 15$
Coin Operated Amusement Machines 1,257$ 776$ 1,857$ 1,852$ 1,926$
Total Business License Fees 2,890$ 1,295$ 3,294$ 3,930$ 3,976$
Source: Accounting Unit, Finance Department, Georgia Department of Revenue - Monthly Press Release of Net Revenue Collections
Revenue Collections (Thousands) - Earnings - General Government
FY2005 FY2006 FY2007 FY2008 FY2009
Real Estate Transfer Tax Collection Costs 669$ 96$ 658$ 362$ 267$
Railroad Equipment Car Tax Collection Costs 61$ -$ -$ -$ -$
Income Tax CheckoffsCollection Costs 1$ -$ -$ -$ -$
Out of State Contractors 2$ -$ -$ 7$ 2$
Liquor Pre-LicenseInvestigation Fees 86$ 48$ 288$ 69$ 104$
Public Service Commission Fees 1,100$ 1,050$ 1,048$ -$ 1,050$
Total Earnings -General Government 1,919$ 1,194$ 1,994$ 438$ 1,423$
Source: Accounting Unit, Finance Department, Georgia Department of Revenue - Monthly Press Release of Net Revenue Collections

State R
evenue Collections and Trends
134
Georgia Department of Revenue | Statistical Report FY2009
Table 44.6Revenue Collections (Thousands) - Other Fees
FY2005 FY2006 FY2007 FY2008 FY2009
Fines and Penalties- Motor Carrier Citations (69)$ (1)$ -$ -$ -$
Fines and Penalties- Tobacco Citations 167$ 2$ 54,702$ 5$ 577$
Fines and Penalties- Alcohol Citations 656$ 629$ 234$ 251$ 62$
Forfeitures - Alcohol and Tobacco -$ -$ 408$ 257$ -$
Unclaimed Property 71,649$ 64,284$ 84,222$ 76,433$ 86,150$
Motor Vehicle Licenses and Permits 271$ 179$ 372$ 494$ 337$
Penalties and Interest- Property Tax 572$ 19$ 267$ 226$ 341$
Penalties and Interest- FiFa 22,780$ 25,005$ 26,286$ 23,234$ 16,190$
Penalties and Interest- Motor Fuel (1,631)$ 3,106$ 443$ 880$ 329$
Penalties and Interest- Alcoholic Beverages 67$ 7$ 31$ 36$ 27$
Penalties and Interest- Cigarette (4,520)$ -$ -$ -$ -$
Delinquent Tax Collections Fees (5,574)$ (10,203)$ (12,011)$ (11,805)$ (9,135)$
Motor Vehicle Tags and Titles 2$ -$ -$ -$ -$
Unallocated Tax 27,856$ 44,215$ (10,309)$ (7,653)$ 51,465$
Unallocated Fees 1,887$ 3,507$ 1,394$ 1,413$ 1,008$
Other -$ -$ 1,932$ -$ -$
Total Other Fees 114,113$ 130,749$ 147,971$ 83,771$ 147,351$
Source: Accounting Unit, Finance Department, Georgia Department of Revenue - Monthly Press Release of Net Revenue Collections

Sta
te R
even
ue C
olle
ctio
ns a
nd T
rend
s
135
Georgia Department of Revenue | Statistical Report FY2009
Table 44.7Revenue Collections (Thousands) - Total Revenue Collections
FY2005 FY2006 FY2007 FY2008 FY2009
Taxes
Corporate Tax 712,313$ 890,736$ 1,017,185$ 943,042$ 694,714$
Individual Tax 7,280,815$ 8,040,624$ 8,820,797$ 8,845,476$ 7,801,185$
Other Taxes 6,581,164$ 7,329,154$ 7,648,593$ 7,573,202$ 6,970,392$
Total Taxes 14,574,292$ 16,260,514$ 17,486,575$ 17,361,720$ 15,466,291$
Funds and Other Fees
Business License Fees 2,890$ 1,295$ 3,294$ 3,930$ 3,976$
Earnings - General Government 1,919$ 1,194$ 1,994$ 438$ 1,423$
Other Fees 114,113$ 130,749$ 147,971$ 83,771$ 147,351$
Total Funds and Other Fees 118,922$ 133,238$ 153,259$ 88,139$ 152,750$
Revenue Collections
Total Revenue Collections 14,693,214$ 16,393,752$ 17,639,834$ 17,449,859$ 15,619,041$
Source: Accounting Unit, Finance Department, Georgia Department of Revenue - Monthly Press Release of Net Revenue Collections

State R
evenue Collections and Trends
136
Georgia Department of Revenue | Statistical Report FY2009
Table 45Trend in Georgia's State Tax Revenues by Major Sources (Unaudited and Millions)
FY2005 FY2006 FY2007 FY2008 FY2009
Department of Revenue 14,693$ 16,394$ 17,640$ 17,450$ 15,619$
Other Agencies 549$ 213$ 341$ 246$ 314$
Grand Total 15,242$ 16,607$ 17,981$ 17,696$ 15,933$
General Sales and Use 5,282$ 5,746$ 5,916$ 5,781$ 5,342$
Selective Sales Taxes (i) 860$ 833$ 918$ 877$ 835$
Income Taxes 7,993$ 8,931$ 9,838$ 9,789$ 7,801$
Other Taxes or Fees 1,107$ 1,097$ 1,309$ 1,249$ 1,955$
Contribution of Department of Revenue to total state revenue 96% 99% 98% 99% 98%
Contribution of Other Agencies to total state revenue 4% 1% 2% 1% 2%
(i) Selective Taxes are made up of Motor Fuel Excise, Tobacco and Alcohol Taxes.Note: The State of Georgia Office of Treasury and Fiscal Services (OTFS) figures are stated using the Statutory Basis of accounting
Source: Accounting Unit, Finance Department, Georgia Department of Revenue - Monthly Press Release of Net Revenue Collections and the State of Georgia Office of Treasury and Fiscal Services (OTFS)

Legi
slat
ive
Sum
mar
y
137
Georgia Department of Revenue | Statistical Report FY2009
Administrative
HB 126 (O.C.G.A. §§ 10-12-1, and others) Effective July 1, 2009, this bill makes a number of changes regarding electronic transactions and signatures for state agencies.
HB 334 (O.C.G.A. §§ 48-2-32 and 48-2-44.1) Effective January 1, 2010, this bill lowers the threshold for payments required to be remitted via electronic funds transfer (EFT) for any return, report, or other document pertaining to sales tax, use tax, withholding tax, or motor fuel distributor tax. The former minimum $5,000 payment has been lowered to $1,000 for returns required to be filed for tax periods beginning on or after January 1, 2010, but prior to January 1, 2011. The bill further lowers the $1,000 minimum payment to $500 for returns required to be filed for tax periods beginning on or after January 1, 2011. This bill also adds a new Code section which imposes a penalty for any sales tax, use tax, withholding tax, or motor fuel distributor tax return which is required to be filed electronically and is not.
HB 444 (O.C.G.A. § 48-2-62) Effective May 4, 2009, this bill adds a new Code section O.C.G.A. § 48-2-62 to provide for preparer penalties. The bill is modeled after the IRS preparer penalties.
HB 485 (O.C.G.A. §§ 48-2-8, 48-2-35, 48-2-35.1, 48-2-55, 48-7-29.16, and 48-7-40.15A) The administrative provisions of this bill, which are effective May 5, 2009, are as follows (see below for additional income tax provisions):
1. The Commissioner can serve subpoenas by registered or certified mail or statutory overnight delivery as opposed to the current practice of service by a marshal.
2. Requires taxpayers to list specific transactions within a refund claim. Gives taxpayers the same right to administratively protest a refund claim denial as they currently have for protests of tax assessments.
3. Allows taxpayers the option of getting a sales tax refund directly from the vendor or the taxpayer may still seek a refund directly from the Department.
4. The Commissioner can serve summons of garnishment by registered or certified mail or statutory overnight delivery as opposed to the current practice of service by a marshal.
Income Tax
HB 74 (O.C.G.A. § 48-1-2) This bill updates Georgia’s adoption of certain portions of the Internal Revenue Code (“IRC”) to the IRC as amended through January 1, 2009. In addition to the “annual update”, this bill also adds a new code section to make this same update applicable retroactively to the 2008 tax year. Thus, this bill incorporates most, but not all, of the provisions of the federal tax bills that were passed during 2008 for purposes of both the Georgia 2008 and 2009 tax years.
HB 186 (O.C.G.A. § 48-7-29.11) This bill extends the Telework Tax Credit for an additional two years (2010 and 2011) and increases the annual cap to $2.5 million for per year.
Legislative Summary for Enacted Legislation

Legislative Sum
mary
138
Georgia Department of Revenue | Statistical Report FY2009
HB 228 (O.C.G.A. §§ 49-1-7, 48-7-29.15, 48-7-161, and others) Effective July 1, 2009, this bill reorganizes and reestablishes various state health and human services agencies and updates the tax code sections where such agencies are referenced.
HB 261 (O.C.G.A. § 48-7-29.17) This bill establishes an income tax credit against individual income tax for the purchase between June 1, 2009 and November 30, 2009 of an eligible single-family residence located in Georgia.
HB 379 (O.C.G.A. §§ 48-7-21, 48-7-27, and 48-7-28.4) Effective for tax years beginning on or after January 1, 2010, this bill establishes a new Code section which requires expenses paid to captive real estate investment trusts to be added back to Georgia income.
HB 410 (O.C.G.A. §§ 33-8-4, 33-8-8.1, 33-8-8.2, 48-7-27 and 48-7-29.13) Effective for tax years beginning on or after January 1, 2009, sections 4 and 5 of this bill change the income tax deduction and the income tax credit for high deductible health plans that were enacted in HB 977 during the 2008 Legislative Session. Previously, the high deductible health plan had to be established and used with a health savings account. Now, the high deductible health plan only needs to be a high deductible health plan as defined in Section 223 of the Internal Revenue Code.
HB 438 (O.C.G.A. § 48-7-40.24) Effective for tax years beginning on or after January 1, 2009, this bill makes significant changes to the credit provided by O.C.G.A. § 48-7-40.24 which is generally referred to as the “Mega Tax Credit”.
HB 439 (O.C.G.A. §§ 48-7-40, 48-7-40.1, 48-7-40.5, 48-7-40.12, 48-7-40.15 and 48-7-40.17) Effective for tax years beginning on or after January 1, 2009, this bill changes the following income tax credits:
1. O.C.G.A. § 48-7-40, jobs tax credit.2. O.C.G.A. § 48-7-40.1, jobs tax credits for business enterprises in less developed areas.3. O.C.G.A. § 48-7-40.5, tax credits for approved retraining. 4. O.C.G.A. § 48-7-40.12, tax credit for qualified research expenses.5. O.C.G.A. § 48-7-40.15, the port activity tax credit.6. O.C.G.A. § 48-7-40.17, the headquarters job tax credit.
HB 473 (O.C.G.A. §§ 50-23-21 and 50-25-8) Effective May 22, 2009, this bill specifies that a person receiving a grant from Georgia Environmental Facilities Authority (GEFA) under O.C.G.A. § 50-23-21 shall not be eligible to claim any tax credit under O.C.G.A. § 48-7-29.14 (Clean Energy Property Tax Credit), or any other grant under O.C.G.A. § 50-23-21, with respect to the same clean energy property.
HB 485 (O.C.G.A. §§ 48-2-8, 48-2-35, 48-2-35.1, 48-2-55, 48-7-29.16, and 48-7-40.15A) The income tax provisions of this bill are summarized as follows:
1. Effective for tax years beginning on or after January 1, 2008, this bill amends the qualified education expense tax credit to allow pre-approved taxpayers that claim the credit to file electronically.

Legi
slat
ive
Sum
mar
y
139
Georgia Department of Revenue | Statistical Report FY2009
2. Creates O.C.G.A. § 48-7-40.15A, which establishes a new port tax credit.
SB 165 (O.C.G.A. §§ 49-4-146.1 and 49-5-273) Effective January 1, 2010, this bill amends Title 49 of the Official Code of Georgia Annotated, relating to social services, so as to authorize the Department of Community Health to obtain income eligibility verification from the Department of Revenue for the Medicaid Program and the PeachCare for Kids Program.
SB 168 (O.C.G.A. §§ 21-5-6, 21-5-30.1, 21-5-34, 21-5-34.1, 21-5-50, 21-5-51, 21-5-52, and 28-1-8 (redesignated to 28-1-8.1)) Effective May 4, 2009, this bill adds a new Code section which provides that the Commissioner must report Senators and Representatives who have not filed a Georgia personal income tax return or who are defaulters for state income taxes in violation of Article II, Section II, Paragraph III of the Constitution. In this new Code section, the Commissioner is required to report the name of the Senator or Representative to the chairperson of the Senate Ethics Committee or the chairperson of the House Committee on Ethics, respectively. The Senator and/or Representative will be informed by the Department of Revenue by registered or certified mail, return receipt requested, or statutory overnight delivery that a report is being made under this Code section at least 30 days prior to the release of such report.
SB 201 (O.C.G.A. § 31-12-14) Currently, individual taxpayers are allowed to contribute money on their individual returns to the “Breast Cancer, Prostate Cancer, and Ovarian Cancer Research Program Fund”. Effective July 1, 2009, this bill changes the name of the fund to the “Cancer Research Program fund”. The purpose is now to provide research for all types of cancer.
Motor Fuel
HB 46 (O.C.G.A. § 48-8-16) Effective May 12, 2008 through May 31, 2009, this bill extended the Governor’s Executive Order providing an exemption from the payment of the 4 percent state sales and use tax on purchases of dyed fuels used exclusively off-road for agricultural, timber growing or harvesting, mining, or construction purposes.
HB 121 (O.C.G.A. §§ 48-8-17 and 48-8-17.1) This bill ratifies the Executive Order of the Governor regarding the exemption on collecting state sales and use tax on motor fuel for the period of July 1, 2008 through December 31, 2008. The exemption did not apply to local sales and use tax.
SB 30 (O.C.G.A. §§ 10-1-232, 10-1-234.1, and 10-1-240) Effective July 1, 2009, this bill gives distributors the right to purchase unblended fuel and blend it themselves. It also regulates the market for blended gasoline to prevent suppliers from refusing to sell unblended gasoline to distributors.
Motor Vehicle
HB 57 (O.C.G.A. §§ 40-2-1, 40-2-140, 46-7-12.1, 46-7-15, 46-7-15.1, and 46-7-16) Effective May 4, 2009, this bill brings the interstate and intrastate motor carriers for hire into compliance with the federal Unified Carrier Registration Act (UCRA) and eliminates redundant rules.

Legislative Sum
mary
140
Georgia Department of Revenue | Statistical Report FY2009
HB 318 (O.C.G.A. §§ 48-5-444 and 48-5-506.1) Effective May 11, 2009, this bill provides that a farm or business vehicle located in a different county, shall be returned where the owner claims homestead or is domiciled. This bill also provides for a one-year exemption from all ad valorem taxes for the first $100,000.00 of the full value for heavy-duty equipment mainly used for road building, industrial, maritime, or mining uses by small firms. This exemption terminates as of December 31, 2010.
HB 584 (O.C.G.A. § 40-5-21(a)(1)(A)) Effective May 11, 2009, this bill repeals existing law for Mitchell County, allowing for a non-staggered, four-month vehicle registration period. Mitchell county will now operate under O.C.G.A § 40-5-21(a)(1)(A) or birthday month registration.
HB 639 (O.C.G.A. § 40-2-86.21) Effective July 1, 2009, this bill amends O.C.G.A. § 40-2-86.21(o)(23) to change language from “Atlanta Falcons Foundation” to “Atlanta Falcons Youth Foundation.” Funds from the sale of the plate are to be disbursed to the “Atlanta Falcons Youth Foundation.” This bill adds paragraph (40) for the Georgia Aquarium; Funds from the sale of the Georgia Aquarium plate shall be disbursed to “Georgia Aquarium, Inc.”
SB 82 (O.C.G.A. §§ 10-1-350, 10-1-351, 10-1-352.1, and 16-8-12) Effective July 1, 2009, this bill provides for the regulation of secondary metals including such things as method of payment and reporting requirements in order to prevent theft of certain metals. This bill also provides for criminal penalties for failure to comply.
SB 128 (O.C.G.A. § 40-8-50) Effective January 1, 2010, this bill allows an option for owners of boat trailers, utility trailers, or noncommercial cattle and livestock trailers to register with a permanent trailer license plate.
Property Tax
HB 143 (O.C.G.A. § 45-12-86) Effective February 17, 2009, this bill changes the manner and method for appropriating funds for homeowner tax relief grants.
HB 233 (§ 48-5B-1) This bill prohibits increases in assessment values on all classes of property subject to ad valorem taxation from January 1, 2009 through the second Monday in January of 2011. This bill does not prohibit corrections of any manifest, factual error or omission in the valuation of the property by tax officials pursuant to current Code.
HB 304 (O.C.G.A. §§ 48-5-48 and 48-5-264.1) Effective May 4, 2009, this bill provides for application of an exemption for the surviving spouse of a disabled veteran to a subsequent homestead within the county of the original homestead. This bill also provides that agents of a county board of tax assessors must provide reasonable notice to the homeowner before they enter onto the property and requires the county tax commissioner to provide notice to homeowners that they have the right to file an ad valorem property tax return.

Legi
slat
ive
Sum
mar
y
141
Georgia Department of Revenue | Statistical Report FY2009
HB 482 (O.C.G.A. § 48-5-41.2) This bill, if adopted by referendum in a general election, would exempt all personal property constituting business inventory from state ad valorem taxation at a rate of ¼ mill.
SB 55 (O.C.G.A. §§ 48-5-2, 48-5-7.7, 48-5-274(c), and 48-5-306(a)) Effective April 14, 2009, this bill changes the factors required to be considered in determining fair market value of real property and changes the deadline for filing forest land conservation use assessment. The bill also changes certain provisions regarding the establishment of the equalized property tax digest and changes made in a taxpayer’s return.
SB 240 (O.C.G.A. §§ 48-5-311(f)(4), 48-5-7.7, 48-5-161, 48-5-306, and 48-5-511) Effective April 29, 2009, this bill provides for modernization and revision of certain provisions regarding ad valorem taxation of property by revising certain procedures relative to the appeal of assessments. This bill also changes provisions regarding collection of costs, commissions, interest and penalties and provides for additional tax return filing requirements for public utilities.
SR 685 This resolution creates a Senate Study Committee to evaluate current methods used to assess residential and commercial property. The Committee will also evaluate the appeals process for such property. This bill was Senate passed and adopted on April 1, 2009. (Governor signature not required).
Sales and Use Tax
HB 46 (O.C.G.A. § 48-8-16) Effective May 12, 2008 through May 31, 2009, this bill extended the Governor’s Executive Order providing an exemption from the payment of the 4 percent state sales and use tax on purchases of dyed fuels used exclusively off-road for agricultural, timber growing or harvesting, mining, or construction purposes.
HB 59 (O.C.G.A. §§ 48-8-18 and 48-8-3) Effective April 21, 2009, this bill ratifies the Executive Order suspending the collection of sales and use tax on drugs provided as free samples and used in clinical trials, and creates a new sales and use tax exemption for drugs provided as free samples and used in clinical trials.
HB 116 (O.C.G.A. § 48-8-3) Effective July 1, 2009, this bill extends from June 30, 2009 to June 30, 2011, a sales and use tax exemption for the sale or use of engines, parts, equipment, or other tangible personal property used in the maintenance or repair of aircraft when such engines, parts, equipment, and other tangible personal property are installed on such aircraft that is being repaired or maintained in this state so long as such aircraft is not registered in this state.
HB 120 (O.C.G.A. § 48-8-3) Effective May 4, 2009, this bill changes the dates for the annual 4-day school supplies sales tax holiday exemption to July 30, 2009 through August 2, 2009. For the general/school sales tax holiday, the covered items include clothing or footwear costing $100 or less per item, a single purchase of computer items for $1,500 or less, and school supplies costing $20 or less per item.

Legislative Sum
mary
142
Georgia Department of Revenue | Statistical Report FY2009
Further, this bill changes the dates for the annual 4-day energy and water efficient products sales tax holiday to October 1, 2009 through October 4, 2009. Covered items for the energy and water efficient products sales tax holiday include Energy Star rated doors, windows, dishwashers, clothes washers, air conditioners, ceiling fans, fluorescent light bulbs, dehumidifiers, programmable thermostats, or refrigerators with a sales price of $1,500 or less; and toilets, bathroom sink faucets, showerheads, and weather or sensor-based landscape irrigation control technologies which have been designated as meeting or exceeding the requirements under the United States Environmental Protection Agency’s Water Sense program.
HB 129 (O.C.G.A. § 48-8-3) Effective May 5, 2009, this bill provides an exemption for a limited period of time with respect to sales of certain tangible personal property used for, and in the renovation or expansion, of a zoological institution.
HB 181 (O.C.G.A. § 48-8-67) Effective May 5, 2009, this bill extends to December 31, 2011 the Revenue Commissioner’s authority to make distributions of unidentifiable sales and use tax proceeds.
HB 212 (O.C.G.A. § 48-8-3) Effective July 1, 2009, this bill extends for 2 years the current partial sales and use tax exemption for certain purchases of jet fuel until June 30, 2011. The rate of the partial exemption has not changed; it would apply to the first 1.80 percent of the 4 percent state sales and use tax on sales on jet fuel to qualifying airlines at airports with more than 750,000 takeoffs and landings in a calendar year.
HB 349 (O.C.G.A. § 48-8-3) Effective May 5, 2009, this bill provides an exemption from sales and use tax for the purchase of tangible personal property to, or used in or for the new construction of a civil rights museum.
HB 358 (O.C.G.A. § 48-8-3) Effective May 4, 2009, this bill amends O.C.G.A. § 48-8-3 to extend for 2 years the sales and use tax exemptions for prepared food and beverages which are donated to a qualified nonprofit organization for hunger relief purposes (57.2); and prepared food and beverages donated for disaster relief purposes (57.3). This bill will extend the sunset for both exemptions until June 30, 2011.
HB 364 (O.C.G.A. § 48-8-3) Effective July 1, 2009, this bill provides a 2-year exemption (July 1, 2009 through June 30, 2011) for the sale or use of an airplane flight simulation training device when the device is approved by the Federal Aviation Administration.
HB 395 (O.C.G.A. § 48-8-3(78)(a)) Effective July 1, 2009, this bill extends until September 1, 2011 the exemption offered by O.C.G.A. § 48-8-3(78)(A) for sales of tangible personal property used in direct connection with the construction of a new symphony hall facility owned or operated by an organization which is exempt from taxation under Internal Revenue Code § 501(c)(3) when the aggregate construction cost is $200 million or more. The exemption does not apply to sales of tangible personal property used for maintenance or operations of the symphony hall facility.
Legi
slat
ive
Sum
mar
y
143
Georgia Department of Revenue | Statistical Report FY2009
HB 441 (O.C.G.A. §§ 48-8-35.1 and 48-9-10.1) Effective May 5, 2009, section 1 of this bill amends O.C.G.A. § 48-8-35.1 relating to sales and use tax refund claims. An expedited refund may be paid to a taxpayer who applies for an expedited refund claim and as part of such application files a bond that is satisfactory to the Commissioner as security for the repayment of such refund (tax, penalty, interest, fees, and costs). Section 1 further provides for penalties associated with frivolously filed sales and use tax refund claims for an excessive amount. Any taxpayer who frivolously files a sales and use tax claim for refund for an excessive amount would be subject to a penalty of 20 percent of the excessive amount. No penalty shall be assessed against any portion of an excessive amount for which a refund is claimed in good faith and the filing of which was not due to negligence or disregard of the law In addition to the 20% penalty, when all or part of the excessive amount of the taxpayer’s claim for refund is based on a position which is knowingly and willfully advanced in bad faith and is patently improper, such taxpayer shall be guilty of a misdemeanor and, upon conviction thereof, fined not more than $1,000.00. Section 2 of this bill creates O.C.G.A. §48-9-10.1 to provide for a sales and use tax refund for certain credit card issuers who make sales of motor fuel for highway use to certain qualified tax-exempt government entities, when such credit card issuer invoices and bills the qualified tax-exempt government entity net of the applicable taxes. Refunds under this Code section will be made without interest.
HB 473 (O.C.G.A. §§ 50-23-21 and 50-25-8) Effective May 22, 2009, the sales tax portion of this bill exempts the Georgia Technology Authority from sales and use taxes.

Georgia Department of Revenue | Statistical Report FY2009G
eorgia Taxpayers’ Bill of R
ights
144
Georgia Taxpayers’ Bill of RightsThe mission of the Georgia Department of Revenue is to provide the best customer service and operational performance of any state taxing authority and the IRS. As a Georgia taxpayer, you have the right to expect the Department to honor its mission and uphold your rights every time you contact or are contacted by the Department. This includes fair and courteous treatment in all dealings with the Department, prompt and accurate responses to all questions and requests for tax assistance, and a fair and timely hearing on a dispute of any tax liability as provided for by law. The following is a summary of your rights and the Department of Revenue’s responsibilities to you as a Georgia taxpayer.
Rights of a Taxpayer
Privacy. You have the right to privacy with regard to information you provide pertaining to returns, reports, or the affairs of your business, except under certain circumstances further detailed under the Georgia Public Revenue Code (O.C.G.A. §§ 48-2-15, 48-7-60).
Assistance. You have the right to advice and assistance from the Department of Revenue in complying with state tax laws.
Explanation. You have the right to a clear explanation of:• the basis of any audit activities performed by an agent of the State Revenue Commissioner;• the basis of an assessment of additional taxes, interest and penalties, or the denial or reduction
of any refund or credit claim;• the procedure for a protest of a proposed assessment or refund denial; • the procedure for an appeal of an official assessment. • the basis of any enforcement activities performed by an agent of the State Revenue Commissioner; • state tax law and any amendments to the law.
Protest and Appeal. You have the right to protest or appeal an adverse decision of the State Revenue Commissioner if you disagree with an assessment of tax or penalty or a reduction or denial of a refund. Please see below for the procedures to file a protest or appeal.
Representation. You have the right to representation by your authorized agent in any hearing or conference with the Department, whether it is an attorney, accountant, or any other person with a properly completed power of attorney. A Power of Attorney form can be downloaded from the Department’s website (www.dor.ga.gov).
Obligations of the State Revenue Commissioner
The State Revenue Commissioner has the obligation to:• estimate your tax liability and issue an assessment based on the best information available
if you fail to preserve and maintain records suitable to determine the amount of tax due or to support the accuracy of a return.
• perform audits, conduct conferences and hearings with you at reasonable times and places;

Georgia Department of Revenue | Statistical Report FY2009G
eorg
ia T
axpa
yers
’ Bill
of R
ight
s
145
• furnish copies of the agent’s audit workpapers that explain the basis for the assessment; • resolve tax controversies fairly and equitably at the administrative level whenever possible.
Protest and Appeal Procedure
To Protest a Notice of Proposed Assessment:• Complete a Protest of Proposed Assessment or Refund Denial form by downloading the form
from the Department’s website at www.dor.ga.gov.• Return the form along with any documentation in support of your protest to the Department
within 30 days of the proposed assessment’s notice date by mailing to:
Georgia Department of RevenueTaxpayer Services Division - Protest Section
P.O. Box 105596Atlanta, GA 30348
• The Department will notify you that the protest has been either granted or denied. If the protest is granted, the proposed assessment will be withdrawn. If the protest is denied, the Commissioner will proceed to make an Official Assessment and notify you of the assessment amount, subject to the right of appeal as provided by law.
Appealing an Official Assessment and Demand for Payment.An official assessment is legally sufficient to establish your obligation to pay the tax liability contained within the assessment unless your appeal points out with particularity the items claimed to be erroneous. A general denial will not be adequate. To appeal an Official Assessment and Demand for Payment, you may file an appeal with either the Georgia Office of State Administrative Hearings or the Superior Court of Georgia.
Office of State Administrative HearingsThe Georgia Office of State Administrative Hearings (OSAH) is a state tribunal whose purpose is to resolve disputes between the public and state agencies. A hearing gives you an opportunity to present witnesses or evidence in support of your case or explain any mitigating circumstances. To file an appeal with the OSAH:
• Complete a Request for Administrative Appeal form by downloading the form from the Depart-ment’s website at www.dor.ga.gov.
• Return the form to the Department within 30 days of the official assessment’s notice date by mailing to:
Georgia Department of RevenueAppeals SectionP.O. Box 105665
Atlanta, GA 30348-5665

Georgia Department of Revenue | Statistical Report FY2009G
eorgia Taxpayers’ Bill of R
ights
146
• It is not necessary to have an attorney to request a hearing. The appeal will be forwarded to the Office of Attorney General, who will represent the State Revenue Commissioner in the hearing, and the Office of State Administrative Appeals, who will appoint a hearing officer to conduct the hearing. The hearing officer will serve a notice of hearing upon all parties that will include the date, time, and location for the matter to be heard and other important procedural information.
Superior Court of GeorgiaYou can also appeal the assessment to the Superior Court of Georgia. To do so, your appeal must satisfy certain legal procedural requirements and be accompanied by either a surety bond in an amount that equals the amount in dispute, or evidence of your owning an equity in real estate in Georgia in an amount that equals or exceeds the amount in dispute. It is highly recommended that you retain legal counsel for an appeal to Superior Court.
Enforcement Procedure
An official assessment becomes final if you do not pay or file a written appeal with the Commissioner within 30 days of the assessment notice date. After 30 days, the Commissioner can issue a tax execution against you for the collection of any tax, interest, and penalty due the state. Interest will continue to accumulate at a rate of 1% per month on any unpaid balance. The Department will also impose a collection fee against you equaling 20% of the total amount due. The tax execution is usually recorded in the public records of any county in the state where you live or own real property and constitutes a lien covering all property in which you have any interest.
After the issuance of the tax execution, the Commissioner can utilize all lawful processes to collect the tax, including garnishment of your wages and other property as well as the levy and sale of your property and rights to property. Any additional costs that arise from such collection actions are added to the amount due as indicated on the state tax execution.
Affidavit of IllegalityIf the State Revenue Commissioner issues a tax execution, you may still seek a judicial determination of whether the tax is legally due by filing an affidavit of illegality with the levying officer assigned to your case. Depending on the tax type, the affidavit of illegality must be accompanied by either payment of the tax or providing a bond in an amount to adequately cover the total of any adverse judgment plus costs. The Department will then discontinue any collection activities against you.
The affidavit of illegality will be given to the Office of the Attorney General, who will file it with the Superior Court in the county where the taxpayer resides. The affidavit of illegality will then be heard and decided by the court. It is highly recommended that you retain legal counsel for an appeal to Superior Court.
Jeopardy AssessmentThe State Revenue Commissioner is authorized to issue a jeopardy assessment against you for the immediate collection of any tax if there is evidence that you intend to leave Georgia, remove your property,

Georgia Department of Revenue | Statistical Report FY2009G
eorg
ia T
axpa
yers
’ Bill
of R
ight
s
147
conceal yourself or your property, discontinue your business without making adequate provisions for the payment of state taxes, or if you do anything which would tend to prejudice or jeopardize the Department’s ability to assess or collect state taxes that you owe. A jeopardy assessment may be appealed in the same manner as an official assessment; however, collection activities will continue unless you file a bond with the Department that adequately secures payment of the tax.
Refund Procedure
You may file a tax refund claim at any time within three years after the date of the payment of the tax to the Department of Revenue or, in the case of income taxes, the later of (i) the date the taxes were paid or (ii) the due date for filing the applicable income tax return, including any extensions which have been granted. The claim must be in writing and include a summary statement of the grounds upon which the taxpayer relies and an identification of the transactions that form the basis of the refund being claimed. Forms to file a claim are available on the Department’s website at www.dor.ga.gov.
A taxpayer can contest any denied refund claim by filing a written protest within 30 days from the notice date of the refund denial. To protest a denial of a refund claim:
• Complete a Protest of Proposed Assessment or Refund Denial form by downloading the form from the Department’s website at www.dor.ga.gov.
• Return the form along with any documentation in support of your protest to the Department within 30 days of the refund denial date by mailing to:
Georgia Department of RevenueTaxpayer Services Division - Protest Section
P.O. Box 105596Atlanta, GA 30348
If the claim is either denied or not decided by the Commissioner within one year from the date of filing the claim, you have the right to bring an action for a refund in the appropriate Superior Court of Georgia. Again, it is highly recommended that you retain legal counsel for an appeal to Superior Court.
Office of the Taxpayer Advocate
The Office of the Taxpayer Advocate was created to insure that your rights as a taxpayer are protected and that you receive timely and courteous service from the Department of Revenue. The Taxpayer Advocate also submits recommendations for procedural and systemic changes to state tax law and regulations in order to remedy undue taxpayer confusion or hardship.
If you feel you have been treated unfairly or had no response to previous requests for service, the Taxpayer Advocate’s Office will intercede on your behalf to facilitate a timely and equitable resolution.

Georgia Department of Revenue | Statistical Report FY2009G
eorgia Taxpayers’ Bill of R
ights
148
The information in this document summarizes your rights as a Georgia taxpayer and the responsibilities of the Department of Revenue. The Georgia Taxpayers’ Bill of Rights may be found in the Georgia Public Revenue Code codified in the Official Code of Georgia (O.C.G.A.) at Title 48, Chapter 1, Section 9.
Please direct any suggestions for improvements that the Department should consider, or complaints concerning a particular tax-related issue, to:
Georgia Department of RevenueOffice of the Taxpayer Advocate
P.O. Box 49708Atlanta, Georgia 30348
404-417-2100404-417-2101 (fax)[email protected]

Georgia Department of Revenue | Statistical Report FY2009H
isto
rical
Tim
elin
e
149
Historical Timeline1938 Population:
3,123,7231938 DOR Collections:
$58,347,067
1938 Department of Revenue (DOR) created and DOR Commissioner appointed
1951 Sales and Use Tax - Georgia is the 30th state to implement at a rate of 3%
1952 State Ad Valorem tax rate reduced from 5 mills to 0.25 mills per $1.00
1955 Motor Vehicle Licenses Counties are authorized to register and issue licenses
1959 Univac Computers installed and Fraud Unit Organized
1965 Metropolitan Atlanta Rapid Transit Authority (MARTA) created and DOR Data Bank System installed
1967 DOR Regional Offices are created
1968 DOR moves from State Capital Building to Trinity - Washington Building
1971 MARTA tax enacted
1972 New Property Tax System implemented and Regional Offices are combined
1973 Unclaimed Property Act established
1976 Local Option Sales Tax authorized for counties
1985 Special Purpose Local Option Sales Tax initiated
1989 State Sales Tax Rate increased from 3% to 4%
1990 Unclaimed Property Taxes moves to DOR
1991 Motor Vehicle International Registration Plan implemented
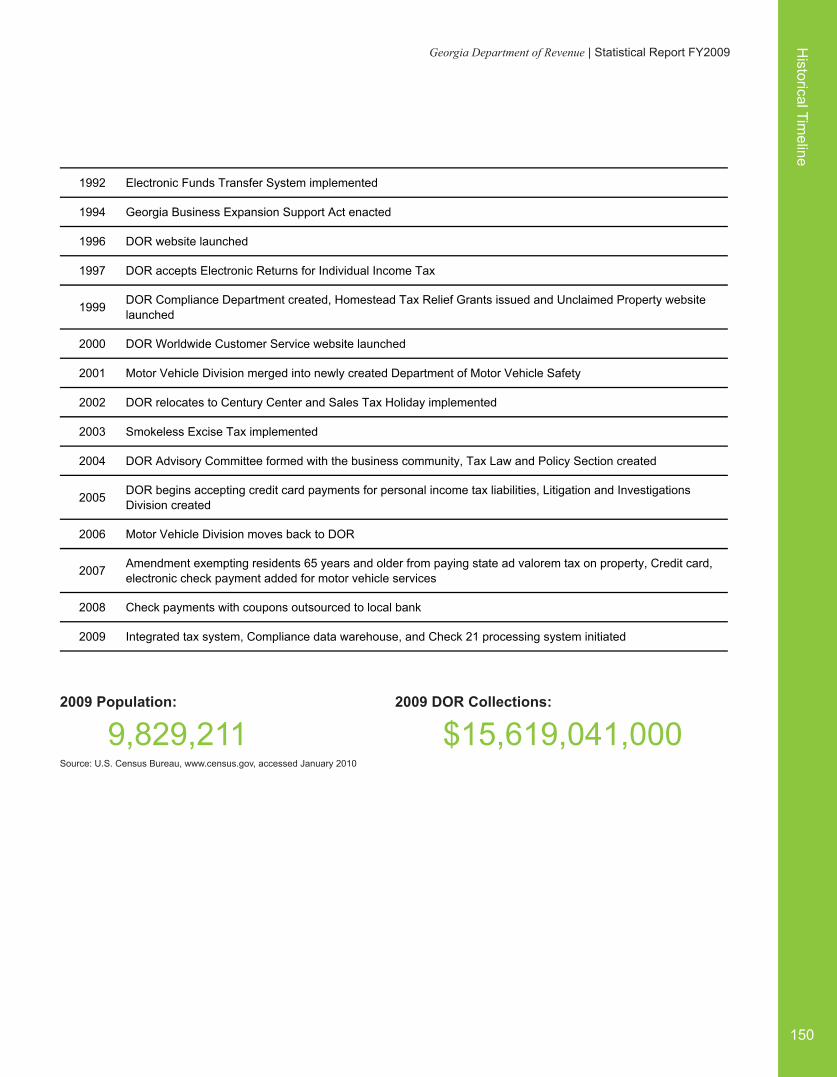
Georgia Department of Revenue | Statistical Report FY2009H
istorical Timeline
150
2009 Population:
9,829,2112009 DOR Collections:
$15,619,041,000Source: U.S. Census Bureau, www.census.gov, accessed January 2010
1992 Electronic Funds Transfer System implemented
1994 Georgia Business Expansion Support Act enacted
1996 DOR website launched
1997 DOR accepts Electronic Returns for Individual Income Tax
1999 DOR Compliance Department created, Homestead Tax Relief Grants issued and Unclaimed Property website launched
2000 DOR Worldwide Customer Service website launched
2001 Motor Vehicle Division merged into newly created Department of Motor Vehicle Safety
2002 DOR relocates to Century Center and Sales Tax Holiday implemented
2003 Smokeless Excise Tax implemented
2004 DOR Advisory Committee formed with the business community, Tax Law and Policy Section created
2005 DOR begins accepting credit card payments for personal income tax liabilities, Litigation and Investigations Division created
2006 Motor Vehicle Division moves back to DOR
2007 Amendment exempting residents 65 years and older from paying state ad valorem tax on property, Credit card, electronic check payment added for motor vehicle services
2008 Check payments with coupons outsourced to local bank
2009 Integrated tax system, Compliance data warehouse, and Check 21 processing system initiated

Georgia Department of Revenue | Statistical Report FY2009R
even
ue C
omm
issi
oner
s
151
Revenue CommissionersCommissioner Dates Served
T. Grady Head February 2, 1938 - January 14, 1941
J. M. Forrester January 14, 1941 - January 26, 1943
Eugene Cook February 18, 1943 - August 22, 1945
M.E. Thompson August 22, 1945 - January 14, 1947
Charles Redwine January 14, 1947 - March 20, 1947
Glenn Phillips March 23, 1947 - June 10, 1948
Downing Musgrove June 10, 1948 - November 18, 1948
Charles D. Redwine November 18, 1948 - December 31, 1954
T.V. Williams January 12, 1955 - January 13, 1959
Curtis Dixon Oxford January 13, 1959 - January 15, 1963
Hiram K. Undercofler January 15, 1963 - December 31, 1966
John Stith January 1, 1967 - January 12, 1967
Peyton S. Hawes January 13, 1967 - March 31, 1970
John A. Blackmon April 1, 1970 - January 14, 1975
Nick P. Chilivis January 15, 1975 - November 7, 1977
W.E. Strickland November 7, 1977 - August 31, 1983
Marcus E. Collins, Sr. September 1, 1983 - August 31, 1996
T. Jerry Jackson September 1, 1996 - April 30, 2003
Robert J. Lenihan, Jr. (Acting Commissioner) May 1, 2003 - June 11, 2003
Bart L. Graham June 12, 2003 - Present

Georgia Department of Revenue | Statistical Report FY2009A
ppendix: Historical D
ata
152
Appendix: Historical DataTable 1
Table 6
Number of Department of Revenue Employees by Category
Fiscal Year TemporaryEmployees
Full-Time Employees
TotalEmployees
2002 464 979 1,443
2003 334 1,010 1,344
2004 285 943 1,228
2005 340 936 1,276
2006 453 1,214 1,667
2007 408 1,267 1,675
2008 255 1,265 1,520
2009 194 1,211 1,405
Source: Human Resources, Georgia Department of Revenue
Net Corporate Tax Collections and Returns Processed Annually
Fiscal Year Corporate Tax ReturnsProcessed
Net Corporate TaxCollections
1997 167 $ 707
1998 188 $ 749
1999 205 $ 800
2000 207 $ 667
2001 216 $ 690
2002 219 $ 565
2003 229 $ 470
2004 234 $ 495
2005 237 $ 712
2006 241 $ 890
2007 250 $ 1,017
2008 239 $ 943
2009 365 $ 695
Note: Return and collection figures for FY2007, FY2008, and FY2009 are unaudited.Source: Processing Center and Accounting Unit, Finance Department, Georgia Department of Revenue - Monthly Press Release of Net Revenue Collections

Georgia Department of Revenue | Statistical Report FY2009A
ppen
dix:
His
toric
al D
ata
153
Table 8Number of Individual Income Tax Returns Processed and Net Individual Income Tax Collections
Fiscal YearNumber of Individual Returns
Processed(Thousands)
Net Individual Income TaxCollections(Millions)
1997 3,130 $ 4,755
1998 3,337 $ 5,334
1999 3,526 $ 5,701
2000 3,629 $ 6,364
2001 3,650 $ 6,923
2002 3,659 $ 6,714
2003 3,690 $ 6,272
2004 3,776 $ 6,583
2005 3,816 $ 7,281
2006 3,861 $ 8,041
2007 4,084 $ 8,821
2008 4,360 $ 8,845
2009 2,721 $ 7,801
Note: Return and collection figures of FY2007, FY2008, and FY2009 are unaudited.Source: Processing Center and Accounting Unit, Finance Department, Georgia Department of Revenue - Monthly Press Release of Net Revenue Collections

Georgia Department of Revenue | Statistical Report FY2009A
ppendix: Historical D
ata
154
Table 9Comparative Trends in Georgia's Individual Income and State Income Tax Receipts
Fiscal Year
Total Individual Personal Income (i) Individual Income Tax ReceiptsIncome Elasticity
Ratio (ii)Amount(Millions)
Change fromPrior Year (%)
Net Amount(Millions)
Change fromPrior Year (%)
1996 $ 159,800 9.92% $ 4,233,297 10.30% 1.037
1997 $ 172,935 8.22% $ 4,754,777 12.30% 1.499
1998 $ 183,757 6.26% $ 5,333,762 12.20% 1.946
1999 $ 200,104 8.90% $ 5,700,758 6.88% 0.773
2000 $ 212,081 5.99% $ 6,364,428 11.64% 1.945
2001 $ 230,356 8.62% $ 6,922,895 8.77% 1.018
2002 $ 240,616 4.45% $ 6,714,191 -3.01% -0.677
2003 $ 244,957 6.34% $ 6,271,693 -9.41% -1.484
2004 $ 264,854 5.60% $ 6,785,077 8.90% 1.589
2005 $ 284,216 7.31% $ 7,280,815 7.31% 1.000
2006 $ 300,891 5.87% 8,040,624$ 10.44% 1.779
2007 $ 318,950 6.00% 8,820,797$ 9.70% 1.617
2008 $ 329,555 3.32% 8,845,476$ 0.28% 0.084
2009 $ 326,970 -0.78% 7,801,185$ -11.81% 15.141
(i) Individual Income amounts are estimated figures that are restated every quarter.(ii) The ratio is the percentage change in tax receipts to the percentage change in individual income. This measures the sensitivity of individual income tax revenue to changes in individual personal income.A ratio of 1.0 would indicate an identical rate of change for income and tax yield.Source: Accounting Unit, Finance Department, Georgia Department of Revenue - Monthly Press Release of Net Revenue Collections and US Department of Commerce, Bureau of Economic Analysis, Released June 2009

Georgia Department of Revenue | Statistical Report FY2009A
ppen
dix:
His
toric
al D
ata
155
Table 10Growth Trend of Individual Income Tax (Thousands)
Calendar YearNumber of
Returns(Thousands)
Adjusted GrossIncome Reported
(Thousands)
Taxable Net IncomeReported
(Thousands)
Tax Liability (Thousands)
1986 2,410 $ 54,170,564 $ 37,169,975 $ 1,984,217
1987 2,529 $ 60,131,052 $ 39,798,725 $ 2,202,662
1988 2,606 $ 65,628,920 $ 44,424,149 $ 2,552,989
1989 2,663 $ 68,617,272 $ 46,207,194 $ 2,611,699
1990 2,702 $ 71,753,093 $ 48,231,107 $ 2,750,736
1991 2,714 $ 75,329,837 $ 51,311,323 $ 2,855,977
1992 2,722 $ 83,090,468 $ 57,098,987 $ 3,061,836
1993 2,855 $ 87,961,434 $ 60,798,369 $ 3,336,851
1994 2,964 $ 96,300,663 $ 65,123,187 $ 3,559,131
1995 3,076 $ 104,219,482 $ 69,551,937 $ 3,899,805
1996 3,166 $ 112,437,195 $ 79,372,476 $ 4,357,859
1997 3,130 $ 118,870,445 $ 84,667,727 $ 4,665,720
1998 3,337 $ 132,507,265 $ 93,022,750 $ 5,125,991
1999 3,526 $ 152,855,648 $ 107,079,738 $ 5,829,915
2000 3,629 $ 157,455,921 $ 117,845,448 $ 6,361,264
2001 3,650 $ 150,635,841 $ 111,049,521 $ 6,043,449
2002 3,659 $ 149,204,721 $ 108,276,684 $ 5,879,892
2003 3,690 $ 153,771,193 $ 112,028,551 $ 6,104,844
2004 3,776 $ 165,421,204 $ 122,448,097 $ 6,712,680
2005 3,836 $ 172,975,112 $ 129,060,396 $ 7,100,396
2006 4,045 $ 193,127,039 $ 144,979,006 $ 8,026,610
2007 4,273 $ 202,746,898 $ 151,026,391 $ 8,373,271
Source: Information Technology Division, Georgia Department of Revenue

Georgia Department of Revenue | Statistical Report FY2009A
ppendix: Historical D
ata
156
Table 10 ContinuedGrowth Trend of Individual Income Tax - Annual Numerical Increase
Calendar YearNumber of
Returns(Thousands)
Adjusted GrossIncome Reported
(Thousands)
Taxable Net IncomeReported
(Thousands)
Tax Liability (Thousands)
1986 100 $ 5,142,525 $ 1,724,776 $ 242,705
1987 119 $ 5,960,488 $ 2,628,750 $ 218,445
1988 77 $ 5,497,868 $ 4,625,424 $ 350,327
1989 57 $ 2,988,352 $ 1,783,045 $ 58,710
1990 39 $ 3,135,821 $ 2,023,913 $ 139,037
1991 12 $ 3,576,744 $ 3,080,216 $ 105,241
1992 8 $ 7,760,631 $ 5,787,664 $ 205,859
1993 133 $ 4,870,966 $ 3,699,382 $ 275,015
1994 109 $ 8,339,229 $ 4,324,818 $ 222,280
1995 112 $ 7,918,819 $ 4,428,750 $ 340,674
1996 90 $ 8,217,713 $ 9,820,539 $ 458,054
1997 (36) $ 6,433,250 $ 5,295,251 $ 307,861
1998 207 $ 13,636,820 $ 8,355,023 $ 460,271
1999 189 $ 20,348,383 $ 14,056,988 $ 703,924
2000 103 $ 4,600,273 $ 10,765,710 $ 531,349
2001 21 $ (6,820,080) $ (6,795,927) $ (317,815)
2002 9 $ (1,431,120) $ (2,772,837) $ (163,557)
2003 31 $ 4,566,472 $ 3,751,867 $ 224,952
2004 86 $ 11,650,011 $ 10,419,546 $ 607,836
2005 60 $ 7,553,908 $ 6,612,299 $ 387,716
2006 209 $ 20,151,927 $ 15,918,610 $ 926,214
2007 228 $ 9,619,859 $ 6,047,385 $ 346,661
Source: Information Technology Division, Georgia Department of Revenue

Georgia Department of Revenue | Statistical Report FY2009A
ppen
dix:
His
toric
al D
ata
157
Table 10 ContinuedGrowth Trend of Individual Income Tax - Annual Percentage Increase/Decrease
Calendar YearNumber of
Returns(Thousands)
Adjusted GrossIncome Reported
(Thousands)
Taxable Net IncomeReported
(Thousands)
Tax Liability (Thousands)
1986 0.00% 0.01% 0.09% 0.01%
1987 4.94% 11.00% 7.07% 11.01%
1988 3.04% 9.14% 11.62% 15.90%
1989 2.19% 4.55% 4.01% 2.30%
1990 1.46% 4.57% 4.38% 5.32%
1991 0.44% 4.98% 6.39% 3.83%
1992 0.29% 10.30% 11.28% 7.21%
1993 4.89% 5.86% 6.48% 8.98%
1994 3.82% 9.48% 7.11% 6.66%
1995 3.78% 8.22% 6.80% 9.57%
1996 2.93% 7.89% 14.12% 11.75%
1997 -1.14% 5.72% 6.67% 7.06%
1998 6.61% 11.47% 9.87% 9.86%
1999 5.66% 15.36% 15.11% 13.73%
2000 2.92% 3.01% 10.05% 9.11%
2001 0.58% -4.33% -5.77% -5.00%
2002 0.25% -0.95% -2.50% -2.71%
2003 0.85% 3.06% 3.47% 3.83%
2004 2.35% 7.58% 9.30% 9.96%
2005 1.57% 4.57% 5.40% 5.78%
2006 5.47% 11.65% 12.33% 13.04%
2007 5.64% 4.98% 4.17% 4.32%
Source: Information Technology Division, Georgia Department of Revenue
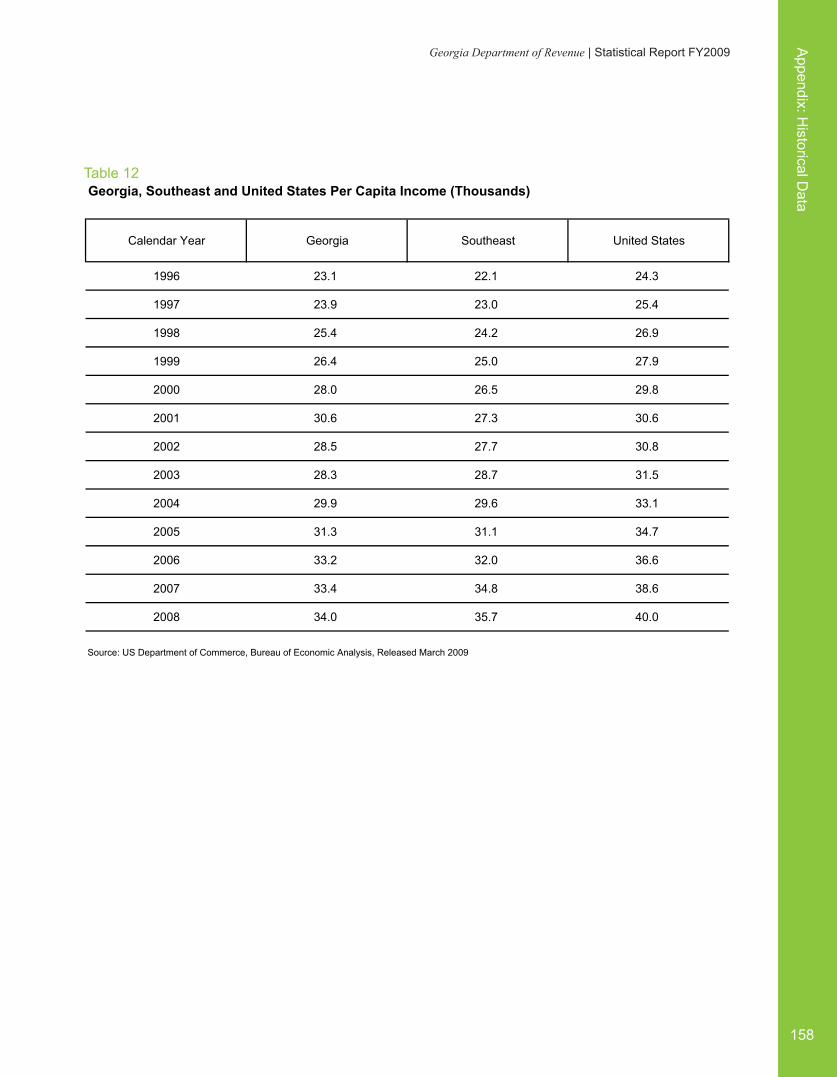
Georgia Department of Revenue | Statistical Report FY2009A
ppendix: Historical D
ata
158
Table 12Georgia, Southeast and United States Per Capita Income (Thousands)
Calendar Year Georgia Southeast United States
1996 23.1 22.1 24.3
1997 23.9 23.0 25.4
1998 25.4 24.2 26.9
1999 26.4 25.0 27.9
2000 28.0 26.5 29.8
2001 30.6 27.3 30.6
2002 28.5 27.7 30.8
2003 28.3 28.7 31.5
2004 29.9 29.6 33.1
2005 31.3 31.1 34.7
2006 33.2 32.0 36.6
2007 33.4 34.8 38.6
2008 34.0 35.7 40.0
Source: US Department of Commerce, Bureau of Economic Analysis, Released March 2009

Georgia Department of Revenue | Statistical Report FY2009A
ppen
dix:
His
toric
al D
ata
159
Table 14Georgia, Southeast Total Individual Income as a Percentage of United States
Calendar Year Georgia Southeast
1996 2.6% 22.1%
1997 2.7% 22.1%
1998 2.7% 22.1%
1999 2.7% 22.0%
2000 2.7% 21.9%
2001 2.8% 22.1%
2002 2.8% 22.2%
2003 2.7% 22.3%
2004 2.7% 22.5%
2005 2.8% 22.6%
2006 2.7% 22.7%
2007 2.7% 22.7%
2008 2.7% 22.6%
Source: US Department of Commerce, Bureau of Economic Analysis, Released March 2009

Georgia Department of Revenue | Statistical Report FY2009A
ppendix: Historical D
ata
160
Table 19Taxable Values and Tax Rates, State of Georgia for General Property and Public Utilities
Net Taxable Values (Thousands)
Fiscal Year State Rate(Per $1000 value)
Grand Total Public Utilities
Grand Total10 Yr
GrowthRate
20 Yr GrowthRate
Public Utilities10 Yr
GrowthRate
20 Yr GrowthRate
1910 5.00 766,889$ 77% - 124,337 175% -
1920 5.00 1,346,889$ 76% 212% 165,410 33% 266%
1930 5.00 1,303,462$ -3% 70% 216,232 31% 74%
1940 5.00 917,612$ -30% -32% 165,146 -24% 0%
1950 5.00 1,487,323$ 62% 14% 247,148 50% 14%
1960 0.25 3,031,881$ 104% 230% 423,707 71% 157%
1970 0.25 9,148,736$ 202% 515% 1,157,333 173% 368%
1980 0.25 39,169,215$ 328% 1192% 3,834,604 231% 805%
1990 0.25 104,270,104$ 166% 1040% 8,068,762 110% 597%
2000 0.25 201,251,237$ 93% 414% 10,313,948 28% 169%
2003 0.25 256,965,131$ - - 10,451,760 0% 0%
2004 0.25 272,207,115$ 111% 381% 11,330,385 20% 118%
2005 0.25 291,219,580$ 114% 360% 11,549,924 21% 98%
2006 0.25 318,095,398$ 116% 343% 12,135,793 24% 71%
2007 0.25 332,356,035$ 111% 306% 11,962,961 21% 50%
2008 0.25 351,151,399$ 104% 285% 12,094,511 22% 39%
Source: Local Government Services Division, Georgia Department of Revenue

Georgia Department of Revenue | Statistical Report FY2009A
ppen
dix:
His
toric
al D
ata
161
Table 19 ContinuedTaxable Values and Tax Rates, State of Georgia for General Property and Public Utilities
General Property (Net of exemptions) (Thousands)
Fiscal Year Total10 Yr
GrowthRate
20 Yr GrowthRate
RealProperty
10 Yr GrowthRate
20 Yr GrowthRate
PersonalProperty
10 Yr GrowthRate
20 Yr GrowthRate
1910 642,551$ 66% - 389,394$ 64% - 253,156$ 69% -
1920 1,181,476$ 84% 205% 714,151$ 83% 201% 467,322$ 85% -
1930 1,087,229$ -8% 69% 776,073$ 9% 99% 311,155$ -33% -
1940 752,466$ -31% -36% 500,610$ -35% -30% 251,857$ -19% -
1950 1,240,174$ 65% 14% 669,405$ 34% -14% 570,769$ 127% -
1960 2,608,171$ 110% 247% 1,560,867$ 133% 212% 1,047,301$ 83% -
1970 7,991,398$ 206% 544% 6,945,928$ 345% 938% 1,045,457$ 0% -
1980 35,334,601$ 342% 1255% 25,323,247$ 265% 1522% 10,011,336$ 858% -
1990 96,201,335$ 172% 1104% 71,614,692$ 183% 931% 24,586,632$ 146% -
2000 190,937,287$ 98% 440% 146,053,491$ 104% 477% 44,883,790$ 83% -
2003 246,513,371$ - - 201,816,877$ - - 44,696,494$ - -
2004 260,876,732$ 118% 408% 217,607,321$ 140% 490% 43,269,408$ 49% 199%
2005 279,669,656$ 121% 386% 236,646,531$ 149% 476% 43,023,125$ 36% 162%
2006 305,959,605$ 122% 373% 251,602,699$ 146% 428% 54,356,906$ 55% 220%
2007 320,393,073$ 117% 333% 265,769,931$ 142% 400% 54,623,142$ 45% 163%
2008 339,056,888$ 110% 311% 284,700,317$ 135% 376% 54,356,572$ 34% 138%
Source: Local Government Services Division, Georgia Department of Revenue

Georgia Department of Revenue | Statistical Report FY2009A
ppendix: Historical D
ata
162
Table 31Tax and Fee Collections by Enforcement Unit of the Alcohol and Tobacco Division (Thousands)
Fiscal Year Delinquent Tax Collections Fee Collections
Executive Orders / Administrative
Penalties / Fines
Total Collections and Fines Paid
2003 $ 5,181 $ 284 $ 508 $ 5,973
2004 $ 9,169 $ 278 $ 600 $10,047
2005 $ 6,900 $ 142 $ 733 $ 7,775
2006 $ 5,869 $ 123 $ 576 $ 6,568
2007 $10,385 $ 118 $ 520 $11,023
2008 $11,631 $ 137 $ 528 $12,296
2009 $11,377 $ 138 $ 966 $12,481
Source: Alcohol and Tobacco Division, Georgia Department of Revenue

Georgia Department of Revenue | Statistical Report FY2009A
ppen
dix:
His
toric
al D
ata
163
Table 32Alcohol and Tobacco Division Performance Figures
Calendar Year Number ofAlcohol Agents
AlcoholInspections
AlcoholInvestigations
AlcoholCitations
UnderageAlcohol
Investigations
UnderageAlcohol
Citations
2002 32 4,761 1,203 1,066 1,944 502
2003 33 4,921 1,351 1,320 1,982 396
2004 28 3,761 1,184 1,691 1,970 306
2005 32 3,247 1,334 1,861 1,851 284
2006 30 3,630 1,377 1,659 2,530 537
2007 30 3,561 1,499 1,716 2,556 774
2008 28 4,085 1,523 2,094 4,202 1,154
2009 24 4,192 1,469 1,603 3,641 615
Calendar Year Liquor License Investigations Still Seizures Tobacco
InspectionsTobacco
InvestigationsTobaccoCitations
UnderageTobacco
Investigations
2002 1,344 2 3,261 29 42 937
2003 2,145 4 3,612 10 34 1,232
2004 2,096 7 2,773 12 27 717
2005 1,921 2 2,049 4 18 553
2006 2,530 4 2,552 9 25 1,008
2007 2,652 - 2,456 9 23 1,568
2008 1,523 - 2,902 11 22 2,095
2009 1,469 - 3,178 13 37 1,782
Calendar Year ExecutiveOrders
GameInspections Felony Arrests Misdemeanor
ArrestsDyed FuelInspections
Dyed Fuel Violations
2002 914 16,356 5 380 - -
2003 1,355 11,803 7 325 - -
2004 1,469 9,676 5 239 - -
2005 1,663 8,764 13 202 - -
2006 1,658 8,312 9 260 2,006 115
2007 1,372 2,130 3 196 4,349 158
2008 1,505 1,743 1 211 5,253 151
2009 2,137 1,482 19 221 6,252 158
Source: Alcohol and Tobacco Division, Georgia Department of Revenue
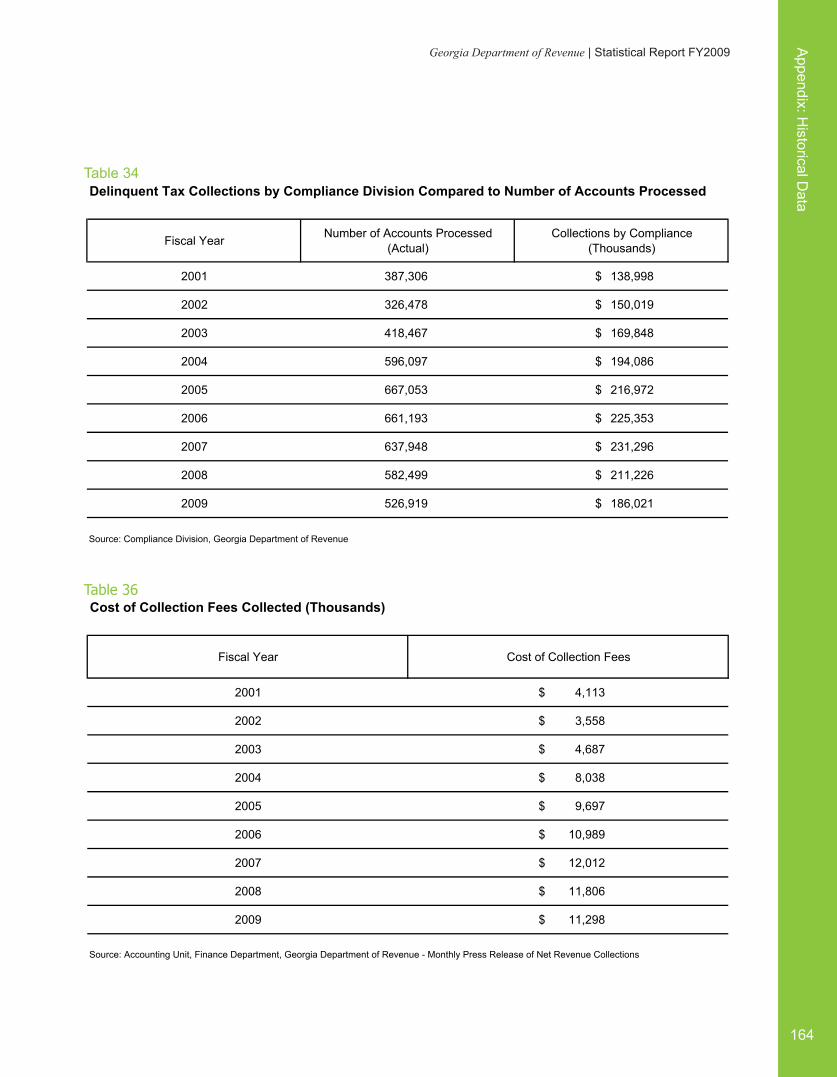
Georgia Department of Revenue | Statistical Report FY2009A
ppendix: Historical D
ata
164
Table 34
Table 36
Delinquent Tax Collections by Compliance Division Compared to Number of Accounts Processed
Fiscal Year Number of Accounts Processed (Actual)
Collections by Compliance (Thousands)
2001 387,306 $ 138,998
2002 326,478 $ 150,019
2003 418,467 $ 169,848
2004 596,097 $ 194,086
2005 667,053 $ 216,972
2006 661,193 $ 225,353
2007 637,948 $ 231,296
2008 582,499 $ 211,226
2009 526,919 $ 186,021
Source: Compliance Division, Georgia Department of Revenue
Cost of Collection Fees Collected (Thousands)
Fiscal Year Cost of Collection Fees
2001 $ 4,113
2002 $ 3,558
2003 $ 4,687
2004 $ 8,038
2005 $ 9,697
2006 $ 10,989
2007 $ 12,012
2008 $ 11,806
2009 $ 11,298
Source: Accounting Unit, Finance Department, Georgia Department of Revenue - Monthly Press Release of Net Revenue Collections

Georgia Department of Revenue | Statistical Report FY2009A
ppen
dix:
His
toric
al D
ata
165
Table 37Comparison of Sales Tax Paid to the State Treasury and Sales Tax Distribution (Millions)
Fiscal Year Net State Collections Distributions
1997 $ 4,079 $ 1,571
1998 $ 4,143 $ 2,245
1999 $ 4,486 $ 2,843
2000 $ 4,814 $ 3,105
2001 $ 5,126 $ 3,242
2002 $ 5,026 $ 3,181
2003 $ 4,985 $ 3,175
2004 $ 5,081 $ 3,398
2005 $ 5,282 $ 3,745
2006 $ 5,745 $ 4,311
2007 $ 5,949 $ 4,725
2008 $ 5,781 $ 4,832
2009 $ 5,342 $ 4,360
Source: Accounting Unit, Finance Department, Georgia Department of Revenue - Monthly Press Release of Net Revenue Collections

Georgia Department of Revenue | Statistical Report FY2009A
ppendix: Historical D
ata
166
Table 39Net Revenue Collections by Georgia Department of Revenue - Monthly Collections (Unaudited and Thousands)
Fiscal Year July August September October November December
2003 $ 898,993 $ 962,576 $ 1,138,661 $ 1,034,960 $ 1,064,161 $ 1,106,994
2004 $ 821,081 $ 980,455 $ 1,240,684 $ 1,095,874 $ 1,085,952 $ 1,106,290
2005 $ 870,867 $ 1,237,074 $ 1,343,923 $ 1,153,479 $ 1,148,740 $ 1,377,758
2006 $ 1,093,198 $ 1,296,959 $ 1,460,918 $ 1,304,776 $ 1,208,629 $ 1,539,857
2007 $ 1,176,085 $ 1,275,942 $ 1,564,037 $ 1,360,901 $ 1,278,362 $ 1,634,397
2008 $ 1,299,683 $ 1,353,788 $ 1,561,749 $ 1,388,598 $ 1,408,993 $ 1,624,867
2009 $ 1,213,291 $ 1,259,631 $ 1,632,334 $ 1,386,860 $ 1,419,543 $ 1,489,148
Fiscal Year January February March April May June
2003 $ 1,362,525 $ 990,809 $ 833,900 $ 956,831 $ 1,293,337 $ 1,272,147
2004 $ 1,466,917 $ 929,078 $ 865,798 $ 1,311,030 $ 1,399,883 $ 1,279,347
2005 $ 1,578,151 $ 705,841 $ 1,110,105 $ 1,270,517 $ 1,451,619 $ 1,445,140
2006 $ 1,795,724 $ 886,113 $ 1,200,704 $ 1,334,743 $ 1,673,929 $ 1,598,202
2007 $ 1,978,077 $ 961,225 $ 1,174,222 $ 1,309,159 $ 2,140,232 $ 1,787,195
2008 $ 1,837,297 $ 965,846 $ 1,155,087 $ 1,761,180 $ 1,473,892 $ 1,618,879
2009 $ 1,575,265 $ 629,448 $ 987,986 $ 1,399,047 $ 1,262,138 $ 1,364,350
Source: Accounting Unit, Finance Department, Georgia Department of Revenue - Monthly Press Release of Net Revenue Collections

Georgia Department of Revenue | Statistical Report FY2009A
ppen
dix:
His
toric
al D
ata
167
Table 39 ContinuedNet Revenue Collections by Georgia Department of Revenue - Fiscal Collections (Unaudited and Thousands)
Fiscal Year Amount Fiscal Year Amount Fiscal Year Amount
1939 $ 40,891 1964 $ 468,243 1989 $ 6,086,781
1940 $ 44,170 1965 $ 523,599 1990 $ 6,802,402
1941 $ 40,380 1966 $ 585,584 1991 $ 6,861,631
1942 $ 57,062 1967 $ 641,167 1992 $ 6,992,517
1943 $ 55,259 1968 $ 703,270 1993 $ 7,826,861
1944 $ 56,906 1969 $ 795,125 1994 $ 8,444,864
1945 $ 58,347 1970 $ 904,279 1995 $ 9,115,243
1946 $ 75,483 1971 $ 949,146 1996 $ 9,928,508
1947 $ 92,519 1972 $ 1,145,094 1997 $ 10,543,106
1948 $ 101,588 1973 $ 1,298,984 1998 $ 11,090,777
1949 $ 102,947 1974 $ 1,454,888 1999 $ 12,068,478
1950 $ 117,894 1975 $ 1,485,597 2000 $ 13,041,655
1951 $ 145,305 1976 $ 1,607,948 2001 $ 13,934,126
1952 $ 220,505 1977 $ 1,826,490 2002 $ 13,044,947
1953 $ 210,038 1978 $ 2,094,166 2003 $ 12,709,799
1954 $ 216,092 1979 $ 2,353,857 2004 $ 13,582,389
1955 $ 226,226 1980 $ 2,624,813 2005 $ 14,693,214
1956 $ 283,154 1981 $ 2,911,453 2006 $ 16,393,752
1957 $ 300,953 1982 $ 3,161,548 2007 $ 17,639,834
1958 $ 303,953 1983 $ 3,389,303 2008 $ 17,449,859
1959 $ 321,702 1984 $ 3,818,550 2009 $ 15,619,041
1960 $ 352,008 1985 $ 4,373,972
1961 $ 374,423 1986 $ 4,739,023
1962 $ 383,718 1987 $ 5,090,622
1963 $ 422,533 1988 $ 5,532,660
Source: Accounting Unit, Finance Department, Georgia Department of Revenue - Monthly Press Release of Net Revenue Collections

Georgia Department of Revenue | Statistical Report FY2009A
ppendix: Historical D
ata
168
Table 40
2009 $ 945,952 $ 834,621 $ 5,342,569 $ 8,495,899 $ 15,619,041
Net Trends in Georgia's State Tax Revenues by Major Sources (Thousands)
Fiscal Year Other Sources SelectiveSales Tax
GeneralSales and Use
Tax
Individual and Corporate
Income Tax
Total Taxes /Other Revenues
1998 $ 353,339 $ 648,072 $ 4,006,162 $ 6,083,204 $ 11,090,777
1999 $ 442,444
2000 $ 536,347
$ 645,645 $ 4,479,223
$ 666,627 $ 4,806,932
$ 6,501,165 $ 12,068,477
$ 7,031,749 $ 13,041,655
2001 $ 450,760 $ 701,107 $ 5,139,314 $ 7,642,945 $ 13,934,126
2002 $ 385,028 $ 717,364 $ 4,620,883 $ 7,321,671 $ 13,044,946
2003 $ 188,636 $ 746,438 $ 4,991,882 $ 6,782,842 $ 12,709,798
2004 $ 467,665
2005 $ 557,883
$ 913,377 $ 4,921,569
$ 860,319 $ 5,281,884
$ 7,279,778 $ 13,582,389
$ 7,993,128 $ 14,693,214
2006 $ 883,973 $ 833,010 $ 5,745,409 $ 8,931,360 $ 16,393,752
2007 $ 968,045 $ 918,288 $ 5,915,519 $ 9,837,982 $ 17,639,834
2008 $ 1,003,093 $ 877,381 $ 5,780,867 $ 9,788,518 $ 17,449,859
Source: Accounting Unit, Finance Department, Georgia Department of Revenue - Monthly Press Release of Net Revenue Collections
Note: Selective Sales Taxes includes Motor Fuel Excise Tax and all Tobacco and Alcohol Taxes.The above figures are extracted from the Department of Revenue's annual Revenue Collection Press Releases published during the relevant years.
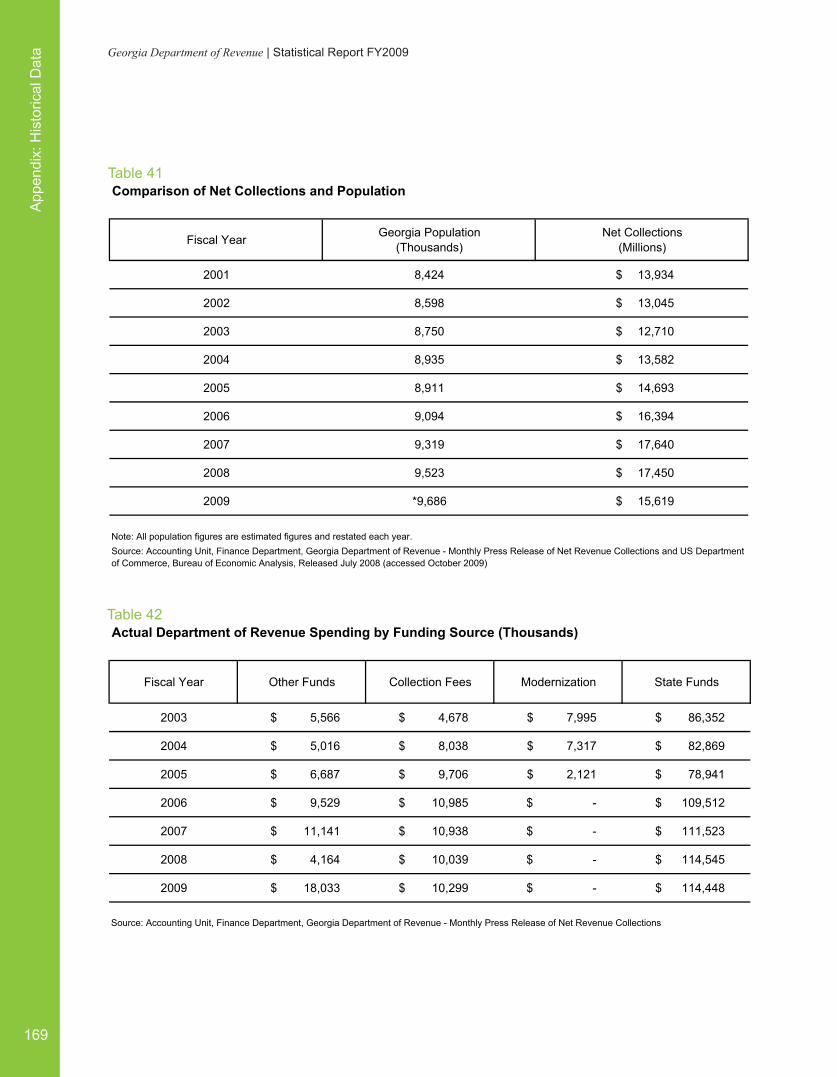
Georgia Department of Revenue | Statistical Report FY2009A
ppen
dix:
His
toric
al D
ata
169
Table 41
Table 42
Note: All population figures are estimated figures and restated each year.
Comparison of Net Collections and Population
Fiscal Ye
2001
ar Georgia Population(Thousands)
8,424
Ne
$
t Collections(Millions)
13,934
2002 8,598 $ 13,045
2003 8,750 $ 12,710
2004
2005
8,935
8,911
$
$
13,582
14,693
2006 9,094 $ 16,394
2007 9,319 $ 17,640
2008 9,523 $ 17,450
2009 *9,686 $ 15,619
Source: Accounting Unit, Finance Department, Georgia Department of Revenue - Monthly Press Release of Net Revenue Collections and US Department of Commerce, Bureau of Economic Analysis, Released July 2008 (accessed October 2009)
Actual Department of Revenue Spending by Funding Source (Thousands)
Fiscal Year Other Funds Collection Fees Modernization State Funds
2003 $ 5,566 $ 4,678 $ 7,995 $ 86,352
2004 $ 5,016 $ 8,038 $ 7,317 $ 82,869
2005 $ 6,687 $ 9,706 $ 2,121 $ 78,941
2006 $ 9,529 $ 10,985 $ - $ 109,512
2007 $ 11,141 $ 10,938 $ - $ 111,523
2008 $ 4,164 $ 10,039 $ - $ 114,545
2009 $ 18,033 $ 10,299 $ - $ 114,448
Source: Accounting Unit, Finance Department, Georgia Department of Revenue - Monthly Press Release of Net Revenue Collections

Georgia Department of Revenue | Statistical Report FY2009A
ppendix: Historical D
ata
170
Table 45Trend in Georgia's State Tax Revenues by Major Sources (Unaudited and Millions)
GeneralSales and
Use
SelectiveSales Taxes
(1)
IncomeTaxes
OtherTaxes or Fees
1996 $ 9,929 $ 350 $10,279 $ 3,951 $ 827 $ 4,930 $ 571
1997 $10,543 $ 376 $10,919 $ 4,067 $ 849 $ 5,462 $ 541
1998 $11,091 $ 393 $11,484 $ 4,006 $ 871 $ 6,083 $ 524
1999 $12,068 $ 392 $12,460 $ 4,479 $ 876 $ 6,501 $ 834
2000 $13,041 $ 409 $13,450 $ 4,807 $ 958 $ 7,032 $ 653
2001 $13,934 $ 411 $14,345 $ 5,139 $ 957 $ 7,613 $ 636
2002 $13,128 $ 467 $13,595 $ 4,621 $ 1,013 $ 7,279 $ 682
2003 $12,777 $ 476 $13,253 $ 4,992 $ 1,070 $ 6,742 $ 449
2004 $13,582 $ 435 $14,017 $ 4,922 $ 913 $ 7,279 $ 903
2005 $14,693 $ 549 $15,242 $ 5,282 $ 860 $ 7,993 $ 1,107
2006 $16,394 $ 213 $16,607 $ 5,746 $ 833 $ 8,931 $ 1,097
2007 $17,640 $ 341 $17,981 $ 5,916 $ 918 $ 9,838 $ 1,309
2008 $17,450 $ 246 $17,696 $ 5,781 $ 877 $ 9,789 $ 1,249
2009 $15,619 $ 314 $15,933 $ 5,342 $ 835 $ 7,801 $ 1,955
(i) Selective Taxes are made up of Motor Fuel Excise, Tobacco and Alcohol Taxes.Note: The State of Georgia Office of Treasury and Fiscal Services (OTFS) figures are stated using the Statutory Basis of accounting.Source: Accounting Unit, Finance Department, Georgia Department of Revenue - Monthly Press Release of Net Revenue Collections and the State of Georgia Office of Treasury and Fiscal Services (OTFS)
Breakdown of Grand Total by Major Source
Fiscal Year Departmentof Revenue
OtherAgencies Grand Total

Georgia Department of Revenue | Statistical Report FY2009FY
2008
and
FY
2009
Tab
le C
ompa
rison
171
Table Page Table Page
Results and Performance Measures A 13 - 13
Number of Department of Revenue Employees by Category 1 16 1 21
Office of Special Investigations Results and Performance Measures A.1 17 - 21
Tax Law and Policy Division Results and Performance Measures A.2 18 - 22
Tax Law and Policy Seminars B.1 18 - 23
Taxpayer Services Division Results and Performance Measures A.3 19 - 25
Taxpayer Services Division Seminars B.2 20 - 26
Net Sales and Use Tax Collections by Month 2 22 2 29
Sales and Use Tax Revenues by Business Group - Net Collections 3.1 23 3.1 30
Sales and Use Tax Revenues by Business Group - Percentage 3.2 23 3.2 31
Sales and Use Tax Revenues by Business Group - Adjusted Total Revenues 3.3 24 3.3 31
Growth in Sales and Use Tax Distributions to the General Fund and 1% to Counties 4 24 4 32
CY2007 Domestic Corporation Income Tax Returns by Taxable Income Class 5.1 25 5.1 33
CY2007 Foreign Corporation Income Tax Returns by Taxable Income Class 5.2 25 5.2 34
CY2007 Corporation Income Tax Returns by Taxable Income Class 5.3 26 5.3 35
Net Corporate Tax Collections and Returns Processed Annually 6 26 6 36
FY2009 Motor Fuel and Motor Carrier Detailed Revenue Data 7 27 7 37
Number of Individual Income Tax Returns Processed and Net Individual Income Tax Collections 8 28 8 38
Comparative Trends in Georgia's Individual Income and State Income Tax Receipts 9 28 9 39
Growth Trend of Individual Income Tax 10 29 10 40
CY2007 Georgia Individual Income - Returns by Income Class 11 30 11 41
Georgia, Southeast and United States Per Capita Income 12 32 12 43
Per Capita Individual Income Percent Increase Comparison by Five Year Periods 13 32 13 43
Georgia, Southeast Total Individual Income as a Percentage of United States 14 33 14 44
Total Individual Income Percent Increase Comparison by Period 15 33 15 44
FY2008 FY2009Titles
FY2008 and FY2009 Table Comparison

Georgia Department of Revenue | Statistical Report FY2009FY
2008 and FY2009 Table C
omparison
172
Table Page Table Page
FY2008 FY2009Titles
CY2007 Individual Income Tax Data by County of Residence 16 34 16 45
CY2009 Electronic Filing Results vs. Paper Returns 17 47 17 59
Local Government Services Division Results and Performance Measures A.4 53 - 61
Local Government Services Division Seminars B.3 49 - 62
Summary of Net Property Tax Collections by Category 18 53 18 67
Taxable Values and Tax Rates, State of Georgia for General Property and Public Utilities 19 54 19 68
Values of General Property, Public Utilities Dollars by Class of Property 20 55 20 69
CY2008 Selected Tax Statistics and Estimates by County 21 56 21 70
Three Economic Indicators by County with Rankings and Per Capita Amounts 22 68 22 77
Millage Rates by County - Alphabetical 23 80 23 91
Millage Rates by County - Numerical 24 86 24 97
Net HTRG Revenue Totals 25 88 25 99
Motor Vehicle Results and Performance Measures A.5 92 - 102
Motor Vehicle Seminars B.4 90 - 103
Number of Motor Vehicle Registrations and Tags Issued 26.1 92 26.1 104
Number of Motor Vehicle Registrations Sold by Major Category 26.2 93 26.2 104
Summary of Revenues from Motor Vehicle Tag, Title, and Related Items 27 93 27 105
FY2009 Motor Vehicle Division Production Report - Tradeport Facility 28 94 28 106
Lobby Customers at Tradeport Facility 29 95 29 107
Processing Center Results and Performance Measures A.7 104 - 109
Tax Returns Processed in Department of Revenue 34 104 30 110
Alcohol and Tobacco Division Results and Performance Measures A.6 98 - 112
Tax and Fee Collections by the Enforcement Unit of the Alcohol and Tobacco Division 30 98 31 114
Alcohol and Tobacco Division Performance Figures 31 99 32 115
Revenue from Selective Excise Taxes 32.1 100 33.1 116
Revenue from Business License Fees 32.2 101 33.2 117

Georgia Department of Revenue | Statistical Report FY2009FY
2008
and
FY
2009
Tab
le C
ompa
rison
173
Table Page Table Page
FY2008 FY2009Titles
Revenue and Number of Multiple Licenses 33 102 N/A N/A
Compliance Division Results and Performance Measures A.8 107 - 120
Delinquent Tax Collections by Compliance Division Compared to Number of Accounts Processed 35 107 34 121
Revenue from Collection Initiatives: September 2003 thru June 2009 36 108 35 122
Cost of Collection Fees Collected 37 108 36 123
Comparison of Sales Tax Paid to the State Treasury and Sales Tax Distribution 38 108 37 123
CY2009 Refund History by Months 39 109 38 124
Net Revenue Collections by Georgia Department of Revenue 40 110 39 125
Net Trends in Georgia's State Tax Revenues by Major Sources 41 111 40 126
Comparison of Net Collections and Population 42 111 41 127
Actual Department of Revenue Spending by Funding Source 43 111 42 128
Changes in Major State Tax Revenues - Collections 44.1 112 43.1 128
Changes in Major State Tax Revenues - Percentage Changes 44.2 112 43.2 129
Changes in Major State Tax Revenues - Absolute Changes 44.3 113 43.3 130
Revenue Collections - Corporate Tax 45.1 113 44.1 131
Revenue Collections - Individual Tax 45.2 114 44.2 131
Revenue Collections - Other Taxes 45.3 114 44.3 132
Revenue Collections - Business License Fees 45.4 115 44.4 133
Revenue Collections - Earnings - General Government 45.5 115 44.5 133
Revenue Collections - Other Fees 45.6 116 44.6 134
Revenue Collections - Total Revenue Collections 45.7 117 44.7 135
Trend in Georgia's State Tax Revenue by Major Sources 46 117 45 136


