George Campsen's North Atlantic Right Whale Independent Study Document
28
INDEPENDENT STUDY 1 Table of Contents INDEPENDENT STUDY INTRODUCTION………………………………………………………………..2 THE STUDY…...……………………………………………………………………………………………………..6
Transcript of George Campsen's North Atlantic Right Whale Independent Study Document
INDEPENDENT STUDY 1
Table of Contents
INDEPENDENT STUDY INTRODUCTION………………………………………………………………..2 THE STUDY…...……………………………………………………………………………………………………..6
INDEPENDENT STUDY 2
INTRODUCTION
Recently while meeting with members of the Charleston Pilots Association I became
aware of a Federal regulatory matter that hinders not only the course and scope of
Charleston Harbor Pilots’ work, but also commerce in and out of the Port of
Charleston. On 10 October 2008 the Federal Register issued regulation 50 CFR Part
224.105 in order to protect the endangered North Atlantic Right Whale1. I am
proposing to study North Atlantic Right Whale activity off the coast of South
Carolina to effectively understand the specie’s migratory patterns and habits, so that
I may present an alternate and less imposing law to the National Oceanic and
Atmospheric Administration at their hearing on May 16th 2013 in Jacksonville
Florida.
Federal regulation 50 CFR Part 224.105 is an effort to protect the endangered North
Atlantic Right Whale from one of the leading causes of their death: ship strikes2. The
new regulation created “speed zones” for vessels greater than 65 feet in length along
the East Coast of the United States. These speed zones are only effective during
certain months of the year, and follow the yearly migration of the Right whales as
they move from the Northeast waters to their calving grounds off of Florida.
Federal Regulation 50 CFR Part 224.105 divides the east coast of the United States
into three different zones: Northeast, Mid-Atlantic, and Southeast. South Carolina
INDEPENDENT STUDY 3
falls into the Mid-Atlantic category and is regulated from November 1st through
April 30th of each year3.
While this regulation is a minor inconvenience to private or recreational boaters, it
impedes the effectiveness of the Charleston Harbor Pilots who deal solely with the
movement of vessels that must adhere to the 10-knot speed regulation.
Charleston’s shipping channel extends fifteen miles into the North Atlantic where it
stops at the sea buoy. There the pilot boards incoming ships and de-boards
outbound ships. Because pilot boats are greater than 65 feet in length, they must
travel at a maximum speed of 10 knots to meet the incoming ship when the
regulation is in effect. Once the pilot is on board the ship, he must also make the 15-
mile sail back to port at a maximum speed of 10 knots. For outbound ships the
process is simply reversed and the same regulations apply.
Because Harbor Pilots are in the business of moving goods, it is critically important
that they, like any business, operate as effectively as possible otherwise they cannot
meet demand and may suffer economic losses due to unhappy customers. Because
the Charleston Pilots are on a limited budget and have a limited staff, they cannot
keep trade moving efficiently at a 10-knot speed. During the regulated period, pilots
do not operate to full efficiency; therefore it is common for ships to wait for hours
outside of the port of Charleston during the regulated period. In effect, the Port of
INDEPENDENT STUDY 4
Charleston loses attraction for major shipping lines, hurting South Carolina’s
economy as well as the Charleston Harbor Pilots.
Throughout the course of my independent study, I will do a thorough review and
analysis of the annual Right Whale reports posted by the National Oceanic and
Atmospheric Administration’s (NOAA) whale watching team1 as well as comparing
Right Whale Habits and regulations in certain regions and proposing alternative
laws. This team flies off the coast of South Carolina and Georgia every day that the
weather permits throughout the migratory season. For the team’s study purposes,
South Carolina’s waters are divided into three separate flight zones: Northern,
Middle, and Southern. Each day they alternate which zone they fly. As the team
carries out their flights, they continually look for whales and report the date,
latitude, longitude, and group size for every right whale sighting. They also report
the survey area and Trackline miles flown on a daily basis4. After gathering and
analyzing all of this data, I will produce a thorough yet concise presentation
illustrating right whale habits and trends off of South Carolina.
My goals for this study are two-fold. First and foremost, I hope that I will make a
favorable and lasting impression on the Charleston Harbor Pilots as I work with and
around them this semester. If I am successful in accomplishing that, my chances of
becoming a harbor Pilot in Charleston Harbor will improve greatly. Second, I will
1 http://sero.nmfs.noaa.gov/pr/mm/rightwhales/SoutheastRegionsContractsAerialSurveyReports.htm
INDEPENDENT STUDY 5
deliver a thorough presentation to the National Oceanic and Atmospheric
Administration on 16 May 2013 in Jacksonville, Florida in hopes of changing the
current regulations to one of two alternatives. If I can accomplish this goal then I
will play a pivotal role in speeding up commerce and making Charleston Harbor
Pilots’ lives easier on top of winning favor in the eyes of those who ultimately
choose the next Pilot in Charleston Harbor.
INDEPENDENT STUDY 6
THE BEGINNING
At the beginning of my independent study I met extensively with Captain John,
Cameron USCG Ret., who currently manages business affairs for the Charleston
Pilots Association. During the initial meeting he imparted what knowledge he had of
North Atlantic Right Whale habits, and we collectively devised a plan of how I
should conduct my research. Following our meeting I familiarized myself with the
federal regulations regarding ship speed, the ongoing yearly study of the Whales off
South Carolina, and the traits and habits of these creatures up and down the eastern
seaboard.
After my brief initial study of the task, we met again to decide that the most effective
and scientific way to pattern these whales would be using South Carolina’s annual
reports prepared by NOAA’s whale watching team as our database. Later I will
explain the details of the NOAA team as well as the methodology for the flights off
South Carolina and how I used that information in my research.
Upon determining what data I was going to use for my database, Captain Cameron
and I collectively decided on an area of interest as well as a time frame. Because I
believe whale activity differs throughout South Carolina’s coastal waters, and that
my focus should be on Charleston Harbor, I chose to study the area that extends 20
nautical miles to the north and south of Charleston harbor. In terms of latitude, this
area ranges from 32° 20’ N to 33° N. Next I viewed the annual Right Whale reports,
INDEPENDENT STUDY 7
discovering that they extend back to the 2004-2005 migratory season. With that
information I decided to use the reports for seasons 2004-2005 through 2011-2012
to hopefully gather enough information to create a long-term picture of whale
activity off the coast of South Carolina.
NOAA’S WHALE WATCHING TEAM
As I previously mentioned, NOAA federally funds a whale watching team of four
trained professionals who are responsible for documenting North Atlantic Right
Whale activity off the coast of South Carolina each migratory season. This team is
composed of one pilot, one co-pilot, and two observers who live on the Isle of Palms,
South Carolina from November 15th to April 15th, flying the coast of South Carolina
every day that the weather permits, spotting and recording whales in the area.
Following is the team’s description of how they methodically fly the coast of South
Carolina:
“The SC survey area for the 2005/2006 season extended from North Myrtle
Beach, SC to the northern end of Sapelo Island, GA. The survey area was
divided into three sections: northern, middle and southern. The northern
area extended from North Myrtle Beach, SC to Cape Romain, SC and consisted
of sixteen southeast/northwest transect lines of varied lengths (35.1 - 35.3
nautical miles) which were flown at approximately 4 nm intervals. The
middle area extended from Cape Romain, SC to Fripp Island, SC and consisted
INDEPENDENT STUDY 8
of sixteen southeast/northwest transect lines of varied lengths (35.3 - 35.4
nm) which were also flown at approximately 4 nm intervals. The southern
section extended from Hilton Head Island, SC to Sapelo Island, GA and
consisted of fourteen east/west transect lines of varied lengths (11.7 – 29.0
nm) which were flown at 3 nm intervals (figure 1). The northern and middle
transit lines were flown in a southeast/northwest direction as opposed to the
east/west direction of the southern section in order to cover a larger
bathymetric range as well as to provide visual data to substantiate the
acoustic data collected by passive detection devices located in the area. A
complete northern survey consisted of 563.4 nm of trackline flown. A
complete middle survey consisted of 565.2 nm of trackline flown. A complete
southern survey consisted of 323.5 nm of trackline flown (table 1). These
totals do not include miles flown in transit to, from, and between transect
lines. The survey aircraft departed from East Cooper Airport in Mt. Pleasant,
SC each day. After completing half of the survey lines for the day, the plane
would break for fuel and to provide a break for observers to avoid observer
fatigue. When flying in the northern section, the plane would refuel at
Georgetown Airport in Georgetown, SC. In the middle section the plane
would refuel at East Cooper Airport. In the southern section, the plane would
refuel at Hilton Head Airport in Hilton Head, SC or at Frogmore Airport in
Beaufort, SC. The plane returned to East Cooper Airport at the end of each
normal survey day. Without whale sightings, a complete northern survey
INDEPENDENT STUDY 9
took approximately 7.9 hobbs hours to finish, a complete middle section took
approximately 7.6 hours, and a complete southern section took
approximately 6.2 hours. This includes transit times to and from the
airports.”2
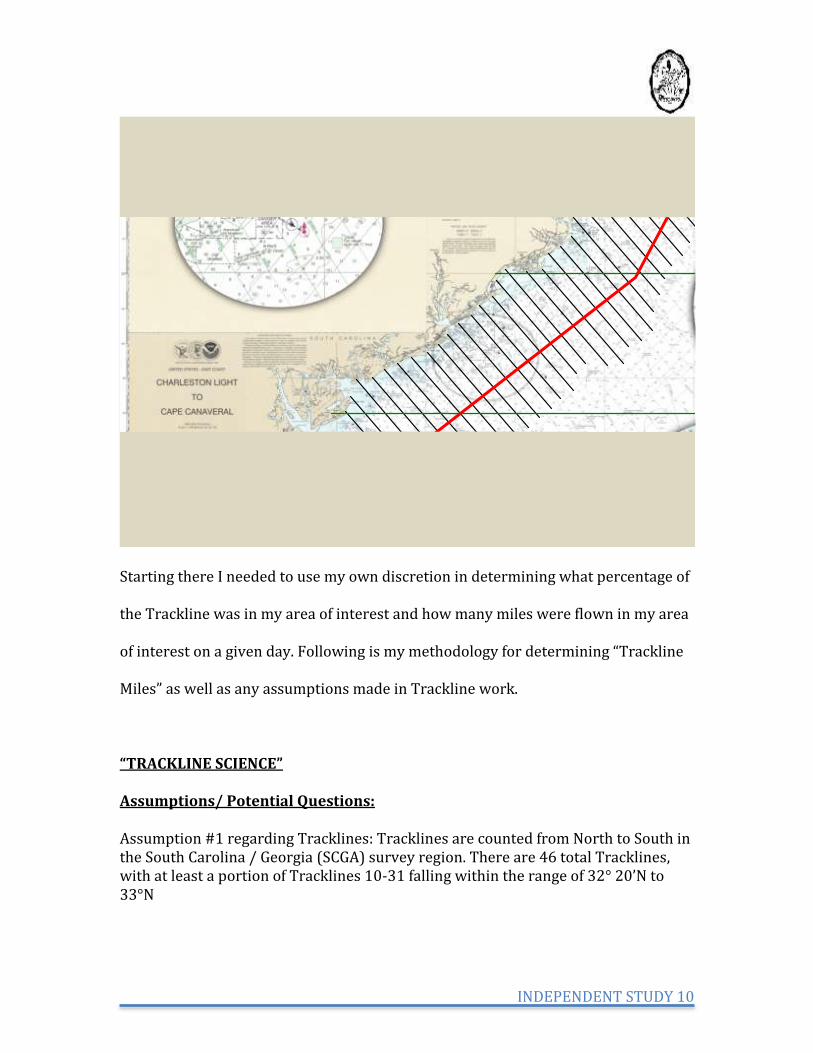
Understanding how the surveys were conducted and how the Tracklines worked, I
set out to determine which Tracklines, and what percentage of each one were in my
area of interest. In doing so I plotted all of the Tracklines’ latitude and longitude
points in Excel, added a trend line, the 20 nautical mile barrier, and my North and
South barriers to my area of interest. Upon completion I overlaid this on the
nautical chart below:
2 http://sero.nmfs.noaa.gov/pr/pdf/05_06%20SCGA%20Final%20Report.pdf
INDEPENDENT STUDY 10
Starting there I needed to use my own discretion in determining what percentage of
the Trackline was in my area of interest and how many miles were flown in my area
of interest on a given day. Following is my methodology for determining “Trackline
Miles” as well as any assumptions made in Trackline work.
“TRACKLINE SCIENCE”
Assumptions/ Potential Questions: Assumption #1 regarding Tracklines: Tracklines are counted from North to South in the South Carolina / Georgia (SCGA) survey region. There are 46 total Tracklines, with at least a portion of Tracklines 10-31 falling within the range of 32° 20’N to 33°N
INDEPENDENT STUDY 11
In my Research I have the Tracklines listed as being the same for every year when the reports say that they changed in both location and in numerical value. This is due to the fact that: Tracklines are the same for: All years 2004-2011
- In the 2007-2008 report NOAA Changed the input method of the Latitude and Longitude Coordinates:
o From degrees and MINUTES to Decimal place. o For example: here are the data points for Trackline 1 in the 2006-
2007 season Latitude West- 31 34.8 Longitude West- -81 7.8 Latitude East- 31 34.8 Longitude East- -80 34.2
- Here are the data points for Trackline 1 in the 2007-2008 season- they
changed the input method but not the value Latitude West- 31.58 34.8/.6= 58 Longitude West- -81.13 7.8/.6= 13 Latitude East- 31.58 34.8/.6= 58 Longitude East -80.57 34.2/.6= 57
From 2007-2008 forward, the reports used a decimal system instead of the degrees and minutes, but the values remain the same. - Trackline location description changes from Sapelo Island, GA to St. Catherine’s Island GA from 2005-2006 to 2006-2007 even though the Latitude/ Longitude remains the same. A small inlet separates these locations and I am assuming that the study uses the center of the inlet as its last Trackline point, therefore the names are interchangeable. Assumptions made on Trackline miles flown between 32° 20’ N to 33°N. I Have found that Tracklines 10-31 (Counting the south Carolina surveys North to South) have at least some of the line within the boundary of 32° 20’ N to 33°N. For Northern surveys 2004-2006:
- The first nine (9) Tracklines are not within the ranges of 32° 20’ N to 33°N, therefore miles flown in that region will not be counted. Surveys were flown
INDEPENDENT STUDY 12
from north to south with the westernmost point of the northernmost Trackline being the starting point for each day’s flights.
METHODOLOGY FOR MEASURING DISTANCE FOR FLIGHTS FLOWN BETWEEN 32° 20’ N to 33°N. I devised my own methodology to determine just how many miles were flown in my area of interest (32° 20’ N to 33°N) on a daily basis. Each day’s flights covered one area- either the northern area, middle area, or the southern area. Both the northern and middle areas have part of their Tracklines between the latitudes 32° 20’ N to 33°N while the southern area does not. The northern area has approximately 179.5 out of 563.4 Trackline miles in my area of interest. The middle area has approximately 389.4 out of 565.2 Trackline miles in my area of interest. During the 2004-2005 and 2005-2006 seasons the flights started at the westernmost point of the northernmost Trackline for the specified area (North, Middle, or South). During the 2006-2007 season the protocol changed and the flights started at the westernmost point of the southernmost Trackline for the specified area. I calculated the Trackline miles flown for each year independently so it was easy to compensate for this change. In order to calculate how many miles were flown over 32° 20’ N to 33°N, I charted all of the Tracklines off of South Carolina in an Excel scatterplot. In doing this, I plotted both the easternmost and westernmost Latitude/Longitude points for every Trackline and then created a trend line for each set of coordinates. This drew a straight line between the two exact Latitude and Longitude points and created the exact Trackline that the airplane flies. After I had all 46 Tracklines plotted, I created straight lines at the latitudes of 32° 20’ N and 33°N to mark where my area of interest ended. Naturally my area of interest cut many of the Tracklines into fractions. So I then zoomed in and approximated what percentage of the Trackline fell into my area of interest. Once I had the Tracklines plotted and percentages assigned to each, I entered the information for the length of the Tracklines (taken off the Right Whale Annual Reports) into Excel and could then determine how many miles were flown in my area of interest in a particular flight.
INDEPENDENT STUDY 13
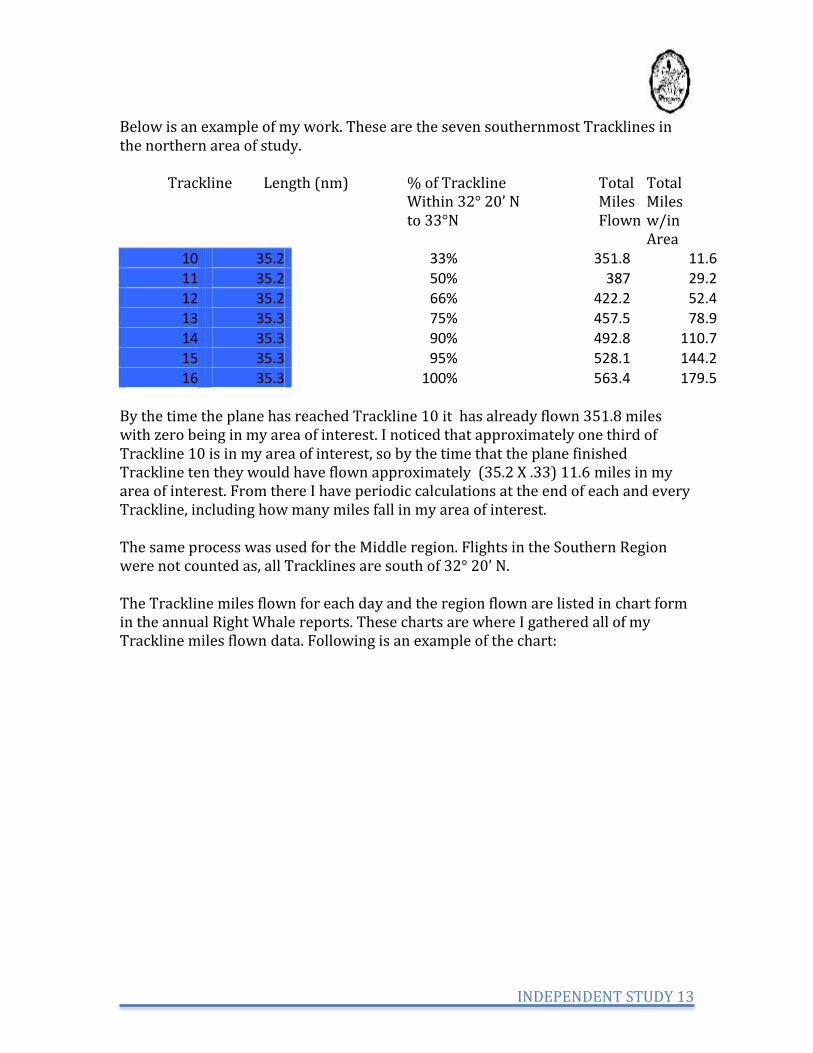
Below is an example of my work. These are the seven southernmost Tracklines in the northern area of study. Trackline Length (nm) % of Trackline Total Total Within 32° 20’ N Miles Miles
to 33°N Flown w/in Area
10 35.2
33%
351.8 11.6 11 35.2
50%
387 29.2
12 35.2
66%
422.2 52.4 13 35.3
75%
457.5 78.9
14 35.3
90%
492.8 110.7 15 35.3
95%
528.1 144.2
16 35.3
100%
563.4 179.5 By the time the plane has reached Trackline 10 it has already flown 351.8 miles with zero being in my area of interest. I noticed that approximately one third of Trackline 10 is in my area of interest, so by the time that the plane finished Trackline ten they would have flown approximately (35.2 X .33) 11.6 miles in my area of interest. From there I have periodic calculations at the end of each and every Trackline, including how many miles fall in my area of interest. The same process was used for the Middle region. Flights in the Southern Region were not counted as, all Tracklines are south of 32° 20’ N. The Trackline miles flown for each day and the region flown are listed in chart form in the annual Right Whale reports. These charts are where I gathered all of my Trackline miles flown data. Following is an example of the chart:
INDEPENDENT STUDY 14
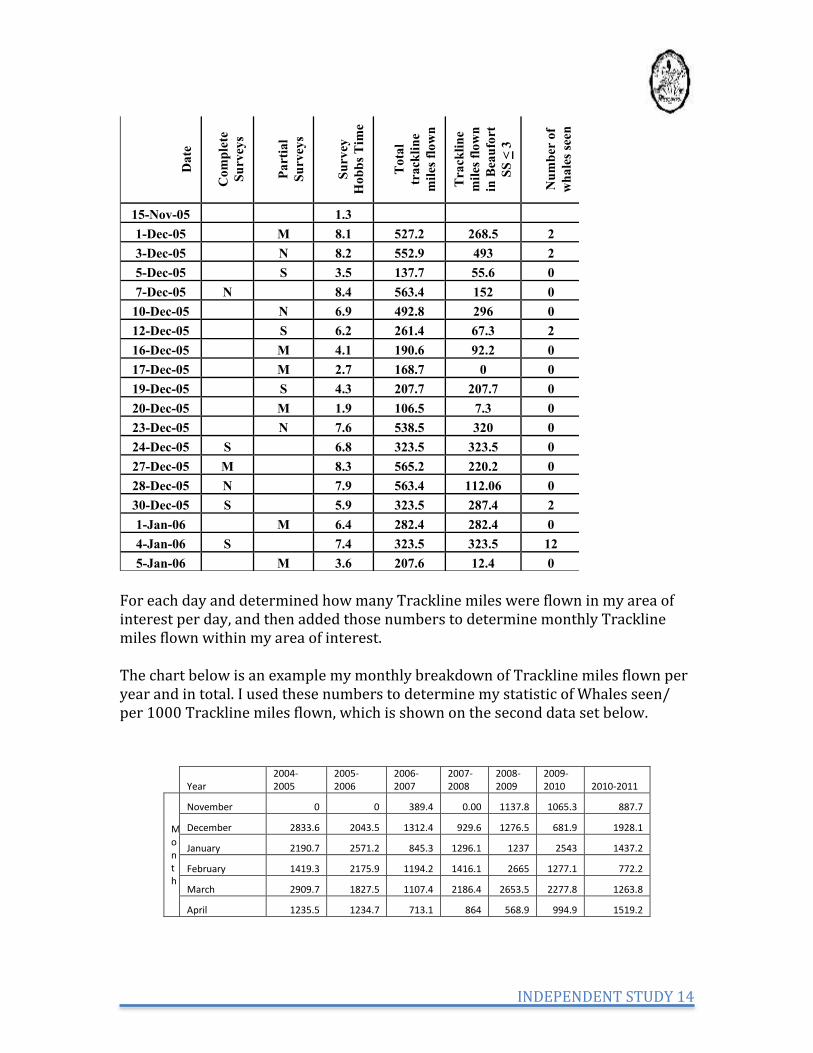
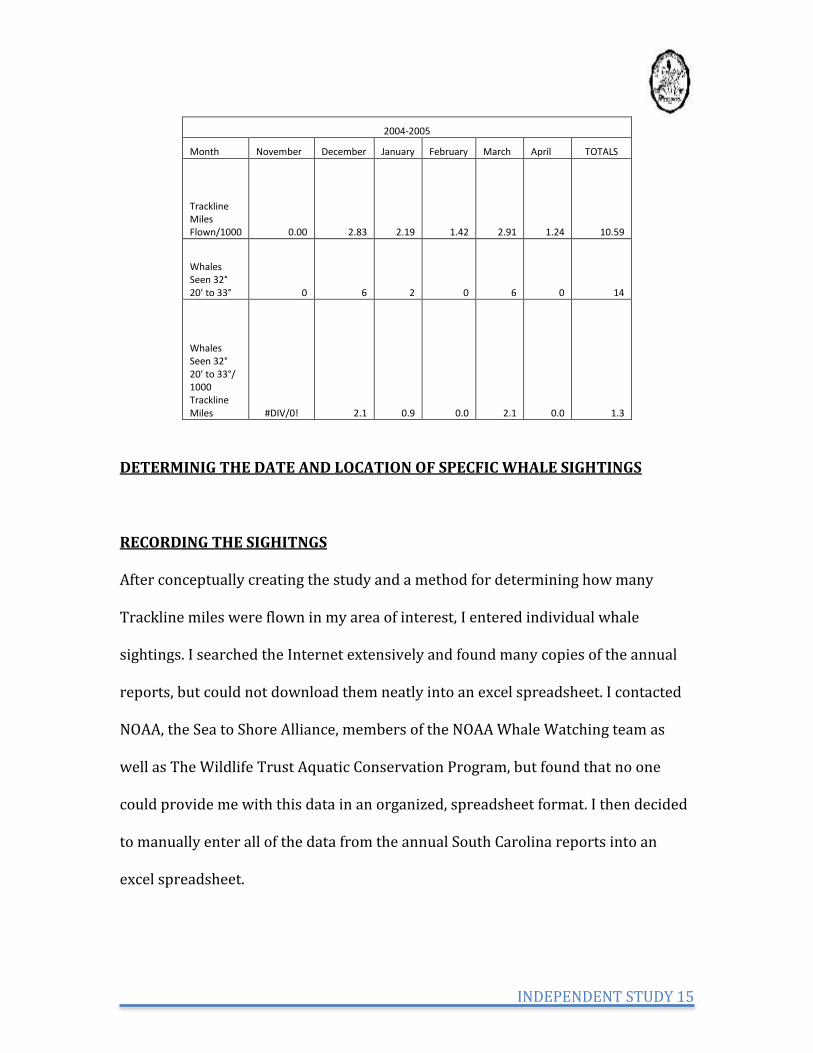
For each day and determined how many Trackline miles were flown in my area of interest per day, and then added those numbers to determine monthly Trackline miles flown within my area of interest. The chart below is an example my monthly breakdown of Trackline miles flown per year and in total. I used these numbers to determine my statistic of Whales seen/ per 1000 Trackline miles flown, which is shown on the second data set below.
9
photographs were received the afternoon of 10 January 2006. No flight was launched to relocate
the carcass due to the time elapsed since the initial sighting and inclement weather.
During a survey of the northern area conducted on 10 January 2006, the flight crew heard a
private sailboat reporting a whale carcass to Coast Guard Station Charleston on marine band
channel 16. The reported position was within the northern survey area. The team broke track,
relocated the carcass, which was a humpback whale, and documented it, then resumed the
survey. During the return transit home, the plane relocated the carcass to provide an updated
location to SCDNR and Wayne McFee of NOAA. On 11 January 2006, the flight crew flew a
dedicated search to relocate the carcass for a necropsy team from South Carolina Department of
Natural Resources. After it had been located, the team flew a complete survey. Approximately
1.2 flight hours were used for this dead whale during 10 January and 11 January 2006.
On 16 March 2006 a large whale carcass was reported by a merchant vessel. No conclusive
information was provided to determine the species. On 17 March 2006, the SCRW survey team
flew a dedicated search to relocate the carcass. The crew found and documented a dead
humpback roughly 1 nm NE of the reported position from the previous day. No survey was
flown due to high seas. 3.3 flight hours were used to locate the dead whale.
Table 2: Survey effort for the SCRW surveys conducted from 24 November 2005 - 15 April
2006. S = southern survey, N = northern survey, M = middle survey.
Da
te
Co
mp
lete
Su
rvey
s
Pa
rtia
l
Su
rvey
s
Su
rv
ey
Ho
bb
s T
ime
To
tal
tra
ckli
ne
mil
es f
low
n
Tra
ckli
ne
mil
es f
low
n
in B
eau
fort
SS
< 3
Nu
mb
er o
f
wh
ale
s se
en
Comments
15-Nov-05 1.3 test flight
1-Dec-05 M 8.1 527.2 268.5 2
3-Dec-05 N 8.2 552.9 493 2
5-Dec-05 S 3.5 137.7 55.6 0
7-Dec-05 N 8.4 563.4 152 0
10-Dec-05 N 6.9 492.8 296 0
12-Dec-05 S 6.2 261.4 67.3 2
16-Dec-05 M 4.1 190.6 92.2 0
17-Dec-05 M 2.7 168.7 0 0
19-Dec-05 S 4.3 207.7 207.7 0
20-Dec-05 M 1.9 106.5 7.3 0
23-Dec-05 N 7.6 538.5 320 0
24-Dec-05 S 6.8 323.5 323.5 0
27-Dec-05 M 8.3 565.2 220.2 0
28-Dec-05 N 7.9 563.4 112.06 0
30-Dec-05 S 5.9 323.5 287.4 2
1-Jan-06 M 6.4 282.4 282.4 0
4-Jan-06 S 7.4 323.5 323.5 12 11 individuals, 1 resight
5-Jan-06 M 3.6 207.6 12.4 0
Year
2004-2005
2005-2006
2006-2007
2007-2008
2008-2009
2009-2010 2010-2011
Month
November 0 0 389.4 0.00 1137.8 1065.3 887.7
December 2833.6 2043.5 1312.4 929.6 1276.5 681.9 1928.1
January 2190.7 2571.2 845.3 1296.1 1237 2543 1437.2
February 1419.3 2175.9 1194.2 1416.1 2665 1277.1 772.2
March 2909.7 1827.5 1107.4 2186.4 2653.5 2277.8 1263.8
April 1235.5 1234.7 713.1 864 568.9 994.9 1519.2
INDEPENDENT STUDY 15
2004-2005
Month November December January February March April TOTALS
Trackline Miles Flown/1000 0.00 2.83 2.19 1.42 2.91 1.24 10.59
Whales Seen 32° 20' to 33° 0 6 2 0 6 0 14
Whales Seen 32° 20' to 33°/ 1000 Trackline Miles #DIV/0! 2.1 0.9 0.0 2.1 0.0 1.3
DETERMINIG THE DATE AND LOCATION OF SPECFIC WHALE SIGHTINGS
RECORDING THE SIGHITNGS
After conceptually creating the study and a method for determining how many
Trackline miles were flown in my area of interest, I entered individual whale
sightings. I searched the Internet extensively and found many copies of the annual
reports, but could not download them neatly into an excel spreadsheet. I contacted
NOAA, the Sea to Shore Alliance, members of the NOAA Whale Watching team as
well as The Wildlife Trust Aquatic Conservation Program, but found that no one
could provide me with this data in an organized, spreadsheet format. I then decided
to manually enter all of the data from the annual South Carolina reports into an
excel spreadsheet.
INDEPENDENT STUDY 16
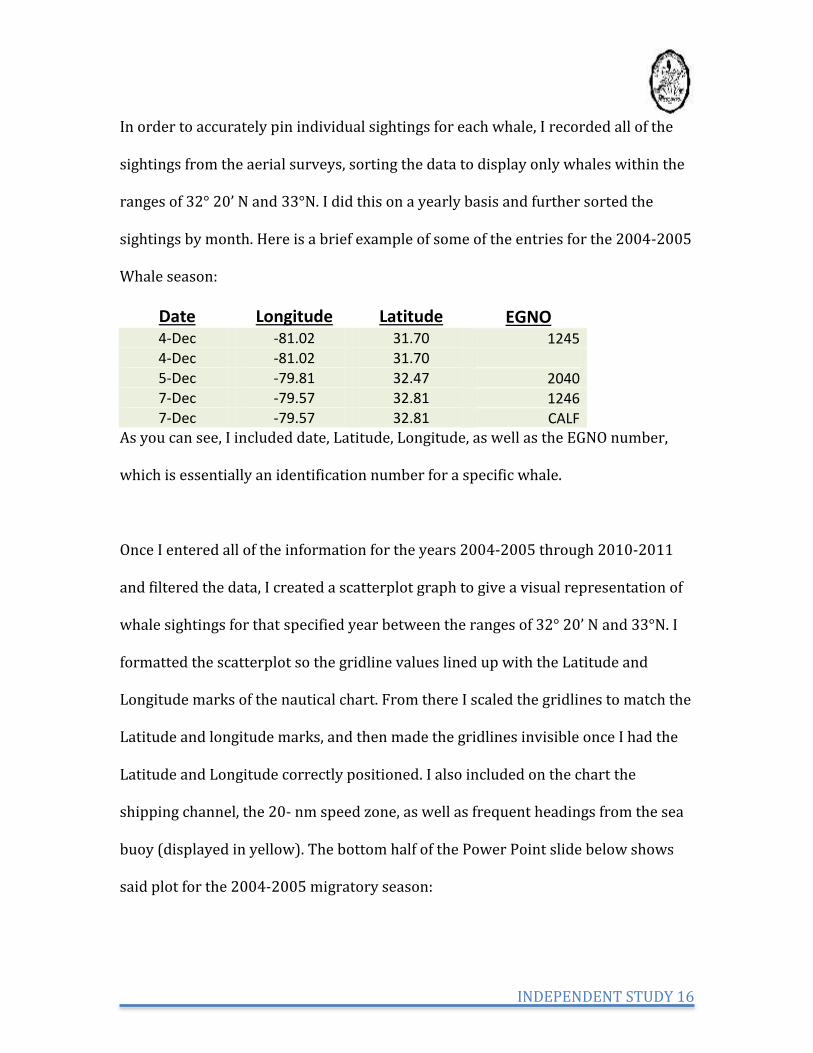
In order to accurately pin individual sightings for each whale, I recorded all of the
sightings from the aerial surveys, sorting the data to display only whales within the
ranges of 32° 20’ N and 33°N. I did this on a yearly basis and further sorted the
sightings by month. Here is a brief example of some of the entries for the 2004-2005
Whale season:
Date Longitude Latitude EGNO 4-Dec -81.02 31.70 1245 4-Dec -81.02 31.70 5-Dec -79.81 32.47 2040 7-Dec -79.57 32.81 1246 7-Dec -79.57 32.81 CALF
As you can see, I included date, Latitude, Longitude, as well as the EGNO number,
which is essentially an identification number for a specific whale.
Once I entered all of the information for the years 2004-2005 through 2010-2011
and filtered the data, I created a scatterplot graph to give a visual representation of
whale sightings for that specified year between the ranges of 32° 20’ N and 33°N. I
formatted the scatterplot so the gridline values lined up with the Latitude and
Longitude marks of the nautical chart. From there I scaled the gridlines to match the
Latitude and longitude marks, and then made the gridlines invisible once I had the
Latitude and Longitude correctly positioned. I also included on the chart the
shipping channel, the 20- nm speed zone, as well as frequent headings from the sea
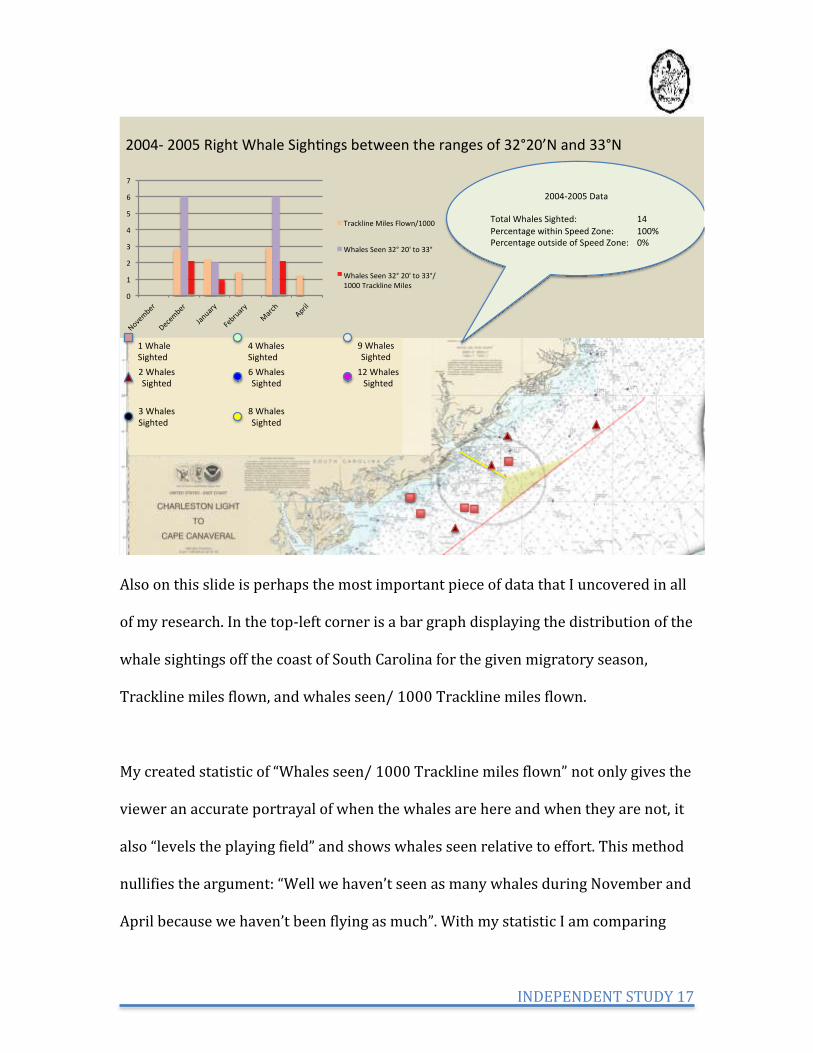
buoy (displayed in yellow). The bottom half of the Power Point slide below shows
said plot for the 2004-2005 migratory season:
INDEPENDENT STUDY 17
Also on this slide is perhaps the most important piece of data that I uncovered in all
of my research. In the top-left corner is a bar graph displaying the distribution of the
whale sightings off the coast of South Carolina for the given migratory season,
Trackline miles flown, and whales seen/ 1000 Trackline miles flown.
My created statistic of “Whales seen/ 1000 Trackline miles flown” not only gives the
viewer an accurate portrayal of when the whales are here and when they are not, it
also “levels the playing field” and shows whales seen relative to effort. This method
nullifies the argument: “Well we haven’t seen as many whales during November and
April because we haven’t been flying as much”. With my statistic I am comparing
2004-2005RightWhaleSigh ngsbetweentherangesof32°20’Nand33°N
12WhalesSighted
9WhalesSighted
8WhalesSighted
6WhalesSighted
4WhalesSighted
3WhalesSighted
2WhalesSighted
1WhaleSighted
2004-2005DataTotalWhalesSighted: 14
PercentagewithinSpeedZone: 100%PercentageoutsideofSpeedZone: 0%
0
1
2
3
4
5
6
7
November
December
January
February
March
April
TracklineMilesFlown/1000
WhalesSeen32°20'to33°
WhalesSeen32°20'to33°/1000TracklineMiles
INDEPENDENT STUDY 18
Whales seen per 1000 miles flown, and looking at the numbers it is clear that the
whales are not here in large numbers during the months of November and April.
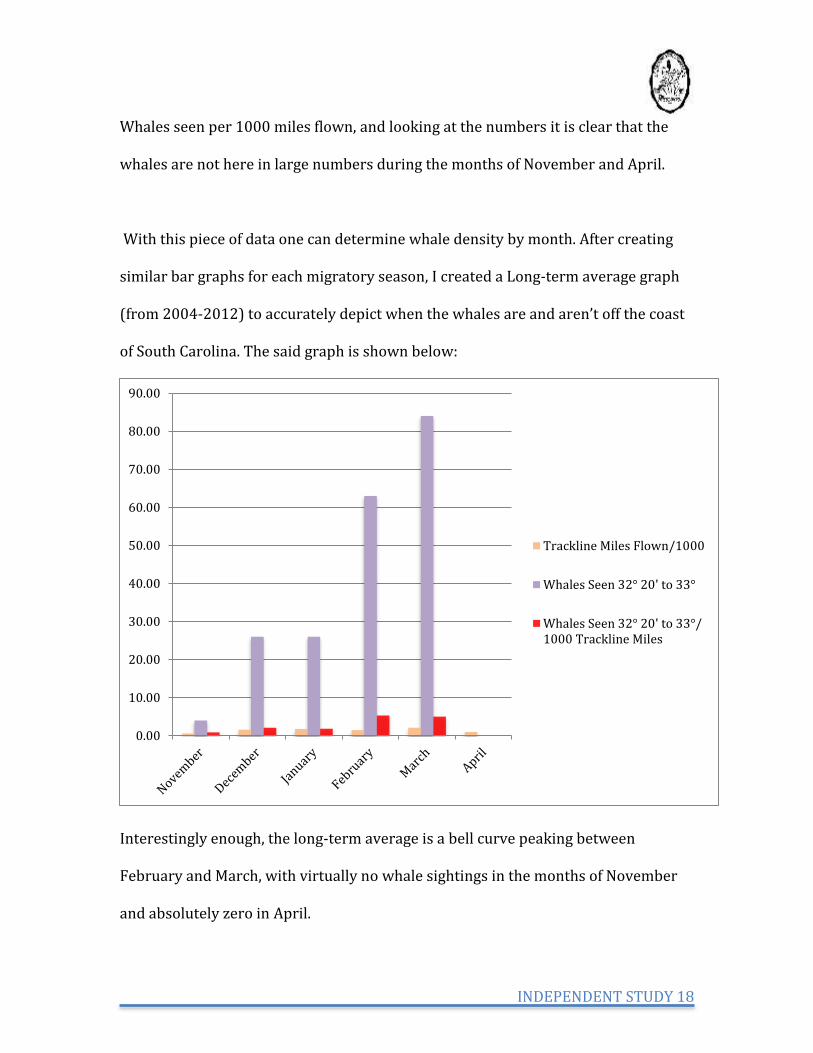
With this piece of data one can determine whale density by month. After creating
similar bar graphs for each migratory season, I created a Long-term average graph
(from 2004-2012) to accurately depict when the whales are and aren’t off the coast
of South Carolina. The said graph is shown below:
Interestingly enough, the long-term average is a bell curve peaking between
February and March, with virtually no whale sightings in the months of November
and absolutely zero in April.
0.00
10.00
20.00
30.00
40.00
50.00
60.00
70.00
80.00
90.00
Trackline Miles Flown/1000
Whales Seen 32° 20' to 33°
Whales Seen 32° 20' to 33°/1000 Trackline Miles
INDEPENDENT STUDY 19
FINDINGS IN THE RANGE OF 32° 20’ N to 33° N
My research clearly indicates that North Atlantic Right Whales are not numerous off
the coast of South Carolina during the regulated months of November and April,
making it un-necessary to regulate ship speed during these months.
Although I acknowledge that my research deals solely with numbers and other
people’s reports, I have speculated as to the reasons of the whales’ absence during
these periods. The North Atlantic Right Whales primarily inhabit the region in the
Northeast known as the gulf of Maine. Each year some of the whales migrate down
the coast to the calving grounds off of Florida. There they give birth and then return
north with their calf.
I believe that the Mid-Atlantic region of the East Coast is regulated too broadly.
From Block Island Sound to Brunswick, Georgia, the coast is subjected to the same
time frame for the speed regulations. In my opinion this is “painting with too wide of
a brush”. I believe that because South Carolina is at the southern end of the
migratory route, the whales arrive late and leave early, making it is unnecessary for
South Carolina to be regulated during the months of November and April.
CHARLESTON HARBOR’S TRACK RECORD WITH RIGHT WHALE STRIKES
INDEPENDENT STUDY 20
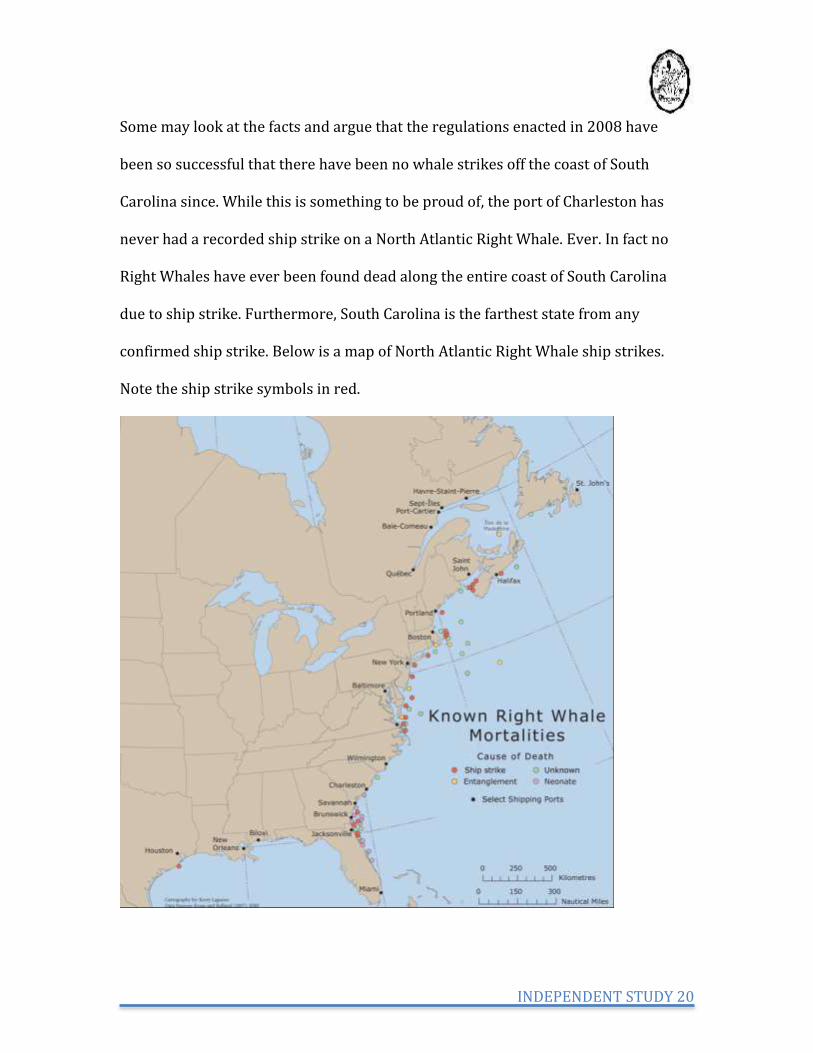
Some may look at the facts and argue that the regulations enacted in 2008 have
been so successful that there have been no whale strikes off the coast of South
Carolina since. While this is something to be proud of, the port of Charleston has
never had a recorded ship strike on a North Atlantic Right Whale. Ever. In fact no
Right Whales have ever been found dead along the entire coast of South Carolina
due to ship strike. Furthermore, South Carolina is the farthest state from any
confirmed ship strike. Below is a map of North Atlantic Right Whale ship strikes.
Note the ship strike symbols in red.
INDEPENDENT STUDY 21
UP NORTH
After examining the area around Charleston Harbor and finding some fairly
significant data I decided to point my research in a new direction- northward to the
ports of: Boston, Portland, Portsmouth, Eastport, Belfast, and Bar Harbor- all ports
that use the Gulf of Maine. As I previously mentioned, the main habitat for the North
Atlantic Right whale is the Gulf of Maine. While this region does have 10-knot speed
regulations like South Carolina, these regulations cover a minimal area rendering
many whales unprotected.
In researching the Gulf of Maine, I searched the Internet and found that I could in
fact download information for the whale sightings in the northeast. I downloaded
the sightings and began by sorting them by Latitude, taking only sightings that fell
between the Latitudes of 40°N and 46°N. Upon completion I plotted these sightings
on an excel scatterplot and once again overlaid them onto a nautical chart. I also
included the three different speed zones in that region to show how many whales
are protected and how many whales are unprotected. Using the SUMIF function for
the throughout the years 2006-2011, I found that in the gulf of Maine region there
are an average of 2126.7 whales seen annually with 38.52% of them sighted outside
of protected speed zones.
Furthermore, 34.97% (an average of 743.7 annually) of whales in the Gulf of Maine
region are seen with no regulations are in effect. This is a stark contrast to South
INDEPENDENT STUDY 22
Carolina where there have been 0 whales reported out of the regulated time period
within the last three years.
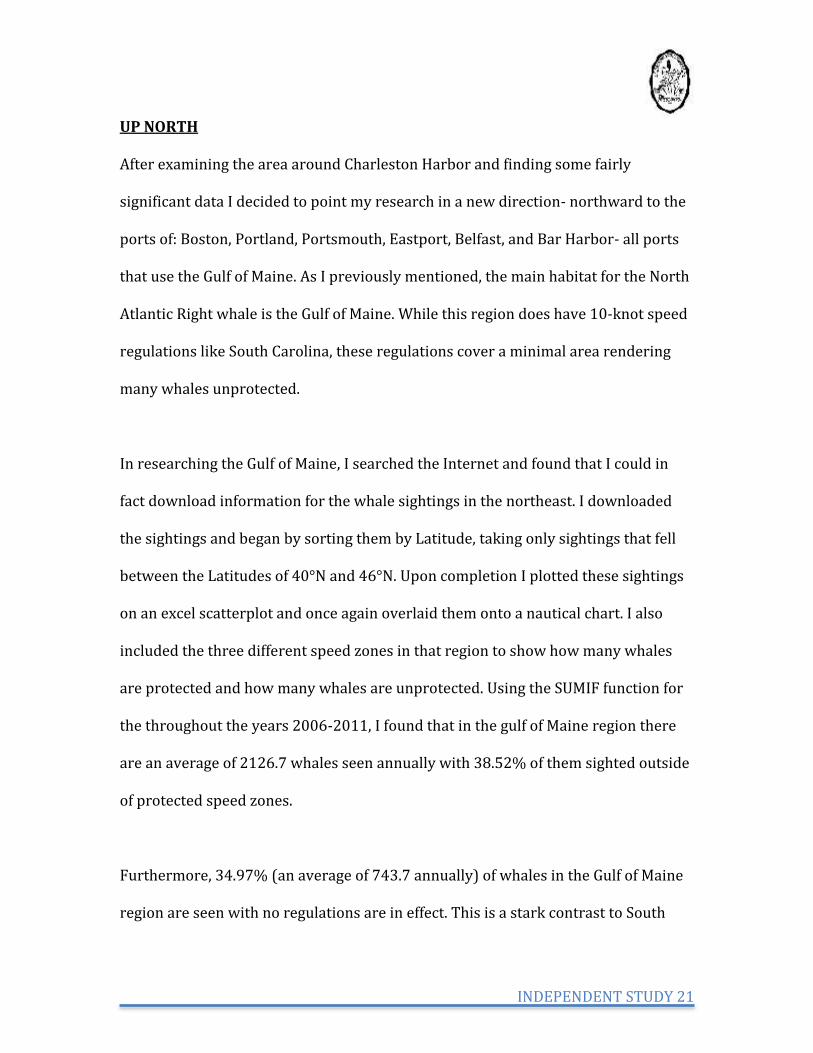
Below is a chart for 2010, a fairly average year for that region with a total of 1748
sightings with 38.16% of those sightings being outside of the protected speed zones.
Even at first glance it is apparent that there are substantially more whales in that
region than there are in South Carolina and that the percentage of unprotected
whales is also substantially more.
Jan1-May15Mar1-Apr30Apr1-Jul31
h p://www.charts.noaa.gov/OnLineViewer/13009.shtml
-71 -70 -69 -68 -67 -66 -65
2010North
eastSighngs
AllSigh
ngs:A
erial,O
pportu
nis
c,USCG,Sh
ipboard
,Whale
Watch
,Acousc,C
ommercial
INDEPENDENT STUDY 23
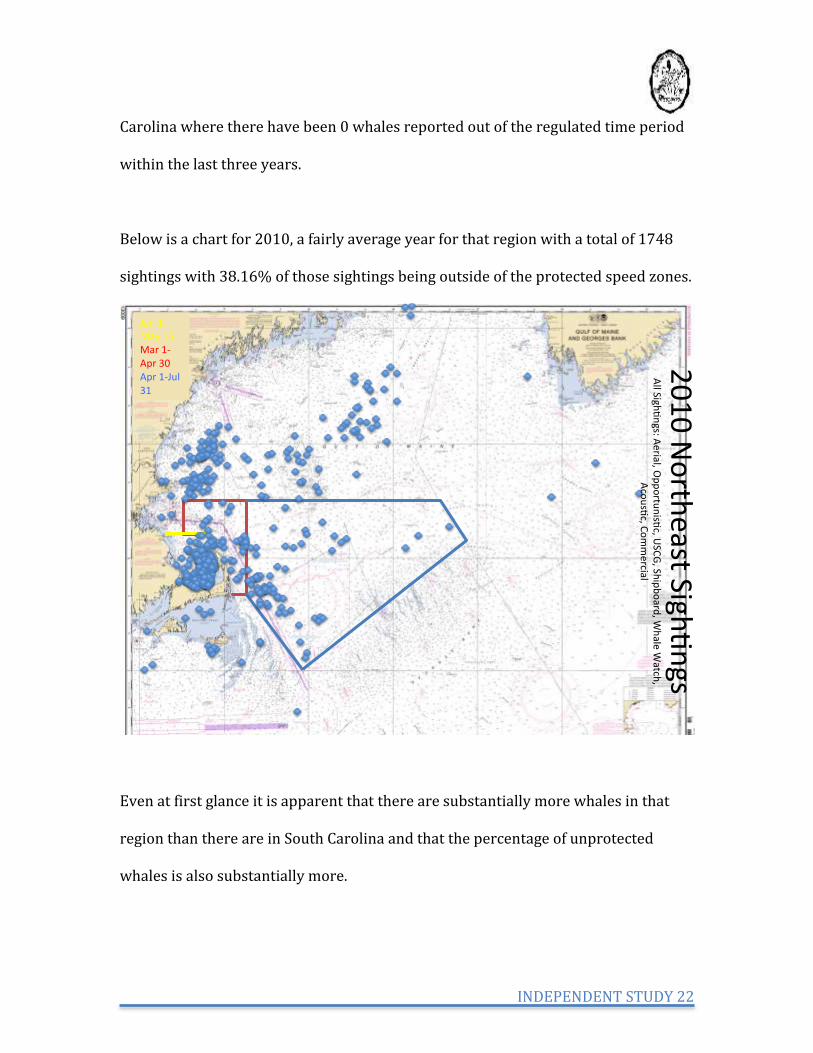
Upon plotting this data I then asked: well how many ships really skirt the speed
zones to the north rather than staying in the channel all the way out? After reading
up on this I found that most ships leaving the six ports for Canada, Europe, The
Mediterranean, Africa, and India skirt the speed zones and go as fast as they wish
through this whale-rich region. I created graphs for the two regions utilizing AIS
ship movements plots and my whale graph overlay for the year 2010 and they are
shown below. I ask that you take the time to notice the astounding difference in
vessel movement’s per whale seen as you analyze which region is creates a larger
risk for whales:
40
41
42
43
44
45
46
-71 -70 -69 -68 -67 -66 -65
-71.00 -70.50 -70.00 -69.50 -69.00 -68.50 -68.00 -67.50 -67.00Notethelargeamountofunregulatedshipac vityinthisarea.Inthisregionanaverageof1315.5shipsleavingthePortsofBoston,Portsmouth,andPortlandavoidregulatedareassoastosteamatfullcruisingspeed.Inthisarea38.5%oranaverageof819.7whalesareseenoutsideoftheregulatedareasannually.
2010(AIS)VesselTrafficwith2010Whalesigh ngsoverlayandspeedzoneboundaries
INDEPENDENT STUDY 24
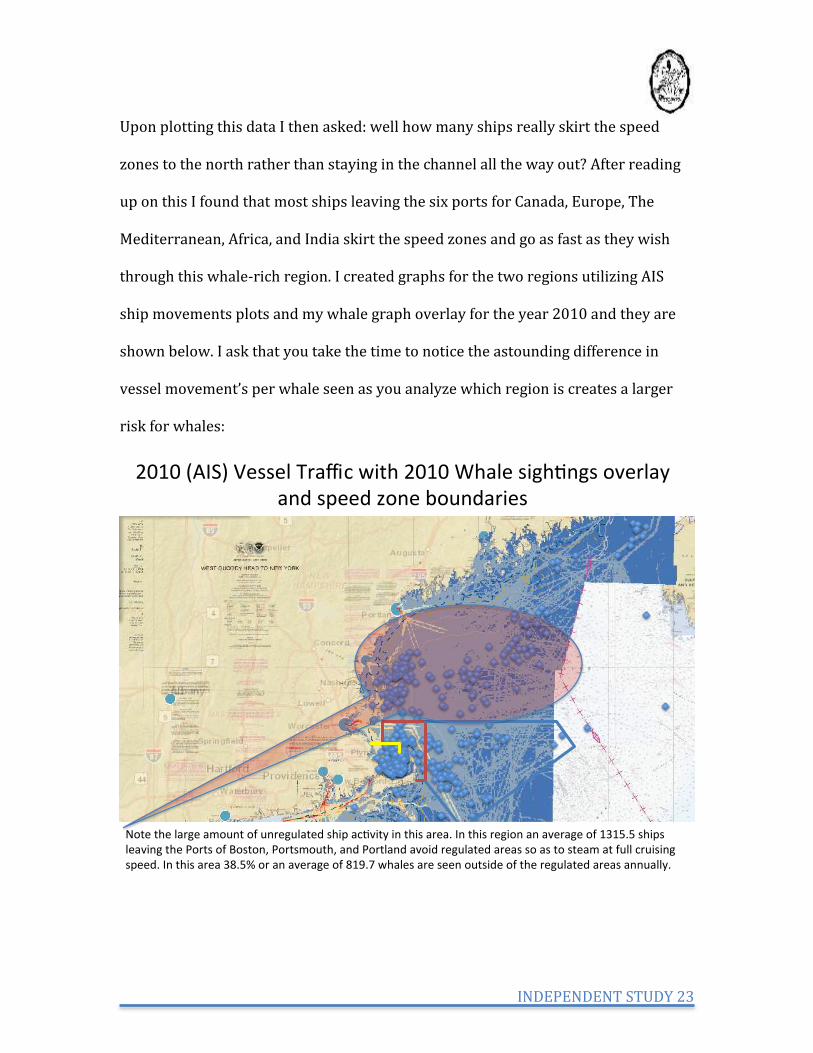
Note the large amount of ship activity just to the north of the speed zone. This is an
astounding number of ships that are traveling at full speed in an incredibly whale
rich environment. Also we must take note that over 34% of these whales are seen
when no regulations are in effect.
In South Carolina only 24% of whales are reported outside of the regulated speed
zones under current regulations with 0% of whales reported when the regulations
are not in effect. This means that in the 40-mile band off of Charleston that stretches
from 32° 20’ N to 33° N there is an average of 5.86 whales that are unregulated
annually. If the government is content with the figure 38.52% in the Gulf of Maine,
2010(AIS)VesselTrafficwith2010Whalesigh ngsoverlayandspeedzoneboundaries
Notethelargeamountofregulatedshipac vityinthisareawithveryli lewhaleac vity.Inthisregion100%ofshipsleavingCharlestonHarborareslowedto10knotsun ltheyreachthe20mileline.Inthe40nau calmilestretcharoundCharlestonanaverageof5.86whalesareseenoutsideoftheregulatedareasannually.
INDEPENDENT STUDY 25
then why would there be a problem dropping the months of November and April
from the regulations? This would raise Charleston’s total unprotected whale
percentage from 30% to 32%.
Over the past eight migratory seasons the data recorded by the aerial surveys shows
that out of the 203 whales seen from 32° 20’ N to 33° N only four were reported in
the months of November and April. Why, then could we not drop those two months
of the regulations and raise our unprotected whale rate by 2% to 32%? This would
aid in commerce while affecting a minute number of whales.
CONCLUSIONS/SOLUTIONS
After studying the of the annual North Atlantic Right Whale reports, I believe that
there is conclusive evidence to state that Right Whale density off the state of South
Carolina is quite small. Furthermore, South Carolina is at the tail end of their
migration south and at the forefront of their migration north. That being said, it is
unreasonable to regulate the entire east coast from Block Island Sound to
Brunswick, Georgia on the same time frame. Clearly there are not a significant
number of whales off the coast of South Carolina during the months of November
and April, therefore I feel that the East Coast regulations should be broken down
into smaller geographic areas.
INDEPENDENT STUDY 26
Upon studying this matter I have come up with two solutions to the current law in
South Carolina:
1. Implement mandatory Dynamic Management Areas
a. I have noticed that North Atlantic Right whales are use South
Carolina’s coast quite sporadically, and are by no means seen here
every day of the six month regulated period. I feel that there is no
need for ships to be slowed when no whales are off of our coast. This
being said, I feel that mandatory DMA would be a better alternative to
the current laws. I believe that the government should issue a
mandatory, two-week DMA for a twenty-mile radius around every
sighting off of South Carolina
i. This would protect the whales when they are here, while
allowing ships to travel efficiently when the whales are not
here.
2. My second alternative to the law would be to reduce the regulation period
from six to four months. My research clearly indicates that whale numbers
off the coast of South Carolina are negligible during the months of November
and April. I propose that NOAA reduces the “speed-zone” time to exclude the
months of November and April. Currently we are slowing down ships for a
negligible amount of whales.

INDEPENDENT STUDY 27

INDEPENDENT STUDY 28
References
1http://ecos.fws.gov/tess_public/pub/stateListingAndOccurrenceIndividual.jsp?state=SC&s8fid=112761032792&s8fid=112762573902 2 http://cfr.regstoday.com/50CFR224.aspx#50_CFR_224p105 3 http://www.nero.noaa.gov/shipstrike/doc/compliance_guide.pdf 4http://sero.nmfs.noaa.gov/pr/mm/rightwhales/SoutheastRegionsContractsAerialSurveyReports.htm