6. Gas Hydrates of the Blake Outer Ridge Site 533, Deep Sea ...

Geophysical evidence for gas hydrates in the deep water of the SouthCaspian Basin, Azerbaijan
C.C. Diaconescua,b,*, R.M. Kieckheferc, J.H. Knappa,d
aDepartment of Geological Sciences, Cornell University, Ithaca, NY 14853, USAbNational Institute for Earth Physics, P.O. Box MG-2, Bucharest, Magurele, RomaniacChevron Overseas Petroleum Inc., P.O. Box 6046, San Ramon, CA 94583-0746, USA
dDepartment of Geological Sciences, University of South Carolina, Columbia, SC 29208, USA
Received 15 May 2000; received in revised form 6 October 2000; accepted 13 October 2000
Abstract
New 2-D seismic re¯ection data from the South Caspian Sea, offshore Azerbaijan, document for the ®rst time in the deep water (up to
650 m) of this area, the presence of gas hydrates. Geophysical evidence for gas hydrates consists of a shallow (300±500 m below sea¯oor)
zone of pronounced high velocity (,2,100 m/s) as compared with the surrounding sediments (1550±1600 m/s). This zone appears on the
seismic data as a depth-limited (,200 m thick) layer extending down the ¯ank of an elongate structural high, and displays seismic blanking
effects on the sedimentary section. A strong positive-polarity �Rc < 0:123� re¯ector marks the top of this velocity anomaly, and is interpreted
as the top of the gas hydrate layer. Similarly, a high-amplitude �Rc < 0:11�; negative polarity re¯ector coincides with the base of the high-
velocity layer, and is interpreted as the base of the hydrate zone. Both the top and bottom of the hydrate layer approximately parallel the
sea¯oor bathymetry, and cut discordantly across the stratigraphic section, suggesting that the two re¯ectors are thermobaric and not
stratigraphic interfaces. Decreasing amplitude with offset at the base of the gas hydrate layer may indicate the accumulation of free gas
beneath this interface. These gas hydrates fall within the hydrate stability ®eld predicted from thermobaric modeling for the South Caspian
Basin, but typically in thinner layers than would be expected from theoretical calculations. The minimum predicted water depth that allows
hydrate formation is ,150 m, and the maximum predicted thickness of the gas hydrate stability ®eld is ,1350 m. q 2001 Elsevier Science
Ltd. All rights reserved.
Keywords: Gas hydrates; Caspian Sea; Bottom-simulating re¯ector
1. Introduction
Ever since the discovery of the Messoyakha gas ®eld in
West Siberia (Sapir et al., 1973) gas hydrates have attracted
the considerable attention of the scienti®c community. Also
known as methane clathrates or clathrate hydrates of natural
gas, these substances are similar to ice, but are composed of
rigid cages of water molecules that entrap molecules of
hydrocarbon gas (Kvenvolden, 1993; Sloan, 1990, 1998).
Three principal aspects of gas hydrates interest the geologic
community: (1) the potential drilling hazards they pose; (2)
their fuel resource potential; and (3) their possible role in
global climate change (Kvenvolden, 1993, 1995). Recent
estimations indicate that the largest accumulations of
natural gas on Earth are in the form of gas hydrates (Collett,
1994) that occur mainly offshore in deep-water marine sedi-
ments, or in association with permafrost in polar zones
(Kvenvolden, 1993). Gas hydrates occur under speci®c
conditions of pressure and temperature, where the supply
of methane is suf®cient to stabilize the hydrate structure.
Since these hydrates form in relatively low temperature
environments, the geothermal gradient limits hydrate occur-
rence to shallow (,1000 m) regions of the sedimentary
section. Furthermore, composition of the hydrocarbon
gases and pore-water salinity are also important controlling
factors in the gas hydrate stability zone (Sloan, 1990, 1998).
Gas hydrates are best known from geophysical (seismic
re¯ection pro®ling) and geochemical (Deep Sea Drilling
Project) studies (e.g. Collett, 1994; Hyndman & Spence;
1992; Kvenvolden, 1995; Shipley et al., 1979; Lee et al.,
1994; Xu & Ruppel, 1999). The typical seismic signature of
gas hydrate is a high-amplitude re¯ector that approximately
parallels the sea¯oor and deepens with increasing water
depth, giving rise to a bottom-simulating re¯ector (BSR)
Marine and Petroleum Geology 18 (2001) 209±221
0264-8172/01/$ - see front matter q 2001 Elsevier Science Ltd. All rights reserved.
PII: S0264-8172(00)00061-1
www.elsevier.com/locate/marpetgeo
* Corresponding author. Department of Geological Sciences, Earth and
Water Science Building, University of South Carolina, 700 Sumter Street,
Columbia, SC 29208, USA. Tel.: 11-803-777-3272; fax: 11-803-777-
6082.
E-mail address: [email protected] (C.C. Diaconescu).

(Hyndman & Spence, 1992; Shipley et al., 1979; Sloan,
1990). A BSR originates in marine or permafrost environ-
ments from the development of a consolidated or ªfrozenº
layer (the gas hydrated sediments) above a zone of uncon-
solidated sediments, frequently containing free gas
(Andreassen, Hart, & MacKay, 1997). High compressional
wave velocity (2000±2,500 m/s) in the gas hydrate sedi-
ments in comparison with the underlying section results in
a negative polarity for the BSR. In addition, the hydrated
layer usually displays ªblankingº effects of the sedimentary
section, i.e. reduced acoustic impedance contrasts caused by
the cementation of the host sediments by the gas hydrate
molecules (e.g. Hyndman & Spence, 1992).
Because the hydrate BSR follows thermobaric rather than
lithologic interfaces, it is usually observed to crosscut other
re¯ectors (stratigraphic layers) on continental slopes (Sloan,
1990, 1998). Previous studies (e.g. Kvenvolden, Barnard,
Brooks, & Wiesenburg, 1981; Kvenvolden, 1993, 1995)
suggested that the presence and location of BSRs are
spatially controlled by the intersection of the geothermal
gradient with the stability curve for gas hydrates coincident
with the BSR. However, recent studies (e.g. Xu & Ruppel,
1999) suggest that the base of gas hydrate occurrences in
marine sediments does not always coincide with the base of
the hydrate stability zone. Similarly, although the top of the
gas hydrate zone in marine sediments usually coincides
with the sea¯oor (e.g. Kvenvolden, 1993), Xu and Ruppel
(1999) argued that this need not always be the case from a
theoretical standpoint.
The Caspian Sea basins of Central Eurasia constitute one
of the major petroleum provinces of the world (Fig. 1),
attracting substantial investment by the international petro-
leum industry since the break-up of the Soviet Union. As
petroleum exploration in the Caspian Sea has recently
moved to deeper water, concern over the potential hazard
posed by gas hydrates has become an important issue. Chev-
ron was among the ®rst companies to establish an explora-
tion lease block in the deep water of the South Caspian Sea.
The Absheron block, named after the nearby Absheron
Peninsula in Azerbaijan, is situated in water depths ranging
from ,150 to 715 m (Fig. 1). The principal motivation for
studying gas hydrates in the South Caspian Sea is driven by
concern over potential geo-hazards during drilling, such as:
(1) uncontrolled release of gas trapped beneath the hydrate
seal; (2) dissociation of gas hydrates due to warming by
drilling ¯uids, which could occur slowly or explosively;
and (3) slope instability since the gas hydrates can affect
the strength of the sediments in which they reside, a process
also likely to play a signi®cant role in sediment transport
(McIver, 1982).
The South Caspian Sea meets the conditions required for
gas hydrate stability, including: (1) supply of natural gas; (2)
low geothermal gradient; and (3) low sea¯oor temperature.
Gas hydrates were previously identi®ed in the South
Caspian Sea, but only in shallow water, and in association
with mud volcanoes (Ginsburg et al., 1992; Ginsburg &
Soloviev, 1994; Yefremova & Zhizhcenko, 1974). In this
paper, we present results from a regional 2D seismic re¯ec-
tion pro®le, collected across the Absheron block as part of
Chevron's exploration program, that indicates the presence
of gas hydrates in the deep water (,700 m) portion of the
basin. Our results draw on the seismic characteristics of gas
hydrates, and represent one of the ®rst examples of buried
gas hydrates in marine sediments. Comparison of the inter-
preted gas hydrate occurrence on the seismic data with the
gas hydrate stability ®eld estimated from thermobaric
modeling of a gas composition speci®c to the study area,
indicates a much thinner depth range than would be
predicted from modeling.
2. Geologic setting of the South Caspian Sea
The South Caspian Sea (Fig. 1) is considered to be a
remnant back-arc basin of the Tethys Sea that evolved adja-
cent to the rapidly uplifting Greater Caucasus Mountains
since the Paleogene (Zonenshain & Le Pichon, 1986;
Zonenshain, Kuzmin, Natapov, & Page, 1990). Several kilo-
meters of Plio-Pleistocene clastic sediments that originated
in the Kura and Volga rivers overlay the Mesozoic and
Paleogene sections. An important part of these sediments
derived from the eroding Lesser and Greater Caucasus
Mountains, which formed as the Arabian Plate collided
with Eurasia, ®rst closing Tethys, and later, the back-arc
basin. A major compressional system with associated
strike±slip structures formed in the process of the South
Caspian Sea closure (Zonenshain & Le Pichon, 1986;
Zonenshain et al., 1990).
The general physiography of the Caspian Sea region can
be roughly divided into three areas. The northern one-third
of the Caspian Sea, north of the Greater Caucasus, rests
upon older Paleozoic platforms of the Eurasian craton
with a thick post-Paleozoic sedimentary cover (Zonenshain
et al., 1990). South of this area, the water depths increase
sharply from 50 to over 700 m. The Absheron Ridge is a
narrow neck of relatively shallow water (50±300 m) that
extends between Baku (Azerbaijan) and Turkmenbashi
(Turkmenistan) to form a bridge between the Great Cauca-
sus compressional orogen and the Kopeh±Dagh strike±slip
fold belt system (Priestley, Baker, & Jackson, 1994). South
of the ridge the water deepens quickly to reach about
1000 m over the South Caspian basin, where our study
area is located (Fig. 1).
The presence of numerous gas-driven mud volcanoes and
active oil and gas seeps suggest that hydrocarbons are form-
ing and migrating within the basin today (Bagirov & Lerche,
1997; Ginsburg et al., 1992; Ginsburg & Soloviev, 1994).
Furthermore, active seismicity in the region (Priestley et al.,
1994) attests that structures and associated hydrocarbon
traps in the shallow section are forming now. In the Caspian
Sea, mud volcanoes are a signi®cant source of methane and
other hydrocarbon gases. This factor, in connection with the
C.C. Diaconescu et al. / Marine and Petroleum Geology 18 (2001) 209±221210
low thermal conductivity of the zones of mixed mud, water,
and gas, make the diapirs cool, creating conditions favorable
for hydrate occurrence in this area.
Rapid subsidence and high sedimentation rates in the
South Caspian Sea (.2.0 km/Ma) have led to low heat
¯ow in the basin. Sea¯oor temperatures of 5.8±6.28C, and
geothermal gradients of 11±178C/km were reported by
several authors for the South Caspian Sea (Ginsburg et al.,
1992; Schoellkopf, & Dahl, 1995; Tagiyev, Nadirov,
Bagirov, & Lerche, 1997). An environmental study
C.C. Diaconescu et al. / Marine and Petroleum Geology 18 (2001) 209±221 211
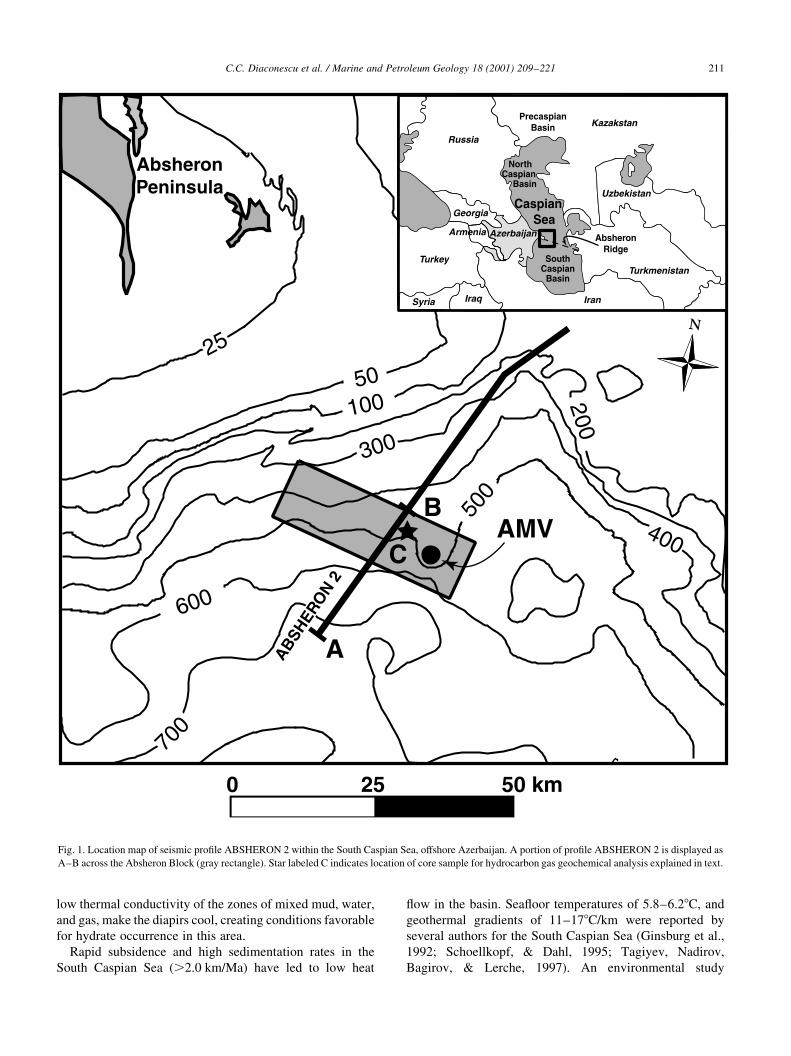
Fig. 1. Location map of seismic pro®le ABSHERON 2 within the South Caspian Sea, offshore Azerbaijan. A portion of pro®le ABSHERON 2 is displayed as
A±B across the Absheron Block (gray rectangle). Star labeled C indicates location of core sample for hydrocarbon gas geochemical analysis explained in text.
ABSH
ERO
N2
A
B
C
AbsheronPeninsula
50
100
600
500
200
25
300
400
700
0 25 50 km
AMV
AbsheronRidge
PrecaspianBasin
CaspianSea
Azerbaijan
Uzbekistan
Turkmenistan
Kazakstan
Russia
Georgia
Turkey
IranIraqSyria
Armenia
NorthCaspian
Basin
SouthCaspian
Basin

performed within the study area (location C in Fig. 1;
Moukhtarov, 1998) found gases of a mixed bacterial-
thermogenic origin in core samples from three different
locations. The low temperatures, abundance of hydrocarbon
gases and deep water (,1100 m) enhances the probability
of gas hydrate formation.
3. Geophysical evidence of Absheron gas hydrates
Previous studies of gas hydrates (Andreassen et al., 1997;
Dillon, Lee, & Coleman, 1994; Hyndman & Spence, 1992;
Lee et al., 1994; Malone, 1994; Shipley et al., 1979) have
documented the signi®cantly distinctive seismic properties
they exhibit in relation to surrounding sediments. Among
these are: (1) reversed (negative) polarity of the BSR rela-
tive to the sea¯oor re¯ection, caused by the acoustic impe-
dance contrast between (2) the higher compressional (P-)
wave velocity of the hydrate layer with underlying lower P-
wave sedimentary layers, (3) `blanking' effects caused by
reduced acoustic impedances within the gas hydrate cemen-
ted sediments, (4) distinctive AVO effects at the BSR, if the
gas hydrate layer overlays gas sands, and (5) crosscutting
relationship of the BSR with the stratigraphic section on the
continental slope. In the following, the seismic characteris-
tics of the Absheron hydrated sediments are examined with
respect to re¯ection character, re¯ection amplitude, and
rock physics.
3.1. Seismic data acquisition and processing
The ABSHERON 2 pro®le (Fig. 1), collected in the deep
water of the South Caspian Sea, is ,70 km long and was
one of the ®rst deep (20 s) re¯ection pro®les acquired in the
Caspian region. Only the ®rst 2000 ms of the southern half
(,30 km) of the line (A±B in Fig. 1) were selected for
hydrate-related processing. Sea¯oor depth along this portion
of the pro®le varies between 450 and 715 m (Fig. 1).
The seismic processing ¯ow for line ABSHERON 2 is
shown in Table 1. An off-end spread with 204 receivers at
25 m spacing was used in acquisition. Shot spacing was
50 m, and the offset range was 231±5306 m. In order to
optimize the appearance of the hydrate-related seismic char-
acteristics, a true amplitude analysis, with wavelet decon-
volution, was performed. Preservation of the true re¯ection
amplitudes was also required for amplitude variation with
offset (AVO) analysis as well as for possible indication of
hydrate-related re¯ection ªblankingº effects. Accordingly,
no time dependent amplitude scaling was applied to the
data.
3.2. Re¯ection character
The multichannel seismic re¯ection pro®le ABSHERON
2, shown in Fig. 2, displays clear evidence for the presence
of gas hydrates, including the existence of a BSR. The
migrated and depth converted seismic section is shown in
Fig. 2a, whereas the velocity ®eld superimposed over the
migrated time section is shown in Fig. 2b. These seismic
velocities were derived from stacking velocities that were
picked on the CMP (common mid point) gathers using Dix's
(1955) equations. In this paper, for the purpose of re¯ection
character analysis, we refer to the maximum excursion of
the seismic wavelet to the right as a peak, or positive polar-
ity (a re¯ection at an interface resulting from a low-
impedance layer above a high-impedance layer), and the
maximum excursion of the seismic wavelet to the left, as
a trough, or negative polarity (a re¯ection at an interface
resulting from a high-impedance layer above a low-
impedance layer).
The seismic sections in Fig. 2 display a strong, positive
polarity re¯ection from the sea¯oor at 600 ms (450 m below
sea level, or mbsl, at B) to 1000 ms (715 mbsl at A) (see
Fig. 1 for location). Two of the more prominent re¯ectors
observed on these seismic sections can be traced for
,12 km and are labeled Base Absheron Hydrate (BAH)
and Top Absheron Hydrate (TAH). BAH is a continuous,
high amplitude, negative polarity re¯ector at ,1150 mbsl
(,1500 ms) approximately 8 km from A in Fig. 1, and shal-
lowing to ,900 mbsl (,1200 ms) above the Absheron
structural high, situated approximately 20 km from A.
TAH is a strong positive polarity re¯ector (with the same
polarity as the sea¯oor), and approximately parallels BAH
,150±200 m shallower in the section. Both of these re¯ec-
tors approximately parallel the sea¯oor, shallow within the
sedimentary section with decreasing water depth, and termi-
nate laterally with no obvious structural control. Thus, BAH
displays the seismic characteristic of a gas hydrate BSR. It is
important to mention here that neither BAH nor TAH can be
interpreted as primary multiples of the sea¯oor since they
occur at much shorter traveltimes than double the sea¯oor
traveltime.
3.3. Seismic velocity
Seismic velocity is one of the most important diagnostic
C.C. Diaconescu et al. / Marine and Petroleum Geology 18 (2001) 209±221212
Table 1
Processing ¯ow
Demultiplexing
Geometry
Spherical divergence correction (with stacking velocities)
Surface consistent deconvolution (128 ms operator length)
Bandpass ®lter (Ormsby: 4-8-50-60 Hz)
F-X deconvolution (Wiener Levinson)
Velocity analysis
Normal moveout correction
Surface consistent amplitude scaling
Amplitude calibration to Shah Deniz 6 well
Top mute
CMP median stack
Conversion from minimum- to zero-phase wavelet
Migration (With interval velocities derived from stacking velocities)
Time to depth conversion using smoothed interval velocities

C.C
.D
iaco
nescu
eta
l./
Marin
eand
Petro
leum
Geo
logy
18
(2001)
209
±221
213
Fig. 2. Composite display showing: (a) Migrated CMP stack of a portion of line ABSHERON 2 (A±B in Fig. 1). The inferred top (TAH) and base (BAH) of the Absheron hydrate bound an ,200 m thick depth-
restricted hydrate layer situated ,300 mbsf. Positive polarity (peak) re¯ections are shown in black (e.g. sea¯oor and TAH); negative polarity (trough) re¯ections are shown in white (e.g. BAH); (b) Interval
velocity ®eld overlaying the migrated time section of line ABSHERON 2. SF stands for shallow faulting (see text for details). Both seismic sections are vertically exaggerated approximately 8:1.

features of hydrated sediments that distinguishes them from
water-®lled sediments. The P-wave velocities (Vp) of
hydrated sediments typically vary between 2000 and
4000 m/s with the corresponding shear (S-) wave velocity
(Vs) varying between 1400 and 1500 m/s (Anderson, 1992;
Dillon et al., 1994). These velocity ranges are both
considerably higher than seismic velocities of shallow
water saturated sediments.
Since the stratigraphy and structure of the upper 2000 ms
in the study area is fairly simple, a conventional NMO
(normal move-out) stacking velocity analysis was used to
obtain reliable root-mean square (RMS) velocities. Using
Dix's equation (Dix, 1955), the RMS velocities were
converted into an interval velocity model, displayed in
color in Fig. 2b. It was more suitable for this analysis to
display interval velocities in time rather than interval velo-
cities in depth, since the velocity analysis was performed in
time, and the depth-converted section shown in Fig. 2b was
generated from smoothing the velocities laterally. Both
BAH and TAH coincide with the bottom and the top,
respectively, of a shallow, high velocity anomaly
(,2100 m/s) shown in yellow. These velocities are compar-
able with values reported in the literature for hydrated sedi-
ments in other areas (e.g. Andreassen et al., 1997; Singh,
Minshull, & Spence, 1993). The surrounding sediments
display signi®cantly lower velocities of 1550±1600 m/s,
representative for water-®lled sediments. Direct measure-
ments of S-wave velocities were not available for our
study area, but some rough estimates were made from
AVO modeling at BAH, which will be presented in one of
the following sections.
3.4. Seismic ªBlankingº effect
Gas hydrate layers commonly display seismic blanking
effects, i.e. reduced acoustic impedance contrasts within the
hydrated sediments, presumably due to the cementation of
the stratal interfaces by the gas hydrate molecules (Hynd-
man & Spence, 1992; Shipley et al., 1979). Thus, a reduc-
tion of the seismic amplitudes should be expected within the
gas hydrate layer, and is often used as a diagnostic feature.
The blanking effect is proportional to the amount of gas
hydrate that ®lls the host sediments, with more hydrates
resulting in a greater reduction in acoustic impedance (e.g.
Collet, 1994). Blanking occurs within the zone of gas
hydrate occurrence, and there are occasions when it can
be observed even when no BSR is present (Sloan, 1990).
As seen in Fig. 2a, a clear amplitude re¯ection blanking
zone on line ABSHERON 2 coincides with the shallow
high velocity layer, and occurs between BAH and TAH.
This zone with reduced amplitudes relative to the surround-
ing sediments coincides with the shallow high-velocity
anomaly zone visible in Fig. 2b.
3.5. Polarity
The boundary between the sediments containing gas
hydrates and the underlying unhydrated strata is often
very sharp, and characterized on seismic data by a well-
developed high-amplitude, negative polarity re¯ector
(Andreassen et al., 1997; Hyndman & Spence, 1992). The
degree to which this high-amplitude re¯ector, or BSR, is
dependent on the presence of free gas beneath the BSR is
still controversial. Kvenvolden (1993) developed two differ-
ent models, in which the potential accumulation of free gas
is controlled by the mechanism of hydrate formation.
Regardless of the presence or absence of gas sands beneath
the hydrated sediments, the transition from a high velocity
hydrated layer to a lower velocity unhydrated layer under-
neath causes a polarity reversal at the base of the gas hydrate
layer (Dillon et al., 1994; Hyndman & Spence, 1992;
Malone, 1994). Since the polarity of the BSR is an important
factor in the detection of gas hydrates on seismic data, a
detailed wavelet analysis of the BAH re¯ector was
performed.
Line ABSHERON 2 displays the sea¯oor and TAH
re¯ectors as positive polarity events (peak in black), and
the BAH re¯ector as a negative polarity event (trough in
white), as shown in Fig. 2. The onset trough waveform for
BAH indicates that this re¯ection results from a boundary of
a high impedance layer above a low impedance layer. The
CMP gather displayed in Fig. 3a (at ,13 km from A) shows
very clearly the positive polarity re¯ection from the sea¯oor
at ,870 ms, the positive polarity re¯ection from TAH at
,1290 ms, and the negative polarity re¯ection from BAH at
,1430 ms. In order to compare the re¯ection polarity of the
sea¯oor with that of the BAH (the inferred hydrate BSR),
the seismic wavelet information was extracted from both
these re¯ectors (Fig. 3b,c). The basic wavelet extracted
from the sea¯oor is shown in Fig. 3b, and the wavelet
extracted from BAH, and rotated with 1608 to match the
sea¯oor wavelet, is displayed in Fig. 3c. The BAH re¯ection
has a dominant frequency of 26 Hz with a bandwidth of 10±
12 Hz. Cross-correlation of these two basic wavelets shows
that the phase difference between them is 1608, which indi-
cates that the sea¯oor and BAH re¯ections have approxi-
mately opposite polarities.
3.6. AVO analysis
Analysis of amplitude variation with offset, or AVO
analysis, is based on variation of the P-wave re¯ection coef-
®cient with the angle of incidence at an interface separating
two media (Castagna, Swan, & Hoster, 1998). Such analysis
has traditionally been used as diagnosis for the presence of
gas sands beneath shales on the basis of increasing ampli-
tude with large offsets. More recently, Castagna et al. (1998)
have shown that AVO gas sands can exhibit either an
increasing or decreasing response depending on the proper-
ties of both the gas sand and the overlying uncharged
stratum. Thus, in order to convey additional information
regarding lithology and ¯uid-type variations, these authors
developed AVO crossplots as an alternative to the classic
C.C. Diaconescu et al. / Marine and Petroleum Geology 18 (2001) 209±221214

amplitude versus offset (or angle of incidence) plots
(Castagna & Swan, 1997; Castagna et al., 1998; Foster,
Keys, & Reilly, 1997; Simm et al., 2000).
In most studies of gas hydrates (e.g. Andreassen et al.,
1997; Bangs, Dale, & Golovchenko, 1993; Ecker, Dvorkin,
& Nur, 1998) the BSR results from a strong acoustic impe-
dance contrast caused by free gas trapped beneath the gas
hydrate layer. It is still a controversial subject whether the
BSR occurs as a result of accumulation of free gas under-
neath the hydrated layer (Bangs et al., 1993), or if the
presence of the hydrated layer itself is enough to produce
an increased seismic impedance relative to the hydrate-free
underlying sediment and produce bright, phase-reversed
re¯ections (Hyndman & Spence, 1992). However, AVO
studies infer that an increase in the seismic amplitudes
with offset of the BSR (Andreassen et al., 1997; Bangs
et al., 1993) is indicative of presence of free gas underneath
the hydrated layer.
In order to evaluate the presence of free gas accumulation
beneath the gas hydrate layer on line ABSHERON 2, an
AVO analysis at BAH was performed. The approach used
here is based on AVO crossplotting (Castagna & Swan,
1997; Castagna et al., 1998), and bears on Shuey's approx-
imation to the Knott±Zoeppritz equations (Shuey, 1985)
C.C. Diaconescu et al. / Marine and Petroleum Geology 18 (2001) 209±221 215
(a)
900
1000
1100
1200
1300
1400
1500
Tim
e(m
s)
Seafloorwavelet
(+)
TAH (+)
Offset (m)250 1050
BAH (-)
(c)
0 0.05 0.10 0.15 0.20 0.25 0.30 0.35 0.40
0.0
0.5
1.0
-1.0
-0.5
Rel
ativ
eam
plitu
deWavelet width (s)
0 0.05 0.10 0.15 0.20 0.25 0.30 0.35 0.40
0.0
0.5
1.0
-1.0
-0.5
Rel
ativ
eam
plitu
de
Wavelet width (s)
(b)
(a)
S
0.2 0.4 0.6 0.8 1.0
0.2
0.4
0.6
0.8
1.0B
-1.0 -0.8 -0.6 -0.4 -0.2
-1.0
-0.8
-0.6
-0.4
-0.2
S
B
III
III IV
0.4
0.3
0.2
0.1
0
-0.1
-0.2
-0.3
-0.4
10 20 30
BAH Reflection Coefficient= - 0.115
Angle of Incidence (o)
Am
plitu
de
(d)0.4
0.3
0.2
0.1
0
-0.1
-0.2
-0.3
-0.4
10 20 30
Seafloor Reflection Coefficient= 0.198
Angle of Incidence (o)Am
plitu
de
0.4
0.3
0.2
0.1
0
-0.1
-0.2
-0.3
-0.4
10 20 30
TAH Reflection Coefficient= 0.123
o)
Fig. 3. (a) Amplitude corrected CMP gather (km 14 in Fig. 2) for a 0±308 range of angle of incidence at the depth of the BAH re¯ector, showing the BAH
wavelet becoming less negative with increasing offset; (b) Sea¯oor wavelet; (c) BAH wavelet rotated 1608 to match the phase of the sea¯oor wavelet; and
(d) AVO stacked re¯ection amplitude (S) and gradient (B) crossplot at BAH. The BAH response indicates that both P- and S-wave velocities decrease below
BAH, as expected from an interface which separates rigid, hydrated sediments from gas sands.
that is valid for angles of incidence of 0±308 (Fig. 3d). The
four quadrants displayed in Fig. 3d are different with respect
to the variation of the intercept and gradient, and the classic
shales overlying gas sands plot in quadrant III. The repre-
sentation displayed in Fig. 3d is based on the following
equation:
R�u� < S 1 B sin2 u �1�where
S <Vp2
r2 2 Vp1r1
Vp1r1 1 Vp2
r2
; B � S 2 2Rs;
and
Rs � Vs2r2 2 Vs1
r1
Vs1r1 1 Vs2
r2
where R is the re¯ection coef®cient, u the angle of inci-
dence, S the AVO intercept, and B the AVO gradient. The
AVO intercept (S) is an approximation of the normal inci-
dence stacked re¯ection amplitudes at a given CMP,
whereas the AVO gradient (B) is a measure of the offset-
dependent re¯ectivity (Castagna & Swan, 1997; Castagna et
al., 1998). At zero offsets, the amplitude depends only on the
P-wave velocity and density, whereas at far offsets, ampli-
tudes are dependent on the S-wave velocity and density as
well.
The ®rst-order information on the amplitude variation
with offset at BAH is provided by the CMP gather shown
in Fig. 3a, which shows the BAH re¯ector with decreasing
AVO (the negative re¯ection coef®cient becoming less
negative at far offsets). Fig. 3d shows the seismic re¯ection
amplitudes sampled along BAH plotted as a function of B
and S. Most of these values fall in quadrant II, indicating
that BAH is an interface with a negative AVO intercept (S),
and a positive AVO gradient (B). According to Castagna et
al. (1998) this AVO pattern indicates decreasing AVO
(decreasing re¯ection magnitude versus offset) at the
re¯ecting interface. Furthermore, the inset in Fig. 3d
shows that the average near-vertical re¯ection coef®cient
for BAH is 20.115, and its magnitude decreases at far
offsets. This re¯ection coef®cient is more than half the
magnitude of the near-vertical re¯ection coef®cient at the
sea¯oor, estimated to be ,0.198 (Fig. 3d), and it is similar
to other re¯ection coef®cients for BSRs worldwide (e.g.
Ecker & Lumley, 1993; Shipley et al., 1979). Similarly,
the near-vertical re¯ection coef®cient at TAH is 0.123
(Fig. 3d).
One of the more interesting results of the AVO crossplots
(Castagna & Swan, 1997; Castagna et al., 1998) is that gas
sands with lower Vs than the overlying formation could
exhibit decreasing AVO, and plot in quadrant II. The
media identi®ed by Castagna et al. (1998), which might
produce this behavior, are hard shales (siliceous or calcar-
eous), siltstones, carbonates, or tightly cemented sediments.
Therefore, for layers 1 and 2 where Vp1. Vp2
, and r1 ù r2
amplitudes will plot in quadrant II or III of Fig. 3d. The
change of Vs across the analyzed interface in¯uences the
plotting of the data in either quadrant II (positive gradient)
or quadrant III (negative gradient). If Vs1# Vs2
; the data fall
into quadrant III, and if Vs1. Vs2
; the data will plot in
quadrant II. The AVO modeling at BAH indicates that
Vs1< 800 m=s and Vs2
< 360 m=s �DVs � 440 m=s�;whereas Vp1
< 2100 m=s and Vp2< 1550 m=s �DVp �
550 m=s�; while the density is considered to be constant �r �1:848 g=cm3� across BAH, therefore both the P- and S-wave
velocities are higher in the hydrated layer than in the under-
lying sediments. There are earlier studies (e.g. Lee et al.,
1994) which found out that there is no major change in
density at the BSR. According to Castagna et al. (1998),
this is a case in which decreasing AVO at BAH suggests
accumulation of free gas underneath BAH (class IV gas
sands), and the gas hydrated layer plays the role of the
tightly cemented sediments. The porosity of the hydrated
layer derived from the AVO modeling is 48%, and ,20%
of the pore space is ®lled with gas hydrates.
4. Thermobaric modeling
Theoretically determined phase equilibria clearly distin-
guish natural gas hydrates from water ice, and can be used to
calculate the temperature and pressure at which hydrates
form from a given gas composition (Sloan, 1990, 1998).
Of the different equations developed for gas hydrate
phase-equilibria, this study employed the three-phase equi-
librium analysis based on a statistical thermodynamic deter-
mination of the distribution of the guest particles in the
hydrate structure (Sloan, 1990; Van der Waals & Platteeuw,
1959). This approach provides a comprehensive means of
correlation and prediction of all the hydrate equilibrium
regions of the phase diagram, without separate prediction
schemes for two-phase regions, three-phase regions, etc.
(Sloan, 1990, 1998).
The gas hydrate phase equilibrium diagrams calculated
for the Absheron area illustrate how variations in formation
temperature, pore pressure and geothermal gradient affect
the thickness of the gas hydrate stability zone (Fig. 4).
Sea¯oor temperature was considered to be 5.858C, regard-
less of the water depth, which is toward the lowest tempera-
ture reported for the study area (5.8±6.28C; Schoellkopf &
Dahl, 1995). Note that a 18C change in the sea¯oor tempera-
ture will shift the gas hydrate stability ®eld by at most a few
tens of meters. A hydrostatic pore-pressure gradient of
0.1 atm/m was assumed for calculating the depth scale
(Kvenvolden, 1993).
Intersection of the gas hydrate stability curves with the
sea¯oor isotherm of 5.858C denotes the minimum water
depth at which gas hydrates are stable for a given hydro-
carbon gas composition (Fig. 4). The depth at which the
geothermal gradient intersects the gas hydrate stability
curve marks the predicted base of the gas hydrate stability
C.C. Diaconescu et al. / Marine and Petroleum Geology 18 (2001) 209±221216

®eld (Kvenvolden et al., 1981; Kvenvolden, 1993). Geother-
mal gradients considered in this study (11±178C/km) were
derived from surface heat ¯ow studies (Schoellkopf & Dahl,
1995; Tagiyev et al., 1997), and were hung from three
different water depths. The shallowest (150 m) represents
the minimum water depth for formation of gas hydrates in
the study area, and water depths of 475 and 690 m corre-
spond to the updip and downdip termination of the inter-
preted gas hydrate layer on line ABSHERON 2 (Fig. 2a).
Gas hydrate stability curves in Fig. 4 are calculated for a
system of pure water (zero salinity) and hydrocarbon gas for
three different gas compositions including pure methane (1)
and measured gas samples from within the study area (2 and
3). The gas compositions for gas hydrate stability curves (2)
and (3) are listed in Fig. 4, and represent compositional
analyses of sediment gases liberated from a core sample
taken at location C in Fig. 1 (Moukhtarov, 1998). Curve
(2) corresponds to the gas composition sampled in the
lower part of the core, whereas curve (3) represents the
gas composition sampled 57 cm higher, in the upper part
of the core.
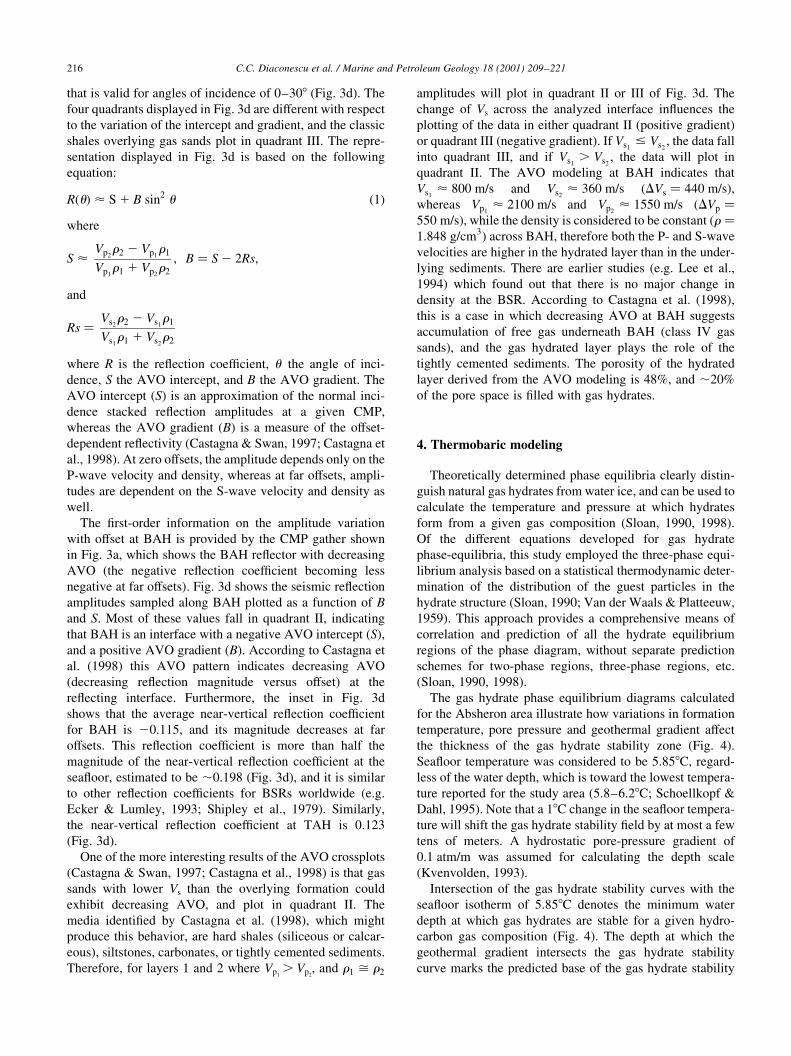
The minimum water depth at which gas hydrates may
become stable within the study area is ,150 m, based on
stability curve (3) (Fig. 4). Note that at this water depth,
methane hydrate does not form because the geothermal
gradient does not intersect the methane hydrate stability
C.C. Diaconescu et al. / Marine and Petroleum Geology 18 (2001) 209±221 217
De
pth
(m)
Pressure
(atm)
3
Ice line
100% metha e1 n
Seafloortemperature
=5.85oC
Water depth forgas hydrate
occurrence onABSHERON 2
2
1
1000
1500
2000
2500
500
0 0
50
100
150
200
250
80.00% methane1.87% ethane2.89% propane0.44% iso-butane1.92% n-butane
12.88% heavyhydrocarbons
3
94.87% methane0.63% ethane0.83% propane0.14% iso-butane2.80% octane0.62% ethylene0.11% propylene
2
+ NaCl + CO2, H2S
Water depth:
150 m475 m690 m
Temperature( C)o
0 4 8 12 16 20 24
Fig. 4. Generalized phase equilibrium diagram for a system of pure water and different hydrocarbon gas compositions based on pure methane (1) and measured
gas compositions from the study area (2 and 3; at coring location C in Fig. 1). Hydrate stability ®elds are calculated for geothermal gradients of 118C/km (plain
lines) and 178C/km (dashed lines), for water depths of 150, 475 and 690 m. The base of the gas hydrate stability ®eld is positioned at the depth at which the
geotherm crosses the gas hydrate stability curves. In all cases, the observed Absheron hydrate occurrence falls within the modeled stability ®eld, but typically
at shallower depths and in thinner layers. Depth scale assumes a pore-water hydrostatic pressure gradient of 0.1 atm/m. Arrows show direction toward which
the gas hydrate stability curves move if NaCl (left) and/or CO2 or H2S (right) are added to the system.

(curve 1). For a water depth of 150 m, gas composition (3)
which suggests a thermogenic origin (with ,20% of heavier
hydrocarbon gases than methane), could be stable as a
hydrate from the sea¯oor and could reach thicknesses of
600 m (for a geothermal gradient of 178C/km) to 1150 m
(for a geothermal gradient of 118C/km). Gas composition
(2) which is richer in methane (,95%) would not form gas
hydrates at the sea¯oor, but deeper in the sediments, starting
at ,275 mbsl (for a geothermal gradient of 178C/km) and
could reach thicknesses as large as ,950 m. Small additions
of heavier natural gas components such as ethane, propane,
isobutane and/or CO2 or H2S cause an increase of the
C.C. Diaconescu et al. / Marine and Petroleum Geology 18 (2001) 209±221218
0 4 8 12 16 20
321
1500
0
1000
2000
500
0
50
100
150
200
(a)
Seafloor
0 4 8 12 16 20
321
1500
0
1000
2000
500
0
50
100
150
200
(b)
Seafloor
1500
0
1000
2000
500
0
50
100
150
200
0 4 8 12 16 20
321
(c)
0 4 8 12 16 20
3
Ice line
Seafloortemperature
=5.85oC
21
1500
0
1000
2000
500
0
50
100
150
200
(d)
Seafloor
Temperature (oC)
Dep
th(m
)
Pressure
(atm)
Temperature (oC)
Dep
th(m
)
Pressure
(atm)
Temperature (oC)
Dep
th(m
)
Pressure
(atm)
Temperature (oC)
Dep
th(m
)
Pressure
(atm)
11 oC/km
Seafloortemperature
=5.85oC
Ice line
Seafloor
17 oC/km
Ice line
Seafloortemperature
=5.85oC
Ice line
Seafloortemperature
=5.85oC
17 oC/km
11 oC/km
Fig. 5. Theoretical phase equilibrium diagrams from Fig. 4, showing predicted gas hydrate stability ®elds for: (a) water depth of 475 m, and geothermal
gradient of 178C/km; (b) water depth of 475 m, and geothermal gradient of 118C/km; (c) water depth of 690 m, and geothermal gradient of 178C/km; and (d)
water depth of 690 m, and geothermal gradient of 118C/km. The predicted gas hydrate stability ®eld is shown in shades of gray, where light gray corresponds
to curve 1, medium gray to curve 2, and dark gray to curve 3. Hachured area shows the gas hydrate occurrence zone as determined from the ABSHERON 2
pro®le.

hydrate stability region due to a displacement of the phase
boundary toward higher temperatures and lower pressures
(Kvenvolden, 1993, 1995). Given the known geochemical
and geothermal constraints from the South Caspian Sea, the
predicted thickness of the gas hydrate stability ®eld varies
between 0 and 1350 m. Lower geothermal gradients and
heavier hydrocarbon gases would only serve to enlarge the
gas hydrate stability ®eld.
5. Discussion
Seismic evidence for gas hydrate occurrences in the
South Caspian Sea argue for the presence of buried gas
hydrates that form well beneath the sea¯oor (300±
350 mbsf, meters below sea¯oor). Thermobaric modeling
of the gas hydrate stability ®eld (Fig. 4) suggests that gas
hydrates should be stable from the sea¯oor to depths largely
controlled by the geothermal gradient and the gas composi-
tion. Development of gas hydrates in layers as thick as
,200 m fall within the predicted gas hydrate stability
®eld (Figs. 4 and 5). Fig. 5a and b display gas hydrate
stability ®elds for water depth of 475 m, which is the shal-
lowest for gas hydrate occurrence on line ABSHERON 2
(Fig. 2). These ®gures are different with respect to the
geothermal gradients, which are 17 and 118C/km, respec-
tively. Similarly, Fig. 5c and d display gas hydrate stability
®elds for water depth of 690 m, which is the deepest where
gas hydrates occur on line ABSHERON 2 (Fig. 2). The
zones shown in hatch represent the gas hydrate occurrence
zones from line ABSHERON 2, and how these ®t the gas
hydrate predicted from thermobaric modeling. The shallow-
est gas hydrate occurrence on line ABSHERON 2 lies
between 800 and 940 mbsl (for water depth of ,475 m),
and the deepest gas hydrate occurrence in the section,
between 1000 and 1150 mbsl (for water depth of
,690 m). As seen in Fig. 5(a)±(d) the gas hydrate zone
interpreted with seismic methods ®ts within the gas hydrate
predicted with the phase equilibrium diagrams. The only
exception to this is shown in Fig. 5a, where the gas hydrate
occurrence is below, and not within the predicted methane
stability ®eld corresponding to curve (1). Even though, the
high sedimentation rate of the South Caspian Sea may
ensure the preservation of suf®cient shallow organic matter
for clathrate production in situ, this shows that the gas
composition in the study area might contain heavier hydro-
carbon gases as displayed by the phase equilibrium curves
(2) and (3). Location of line ABSHERON 2 relatively close
(,6±8 km) to a mud volcano (Fig. 1; Absheron mud
volcano) enhances the chance for production of thermo-
genic gas in our study area.
As known from previous studies (e.g. Kvenvolden, 1993,
1995; Sloan 1998), heavier hydrocarbon gases enlarge the
gas hydrate stability ®eld. The present study once again
demonstrates that the thickness of the gas hydrate stability
®eld, as predicted from the thermobaric modeling, is very
sensitive to variation in the geothermal gradient, seawater
depth, and hydrocarbon composition. Each of these factors
can affect the thickness of the stability ®eld by a few
hundred meters. Decrease of the geothermal gradient and
increase in water depth result in increased thickness of the
hydrate stability ®eld. Pore-water salinity and sea¯oor
temperature are also important in the gas hydrate thickness
¯uctuations, but to a lesser extent. Pore water salts in
contact with gas during gas hydrate formation can reduce
the crystallization temperature by about 0.068C for each part
per thousand of salt (Kvenvolden, 1995). Thus, pore water
salinity similar to that of seawater (,35 permil) reduces the
crystallization temperature by 2.18C and the thickness of the
gas hydrate stability zone by about 200 m (Collet, 1994).
The Caspian Sea salinity is low (,10 ½; Ginsburg
and Soloviev, 1994) therefore this might thin the phase
equilibrium by only a few tens of meters compared to
fresh water.
The gas hydrates mapped on the ABSHERON 2 pro®le
occur on the western ¯ank of the Absheron mud volcano
(Fig. 1). Given the thermogenic nature of gas seen in shal-
low piston cores (C in Fig. 1), the mud volcano represents a
likely source for gas in these hydrates. Additionally, chaotic
mud ¯ows and breccias emanating from the mud volcano
may account for the lack of stratigraphic de®nition within
the shallow section south of the Absheron high (Fig. 2). We
cannot rule out the possibility that the lateral and depth-
limited extent of the gas hydrates is in some way affected
by the presence of such mud ¯ows. Analysis of this relation-
ship awaits detailed examination of 3D data in the region.
Alternatively, these seismic data may lend support for the
theory developed by Xu and Ruppel (1999) that the gas
hydrate occurrence zone does not necessarily coincide
with the gas hydrate stability zone predicted from thermo-
baric modeling. A plot of the gas hydrate occurrence with
the predicted stability ®eld (Fig. 5) shows that the hydrates
lie consistently within the hydrate stability zone, but within
a much narrower depth range for all conditions modeled.
According to Xu and Ruppel (1999), this phenomenon
appears to be primarily controlled by the mass fraction of
hydrocarbon gases in bottom water as well as the gas and
¯uid migration rates. The stability of gas hydrates at the
sea¯oor is possible only where there is a constant supply
of gas at suf®cient pressure. The occurrence of gas hydrates
in well-de®ned layers well beneath the sea¯oor could be a
result of the fact that the free gas underneath the hydrate-
cemented sediment may occur as patches of gas-®lled sedi-
ment with variable thickness. The gas hydrates within the
Absheron block develop in relation to the structural high
shown in Fig. 2, suggesting that their occurrence might be
due to larger supply of gas from underneath. There is some
relief on BAH, which does not perfectly parallel the sea¯oor
re¯ection, possibly due to an undocumented thermal
anomaly on top of the structural high or to spatially irregular
gas supply.
Due to the high sedimentation rate in the South Caspian
C.C. Diaconescu et al. / Marine and Petroleum Geology 18 (2001) 209±221 219

basin (average of ,2 km/Ma for the past 5 Ma; Devlin et al.,
1999), the isotherms migrate downwards as the sediment
surface builds up. The trapped free gas at the base of the
gas hydrate layer (indicated by the AVO analysis) may
penetrate the hydrate-cemented zone either by diffusion or
along pathways provided by small faults (Dillon et al.,
1994), and it is rapidly converted to hydrate, causing a
higher concentration of hydrate in the lower part of the
hydrate stability zone. This might be the reason for higher
velocities (as shown in tones of red) within the gas hydrate
zone in Fig. 2, in the vicinity of BAH. Also, as an effect
of the high sedimentation rates, the phase-boundary
conditions change rapidly, possibly causing the variation
in the character of the BAH re¯ector.
6. Conclusions
Gas hydrate cemented sediments are for the ®rst time
documented in the deep water of the South Caspian Sea,
where they form in layers well below the sea¯oor, charac-
terized by sharply de®ned upper and lower boundaries
within the host sediments. These gas hydrate layers occur
at the temperature and pressure conditions that mark the
hydrate phase boundary, but in much thinner layers than
predicted from thermobaric modeling of the hydrate
stability zone.
This study shows that gas hydrates of the South Caspian
Sea occur not only on the top of mud volcanoes as
previously studied (Ginsburg et al., 1992; Ginsburg & Solo-
viev, 1994), but also in a fairly undisturbed sedimentary
section. This is the ®rst time, to our knowledge, that a strong
and clear seismic BSR (BAH in this study) has been
observed in the Caspian Sea at a fairly large depth
(,300±500 mbsf), and its occurrence correlates with calcu-
lations of the hydrate stability ®eld from thermobaric
modeling using speci®c geochemical and geothermal data
for the study area.
Thermobaric modeling suggests that the gas hydrates
may be stable in the South Caspian Sea offshore Azerbaijan
in water depths as shallow as 150 m (in case of thermogenic
gas such as curve (3) in Fig. 4), and 460 m for biogenic gas
(for pure methane). These minimum depths for gas hydrate
formation in the study area are much shallower than those
reported for other gas hydrate sites worldwide (e.g. Dillon
et al., 1994; Field, & Kvenvolden, 1985; Lee et al., 1994).
The maximum thickness of the predicted hydrate stability
®eld is 1350 m (Figs. 4 and 5). These results indicate poten-
tial occurrence of gas hydrates in depth-restricted zones well
beneath the sea¯oor (,300±350 mbsf), suggesting that the
actual gas hydrate occurrence zone is thinner and falls
within the gas hydrate stability zone predicted by thermo-
baric modeling, but typically at shallower depths and in
thinner layers (Fig. 5). This is a con®rmation of the theore-
tical model introduced by Xu and Ruppel (1999), according
to which it is very likely that the gas hydrate occurrence
does not coincide with the gas hydrate predicted with the
phase equilibrium diagrams, but it is rather positioned
within the latter.
Acknowledgements
Many thanks are due to Chevron Overseas Petroleum Inc.
(USA), SOCAR (Azerbaijan), and Total (France) for
providing access to the seismic data and for permission to
publish them. Here, special acknowledgments are directed
to John A. Connor, Rukhsara Gulieva, Keith Kvenvolden
and Alan Cooper for their support during this study. Caspian
Geophysical collected the seismic pro®le analyzed in this
paper. Jorge Mendiguren (COPI) provided the software
used for the AVO analysis. Larry Brown offered useful
comments on earlier versions of the manuscript, and Neil
Piggott provided a constructive review. Acknowledgment
is made to the donors of The Petroleum Research Fund,
administered by the ACS, for partial support of this
research. Contribution #1 from the Tectonics and Geo-
physics Lab at USC.
References
Anderson, A. L. (1992). Remote acoustic characterization of the sea¯oor
including gassy and hydrated sediment regions. Second International
offshore and polar engineering conference proceedings (Vol. 1, pp.
674±683). Golden, Colarado: International Society of Offshore and
Polar Engineering.
Andreassen, K., Hart, P. E., & MacKay, M. (1997). Amplitude versus offset
modeling of the bottom-simulating re¯ection associated with submarine
gas hydrates. Marine Geology, 137, 25±40.
Bagirov, E., & Lerche, I. (1997). Hydrates represent gas source, drilling
hazard. Oil and Gas Journal, 95 (48), 99±101.
Bangs, N. L. B., Dale, S. S., & Golovchenko, X. (1993). Free gas at the base
of the gas hydrate zone in the vicinity of the Chile triple junction.
Geology, 21, 905±908.
Castagna, J. P., & Swan, H. W. (1997). Principles of AVO crossplotting.
The Leading Edge, 16 (4), 337±342.
Castagna, J. P., Swan, H. W., & Hoster, D. J. (1998). Framework for AVO
gradient and intercept interpretation. Geophysics, 63 (3), 948±956.
Collett, T. S. (1994). Permafrost-associated gas hydrate accumulations.
International conference on natural gas hydrates. E. D. Sloan Jr., J.
Happel & M. A. Hnatow. Annals of the New York Academy of Sciences,
715, 247±269.
Devlin, W. J. (1999). South Caspian Basin; young, cool, and full of
promise. Geological Society of America Today, 9 (7), 1±9.
Dillon, W. P., Lee, M. W., & Coleman, D. F. (1994). Identi®cation of
marine hydrates in situ and their distribution off the Atlantic Coast of
the United States. International conference on natural gas hydrates.
E. D. Sloan Jr., J. Happel & M. A. Hnatow. Annals of the New York
Academy of Sciences, 715, 364±380.
Dix, C. H. (1955). Seismic velocities from surface measurements. Geo-
physics, 20, 68±86.
Ecker, C. & Lumley, D. (1993). AVO analysis of methane hydrate seismic
data. SEP-79 (pp. 161±176), Stanford University.
Ecker, C., Dvorkin, J., & Nur, A. (1998). Sediments with gas hydrates;
internal structure from seismic AVO. Geophysics, 63 (5), 1659±1669.
Field, M. E., & Kvenvolden, K. A. (1985). Gas hydrates on the northern
California continental margin. Geology, 13, 517±520.
C.C. Diaconescu et al. / Marine and Petroleum Geology 18 (2001) 209±221220

Foster, D. J., Keys, R. G., & Reilly, J. M. (1997). Another perspective on
AVO crossplotting. The Leading Edge, (9), 1233±1237.
Ginsburg, G. D. (1992). Gas hydrates of the southern Caspian. International
Geology Review, 35 (8), 765±782.
Ginsburg, G. D., & Soloviev, V. A. (1994). Mud volcano gas hydrates in the
Caspian Sea. Bulletin of the Geological Society of Denmark, 41, 95±
100.
Hyndman, R. D., & Spence, G. D. (1992). A seismic study of methane
hydrate marine bottom-simulating re¯ectors. Journal of Geophysical
Research, 97 (5), 6683±6698.
Kvenvolden, K. A. (1993). A primer on gas hydrates. The Future of Energy
Gases (pp. 279±291). US Geological Survey professional paper 1570.
Kvenvolden, K. A. (1995). A review of the geochemistry of methane in
natural gas hydrate. Organic Geochemistry, (11±12), 997±1008.
Kvenvolden, K. A., Barnard, L. A., Brooks, J. M., & Wiesenburg, D. A.
(1981). Geochemistry of natural-gas hydrates in oceanic sediments.
Advances in Organic Geochemistry, 422±430.
Lee, M. W., Hutchinson, D. R., Agena, W. F., Dillon, W. P., Miller, J. J., &
Swift, B. A. (1994). Seismic character of gas hydrates on the South-
eastern US continental margin. Marine Geophysical Researches, 16 (3),
163±184.
Malone, R. D. (1994). Hydrate characterization research overview. Inter-
national conference on natural gas hydrates. E. D. Sloan Jr., J. Happel
& M. A. Hnatow. Annals of the New York Academy of Sciences, 715,
358±363.
McIver, R. D. (1982). Role of naturally occurring gas hydrates in sediment
transport. American Association of Petroleum Geologists Bulletin, 66
(6), 789±792.
Moukhtarov, F. (1998). Core sample report (17 pp.). Aberdeen, Scotland
(Chevron internal report).
Priestley, K., Baker, C., & Jackson, J. (1994). Implications of earthquake
focal mechanism data for the active tectonics of the South Caspian basin
and surrounding regions. Geophysics Journal International, 118, 111±
141.
Sapir, M. K., Khramenkov, Y. N., Yefremov, I. D., Ginsburg, G. D.,
Ben'yaminovich, A. E., Lenda, S. M., & Kislova, V. I. (1973). Geologic
and geophysical features of gas hydrate reservoirs of the Messoyakha
Gas Field. Geologiya Nefti i Gaza, 26±33 (in Russian).
Schoellkopf, N. B. & Dahl, J. E. (1995). Geochemistry and maturation
history of the South Caspian basin, Azerbaijan. CIS (Chevron internal
report).
Shipley, T. H., Houston, M. H., Buf̄ er, R. T., Shaub, F. J., McMillen, K. J.,
Ladd, J. W., & Worzel, J. L. (1979). Seismic evidence for widespread
possible gas hydrate horizons on continental slopes and rises. American
Association of Petroleum Geologists Bulletin, (12), 2204±2213.
Shuey, R. T. (1985). A simpli®cation of the Zoeppritz equations. Geo-
physics, 50, 609±614.
Simm, R., White, R., & Uden, R. (2000). The anatomy of AVO crossplots.
The Leading Edge, 19 (2), 150±155.
Singh, S., Minshull, T. A., & Spence, G. (1993). Velocity structure of a gas
hydrate re¯ector. Science, 260, 204±207.
Sloan Jr., E. D. (1990). Clathrate hydrates of natural gases, New York and
Basel: Dekker (641 pp.).
Sloan Jr., E. D. (1998). Clathrate hydrates of natural gases, New York:
Marcel Dekker (705 pp.).
Tagiyev, M. F., Nadirov, R. S., Bagirov, E. B., & Lerche, I. (1997). Geohistory,
thermal history and hydrocarbon generation history of the north-west
South Caspian Basin. Marine and Petroleum Geology, 14 (4), 363±382.
Van der Waals, J. H., & Platteeuw, J. C. (1959). Clathrate solutions.
Advances in Chemical Physics, 2 (1).
Xu, W., & Ruppel, C. (1999). Predicting the occurrence, distribution, and
evolution of methane gas hydrate in porous marine sediments. Journal
of Geophysical Research, 104 (B3), 5081±5095.
Yefremova, A. G., & Zhizhcenko, B. P. (1974). Occurrence of crystal
hydrates of gases in the sediments of modern marine basins. Doklady
Akademii Nauk SSSR, 214 (5), 1179±1181.
Zonenshain, L. P., & Le Pichon, X. (1986). Deep basins of the Black Sea
and Caspian Sea as remnants of Mesozoic back-arc basins. Tectonophy-
sics, 123, 181±211.
Zonenshain, L. P., Kuzmin, M. I., & Natapov, L. M. (1990). In B. M. Page,
Geology of the USSR: a plate tectonic synthesis. Geodynamic series Vol.
21. (pp. 169±198). Washington, DC: American Geophysical Union.
C.C. Diaconescu et al. / Marine and Petroleum Geology 18 (2001) 209±221 221