Geomorphology - UNL · While the basis of knowledge in fluvial geomorphology continues tostemfrom...
16
Patterns of anabranching channels: The ultimate end-member adjustment of mega rivers Edgardo M. Latrubesse Centro de Investigaciones Geológicas-CIG-LATYR-CONICET, Universidad Nacional de La Plata-FCNyM, Calle 1 N 644 (1900), La Plata, Argentina ABSTRACT ARTICLE INFO Article history: Received 22 November 2007 Received in revised form 30 April 2008 Accepted 9 May 2008 Available online 29 May 2008 Keywords: Large rivers Channel patterns Anabranching Amazon River Hydraulic geometry Large fluvial systems adjust to a combination of controls to form distinctive channels, which represent a dominant factor in the evolution of floodplain geomorphology and sedimentology. Fluvial geomorphology has commonly classified river channels into meandering, straight and braiding patterns, which are seen to represent a continuum of channel geometry. Anabranching patterns, rivers with multiple channels, however, are characteristic of many rivers. The identification of a combination of variables that discriminates specific channel patterns has been a significant focus of research in fluvial geomorphology. The development of this body of knowledge, however, has been established from medium and small rivers, and laboratory flume studies. Very few of these research ideas developed from analysis of large fluvial systems. This paper assesses the pattern of channel adjustment of large fluvial systems by employing hydraulic geometry, discharge, w/d, slope, grain size, stream power, specific stream power, and Froude number (Q mean N 1000 m 3 /s). The study demonstrates that methods currently used to discriminate channel patterns are not useful when applied to very large rivers. Further, with the exception of the Lower Mississippi, alluvial rivers with mean annual discharges greater than ~17,000 m 3 /s, here classified as mega rivers, do not generate single thread meandering or typical braided patterns. These mega rivers develop anabranching patterns. © 2008 Elsevier B.V. All rights reserved. 1. Introduction Fluvial systems adjust the floodplain and channels to a combina- tion of controls, and a strong correlation exists between river channel patterns and floodplain sedimentology (Nanson and Croke, 1992; Bridge, 2003). Over small time-scales floodplain conditions affect channel patterns by influencing local bank resistance, flow transmis- sion and sediment load. Over longer time-scales, however, the patterns of river channels are seen as the driver for floodplain styles (Nanson and Croke, 1992), and models of alluvial architecture and depositional environments are dependent upon the dynamics of channel patterns (Miall, 1996; Bridge, 2003). Fluvial geomorphology has commonly categorized river channels as meandering, straight and braiding patterns, which are seen to represent end-member patterns (Leopold and Wolman, 1957, Knighton, 1998). The identification of a combination of variables that discriminates specific channel patterns has been a significant focus of research in fluvial geomorphology. The development of this body of knowledge, however, has been established from small and medium sized rivers, and laboratory flume studies. This paper examines the adjustment of channel patterns for the largest fluvial systems on Earth, with the idea of being able to identify a threshold for what may be considered a large river. Simple definitions such as straight, meandering and braided are difficult to apply in large rivers (Latrubesse et al., 2005). In a recent paper, Jansen and Nanson (2004) indicate that the largest rivers are dominated by anabranching patterns, an observation made by Latrubesse (1992) a decade earlier. Anabranching channel patterns represent an additional planform geometry (e.g. Nanson and Knighton, 1996), and agreement exists among researchers that the physical causes for anabranching channels should be identified (Nanson and Huang, 1999; Huang and Nanson, 2007). As addressed by several authors (Nanson and Croke, 1992; Knighton 1998, Miall, 1996; Fielding, 2007) a close association occurs between the type of channel pattern and the characteristics of flood- plain development. The distinctive aggradation morphologies and the sedimentary architecture that characterize a floodplain can be related to the hydro-geomorphologic dynamics of the associated channel pattern. Nanson and Croke (1992), for example, quantitatively iden- tified several types of floodplains and channel patterns as a function of specific stream power at bankfull discharge and sediment texture. The largest rivers, however, exhibited a variety of channel styles, and anabranching pattern were common. Considering the existing lack of knowledge on anabranching rivers on the varieties of sub-patterns or planforms as well physical causes for anabranching, understanding floodplain evolution generated by anabranching patterns remains incomplete. Geomorphology 101 (2008) 130–145 E-mail address: [email protected]. 0169-555X/$ – see front matter © 2008 Elsevier B.V. All rights reserved. doi:10.1016/j.geomorph.2008.05.035 Contents lists available at ScienceDirect Geomorphology journal homepage: www.elsevier.com/locate/geomorph
Transcript of Geomorphology - UNL · While the basis of knowledge in fluvial geomorphology continues tostemfrom...

Geomorphology 101 (2008) 130–145
Contents lists available at ScienceDirect
Geomorphology
j ourna l homepage: www.e lsev ie r.com/ locate /geomorph
Patterns of anabranching channels: The ultimate end-member adjustment ofmega rivers
Edgardo M. LatrubesseCentro de Investigaciones Geológicas-CIG-LATYR-CONICET, Universidad Nacional de La Plata-FCNyM, Calle 1 N 644 (1900), La Plata, Argentina
E-mail address: [email protected].
0169-555X/$ – see front matter © 2008 Elsevier B.V. Aldoi:10.1016/j.geomorph.2008.05.035
A B S T R A C T
A R T I C L E I N F OArticle history:
Large fluvial systems adjus Received 22 November 2007Received in revised form 30 April 2008Accepted 9 May 2008Available online 29 May 2008Keywords:Large riversChannel patternsAnabranchingAmazon RiverHydraulic geometry
t to a combination of controls to form distinctive channels, which represent adominant factor in the evolution of floodplain geomorphology and sedimentology. Fluvial geomorphologyhas commonly classified river channels into meandering, straight and braiding patterns, which are seen torepresent a continuum of channel geometry. Anabranching patterns, rivers with multiple channels, however,are characteristic of many rivers. The identification of a combination of variables that discriminates specificchannel patterns has been a significant focus of research in fluvial geomorphology. The development of thisbody of knowledge, however, has been established from medium and small rivers, and laboratory flumestudies. Very few of these research ideas developed from analysis of large fluvial systems.This paper assesses the pattern of channel adjustment of large fluvial systems by employing hydraulicgeometry, discharge, w/d, slope, grain size, stream power, specific stream power, and Froude number(QmeanN1000 m3/s). The study demonstrates that methods currently used to discriminate channel patternsare not useful when applied to very large rivers. Further, with the exception of the Lower Mississippi, alluvialrivers with mean annual discharges greater than ~17,000 m3/s, here classified as mega rivers, do not generatesingle thread meandering or typical braided patterns. These mega rivers develop anabranching patterns.
© 2008 Elsevier B.V. All rights reserved.
1. Introduction
Fluvial systems adjust the floodplain and channels to a combina-tion of controls, and a strong correlation exists between river channelpatterns and floodplain sedimentology (Nanson and Croke, 1992;Bridge, 2003). Over small time-scales floodplain conditions affectchannel patterns by influencing local bank resistance, flow transmis-sion and sediment load. Over longer time-scales, however, thepatterns of river channels are seen as the driver for floodplain styles(Nanson and Croke, 1992), and models of alluvial architecture anddepositional environments are dependent upon the dynamics ofchannel patterns (Miall, 1996; Bridge, 2003).
Fluvial geomorphology has commonly categorized river channelsas meandering, straight and braiding patterns, which are seen torepresent end-member patterns (Leopold and Wolman, 1957,Knighton, 1998). The identification of a combination of variablesthat discriminates specific channel patterns has been a significantfocus of research in fluvial geomorphology. The development of thisbody of knowledge, however, has been established from small andmedium sized rivers, and laboratory flume studies.
This paper examines the adjustment of channel patterns for thelargest fluvial systems on Earth, with the idea of being able to identify
l rights reserved.
a threshold for what may be considered a large river. Simpledefinitions such as straight, meandering and braided are difficult toapply in large rivers (Latrubesse et al., 2005). In a recent paper, Jansenand Nanson (2004) indicate that the largest rivers are dominated byanabranching patterns, an observation made by Latrubesse (1992) adecade earlier. Anabranching channel patterns represent an additionalplanform geometry (e.g. Nanson and Knighton, 1996), and agreementexists among researchers that the physical causes for anabranchingchannels should be identified (Nanson and Huang, 1999; Huang andNanson, 2007).
As addressed by several authors (Nanson and Croke, 1992;Knighton 1998, Miall, 1996; Fielding, 2007) a close association occursbetween the type of channel pattern and the characteristics of flood-plain development. The distinctive aggradation morphologies and thesedimentary architecture that characterize a floodplain can be relatedto the hydro-geomorphologic dynamics of the associated channelpattern. Nanson and Croke (1992), for example, quantitatively iden-tified several types of floodplains and channel patterns as a function ofspecific stream power at bankfull discharge and sediment texture. Thelargest rivers, however, exhibited a variety of channel styles, andanabranching pattern were common. Considering the existing lack ofknowledge on anabranching rivers on the varieties of sub-patterns orplanforms as well physical causes for anabranching, understandingfloodplain evolution generated by anabranching patterns remainsincomplete.

Table 1Largest rivers of the world
River Country tothe mouth
Mean annualdischarge (m3/s)
Drainage area(103 km2)
Annual Qs
(Mt/year)Sediment yield(t/km2 year)
Dominant channel pattern
Amazon Brazil 209,000a 6100 ~1000e 167 AnabranchingCongo Zaire 40,900 3700 32.8 9 AnabranchingOrinoco Venezuela 35,000d 950 150d 157.8 AnabranchingYangtze China 32,000 1943 970e 499 Anabranching-occasional complex and
geologically controlled sinuous reachesMadeira Brazil 32,000a 1360 450c 330 AnabranchingNegro Brazil 28,400a 696 8b 11.5 AnabranchingBrahmaputra Bangladesh 20,000 610 520e 852.4 AnabranchingJapura Brazil 18,600a 248 33b 133 AnabranchingParana Argentina 18,000 2600 112g 43 AnabranchingMississippi USA 17,000 3200 330e 102 Meandering
Data sources: (a) data estimated from the Brazilian National Agency of Water-ANA, (b)Filizola (1999), (c)Martinelli et al. (1993), (d)Meade et al. (1983), (e)Meade (1996), (g)Amsler andPrendes (2000).
131E.M. Latrubesse / Geomorphology 101 (2008) 130–145
While the basis of knowledge in fluvial geomorphology continuesto stem from studies of smaller rivers, a greater recognition exists thatlarge rivers are unique fluvial systems, in terms of the controls,processes, and from the standpoint of management (Potter, 1978; Junket al., 1989; Latrubesse et al., 2005; Gupta, 2007). Geomorphologists,however, have neither agreed upon how large a river needs to be to beconsidered “large”, or have identified objective criteria to categorizesuch rivers. Indeed, commonly a great range in the size of rivers isconsidered “large”. Kellerhalls and Church (1990) identified largerivers as having a bankfull discharge exceeding 20 m3/s and channelwidth of greater than 20 m, which is too small to be classified a largeriver by most categories (e.g., Potter, 1978; Latrubesse et al., 2005;Wohl, 2007). Nevertheless, this implies that the channel would be
Fig. 1. Location of the ten largest ri
unlikely to be significantly influenced by local factors, such as alandslide blockage or fallen trees, providing some distinction fromsmaller rivers in terms of the controls on channel morphology. Otherauthors suggest that the scale of large fluvial systems createsdistinctive types of channel and floodplain hydrologic connectivity(Junk et al.,1989;Mertes et al.,1996;Mertes,1997) which also suggestsfloodplain/channel style and scale-dependence in hydro-ecologicalprocess (Latrubesse et al., 2005, Latrubesse, in press). Other studies,however, have noted that large rivers generally require extensivegeologic control by structure or tectonics (Potter, 1978; Latrubesseet al., 2005; Miall 2006; Tandon and Sinha, 2007). Indeed, this hasemerged as the main criteria for identifying large rivers, which resultsin very long channels, a large drainage basin, and a high mean annual
ver basins based on discharge.

132 E.M. Latrubesse / Geomorphology 101 (2008) 130–145
discharge (Gupta, 2007). While it is probably reasonable to avoid toostrict of a threshold, such a broad categorization results in even thelatest treaties on the subject including rivers that span an incrediblerange of drainage area, length, and discharge. Obviously drainage areais a helpful parameter to define large rivers. To study modern geomor-phic processes, however, discharge is a key variable because channeland floodplain processes are strongly related to fluvial processes.Several fluvial systems with extensive drainage areas, for example, arelocated in dry regions and, thus, are often not considered large rivers.The Global Commission on Continental Paleohydrology (GLOCOPH)Large Rivers Working Group, for example generally considers largerivers to have a mean annual discharge (Qmean)N1000 m3/s).
Thus, in this study a large river is defined as having a mean annualdischarge (Qmean)N1000 m3/s, with the majority of case studiesincluding riversN5000 m3/s Qmean. The objective is to emphasizerivers with a Qmean greater than 1000 m3/s, which are infrequentlystudied and are seldom included in studies used to quantitativelydiscriminate channel pattern. “Flashy” rivers with high peak eventswere not included. Additionally, a new category of “very large” riversis proposed: mega rivers, which are those rivers with a QmeanN
~17,000 m3/s and include the nine largest rivers on Earth. These riversinclude the Amazon, Congo, Orinoco, Yangtze, Madeira, Negro,Brahmaputra, Japura, Parana. Additionally, the tenth largest river,the Mississippi, will be also discussed (Table 1, Figs. 1 and 2). Thisstudy aims to improve the understanding of why the largest riversdiffer from smaller rivers, and how this response is observed in theplanform channel geometry. The decoupling of knowledge betweenlarge and smaller fluvial systems represents a tremendous problem influvial geomorphology. Considering the importance of large rivers and
Fig. 2. Main sub-basins of the Amazon drainage basin. The Madeira River, Negro River and
river floodplains to a range of global-scale ecological issues, such assediment flux, carbon sequestration, and water resources, this repre-sents a significant problem for river management. Indeed, most of therunoff on Earth is transported by a few very large rivers, with ~16 to20% of the runoff discharge by the Amazon. In this regard, this studyidentifies new research directions for large rivers.
2. Data, methods, and approach
To situate the findings from this study within the body of knowl-edge on the topic, it is critical to utilize methods that are consistentwith the published literature. Thus, this study utilizes techniqueswhich have influenced the current geomorphological thinking onchannel patterns and predictions of channel planform morphology.Data from large rivers were obtained from gauging station recordsin several countries (Table 2 and Fig. 3). The data include records aswell as measurements of bankfull discharge (Qbf) and mean annualflooding (Qmaf) for time-series, hydraulic geometry (w, d and v),median grain size (D50), slope, Froude number, stream power, andpercent of suspended or bed load in relation to total load. Channelpatterns were characterized by using topographic maps, hydrographicsurveys, and satellite imagery from several sources, including Landsat5 TM and Landsat 7 ETM+, CBERS (Chinese–Brazilian Satellite), GoogleEarth, Geocover, and JERS 1 (Synthetic Aperture Radar—SAR). Furtherdescription and referencing of these data sources are included below.
In addition to the author's original data obtained from governmentagencies, field work, and analysis of remote sensing imagery, data setsavailable from published articles were included in the analysis, whichincludes data from Franzinelli and Potter (1983), Mertes and Meade
Japura River basins (dashed areas) complete the list of the ten largest rivers (Fig. 1).

Table 2
Numberin Fig. 2
River Gauge station Channel pattern Drainagearea (km2)
Mean annualdischarge Qm
(m3/s)
Bankfulldischarge Qb
(m3/s)
Slope — S(cm/km)
Streampower(J s−1)
Specificstreampower(W/m2)
w/d Medianbed-size —
D50 (m)
1 Juruá Eurinepê Tortuous meandering 77,136 1783 3000 7.2 2118 9.76 18 0.00032 Juruá Santos Dumont Tortuous meandering 142,234 3980 7700 8 6041 16.7 24 0.00033 Purus Beaba (Cariuacanga) Tortuous meandering 347,147 9564 16,711 3.2 5244 7.6 35 0.00034 Purus Valparaíso Tortuous meandering 103,285 2088 6000 9.3 5472 18.8 24 0.00035 Purus Lábrea Tortuous meandering 220,351 5521 10,550 6.5 6725 14.7 27 0.0003– Fly Kuambjt gauging station Tortuous meandering 18,400 2355 3018 5 5001 15 26 0.0002– Mississippi Viscksburg Meandering 2,964,252 16,600 25,000 8 19,614 14.3 70 0.00046 Iça Ipiranga Meandering 108,362 7188 10,213 8.2 8213 10.2 75 0.00037 Paraguay Porto Murtinho Meandering 474,500 2376 3333 4 1111 3.8 20 0.0003– Yangtze From Chijiang to Ouchi Anabranching with
sinuous branches1,010,000 14,500 45,600 4.4 17,887 13.3 102 0.00025
8 Mamoré Guajará–Mirim Meandering upstreamGuajara
589,497 8154 14,700 9 12,974 15.2 75 0.0003
9 Madeira Abunã Anabranching 1,532,002 18,630 25,000 6 14,710 23 30 0.000310 Madeira Porto Velho Anabranching 954,285 19,039 30,000 4.3 12,651 17 33 0.000211 Madeira Manicoré Anabranching 1,157,516 25,538 42,000 4.1 16,887 19 35 0.000212 Madeira Fazenda Vista Alegre Anabranching 1,586,000 31,003 57,000 5.7 31,862 23.1 64 0.000213 Japura Acanauí Anabranching 242,259 14,333 21,000 3.6 8041 7.7 65 0.000414 Japura Vila Bittencourt Anabranching 197,136 13,758 20,000 4.1 8041 7,8 68 0.000415 Solimões Teresina Anabranching 983,157 45,366 60,000 3.8 22,359 10.35 127 0.000316 Solimões Santo Antonio do Içá Anabranching 1,134,540 55,538 70,000 3.4 23,340 10.9 110 0.000317 Solimões (Amazon) Itapeua Anabranching 1,769,000 82,069 90,000 1.6 14,112 13.6 24 0.000218 Solimões (Amazon) Manacapuru Anabranching 2,147,736 101,218 120,000 1.8 21,183 6.6 120 0.0002519 Amazon Jatuarana Anabranching 2,854,286 123,680 161,330 2.1 33,219 12.2 72 0.0002520 Upper Parana Porto Rico Anabranching 670,500 9700 12,300 11 13,268 11.5 68 0.000321 Parana Corrientes Anabranching- 1,950,000 19,170 27,330 4.9 13,123 8.81 110 0.000422 Parana Curtiembre Anabranching- 2,300,000 19,500 20,500 4.8 9643 7.25 111 0.000323 Parana Villa Urquiza Anabranching- 2,173,000 16,460 17,140 4.4 7390 5.6 112 0.0003– Brahmaputra Bahadurabad area Anabranching- 636,130 21,261 60,000 6.8 33,343 9.8 200 0.0002524 Araguaia Luis Alves Anabranching- 117,580 1621 3700 10 3628 7 76 0.000325 Araguaia Aruana Anabranching- 76,964 1200 3200 15 4707 12.2 64 0.000426 Araguaia São Felix Anabranching- 193,923 2700 6000 9.8 5766 9.2 83 0.000327 Orinoco Musinacio Anabranching- 1,705,383 28,723 64,600 6 34,763 19.6 101 0.0004– Yangtze Datong Anabranching-sinuous 1,705,000 25,023 87,204 9.3 79,477 26.4 130 0.00013
133E.M. Latrubesse / Geomorphology 101 (2008) 130–145
(1985), Nordin and Perez Hernandez (1989), Thorne et al. (1993),Biedenharn and Thorne (1994), Dietrich et al. (1999), Guyot et al.(1999), Amsler and Prendes (2000), Paoli and Schreider (2000), Orfeoand Stevaux (2002), Ramonell et al. (2002) and Rocha and Souza Filho(2005). ANA (National Agency of Water) provided historical series andother hydrologic data from Brazilian rivers.
2.1. Bed material size
The median particle size (D50, mm) of bed material was obtainedfrom field work on Brazilian rivers, and for other rivers was obtainedfrom the previously cited peer reviewed published literature (above).The D50 of large rivers is medium or fine sand with values varyingbetween 0.13 and 0.5 mm.
2.2. Data on bankfull discharge (Qbf)
Bankfull discharge was estimated using standard procedures (e.g.,Dunne and Leopold, 1998; Knighton, 1998), and was estimated forcross-sections at hydrologic gauging stations. This procedure wasapplied in all the Brazilian gauging stations where mean dailydischarges are in general available from about 1970. The observedlevel was also compared with the discharge recurrence interval dataobtained from the hydrological series at each station and the stagelevel compared to a distribution of peak daily discharges for eachrecorded year. Field survey was carried out in Manacapuru (SolimõesRiver), Guajara (Mamoré River), Aruana and Luiz Alves (AraguaiaRiver), Porto Velho and Abuna (Madeira River) and Porto Rico (UpperParana River) gauge stations. The average of the mean annual floodswas also used for comparison and calibration. Additionally, theestimated bankfull data were compared with estimates of recurrence
intervals from a Gumbell distribution. Bankfull data from Brahmapu-tra, Yangtze, Fly, Mississippi, Orinoco and Parana were obtained fromthe literature mentioned above.
2.3. Hydraulic geometry
The at-a-station hydraulic geometry data were analyzed using themethod proposed by Leopold and Maddock (1953), with width, depthand velocity expressed below as:
w ¼ aQb; d ¼ cQ f ; u ¼ kQm ð1Þ
where w = width; d = depth and u = mean velocity.Data were calculated for twenty-three Brazilian gauging stations.
Data from the Orinoco, Fly and additional data from the Parana wereobtained from Nordin and Perez Hernandez (1989), Dietrich et al.(1999) and Rocha and Souza Filho (2005), respectively.
2.4. Slope
Slope is the most problematic variable to accurately estimate forlarge rivers. Estimates of slope at bankfull stage were provided frompublished literature or calculated from hydraulic data using standardprocedures. The water-surface gradient of the Solimões–AmazonRiver has been estimated by using remote sensing data from theSeasat mission (Guzkowska et al., 1990) and TOPEX/POSEIDON (Birketet al., 2002), as well as water velocity profiles at specific locations(Dunne et al, 1998). The values are available for Santo Antonio do Iça,Itapeua and Manacapuru gauging stations from field work bygovernment agencies. Slope is not available, however, for othergauging stations along the Amazon. In such cases, slopewas estimated

Fig. 3. Location of the South American gauging stations. Numbers are in agreement with the numbered gauging stations in Table 2.
134 E.M. Latrubesse / Geomorphology 101 (2008) 130–145
by using the Manning technique, as adopted from the method used byDietrich et al., (1999) for the Fly River:
u ¼ d0:67S0:5=n: ð2Þ
Solving for the slope, (S), and replacing the mean velocity, u, andthe average depth (d), and width (w) obtained from the hydraulicgeometry relationships
u ¼ kQm and d ¼ cQf
gives
S ¼ kQmð Þ2n2= cQf� �1:33
or
S ¼ k2c−1:33Q 2m−1:33fð Þn2: ð3Þ
Applying Eq. (3) the slope was estimated for bankfull stage at thetwenty-three stations in Brazil, and, when possible, compared with
data obtained from other methods, such as recorded from theliterature or from personal field measurements.
A Manning's n of 0.03 was proposed for all the rivers with excep-tion of the Amazon where an n value of 0.025 was used. For largealluvial rivers as those of our data set, n values at bankfull are highlyconsistent with dominant narrow range that oscillates from 0.02 to0.035. The suggested roughness values (n) are inside the range ofestimates obtained in the Amazon River (Itacoatiara and Obidos) andMadeira River (Fazenda Vista Alegre) by Strasser et al., (2005).
The data obtained by this method at Manacapuru, Itapeua andSanto Antonio do Iça are inside the range of water gradient valuesestimated by the TOPEX POSEIDON satellite radar altimetry (Birketet al., 2002), and calculation fromwater velocity profiles (Dunne et al,1998). This comparison was used as a validation of the method toobtain slopes for other stations of the Amazon basin.
Hydraulic geometry estimations of slope were additionally com-pared with direct slope measures available on upper Parana andAraguaia by the author and collaborators and on the Orinoco River(Nordin and PerezHernandez,1989). Slope estimates for theMississippi,middle-lower Parana, Fly and Yangtze Rivers were available fromthe published literature.

Fig. 4. Meandering rivers. A) Purus River at Labrea (Qmean=5521 m3/s); B) Jurua River at Santo Dumont (Qmean=3980 m3/s); C) Mississippi at Vicksburg (Qmean=16,660 m3/s);D) Mamoré River upstream of Guajara Mirim (Qmean=8154 m3/s); E) Iça River at Ipiranga Novo (Qmean=7188 m3/s); F) Paraguay River at Porto Murtinho (Qmean=2376 m3/s.
135E.M. Latrubesse / Geomorphology 101 (2008) 130–145

136 E.M. Latrubesse / Geomorphology 101 (2008) 130–145
2.5. Width and depth
Values for width and depth were measured and estimated inseveral ways. Direct field measures are available at surveyed gaugingstations for all South American rivers reported in this study. As an
Fig. 5. Low sinuosity anabranching patterns. A) Solimões–Amazon immediately downstrea(Qmean~55,600m3/s); C) Amazon at Careiro Island, Jatuarana station (Qmean=123,680m3/s); D(Qmean=14,333 m3/s).
additional control, however, width measurements were obtainedfrom navigation charts and topographic maps to compare with directmeasurement at gauging stations (in the Amazon basin). For addi-tional comparison, the width data were estimated by applying thehydraulic geometry relations to bankfull discharges. This procedure
m of Itapeua; B) Solimões–Amazon at Fonte Boa downstream of Santo Antonio do Iça) Madeira River at Fazenda Vista Alegre (Qmean=31,000m3/s); E) Japura River at Acanaui

137E.M. Latrubesse / Geomorphology 101 (2008) 130–145
was applied to all the rivers in the Amazon basin and to the upperParana, the Paraguay, the Araguaia, and the Orinoco Rivers (Fig. 3).
For the Mississippi, Yangtze, Brahmaputra, and Parana, such datawere obtained from the published literature. In the lower Brahmapu-tra (downstream of Bahadurabad) and Mississippi Rivers the availablechannel width data were compared with measurements obtainedfrom analysis of Landsat 5 TM and Landsat 7 ETM+ satellite imagery.Considering the scale of the rivers and image resolution (15 m forLandsat 7 ETM+), the amount of error should be negligible. Indeed,satellite imagery is increasingly useful for such measurements of largerivers (Latrubesse et al., in press), and a more recent study has usedthe widely available public satellite imagery data source GoogleEarth® (Constantine and Dunne, 2008).
Depth values where obtained from the published literature(Yangtze, Brahmaputra, Mississippi) and from cross-section measure-ments at gauging stations for the South American rivers. Additionally,hydraulic geometry relations were used to estimate mean depth frombankfull discharge data and navigation charts, where available.
2.6. Stream power
Total stream power is an expression of the rate of potential energyexpenditure per unit length of channel, and is defined as
X ¼ γQs ð4Þ
where γ is the specific weight of the water, Q discharge and s is slope,whereas specific stream power is stream power per unit of channelwidth.
ω ¼ X=wð Þ ð5Þ
Because it is a direct product of discharge and slope, stream poweris closely related to sediment transport, bank erosion and rates oflateral migration (Nanson and Hickin, 1986; Knighton, 1998).
Fig. 6. The Solimões River at Manacapuru area. A) The main channel, B) large sand bar at lowIsland.
Ω and ω were calculated for all rivers at bankfull discharge(Table 2).
3. “Mega” rivers and anabranching channel patterns
The characteristics of the ten largest rivers are provided in Table 1.Mean annual discharge (Qmean) for each river was obtained from thelower-most gauging station. The data used to characterize the rivers atindividual gauging stations are reported in Table 2.
Of the ten largest rivers only the Mississippi, the smallest, has asingle-thread meandering channel (Fig. 4C). Rivers with Qmean slightlyhigher, such as the Parana and Japura rivers, clearly anabranch (Figs 5Eand 6A).
In the lower Mississippi w/d ratios can be ~70–90 (from Vicksburgto Natchez) (Fig. 4C) but before human modifications were as high as200 in some places (Schumm et al., 1994). In the Mississippi, “natural”sinuosity up to 1915 varied mainly from 1.3 to 2 (Schumm et al., 1994,from Fisk, 1944). Historic maps indicate that, prior to humanmodifications, the lower Mississippi had a substantial number ofsmall channel islands, especially in meander bends. This wasparticularly common in the middle reaches of the alluvial valley(Schumm et al., 1994), which underwent high rates of meander bendmigration (Hudson and Kessel, 2000). Nearly all bends included anisland or channel bar.
The Yangtze River at Yichang gauging station has a Qmean of~14,200 m3/s, and displays a complex multi-channel sinuous patternwhere it crosses a tectonically active basin, as can be observeddownstream from Chijiang (Wang et al., 2005). Several branches areindividually sinuous, but the overall pattern is multi-channel. Inothers downstream reaches the sinuosity of the Yangtze Riverincreases. But the pattern, however, is related to geologic (bedrockand structural) controls, confining the channel to a narrow valley,which does not permit the river to develop typical meanders and ananabranching pattern with sporadic islands prevail. Furthermore, theupper Solimões–Amazon at Fonte Boa has a complex multi-channel
water stage, C) exposure of channel cutbank, ~7 m high, at the head of Marchantaria

138 E.M. Latrubesse / Geomorphology 101 (2008) 130–145
sinuous pattern rather than a single meanders-thread, with a Qmean of55,000 m3/s and a Qbf of 70,000 m3/s (Fig. 5B).
As with meandering, braided rivers are not represented in megarivers. Islands are a characteristic element of large rivers but thesedivide the flow at discharges up to bankfull. This suggests thatindividual channels act as anabranches, as defined by Nanson andKnighton (1996), rather as channel bars within the same channelcross-section.
In general terms, the channel belt of anabranching rivers such asAmazon, Japura and Madeira, are relatively straight and have asinuosity for main and major secondary channels of b1.3 (Fig. 5). TheAmazon–Solimões River generally does not divide inmore than two orthree branches at the same location, flowing in between stronglyvegetated islands and generating episodic and large sand bars(Figs. 5A, B and 6). In some specific places secondary branches canbe relatively sinuous but are restricted to short lateral reaches (Merteset al, 1996; Latrubesse and Franzinelli, 2002). The Madeira River(Qmean=32,000 m3/s at the mouth), the main tributary of the Amazonas well as the Japura River (Qmean=18,600 m3/s at the mouth)
Fig. 7. Anabranching rivers with tendency towards braided pattern. A) lower Parana River dB) Brahmaputra at Baharudabad (Qmean=21,261 m3/s); C) Orinoco River at Musinacio (Qmea
mentioned above, show a few branches with relatively straightchannels with sinuosity of less and characteristic w/d ratios oscillatebetween 30 and 70 (Fig. 5D).
Numerous sand bars, however, can also be characteristic of someanabranching rivers, such as the Brahmaputra and Orinoco, whereextensive channel bars form and result in local channel braiding.Nevertheless, the overall pattern is anabranching, with large stablevegetated islands that do not seasonally adjust with annual flowvariability, as with unconsolidated sediments comprising bars in abraided river. Examples of anabranching patterns with large islandsand sand bars resembling braiding patterns are shown in Fig. 7.Several reaches of the Brahmaputra River (Fig. 7B) (Bristow, 1987,Sarma, 2005) as well as the Middle Parana River in Argentina (Figs. 7Aand 8) are in this category, which includes very high w/d ratios whichexceed frequently 200. Bed load represent approximately 15% of thetotal load in Brahmaputra (Goswamy, 1989, Sarma 2005) and 17% inthe middle Parana (Ramonell et al., 2002).
The Orinoco River shows a less complex pattern with a few islandsand several sand bars as can be observed at Musinacio area (Fig. 7C)
ownstream of Santa Fe (downstream Villa Urquiza gauge station) (Qmean=16,400 m3/s);n= 28,723 m3/s); D) Araguaia River at Luiz Alves (Qmean=3700 m3/s).

Fig. 8. The anabranching pattern of the Middle Parana River near Santa Fe (downstream Villa Urquiza gauging station).
139E.M. Latrubesse / Geomorphology 101 (2008) 130–145
where the Qmean is ~28,700 m3/s. The two largest rivers drainingdominantly Precambrian rocks in tropical rainforest, the Congo inAfrica and the Negro in South America, generate substantial fluvialarchipelagos (Fig. 9). Nevertheless, these rivers display an intricatemulti-channel pattern and complex floodplains that have lowsuspended sediment loads relative to the very large discharge values(Table 1). A substantial part of these river channels are controlled bygeology (structures and bedrock) and do not generate broad flood-plains. As noted above, however, tectonic blocks permit the devel-opment of impressive fluvial archipelagos that exceed 15 km inwidth and extend for hundreds of kilometers. These rivers were notincluded in the database because of the lack of hydrologic andhydraulic data for multi-channel reaches, and because a considerableamount of the floodplain, representing the older Quaternary flood-plain geomorphology, is unrepresentative of the modern system(Latrubesse and Franzineli, 2005). Briefly, these rivers have a broad
Fig. 9. Mega complex anabranching rivers. A) the Congo River between Mobenga and Mokanat these reaches, however taking account data from gauging station located upstream aQmeanN17,000 m3/s).
range of w/d ratios, ranging from 400 in large channels to 20 insecondary channels.
4. Discriminating channel patterns
4.1. The discharge/slope approach
The most commonly accepted approaches to discriminate channelpatterns include discharge (Q) and slope (S) (Leopold and Wolman,1957, Lane 1957).
Leopold and Wolman (1957) proposed that:
S ¼ 0:013Q−0:44bf
whereQbf is the bankfull discharge and S is the channel slope.
gamoi B) the Negro river at Barcelos, Mariuá archipelago (no gauging stations availablend downstream, the river reaches are inside the classification of mega rivers with

Fig. 11. Lane (1957) slope/mean annual discharge diagram to discriminate channelpatterns. The figure shows an enlarged area where large rivers plot.
140 E.M. Latrubesse / Geomorphology 101 (2008) 130–145
Fig. 10-A shows the data plotted by Leopold and Wolman (1957)with additional data on anastomosing rivers (Knighton and Nanson1993), which plot well below the original curve.
Several criticisms have risen on the validity of this approach, as forexample:
• The braiding meander transition should be less dependent ofbankfull discharge than suggested in the original diagram andgrain size also could depend on median grain size, D50 (Carson 1984,Ferguson, 1987).
• In sinuous rivers, valley slope should be used rather than channelslope because the latter is directly influenced by sinuosity and, thus,does not represent a true independent variable (Carson, 1984, Vanden Berg, 1995, Bridge, 2003).
• Empirical data from anastomosing rivers plot below the trend line(Knighton and Nanson, 1993), with the implication that banksediments are as important as slope in producing changes inchannel pattern (Schumm, 1977; Simpson and Smith, 2001).
The concentration of data in the Leopold and Wolman diagram isfor small rivers less than 400 m3/s to bankfull. The data set of Leopoldand Wolman (1957) only include a few data points representing largerivers with a QbfN5000m3/s (Fig. 10A). Only three points are plotted inthe original figure for rivers with a Qbf of more than 10,000 m3/s,which plot below the trend line (two are meandering and onebraided). The three points plotting above the trend line are for the KosiRiver in India, which generates a fluvial mega fan in the Himalayanpiedmont. The large “bankfull” discharge of the Kosi River is notcharacteristic of a large river because it is a product of the monsoonaleffect (see discussion of effective discharge, Section 7) in an active and
Fig. 10. A) The Leopold and Wolman (1957) slope/bankfull discharge diagram todiscriminate channel patterns, including the plot of anabranching rivers by Knightonand Nanson (1993). The squared area indicates the location of the large rivers plotted inFig. 5B. B) enlarged area of the diagram of Leopold and Wolman.
avulsive alluvial fan. The other three points below the trend lineplotted by Leopold and Wolman (1957) are for the Ganges River nearPatna, the Mississippi near Blytheville, and the Yukon River near HolyCross, Alaska. Thus, the original relation developed by Leopold andWolman (1957) is not sensitive enough to discriminate channelpatterns for large rivers. Fig. 10B shows an enlargement of this figurefor rivers of more than 1500 m3/s, with the majority of data for riverswith a Qbf that exceeds 5000 m3/s. The revised values of sinuous riversare plotted as values corrected to valley slope (Sv).
Despite the slope correction, the entire group of large rivers plotbelow the Leopold and Wolman trend line (1957), and cannot be dis-criminated in relation to channel pattern. The tendency is that slope(s) decrease as discharge increases, but it is not possible to distinguishchannel styles.
Large rivers have very low slopes, b0.0002, and the largest rivershave slopesb0.0001. The only large river plotted close to the discrim-inating curve is the Yangtze River at Datong, where, as explainedabove, geological control causes the slope to be near 0.0001 at bank-full discharge.
Fig. 11 shows the trend line produced by Lane (1957) to discrim-inate channel patterns relating Qmean and slope, where:
Sb0:007Q−0:25m for meandering; sand� bed channels
0:0041Q−0:25m NSb0:007Q−0:25
m meandering–braiding transition
SN0:0041Q−0:25m braided; sand� bed channels:
To summarise, the trend lines utilized for the analysis of channelpatterns are not useful (Fig. 11) to discriminate channel patterns forvery large rivers. All rivers with a Qmean discharge higher than~17,000 m3/s are anabranching systems. These “mega” rivers plot inan exclusive “anabranching field” and have channel slopes less0.00007 (Fig. 11).
4.2. The sediment load approach
Schumm (1977, 1985) suggested that the type of sediment load is amajor control of channel pattern because it controlsw/d and sinuosity(Table 3). Bed load rivers are generally characterized as highly activeand low sinuosity channels that exhibit a braided channel pattern.Suspended sediment load dominated rivers are characterized by asingle channel with a higher sinuosity, and stable banks because ofcohesive fine-grained deposits. Mixed load rivers exhibit intermediateproperties. Criticisms of the Schumm (1977, 1985) approach weremade because it was noted that sinuous single thread river channelscan be generated for sandy or gravely systems (Van den Berg, 1995,Lewin and Brewer, 2001, Bridge, 2003), and because it is also not clear

Table 3
Type of channel Sedimentary load and bed load as% of total load
w/d ratio Sinuosity Slope Characteristic rivers
Meandering Sinuous–tortuous Suspended load dominant, bed loadb2% of total load
~15–30 Usually N2 AlwaysVerygentle
Jurua, Purus and Fly
Meandering with tendency toanabranching and others
Suspended load variable and bedload dominated by sand which canbe up to 10% of total load
Variable andcan be up tomore than 200
Usually b2..3 Mississippi, Iça,lower Paraguay,lower Mamoré, lower Ucayali
Anabranching Low to moderateanabranching-low sinuosity
Simples to moderateanabranching-lowsinuosity
Suspended load dominant, b5% ofbed load
From 20 togenerally N100
b1,5, occasionalsecondary branchessinuous or not
Madeira, JapuraAmazon
Anabranching withtendency to Braided
Significant bed load N10 % and upto 35% of total load
Generally morethan 100
Some branches canbe sinuous
Brahmaputra, Orinoc,Parana and Araguaia
Complex anabranching archipelagos Insignificant amount of suspendedload. Relatively high bed load whencompared with the low suspendedload amounts they carried
Generally morethan 100
Not relevant Negro, Congo
141E.M. Latrubesse / Geomorphology 101 (2008) 130–145
what criteria the methods were used to define the percentages of bedload in relation to the total load to discriminate channel patterns. Forexample, Baker (1978) studying rivers in the Amazon basin and Pickup(1984) studying the Fly River demonstrated that the empiricalequations proposed by Schumm (1977, 1985) were not adequate tocharacterize those systems.
Schumm's classification does not applywell to large rivers (Tables 3and 4). For example, rivers in Schumm's (1977, 1985) classificationwould be defined as “suspended load rivers” and have a high sinuosityand tortuous and complex meanders, as those in South-westernAmazon lowland (Purus, Jurua) transport ~98% of wash load have w/dratios between 18 and 35 (Fig. 4A and B). Additionally, the Amazon,and several large tributaries, such as theMadeira and Japura, transport~95% wash load and 2 to 5% sandy bed load (Gibbs, 1967, Mertes andMeade, 1985) and would be classified as suspended or mixed loadrivers. These rivers, however, are anabranching (Fig. 5) with lowsinuosity values, and the w/d values exceed 20, with several greaterthan 100. The classification also does not consider large complexanabranching rivers with very low sediment loads (suspended or bedload), such as the Congo or Negro Rivers (Fig. 9) where w/d can rangefrom 20 to 400. Further, rivers such as Parana, Brahmaputra, andOrinoco as well as minor rivers such as the Araguaia would becategorized as bed load rivers by Schumm's (1977, 1985) criteriabecause the rivers transport greater than 11% of the total load as bedload. These systems, however, are anabranching with multiple islandsand bars and do not generate typical braided patterns (Figs. 7 and 8).
Alternatively, Schumm's classification assumes that slope is relatedto the type of sediment transport. For instance, channel patternsshould be related to the calibre of the bed sediments. Large rivers withsimilar slopes and similar grain sizes, however, generate a variety ofchannel patterns from meandering to a set of anabranching patterns.Table 4 presents a synthesis of main characteristics of the large riversanalyzed in this paper.
Table 4
Type ofchannel
Bed load as%total load
w/d ratio Sinuosity Slope Channel patte
Suspendedload
b3 b10 Usually N2 Relatively gentlegradient
Meandering-t
Mixed load 3–11 10–40 1.3–2 Moderate gradient Meandering-h
Bed load N11 N40 b1.3 Relatively steepgradient
Braided
4.3. Stream power and grain size
Van den Berg (1995) postulated that the threshold slope forbraiding also depends on the grain size of the bedmaterial and plottedspecific stream power against median grain size (Fig. 12A).
The study was based on an analysis of 228 data points obtainedfrom rivers spanning a diversity of climatic and physical settings. Thestudy employed valley slope as an alternative to channel slope, aregime-based estimate of channel width, and bankfull discharge. Thisgenerated the discriminating function of,
ω ¼ 900D0:4250 ð6Þ
where ω is specific stream power at the transition between single-thread and multi-thread channels and D50 = median diameter of thebed material.
While the approach has been widely utilized, it has been criticized(Lewin and Brewer, 2001, 2003) based on the notion that regime-based estimates of channel width result in exaggerated values ofspecific stream power (Lewin and Brewer, 2001, 2003).
Of note is that the data set concentrates on rivers with more than25 W/m2, and values of D50N0.5 mm. In contrast, large rivers have aD50b0.5 mm, and specific stream powerb25W/m2. Only 19 of the 228data points of Van den Berg (1995) are for rivers with D50 less than0.5 mm. Thus, the Van den Berg (1995) equation is not suitable fordiscriminating channel patterns in large systems (Fig. 12B). For largerivers, single and anabranching patterns plot on a very restricted areabecause large alluvial rivers have a narrow range of grain sizes withD50 mainly between 0.1 and 0.5 mm, and specific stream power ischaracteristically b25 W/m2. As observed in Table 2, all large alluvialrivers have medium to low values of stream power that range from ~3to 25 W/m2. A similar approach to the Van den Berg (1995) study wastaken by Bledsoe and Watson (2001) by plotting SvQ0,50 against D50.
rn Some main problems for large river
ortuous Rivers considered suspended load with tortuous meander have w/d ratiosvarying from 18 to 35. River with b3% of bed load can generate lowanabranching-low sinuosity patterns with very gentle slopes
armonic Rivers with up to 11% of bed load can generate a variety of anabranchingpatterns to slopes as lower as “suspended load” rivers. w/d ratio can reachvalues as higher as more than 100. Rivers generating harmonic meanderscan have w/d ratios as high as 200.Anabranching rivers with tendency to braided have very gentle slopes. Nopure braided patterns are founded in large rivers.

Fig. 12. A) Van den Berg (1995) diagram of channel pattern in relation to grain size andspecific stream power. The square identifies the large rivers. B) Enlarged area of Fig. 5A.
142 E.M. Latrubesse / Geomorphology 101 (2008) 130–145
Because the low D50 variability, however, this function was notsuitable for discriminating the channel patterns of large rivers.
4.4. Theoretical analysis of channel stability
Several authors proposed that channel pattern is controlled by acombination of width, depth, slope and Froude number (Fr), withParker (1976) suggesting discrimination on the basis of on w/d≈Fr /S.Bridge (1993) observed that the braiding criterion of Parker does notagree well with field data. The data show that large rivers plot in theParker diagram in the restricted region relating to meandering and
Fig. 13. Parker's (1976) diagram to discriminate straight, meandering, and braidedrivers. The degree of braiding is defined in terms of slope/Froude number and d/wratios.
transitional to straight (Fig. 13). For large rivers d/w oscillated mainlybetween 0.05 and 0.007, and the values of the relation Slope/Froudenumbers are very low, restricted between 0.00012 and 0.0014. Meanvelocity for several cross-sections to bankfull varied between 1 and2 m/s and slope was very low. Data obtained by Richardson andThorne (2001) for the Brahmaputra River plot in a similar position.
The largew/d values greater than 20 for large rivers could promoteflow separation and the generation of new channel branches. As indi-cated also by Fredsoe (1978) and Fukuoka (1989), w/d probably is amajor control for braiding. The value of w/dN50 for braiding patterngeneration as suggested by Fredsoe (1978), however, is too large.Alternatively, singlemeandering channels can bemaintainedwithw/dratiosN50.
By employing the Fukuoka equation S0,2 w/d≈10–20 with originalfield data for the meandering–braided transition (S = slope), nearly allof the large rivers could have w/d estimated values of b13.
4.5. Predicting the bifurcation of single channels
The preceding analysis shows that anabranching patterns aremorecharacteristic of large rivers, and particularly of mega rivers. In anattempt to identify the mechanisms in association with the formationof anabranches for the Brahmaputra River, Richardson and Thorne(2001) related specific energy (E) to depth/width ratio (d/w) forseveral cross-sections, where specific energy is defined as,
E ¼ v2=2g� �þ d ð7Þ
and d = mean depth of water (m); v = mean velocity (m/s) and g =acceleration because gravity (m/s2). The authors plotted two series ofdata, one from single-thread flows and the other second from multi-thread flowswith the threshold between the two series defined by thepower relation:
E ¼ 46:6 d=wð Þ0:39: ð8Þ
They concluded that multi-thread channels have higher values ofspecific energy for a given d/w ratio. The problem is that, for large rivers,specific energy becomes almost entirely a surrogate for depth such thatin the discriminating relationship d plotted against d/w becomes invalid(Fig.14). Indeed, for the study datamean depth oscillates between 6 and~43 m. For this reason the term (v2/2g) is irrelevant.
5. The hydraulic geometry of large rivers
At-a-station hydraulic geometry relates adjustments in cross-sectional alluvial channel morphology to changes in discharge
Fig. 14. Large rivers shown by plotting specific energy in relation to depth:width ratio asproposed by Richardson and Thorne (2001). The curve indicates the threshold betweensingle-thread flows and multi-thread flows as found in the Brahmaputra River.
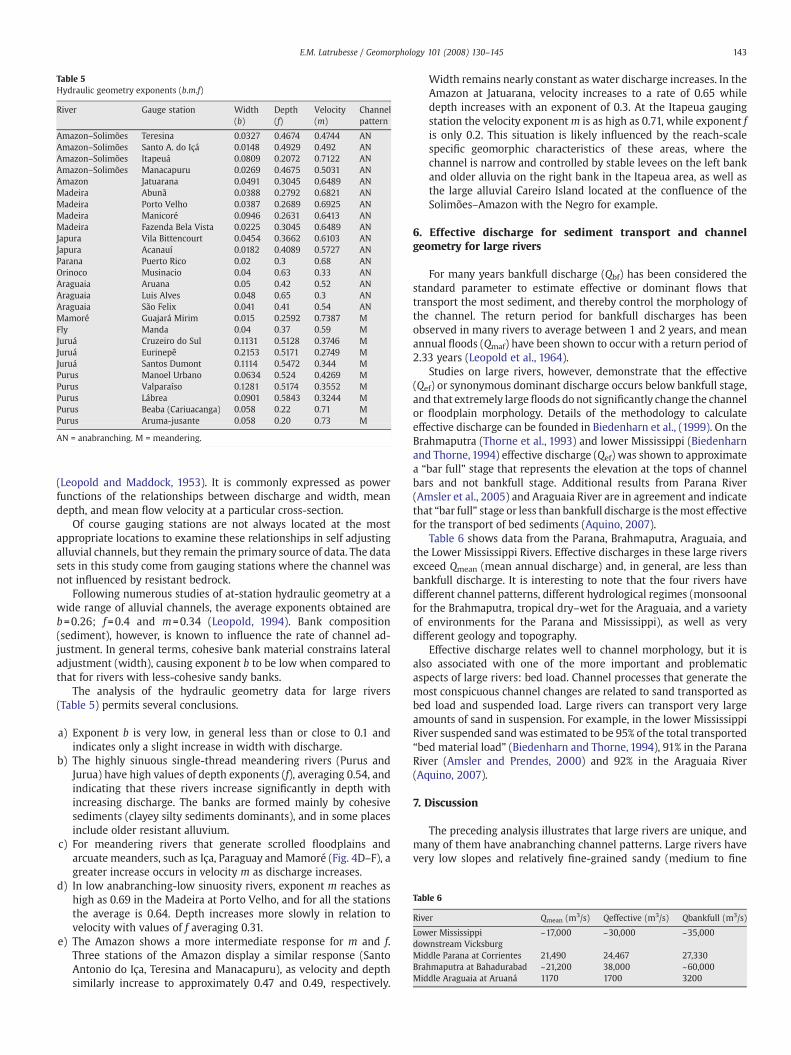
Table 5Hydraulic geometry exponents (b.m.f)
River Gauge station Width(b)
Depth(f)
Velocity(m)
Channelpattern
Amazon–Solimões Teresina 0.0327 0.4674 0.4744 ANAmazon–Solimões Santo A. do Içá 0.0148 0.4929 0.492 ANAmazon–Solimões Itapeuá 0.0809 0.2072 0.7122 ANAmazon–Solimões Manacapuru 0.0269 0.4675 0.5031 ANAmazon Jatuarana 0.0491 0.3045 0.6489 ANMadeira Abunã 0.0388 0.2792 0.6821 ANMadeira Porto Velho 0.0387 0.2689 0.6925 ANMadeira Manicoré 0.0946 0.2631 0.6413 ANMadeira Fazenda Bela Vista 0.0225 0.3045 0.6489 ANJapura Vila Bittencourt 0.0454 0.3662 0.6103 ANJapura Acanauí 0.0182 0.4089 0.5727 ANParana Puerto Rico 0.02 0.3 0.68 ANOrinoco Musinacio 0.04 0.63 0.33 ANAraguaia Aruana 0.05 0.42 0.52 ANAraguaia Luis Alves 0.048 0.65 0.3 ANAraguaia São Felix 0.041 0.41 0.54 ANMamoré Guajará Mirim 0.015 0.2592 0.7387 MFly Manda 0.04 0.37 0.59 MJuruá Cruzeiro do Sul 0.1131 0.5128 0.3746 MJuruá Eurinepê 0.2153 0.5171 0.2749 MJuruá Santos Dumont 0.1114 0.5472 0.344 MPurus Manoel Urbano 0.0634 0.524 0.4269 MPurus Valparaíso 0.1281 0.5174 0.3552 MPurus Lábrea 0.0901 0.5843 0.3244 MPurus Beaba (Cariuacanga) 0.058 0.22 0.71 MPurus Aruma-jusante 0.058 0.20 0.73 M
AN = anabranching. M = meandering.
Table 6
River Qmean (m3/s) Qeffective (m3/s) Qbankfull (m3/s)
Lower Mississippidownstream Vicksburg
~17,000 ~30,000 ~35,000
Middle Parana at Corrientes 21,490 24,467 27,330Brahmaputra at Bahadurabad ~21,200 38,000 ~60,000Middle Araguaia at Aruaná 1170 1700 3200
143E.M. Latrubesse / Geomorphology 101 (2008) 130–145
(Leopold and Maddock, 1953). It is commonly expressed as powerfunctions of the relationships between discharge and width, meandepth, and mean flow velocity at a particular cross-section.
Of course gauging stations are not always located at the mostappropriate locations to examine these relationships in self adjustingalluvial channels, but they remain the primary source of data. The datasets in this study come from gauging stations where the channel wasnot influenced by resistant bedrock.
Following numerous studies of at-station hydraulic geometry at awide range of alluvial channels, the average exponents obtained areb=0.26; f=0.4 and m=0.34 (Leopold, 1994). Bank composition(sediment), however, is known to influence the rate of channel ad-justment. In general terms, cohesive bank material constrains lateraladjustment (width), causing exponent b to be low when compared tothat for rivers with less-cohesive sandy banks.
The analysis of the hydraulic geometry data for large rivers(Table 5) permits several conclusions.
a) Exponent b is very low, in general less than or close to 0.1 andindicates only a slight increase in width with discharge.
b) The highly sinuous single-thread meandering rivers (Purus andJurua) have high values of depth exponents (f), averaging 0.54, andindicating that these rivers increase significantly in depth withincreasing discharge. The banks are formed mainly by cohesivesediments (clayey silty sediments dominants), and in some placesinclude older resistant alluvium.
c) For meandering rivers that generate scrolled floodplains andarcuate meanders, such as Iça, Paraguay and Mamoré (Fig. 4D–F), agreater increase occurs in velocity m as discharge increases.
d) In low anabranching-low sinuosity rivers, exponent m reaches ashigh as 0.69 in the Madeira at Porto Velho, and for all the stationsthe average is 0.64. Depth increases more slowly in relation tovelocity with values of f averaging 0.31.
e) The Amazon shows a more intermediate response for m and f.Three stations of the Amazon display a similar response (SantoAntonio do Iça, Teresina and Manacapuru), as velocity and depthsimilarly increase to approximately 0.47 and 0.49, respectively.
Width remains nearly constant as water discharge increases. In theAmazon at Jatuarana, velocity increases to a rate of 0.65 whiledepth increases with an exponent of 0.3. At the Itapeua gaugingstation the velocity exponentm is as high as 0.71, while exponent fis only 0.2. This situation is likely influenced by the reach-scalespecific geomorphic characteristics of these areas, where thechannel is narrow and controlled by stable levees on the left bankand older alluvia on the right bank in the Itapeua area, as well asthe large alluvial Careiro Island located at the confluence of theSolimões–Amazon with the Negro for example.
6. Effective discharge for sediment transport and channelgeometry for large rivers
For many years bankfull discharge (Qbf) has been considered thestandard parameter to estimate effective or dominant flows thattransport the most sediment, and thereby control the morphology ofthe channel. The return period for bankfull discharges has beenobserved in many rivers to average between 1 and 2 years, and meanannual floods (Qmaf) have been shown to occur with a return period of2.33 years (Leopold et al., 1964).
Studies on large rivers, however, demonstrate that the effective(Qef) or synonymous dominant discharge occurs below bankfull stage,and that extremely large floods do not significantly change the channelor floodplain morphology. Details of the methodology to calculateeffective discharge can be founded in Biedenharn et al., (1999). On theBrahmaputra (Thorne et al., 1993) and lower Mississippi (Biedenharnand Thorne, 1994) effective discharge (Qef) was shown to approximatea “bar full” stage that represents the elevation at the tops of channelbars and not bankfull stage. Additional results from Parana River(Amsler et al., 2005) and Araguaia River are in agreement and indicatethat “bar full” stage or less than bankfull discharge is themost effectivefor the transport of bed sediments (Aquino, 2007).
Table 6 shows data from the Parana, Brahmaputra, Araguaia, andthe Lower Mississippi Rivers. Effective discharges in these large riversexceed Qmean (mean annual discharge) and, in general, are less thanbankfull discharge. It is interesting to note that the four rivers havedifferent channel patterns, different hydrological regimes (monsoonalfor the Brahmaputra, tropical dry–wet for the Araguaia, and a varietyof environments for the Parana and Mississippi), as well as verydifferent geology and topography.
Effective discharge relates well to channel morphology, but it isalso associated with one of the more important and problematicaspects of large rivers: bed load. Channel processes that generate themost conspicuous channel changes are related to sand transported asbed load and suspended load. Large rivers can transport very largeamounts of sand in suspension. For example, in the lower MississippiRiver suspended sandwas estimated to be 95% of the total transported“bed material load” (Biedenharn and Thorne, 1994), 91% in the ParanaRiver (Amsler and Prendes, 2000) and 92% in the Araguaia River(Aquino, 2007).
7. Discussion
The preceding analysis illustrates that large rivers are unique, andmany of them have anabranching channel patterns. Large rivers havevery low slopes and relatively fine-grained sandy (medium to fine

144 E.M. Latrubesse / Geomorphology 101 (2008) 130–145
sand) bed load. As response to adjustments to changes in discharge ata cross-section, width remains remarkably constant in analysis ofhydraulic geometry.
Large alluvial rivers have very lowslopes,b0.00015, for greater than athousand kilometers upstream of the ocean. To transport high dischargeand sediment loads over such great distances with low gradients, thesystemmaximizes efficiency by limiting channel width andmaximizingflow depth and velocity. As proposed by Nanson and Huang (1999) andHuang and Nanson (2007), this can be achieved by the introduction ofislands. Considering the limitations of slope adjustments, large rivershydraulically force discharge and sediment transport.
Considering that hydraulic geometry is related to discharge someconclusions can be raised. The results illustrate that rivers with a Qmean
of ~17,000m3/s generate either single thread or anabranching channels.Beyond this threshold, only anabranching systems can achieve efficientways to move water and sediment over exceptionally low gradients.In mega rivers with QmeanN17,000 m3/s, slope is typically less than0.00007 and inmany places less than 0.00003 to values close to 0 (zero).In this extreme condition, the rivers do not generate meanders.
If applying the concept of a channel pattern continuum, straight,meandering and braided, the end member pattern for large alluvialrivers is anabranching. Considering the Mississippi River as theultimatemeandering channel, no additional “pure”meandering singlechannel rivers exist with a mean annual dischargeN~17,000 m3 s−1.These systems were classified in this paper as “mega” rivers, with athreshold Qmean, available for all rivers.
When analyzing large rivers with N1000 m3/s, several interestingconclusions can be raised.
Most current methods, proposed to discriminate channel patternbased on the analysis of variables such as slope, grain size, bankfulland others, are not useful when applied to large rivers.
The hydraulic geometry, very low slopes, and minor variability ofgrain size in large rivers indicates that, although meandering patternsare present, intrinsic characteristics of discharge and largew/d relation-ships favour the development of anabranching patterns. Additionalresearch is needed, however, to discriminate the variables that controlchannel pattern. New and additional approaches are needed to classifyand understand large anabranching rivers, and the response andmechanisms that control the generation of multiple river branches.
Considering that w/d ratios are high for the different channelspatterns, additional methodological alternatives to this parametershould be developed. In particular it would be useful to relate thisapproach with effective discharge, taking account of the geomorpho-logic importance of bar full and bankfull discharges, and channel–floodplain interactions.
8. Final comments
Because of the close association between channel style, floodplainmorphology, and alluvial architecture, it is important to understandthe mechanisms that generate floodplains in large rivers. Duringrecent decades, facies models were built on the basis of a few activefluvial systems, and in many cases from small to medium size rivers.Present-day analogues of fluvial models used for understandingancient sedimentary sequences remain poorly developed and areincomplete (Miall, 1996, Latrubesse et al., 2005). Nevertheless, one ofthe implications of this study concernsmodeling. The results from thisanalysis clearly suggest that it is not yet possible to “scale up” fromdata sets developed on small rivers or laboratory flumes to theextensive “mega” rivers considered in this study. Indeed, a majorconstraint to understanding older fluvial sequences is that thetheoretical and empirical base of knowledge of fluvial geomorphologywas built on extensive data sets of much smaller rivers, and a poor setof geomorphologic information exists for large rivers. It is fundamen-tally important that conceptual and quantitative models be developedfor large river systems from field based data sets.
Acknowledgements
I want to thank many friends that contributed to my geomorpho-logic perspective on large rivers such as J.C. Stevaux, C. Ramonell, M.Amsler, M. Iriondo, R. Meade, V. Baker, G. Nanson, Z. Chen, L. Mertes, T.Dunne, R. Sinha, E. Franzinelli, Mario Assine among others. I also wantto especially thank Z. Chen, Paul Hudson, Mike Blum, M. Amsler and R.Sinha for providing data and comments from the Yangtze, Mississippi,Parana and Brahmaputra rivers. I am very appreciative of the invalu-able help from Samia Aquino with processing of hydrological data.I am particularly grateful to Paul Hudson for his editorial commentsand suggestions. Finally, special thanks to Gerald Nanson for a detailedand fundamentally critical review of the analysis, and for highly valu-able comments that significantly improved the study.
References
Amsler, M., Prendes, H., 2000. Transporte de sedimentos y procesos fluviales asociados.In: Paoli, C., Schreider, M. (eds.) El Río Paraná en su tramo medio. Centro dePublicacions Universitarias, Universidad Nacional del Litoral, Santa Fe, Argentina,233–306.
Amsler, M., Ramonell, C., Toniolo, H., 2005. Morphologic changes in the Parana Riverchannel (Argentina) in the light of the climate variability during the 20th century.Geomorphology 70, 257–295.
Aquino, S., 2007. Mecanismos de Transmissão de Fluxos de Água e Sedimentos em doisGrandes Rios Aluviais Impactados pela Atividade Humana: o Araguaia e o Paraná.Unpublished PhD Thesis, Maringa State University, Maringa, Brazil, 134 p.
Baker, V., 1978. Adjustment of fuvial systems to climate and source terrain in tropicaland subtropical environments. In: Miall, A.D. (Ed.), Fluvial Sedimentology, vol. 5.Memoir-Canadian Society of Petroleum Geologists, pp. 211–230.
Biedenharn, D., Thorne, C., 1994. Magnitude–frequency analysis of sediment transportin the lower Mississippi River. Regulated Rivers: Research and Management 9,237–251.
Biedenharn, D., Thorne, C., Soar, P.J., Hey, R.D., Watson, Ch.C., 1999. A practical guide toeffective discharge calculation (Appendix A). In: Watson, Ch.C., Biedenharn, D.,Torne, C. (Eds.), Demonstration Erosion Control-Design Manual. U.S. Army Corps ofEng., Vicksburg, Mississippi, USA.
Birket, C., Mertes, L., Dunne, T., Costa, M., Jasinski, M., 2002. Surface water dynamics inthe Amazon basin: application of satellite radar altimetry. Journal of GeophysicalResearch 107. doi:10.1029/2001JD000609.
Bledsoe, B.,Watson, Ch., 2001. Logistic analysis of channel pattern thresholds:meandering,braiding and incising. Geomorphology 38, 281–300.
Bridge, J., 1993. The interaction between channel geometry, water flow, sedimenttransport and deposition in braided rivers. In: Best, J.L., Bristow, C.S. (Eds.), BraidedRivers. Geological Society Special Publication, vol. 75, pp. 13–72. UK.
Bridge, J.S., 2003. Rivers and Floodplains: Form, Process, and Sedimentary Record.Blackwell Science, Oxford. 491 pp.
Bristow, C.S., 1987. Brahmaputra River: channel migration and deposition. In: Ethridge,F.G., Flores, R.M., Harvey, M.D. (Eds.), Recent Development in Fluvial Sedimentology.Soc. Eco. Paleo. Miner. Spec. Publ., vol. 39, pp. 63–74.
Carson, M.A., 1984. The meandering-braided threshold: a reappraisal. Journal ofHydrology 73, 315–334.
Constantine, J.A., Dunne, T., 2008. Meander cutoff and the controls on the production ofoxbow lakes. Geology 36, 23–26.
Dietrich, W., Day, G., Parker, G., 1999. The Fly River, Papua New Guinea: inferences aboutriver dynamics, floodplain sedimentation and fate of sediment. In: Miller, A., Gupta,A. (Eds.), Varieties of Fluvial Forms. Wiley, pp. 345–376.
Dunne, T., Leopold, L., 1998. Water in Environmental Planning. Freeman. 818 pp.Dunne, T., Mertes, L., Meade, R., Richey, J., Forsberg, B., 1998. Exchanges of sediment
between the floodplain and channel of the Amazon River in Brazil. GSA Bull. 110 (4),450–467.
Ferguson, R.I., 1987. Hydraulic and sedimentary controls of channel patterns. In: Richards,K.S. (Ed.), River Channel: Environment and Processes. Blackwell, pp. 125–158.
Fielding, C.R., 2007. Sedimentology and stratigraphy of large river deposits: recognitionin the ancient record, and distinction from “incised valley fills. In: Gupta, A. (Ed.),Large Rivers: Geomorphology and Management. John Wiley & Sons, pp. 97–114.
Filizola, N.P., 1999. O fluxo de sedimentos em suspensão nos rios da bacia AmazônicaBrasileira. ANEEL, Brasilia. 63pp.
Fisk, H.N., 1944. Geological investigation of the alluvial valley of the lower MississippiRiver. Army Corps of Engineers, Vicksburg, Mississippi, U.S., p. 78 (plus plates).
Franzinelli, E., Poter, P., 1983. Petrology, chemistry and texture of modern river sands,amazon river system. Journal of Sedimentary Petrology 27, 3–26.
Fredsoe, J., 1978. Meandering and braided rivers. Journal of Fluid Mechanics 84,609–624.
Fukuoka, S., 1989. Finite amplitude development of alternate bars. In: Ikeda, S., Parker,G. (Eds.), River Meandering. Water Resource Monographs, vol. 12. AmericanGeophysical Union, pp. 237–265.
Gibbs, R., 1967. The geochemistry of the Amazon rivers system: Part1. The factors thatcontrol the salinity and the composition and concentration of the suspended solids.Geological society of American Bulletin 78, 1203–1232.

145E.M. Latrubesse / Geomorphology 101 (2008) 130–145
Goswamy, D., 1989. Estimation of bedload transport in the Brahmaputra River. AssamJournal Earth Science 15 (1), 14–26.
Gupta, A., 2007. Introduction. In: Gupta (Ed.), Large Rivers: Geomorphology andManagement. John Wiley & Sons.
Guyot, J.L., Jouanneau, J.M.,Wasson, J.G.,1999. Characterization of river bed and suspendedsediments in the Rio Madeira drainage basin (Bolivia–Amazonia). Journal of SouthAmerican Earth Sciences 12, 401–410.
Guzkowska, M.A., Rapley, C., Ridley, J., Cudlip, W., Birket, C. and Scott, R., 1990.Developments in inland water and land altimetry, ESA Contract, CR-7839/88/F/FL
Huang, H.Q., Nanson, G., 2007. Why some alluvial rivers develop an anabranchingpattern. Water Resources Research 43.
Hudson, P.F., Kessel, R.H., 2000. Channel migration and meander-bend curvature in thelower Mississippi River prior to major human modification. Geology 28, 531–534.
Jansen, J., Nanson, G., 2004. Anabranching and maximum flow efficiency in MagelaCreek, northern Australia. Water Resources Research 40.
Junk, W.J., Bayley, P.B., Sparks, R.E., 1989. The flood pulse concept in river-floodplainsystems. In: Dodge, D.P. (Ed.), Proceedings of the International Large RiverSymposium (LARS). Canadian Special Publications of Fish and Aquatic Sciences,vol. 106, pp. 110–127.
Kellerhalls, R., Church, M., 1990. . The morphology of large rivers:characterization andmanagement. In: Dodge, D.P. (Ed.), Proc. Int. Large Rivers Symposium. CanadianSpec. Publ. Fisheries and Aquatic Sciences, vol. 106, pp. 31–48.
Knighton, D., 1998. Fluvial Forms and Processes — A New Perspective. Arnold, London.383pp.
Knighton, D., Nanson, G., 1993. Anastomosis and the continuum of channel pattern, 18.Earth surface Processes and Landforms, pp. 613–625.
Lane, E.W., 1957. A Study of the Shape of Channels Formed by Natural Streams Flowingin Erodible Materials. Missouri Rivers Division Sediment Series No 9. US ArmyEngineer division, Missouri River, Corps of engineers, Omaha, NE. 106 pp.
Latrubesse, E., 1992. El Cuaternario fluvial de la cuenca del Purus e el Estado de Acre,Brasil. PhD Thesis, Universidad Nacional de San Luis, Argentina, 219 p.
Latrubesse, E. in press. Lakes paleolakes and reservoirs in the Amazon basin. In:Herschy, R. and Fairbridge, R. (Eds.), Encyclopedia of lakes and reservoirs, Springer.
Latrubesse, E., Franzinelli, E., 2002. The Holocene alluvial plain of the middle AmazonRiver. Geomorphology 44, 241–257.
Latrubesse, E., Franzinelli, E., 2005. The late Quaternary evolution of the Negro river,Amazon Brazil: implications for islands and floodplains formation in largeanabranching tropica systems. Geomorphology 70, 372–397.
Latrubesse, E., Stevaux, J.C., Sinha, R., 2005. Tropical rivers. Geomorphology 70,187–206.Latrubesse, E., Amsler, M., Morais, R., Aquino, S., in press. The Geomorphologic response
of a large pristine alluvial river to tremendous deforestation in the South Americantropics: the Araguaia case. Geomorphology.
Leopold, L.B., Wolman, M.G., Miller, J.P., 1964. Fluvial processes in geomorphology.Dover Publications, New York. 522 p.
Leopold, L.B., 1994. A View of the River. Harvard University Press, Cambridge,Massachusetts.
Leopold, L.B., Maddock Jr., T., 1953. The Hydraulic Geometry of Stream Channels andSome Physiographic Implications. US Geological Survey Professional Paper, vol. 252.
Leopold, L.B., Wolman, M.G., 1957. River channel patterns-braided, meandering andstraight. US Geological Survey Professional Paper, vol. 282B, pp. 39–85.
Lewin, J., Brewer, P., 2001. Predicting channel patterns. Geomorphology 40, 329–339.Lewin, J., Brewer, P., 2003. Reply to Van den Berg and Bledsoe's comment on Lewin and
Brewer (2001) “Predicting channel patterns”, Geomorphology 40, 329–339.Geomorphology 53. 339–342.
Martinelli, L.A., Forsberg, B.R., Victoria, R.L., Devol, A.H., Mortatti, J.R., Ferreira, J., Bonassi,J., de Oliveira, E., 1993. Suspended sediment load in the Madeira river. Mitteilungenaus dem Geologisch-Paläontologischen Institut der Universität Hamburg 74, 41–54.
Meade, R., 1996. River-sediment inputs to major deltas. In: Milliman, J., Haq, B.U. (Eds.),Sea Level rise and Coastal Subsidence. Kluwer Academic Publishers, pp. 63–85.
Meade, R.H., Nordin Jr., C.F., Hernandez, D.P., Mejía, B.A., Godoy, J.M., 1983. Sediment andwater discharge in rio Orinoco, Venezuela and Colombia. Proceedings of the SecondInternational Symposium on River Sedimentation: Water Resources and ElectricPower Press, Nanjing, China, pp. 1134–1144.
Mertes, L., 1997. Documentation and significance of periphereic zone on inundatedfloodplains. Water Resource Research 33, 1749–1762.
Mertes, L., Meade, R., 1985. Particle sizes of sand collected from the bed of the AmazonRiver and its tributaries in Brazil during 1982–84. U.S. Geological Survey Open-fileReport 85-333, p. 16.
Mertes, L., Dunne, T., Martinelli, L., 1996. Channel floodplain geomorphology along theSolimões–Amazon River, Brazil. Geological Society of American Bulletin 108,1089–1107.
Miall, A.D., 1996. The Geology of Fluvial Deposits. Springer. 582pp.Miall, A.D., 2006. How do we identify big rivers? And how big is big? Sedimentary
Geology 186, 39–50.Nanson, G., Hickin, E.J., 1986. A statistical analysis of bank erosion and channel
migration in western Canada. Geological Society of America bulletin 97, 497–504.Nanson, G., Croke, J., 1992. A genetic classification of floodplains. Geomorphology 4,
459–486.Nanson, G., Huang, H., 1999. Anabranching rivers: divided efficiency leading to fluvial
diversity. In: Miller, A., Gupta, A. (Eds.), Varieties of Fluvial Forms.Wiley, pp. 477–494.Nanson, G., Knighton, D., 1996. Anabranching rivers: their cause, character and
classification. Earth Surface Processes and Landforms 21, 217–239.Nordin, C.F., Perez Hernandez, D., 1989. Sand Waves, Bars and Windblown Sands of the
Rio Orinoco, Venezuela and Colombia. U.S. Geological Survey Water Supply Paper,vol. 2326A. 74pp.
Orfeo, O., Stevaux, J.C., 2002. Hydraulic and morphologic characteristics of middle andupper reaches of the Parana River (Argentina and Brazil). Geomorphology 44,309–322.
Paoli, C., Schreider, M., 2000. El Río Paraná en su tramomedio. Centro de Publicaciones-Universidad Nacional del Litoral, Santa Fe, Argentina, p. 309.
Parker, G., 1976. On the cause and characteristics scales of meandering and braidingrivers Journal of Fluids Engineering 76, 457–480.
Pickup, G., 1984. Geomorphology of Tropical rivers: I. Landforms hydrology andsedimentation in te Fly and lower Puari, Papua New Guinea. Catena Supplement,vol. 5, pp. 1–18.
Potter, P.E., 1978. Significance and origin of big rivers. Journal of Geology 86, 13–33.Ramonell, C., Amsler, M., Toniolo, H., 2002. Shifting modes of the Parana River thalweg
in its middle-lower reach. Zeitschrift fur Geomorphologie 129, 129–142.Richardson, W.R., Thorne, C.R., 2001. Multiple thread flow and channel bifurcation in a
braided river: Brahmaputra–Jamuna River, Bangladesh. Geomorphology 38,185–196.
Rocha, P.C., Souza Filho, E., 2005. Interações dinâmicas entreos materiais do leito de umcanal secundário com o canal principal no trecho multicanal do alto rio Prana,Brasil. Revista Basileira de Geomorfologia, pp. 19–32.
Sarma, J.N., 2005. Fluvial processes andmorphology of the Brahmaputra River in Assam,Índia. Geomorphology 70, 226–256.
Schumm, S., 1977. The Fluvial System. Wiley, New York. 338 pp.Schumm, S., 1985. Patterns of alluvial rivers. Annual Review, Earth and Planetary
Sciences 13, 5–27.Schumm, S., Rutherfurd, I., Brooks, J., 1994. Pre-cut-off morphology of the lower
Mississippi River. In: Schumm, S., Winkley, B. (Eds.), The Variability of Large AlluvialRivers. ASCE Press, New York, pp. 13–44.
Simpson, Ch., Smith, D., 2001. The braided Milk River, northern Montana, fails theLeopold–Wolman discharge-gradient test. Geomorphology 41, 337–353.
Strasser, M., Netto, A., Silva, R.V., Mascarenas, F., 2005. Estudo da variação do coeficientede Manning e rios da bacia Amazónica por meio de modelagem hidrodinámica.Annals of the XVI Brazilian Simposio ofWater Resources, SBRH, Joao Pessoa, vol.117.
Tandon, S.K., Sinha, R., 2007. Geology of large rivers. In: Gupta, A. (Ed.), Large Rivers:Geomorphology and Management. John Wiley & Sons, pp. 7–28.
Thorne, C.R., Russel, A., Alam, K., 1993. Planform pattern and channel evolution of theBrahmaputra River, Bangladesh. In: Best, J.L., Bristow, C.S. (Eds.), Braided Rivers.Geological society Special Publication, vol. 75, pp. 257–276. UK.
Van den Berg, J., 1995. Prediction of alluvial channel pattern of perennial rivers.Geomorphology 12, 259–12, 279.
Wang, S., Chen, Z., Smith, D., 2005. Anastomosing rivers systems along the subsidingmiddle Yangtze River basin, southern China. Catena 60, 147–163.
Wohl, E.E., 2007. Hydrology of large river basins. In: Gupta, A. (Ed.), Large Rivers:Geomorphology and Management. John Wiley & Sons, pp. 21–44.