GEOMORPH SITE CHARACTERIZATION UPPER TITTABAWASSEE …
41
ATTACHMENT I GEOCHEMISTRY PROTOCOL AND RESULTS GEOMORPH ® SITE CHARACTERIZATION UPPER TITTABAWASSEE RIVER
Transcript of GEOMORPH SITE CHARACTERIZATION UPPER TITTABAWASSEE …

ATTACHMENT I
GEOCHEMISTRY PROTOCOL AND RESULTS
GEOMORPH® SITE CHARACTERIZATION UPPER TITTABAWASSEE RIVER

Report 12/20/2006 Page 1
REPORT
Title:
METHOD DEVELOPMENT FOR DETERMINATION OF THE DISTRIBUTION OF POLYCHLORINATED DIBENZO-p-DIOXIN/DIBENZOFURANS ON SOIL FRACTIONS FROM THE
TITTABAWASSEE RIVER FLOODPLAIN
Submitted to
Michigan Department of Environmental Quality
Prepared by
Toxicology & Environmental Research and Consulting The Dow Chemical Company
Yunzhou (Joe) Chai, Ph.D.
John W. Davis, Ph.D.

Report 12/20/2006 Page 2
ABSTRACT
The objective of this study was to develop a method to size-fractionate Tittabawassee River floodplain soils and to determine the distribution of polychlorinated dibenzo-p-dioxin/dibenzofurans (PCDD/Fs) in different fractions.. Both fractionation approaches showed enrichment of organic carbon in the fine fractions (5-53 µm and <5 µm). The enrichment of organic carbon in fine fractions (5-53 µm and <5 µm) correlated with an increase in the PCDD/Fs concentrations as quantified by the estimated toxic equivalent (E-TEQ) in these fractions. Either fractionation approach did not indicate the enrichment of black carbon in any fraction.
Particle size distribution analysis using laser diffraction demonstrated that the soil fractions obtained by dry-sieving contain some level of particles outside the size range specified by the sieves. In addition the dry-aerosol cyclone separation did not satisfactorily separate and isolate particles with size of <5 µm. Thus, the fractionation of Tittabawassee River floodplain soil by dry-sieving coupled with dry-aerosol cyclone separation was only partially successful in segregating floodplain soils according to particle sizes. Compared with dry-sieving approach, the wet-sieving approach was successful in this aspect.
Therefore, the fractionation by wet-sieving coupled with sedimentation will be used for future fractionation study for the Tittabawassee River floodplain soils.
Report 12/20/2006 Page 3
TABLE OF CONTENTS
ABSTRACT........................................................................................................................ 2
TABLE OF CONTENTS.................................................................................................... 3
LIST OF TABLES.............................................................................................................. 4
LIST OF FIGURES ............................................................................................................ 4
TITLE ................................................................................................................................. 5
INTRODUCTION .............................................................................................................. 5
EXPERIMENTAL.............................................................................................................. 6
Soil Samples ................................................................................................................... 6
Soil Fractionation............................................................................................................ 6 Dry sieving Combined with Aerosol Cyclone ........................................................ 7 Wet Sieving Combined with Sedimentation........................................................... 8
Analytical Methods....................................................................................................... 10 Elemental Analysis (C/H/N) and Total Organic Carbon Content (foc) ................. 10 Black Carbon Content (fbc) ................................................................................... 10 Particle Size Distribution Analysis ....................................................................... 10 PCDD/Fs in Solid Samples................................................................................... 11
RESULTS AND DISCUSSION....................................................................................... 11
Dry-sieving combined with dry-aerosol cyclone.......................................................... 11 Soil mass distribution and PCDD/Fs distribution in different size fractions........ 11 Particle Size Distribution of Bulk and Dry-sieved Soil ........................................ 12 Total Organic Carbon (foc) and Black Carbon (fbc) Contents of Bulk and Dry Sieved Soil ............................................................................................................ 13
Wet-sieving combined with sedimentation................................................................... 14 Soil mass distribution and PCDD/Fs distribution in different size fractions........ 14 Particle Size Distribution ...................................................................................... 15 Total organic carbon (foc) and black carbon (fbc) contents.................................... 15
CONCLUSIONS............................................................................................................... 16
REFERENCES ................................................................................................................. 17

Report 12/20/2006 Page 4
LIST OF TABLES
Table 1 Soil mass and PCDD/Fs distribution in West Michigan Park soil by dry-sieving combined with aerosol cyclone .......................................................................... 18
Table 2 Soil mass and PCDD/Fs distribution in Imerman Park soil by dry-sieving combined with aerosol cyclone .......................................................................... 18
Table 3 PCDD/Fs concentration and organic carbon and black carbon content in bulk and fractionated West Michigan Park and Imerman Park soils by dry-sieving combined with aerosol cyclone .......................................................................... 19
Table 4 Soil mass and PCDD/Fs distribution in West Michigan Park soil by wet-sieving combined with sedimentation............................................................................. 20
Table 5 Soil mass and PCDD/Fs distribution in Imerman Park soil by wet-sieving combined with sedimentation............................................................................. 20
Table 6 PCDD/Fs concentration and organic carbon and black carbon content in bulk and fractionated West Michigan Park and Imerman Park soils by wet-sieving combined with sedimentation............................................................................. 21
LIST OF FIGURES
Figure 1. Sampling location from West Michigan Park ................................................... 22
Figure 2. Sampling location from Imerman Park ............................................................. 23
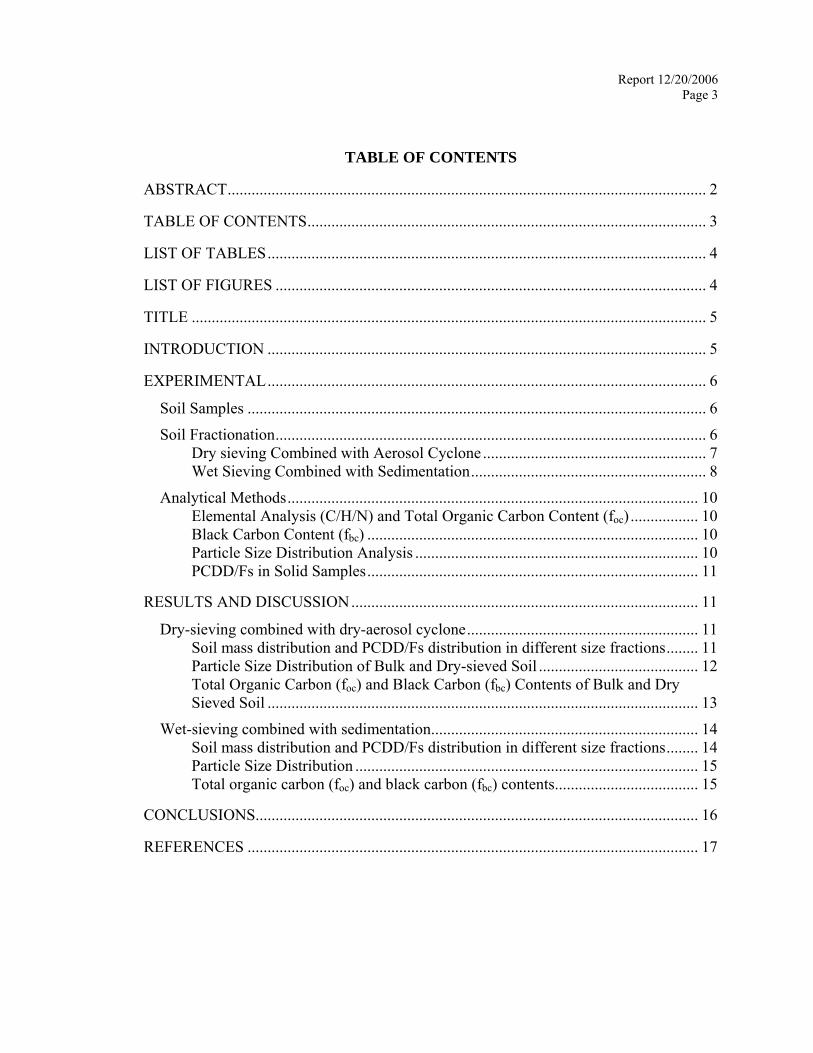
Figure 3. Fractionation scheme for dry-sieving coupled with aerosol cyclone ................ 24
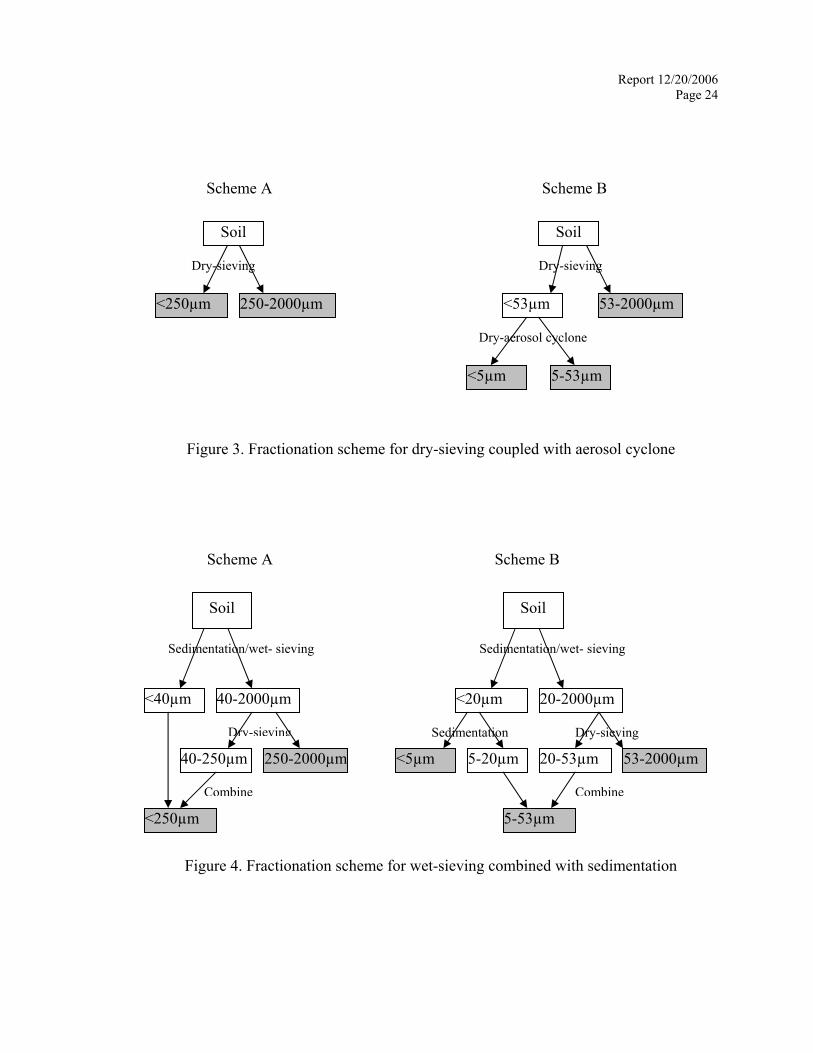
Figure 4. Fractionation scheme for wet-sieving combined with sedimentation ............... 24
Figure 5. Particle size distribution of bulk and fractionated West Michigan Park soil by dry-sieving combined with aerosol cyclone ....................................................... 25
Figure 6. Correlation between estimated toxic equivalent (E-TEQ) and organic carbon content for dry-sieving ....................................................................................... 26
Figure 7. Particle size distribution of bulk and fractionated West Michigan Park soil by wet sieving combined with sedimentation ......................................................... 27
Figure 8. Correlation between estimated toxic equivalent (E-TEQ) and organic carbon content for wet-ieving......................................................................................... 28

Report 12/20/2006 Page 5
TITLE
METHOD DEVELOPMENT FOR DETERMINATION OF THE DISTRIBUTION OF POLYCHLORINATED DIBENZO-p-DIOXIN/DIBENZOFURANS ON SOIL FRACTIONS FROM THE TITTABAWASSEE RIVER FLOODPLAIN
INTRODUCTION
Understanding the fate, transport and bioaccessibility of hydrophobic organochlorines in soils and sediments is an important component of the risk management decision process. Hydrophobic organochlorine compounds such as polychlorinated dibenzo-p-dioxin/dibenzofurans (PCDD/Fs) are strongly associated with soil or sediment matrices and the environmental fate of these materials is impacted primarily through solids-mediated transport. Therefore, the distribution of these hydrophobic organochlorines in various grain size fractions in soils and sediments may provide insight into both the transport and the bioaccessibility of PCDD/Fs.
The objective of this study is to develop a method which could be used to fractionate Tittabawassee River floodplain soil and sediment samples based on particle size. After fractionation the distribution of PCDD/Fs in the individual fractions (and bulk soil) was determined. The following hypotheses were evaluated in this study: 1) PCDD/Fs are unevenly distributed in the Tittabawassee floodplain soil matrices; 2) Soil properties/ characteristics help explain the distribution of PCDD/Fs levels in Tittabawassee floodplain soil, e.g., higher levels of PCDD/Fs are associated with soil fractions exhibiting higher total organic carbon or black carbon contents.
Two soil samples from the Tittabawassee floodplain were collected from areas previously identified to contain elevated levels of PCDD/Fs. Soil samples were fractionated into different size fractions, e.g., sand, silt and clay. The distribution of PCDD/Fs in each fraction was determined. Floodplain soils and their sub-domains were characterized for total organic carbon/total organic matter, black carbon content, and elemental analysis (carbon/hydrogen/nitrogen elemental ratio, C/H/N). The correlation between the distribution of PCDD/Fs and the organic carbon (e.g. total organic carbon and black carbon) of each fraction was determined.

Report 12/20/2006 Page 6
Two approaches were assessed to realize the fractionation: 1) dry-sieving combined with dry-aerosol cyclone, and 2) wet-sieving combined with sedimentation.
EXPERIMENTAL
Soil Samples
Soil samples were collected from two locations along the Tittabawassee River floodplain, one from West Michigan Park (WMP, refer to map in Figure 1 for sampling location Dow-SHL-02770) and the other from Imerman Park (IP, refer to map in Figure 2 for sampling location Dow-THT-02769). These samples were collected from areas that have previously been identified to contain elevated levels of PCDD/Fs. The sampling locations were agreed upon between Michigan Department of Environmental Quality (MDEQ) and The Dow Chemical Company (TDCC). From each sampling location, soil samples from 0-2 inch below ground surface were taken after the overlying grass had been removed. Soil samples were sealed and transported back to the laboratory and stored at 4ºC. Soil samples were sieved through 2 mm sieve after collection to remove large objects such as gravels, leaves and grass roots, sealed and stored at 4ºC.
Soil Fractionation
Soil samples were fractionated into different size fractions, i.e., sand, silt and clay. Two separate fractionation approaches were compared: 1) dry-sieving combined with aerosol cyclone based on American Society for Testing and Materials (ASTM) method D421-85 (ASTM, 2003a), and 2) wet-sieving combined with sedimentation based on ASTM method D 422-63 (ASTM, 2003b).
The mass distribution of different fractions and the distribution of PCDD/Fs in each fraction were determined. The correlation between the distribution of PCDD/Fs and the characteristics of each fraction, e.g., total organic carbon content (foc) and black carbon content (fbc), were determined. The particle size distribution (PSD) of bulk WMP soil and its sub fractions were determined by laser diffraction particle size analyzer to evaluate the efficacy of the two fractionation approaches (i.e. wet vs. dry).

Report 12/20/2006 Page 7
Both the wet and dry fractionation approaches resulted in several different size classes of particles. Scheme A separates the soils into two fractions: <250 µm and 250–2000 µm. The objective of this scheme was to obtain further characterization of the fraction of <250 µm. Scheme B is based on the U.S. Department of Agriculture (USDA) definition of sand, silt and clay fractions in soil (Marshall and Holmes, 1979). According to USDA, sand, silt and clay particles are differentiated according to their particle sizes in the following way: sand (50–2000 µm), silt (2-50 µm) and clay (< 2 µm).
The soils were fractionated into sand (53–2000 µm), silt (5-53 µm) and clay (< 5 µm). A standard American Society for Testing and Materials (ASTM) stainless steel sieve with an opening of 53 µm was used to separate sand (> 53 µm) from silt and clay particles. This specific sieve was used because it represents the only ASTM standard test sieve which is available that generates particles sizes nearest to 50 µm. The choice of 5 µm instead of 2 µm as the cut-off size for the differentiation between clay and silt was based on the cut-off size of aerosol cyclone for dry-sieving approach and on the logistic considerations for sedimentation for wet-sieving approach.
Dry sieving Combined with Aerosol Cyclone
The flowchart for the fractionation utilizing dry sieving combined with aerosol cyclone is shown in Figure 3. Soil samples were air-dried and soil aggregates were manually crushed using a mortar and pestle. For fractionation scheme A, an ASTM standard sieve with opening of 250 µm was used to separates the soils into two fractions: <250 µm and 250–2000 µm. For scheme B, an ASTM standard sieve with opening of 53 µm was used to separates the soils into two fractions: <53 µm and 53–2000 µm. A micro-feeder (MF-2, Siboto) and a 5 µm cut-off stainless steel cyclone were utilized to separate particles with diameters below 53 µm into silt (5-53 µm) and clay (< 5 µm) fractions. The micro-feeder transfers dry soil sample at an aerosol flow rate of 30 liters per minute and a pressure of 2 psi into the stainless steel cyclone. This separates particles with aerodynamic diameters as low as 5 µm. Particles with diameters less than 5 µm were collected in a Teflon bag from the upper exit of the cyclone. Particles with diameter of 5 to 53 µm were collected in a reservoir below the cyclone.

Report 12/20/2006 Page 8
Wet Sieving Combined with Sedimentation
Fractionation of soil samples utilizing sedimentation and wet-sieving is based on the Society of Agronomy standard method (Day, 1965) and ASTM method D 422-63 (ASTM, 2003b). Particles with different diameters will settle in water at different settling velocities. According to Stokes’ Law, the settling equation for a spherical particle in water is
2
181 gdu lp
µρρ −
=
where u is the settling velocity of the particle, ρp and ρl are the density of the particle (2.65 g/cm3 for soil) and water (1 g/cm3), respectively, µ is the dynamic viscosity of water, g is the acceleration of gravity, and d is the particle diameter. For a water column with a given height, the time required for a particle with known diameter to settle can be determined from the settling velocity. The flocculation and compression during sedimentation are two factors that hinders the complete separation of soil according to particle diameters. The initial height of a particle in the water column is another factor that hinders the complete separation of particles with different diameters because the traveling time of a particle to the bottom of the water column depends on both its initial height and settling velocity. Therefore, re-suspension and sedimentation will need to be repeated until the yield of fine particles is negligible.
The flowchart for the fractionation utilizing wet sieving combined with sedimentation is shown in Figure 4. For each fractionation scheme, approximately 300 g soil samples placed in a 1-L glass jar and approximately 500 ml MilliQ (Deionized water purified through a Milli-Q water treatment system, Millipore Corporation, Bedford, MA, USA) water was added. The glass jar was sealed and shaken for 24 h on a shaker machine before the soil slurry was subjected to the fractionation procedure.
For fractionation scheme A, the soil slurry in the 1-L glass jar was stirred using a spatula for 30 sec before it was settled for 1 min. This would allow sand and silt particles greater than approximately 40 µm to settle (10 cm water column). The suspension was siphoned and passed through an ASTM standard sieve with opening of 250 µm in order to remove remaining organic matter particles in the suspension

Report 12/20/2006 Page 9
with diameters greater than 250 µm. The sieved suspension was collected in a 2-L glass beaker. This material retained on the sieve was placed back into the original 1-liter glass jar containing the remaining soil slurry to be fractionated. Approximately 500 ml MilliQ water was added into the 1-L glass jar and stirred for 30 sec. The above re-suspension and sedimentation steps were repeated for 6 cycles. For the last two cycles, the soil slurry was sonicated for 10 min following the addition of MilliQ water. The yield in the last cycle was negligible. The siphoned suspension was centrifuged at 2000 g for 30 min to recover the fraction <40 µm. The fraction > 40 µm left in the glass jar was air-dried, crushed using spatula, and sieved through 250 µm sieve to obtain >250 µm and 40-250 µm fraction. The 40-250 µm fraction was combined with <40 µm fraction to obtain <250 µm fraction.
For scheme B, the soil slurry in the 1-L glass jar was stirred using a spatula for 30 sec before it was settled for 5 min. This would allow sand and silt particles greater than approximately 20 µm to settle (10 cm water column). The suspension containing particles < 20 µm was siphoned and passed through an ASTM standard sieve with opening of 53 µm in order to remove remaining organic matter particles in the suspension with diameters greater than 53 µm. The sieved suspension was collected in a 2-L glass beaker. The material on the sieve was placed back into the original 1-L glass jar containing soil slurry to be fractionated. Approximately 500 ml MilliQ water was added into the 1-L glass jar and stirred for 30 sec. The above re-suspension and sedimentation steps were repeated for 8 cycles. For the last two cycles, the soil slurry was sonicated for 10 min following the addition of MilliQ water. The yield in the last cycle was negligible. The fraction > 20 µm left in the glass jar was air-dried, crushed using spatula, and sieved through 53 µm sieve to obtain >53 µm and 20-53 µm fraction. The siphoned suspension containing the fraction <20 µm was collected in 2-L beakers. The suspension was stirred for 30 sec, and settled for 75 min. This would allow particles greater than 5 µm to settle through a 10 cm water column, the suspension was then siphoned from 2000 ml level to 700 ml level mark (10 cm water column). The siphoned suspension was centrifuged at 2000 g for 30 min to recover <5 µm fraction. The re-suspension-sedimentation-siphon-centrifugation cycle was repeated until the yield is negligible (8 cycles). The 5-20 µm fraction was centrifuged at 2000 g for 30 min to remove excess water and was combined with the 20-53 µm fraction to obtain 5-53 µm fraction.

Report 12/20/2006 Page 10
Analytical Methods
Elemental Analysis (C/H/N) and Total Organic Carbon Content (foc)
A Perkin Elmer 2400 CHN Analyzer was used to determine the weight percentage of carbon, hydrogen and nitrogen (CHN). CHN analysis was conducted by Quantitative Technologies, Inc (QTI, Whitehouse, NJ, USA). All soil samples were acidified with 6N HCl to remove the inorganic carbon in the samples before samples were sent to QTI for CHN analysis. As a result the elemental carbon content from this C/H/N analysis represents the total organic carbon content (foc) of the sample. The total organic matter content is obtained from the total organic carbon content by multiplying by a factor of 1.724 (Nelson and Sommers, 1982).
Black Carbon Content (fbc)
The black carbon content (fbc) in each of the soils and soil fractions was determined using combustion techniques (Gustafsson et al., 1997). Briefly, aliquots of acidified (6N HCL) dry samples were weighed and combusted under air for 24 h at 375°C, so that the labile organic matter was oxidized but the black carbon fraction in the sample was retained. The organic carbon content of the sample after combustion at 375°C (foc
375) was determined following the above procedure. The black carbon content (fbc) was calculated from the total organic carbon content (foc) in the sample, the organic carbon content of the sample after combustion (foc
375), and the weight loss due to combustion at 375°C. Note that the black carbon content is operationally defined (i.e., intact in air combustion at 375°C for 24 h). Black carbon, which includes soot, coal and coal derived particles, coke etc, has been reported to be ubiquitous in soil or sediment (Gustafsson et al., 1997; Ghosh et al., 2001; Cornelissen and Gustafsson, 2005). Different terms are used to denote this black carbon such as hard carbon, condensed phase organic carbon, carbonaceous geosorbents.
Particle Size Distribution Analysis
The particle size distribution (PSD) analysis for the West Michigan Park (WMP) soil and its fractions was analyzed by a Beckman Coulter LS13 320 laser diffraction particle size analyzer. This analysis was conducted by Particle Technology Labs (PTL, Downers Grove, IL, USA).

Report 12/20/2006 Page 11
PCDD/Fs in Solid Samples
All PCDD/Fs analysis was conducted by the Trace Laboratory in the Environmental Analytical Chemistry Laboratory at The Dow Chemical Company (Dow, Midland, MI, USA). The toxic equivalency factors (TEFs) values for dioxins and furans used to calculate toxic equivalent (TEQ) were according to values published by World Health Organization (WHO) (i.e., WHO-TEQs).
The PCDD/Fs pre-screening analysis for the two bulk soils followed a modified U.S. Environmental Protection Agency (U.S. EPA 1613b) procedure. The results were quantified using WHO-TEQs. The fast analysis method (1613 RT/TRP) was used to determine the estimated toxic equivalents (E-TEQs) for all soil samples in this study. The fast analysis method (1613 RT/TRP) determines the concentration of 2,3,7,8-TCDD, 2,3,7,8-TCDF, 1,2,3,7,8-PeCDF, 2,3,4,7,8-PeCDF, 1,2,3,4(6),7,8-HxCDF (the two hexachlorodibenzofurans co-elute in the fast method), E-TEQs were obtained based on historical PCDD/Fs congener patterns in Tittabawassee River floodplain soil/sediments according to the following way: E-TEQ = 1.1 × Σ (TEQ of the above congeners). The fast analysis method significantly reduced the turnaround time without adverse impact on the data quality.
RESULTS AND DISCUSSION
Dry-sieving combined with dry-aerosol cyclone
Soil mass distribution and PCDD/Fs distribution in different size fractions
The soil mass distribution and PCDD/Fs measured by estimated toxic equivalent (E-TEQ) in fractionated West Michigan Park (WMP) soil are presented in Table 1. For fractionation scheme A, WMP<250 µm fraction contained 86% of the soil mass and 95% of the E-TEQ. For fractionation scheme B, WMP53-2000 µm fraction contained 88% of the soil mass and 76% of the E-TEQ. WMP5-53 µm and WMP<5 µm two fractions together contained ~12% of the soil mass and ~30% of the E-TEQ. The mass balances for soil mass were both 100% for the two fractionation schemes. The mass balances for E-TEQ were 106% for both fractionation schemes.
The soil mass distribution and PCDD/Fs measured by estimated toxic equivalent (E-TEQ) in fractionated Imerman Park (IP) soil are presented in Table 2.

Report 12/20/2006 Page 12
For fractionation scheme A, IP<250 µm fraction contained 93% of the soil mass and approximately 49% of the E-TEQ. For fractionation scheme B, IP53-2000 µm fraction contained ~83% of the soil mass and approximately 42% of the E-TEQ. IP5-53 µm and IP<5 µm two fractions together contained approximately 17% of the soil mass and approximately 16% of the E-TEQ. The mass balances for soil mass were both 100% for the two fractionation schemes. The mass balances for E-TEQ were only approximately 56% and 57% for fractionation schemes A and B, respectively. The results from the two fractionation schemes suggested that the majority of the soil mass and PCDD/Fs were associated with the 53-250 µm.
The low mass balance on PCDD/Fs E-TEQ for IP soil and its fractions was due to the heterogeneity of the soil although the soil was thoroughly homogenized before fractionation. The E-TEQ for WMP soil was 3150 ng/kg (Analyzed in Aug. 2006). This was in good agreement with preliminary analysis of WHO-TEQ of 3007 ng/kg. The E-TEQ for IP soil was 4400 ng/kg (Analyzed in Aug. 2006). This was, however, much higher than the preliminary analysis of WHO-TEQ of 1559 ng/kg. Thus, three more replicates of IP soil were analyzed in Oct. 2006 for E-TEQ. The E-TEQs were 3850, 1580, 1840 ng/kg. Thus the average of the four measurements, 2918 ng/kg, was used in this report. The relative large variation was due to the soil heterogeneity.
Particle Size Distribution of Bulk and Dry-sieved Soil
Particle size distribution results for West Michigan Park (WMP) soil and its dry sieved fractions are shown in Figure 5. Figure 5A shows the soil volume (mass) abundance at each size interval for WMP bulk soil and WMP 250-2000 µm, <250 µm fractions. Dry-sieving of the soil did not completely segregate particles based on size. For example, the results from the particle size distribution analysis for the WMP 250- 2000 µm soil fraction showed that approximately 40% of the mass is less than 250 µm while for the WMP<250 µm fraction approximately 10% of its mass is greater than 250 µm. Figure 5B shows the soil volume (mass) abundance at each size interval for WMP bulk soil and WMP 53-2000 µm, WMP5-53 µm and WMP<5 µm fractions. For fraction WMP53-2000 µm, approximately 32% of its mass is less than 53 µm. For fraction WMP 5-53 µm, approximately 11% of its mass is less than 5 µm and 11% greater than 53 µm. For fraction WMP <5 µm, approximately 83% of its mass is greater than 5 µm.

Report 12/20/2006 Page 13
It is important to note that dry-sieving was utilized to generate soil fractions WMP 250-2000 µm and WMP <250 µm (scheme A) and WMP 53-2000 µm and WMP <53 µm (scheme B). Before dry-sieving, soil samples were manually crushed using mortar and pestle to break soil aggregates. The particle distribution results suggested that this crushing process was not an efficient approach for size-fractionating soil. First of all, it could not completely break soil aggregates, secondly, it likely generated more fine particles. The effectiveness of dry-aerosol cyclone to separate soil fraction WMP <53 µm into WMP5-53 µm and WMP<5 µm fractions is also questionable. The particle size distribution of these two fractions (WMP5-53 µm and WMP<5 µm) suggested that the two fractions showed almost identical particle size distribution.
Dry-sieving coupled with dry-aerosol cyclone treatment was partially successful in segregating soil particles based upon size. However, the wet-sieving/sedimentation methods (below) proved to yield soil sub-fractions with higher percentage of the desired particle size range.
Total Organic Carbon (foc) and Black Carbon (fbc) Contents of Bulk and Dry Sieved Soil
The total organic carbon content (foc) and black carbon content (fbc) for the bulk soil and soil fractions are shown in Table 3. The total organic matter content can be obtained from the total organic carbon content by multiplying by a factor of 1.724 (Nelson and Sommers, 1982). However, organic carbon content was used in the discussion below because organic matter content is not an accurately measurable entity (Nelson and Sommers, 1982).
The organic carbon contents for bulk WMP and IP soil were 2.50% and 2.37%, respectively. For both soils, the organic carbon contents for 5-53 µm fraction and <5 µm fraction were significantly higher (approximately two-fold) than the corresponding bulk soil. The organic carbon contents for other fractions were generally very close to those of the corresponding bulk soils. The black carbon contents for soil fractions were generally close to those for bulk soils. There was no strong evidence suggesting the enrichment of black carbon in certain fractions. The correlation between PCDD/Fs concentration as measured by E-TEQs and organic

Report 12/20/2006 Page 14
carbon contents in bulk soil and dry sieved soil fractions are shown in Figure 6. There was a strong linear correlation between the E-TEQs and organic carbon contents in bulk WMP soil and fractions generated from WMP soil, with correlation coefficient r2 of 0.98. This correlation was not so strong for the bulk IP soil and fractions generated from IP soil, which gives r2 of 0.31.
These results confirmed that the majority of PCDD/Fs in Tittabawassee river floodplain soils were associated with soil organic fractions, which is consistent with literature reports about the association behavior of highly hydrophobic organic contaminants in soil or sediment in the environment. Elevated E-TEQ in fine fractions (5-53 µm and <5 µm) correlated well with high organic carbon contents in these fractions.
Wet-sieving combined with sedimentation
Soil mass distribution and PCDD/Fs distribution in different size fractions
The soil mass distribution and PCDD/Fs measured by estimated toxic equivalent (E-TEQ) in fractionated West Michigan Park (WMP) soil by wet-sieving combined with sedimentation are presented in Table 4. For fractionation scheme A, WMP<250 µm fraction contained ~86% of the soil mass and ~121% of the E-TEQ. For fractionation scheme B, WMP53-2000 µm fraction contained ~72% of the soil mass and ~26% of the E-TEQ. WMP5-53 µm and WMP<5 µm two fractions together contained ~25% of the soil mass and ~75% of the E-TEQ representing an ~ three-fold enrichment of the E-TEQ in this fraction. The mass balances for soil mass were ~ 98% and ~97% for the fractionation scheme A and B, respectively. The mass balances for E-TEQ were 149% and 101% for fractionation scheme A and B, respectively.
The soil mass distribution and PCDD/Fs measured by estimated toxic equivalent (E-TEQ) in fractionated Imerman Park (IP) soil by wet-sieving combined with sedimentation are presented in Table 5. For fractionation scheme A, IP<250 µm fraction contained 94% of the soil mass and approximately 66% of the E-TEQ. For fractionation scheme B, IP53-2000 µm fraction contained ~64% of the soil mass and approximately 60% of the E-TEQ. IP5-53 µm and IP<5 µm two fractions together contained approximately 33% of the soil mass and approximately 39% of the E-TEQ

Report 12/20/2006 Page 15
representing only a slight enrichment of the E-TEQ in this fraction. The mass balances for soil mass were 101% and 98% for fractionation scheme A and B, respectively. The mass balances for E-TEQ were approximately 68% and 99% for fractionation scheme A and B, respectively. The distribution of the PCDD/Fs appeared different in the two soil samples (IP and WMP) using the wet sieve/sedimentation fractionation scheme. For the IP soil the majority of the soil mass and PCDD/Fs were associated with the 53-250 µm. In contrast, for the WMP soil the majority of the soil mass was in the >53 µm fraction while most (~75%) of the PCDD/Fs were associate with the < 53 µm soil particles.
Particle Size Distribution
Particle size distribution results for West Michigan Park (WMP) soil and its fractions by wet-sieving combined with sedimentation are shown in Figure 7. Figure 7A shows the soil volume (mass) abundance at each size interval for WMP bulk soil and WMP 250-2000 µm, <250 µm fractions. Figure 7B shows the soil volume (mass) abundance at each size interval for WMP bulk soil and WMP 53-2000 µm, WMP5-53 µm and WMP<5 µm fractions. Compared with dry-sieving approach, the wet-sieving approach was more successful in segregating particles based on size.
Total organic carbon (foc) and black carbon (fbc) contents
The total organic carbon content (foc) and black carbon content (fbc) for the bulk soil and soil fractions are shown in Table 6. The organic carbon contents for bulk WMP and IP soil were 2.50% and 2.37%, respectively. For both soils, the organic carbon contents for 5-53 µm fraction and <5 µm fraction were significantly higher than the corresponding bulk soil. The organic carbon contents for 53-2000 µm fractions and <250 µm fractions were generally lower than those of the corresponding bulk soils. The correlation between PCDD/Fs concentration as measured by E-TEQs and organic carbon contents in bulk soil and soil fractions are shown in Figure 8. There was a strong linear correlation between the E-TEQs and organic carbon contents in bulk WMP soil and fractions generated from WMP soil, with correlation coefficient r2 of 0.83. This correlation was not so strong for the IP soil, which may have been due to the heterogeneity of IP soil. Similar to dry-sieving approach, there was no strong evidence suggesting the enrichment of black carbon in specific soil fractions.

Report 12/20/2006 Page 16
These results confirmed that the majority of PCDD/Fs in Tittabawassee river floodplain soils were associated with soil organic fractions, which is consistent with literature reports about the association behavior of highly hydrophobic organic contaminants in soil or sediment in the environment. Elevated E-TEQ in fine fractions (5-53 µm and <5 µm) correlated well with high organic carbon contents in these fractions.
CONCLUSIONS
The objective of this study was to develop a method to size-fractionate Tittabawassee River floodplain soils and to determine the distribution of polychlorinated dibenzo-p-dioxin/dibenzofurans (PCDD/Fs) in different fractions. Both fractionation approaches showed enrichment of organic carbon in the fine fractions (5-53 µm and <5 µm). The enrichment of organic carbon in fine fractions (5-53 µm and <5 µm) correlated with an increase in the PCDD/Fs concentrations as quantified by the estimated toxic equivalent (E-TEQ) in these fractions. Either fractionation approach did not indicate the enrichment of black carbon in any fraction.
Particle size distribution analysis using laser diffraction demonstrated that the soil fractions obtained by dry-sieving, as compared to the wet sieving/sedimentation, contain greater percentage of particles outside the size range specified by the sieves. In addition the dry-aerosol cyclone separation did not satisfactorily separate and isolate particles with size of <5 µm. Thus, the fractionation of Tittabawassee River floodplain soil by dry-sieving coupled with dry-aerosol cyclone separation was only partially successful in segregating floodplain soils according to particle sizes. Compared with dry-sieving approach, the wet-sieving approach was more successful in this aspect.
Therefore, the fractionation by wet-sieving coupled with sedimentation will be used for future fractionation study for the Tittabawassee River floodplain soils.

Report 12/20/2006 Page 17
REFERENCES
(1) ASTM (2003a). Standard practice for dry preparation of soil samples for particle size analysis and determination of soil constants. D 421-85 (2002). Eds, Annual Book of ASTM Standards. Vol. 04.08. ASTM International, Philadelphia, PA.
(2) ASTM (2003b). Standard test method for particle-size analysis of soils. D 422-63
(2002). Eds, Annual Book of ASTM Standards. Vol. 04.08. ASTM International, Philadelphia, PA.
(3) Marshall, T. J. and Holmes, J. W. (1979). Soil Physics, Cambridge University Press. (4) Day, P. R. (1965). Method for separation of clay, silt and sand fractions. In Black, C.
A., Evans, D. D., White, J. L., Ensminger, L. E. and Clark, F. E., Eds, Method of soil analysis. Part 1 Physical and mineralogical properties, Including statistics of measurement and sampling. Vol. 9. American Society of Agronomy. Madison, Wisconsin, USA, 550-552.
(5) Nelson, D. W. and Sommers, L. E. (1982). Total carbon, organic carbon, and organic
matter. In Page, A. L., Miller, R. H. and Keeney, D. R., Eds, Method of soil analysis. Part 2 Chemical and microbiological properties. Vol. 9. American Society of Agronomy, Soil Science Society of America. Madison, Wisconsin, USA, 539-577.
(6) Gustafsson, Ö., Haghseta, F., Chan, C., Macfarlane, J. and Gschwend, P. M. (1997).
Quantification of the dilute sedimentary soot phase: Implications for PAH speciation and bioavailability. Environmental Science and Technology 31: 203-209.
(7) Ghosh, U., Talley, J. W. and Luthy, R. G. (2001). Particle-scale investigation of PAH
desorption kinetics and thermodynamics from sediment. Environmental Science and Technology 35: 3468-3475.
(8) Cornelissen, G. and Gustafsson, O. (2005). Importance of unburned coal carbon,
black carbon, and amorphous organic carbon to phenanthrene sorption in sediments. Environmental Science and Technology 39(3): 764-769.

Report 12/20/2006 Page 18
Table 1 Soil mass and PCDD/Fs distribution in West Michigan Park soil by dry-sieving combined with aerosol cyclone
PCDD/Fs Fractionation
Scheme Fraction Soil Mass
(% of Total) E-TEQ a, ng/kg
% of Total b
250 – 2000 µm 14.4% 2440 11.1% < 250 µm 85.7% 3500 95.3%
A
Total mass balance 100% - 106% 53 – 2000 µm 87.5% 2720 75.6% 5 – 53 µm 8.6% 7330 20.1% < 5 µm 3.5% 8840 9.8%
B
Total mass balance 99.7% - 106% a: Estimated toxic equivalent (E-TEQ) was obtained based on historical PCDD/Fs congener patterns
in Tittabawassee River floodplain soil/sediments according to the following empirical formula: E-TEQ = 1.1 × Σ (TEQ of 2,3,7,8-TCDD, 2,3,7,8-TCDF, 1,2,3,7,8-PeCDF, 2,3,4,7,8-PeCDF and the co-elutes of 1,2,3,4(6),7,8-HxCDF).
b: E-TEQ for bulk West Michigan Park soil was 3150 ng/kg.
Table 2 Soil mass and PCDD/Fs distribution in Imerman Park soil by dry-sieving combined with aerosol cyclone
PCDD/Fs Fractionation
Scheme Fraction Soil Mass
(% of Total) E-TEQ a, ng/kg
% of Total b
250 – 2000 µm 6.9% 3010 7.1% < 250 µm 93.2% 1530 48.9%
A
Total mass balance 100% - 56.0% 53 – 2000 µm 82.8% 1460 41.5% 5 – 53 µm 11.5% 2600 10.3% < 5 µm 5.4% 2870 5.3%
B
Total mass balance 99.7% - 57.0% a: Estimated toxic equivalent (E-TEQ) was obtained based on historical PCDD/Fs congener patterns
in Tittabawassee River floodplain soil/sediments according to the following empirical formula: E-TEQ = 1.1 × Σ (TEQ of 2,3,7,8-TCDD, 2,3,7,8-TCDF, 1,2,3,7,8-PeCDF, 2,3,4,7,8-PeCDF and the co-elutes of 1,2,3,4(6),7,8-HxCDF).
b: Based on average E-TEQ for bulk Imerman Park soil of four measurements: 4400 (analyzed in Aug., 2006, the next three measurements were analyzed in Oct. 2006), 3850, 1580 and 1840 ng/kg, respectively.

Report 12/20/2006 Page 19
Table 3 PCDD/Fs concentration and organic carbon and black carbon content in bulk and fractionated West Michigan Park and Imerman Park soils by dry-sieving combined with aerosol cyclone
Soil ID E-TEQ
ng/kg
OC Normalized
E-TEQ ng/kg
Organic Carbon (OC)
%
Black Carbon (BC)
%
BC/OC
% WMP 3150 125820 2.50 0.39 15.5
WMP250-2000µm 2440 142985 1.71 0.31 17.9 WMP<250 µm 3500 136315 2.57 0.38 14.7
WMP53-2000 µm 2720 123654 2.20 0.36 16.6 WMP5-53 µm 7330 141235 5.19 0.74 14.3 WMP<5 µm 8840 157827 5.60 0.78 13.9
IP 2918 122904 2.37 0.31 13.1 IP250-2000 µm 3010 107290 2.81 0.50 18.0
IP<250 µm 1530 67341 2.27 0.32 14.2 IP53-2000 µm 1460 68177 2.14 0.25 11.6
IP5-53 µm 2600 67987 3.82 0.49 12.9 IP<5 µm 2870 68641 4.18 0.42 9.9
WMP: West Michigan Park soil; IP: Imerman Park soil; E-TEQ: Estimated toxic equivalent; OC: Organic carbon; BC: Black carbon

Report 12/20/2006 Page 20
Table 4 Soil mass and PCDD/Fs distribution in West Michigan Park soil by wet-sieving combined with sedimentation
PCDD/Fs Fractionation
Scheme Fraction Soil Mass
(% of Total) E-TEQ a, ng/kg
% of Total b
250 – 2000 µm 11.7% 7530 27.9% < 250 µm 86.1% 4420 121%
A
Total mass balance 97.8% - 149% 53 – 2000 µm 72.1% 1150 26.3% 5 – 53 µm 18.6% 7650 45.1% < 5 µm 6.4% 14600 29.7%
B
Total mass balance 97.1% - 101% a: Estimated toxic equivalent (E-TEQ) was obtained based on historical PCDD/Fs congener patterns
in Tittabawassee River floodplain soil/sediments according to the following empirical formula: E-TEQ = 1.1 × Σ (TEQ of 2,3,7,8-TCDD, 2,3,7,8-TCDF, 1,2,3,7,8-PeCDF, 2,3,4,7,8-PeCDF and the co-elutes of 1,2,3,4(6),7,8-HxCDF).
b: E-TEQ for bulk West Michigan Park soil was 3150 ng/kg.
Table 5 Soil mass and PCDD/Fs distribution in Imerman Park soil by wet-sieving combined with sedimentation
PCDD/Fs Fractionation
Scheme Fraction Soil Mass
(% of Total) E-TEQ a, ng/kg
% of Total b
250 – 2000 µm 6.4% 1070 2.3% < 250 µm 94.3% 2030 65.6%
A
Total mass balance 101% - 67.9% 53 – 2000 µm 64.3% 2720 60.0% 5 – 53 µm 26.4% 2660 24.0% < 5 µm 7.0% 6010 14.5%
B
Total mass balance 97.7% - 98.5% a: Estimated toxic equivalent (E-TEQ) was obtained based on historical PCDD/Fs congener patterns
in Tittabawassee River floodplain soil/sediments according to the following empirical formula: E-TEQ = 1.1 × Σ (TEQ of 2,3,7,8-TCDD, 2,3,7,8-TCDF, 1,2,3,7,8-PeCDF, 2,3,4,7,8-PeCDF and the co-elutes of 1,2,3,4(6),7,8-HxCDF).
b: Based on average E-TEQ for bulk Imerman Park soil of four measurements: 4400 (analyzed in Aug., 2006, the next three measurements were analyzed in Oct. 2006), 3850, 1580 and 1840 ng/kg, respectively.

Report 12/20/2006 Page 21
Table 6 PCDD/Fs concentration and organic carbon and black carbon content in bulk and fractionated West Michigan Park and Imerman Park soils by wet-sieving combined with sedimentation
Soil ID E-TEQ
ng/kg
OC Normalized
E-TEQ ng/kg
Organic Carbon (OC)
%
Black Carbon (BC)
%
BC/OC
% WMP 3150 125820 2.50 0.39 15.5
WMP250-2000µm 7530 367317 2.05 0.13 6.5 WMP<250 µm 4420 274534 1.61 0.14 8.6
WMP53-2000 µm 1150 161972 0.71 0.09 12.6 WMP5-53 µm 7650 213687 3.58 0.16 4.5 WMP<5 µm 14600 275472 5.30 0.17 3.2
IP 2918 122904 2.37 0.31 13.1 IP250-2000 µm 1070 34740 3.08 0.16 5.1
IP<250 µm 2030 130968 1.55 <0.08 <5 IP53-2000 µm 2720 256604 1.06 <0.09 <8
IP5-53 µm 2660 93662 2.84 0.12 4.3 IP<5 µm 6010 124948 4.81 0.17 3.6
WMP: West Michigan Park soil; IP: Imerman Park soil; E-TEQ: Estimated toxic equivalent; OC: Organic carbon; BC: Black carbon

Report 12/20/2006 Page 22
Figure 1. Sampling location from West Michigan Park
West Michigan Park (WMP) soil used for this study was sampled from location labeled as Dow-SHL-02770.

Report 12/20/2006 Page 23
Figure 2. Sampling location from Imerman Park
Imerman Park (IP) soil used for this study was sampled from location labeled as Dow-THT-02769.
Report 12/20/2006 Page 24
Scheme A Scheme B
Figure 3. Fractionation scheme for dry-sieving coupled with aerosol cyclone
Figure 4. Fractionation scheme for wet-sieving combined with sedimentation
Soil
<40µm 40-2000µm
Scheme A Scheme B
Sedimentation/wet- sieving
Combine
Dry-sieving
40-250µm
<250µm
250-2000µm
Soil
<20µm 20-2000µm
Sedimentation/wet- sieving
Combine
Dry-sieving
20-53µm
5-53µm
53-2000µm 5-20µm <5µm
Sedimentation
Soil
<250µm 250-2000µm
5-53µm
53-2000µm
<5µm
<53µm
Dry-aerosol cyclone
Soil
Dry-sieving Dry-sieving

Report 12/20/2006 Page 25
0
1
2
3
4
5
6
7
8
0.1 1 10 100 1000 10000
Particle Size, µm
Vol
ume
(mas
s), %
WMP bulk soilWMP250-2000µmWMP<250µm
A
0
1
2
3
4
5
6
7
8
0.1 1 10 100 1000 10000
Particle Size, µm
Volu
me
(mas
s), %
WMP bulk soilWMP53-2000µmWMP5-53µmWMP<5µm
B
Figure 5. Particle size distribution of bulk and fractionated West Michigan Park soil by dry-sieving combined with aerosol cyclone
Figure A: West Michigan Park bulk soil and fraction 250-2000 µm and <250 µm; Figure B: West Michigan Park bulk soil and fraction 53-2000 µm, 5-53 µm and <5 µm.

Report 12/20/2006 Page 26
R2 = 0.98
R2 = 0.31
0
2000
4000
6000
8000
10000
1.00 2.00 3.00 4.00 5.00 6.00
Organic Carbon Content, %
Est
imat
ed T
EQ, n
g/kg
WMP
IP
Figure 6. Correlation between estimated toxic equivalent (E-TEQ) and organic carbon
content for dry-sieving
Solid squares are for West Michigan Park (WMP) soil and its fractions, Open squares are for Imerman Park (IP) soil and its fractions. Solid and dotted lines are linear regression lines between estimated TEQ concentration and organic carbon content in bulk and fractionated WMP and IP soil.

Report 12/20/2006 Page 27
0
1
2
3
4
5
6
7
8
0.1 1 10 100 1000 10000
Particle Size, µm
Vol
ume
(mas
s), %
WMP bulk soilWMP250-2000µmWMP<250µm
0
1
2
3
4
5
6
7
8
0.1 1 10 100 1000 10000
Particle Size, µm
Volu
me
(mas
s), %
bulk soil53-2000µm5-53µm<5µm
Figure 7. Particle size distribution of bulk and fractionated West Michigan Park soil by
wet sieving combined with sedimentation
Figure A: West Michigan Park bulk soil and fraction 250-2000 µm and <250 µm; Figure B: West Michigan Park bulk soil and fraction 53-2000 µm, 5-53 µm and <5 µm.

Report 12/20/2006 Page 28
R2 = 0.83
R2 = 0.42
0
2000
4000
6000
8000
10000
12000
14000
16000
1 2 3 4 5 6
Organic Carbon Content, %
Estim
ated
TEQ
, ng/
kgWMP
IP
Figure 8. Correlation between estimated toxic equivalent (E-TEQ) and organic carbon content for wet-sieving
Solid diamonds are for West Michigan Park (WMP) soil and its fractions, Open diamonds are for Imerman Park (IP) soil and its fractions. Solid and dotted lines are linear regression lines between estimated TEQ concentration and organic carbon content in bulk and fractionated WMP and IP soil.

Geochemistry Data Supplement
January 31, 2007

Fractionation of Tittabawassee River Floodplain Soils
Eleven bulk soil samples were collected from Tittabawassee River floodplain at various depth along a transect in Reach L. The soils were transported back to the laboratory (Midland, MI) and sieved through a 2 mm brass sieve. The soils were then fractionated by size according two schemes (i.e., A and B) by wet-sieving and sedimentation. For Scheme A, the soils were separated into two size fractions, 250-2000 µm and <250 µm; and for Scheme B, the soils were fractionated into three size fractions, 53-2000 µm, 5-53 µm and <5 µm. Detailed fractionation procedures are described in the report submitted to Michigan Department of Environmental Quality entitled “Method development for determination of the distribution of polychlorinated dibenzo-p-dioxin/dibenzofurans on soil fractions from the Tittabawassee river floodplain,” included in this Attachment.
The distribution of soil mass in each fraction and the distribution of polychlorinated dibenzo-p-dioxin/dibenzofurans (PCDD/Fs) as measured by the estimated toxicity equivalent (E-TEQ) in each fraction were determined (Table 1 and Table 2). The PCDD/Fs congener patterns are presented in Appendix A, attached. Floodplain soils and their sub-domains were characterized for total organic carbon content and black carbon content (Table 3). Selected soils and their sub-domains were characterized for their specific surface area (Table 4).

Table 1 Soil mass and PCDD/Fs E-TEQ distribution for fractionation Scheme A
250-2000µm <250µm
Depth Bulk E-
TEQ Soil mass
% E-TEQ E-TEQ
% Soil mass % E-TEQ E-TEQ %
Soil Mass
Balance E-TEQ Balance
Soil Location (ft bgs) (g) (%) (ng/kg) (%) (%) (ng/kg) (%) (%) (%) RL-246+00-SW20 3-4 530 7.8 49 0.7 88.4 390 65.0 96.2 65.8RL-246+00-SW20 4-5 2200 8.5 11000 42.4 87.8 1500 59.8 96.2 102.2RL-246+00-SW20 5-6 3400 24.5 46000 331.9 72.2 8700 184.7 96.7 516.6RL-246+00-SW20 6-7.5 10000 9.4 15000 14.1 84.5 10300 87.0 93.9 101.1RL-246+00-SW20 7.5-8.5 22000 5.3 43000 10.4 93.5 4500 19.1 98.9 29.5RL-246+00-SW85 0-0.6 930 15.0 94 1.5 82.6 1550 137.7 97.6 139.2RL-246+00-SW85 0.6-1.5 830 20.0 870 20.9 77.0 1100 102.0 96.9 122.9RL-246+00-SW85 1.5-2.5 24 25.6 <10 NA 70.8 32 94.4 96.4 94.4RL-246+00-SW265 0-0.8 970 1.7 400 0.7 96.5 760 75.6 98.2 76.3RL-246+00-SW265 0.8-1.1 1900 9.7a 2600 13.3 75.6 1100 43.7 85.2 57.0RL-246+00-SW265 1.1-3.1 68 0.0 0 0.0 93.2 78 106.9 93.2 106.9
a: This fraction is essentially all <250 µm due to incomplete removal of aggregates when soaking soil prior to fractionation NA: Not applicable

Table 2. Soil mass and PCDD/Fs E-TEQ distribution for fractionation Scheme B
53-2000µm 5-53µm <5µm
Depth Bulk
E-TEQ
Soil mass
% E-TEQ E-TEQ
%
Soil mass
% E-TEQE-TEQ
%
Soil mass
% E-TEQE-TEQ
%
Soil Mass
Balance E-TEQ Balance
Soil Location (ft bgs) (ng/kg) (%) (ng/kg) (%) (%) (ng/kg) (%) (%) (ng/kg) (%) (%) (%)RL-246+00-SW20 3-4 530 74.0 210 29.3 15.5 1200 35.0 8.7 1700 27.8 98.1 92.1RL-246+00-SW20 4-5 2200 63.2 570 16.4 21.1 2200 21.1 10.8 3200 15.8 95.2 53.3RL-246+00-SW20 5-6 3400 80.5 150000 3551.1 11.3 14000 46.4 5.1 21000 31.5 96.8 3629.0RL-246+00-SW20 6-7.5 10000 68.4 4200 28.7 16.1 16000 25.7 10.2 22000 22.5 94.7 77.0RL-246+00-SW20 7.5-8.5 22000 72.7 1500 5.0 14.0 12000 7.6 9.1 16000 6.6 95.8 19.2RL-246+00-SW85 0-0.6 930 84.2 670 60.7 9.4 4100 41.4 4.0 7200 31.0 97.6 133.1RL-246+00-SW85 0.6-1.5 830 86.3 640 66.5 6.6 3100 24.7 4.5 5000 27.2 97.4 118.5RL-246+00-SW85 1.5-2.5 24 89.4 <10 NA 6.4 230 61.1 3.8 305 48.6 99.6 109.7RL-246+00-SW265 0-0.8 970 31.5 1500 48.7 44.4 660 30.2 19.6 870 17.6 95.5 96.5RL-246+00-SW265 0.8-1.1 1900 28.0 1400 20.7 41.2 1100 23.9 23.1 1400 17.0 92.4 61.6RL-246+00-SW265 1.1-3.1 68 22.3 49 16.1 39.1 68 39.1 31.9 77 36.1 93.3 91.3
NA: Not applicable

Table 3. Total organic carbon and black carbon content of soils and soil fractions
Sample ID/Depth (ft) Fraction
Total organic carbon (%)
Black carbon (%)
E-TEQ (ng/kg)
Organic carbon normalized E-TEQ (ng/kg-OC)
RL-246+00-SW20 Bulk soil 0.86 0.13 530 61628 3-4 250-2000µm 0.36 0.13 49 13611 <250µm 0.61 <0.10 390 63934 53-2000µm 0.22 <0.10 210 95455 5-53µm 1.62 0.60 1200 74074 <5µm 2.86 0.50 1700 59441 RL-246+00-SW20 Bulk soil 0.69 0.14 2200 318841 4-5 250-2000µm 0.35 <0.10 11000 3142857 <250µm 0.64 0.11 1500 234375 53-2000µm 0.14 <0.10 570 407143 5-53µm 2.08 0.40 2200 105769 <5µm 2.56 0.47 3200 125000 RL-246+00-SW20 Bulk soil 0.38 0.13 3400 894737 5-6 250-2000µm <0.10 <0.10 46000 NA <250µm 0.51 <0.10 8700 1705882 53-2000µm 0.13 <0.10 150000 115384615 5-53µm 1.99 0.44 14000 703518 <5µm <0.10 0.43 21000 NA RL-246+00-SW20 Bulk soil 1.11 <0.10 10000 900901 6-7.5 250-2000µm 0.41 <0.10 15000 3658537 <250µm 0.63 0.17 10300 1634921 53-2000µm 0.22 <0.10 4200 1909091 5-53µm 1.98 0.96 16000 808081 <5µm 2.18 0.39 22000 1009174 RL-246+00-SW20 Bulk soil 0.36 <0.10 22000 6111111 7.5-8.5 250-2000µm 0.26 <0.10 43000 16538462 <250µm 0.32 <0.10 4500 1406250 53-2000µm <0.10 <0.10 1500 NA 5-53µm 0.26 0.32 12000 4615385 <5µm 1.91 0.47 16000 837696
NA: Not applicable.

Table 3. Total organic carbon and black carbon content of soils and soil fractions (Continued)
Sample ID/Depth (ft) Fraction
Total organic carbon (%)
Black carbon (%)
E-TEQ (ng/kg)
Organic carbon normalized E-TEQ (ng/kg-OC)
RL-246+00-SW85 Bulk soil 2.42 0.38 930 38430 0-0.6 250-2000µm 1.37 0.13 94 6861 <250µm 2.13 0.38 1550 72770 53-2000µm 0.85 0.19 670 78824 5-53µm 8.54 2.32 4100 48009 <5µm 12.37 1.60 7200 58205 RL-246+00-SW85 Bulk soil 0.78 0.13 830 106410 0.6-1.5 250-2000µm <0.10 <0.10 870 NA <250µm 0.87 0.12 1100 126437 53-2000µm 0.19 <0.10 640 336842 5-53µm 5.99 0.62 3100 51753 <5µm 8.53 0.57 5000 58617 RL-246+00-SW85 Bulk soil 0.33 <0.10 24 7273 1.5-2.5 250-2000µm 0.36 <0.10 <10* NA <250µm <0.10 <0.10 32 NA 53-2000µm 0.37 <0.10 <10 NA 5-53µm 2.23 0.16 230 10314 <5µm 5.00 0.50 305 6100 RL-246+00-SW265 Bulk soil 5.57 1.98 970 17415 0-0.8 250-2000µm 23.96 6.24 400 1669 <250µm 5.46 1.59 760 13919 53-2000µm 7.10 2.52 1500 21127 5-53µm 4.56 1.25 660 14474 <5µm 5.73 0.81 870 15183 RL-246+00-SW265 Bulk soil 3.42 1.20 1900 55556 0.8-1.1 250-2000µm 5.76 2.16 2600 45139 <250µm 2.96 0.93 1100 37162 53-2000µm 2.52 1.03 1400 55556 5-53µm 3.05 0.59 1100 36066 <5µm 4.46 0.76 1400 31390 RL-246+00-SW265 Bulk soil 1.46 0.24 68 4658 1.1-3.1 <250µm 1.47 0.23 78 5306 53-2000µm 0.50 0.10 49 9800 5-53µm 1.04 0.34 68 6538 <5µm 2.35 0.33 77 3277
NA: Not applicable.

Table 4. Specific surface area
Sample ID/Depth (ft) Fraction
Specific surface area (m2/g)
RL-246+00-SW20 Bulk soil 3.42 5-6 250-2000µm 0.47 <250µm 3.54 53-2000µm 0.70 5-53µm 5.78 <5µm 27.60 RL-246+00-SW85 Bulk soil 0.96 0-0.6 250-2000µm 0.41 <250µm 0.94 53-2000µm 0.45 5-53µm 2.03 <5µm 9.66 RL-246+00-SW265 Bulk soil 5.92 0-0.8 250-2000µm 2.55 <250µm 6.00 53-2000µm 3.39 5-53µm 4.10 <5µm 16.84

Appendix A

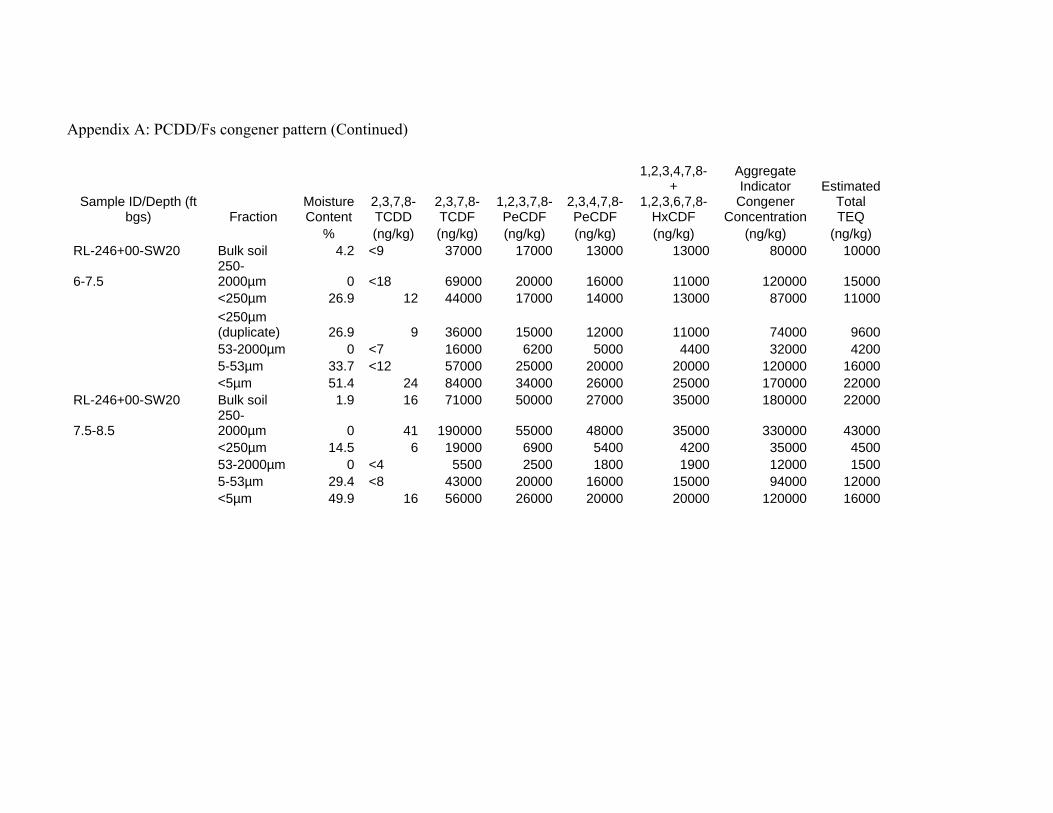
Appendix A: PCDD/Fs congener pattern
Sample ID/Depth (ft bgs) Fraction
Moisture Content
2,3,7,8-TCDD
2,3,7,8-TCDF
1,2,3,7,8-PeCDF
2,3,4,7,8-PeCDF
1,2,3,4,7,8- +
1,2,3,6,7,8-HxCDF
Aggregate Indicator
Congener Concentration
Estimated Total TEQ
% (ng/kg)
(ng/kg)(ng/kg) (ng/kg) (ng/kg) (ng/kg) (ng/kg)RL-246+00-SW20 Bulk soil 2.9 <5 1600 800 620 1100 4100 530
3-4 250-2000µm 0 <4 170 67 48 88 380 49<250µm 17.9 <6 1400 570 430 600 3000 39053-2000µm 0 <5 780 340 230 280 1600 2105-53µm 34.8 <19 4000 1800 1400 2400 9600 1200<5µm 54.4 22 5300 2400 1800 4200 14000 1700
RL-246+00-SW20 Bulk soil 4.9 <6 9700 2900 2400 2100 17000 2200
4-5 250-2000µm 0 <7 52000 12000 12000 6300 83000 11000<250µm 18.7 <8 5500 2100 1800 1800 11000 150053-2000µm 0 <4 1500 1100 730 1100 4500 5705-53µm 29.1 <5 7500 3500 2800 3400 17000 2200<5µm 51.2 <14 11000 4800 3700 5100 25000 3200
RL-246+00-SW20 Bulk soil 3.9 <6 13000 4800 4000 3800 26000 3400
5-6 250-2000µm 0 32
180000 65000 59000 38000 340000 46000
<250µm 20.3 <5 30000 14000 11000 12000 66000 870053-2000µm 0 100 410000 290000 210000 270000 1200000 1500005-53µm 40.1 <14 50000 21000 18000 18000 110000 14000<5µm 58.7 <21 78000 33000 26000 27000 160000 21000
Appendix A: PCDD/Fs congener pattern (Continued)
Sample ID/Depth (ft bgs) Fraction
Moisture Content
2,3,7,8-TCDD
2,3,7,8-TCDF
1,2,3,7,8-PeCDF
2,3,4,7,8-PeCDF
1,2,3,4,7,8- +
1,2,3,6,7,8-HxCDF
Aggregate Indicator
Congener Concentration
Estimated Total TEQ
% (ng/kg)
(ng/kg)(ng/kg) (ng/kg) (ng/kg) (ng/kg) (ng/kg)RL-246+00-SW20 Bulk soil 4.2 <9 37000 17000 13000 13000 80000 10000
6-7.5 250-2000µm 0 <18 69000 20000 16000 11000 120000 15000<250µm 26.9 12 44000 17000 14000 13000 87000 11000
<250µm (duplicate) 26.9 9
36000 15000 12000 11000 74000 9600
53-2000µm 0 <7 16000 6200 5000 4400 32000 42005-53µm 33.7 <12 57000 25000 20000 20000 120000 16000<5µm 51.4 24 84000 34000 26000 25000 170000 22000
RL-246+00-SW20 Bulk soil 1.9 16 71000 50000 27000 35000 180000 22000
7.5-8.5 250-2000µm 0 41 190000 55000 48000 35000 330000 43000<250µm 14.5 6
19000 6900 5400 4200 35000 4500
53-2000µm 0 <4 5500 2500 1800 1900 12000 15005-53µm 29.4 <8 43000 20000 16000 15000 94000 12000<5µm 49.9 16 56000 26000 20000 20000 120000 16000

Appendix A: PCDD/Fs congener pattern (Continued)
Sample ID/Depth (ft bgs) Fraction
Moisture Content
2,3,7,8-TCDD
2,3,7,8-TCDF
1,2,3,7,8-PeCDF
2,3,4,7,8-PeCDF
1,2,3,4,7,8- +
1,2,3,6,7,8-HxCDF
Aggregate Indicator
Congener Concentration
Estimated Total TEQ
% (ng/kg) (ng/kg)(ng/kg) (ng/kg) (ng/kg) (ng/kg) (ng/kg)RL-246+00-SW85
Bulk soil 14.3 15
3300 1400 1200 1200 7000 930
0-0.6 250-2000µm 0 <4 340 130 110 130 710 94<250µm 35.8 22 4600 1700 1500 1500 9400 1300
<250µm (duplicate) 35.8 19 7100 2500 2200 2000 14000 180053-2000µm 0 7 2100 1200 850 1000 5100 6705-53µm 55.3 68 14000 6100 5200 5200 31000 4100<5µm 64.7 110
25000 10000 8800 9400 54000 7200
RL-246+00-SW85
Bulk soil 8 <7 2300 1900 980 1700 6900 8300.6-1.5 250-2000µm 0 <4 5200 520 770 300 6800 870
<250µm 21.7 5 4500 1700 1400 1200 8700 110053-2000µm 0 <4 2900 710 740 410 4800 6405-53µm 48 17 11000 4600 3900 3900 23000 3100<5µm 64.2 40 17000 7700 6200 6400 38000 5000
RL-246+00-SW85
Bulk soil 5.2 <4 75 35
25
35 170 24 1.5-2.5 250-2000µm 0.8 <4 11 <8 <9 <7 <32* <10*
<250µm 23.5 <4 110
48
37
37 230 32 53-2000µm 1.8 <4 <7 <7 <9 <4 <31 <10
5-53µm 45.3 <6 870 340 300 280 1800 240
5-53µm (duplicate) 45.3 <5 760 330 280 250 1600 220<5µm 63.2 <13 1200 430 370 380 2300 310
<5µm (duplicate) 63.2 <11 1100 420 360 340 2300 300

Appendix A: PCDD/Fs congener pattern (Continued)
Sample ID/Depth (ft bgs) Fraction
Moisture Content
2,3,7,8-TCDD
2,3,7,8-TCDF
1,2,3,7,8-PeCDF
2,3,4,7,8-PeCDF
1,2,3,4,7,8- +
1,2,3,6,7,8-HxCDF
Aggregate Indicator
Congener Concentration
Estimated Total TEQ
% (ng/kg) (ng/kg)(ng/kg) (ng/kg) (ng/kg) (ng/kg) (ng/kg)RL-246+00-SW265
Bulk soil 17.9 46 3200 1400 1100 1500 7200 970
0-0.8 250-2000µm 9.6 29 1200 490 460 610 2800 400<250µm 51.5 43 2500 980 880 1000 5400 76053-2000µm 2 34 6100 2100 1800 1700 12000 15005-53µm 49.1 38 2000 900 770 1000 4700 660<5µm 57.3 54 2800 1100 970 1300 6200 870
RL-246+00-SW265
Bulk soil 1 17 6900 2700 2400 2300 14000 19000.8-1.1 250-2000µm 2 36 9100 4100 3200 3100 19000 2600
<250µm 30 19 4000 1800 1400 1300 8600 110053-2000µm 1 14 4300 2700 1800 2300 11000 14005-53µm 39.5 15 3600 1600 1400 1500 8100 1100<5µm 53.7 21 4900 2100 1800 2000 11000 1400
RL-246+00-SW265
Bulk soil 4.7 <4 230 100 79 110 510 681.1-3.1 <250µm 40 <8 300 100 87 71 560 78
53-2000µm 1 <4 170 72 58 66 360 495-53µm 34.7 <4 240 99 80 92 520 68<5µm 54.7 <9 350 88 72 63 570 77