Earth’s Interior and Geophysical Properties Physical Geology 11/e, Chapter 17.

UNITED STATES DEPARTMENT OF THE
INTERIOR. J. A. Krug, Secretary.
GEOLOGICAL SURVEY W. E. Wrather, Director.
CIRCULAR 33 October 1948
GEOLOGY AND WATER-BEARING PROPERTIES OF THE "1,400-FOOT" SAND IN THE MEMPHIS AREA
A PROGRESS REPORT
By .
Robert Schneider and E. M. Cushinl
Prepued in coopeptioo 1ritk the
MEMPHIS LIGHT, GAS, AND WATER DIVlSION
WASHINGTON, D. C.

GEOLOGY AND WATER-BEARING PROPERTIES OF THE "1,400-FOOT". SAND IN THE MEMPHIS AREA
A PROGRESS REPORT By Robert Sc4neider and E. M. ~ushing
CONTENTS
Page Introduction••••••••••••••••••••••••••••• 2
History of the development of tbe "1,40D-foot" sand•••••••••••••••••••••· 2
Previous investigations•••••••••••••••• 2 The present investigation ••••• ~......... 2 Acknowledgments........................ 2
Geology•••••••••••••••••••••••••••••••••• 3 Regional geology••••••••••••••••••••••• 3 Geology of the "1,400-foot" sand••••••• 3
Stratigraphy••••••••••••••••••••••••• 3
Page Geology--continued.
Geology of the "1,40D-toot".sand--Con. Structure and thickness.............. 4 Mechanical composition••••••••••••••• 6 Preliminary microscopic study........ 7
Quality ot the water••••••••••••••••••••• S Water-bearing properties••••••••••••••••• 8
Pumpage and water-level histo.r,r........ 8 Pumping tests•••••••••••••••••••••••••• 11
Summar,r •••••••••••••••••••••••••••••••••• 13
ILWSTRATIOIS
Page Plate 1. Map of Memphis, tennessee, showing locations of deep wells and location ot cross
section ••••••••••••••••••••••••••••••••••••••••••••••••••••••••••••••••..•••••••••• 2 4 2.
Figure l. Geologic _cross section (A-A') through Memphis, Tennessee•••••••••••••••••••••••••• Map of Shelby County, Tennessee, showing generalized structural contours on upper
surface ot 1 1,40D-foot" sand••••••••••••••••••••••••••••••••••••••••••••••••••••• 5
9
12
2. Graphs showing relation between water-level fluctuations and pumpage trom the "1,4DO-foot• sand••••••••••••••••••••••••••••••••••••••••••••••••••••••••••••••••
3. Approximate water-level declines at the end of l day at various distances trom a well being pumped at 1,000 gallons a minute••••••••••••••••••••••••••••••••••••••
ABSTRACT
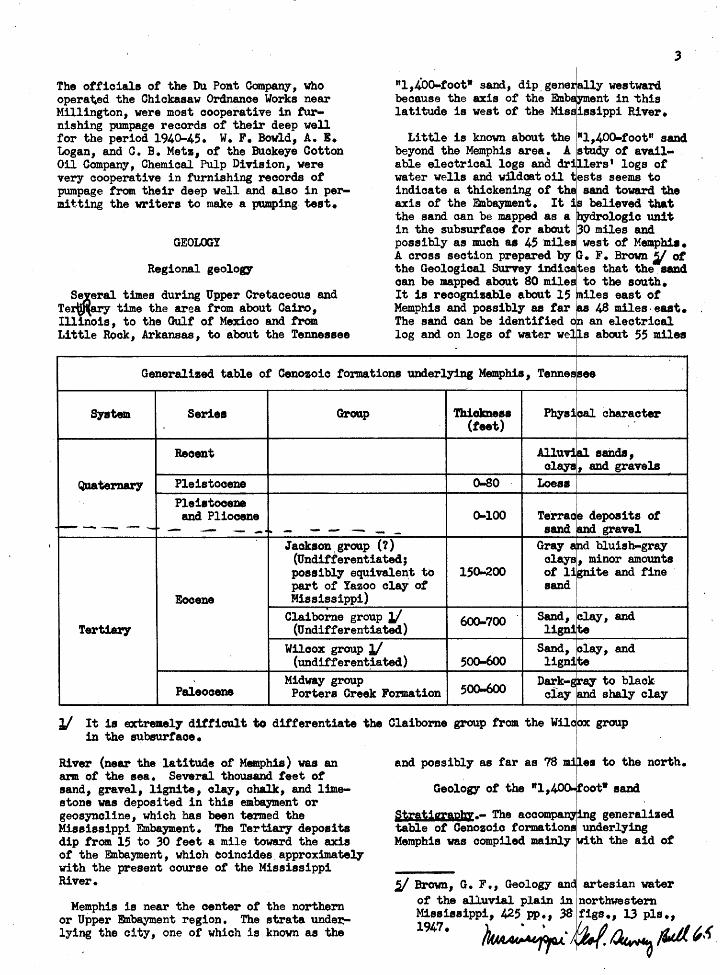
The entire municipal water supply of Memphis, Tennessee, comes from sandy beds in the Claiborne and Wilcox groups (Eocene). Sirce 1924 a number of w~lls have obtained water from a sand in the lower part ot the Wilcox grQUp. It is about 1,200 to 1,400 feet below the land surface and is known locally as t~e "1,40D-foot" s~~~.
The ·aquifer is composed ot unconsolidated fine- to medium-grained quartz sand interbedded with thin layers of clay. It is apparentlf about 210 feet thick and the upper surface dips westWard about .30 feet a mile. It is believed that the sand can be identified as a ~ologic unit as far as 45 miles vest, 78 miles north, 48 miles east, and 80 milPs s~th of Memphis.
Water from the "1,400..foot" sand is very soft but it contains iron. In the Memphis
area its temperatur~ ranges tram 70° to 72° F.
Pumping tests were ~e and the values for transmissibility and ~he coefficient ot storage were found to vary somewhat in different parts of the city. 1
About 49 billion gallons of water was pumped from the "1 ,4C>O-foot" sand in Shelby County, Tennessee, from 1924 through 1946. In 1946 an average of abont 8.7 million gallons of water was 'pumped daily from the sand in Memphis. It_ is estimated that about 1 mil1ton gallons ot water is pumped daily trom th~ -~1,40Q-foot" sand in De Soto County, Mis""issipp1, and Crittenden County, Arkansas.
A study of the available water-level and pumpage data indicates that nearlJ all the water pumped up·to and including 1945 came trom storage vi thin the sand. There is, as yet, no indication that recharge bas been affected by the pumping.
1

UNITED STATES DEPARTMENT OF THE INTERIOR GEOLOGICAL SURVEY
OFFICIAL CITY MAP OF
MEMPHIS TENNESSEE
WALTER CHANDLER
OSCAR P. WILLIAMS ROBERT I . FREDERICKS
JOSEPH P. BOYLE DONALD C. MILLER
PMMR!D 1Y THI:
DEPARTMENT OF PUBLIC WORKS WILL~~ 1~.f.2WLE R
1944 -"··_!_ ~--·· __ T ___ _
t......,....,., ___ .. ....... _ .. .. .., ........... ..,.. ... , REPRODUCED IY THE
U . S . IIOLOII CAL SURVEY
WITH THE rEIUII SSION OP' . , DE,T. 0' PUILI C WOIUCI
~
s s M I S. S l
. : ~
l I
j \ / ·-.
I ~ I ~ I I l,j
\ \ ! I' 'I
.~ I
'·I :-.: r;
{' /~y l 1 '·· •. ··-: "~"""r:;...o;;;:?"
MAP OF MEMPH I S, TENN., SHOWING LOCATIONS OF DEEP WELLS AND LOCATION OF CROSS SECTION
CIRCULAR 33 PLATE 1
EXPLANATION
• USED WELL SCREENED IN " t, 400-FOOT " SAND.
Q UNUSED WELL.

2
INTRODUCTION
History of the development of the "1,400-foot" sand
The entire municipal water supply of Memphis, _Tennessee, comes from water-bearing sands of Eocene age. Most of the municipal supply is obtained from sandy beds about> 400 to 500 feet below the land .surface in the Claiborne group that are known locally as the "500-foot" sand. A supplementary source of water is obtained from a sand about 1,200 to 1,400 feet below the land surface in the lower part of the Wilcox group, known locally as the "1,400-f'oot• sand.
In 1924 a well tapping the "1,400-foot• sand was .drilled under the supervision of W. G .Lanham, of the Memphis Light, Gas and Water Division. According to Mr. Lanham, 'JI an exploratory well that reached this aquifer (water-bearing formation) had been drilled in 1902.
By 1928 the City had nine wells in the "1,400-foot" sand. At the present time the city uses 19 wells in this stratum and the Buckeye Cotton Oil Company uses one. (See p 1. 1 for location of wells in use.) From 1940 to 1945 a well (No. 148-tJ>) screened in this sand was pumped at the Chickasaw Ordnance Works near Millington, Tennessee, about 15 miles north of Memphis.
A partial inventory of wells in the vicinity .or Memphis has disclosed that the city of West Memphis, Arkansas, about 7 miles west of Memphis, has two wells in this sand and that Marion, Arkansas, about 5 miles north of West ~~emphis, has one. Several 2- and 3-inch wells probably in the same sand have been reported south of Memphis in De Soto County, Mississippi.
Previous tnvestigations
The earliest report on groand-water conditions in this region was written by L. c. Glenn. Y in 1906. In 1931 F. G. Wells l/
i/ Personal communication from W. G. Lanham to R. G. Kazmann, formerly with the U. s. Geological Survey.
?:/ Glenn, L. c., Underground waters of Tennessee and Kentucky west of Tennessee River and of an adjacent area in Illinois: U. S. Geol. Survey Water-Supply Paper 164, 1906.
l/ Wells, F. G., A preliminary re:9ort on the artesian water supply of Memphis, Tennessee: U. s. Geol. Survey Water-Supply Paper 638-A, 1931.
wrote a preliminary rPport on the artesian water supply of Memphis. In 1933 Wells Ill wrote a fairly comprehensive report on the ground-water resources of western Tennessee.
The Memphis Light, Gas and Water Division conducted a series of pumping tests on the "1,400-foot" aquifer from l932 to 1934. The results of these tests were analyzed by ·R. G. Kazmann, together with most of/the data obtained during the present investigation.
Records of. water levels have been published in Water-Supply Papers 817, 840, 8451 886 907, 937, 945, 987, and 1017 of the Geological Survey under the title "Water levels and artesian pressure in observation wells in the United States." Water-level measurementl from April 1927 to March 1931 are presented graphically in Water-supply Paper 656.
The present investigation
The field work ·for this r•port was started in 1945 by R. G. Kazmann, who resigned tram the Geological ~Y before a report could be prepared. Most of the data in the section on water-bearing properties were obtained by him, except for those on a pumping test at the Buckeye Cotton Oil Company and the most recent data on pampage. The original analysis of the hydrologic data was also made by Mr. Kazmann.
A typewritten report entitled "A brief review of ground-water condi tiona ir1 the vicinity of Memphis, Tennessee• was prepared by F. H. naer, Jr., and R. G. Kazmann in 1943. A progress report entitled "The water supply of the Memphis area" was writte:p. in 1944 by R. G. Kazmann and was issued in mimeographed form.
Acknowledgments
This investigation is being carried on under the general supervision of A. N. Sayre, Geologist in Charge of _the Ground Water Division of the Geological Survey. It was started under the general supervision of o. E. Meinzer (deceased) 1 Geologist in Charge of the Division. The investigation is under the immediate supervision of V • T. Stringfield, senior, geologist in the Geological Survey. It is being carried on in cooperation with the Memphis Light, Gas and Water Division. The writers express their thanks for the cooperation and assistance of Major T. H. Allen, c. M. McCord, w. G. Lanham, and A. J. Rumley, of the Memphis Light, Gas and Water Division.
The officials ot the Du Pomt Company, who opera~ed the Chickasaw Ordnance Works near Millington, were most cooperative in furnishing pumpage records of their deep well tor the period 1940..45. w. F. Bowld, A. E. Logan, and C. B. Metz, of the Buckeye Cotton Oil Company, Chemical Pulp Division, were very cooperative in furnishing records of pumpage from their deep well and also in permit.ting the writers to make a pumping test.
GEOLOGY
Regional geology
S~~eral times during Upper Cretaceous and Te~ time the area from about Cairo 1 Illinois, to the Gu1t ot Mexico and tram Little Rock, Arkansas, to about the Tennessee
"1,400..toot" sand, dip~ gene:t ally westward because the axis of the Embl:~ent in 'this latitude is west ot the Misfissippi River.
3
Little is known about the "1,400..toot" sand beyond the Memphis area. A study ot available electrical logs and drj~ers 1 logs ot water wells and wlldaat oil 1 ests seems to indicate a thickening of the sand toward the axis of the I!mbaym.ent. It j s believed that the sand can be mapped as a ~logic unit in the subsurface tor about 30 miles and possibly as much as 45 ·mUe2 west ot Memphia. A cross section prepared by P. F. Brown ~ ot the Geological Survey indicates that the aaDd can be mapped about 80 milee to the south. It is recognizable about 15 ~iles east of Memphis and possibly as tar~ 48 miles·eaat. The sand can be identified c n an electrical log and on logs of water wellls about 55 miles
Generalized table of Cenozoic formations underlying Memphis, Tennessee
S;yat. Series Groo.p Thiok:neaa (teet)
Pbyaj cal character
Recent Allun jal aailda, clayE , and gravels
Quatel"D8.17 Pleistocene o-so Loeaa
PleietoceDe and Pliocene 0..100 Terrae ~ deposits ot 1----- - - - _.,. - ._. ...... ·---- ....... - sand ~ gravel
Gray e ~d bluish-gray Jackson, group (?) (Undifferentiated; clay~: 1 minor amounts possibly equivalen.t to 15o-200 ot lj gni te and tine · part of Yazoo clay of sand
Eocene Mississippi)
Claiborne group 1/ (Undifferentiated)
600..700 Sand, liglrl
clay, and fte Tertiary'
Wilcox group 'J/ 5oo-600
Sand, clay, and (unditterent~ated) lignj te
Midway group jrq to black· Paleocene Porters Creek Formation 5oo-600
Da.tk-e clay and shaly clay
'J/ It is extremely ditficmlt to differentiate the Claiborne group from the Wile ox group in the subsurface.
River (near the ·latitude of Memphis) was an arm of the sea. Several thousand feet ot sand, · gravel, lignite, clay 1 chalk, and limestone was deposited in this embayment or geosyncline, which has been termed the Mississippi Embayment. The Tertiary deposits dip tram 15 to 30 teet a mile toward the axis ot the Embayment, which coincides approximatelY with the present course of the Mississippi River.
Memphis is near the center of the northern or Upper :&nbayment region. The strata under.lying the cj.ty, one of which is known as the
and possibly as far as 78 mjiJ.es to the north.
Geology ot the "1 ,400.!toot• sand
§tratigrappy.- The accomnarnkng generalized table of Cenozoic formations underlying Memphis was compiled mainly ~th the aid of
JJI Brown, G. F., Geology and artesian water of the alluvial plain in northvestern Mississippi, 425 pp., 38 figs., 13 pls.,
1947. ~-)~.f.~ {W1 ~.{

UNITED STATES DEPARTMENT OF THE INTERIOR GEOLOGICAL SURVEY
CIRCULAR 33 PLATE 2.
A A' 0.10
ii: - 8 -50 8· 64 __ ,.....[II.....,[J r----;... 1TTniT i ·~ W:."!~o~~~ ~ ~ ~ ,.,09 ---~H~i'~;l·:~l~; !l;i~~-~~n~1'1t--r1 '~l;;~·~,~,~-··~-~IT,:~:;~:.,· ---~,·~;;~. ;,:·;" ~.FH~'·;·'~:'·~"....-f1 ;' 1·,~;~~---------LL:Co)EE~S~ss"i(~PPLLJE;I S~T~O~C~E;N~E~)L===~:: __ --------------------------- . . . . ..
•oo ::::7.~i;.....:F~~-· F~~~~~~=-==-==-:~;;~ml2~:==.==~j~.#~ ·J: ¥; :#; ::::::f~f;:t=f: ;t~ ~t. ~-. t=====¥:.~ .. F:::::::===f~ .. i. =F. _j. t .. i. t.~ .. it~====:.;s~A ~ A"N ~GRAVEL( PL E 1 s roc ENE AN o ~L~CE N E > ---_- --~.::--,----======-==-==-=:::::::-:::==;;;;;-;;;==-==i~· ·~· ~·~· ·t===1~1-- •o•
~ - =~1\~-- =-=::- r"- ~ . . 0 ... . ~·:..;.··U;..:"':..;..." ~.+=' "='-.1' -------------- ~ ~- ~ /00------1~~· · ·····[· --~---------------------i~-~------------it-~i~~ .. ~-r---l~~·~ .. ~-'~~· ~ .. r-,~~~~·~}:::j:~::::::~::=:tt~::;:f1~;~.:r~~-~~rt~~.~~~ ---------------------------------------~------------------------------------------------------------------------------~j-~~-----r~~=·.·~.·.~--/OO
~_; ~i __ -- JACKSON GROUP ( ?) (EOCENE) ::-: - ~
MEA*------~Il-------------------------4~~----------~~}+~~--~-~~-~--~-~-~~~+---~~------i~~~E~-~-~-~~~-~-~----------------------------------------------------------------------~~==~~~~==~==~~------~~------~--~~~~-~~~~~?~-+~~--~~~ /::EL J-=-_- _ _ -- -:__ _ _ ------------ '-_--_::_- . . . . . LEttn
-::c:;: ..--- - - ~v ~=~-..j:.:-::..::j..------------------- """"" ------4~1---~----~==~~==~==~J~::~~~~l·==~=?:~==~~~~~~~~~--~f--~--~~~J---f;~------i~~-~ .. }+~t+~tt~tt~~------------------------------------~--------------------------------------------------------------------------------1~:·~=·r-r.·~·1· r------t~ .. ~-~-- /OO
/00 f.---? ... :;;.- -1 .... 1:::=: .. ·=.. ~-·-_·_· ~ ... . . . ~ ~~ ~ _ ... .
~. ~ ~ ~ ~~ ~ ,=,=F too------~~-------------------------+~~-----------+.~~~~--~~--~~--~0+--~~~ .. -~.~-----}.~.~ .. ~~~.~.~~~.~. ~~~~------------------------------------------------------------------------------------------------------------------------+7~~-.=-i-------f~~ .. ~-~--too
F. § · · · ~ ~· CLAIBORNE GROUP (EOCENE) ~ F.-:;.; •oo------~~~-~------------------------t:::~:~~: .. ~----------~~~.-~.~~~~~· ~--~~--~~--{~~-~··}---+~~.~~_ ::~-----}~:;;.~~ .. ~~~.~~:.~~~~-~~-~-~------------------~~~~~(U~N~D-IF_F_E_R_E_N_T_I_A_T_E_D_l ____________________________________________________________________________ ~~-t~-------t_~-:~.~--•oo
•oo--~--~~------------------------~rliJ' I .. ~-----------+~~~-~--~~~ .. ~·.'~----h~--~~---+~~----~~~~~~~-~-~~-~------------------------------------------------------------------------------------------------------------------------~ .. ~·t-~1-------t.·~·~·r---•oo . · .. I--"-~-·-_·:
:--:::-§ ~ ...--- r-
E: - - -~v~ ~ ------f=;t-------------------------t·~·~"t------------+~tt~r---1~~t-~r.·~'·1--t~t---~~------~~~~~~~~~§-----------------------------------------------------------------~============================~~:===~--~~~~==~·----i~~-~r-~-~-]l------~7r---••• 600 "":' . - ~ F:=:
~ bF. ~ E . ...
-----4~~--------------------~~~· ·+---------~~~-~-~~~~-~·· --~~-~--~-A-~~==~--~~~~·~· ----~~++~~~~~~~--------------------------------------------------------4 1 0 0 .. . . ~ - - - - -- .•.. ~ E='
~.:=-. -.:. ~ ~ - -- r.:,=..: - .~_·_:::-.. ... ,:>. .. /-- --;:;.;;: F . . . . r..:=.., , ''~="=' --TOO------~~-------------------------+.~~----------~~~~----~~--~~--~~--~~~--~~~~~~~H=~~~-------------------------------------------------------------------
~ ~ / ~ ·_ 1---------.---J~r.o_...;.._l-- ---:. _-_ ~ ~ ·-t?t---.1E "' <::: /J =~ - § ~ ~· WILCOX GROUP (EOCENE)
•oo------~-~- -----------------------~~~~~-~~----------~~~_~,~-=~---~~--. ~~_~-f~~.~~-~~~~-~-~-~~~~-~~~+.~----~~~:~~-~~~-~=~~-~+~~~~.~~~. ~~.~------------------~~~~(-U_N_D_I_F_F_E_R_E_N_T_IA_T __ E_D_) ____________________ _,
----------------~.....;..~c...;· -------EXPLANATION
SOURCE OF MATERIAL : DR I LLERS ' LOGS OF WELLS PENETRATING THE " 1,400 -FOOT " SAND
LEGEND
ITIIJ LOESS ("TO PSOil:) c=:J 15ANO
f.:.:.:.j SAND AND CLAY r.....-.¢'1 CLAY
~ SAND AND GRAVEL - LI QN I TE
~ GRAV EL ~ •ROCK•tt
C. LIGNITE AND SAND • POSSIIL.Y IAMOITON( , srdsTONr:, Ofl MAllO SHALl
HOR IZONTAL SCALE 'lio VERTICAL SCALE
~ ~· 1----------------+~--F==l------4;;;...;;;;.'-__ 600
~ 1-----------------F~----{"~~· ~ .. i--''-'----+=-=--~---- 800 --
- .. ~::.· ~ - ~ -_- F_- - . . . ,_-___ t..=....::_- __ -
F--::: · ~ ~ ;;;;..; . . . ,....... p= ~ •• o,----~~~= .. ~.~----------------------~~~.+.------------~~~~-~-~--~~~-~--~~--~-~-~--~-~-~-----b~~~~~-~-~~~-~~~~~~--~--------------------------------~----------------------------~----------------_--_-_--_-_--_--_-_--_-_--_--_~_--_-_--_--_-_--_--_-_-~-F=_.~·.··3 ... v~.-.. ~:.::~ .. ::r------r .. ~ .. ~ ... r--··· ---t~~· ---------E~~.:;;. .. t, ------i=~=IT~~-_ii::~· ~~,__~=t=f_~-t==f.-~--¢====f:=~~~--W~1= &~§:-=ffi=~--~=====-:~==-==~~-~===--=----__ -__ -__ -_-_-__ -__ -__ -__ -_-__ -_-_-__ -__ -___________ ldt:J---rT-- I, 000
1.ooo ~ .. :=:::: ~ .. -::. . . . . '---,...- . . . . -~- _ ~ ~ -- = !=;:.::;: - -~ .. . :"<: ·. ~
1,100 ------e:.;....;,-;;;,j--------------------'-------E::.,_;:::l•· ~---=-....C.---~---_-:.,r-:...:-4.,.~'-'r--~'~· -+."-_-__ --1:::-:-::l--+:...:..:.+--+··.:.···.:..·· ~--F+-------j.:.... :..: .. 4. -hd-1.:..:...:.-· ,_ ... _. +-:....:.f..f--:4-------------------- . I 4 0 0 - F 0 0 T II sAND ---------------------------------------------------------------------------------------==--;;;!:-=· ·=·!---- 1,100
~--~ - ~ . . ----- -~.· :... ....... ' -------------- ~~ c...:...:.: ~ c.:..:..:..: L.:...:....:... . • •• .,;,.:.:_...:..:...:. --?---- =-= r:-=-==-~ ----- . -
E ------~--4~·------~~-------------------------+.~. ~--------------~~------------------------------------------------------------------------------------===-----------=?~-~~------~==~~=-----------------------------------------------------------------------~~--- ~ •oo :::=: - ----------?---_-_ -- -----?---
4••~-----k~------------------------~~~---------------+~~~~----------~~~~==~----~--------------------------------------~----------------------------------------------------------------------------------------------------------------~~~-- I,>OO ~~-'-·'-'·+-------?--:- -?-- ~
~~-----'~~--- ~ MIDWAY
GROUP (PALEOCE~E)
GEOLOGIC CROSS SECTION (A-A') THROUGH MEMPHIS, TENNESSEE

4
the geologic maps of the States of Arkansas fJ/ 1 l.fississippi 7/, and Tennessee. ~ Corre. lations are based on stratigraphic positions and lithologic charact~ristics as described for the most part in drillers 1 logs. The "1,400-foot11 sand is presumed to be in the lower part of the Wilcox group of sands, clays, and liJni te.
Roberts and Collins 2/ differentiated the Wilcox group of Tennessee, subdividing it into the Grenada, Holly Springs, and Ackerman formations. The middle Eocene (Claiborne group) was presumed to be absent. This interpretation, which was followed by Wells ~ was based on a subdivision of the Eocene of north-central Mississippi by Lowe. iL/ According to the most recent geologic map of Mississippi, :}6.1 part-of the strata which were mapped earlier as Wilcox may actually be, in part at least, of Claiborne age.
In this report no attempt has been made to subdivide the Wilcox group in the subsurface bec:;ause the history of marine advances and regressions in the upper embayment was so complicated that marine and continental beds grade laterally and vertically into one another. In earlier work correlations on the surface have generally been based on fragmentary remains of plants, but these are generally destroyed by rotary drilling.
At least locally the "1,40D-foot" sand con-' sists predominantly of unconsolidated fine-to medium-grained quartz sand. Drillers I logs geDer~ describe the upper third or the unit as •sand", •artesian sand" 1
8 good sand", or "water-bearing sand.• Electrical logs of wells in the vicinity of Memphis essentially agree with these descriptions, although they also indicate that there are. some beds of argillaceous sand and sandy clay-, up to 5 or 10 feet thick, interbedded with the sand. Overlying the sand c:re thick beds of gray-1 bluiah-gr&.7, and green clais and shal7 clayw interbedded with thin lqers of lignite, sand, and sandy cl.q. The Porters
W Arkansas Geol. Survey, 1929. 7/ Mississippi Geol. Soc., 1945. ~ Tennessee Di v. Geology, 1933. ~ Roberts, J. K., and Collins, R. L., The
Tertiary of vest Tennessee: Am. Jour. Sci., 5th ser., vol. 12,. pp. 235-243, 1926.
:L,St Wells 1 F. G., Ground-water resources ot western Tennessee: U. S. Geol. Survey Water-Supply Paper 656, pp. 89-95, 1933.
U/ Lowe, E. N., Preliminary report on iron ores of Mississippil Mississippi Geol. Survey Bull. 10, · pp. 23-25, 1913.
u/ Op. cit.
· Creek formation (Paleocene) and possibly same younger beds.of clay and shale lie tDmediately benAath the ."11400-foot" sand.
On the geologic map of Tennessee the MidwayWilcox contact is about 60 miles east of Memphis. It the "1,4~foot• sand is assumed to be a continuous hydrologic unit eastward from Memphis, the distance to this contact would be the approximate distance to the area where the basal part of the sand crops out on the surtace. In Mississippi u/ there is some doubt as to whether the sand is continuous to the east and the same condition ~ possibly prE' vail in Tennessee. However, if' the sand is continuous eastward, there is also a possibility that it is completely overlapped by the Claiborne group.
Regardless of whether the sand is overlapped eastward by the Claiborne group, the possibility of recharge still remains becanse the ·claiborne group includes sandy beds which would permit the percolation of water downward toward the 111 1400..toot• sand.
Structure and thickness.- It should be kept in mind that practic8liy all the information on the "1,400-toot" sand in the Memphis area has been recorded by water-well drillers. Unless a test hole is being drilled, the accumulation of data of scientific value is ot secondary importance to drillers because they are primarily interested in completing the well. Even though some of the logs JDa7 be very poor 1 the drillers are to be commended for keeping the existin~ records.
The apparent westward dip of the upper surface of the "1 ,4QO..foot• sand along the line of section A-A • (pl. 2 ) is about 30 feet to the mile. This figure is fairly reliable because the driller usually makes accurate observations about the time he expects the drill to penetrate the sand in which he is go~ to set the screen.
The structural contour, map of the upper surface of the •1,400...toot11 sand in Shelby Count,- (fig. 1 ) was drawn with 16 control points. Three of the points are wells which were logged electrically. The rest are . selected drillers 1 logs which were considered to be relatively accurate. It should be noted that eight ot the control points are concentrated in Memphis. Consequently, the map is a very generalized picture ot the configuration of this surface.
In the North Parkway Pumping Station area (walls with prefix number 7 in p 1. 1) 1 where the mean land-surface elevation is about 250
U' Peraonal cCIIDDIUD.ication fr.Qm G. F, Brown 1 u.s. Geological Survey, Univers1ty, Mississippi. .

,-----~-·
........
:I(
• ) . • ~
0 0 ..... .
I
·~ .... 0 Cl
I ::
·t g ... ~ ::1
c:: 0
'it ... s C)
I~
~
• ~~ ;
.. , .... ''il
.... c e .., : .... • .8 ,r
•'
i f •
t .! ,e
.t
f.: : ... c::
~.~ t~ ' .
. ~·a
I~ :
0
s I t . ro4
• I .:
6
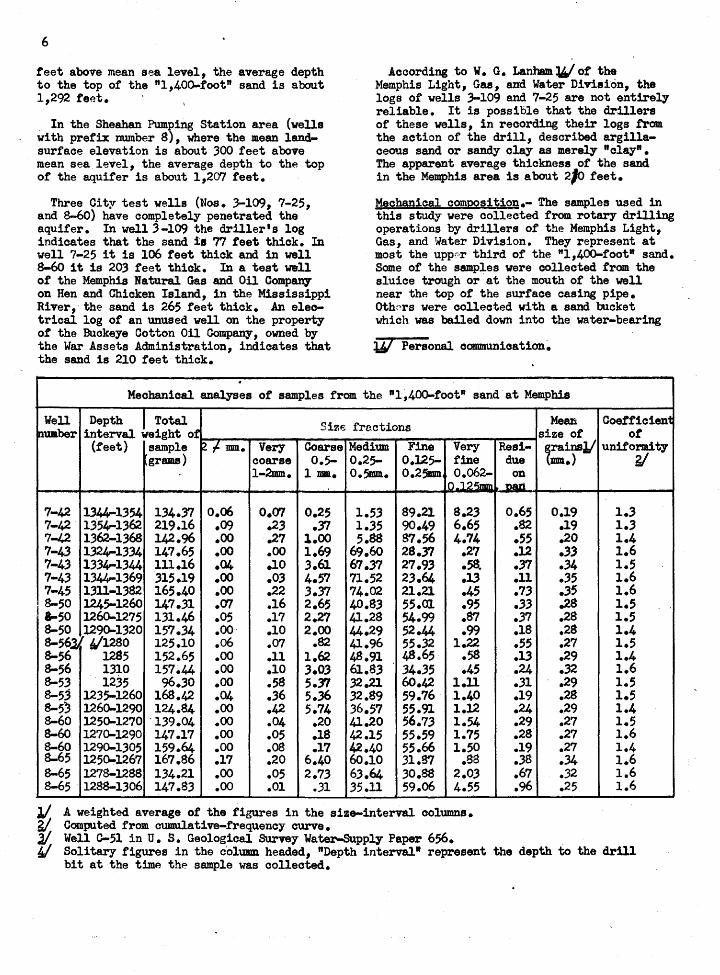
feet above mean sea level, the average depth to the top of the "1,40Q-foot" sand is about 11292 feet. ·
. In the Sheahan Pumping Station area (wells with prefix number 8), where the mean landsurface elevation is about 300 feet abo•e mean sea level, the average depth to the top of the aquifer is about 1 1207 feet.
Three City test wells (Nos. 3-109, 7-25, and 8-60) have completely penetrated the aquifer. In well3-109 the driller's log indicates that the sand ia 77 feet thick. In well 7-25 it is 106 feet thick and in well 8-60 it is 203 feet thick. In a test well of the Memphis Natural Gas and Oil Compa.D7 on Hen and Chicken Island, in the Mississippi River,· the sand is 265 feet thick. An electrical log of an unused well on the property of the Buckeye Cotton OU Company, owned by the War Assets Administration, indicates that the sand is 210 feet thick.
.
According to W. G. Lanham W' ot the Memphis Light, Gas, and Water Division, the logs of wells 3-109 and 7-25 are not entirelY reliable. It is possible that the drillers of these wells, in recording their logs from the action of the drill, described argillaceous sand or sandy clay as merely "clay" • The apparent average thickness of the sand in the Memphis area is about 2#0 feet.
Mech8nical composition.- The samples used in this study were collected from rotary drilling operations by drillers of the Memphis Light, Gas, and Water Division. They represent at most the upp"'·r third of the "1,400-foot" sand. Some of the samples were collected from the sluice trough or at the mouth of the well near the top of the surface casing pipe. OthPrs were collected with a sand bucket which was bailed down into the water-bearing
ti/ Personal communication~
Mechanical analyses of samples from the "1~40Q-foot" sand· at Memphis
Well Depth I Total Siz.;; fractions ~nUmber interval weight of
(feet) sample ~ f. mm. Very Coarse Medium Fine Very grams) coarse 0.5- 0.25- 0.125- tine
l-2mm. 1 Illlle 0.5mm. o.25mm 0.062-In 1 ?'\mm
7-42 134J.,-1354 134.37 o.06 O.(y] 0.25 1.53 89.21 8.23 7-42 1.354-1362 219.16 .09 .23 .37 1.35 90.49 6.65 7-1.2 1362-1368 142.96 .oo .27 1.00 5.88 87.56 4.74 7-43 1324-1334 147.65 .oo .oo 1.69 69.60 28.37 .27 7-43 1334-1344 111.16 .04 .10 3.61 67.37 27.93 .58. 7-43 13~1369 315.19 .oo .03 4.57 71.52 23.64 .13 7-45 1311-1382 165.40 .oo .22 3.37 74.02 21.21 .45 8-50 1245-1260 147.31 .r:n .16 2.65 40.83 55.01 .95 &-50 126o-1275 131.46 .05 .17 2.27 41.28 54.99 .87 8-50 l29Q-1320 157.34 .oo· .10 2.00 44.29 52.44 .99 8-56l( 6/1280 125.10 .o6 .07 .82 41.96 55.32 1.22 8-56 1285 152.65 .oo .11 1.62 48.91 48.65 .58 8-56 1310 157.44 .oo .10 3.03 61.83 .34.35 .45 8-5.3 1235 96.30 .oo .58 5.71 32.21 60.42 1.11 8-53 1235-1260 168.42 .04 .36 5.36 32.89 59.76 1.40 8-53 1260-1290 124.84 .oo .42 5.74 36.57 55.91 1.12 S-60 1250-1270 < 139.04 .oo .04 .20 41.20 56.73 1.54 8-60 1270-1290 147.17 .oo .05 .18 42.15 55.59 1.75 8-60 1290-1305 159.64 .oo .08 .17 42.40 55.66 1.50 S-65 125~1267 167.86 .17 .20 6.40 60.10 31.87 .sa 8-65 1278-1288 134.21 .oo .05 2.73 6.3.64 30.88 2.03 8-65 1288-1.306 147.83 .oo .01 .31 35.11 59.06 4.55
112
, A weighted average of the figures in the size-interval columns. ~- Computed from cumulative-frequency curve.
Mean Coef'f'icien1 size of of'
Resi- ~rainsl/ uniformity due mm.) ?/ on
.Dalt
o.65 0.19 1.3 .82 .19 1.3 .55 .20 1.4 .12 .33 1.6 .37 .34 1.5 .n .35 1.6 .73 .35 1.6 .33 .28 1.5 .37 .28 1.5 .18 .28 1.4 .55 .27 1.5 .13 .29 1.4 .24 .32 1.6 .31 .29 1.5 .19 .28 1.5 .24 .29 1.4 .29 .27 1.5 .28 .27 1.6 .19 .27 1.4 .38 .34 1.6 .67 .32 1.6 .96 .25 1.6
J/ Well G-51 in U. S. Geological Survey Water-Supply Paper 656. . 4/ Solitary figures in the c'olumn headed, "Depth interval• represent the depth to the drill
bit at the time the sample was collected.

sand. The latter method provides samples that are more ~ representative than those collected by the first method, although in both eases some or all the tiner mineral ·grains are lost. . Samples collected by the first method are generally more or less mixed with material from other horizons, owing to the constant Qirculation of the drilling mud in the hole. The possibility of mixture with materials from shallower horizons exists in the sand-bucket method of collection also, but to a far l~ss degree.
There is no record as to which method of sampling was used in collecting the samples studied. Theretore, the results 1 can be used only to make general comparisons between samples as far as. texture and the degree of sorting are concerned. It sbou.ld be emphasized that size-analysis data for a single sample are of little value unless the,- are used tor comparison with data for samples which have been collected in a •imilar marmer.
The sand samples studied range in texture troll fine to medium, the ave~e-falling in the medium grade (Wentworth~ scale). The coefficient of unif'ormit,- is a mDD.erical index of the degree to which the sand bfs been sorted. It represents the .ratio of the diameter ot a grain that is coarl!ler than 60 PfJl"eent of the sample to the diameter of a grain that is coarser than 10 percent of the sample. Thus, a sand that is perfectly sorted would have a coefficient ot uniformity of 1.0; that 1a, all the grains would be ot the s.. size.
The average coefficient ot uniformity tor 22 samples tram the •1,400-toot• s&Dd is 1.5, the max1mtml recorded is 1.6, and the miniJIIDI is 1.3. These coefficients are all somewhat lower than the trne value because it must be assumed that some of the finer mineral gra1u have been lest. Even though it is likel7 that some of the coarser grains have been loat also, most ot the loss. is probably in the smaller grain sizes, olfing to the fact that they remain in suspension in the dril.l.iDc Jmd longer than the coarser grains.
It is ot interest to note that, even though tn. coefficients of unitor.mit,y for the samples trom the Sheahan well field and the Jforth Parkway well field show little difference in the degree of sorting, the mechanical anal.ysis data indicate some ditterence. At least 67 .7! pf\reent of' the weight of' each sample trom the North Parkway well field is confined in one size interval. According to the analysis, 90.49 percent of the sample trom'l 1.354-62 feet in well 7-42 is in the size interval 0.125-0.25 DDDe
U/ Wentworth, c. K., A scale of' grade and class terms for clastic sediments: Jour. Geology, vo.J..tt 30, No. 5, pp. 377-392, Jul7-AUg .l "J'"- •
7
In general, the bulk of the weight of each sample from the Sheahan well f'ield ill distributed between two size intervals, 0.125-0.25 mm. and 0.25-0.5 mm. The most even distribution occurs in a sample trcn well 8-56 (1,285 f'eet) in which 48.65 percent of' the sample is in the interval 0.125-0.25 Dille $Dd 48.91 percent is in the interval 0.25-0.5 •• The most uneven distribution in this well field occurs in a sample frail 1,2?8-88 feet 1n well 8-65, in which .30.88 percent of the weight is in the size interval 0.125-0.25 .a. and 6.3 .64 percent is in the size interval 0.25-0.5 DID..
These data should not be interpreted to mean that the coefficient of UDitormity is ot no value. A more accurate value tor this coefficient can be obtained b,y adding intermediate size intervals in the mechanical analysis. Considering the method or sampling and the scope of this report, it was not deemed necessary to make the mecbanical anal.Jses more detailed.
As far as the samples used in this study are concerned, the meohani cal analyses indicate that the •1,400-toot• sand in the SJwaban well field is somevbat less well sorted tha 1D the Rorth Parkway well field. It is believed that the slight ditterenee in the degree ot sorting is responsible to some extent tor the differences in the water-bearing properties ot the sand in the tvo fields because the size and arrangement or the grains effects the per.aeabilit,r.
Pn11•1pen Jdcrgacopic study.- A binocular microscope was used to stu.c%r the sand samples. The folloving observations should be appraised cri ticall.y in view of the fact tbat the samples were collected tram rotary' drUl.1.q operaticms. Bo att-.pt was· -.de to identit7 all the llineral grains present in llin.or 8Dl011Jlts, owing to the possibility that the s811d may bave been contaminated vi th grains troa other horizons.
The sand is composed essentially of tine to medium, subangular to sharplJr angular gl"aina of quartz. A fev or the graitns are wellrounded and frosted. About halt the quartz grains are clear and half are milky. The mil.k:y appearance is due in part to DUJDerowl tin7 fractures in the quartz. J. rev or the quartz grains are smoky or amber-colo~d. Almost every grain of smo1ey' quartz is CJ:"1Stalline. Minerals present in minor amounts mclude kyani te, staurolite, tourmaline, feldspars, pyrite, :u.gneti te 1 IIIUScovi te, rutile, and a dark glassy mineral.
Eve17 sample ·exudned containa minor amouuta ot kaolinite. The kaolinite is general.l7 in slightl7 elongated "books" which are subr0Wlde4

8
tt9 subangular in shape. This mineral is extremely sort in comparison to the detrital minerals listed above. .If the kaolinite had _been_derived directly from the weathering-of feldspars in the sand it would have been more or less amorphous, except tor possible preservation of the general outlines or cleavage fragments. In a:idi tion, there should have been some partially kaolinized feldspar grains in the sand. The worn edges of the kaolinite grains suggest that they have been.transported for some distance, but the relatively weak physical character or the mineral limits the possible distance to the source area. The stratigraphic position of the sand (near the contact betlleen the WUcox and Midway groups) suggrsts a possible source for the kaolinite b~caus~ kaolinitic blays, bauxite, banxitic clays' and kaolinized bauxite are quite commonly associated with this contact in Arkansas, Tenness~e, Mississippi, and Alabama. It is possible that the kaolinite was eroded and transported in post-Midway time from deposits or kaolinite on the surface or the formations or thR Midway group.
QUALITY OF THE WATER
Water from the "1 ,40D-foot" sand is generally or good quality and ranges from 700 to 72° F. in temperature. The average hard-ness determined from 10 analyses is 9.5 parte per million (as GaC03) • The maximum value recorded is 17 and the minimum is 5. This is generally considered to be a very soft water. The following table presents three typical analyses of waters from the "1 14DO-foot" sand.
Analyses of waters from the "1,40Q-foot" sand in Memphis
[Analyzed by G. A. Billingsley, U. S. Geological Survey]
Well Well Buckeye 7-38 8-62 Cotton
OU Co .. (Parts per million except pH)
Si.lica (Si02) 10 10 12 Iron (Fe) .84 1.4 .55 Aluminum (Al) .7 .7 1.8 Calcium (Ca) 1.8 4.0 2.0 Magnesium (Mg) .9 1-.7 .9 Sodium (Na) 41 31 38 Potassium (K) 1.3 1.7 1.6 carbonat"" (ceg) 0 0 0 Bicarbonate ( C03) 112 96 105 Sulfate (S04) 4.4 4.7 4.4 Chloride (Cl) 2.0 1.8 2.0 Fluoride (F) .2 .1 .1 Nitrate (N03) .2 .2 .2 Dissolved Solids 119 105 115 Total \lardness 8 17 9 pH 7.8 7.7 7.6
An objectionable quality of the water is that it contains an average of 0.86 part per million of iron. The maximum value recorded is 1.7 parts per million and the minimum is 0.45 part per million. The presence of the iron necessitates its removal by aeration and filtration.. Practically all the iron in the public supply of the City of Memphis is eliminatPd in this manner.
WATER-BEARING _PROPERTIES
Pumpage and water-level history
As far as is known the only major water withdrawals from the,"l,40D-foot" sand occur in Shelby County, Tennessee. A partial well inventory conducted in July 1945 in Crittenden County, Arkansas, indicated a total withdrawal of about three-quart~rs of a million gallons of water a day. The quantity or water withdrawn from the 2- and 3-inch wells penetrating the sand in De Soto County, Mississippi, ~s small. Outside Shelby Colinty the total amount ot ,water pumped from the "1,40Q-foot" sand is probably about a million gallons a day, and thr:se withdrawals are distributed over a large area.
In Shelby County, owing to a combination of fortuitous circumstances, it has been possible to obtain an almost complete record of the water pumped from the aquifer. To obtain this record it was necessary to make a thorough check of all the records of the Memphis Light, Gas and Water Division and its predecessors. Fortunately, W. G. Lanham, the Superintendent of Wells, has insisted on the compilation and maintenance of adequate pumpage records. As Mr. Lanham has been associated with the muni_cipal water supply of Memphis for nearly 40 years, the records are in good condition. The records of deep-well pumpage are continuous from the time the first well was put into operation on November 11, 1924. From 1924 through 1946 about 49 billion gallons of water vas pumped from the "1,40D-foot" sand in Shelby County. The av~rage daily pumpage is given in the following .table: .
Average daily ~unpage, in million gallons a day, from the "1 ,400-foot" sand in Shelby County
\
~ear ~page Year Pumpage Year Pumpage
1924 0.1 1932 6.5 1940 6.6 1925 0.9 1933 3.8 1941 8.7 1926 2.5 1934· 4.9 1942 8.6 1927 2.2 1935 6.3 1943 11.1 1928 4.5 i936 5.4 1944 10.8 1929 5.7 1937 4.5 1945 8.7 1930 6.2 1938 5.6 1946 8.7 1931 5.4 1939 6.0 -- --
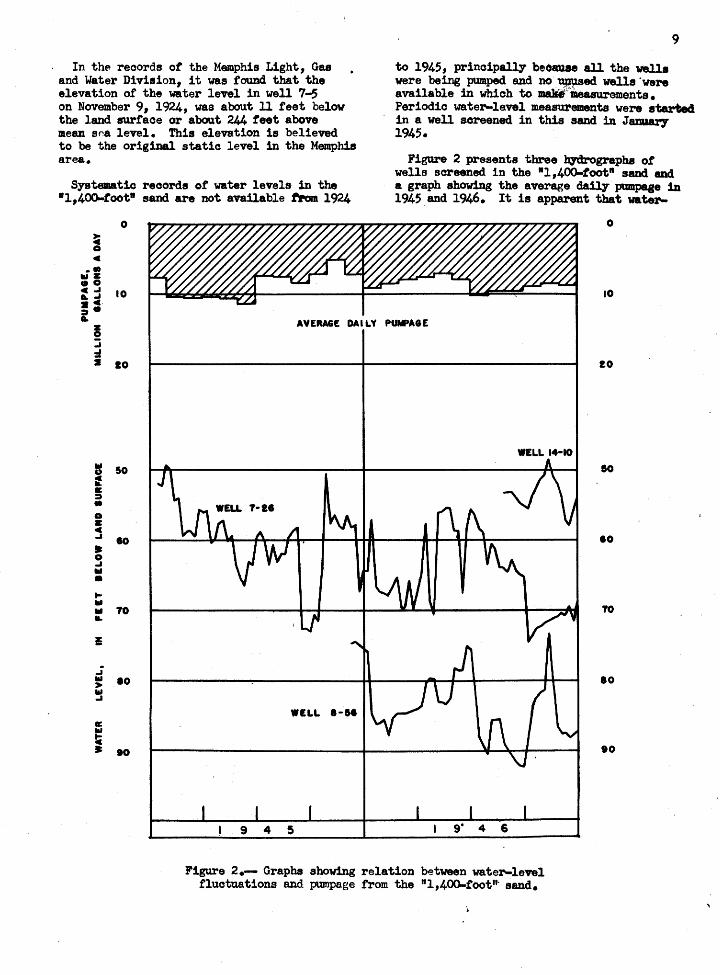
In th~ records ot the Memphis Light, Gas and Water Division, it vas found that the elevation of' the water level in well 7-5 on November 9, 1924, was about 11 feet below the land surface or about 244 teet above mean s~a level. This elevation is believed to be the original static level in the Memphis area.
Systematic records ot water levels in the •1,400..toot• sand are not. available f'Jiom. 1924
= 0 4
•• IIIZ .o
0
::I 10 2 4·
9
to 1945, principally beoauae all the wells were being pumped and no uuused valls ·were available in which to ma.JEi":laeaauraments. Periodic water-level measurements were starW in a well screened in this sand in Janu&r7 1945.
Figure 2 presents three hJdrographs of wells screened in the 111 ,400-toot• sand lllld a graph showing the average daily pumpqe 1n 1945 and 1946. It is apparent that 'Water-
0
10
~· .. 5 ::;
AVERAGE DAILY PUMPAGE
_, i 10
... 50 u
' K ~ • 0 a c ... eo • 0 _, ... • ... ... Ill TO ~
E
.; ... eo > .., ... 1: .., !C • H
WELL 14-10
9 4 5
Figure 2.-- Graphs showing relation between water-level fluctuations and pumpage from the "1,4QO-foot"· sand.
20
10
•o
TO
eo
eo

10
level fluctuations in a particular observation well tEmd to reflect the pumpage in the well field in which the observation well is located more than they do the total pumpage in th~ area. The relation between the fluctuations of the water level in an observation well and the total pUmpage is obscured by the £act that water is b~ing pumped from several widely scattered points.
In De Soto County, Mississippi, a few measurements of water levels were made in wells that probably tap the "1,400-f'oot" sand. These measurements have been published in water-supply papers of the Geological Survey entitled "Water levels and artesian~ssure in observation wells in the United States," beginning with the 1942 volume. Although measurements were not made early enough and were not numerous enaugh to justify any conclusions, it is apparent that water levels in thP aquifer have declined, for the wells in Mississippi that formerly flowed freely under several feet of head now mnst be pumped.
A number of water-level measurements have been made in individual wells of' the Parkway and Sheahan fields since the wells were first operated. These measurements are not strictly comparable, owing to changes in pumping conditions • Systematic measurements have been tabulated for the period tram July 1933 to February 1934, during which 1ime all the wells screened in the "1 ,400-toot" sand were slmt off' for an experiment. However, all the measurements made by members of· the water works staff over the 20-year period have not yet been tabulated. ,
Depths to \otater, in f'eet below the land surface in l.Q31 and 1945 under s:lm.Uar conditions of pu'lD.i31ng, are given below:
Well January 18, 1931 January 18, 1945 number Depth to Pumping Depth to Pumping
water in rate in water in rate in feet gallons f'eet gallons
a minute a minute 7-5 (J/) - - 620 7-26 - 700 51.6 -7-27 - 700 (J/) -7-28 36.7 - 52.1 -7-29 31.5 - 47.7 -7-30 26.8 - 44.9 -7-31 27.2 - 45.5~ -7-32 - 700 - 760 7-33 - 700 40.0 -7-38 - - - . 850
'J./ No measurement made •
Note: Wells in Sheahan fiE:'ld not yet drilled in 1931. Sheahan wells shut off for 2 days when measurements were made in 1945.
The average clurnge in water level between '1931 and 1945 is apparently about 17 feet in the Parkway . well field. This is not a large change· over a 14-year period. Part of' the change can be.attributed to the effect ot wmping in the. Sheahail well field during the past 10 years. Computations made on the basis of data obtained from pumping tests indicate that a drawdown between 6 and 8 feet would be produced in the.Parkway field b,y pumping an average of 2 million gallons a day at the Sheahan well field for about 10 years.
On the basis of' pumping-test data, and assuming that an average ot 5 million gallons of water was pumped daily in the Parkway field b.etween 19.31 and 19454 the static water leve~l * would be expected to decline about 4 fee~ given in the previOus paragraph, it is, be!:. lieved that 10 to 12 feet of the apparent loss ~ of head of 17 feet between 19.31 and 1945 can §~ be accounted for by the pumping in the two *
municipal well fields. The interference ~ caused by the Chickasaw Ordnance Works, where ~ a daily average of about 1.5 million gallons p of water was pumped from January 1941 to January 1945, was between 2 and 3 feet at the ={' Parkway field by January 1945. Added to the • 10 to 12 feet given above, thiS gives a total of 12 to 15 feet. ~,
Basing conclusions on the results or the pumping tests and assuming that·the character of the sand is unchanged tram the Memphis area to the· area wher:e the. sand is at or near the surface, it would seem that the decline of the water level in the Parkway field between 1931 and 1945 is largely accounted for by the known water withdrawals in the area. ·
The difference between the drawdown computed :from the effect or. pumping since 1931, 1.2 to 15 feet, and the actual measured drawdowns, about 17 feet, is 2 to 5 teet. It is believed that this discrepancy is largely due to variations in pumpage within the field and to pumpage in Cr~ttenden County, Arkansas, and De Soto County, Mississippi, and to variations in the transmissibility and the coefficient of storage. The effect of recharge is not yet discernible. This would indicate that the re-· charge area is quite distant, probably more than 50 or 60 miles .from the Memphis area.
The available water-level data, combined with pumpage and pumping-test information, seem to show that until now the aquifer has behaved as would be expected ot the theoretically infinite aquifer postulated in the derivation of the formulas used to compute the effects of' withdrawals. Apparently the quantity of water withdrawn has been small compared to the total quant~ty in storage and the effect of the boundaries of the aquitor is not yet manifest.

.,.
Pumping teste
The quantity of water that can be obtained from a well or a group of wells depends in part upon the hydraulic characteristics ot thP. wate~aring formations tapped by the vella. Pumping tests may be used to determine
. the-se characteristics. The quantity of water that is transmitted by a formation depends upon its pel'lleabUi ty, thickness, extent, and continuity, and on the hydraulic gradient that is induced in the formation.
• The permeability of a formation is defined aa the rate at which the formation vil1 transmit watf>r through a unit cross section under unit difference of head per unit distance. Permeability may be exprPssed as 'the :number of gallons of wa~r a day that will percolate through a cross section of the tor.matiaD 1 mile wide and 1 foot thick, tor each toot per mile of bydranlic gradient.
Transmissibility is the product ot the permeability and the thickness or the saturated portion ot the aquifer, and 1n· this report is :measured in gallons a day per toot.
The coerticient ot storage is the valume of water releas~ from storage in each vertical prism of the> aquiter or unit cross section by unit decline of head. The water is derived from storage, oviDg largely to the expansion of the water and the compaction of the aquifer. There is no actual unwatering of the formation.
Arter the deep wells of the Sheahan well field were ccmpleted between 19.32 and 1934 by the Water Department (now included in the Memphis Light, Gas and Water Division), pumping tests were conducted on each well and the interference among the different wells screened in the same stratum was measured. The tests were planned and conducted by w. G. Lanham and most of the measurements were made by A • J. Rumley. After discussing the testing procedure vi tn Messrs. Lanham and Rumley 1 it was concluded that all the data needed for computing the values for the transmissibUi ty and for the storage coefficient were obtained to the required degree ot accuracy.
·In addition to the tests made in the Sheahan wall field after ~he completion of the wells, another test was conducted by Mr. Lanham, starting in the summer of 19.33 and continuing into February 1934. The test consisted of stopping all lllllllicipal pumping from the •1 ,400-toot• sand. At the same time, measurements were made each day ot the depth to . water
n
in Oll the wells in the Sheahan and Park:wfq . fields. On February 9, 19.341 after the wells had been idle for 196 days 1 well 7-26 was started. On February 21, well 7-28 was started and pumped intermittently until March 9, when it was slmt off. On March 31 other deep wells were started and on April 1 wells 7-26, 7-271 7-28, and 7-29 were all pumping. All the other wells in the Par~ fl.eld and wall . 8-56 in the Sheahan field were measured during the entire period. Fran data collected during the course of this test 1 values tor the transmissibility and for the storage coefficient within the Parkway and Sheahan fields and between the fields were computed.
On January and February 1945 another series ot pumping tests was conducted in the Parkway and Sheahan -well. fields and an attempt was made to measure . the interference between the fields • These tests yielded values for the transmissibility and for the storage coefficient essentially the same as those computed from the tests made in 1932-.34.
A pumping test was made on the property ot the Buckeye 'Cotton Oil Comp&JlJ" during March 1947. The company's deep well was used as the discharge well and was pumped tor 3 cla.J1I at a rate of 1,400 gallons a minute. Two wells on the company's property 1 which were owned b.t the War Assets Administration, were used a8 observation wells. The decline. of the water· level produced by pumping the Buckeye CcmpaD7 well was recorded in well 8-56 in the Sheahan well field, about .3.5 miles away.
The values obtained from the pump~sts haw a moderate range. For e:mmple~ Parlcwlcy' tield, values ranging from ll01000 to 1441000 gallons a day per toot were obtained tor the transmissibility, and the values tor the
4storage coetftcient ranged
!rom 2.3 X 1~ to 6.1 X l<r't • In the Sheahan field values tor the transmissibility ranged frOlll 8'7,000 to 1171000 gallons a dq p•foot and Talues fo~ the coefficient ot s~ ranged troa 1.21 X 1()4 to 2.15 X 1(1"'4 •- At the Buckeye plant the values tor the tran..:. missibUity ranced from Cf7 ,000 to 1031000 gallons a . cia1' per feot and the values tor the coefficient ot storage ranged from 2.13 x lo-4 to 2.52 X l<r4. .
The differences in transmissibility • which are about t 15 percent from the average, are not greater than usual in UDConsolldated aquifers.
The following table presents the averages of the results obtained from the pumping tests:

2
.... 4 11.1 w ~
z . 11.1 ! 6 .J 0 11.1 0
.J UJ > ~ 8 I
a: UJ
i 10
12
--1---;.=+r
14 100
~ ,fll
DISTANCE FROM PUMPED WELL, IN FEE1 ,w . .... ~
.~ .oa ,, ..... t» .. "'
FT i=-=t--=1--+--
IF
l_ tL
~tL_, __ _
lllll!lll!lllllllllllllll
-·-
• 1,000
"Tl'·rr,l 1 ' ! H-tttti:i-iH-I:T~ -2- ~~tiT-
l--t- -1-+ r::__"·.-
IJ-
{::: H---+ r~
,_:-~F. ~-++l-r
·"" ,01
;jHl
_l~}rL tmf·;:' 1. L,. ~.1. -4 d-
j • • : ! -~ ...
.. lOt •" .w :0 p
II
I
10,000.,
Figure 3 .-Approximate water-level declines at the end of 1 day at various distances trom a well being pumped · at 1 1000 ;;.allons a minute.
~
Number of Location sets of
data
Sheahan WPll field 14 Parkway well field 5 Buckeye Cotton Oil Company 2 Between Sheahan and Parkway well fields 6
Between Buckeye Cotton Oil Company and Sheahan well field 1
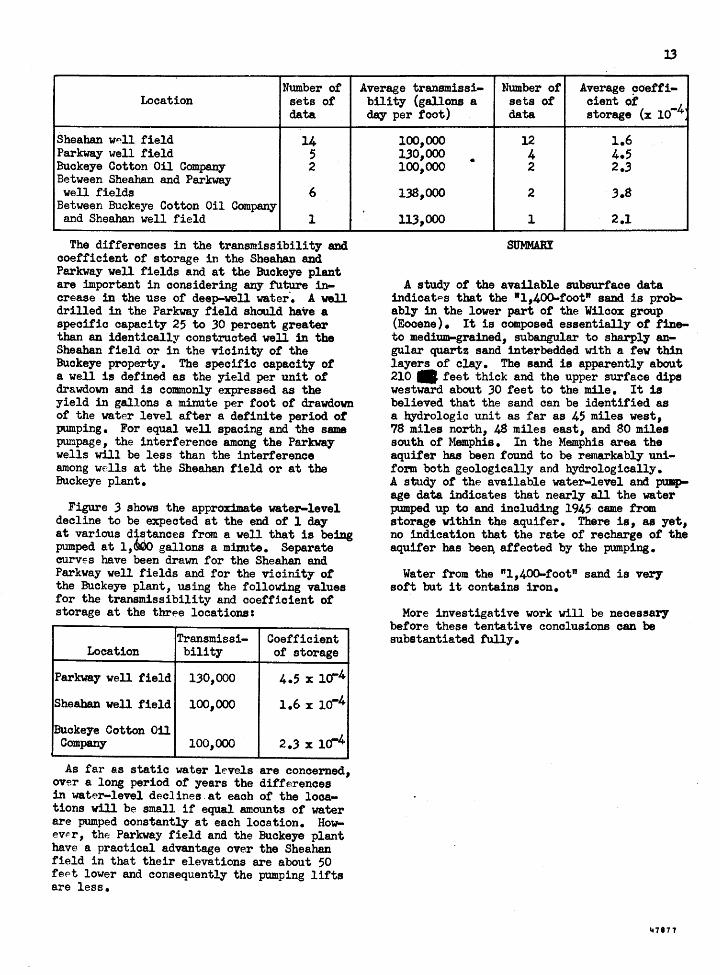
The differences in the transmissibility aDd coefficient of storage in the Sheahan and Parkway well fields and at the Buckeye plant are :important in considering any future increase in the use of deep-well water·. A well drilled in the Parkway field should baire a specific capacity 25 to .30 percent greater than an identically constructed well in the Sheahan field or in the vicinity of the Buckeye property. The specific capac! ty of a well is defined as the yield per unit of drawdown and is commonly expressed as the yield in gallons a minute per foot of drawdow.n or the water level after a definite period ot pumping. For equal well spacing and the same pw:1page, the interference among the Parkway wells will be less than the interference among wells at the Sheahan field or at the Buckeye plant.
Figure .3 shows the approximate water-level decline to be expected at the end of 1 day at various distances from a well that is being pumped at 1,&0<> gallons a minute. Separate curves have been drawn for the Sheahan and Parkway well fields and tor the vicinity or the Buckeye plant, using the following values for the transmissibility and coefficient of storage at the three locations:
Transmissi- Coefficient Location bUity ot storage
Parkway well field 1.30,000 4.5 X 1Ci4
Sheahan well field 100,000 1.6 x lo-4
Buckeye Cotton Oil 2 • .3 X l<J4 Company 100,000
As far as statio water levels are concerned, ov~r a long period of years the differences in water-level deolines.at each of the locations will be small if equal amounts of water are pumped constantly at each location. Howev~r, the Parkway field and the Buckeye plant have a practical advantage over the Sheahan field in that their elevations are about 50 teet lower and consequently the pumping lifts are less.
l3
Average transmissi- Number of Average ~oetfi-bili ty (gallons a sets of oient of day per foot) data storage (x 10-4
100,000 12 1.6 1.30,000 • 4 4.5 100,000 2 2 • .3
138,000 2 .3.8
11.3,000 l 2.1
A study of the available subsurface data indicat~=>s that the 111,400..f'oot11 sand is probably in the lower part of' the Wilcox group (Eocene). It is composed essentially ottineto medium-grained, subangular to sharply angular quartz sand interbedded w1 th a f'ev thin layers of' clay. The sand is apparently about 210 Ill feet thick and the upper surface dips westward about .30 feet to the mile. It is believed that the sand can be identified as a hydrologic unit as far as 45 miles west, 78 miles north, 48 miles east, and SO miles south of Memphis. In the Memphis area the aquifer has been found to be remarkably uniform both geologically and hydrologically. A study of the available water-level and pumpage data indicates that nearly all the water pumped up to and including 1945· came trom storage within the aquifer. There is, as yet, no indication that the rate of recharge or the aquifer bas bee~ affected by the pumping.
Water from the "1,400-footn sand is ver,y soft but it contains iron.
More investigative work will be necessary before these tentative conclusions can be substantiated tully.
147877

I ,
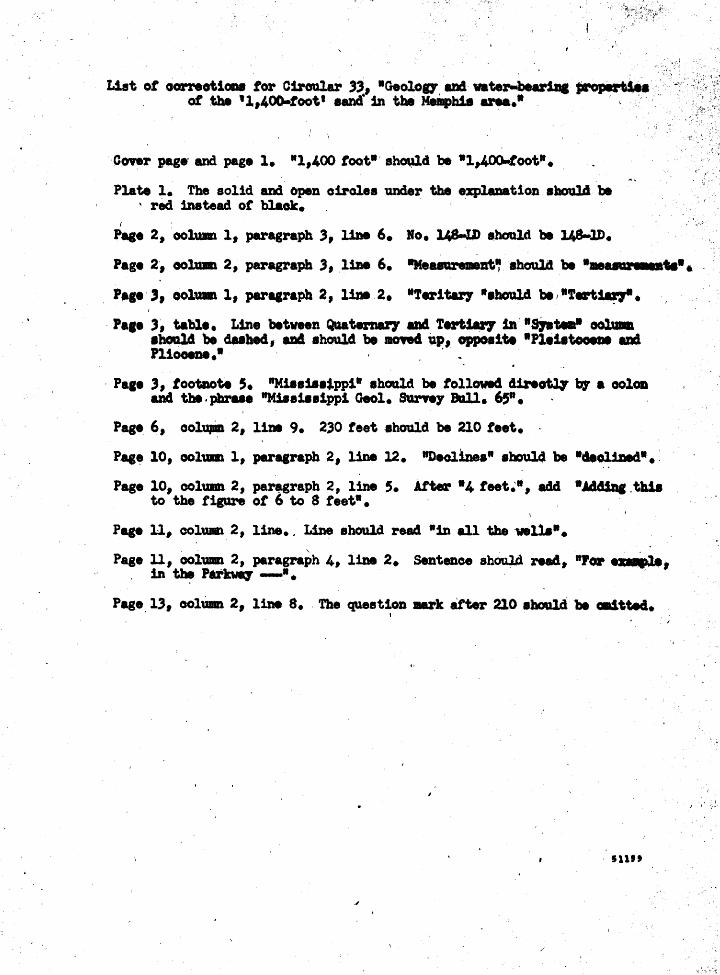
List ot oorreotlOM tor Ciraalar 331 8Geolo11 ana· vater-'beuina propertlee ·
ot the ,, 1 1400.toot' eand . :ln the Mempbie ana. • ·
Cover page and page 1. ·•1,400 toot• sh01;1ld be 8 1,4oo-toot•.
Plate 1. The solid and open oircles U:J'l(ler the explanation •hoal4 be · red instead or black. . ~ '
Pase, 2, oolwm 1, paragr-.ph 3, l.1De 6. lo. 148-ID shoold t. 148-l.D.
Page 2, oo~ 2, paragraph 3, liM 6. IIMeua.reJD~zrt' ahCNld be ••uar artt~•, •.
Pa1e 3, ool~ 1, paracraph 2, line 2. •Terltarr 1ehoul4 be 81'.-tf.a711.
· Pa1e 3, table. Line between QuatemarJ 8D4 T.-tiu7 ·a •s,._. ~ ehoald be dahed, ~ should be •owe!· up, opposite 1Pleutootae &D4 Pliooene.•
Page 3, footnote s. "Miaeila1pP1" ahoald~ be followed d.UeOtJ.,. .. 'b7 a ooloD · and the phrase ·"Misaillsi:Pr>l Geol. SUne7 Ball. 65" • · · ·
Page 6, . oolu. 2, liDe 9. 230 teet ehould be .210 teet.
Page 10, ool,_. 1, paragraph 2, line 12. "Deolinea• aboUld be •uoJ•...,•. . '
Page 10, oolUIID 2, paragraph 2, line 5. uter 8 4 teet.•, add 8£dd1zal tbia to the tigare,ot 6 to 8 teet•. . . .
Page 11, oolUIIl 2, 11n8. Line should read •tn all the wu.• • Page 11, oolu. 2, paragraph 4, 11De 2. sentence s~oul4 read, "For a.p~,
in the Parltwq -•. . ·
Pqe 13, oollall 2, liM 8. ~· question mark after 210 ehould be .ttW.
fUf'.
I
Cover page· end page 1. "11400 toot•· sh~d be •1,4oo.toot•.
Plate 1. The solid aDd open oirolea UDder the expl.uation al\wld. be ' red inatead or blaok. I
I
Pace 21 oollllll 11 paragraph 3, l:llle 6. lo. 148-ID should be 148-ID.
Page 2·, ooJ.u. 2, paragraph 3, liM 6. IIMe~zrt;' ahoul4 be • ......._. ••
••••· '' oolua 1, paracraph 2, liDe 2. llfer1tU')" 1ahoald be,•Tert~.
· Paae 31 table. Line between Qutemaz7 aD4 Tertiaz7 m· •Sjlltea• oo11Jia ahOald be duhecl, u4 ahoulcl be JIOft4 up, opposite 1 Pleiatooat a4 PlioOIDI.• ·
· Pa1• 31 tootllote 5. "Mias1aaS,pp11 ahOt.lld be tollowcl 41re~ bt a oolOD and the. pbraae "M18a1aa1ppl Geol. 8un'e7 Bl111. 65" • · .
Page 6, ool~ 2, 11M 9. 230 teet should be 210 feet. ·
Pac~ 10, oolua1 1, parqraph 2, line 12. "Deollnea" ahoul4 be 1d.e~'w•.:
Page 10, oolan 2, pargraph 2, line 5. .uter 14 teet~•, a4cl •ws.,.. .tllle to the tigare ot 6 to 8 teet• • · . . ·
Pap 11, colwan2, line •. Line should rea4 •m all the •U.•. Page ll, ool\181 2, paragraph 4, l-ine 2. SenteDce shOuld re&4, .,or·-~~
. in ~ Patkwa7 -• • ·
Page. 13, oolU. 2, lille 8. . The question ark atter 210 shoDld be -s.tw. I
· sut•