Geology and Origin of Mystery Cave TECHNICAL REPORT
143
Geology and Origin of Mystery Cave State Park, Minnesota TECHNICAL REPORT LC:MR Mystery Cave Resources Evaluation Arthur N. Palmer Margal'et V. Palmer 1993 Consultant's Report This document is made available electronically by the Minnesota Legislative Reference Library as part of an ongoing digital archiving project. http://www.leg.state.mn.us/lrl/lrl.asp (Funding for document digitization was provided, in part, by a grant from the Minnesota Historical & Cultural Heritage Program.)
Transcript of Geology and Origin of Mystery Cave TECHNICAL REPORT

Geology and Origin of Mystery Cave Fo~tville State Park, Minnesota
TECHNICAL REPORT
LC:MR Mystery Cave Resources Evaluation
Arthur N. Palmer Margal'et V. Palmer
1993
Consultant's Report
This document is made available electronically by the Minnesota Legislative Reference Library as part of an ongoing digital archiving project. http://www.leg.state.mn.us/lrl/lrl.asp (Funding for document digitization was provided, in part, by a grant from the Minnesota Historical & Cultural Heritage Program.)


ACKNOWLEDGMENT:
Funding for this project was approved by the Minnesota Legislature M. L. 91, Chapter 254, Article 1, Section 14, Subd. 3(1), as recommended by the Legislative Commission on Minnesota Resources, from the Future Resources Fund.
COPYRIGHT 1993 STATE OF MINNESOTA DEPARTMENT OF NATURAL RESOURCES
FORESTVILLE STATE PARK


page
2 3 3 3 5 6 7 7 8 11 13 13 13 13 14 14 15 16 16 19 25 26 29 29 31 32 32 33 35 37 37 39 42 42 45 5..J 5~
,r \ 5~ \
GEOLOGY AND ORIGIN OF MYSTERY CA VE
Technical Report
Arthur N. Palmer and Margaret V. Palmer Department of Earth Sciences State University of New York
Oneonta, NY 13820-4015
Introduction Geologic setting Field and laboratory methods
Leveling survey
CONTENTS
Accuracy of leveling survey Computer analysis of survey data Sampling of bedrock and speleothems Stratigraphic mapping Refraction seismology Vibration study Photography Laboratory preparation of samples Thin-section analysis X-ray diffraction Scanning electron microscopy and EDX analysis Geochemistry
Geologic profile of Mystery Cave Stratigraphic interpretation
Bedrock composition Interpretation of environments of deposition of bedrock The dolomite question
Geologic structure Geomorphic interpretation
Speleothem dating Cave sediment Past water flow in Mystery Cave
Scallop data Sediment grain size as a velocity indicator
Sediment thickness and bedrock configuration Water chemistry
Chemistry of cave-forming water Variation of pH with time and depth in cave pools
Laboratory analysis of spclcothcms Influence of water chemistry on crystal shapes in pool deposits Current hypotheses on calcite and aragonite Cl)1al growth A few obscrrntions about spelcothcms in Mystery Cave
Stalactites and stalagmites Iron-rich spclcothems
Continued .....

56 57 59 60 64 80 116 124 126 129 d1
I 132' !Jl{
Levels of static ponding Vibration measurements Conclusions References Appendix I : Bench marks in Mystery Cave Appendix 2: Leveling data Appendix 3: Seismic refraction data Appendix 4: Location of samples Appendix 5: Description of bedrock samples Appendix 6: Grain composition of bedrock samples Appendix 7: Clay content of bedrock samples
'ApPendix 8: X-ray analysis of spcleothem samples Appendix 9: Speleothem ages and locations; locations of sediment samples of Milske ~ (1982)
INTRODUCTION
2
This is the technical portion of the final report for the Legislative Commission on Minnesota Resources (LCMR) project entitled Mystery Cave Geology Resources Evaluation, part of the Mystery Cave Resource Evaluation. This project concerns the geology, mineralogy, and origin of Mystery Cave. A summary of these topics in non-technical tenns is given in a separate Inteipretive Report, and recommendations for further study and management suggestions are given in a separate Management Report. This Technical Report contains a detailed discussion of the results of this study, along with infonnation on quantitative methods, techniques and equipment, analysis of error and of scientific findings, and tables of data. It is intended to supplement the Interpretive Report, which covers many of the discussions in non-technical terms. Future publications (journal articles, etc.) will be based on both the Technical and Interpretive reports.
Two sets of units are used in this report: American and metric. Large distances are in American units because they are most familiar to the reader, and also because the USGS topographic maps of the area are in feet. Metric units are used for small features, for which there are no convenient American units.
Mystery Cave is the largest cave in Minnesota. The two entrances of the cave, as well as land around them, are administered bythe state Department of Natural Resources at Forestville State Park, and interpretive tours are run for the public in both sections by DNR staff. The purpose of this report is to enhance the interpretive and management programs of the Park by providing a comprehensive reference to the geology and origin of the cave.
Acknowledgments: Funding for this project was approved by the Minnesota Legislature M. L. 91, Chapter 254, Article 1, Section 14, Subd. 3(1), as recommended by the Legislative Commission on Minnesota Resoufces, from the Future Resources Fund. Several people helped considerably in the field work for this project. Warren Netherton, Cave Specialist at Mystery Cave, provided inspiration, enthusiasm, and continual support throughout the project. He and his family did a great deal to make our visits memorable. Calvin Alexander and Roy Jameson of the Dept. of Geology and Geophysics at the University of Minnesota generously contributed their ideas and information about the cave. The Mystery Cave staff gave us much encouragement and guided us in searching out the questions that most needed answering. Our sincere thanks to them all.

3 GEOLOGIC SETTING
Mystery Cave is located in the Central Lowlands geomorphic province, in gently dissected plateaus with a local relief of only 150-200 feet. It has been developed in carbonate rocks of the Stewartville, Dubuque, and Maquoketa Formations of Ordovician age, which have been dissected by Quaternary stream erosion. The cave occupies an entrenched meander in the South Branch of the Root River. Nearly all the water in the river passes underground through the cave and other solution conduits. The region underwent Quaternary glaciation, although the most recent glacial advances fell short of this area. The latest glacial advance into southern Minnesota was the Des Moines ice lobe, whose eastern boundary fell about 40 miles to the west of Mystery Cave. Glacial effects have been significant in the cave area, however. Thick loess (wind-deposited material derived from unvegetated glacial drift) blankets the area to depths up to 25 feet. The cave contains many sediments that appear to have be glacial material carried underground by the South Branch.
The sedimentary rocks at Mystery Cave locally dip toward the west-northwest at about 0.5-0.6 degrees, Most of the underground water flow is against the dip, toward the east and northeast, with . a great deal of discordance made possible by prominent joints and faults. The main outlet for water is Seven Springs, located east of the cave at the valley of the South Branch. About 13 miles of passages have been mapped in the cave, nearly all of which have been guided by fractures oriented mainly E-W and NE-SW. NW-SE orientations are also common in the northeastern part of the cave, and a few passages follow rare N-S joints.
FJELD AND LABO RA TORY METHODS
Interpretation of the cave required detailed geologic mapping, sampling of bedrock and cave deposits, and a variety of field and laboratory techniques. The major techniques are described in detail here, with the data listed in the appendices. Interf>retations of the data are given later in this report. Brief summaries are given in the Interpretive Report.
Leveling Survey
For general orientation and preliminary observations, we used the existing map of the cave made by the Minnesota Speleological Survey (a plan view showing survey lines only). To obtain detailed geologic information, we leveled all the major passages in the cave (and some minor ones) with a tripod-mounted Nikon AZ-1 automatic surveyor's level and segmented metric rods. This survey provided very precise vertical measurements, which are essential for a valid geologic interpretation. To obtain horizontal coordinates, bearings were measured with a hand-held SUUNTO compass, and distances were calculated from stadia readings made with the level. The horizontal accuracy was no better than that of the original survey, as slight errors in location are not significant to the interpretation. The vertical accuracy with this method probably exceeds that of any other cave survey (see the following section on survey accuracy). Where it was not possible to use the tripod-mounted level, a hand level and rods were used, along with a fibreglass tape and SUUNTO compass. In the main part of Mystery III, where numerous junctions made precise locations possible from the original map, we obtained the horizontal c?ordinates directly from the map.

Walnut Cave
• Dllfil
DI
.r
Mystery I Entrance
0173 /08611
Old Mystery Cave ~ DH3
Old Still Cav: oa79
Bench Marks in Mystery Cave
set during leveling survey, 1991-1993
544 0719 Turquoise Lake
Big Fork
Hl33
HZ7 Mystery Ill
Fifth Avenue
Ooor-to-Ooor Route
0997
09711
Main Street
t 0 250 50011.
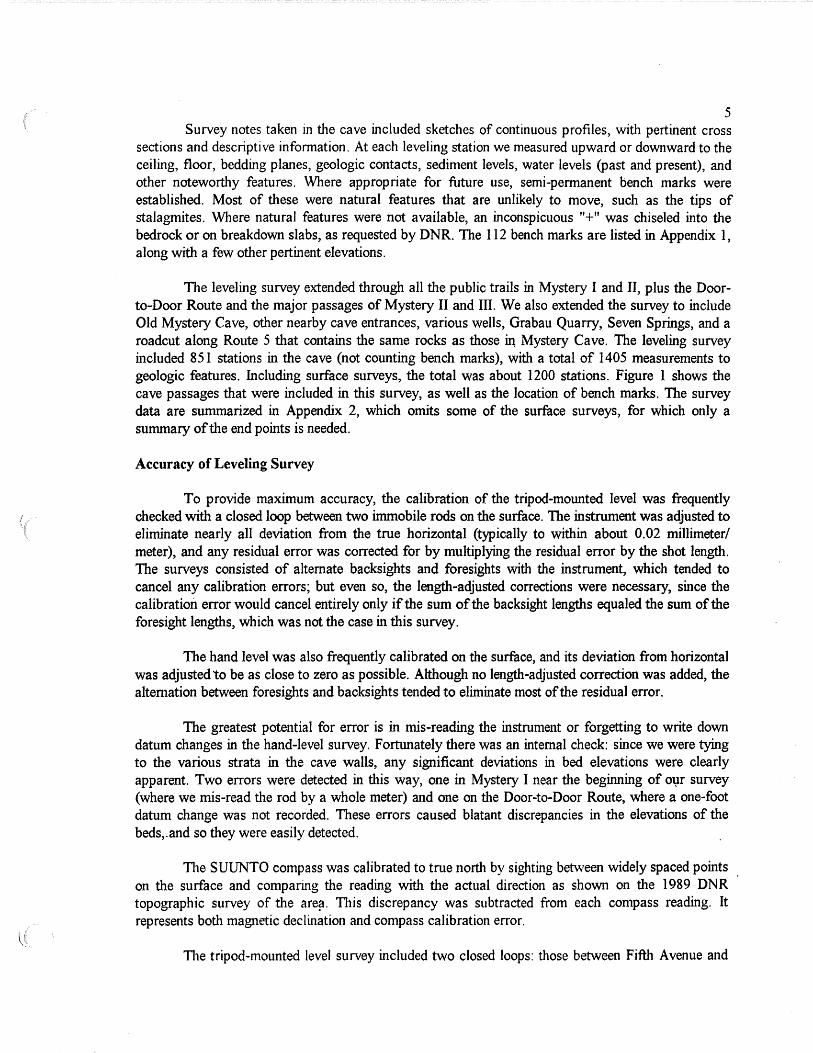
Figure 1: Map of passages included in leveling survey> showing location ofbench marks.
Mystery II Entrance • 0240
• 0244
0124, 0752
~ottrleGods
J:;..
5 Survey notes taken in the cave included sketches of continuous profiles, with pertinent cross
sections and descriptive infonnation. At each leveling station we measured upward or downward to the ceiling, floor, bedding planes, geologic contacts, sediment levels, water levels (past and present), and other noteworthy features. Where appropriate for future use, semi-permanent bench marks were established. Most of these were natural features that are unlikely to move, such as the tips of stalagmites. Where natural features were not available, an inconspicuous "+" was chiseled into the bedrock or on breakdown slabs, as requested by DNR. The 112 bench marks are listed in Appendix 1, along with a few other pertinent elevations.
The leveling survey extended through all the public trails in Mystery I and II, plus the Doorto-Door Route and the major passages of Mystery II and III. We also extended the survey to include Old Mystery Cave, other nearby cave entrances, various wells, Grabau Quarry, Seven Springs, and a roadcut along Route 5 that contains the same rocks as those in, Mystery Cave. The leveling survey included 851 stations in the cave (not counting bench marks), with a total of 1405 measurements to geologic features. Including surface surveys, the total was about 1200 stations. Figure 1 shows the cave passages that were included in this survey, as well as the location of bench marks. The survey data are summarized in Appendix 2, which omits some of the surface surveys, for which only a summary of the end points is needed.
Accuracy of Leveling Survey
To provide maximum accuracy, the calibration of the tripod-mounted level was frequently checked with a closed loop between two immobile rods on the surface. The instrument was adjusted to eliminate nearly all deviation from the true horizontal (typically to within about 0.02 millimeter/ meter), and any residual error was corrected for by multiplying the residual error by the shot length. The surveys consisted of alternate backsights and foresights with the instrument, which tended to cancel any calibration errors; but even so, the length-adjusted corrections were necessary, since the calibration error would cancel entirely only if the sum of the backsight lengths equaled the sum of the foresight lengths, which was not the case in this survey.
The hand level was also frequently calibrated on the surface, and its deviation from horizontal was adjusted to be as close to zero as possible. Although no length-adjusted correction was added, the alternation between foresights and backsights tended to eliminate most of the residual error.
The greatest potential for error is in mis-reading the instrument or forgetting to write down datum changes in the hand-level survey. Fortunately there was an internal check: since we were tying to the various strata in the cave walls, any significant deviations in bed elevations were clearly apparent. Two errors were detected in this way, one in Mystery I near the beginning of 01;J.r survey (where we mis-read the rod by a whole meter) and one on the Door-to-Door Route, where a one-foot datum change was not recorded. These errors caused blatant discrepancies in the elevations of the beds,.and so they were easily detected.
TI1e SUUNTO compass was calibrated to true north by sighting benveen widely spaced points on the surface and comparing the reading with the actual direction as shown on the 1989 DNR topographic survey of the areft. This discrepancy was subtracted from each compass reading. It represents both magnetic declination and compass calibration error.
The tripod-mounted level survey included two closed loops: those between Fifth Avenue and

6 Angel Loop, and between Fifth Avenue and Fourth Avenue. Closure error was 1.9 mm in the first loop and 0.5 mm in the second loop. There is not enough information to suggest a typical error per unit distance, because the longer loop produced the smaller error. The vertical error is negligible. The horizontal error was about 0.1 percent, which is well within normal cave--surveying tolerances and is quite sufficient for our purposes. Accuracy in the vertical data is critical to the interpretation of the geologic structure and cave origin, whereas the horizontal coordinates do not need such accuracy.
The ultimate test of accuracy was the entrance-to-entrance vertical discrepancy between our leveling survey through the cave and the 1989 DNR survey on the surface. Between the DNR bench marks BM 10 by the ticket office at Mystery I and BM 15 on a power pole near the Mystery II entrance, the vertical discrepancy between the two surveys was only 0.15 foot (4.6 cm). This close agreement was a surprise even to us, since about half of the underground distance was surveyed with a hand level.
Our calculated altitude for Seven Springs is about 6 feet higher than the DNR topographic survey seems to indicate. We need to repeat our survey, as it is likely that there was a mis-reading of the rod on one of the long-distance shots.
As a further check on the accuracy of the cave survey, we re-leveled many of the main passages in Mystery I and II while placing bench marks. This allowed us to note any discrepancies with the original survey. Replicated values are shown below:
Station
DI 03 D37 D53 D72 Diil D118 0187 D233 D244 0348 D456
Original elevation (1991)
1230.37 1218.54 1220.87 1219.15 1212.57 1217.67 1217.83 1214.32 1251.49 1273.60 1222.96 1228.92
Resurveyed elevation (1992)
1218.54 1220.86 1219.15 1212.51 1217.67 1217.82 1214.32 1251.48 1273.60 1222.97 1228.92 .
(used as base station)
(awkward position on ledge)
The original figures are considered valid and are the ones shown in the listing of survey coor~ates in . the appendices.
Computer Analysis of Survey Data
Using a home-made computer program, the leveling surveys were converted to X-Y-Z coordinates (i.e.~ East-North-Vertical coordinates). Survey lines were plotted in plan -views and in both extended and projected profile on a Hewlett Packard 7470A plotter, and details were added from the survey notes. The program also allowed plotting the elevations on specified beds and detennining the

7 mean dip and strike of the beds by extending a regression plane through the data. Residuals between the regression plane and the actual survey data could also be plotted. Structural contour maps were also made with the program SURFER (Golden Software, Inc., Golden, CO).
Sampling of Bedrock and Speleothems
Loose chips of bedrock and broken speleothems were obtained in a non-destructive way, leaving no observable damage. Collecting in a cave should be done in the most discrete way possible, and only for projects that will provide a clear benefit to the interpretation of the cave. In some places it was appropriate to break a small chip from a larger already-broken fragment within the cave; however, virtually no visible scars were left in the cave, even on breakdown blocks. Some bedrock samples were obtained by prying small loose blocks from the wall where fresh breakdown had already occurred. No sampling was done of unique or attractive features, or of features which we are not qualified to study (e.g., bacterial filaments).
The entire stratigraphic sequence within cave was sampled bed by bed -- a total of 76 beds. In addition, 57 speleothem chips (5 for radiometric dating) and 4 sediment samples were obtained; the latter are relatively few, as the sediments had already been studied extensively by Milske (1982), and by Milske, Alexander, and Lively (1983).
A few water samples were taken for chemical analysis to correlate with our mineralogical observations. Water chemistry was the main focus of the LCMR hydrology project, and so our geochemical sampling and measurements were done simply to clarify a few mineralogical questions.
Sampling sites for rocks, minerals, and sediments for this study are shown in Appendix 4. The sediment sampling sites of Milske (1982), the Speleothem samples used for Uffh dating by Lively (Milske, Alexander, and Lively, 1983) and for this report are shown in Appendix 9. One complication is that many of our speleothem samples wert:i obtained from dump piles placed at the surface during excavation of fill from Mystery I during trail improvement in 1990-1992. This material consisted mainly of broken fragments that were used during early (pre-DNR) commercialization to fill the large depression at the base of Frozen Falls. However, it is clear that nearly all of that material originated from the floor of the route to the Bomb Shelter, which was excavated during early commercialization to allow easier access to that part of the cave. Figure 30 in Appendix 4 shows these samples in approximately their original location between Turquoise Lake and the Bomb Shelter.
Stratigraphic Mapping
A major purpose of the leveling survey and the bedrock sampling was to dete~e the stratigraphic section at Mystery Cave. Each bed in the exposed sequence was measured during the survey, and nearly all beds were sampled for analysis. The stratigraphic section (or column) is shown in Figure 2. The location of our bedrock samples in the column is also shown. A similar colu~n containing formation descriptions is included in the Interpretive Report. The rock formations exposed in the cave (Stewartville, Dubuque, and Maquoketa Formations) are shown on the column with the most commonly accepted boundaries. Individual members within the Dubuque (Frankville, Luana, and Littleport) are difficult to distinguish in this area on the basis of field observation alone. The Luana contrasts with the other two ~embers by having a much lower dolomite content (see details in the discussion of stratigraphy elsewhere in this report and in the Interpretive Report).
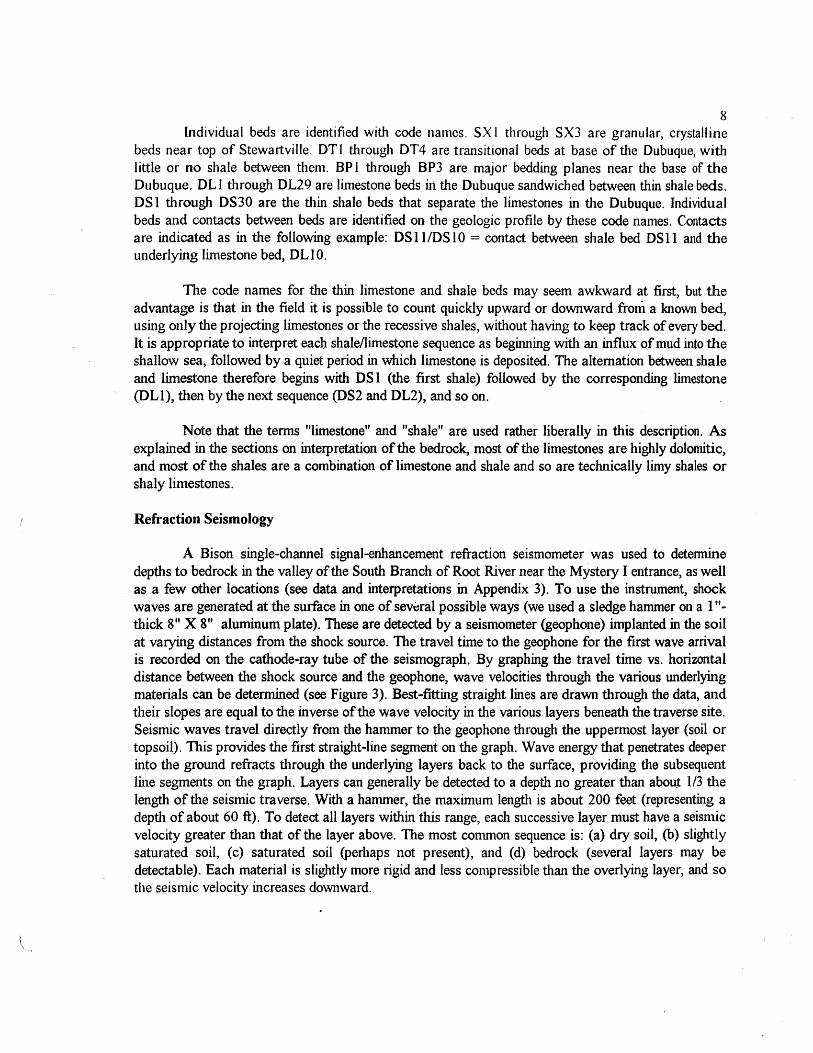
8 Individual beds are identified with code names. SX I through SX3 are granular, crystalline
beds near top of Stewartville. DTI through DT4 are transitional beds at base of t11e Dubuque, with little or no shale between them. BP l through BP3 are major bedding planes near the base of the Dubuque. DL I through DL29 are limestone beds in the Dubuque sandwiched between thin shale beds. DS l through DS30 are the thin shale beds that separate the limestones in the Dubuque. Individual beds and contacts between beds are identified on the geologic profile by these code names. Contacts are indicated as in the following example: DSll/DSlO =contact between shale bed DSll and the underlying limestone bed, D LI 0.
The code names for the thin limestone and shale beds may seem awkward at first, but the advantage is that in the field it is possible to count quickly upward or downward from a known bed, using only the projecting limestones or the recessive shales, without having to keep track of every bed. It is appropriate to interpret each shale/limestone sequence as beginning with an influx of mud into the shallow sea, followed by a quiet period in which limestone is deposited. The alternation between shale and limestone therefore begins with DS 1 (the first shale) followed by the corresponding limestone (DLI), then by the next sequence (DS2 and DL2), and so on.
Note that the terms "limestone" and "shale" are used rather liberally in this description. As explained in the sections on interpretation of the bedrock, most of the limestones are highly dolomitic, and most of the shales are a combination of limestone and shale and so are technically limy shales or shaly limestones.
Refraction Seismology
A Bison single-channel signal-enhancement refraction seismometer was used to determine depths to bedrock in the valley of the South Branch of Root River near the Mystery I entrance, as well as a few other locations (see data and interpretations in Appendix 3). To use the instrument, shock waves are generated at the surface in one of sev~ral possible ways (we used a sledge hammer on a I"thick 8" X 8" aluminum plate). These are detected by a seismometer (geophone) implanted in the soil at varying distances from the shock source. The travel time to the geophone for the first wave arrival is recorded on the cathode-ray tube of the seismograph. By graphing the travel time vs. horizontal distance between the shock source and the geophone, wave velocities through the various underlying materials can be determined (see Figure 3). Best-fitting straight lines are drawn through the data, and their slopes are equal to the inverse of the wave velocity in the various layers beneath the traverse site. Seismic waves travel directly from the hammer to the geophone through the uppermost layer (soil or topsoil). This provides the first straight-line segment on the graph. Wave energy that penetrates deeper into the ground refracts through the underlying layers back to the surface, providing the subsequent line segments on the graph. Layers can generally be detected to a depth no greater than about 1/3 the length of the seismic traverse. With a hammer, the maximum length is about 200 feet (representing a depth of about 60 ft). To detect all layers within this range, each successive layer must have a seismic velocity greater than that of the layer above. The most common sequence is: (a) dry soil, (b) slightly saturated soil, (c) saturated soil (perhaps not present), and (d) bedrock (several layers may be detectable). Each material is slightly more rigid and less compressible than the overlying layer, and so the seismic velocity increases downward.

----1 ----z 9 0
~ :E ------< ~ 0 I!?
------. --- - - ~ u... Cl> Cl> .c ..._ _____
~ MY119 ~---- .c
E . E w :J - - - :J ~ c c 0 Cl> MY118 e ::> Q. ------0 E "O
~ cu MYl17
Cl>
"' al
MY115MY116 MID MY114
·- DS 30 DL 211
MY113 DS 211 MY112. J DL 28
MY111 ~:=-:=-::::::.. :::.'\ DS 28 OL 27 MY110 :--:~-:-.-_--_:.
.8 MY109 OS 27
OL 26
E MY108 ~~*~ DS26
CD MY107. -------l OL 25
::e MY106 DS 25 OL 24 MY105 ;~--~:-,
t: MY104 l;",o::.:;:~::-""':...::::;:_--:;: OS 24 0 a. MY102MY103 OL 23 CD
~ MY101 DS 23 OL 22 _. MY100 :;:.--.. ~ - DS 22 MY99 I OS 21 OL 21
MY92MY~ ~Y91 MY9 OS 20 OL 20
Y90MY96 _______ J MY95 DS 111OL111 MY69MY94 ... --a--...---....... --1
OS 18 OL 18 z MY93 MYaa
0 MY87 .. ';"_ .. r>----.. ~ -.... ~~I DS 17 OL 17
~ MY86 OL 16
MY65 ~-.:-----..... -=-..-~J DS 16 MY63 MY84
_J DS 15 OL 15 :E ~
MY82 OL 14 MY80, MY81 ~-..:- -:..--..... 0514
0 MY79 ,J OL 13
LL -=::----:.--Y.:'\ OS 13 MY77 l OL 12
w DS12 ... DL11 ::> .8 MY76,MY78 ' ~:-::::::~~~. DS11
0 E ::> Cl> MY75 DL 10
al ::e MY74 DS10 ca MY72 MY73 DLll
::> c DSll
0 ca MY70 MY71
I OL8 :J DS8
OL 7 _. MY69 MY68 :-s...::;:.:_-::,ri:-=-=:-. 057
MY66 MY67 - J OL6 OS6
OL 5 MY64 MY6S OS5
OL4 MY62 ~: -- -- -·- .... -- Ds.4
OL3 MY60 ...... -.--- ·---~ ...... OS3
MYS8 MY59 I OL 2 OS2
OLI MY57 OSI MY58 MYS4 ~-·-· --------·· DH MY55 ' BP3 MY51 ··········--
..S! ... ... ····-- OT3 ····.:::.::::: :s g - --------------

Typical seismic velocities arc:
dry soil: saturated soil or sediment: shale or sandstone: Jimestone: igneous rock: metamorphic rock: weathered bedrock:
600-2000 ft/sec 5000 ft/sec 6000-12,000 ft/sec (depending on compaction or cementation) 12, 000-17, 000 ft/ sec 16,000-22,000 ft/sec varies a great deal, depending on type of rock generally about 50-80% of the values for unweathered rock
The depth to the second layer can be determined by the following equation:
10
where X0 = the horizontal position on the graph where the two lines of data intersect, V 1 = velocity of upper layer, and V2 =velocity of lower layer.
Where more than two layers are present, the above equation is valid only if the top layer is relatively thin. Otherwise a more complicated approach is needed. fu nearly all the seismic profiles for this report, only two distinct layers were observed: dry unconsolidated river sediment (or loess) overlying limestone bedrock. The contrast in seismic velocities between these two materials is extreme, and so there was little doubt as to the depth to bedrock, except where the bedrock surface appeared to be disrupted by collapse material or had a highly irregular contact with the overlying unconsolidated material. Irregular contacts (if not too irregular) can be detected as scatter in the data beyond the first line segment. Delays in arrival times represent hollows and early arrivals represent high areas.
Reverse profiles (reverse "shots") are used to detect lateral variations in geology. For example, dipping or sloping contacts can be detected by noting discrepancies in the wave velocities between forward and reverse shots. The contact dips in the direction of the apparent lower velocity. The true velocity is roughly the average of the two apparent velocities, and the dip angle is found by:
. [ . v1 . V1 l Di.p = o. 5 arcs in-- - arcs1n--V2a V2b
where Via and V zb are the apparent velocities of the lower layer measured in the down-dip and up-dip directions respectively.
The example in Figure 3 shows the results for profile #3, which was in the picnic area across from Mystery I, perpendicular to the South Branch, with the forward shot oriented toward the west. Arrival times for the forward shot are shown as triangles, and for the reverse shot as pluses. Note the prominent break in slope in each of the two sets of data. The initial steep portion represents the direct waves that travel only through the soil or sediment. The more gently sloping portion represents the waves that have refracted through the next layer down (in this case, limestone). Straight lines are

II drawn through the data. Their point of intersection is Xe, the critical distance, where both the direct and refracted waves arrive simultaneously. For the forward shot, Xe= 50.5 ft. For the reverse shot, Xe = 120 - 70.5 = 49.5 ft. The slope. of the initial line is 0.0009 sec/ft, and the seismic velocity of the upper layer is the inverse of this, or 1110 ft/sec. Using the same technique, the reverse shot gives an upper-layer velocity of 1105 ft/sec. The fact that they are almost exactly the same is not surprising, since they represent the same layer. This is a typical seismic velocity for dry soil or sediment.
The slope of the second line in the forward shot is 0. 00009 sec/ft, which gives a bedrock velocity of 11, 110 ft/sec. (The numerical similarity to V 1 is coincidental.) The reverse shot gives a slightly lower velocity (8695 ft/sec) for the same layer, apparently because of a slight slope on the sediment/bedrock interface. The average of the two values (9900 ft/sec) is a little low for limestone, but this is undoubtedly a weathered surface that should not have as high a velocity as unweathered limestone. The dip of the interface is only about a degree toward the east.
The depth to bedrock is found in the following way:
50.5 Forward shot: Depth=
2 11110-1110 11110+ 1110 = 22·8/t
The corresponding depth from the reverse shot is 21. 8 ft. The calculated depth actually represents the depth at about 0.5 Xe, so the shallower depth for the reverse shot agrees with the fact that the bedrock surface slopes very gently toward the east ..
Point A deviates significantly from the straight line. This could be caused simply be scatter, but the regularity of all the other data argues that it is a valid point. This was apparently caused by a slight depression in the bedrock surface, which caused the seismic waves to be delayed by having to travel through a greater distance of low-velocity sediment. The delay is only 0.002 sec, which, with an upper-layer velocity of 1110 ft/sec, represents a depression of only two feet or so (taking into account the fact that the wave is traveling at an angle to the surface). The irregularities on the bedrock surface are not large enough to warrant special attention.
Vibration Study
The same Bison seismometer used in the surface seismic study was also used in the cave to measure the effect of surface disturbances compared to the background level of vibration. This study was not very conclusive because of limited equipment, but in general it showed that normal traffic over the cave produces almost undetectable vibration in comparison with background vibration from drips and other natural sources.

-d CD ~ CD
0.05
0.04
E o.03 :;:I
~ ~
0.02
0.01
j· forward shot I
Sample Seismic Refraction Plot Profile #3
I V1 = 111 o ft/sec I
12
j reverse shot j
o...-~__,..~~---~-.-~~.....-~--+-~~.--~-+-~--.~~-.-~---.-~~...-~-+-
o 10 20 30 40 50 60 70 80 90 100 110 120 X (horizontal distance In feet)
Figure 3: Example of travel-time graph for seismic refraction profiles.

I/ I \
J3 Photography
Black-and-white photographs were made of significant features in the cave, as well as closeup views of samples and photomicrographs of thin section. Kodak T-Max 100 and Tech Pan film were used for all photos. Cave scenes were photographed with a rangefinder Leica M2, and outdoor scenes, close-ups, and microscopic samples were photographed with a single-lens-reflex Leica R4. Only a few of the photos are included in this preliminary version of the LCMR report. The complete collection will appear in the June 1994 version.
Laboratory Preparation of Samples
Rock and mineral samples were first sketched, photographed (if appropriate), and described under binocular microscope at magnifications up to 40X. Fossils, basic structure, and most minerals could be identified by this method. Where appropriate (for about 80% of the samples) the samples were cut by diamond saw into thin slabs and mounted on glass slides with epoxy resin (Buehler epoxide), then sent to a professional lab for thin-section preparation. Delicate samples were first impregnated and embedded in epoxy to prevent disintegration. Mounted slabs are ground by the thinsection laboratory to about 30 microns (0.03 mm) thickness, at which where they are transparent and can be viewed by transmitted light through a microscope.
Thin-Section Analysis
Thin sections were interpreted and photographed with the aid of a petrographic microscope (Leitz model 11, with magnification up to 630X), which provides the option of using polarized or cross-polarized light, which enhances certain images to help in the identification of minerals and their associations. Under the polarizing microscope nearly all minerals could be identified and their interrelationships were clarified. The chemical history of the sample could be fairly clearly interpreted.
A simple but effective method for identifying certain minerals in rock slabs or thin sections is to color them with mineral-specific stains. This is not always necessary, but it provides a quick and easy way of distinguishing the relative abundance and di'stribution of mineral types within a sample. Alizarine red staining for calcite was used on all thin sections of bedrock to aid in making preliminary distinctions between minerals.·
Seventy-three thin sections of rock samples from the cave were made in order to interpret the environment in which the various beds formed, as well as their effect on the cave. Point counts were made to determine the major constituents of each sample. These are done with a mechanical slide· holder that moves the sample a given distance in either of two perpendicular directions,. so that the entire surface (or a selected portion of it) is divided into a rectangular grid. At each point on the grid, the mineral is noted and recorded. Summing the results gives the percentage of each mineral in the sample.
X-Ray Diffraction
Minerals that are too.small to recognize under the polarizing microscope, or whose identity is ambiguous, can be identified by powdering a small sample and determining its X-ray diffraction pattern. A thin layer of powder is placed on a microscope slide and is slowly rotated within an X-ray diffractometer while it is exposed to a beam of X-rays. The rays are scattered by diffraction at given

14 angles (2-theta), and each mineral has a distinctive set of peaks at which the outgoing radiation is most concentrated. Mineral identification is usually quite unambiguous, although certain mineral groups, such as clay, can prove difficult to distinguish. The relative abundance of elements in certain minerals, such as the Mg/Ca ratio in calcite or dolomite, can also be determined. For this study most of the samples were analyzed with a Philips model XRG-3100 X-ray diffractometer.
Scanning Electron Microscopy and Energy-Dispersive X-Ray Analysis
The scanning electron microscope (SEM) is used to examine the surface characteristics of a sample. It produces exquisite photomicrographs. The problem is that only the surface can be viewed, in contrast to the petrographic scope, which allows internal structures to be viewed. Combined with the SEM is an EDX (energy-dispersive X-ray) unit that identifies individual elements within selected parts of the sample. This information complements that from the X-ray diffraction unit. It does not identify the minerals but helps to narrow the range of possibilities and gives information about their impurities. We used an ISi DS-130 scope with Tracor-Northern EDX unit, courtesy of Rick Olson of the Electron Microscopy Laboratory at University of Illinois. So far only two samples have been analyzed in this way: MY 98, a shale in the Dubuque (DS21), to verify the chemical content determined by X-ray analysis, and MY219, a black flowstone chip from the Tar pits, to identify the source of the black stain.
Geochemistry
Water chemistry was not one of the primary goals of this project, since detailed information on the subject is available from the group undertaking the LCMR Hydrology project. However, the major geochemical concepts are described here, and a few measurements of water chemistry were made for this study, because they concern the origin of the cave and its speleothems.
The pH and temperature were measured in selected pools, streams, and drips, as well as in the South Branch of Root River during a moderate flood (April 19, 1993). Calcium and magnesium were measured in the lab by EDTA titration (repeatability to 1-2%). From these four measured variables it is possible to calculate the saturation index (SI) for calcite, aragonite, and dolomite, the equilibrium Pc02 of the water, and the molar Mg/Ca ratio. Without a full analysis of the dissolved components the SI and P coz are not exactly accurate, but the major karst-related attributes of the water and comparisons between water samples are apparent. Data from the thesis by Shiela Grow (1986) were also used to calculate the SI of calcite and dolomite, to show how saturation levels in the river water could affect rates of cave enlargement.
The home-grown Pascal program "SI" was used to .determine saturation index with respect to calcite, aragonite, and dolomite, as well as molar Mg/Ca ratio and equilibrium Pcoz· Our figures differ slightly from those of the hydrology team because we use slightly different equilibrium constants, and because the SI calculations are more accurate (as shown by significant discrepancies in mass balance with the PC WATEQ program normally used). However, in practice the difference is negligible.
The following sections describe in detail the results and conclusions from the field mapping and laboratory analysis. Only the quantitative and technical aspects are discussed here. A more general discussion is given in the Interpretive Report.

,( \'
J5 GEOLOGIC PROFILE OF MYSTERY CA VE
TI1e profile of the cave that accompanies these reports consists of 20 11" X 17" sheets~ This is an extended profile, which stretches out all the bends and allows the surveyed passages to be viewed from the side without the confusion of having segments arranged at various angles to the surface of the page. Each profile sheet contains a plan-view index map of the cave to show where that particular segment of the profile is located. The profile sheets are unbound because of their large format. This facilitates comparison between sheets and also makes it possible to piece them together if desired. Ceilings, floors, major cave features, survey stations, and permanent bench marks are shown, as well as geologic contacts that appear in the cave walls. Only a few selected contacts are shown on the profiles to avoid clutter, but all beds, contacts and bedding planes are shown on the cross sections that accompany the profile. Survey stations are shown as round dots. To avoid clutter, fewer than half are labeled, but the sequence of the unlabeled stations is clear. Survey data and geologic measurements at each station are shown in Appendix 2, along with an explanation of the notation.
The vertical scale of the profile is exaggerated 5 times, to emphasize differences in elevation between various parts of the cave. The cross sections have a I: I vertical to horizontal scale -- i.e., they look just the way they do in the cave. The vertical exaggeration of the profile prevents it from looking like a strand of spaghetti, but it does cause some strange effects on local features· -- breakdown that looks like the Tower of Pisa, needle-like stalactites, side passages that look far thinner than they really are, and descending fissures that look terrifyingly deep and narrow (an impression that seems all too real to the explorer). For this reason some of the features (particularly breakdown) are drawn with a certain amount of artistic license, reducing their vertical exaggeration to provide a better feel for how they look in the cave.
The vertical exaggeration of the profile also exaggerates the dip of the beds. Do not measure the dip directly from the profile! To find the actual dip between two points, measure the horizontal distance between the points, as well as the elevation difference on a given contact or bedding plane between the same two points. Divide the elevation difference by the horizontal distance and take the arctangent (inv tangent or tan"1 on a calculator) to obtain the true dip. For example, between stations R24 and D3 7 on Sheet I (Mystery I), the horizontal distance is 411 ft and the elevation change on contact DS13/DL12 is 2.3 ft. The apparent angle of dip exposed in this section of the cave is therefore arctan (2.3/411) = 0.32 degrees. Warning: the dip shown on the profile is only an apparent dip. That is, where a passage cuts across the beds at some angle other than the true dip direction, the beds exposed in the walls will exhibit a dip, but it will not be the full amount of the dip. For example, if the true dip is to the northwest and a passage is oriented east-west, it cuts across the structure at an angle of 45 degrees to the true dip. The apparent dip (exposed in the walls of the passage) will be only half as great as the actual dip. If the passage is oriented northeast-southwest, as is much of the Door-toDoor Route, the apparent dip will approach zero. In passages that zig-zag in many directions, such as the passage near the Bomb Shelter and toward Enigma Pit, the apparent dip will vary considerably. The apparently radical changes in dip on the section between Fifth Avenue and Enigma Pit (Sheet 15) are caused more by changes in the passage direction than by changes in the dip itself.

16 STRATIGRAPHIC INTERPRETATION
The rock strata at Mystery Cave and their origin are described in detail in the Interpretive Report. The following section includes the results of the rock analysis, interpretations about the environments in which the rocks were deposited, and their effect on the cave. Refer to Figure 2 and Appendices 4-7 for quantitative details.
Bedrock Composition
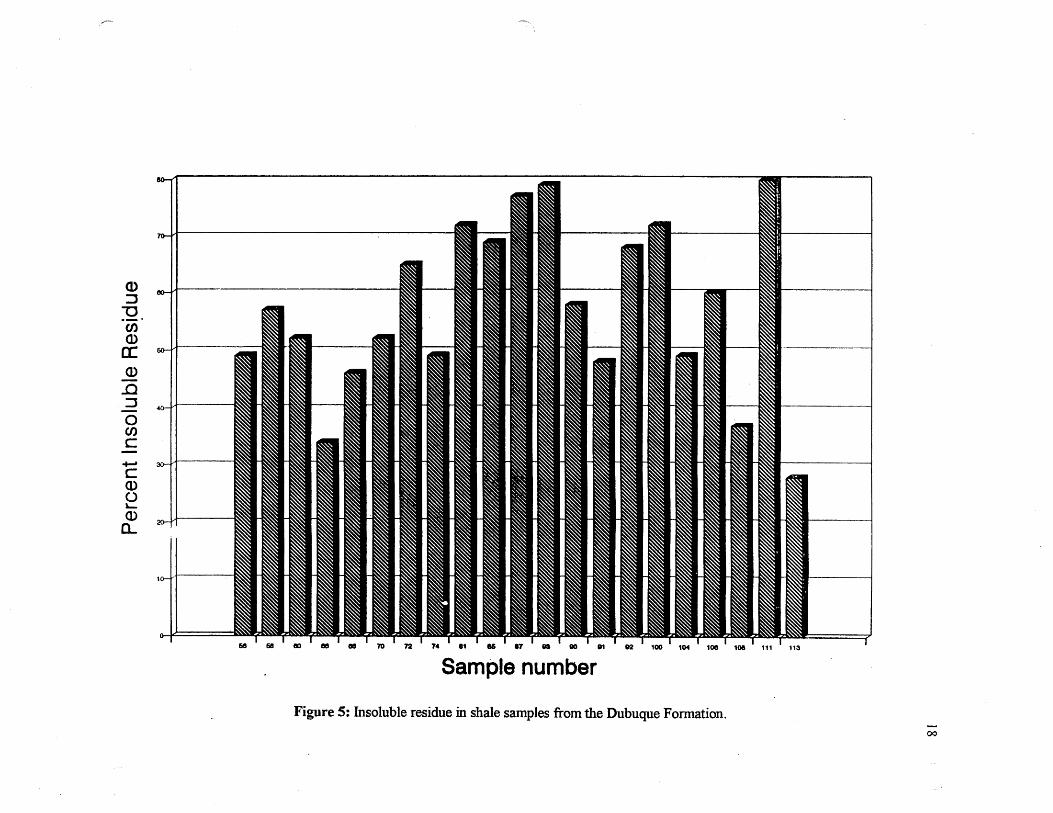
The descriptions and map in Appendix 4 show where the bedrock samples were obtained in the field. Their descriptions are given in Appendix 5. Insoluble residue percentages were determined by dissolving part of each sample in dilute hydrochloric acid, weighing the residue, and calculating the weight ratio ofthe·residue to the original sample. This information is also shown in Appendix 5. The grain composition of each bedrock sample was then determined by making point counts of the thin section of each sample (Figure 4). The relative percentages of calcite spar, calcite mud (micrite), dolomite, fossils (mainly calcite), and non-carbonate material (mainly silt and clay) are listed in Appendix 6. Alizarine red stain was used to differentiate calcite from other minerals. Because it was difficult to differentiate stained grains in clay-size material, the percent insoluble residue is a better approximation of the shale content. In a few samples the insoluble residue does not agree with the percent insoluble material measured in thin sections, as shown in Appendix 5, because of local variations in composition within the sample and lower accuracy of identifying insoluble material in thin sections. The insoluble percentage of the Dubuque shale beds varies from 34 % in bed DS6 to . more than 70% in beds DS14 and DS18 (Figure 5). The Dubuque "shales" are actually limy shales at best, and many of them: are simply shaly limestones. This is to be expected, because limestone deposition did not stop when the detrital sediment was being carried into the Ordovician sea. The insoluble content of the limestone beds is much lower. In the Stewartville it ranges from nearly zero up to about 10%. In the Dubuque limestones it ranges from nearly zero up to about 30%. The Maquoketa had a consistently significant insoluble percentage from about 8 to more than 50%. There is one
· discrepancy in the bed names: the bed we labeled in the field as DL27 (implying that it is a limestone), because of its resistance to weathering compared to the surrounding shales, turned out to have a very high insoluble percentage and is probably better identified as a limy siltstone.
X-ray analysis of insoluble material from the shale beds in the Dubuque shows that it consists mainly of illite (a clay mineral), muscovite (mica), and quartz. The results are shown in Appendix· 7. EDX spectra of sample MY98 (bed DS21) showed the presence of Mg, AI, Si, K, Ba and Fe. This . corroborated the X-ray analysis. The uniformity of most of the results shows that the erosional source area was rather constant. Montmorillonite, a clay mineral that might indicate the presence of former volcanic ash beds or bentonite, was not found, although some samples have yet to be analyzed. It is possible that accessory minerals will have to be used to identify the bentonites.
Three beds show a significant difference from the others: DS I 6, DS20, and DS25 (samples MY85, MY90, and MY106). They contain chlorite and kaolinite (also clay minerals) in addition to the other three. It is interesting to note that both DS 16 and DS20 have a distinctly gummy texture, weathering almost to the consistency of soft chewing gum. Both are exposed in many places (see geologic profile). Our samples came, respectively, from near the ceiling of the western extension of Fifth Avenue and from the connection in Fourth Avenue between Fat Man's Misery and the Smoking

l
\
6U llU LH 9U SU .. H cu ZH Ul OU 60l l10l L.Ol 90l l'Ol COl ZOl lOl OOl
66 Z6 LIS lll Oii 96 S6 HI £11 99 LV
" 59 w :: ....I Z9 Q. ~ :E ~< SIL.(/) SL. .. L. CL. ZL. lL OL 119 99 L9 99 S9 £9 lll 09 65 9S LS
----1-: cs OS ZS 6 .. 9t> s .. » c.. z .. l .. o ..
~~~~~~~~~~~~~~~~~~~~===+=====:=:;::====:::;::=====!= ~
38\flN38H3d 31\llVlnV'JnO
17
Q) :::J :o. en Q)
a: Q)
_Q :::J 0 en c ~ c Q) () S-Q) a..
60 611 eo 100 t04 toe 1oe 111 113
Sample number
Figure 5: Insoluble residue in shale samples from the Dubuque Formation. 00

( \
19 Chamber. Bed DS25 was not sampled only at the cave entrance, but it probably behaves in a similar manner in the moist cave environment.
Interpretation of Environments of Deposition of Bedrock
Figure 6 and Appendix 6 show that dolomite forms a high percentage of the Stewartville Formation and the Frankville Member of the Dubuque Formation. Dolomite crystal sizes average 200 microns (0.2 mm). There is a sharp drop in dolomite percentage at the Luana/Frankville contact at the first distinct shale (DSl). There continues to be a trace amount of dolomite in the Luana and a small amount of rhombic porosity that represents dolomite that has been dissolved from the sample by weathering. Dolomite becomes significant again in the Littleport Member. Dolomite content adds to the meager rationale for subdividing the Dubuque into members. The Maquoketa is even more
· dolomitic than the Stewartville, with some beds that have been almost completely dolomitized.
Little of the dolomite in the section is detrital (i.e., deposited as sediment grains). Most of it has replaced preexisting limestone carbonate beds. However, some dolomite rhombs at the tops of beds in the Littleport Member appear to be detrital. For example, bed DL26 (as shown by sample MYl 09) overlies a wave-scoured surface, from which material was ripped off by storm activity and which acquired a wavy surface. Non~dolomitic angular clasts of siliceous clay float in a matrix of dolomite rhombs above the wavy bedding. This juxtaposition suggests that the dolomite was a detrital residue· from the eroded layer. A photomicrograph of a typical storm deposit is shown in Figure 7.
The most obvious depositional trend, of course, is the appearance of shale interbeds at the Luana/Frankville contact. Phosphate grains and phosphatized fossils, especially conodonts, appear for the first time and coincide with the influx of shale. Shale and phosphate continue to be common upward through the lower Maquoketa. Fossils are located rather uniformly throughout the column, suggesting that any changes in the geochemical environment controlling the precipitation of dolomite were subtle enough that the fauna were not disrupted. Carbonate mud is also fairly constant, although it gives way to shale in the Maquoketa.
Fossils are one of the chief clues to interpreting the depositional environment. Details are given in the Interpretive Report. The most characteristic feature of the Stewartville is the numerous burrows of the worm Paleosynapta jlaccida. They are tubular structures about a centimeter in diameter and have been dolomitized. The dolomite is very susceptible to weathering and often leaves holes in the surrounding limestone. However, in many places the burrows protrude into the cave instead of weathering inward. The difference is shown in photographs in the Interpretive Report. Projecting burrows invariably lie below those that weather to holes. This difference is not controlled by stratigraphy, because the transition point migrates up or down following the contours of wh~t seem to have been banks of sediment. Burrows that project outward appear to have been covered at one time by sediment that has since been removed by erosion. The sediment apparently protected the dolomite from weathering. Remnants of sediment can be traced up to the level at which the burrows stop projecting. The cave walls are usually more recessed where the burrows protrude. Burrows stick out on the surface of undercut ledges, implying that water may have been more aggressive to limestone than to dolomite below the sediment cover, where erosional effects would be absent.

w (!)
~ z w 0 a: w 0.. w
~ ::::> ~ :::> 0
I • % Dolomite c:::J OfonN~~~~-~iej
~~~~~~;~~~~~~m~~mm~wra~~~mm~~~~~~~~~2ag~~~~~~~~~~go~~m~~~~~~~~~~EE~~~~~~~
Stewartville Fm. Dubuque Fm. Samples
Dubuque Fm. Maquoketa Fm.
Figure 6: Pecentage of dolomite and non-carbonate fractions in bedrock samples, based on pointcount analysis of thin sections. ~
0
( \
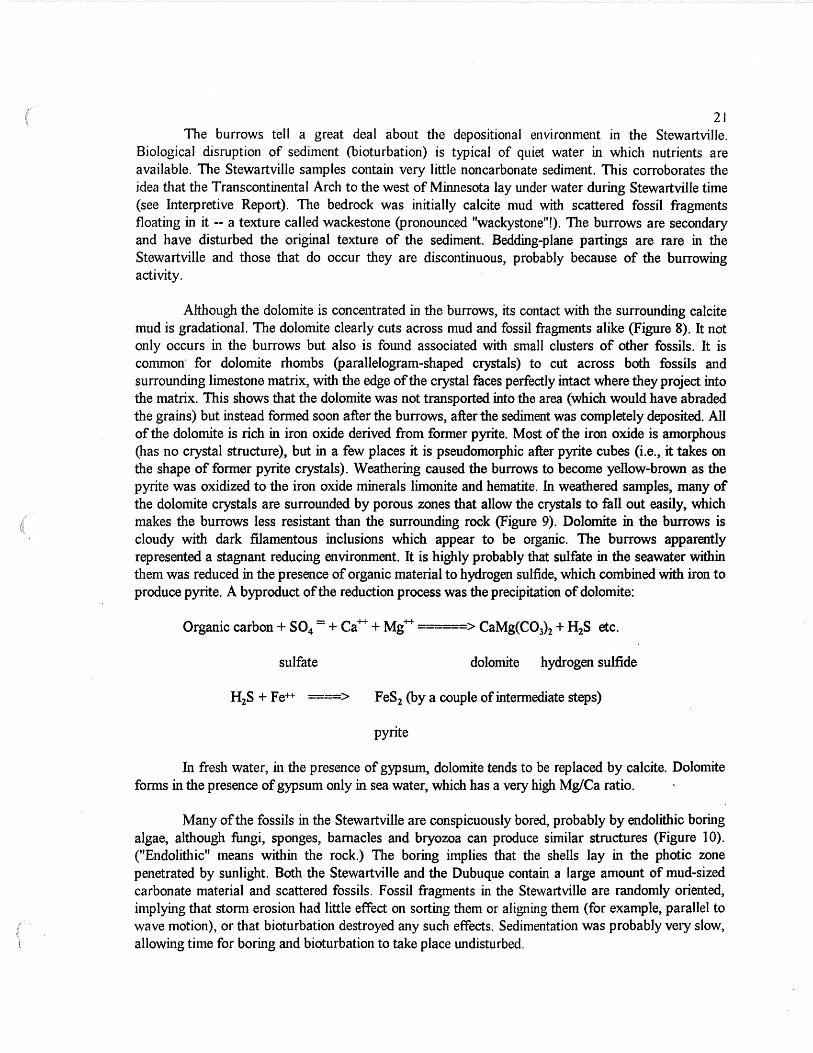
21 The burrows tell a great deal about the depositional environment in the Stewartville.
Biological disruption of sediment (bioturbation) is typical of quiet water in which nutrients are available. The Stewartville samples contain very little noncarbonate sediment. This corroborates the idea that the Transcontinental Arch to the west of Minnesota lay under water during Stewartville time (see Interpretive Report). The bedrock was initially calcite mud with scattered fossil fragments floating in it -- a texture called wackestone (pronounced "wackystone"!). The burrows are secondary and have disturbed the original texture of the sediment. Bedding-plane partings are rare in the Stewartville and those that do occur they are discontinuous, probably because of the burrowing activity.
Although the dolomite is concentrated in the burrows, its contact with the surrounding calcite mud is gradational. The dolomite clearly cuts across mud and fossil fragments alike (Figure 8). It not only occurs in the burrows but also is found associated with small clusters of other fossils. It is common· for dolomite rhombs (parallelogram-shaped crystals) to cut across both fossils and surrounding limestone matrix, with the edge of the crystal faces perfectly intact where they project into the matrix. This shows that the dolomite was not transported into the area (which would have abraded the grains) but instead formed soon after the burrows, after the sediment was completely deposited. All of the dolomite is rich in iron oxide derived from former pyrite. Most of the iron oxide is amorphous (has no crystal structure), but in a few places it is pseudomorphic after pyrite cubes (i.e., it takes on the shape of former pyrite crystals). Weathering caused the burrows to become yellow-brown as the pyrite was oxidized to the iron oxide minerals limonite and hematite. In weathered samples, many of the dolomite crystals are surrounded by porous zones that allow the crystals to fall out easily, which makes the burrows less resistant than the surrounding rock (Figure 9). Dolomite in the burrows is cloudy with dark filamentous inclusions which appear to be organic. The burrows apparently represented a stagnant reducing environment. It is highly probably that sulfate in the seawater within them was reduced in the presence of organic material to hydrogen sulfide, which combined with iron to produce pyrite. A byproduct of the reduction process was the precipitation of dolomite:
Organic carbon+ S04 =+Ca+++ Mg++ ___ > CaMg(C03) 2 + H2S etc.
sulfate dolomite hydrogen sulfide
FeS2 (by a couple of intermediate steps)
pyrite
fu fresh water, in the presence of gypsum, dolomite tends to be replaced by calcite. Dolomite forms in the presence of gypsum only in sea water, which has a very high Mg/Ca ratio.
Many of the fossils in the Stewartville are conspicuously bored, probably by endolithic boring algae, although fungi, sponges, barnacles and bryozoa can produce similar structures (Figure 10). ("Endolithic" means within the rock.) The boring implies that the shells lay in the photic zone penetrated by sunlight. Both the Stewartville and the Dubuque contain a large amount of mud-sized carbonate material and scattered fossils. Fossil fragments in the Stewartville are randomly oriented, implying that storm erosion had little effect on sorting them or aligning them (for example, parallel to wave motion), or that bioturbation destroyed any such effects. Sedimentation was probab]y very s]ow, allowing time for boring and bioturbation to take place undisturbed.

(
22
Figure 7: Thin section of a lag deposit of shells overlain by carbonate mud that settled out after a storm (MYIOOa). Enlargement= 5.5X (non-polarized light).
Figure 8: Dolomite rhombs typically cross the bedrock matrix, grains, and fossils, showing that the dolomite post-dates the original sediment (sample MYI 09). Elargement = 40X (polarized light).
Figure 9: Porous zones (dark areas) outlining corroded dolomite crystals 111 weathered samples (MY2). Enlargement =· 6 7X (polarized light).

( \
23
Figure 10: Thin section showing organic borings in a fossil fragment, typical of Stewartville ·Formation (MY38). Enlargement= SOX (polarized light).
Figure 11: Bedrock grains partly replaced by gypsum that has since been replaced by calcite spar (MY 45). Enlargement SOX (polahzed light)

24 Some fossils in the rocks exposed in Mystery Cave have been recrystallized to calcite spar.
Many of these fossils were completely dissolved and their molds were filled with spar. This is typical of fossils whose shells were originally composed of aragonite. Because aragonite is usually unstable in fresh groundwater, it easily dissolves. The tendency for former aragonite shells to dissolve in the upper Stewartville was noted by Delgado, (1983), although his observations show that the dissolved shells were filled with sediment instead. Evidence of boring activity in some of these calcified fossils indicates that calcite replacement took place in the marine environment, in which the aragonite would presumably have still been stable, and not at a later date after the rocks had been exposed to fresh groundwater by uplift. Calcite nodules scattered throughout the Stewartville, especially near the top, are another indication that calcite was stable at the time of dolomite precipitation. Calcite vugs are also concentrated along joints and cracks at about eye level in the Angel Loop. Near the top of the Stewartville, calcite spar fills the burrows but is surrounded by a hazy zone of dolomite. The spar does not have a sharp . contact with the surrounding rock but partially digests it, leaving bits of unassimilated dolomite and inclusions floating in the spar. Dolomite rhombs are irregular and corroded, with many holes and ragged edges. In sample MY45 (near the top of the Stewartville) partly assimilated fossil fragments "float" in.spar. Edges of the fragments are broken into small crystals that have become assimilated by the spar. Iron oxide occurs at the edges. Slightly larger spindle- or lozenge-shaped calcite crystals float nearby within the spar along with tiny remnants of almost completely assimilated fossil grains. In one place the inclusions are dark, very small networks of what appear to be filaments. It is clear that dolomite formed in the low-energy reducing environment and that the spar.formed soon afterward.
Textures like these are common in areas of gypswn replacement of limestone or dolomite. Gypsum wedges the bedrock apart as the gypsum crystallizes in cracks and gradually replaces the fragments by assimilation (Figure 11). Bedrock fragments appear to "float" in the gypsum. Breccias (conglomerates with angular fragments) are commonly produced. Such a breccia occurs at the Stewartville/Dubuque contact. We have observed similar features in bedrock replacement zones behind gypsum crusts in many areas, including Lechuguilla Cave, New Mexico. Another indication that gypsum was present is the presence of stylolites, which are irregular interpenetrations of one bed into the underlying one. Stylolites represent zones of compaction, often where a void space has collapsed. Gypsum is very soluble and its former presence is frequently represented by stylolites. Sample MY 46 (bed SX3) is lined with spar that has filled cracks. fonned by gypsum growth. The spar in MY 46 (bed SX3) ends laterally in a wavy clisconformity, as described in the Interpretive Report.
Besides the worm burrows in the Stewartville, other organic remains can tell us about the environment. Scavenging organisms such as snails and nautiloids are common, indicating yet again a high level of organic material in the sediment. Fossils are similar to those found in the Dubuque. Sloan (1987) reported that an extinction event reduced the fauna by 90 percent in the lower Stewartville, which he thought was caused by shallowing of the water (see graph of water depths in the Interpretive Report). If our interpretation is correct that sulfate reduction was common in the Stewartville, could an alternate explanation be that salinity rose as the sea became shallower, killing many organisms? According to Sloan and Webers (1987), the few species of snails that dominated the upper Stewartville lived under very harsh conditions. We found fewer intact shells in the Stewartville than in the Dubuque, but the overall percentage of fossil debris does not vary much between formations, and the fossil types were much the same.
Large fossi] fragments are easily recognized in thin sections from the Dubuque. The most common include brachiopods, trilobites, ostracods, conodonts, and echinoderms. Brachiopod shells are layered, with thin, subparallel laminations that are inclined at angles to the she11 surface like shingles

25 on a roof. The laminations are usually slightly wavy or crinkled. A trilobite shell consists of a single crystal. Extinction under polarized light (i.e., the sample turns dark)' does not occur sharply or al1 at once, but instead a dark extinction band travels as a wave across the crystal as the microscope stage is rotated. In cross section, trilobite shells have bent ends that look like shepherd's crooks. The two shells of an ostracod are usually nearly spherical and only about a millimeter wide. Conodonts are tiny (1/2 mm) tooth-shaped features usually replaced by phosphate. Echinoderms are made up of monocrystalline plates. The echinoderm is easily broken up, leaving many round-to-square plates having sharp extinction under polarized light. Chitinozoans, of uncertain affinity, became common in the Upper Dubuque and Maquoketa. They are tiny (1/2 mm) opaque, thin walled, black organic bodies shaped like vases but squashed flat in our samples so that the two walls lie against each other.
Phosphate is associated with the shale beds in the upper Dubuque Formation and continues upward into the Maquoketa. Phosphate is also encountered in one of the lowest shales (sample MY58 =bed DS2). At this same horizon, dolomite decreases to a trace amount. Phosphate is often associated with nondepositional intervals or periods of slow sedimentation and can imply high biological production (Scholle, 1978). Experiments suggest that organic matter provides phosphate to pore water and will not form if the substrate is sterile (Southgate, 1986). Burrowing becomes less common upward into the Dubuque, and layers of large fossil fragments separated by calcite mud are common. TI1ese fossils are probably remnants from episodic storms, when high-energy waves reworked the bottom sediment. Fine-grained material went into suspension, while the heavier fossils were aligned along the bottom as a lag deposit and were covered with mud again when the fine-grained material settled out. Sparse calcite spar in the upper Dubuque shows evidence of having replaced evaporites. Conditions seem to have returned to those of the upper Stewartville. Dolomite crystallized in a reducing environment near the top of the Dubuque where organic carbon was present.
The Dolomite Question
How does dolomite form? This is a question that has plagued geologists for many years. There is an immense amount of literature devoted to this topic and no real end in sight (Hardie, 1987). There are many hypotheses on the subject, and a good discussion can be found in Blatt, Middleton and Murray (1980). But when applied to the field, usually no single theory seems to fit. Most geologists in
· the midcontinent favor the model that invokes mixing of freshwater with seawater for the Galena dolomites. It was thought that fresh water from land areas mixed with magnesium-rich saline water to form a mixture that would precipitate dolomite. Even though the idea is supported by the fact that the Galena dolomites formed in shallower water than limestone, there are exceptions where this hypothesis does not hold true (Witzke, 1983).
Friedman (1980) recognized that dolomite is associated with gypsum (Friedman, 1980), and that its reduction might form dolomite (Mullins and others, 1988). Compton (1988), who studied dolomite in the Monterey Formation in California, found so much evidence for the coincidental decay of organic matter, the reduction of sulfate, and the origin of dolomite, that he called this dolomite "organogenic." Evidence that sulfate reduction produced the large bodies of dolomite that formed in the shallow continental seas of the past has been largely overlooked. Although the evidence in the Mystery Cave samples is subtle, we strongly support this origin for the dolomite in the Stewartville.

26 GEOLOGICSTRUCTURK
The enclosed geologic profile of the cave clearly shows the local northwesterly dip of the rocks in which the cave is developed. The mean dip of any particular geologic contact or bed (i.e., the angle at which it is tilted) can be found by calculating the regression plane through all the measured points on that contact. The results differ according to the contact chosen because the dip is not unifonn, and each contact is exposed in somewhat different parts of the cave.
The 87 points measured in the cave on the Dubuque/Stewartville contact have the following regression plane: ·
elevation above sea level= 0.007I E - 0.0050 N + I 198.95 ft.
where E =feet east of station DI and N =feet north of station DI (use negative values for west and south respectively). The standard error of estimate is 2.08 feet -- that is the mean deviation in elevation between the regression planes and the actual measured points. The regression plane dips 0.50 degree in the direction 304.9 degrees.
A surn.lnary ofthe dip attitude of various contacts is given below:
Contact Dip angle Ft./mileDip direction Std. error No. of points
D/S 0.50 deg 46 ft/mi 304.9 deg 2.08 ft 87 BP2 0.68 62 307.4 1.55 56 DS1/DT4 0.77 7I 3I2.6 1.91 19 DL9/DS9 0.55 51 302.1 1.27 38 DS10/DL9 0.68 63 308.0 1.46 21 DLlO/DSIO 0.72 66 308.1 1.24 34 DL14/DS14 0.50 46 307.4 1.55 18
The average dip of the rocks in the cave is therefore about 50-60 feet per mile, with a rather uniform dip direction of about 307 degrees (i.e., 53 degrees west of north). The smaller mean dips are on contacts that are partly exposed in low-dip parts of the cave. For example, D/S is exposed in Fifth A venue and the route to the Garden of the Gods, where the dip is less than in the other parts of the cave. The standard error is understandably large, because a single regression plane cannot represent very well all the points on a contact that varies in dip. Those contacts with both low standard error and low dip are exposed mainly in those parts of the cave in which the dip is low.
In detail, there are many small structures superimposed on the average dip, some due to erosional/depositional irregularities or differential compaction, and some due to structural deformation. From the standpoint of water flow, there is little difference in effect.
To reveal the variations in dip in the area, the Dubuque/Stewartville contact was contoured using the contouring program SURFER (Golden Software Co., Golden, CO). To provide rather unifonn coverage throughout the cave, several other higher stratigraphic contacts were included in the data, with their elevations adjusted downward to the Dubuque/Stewartville contact. In other words, measurements on D L 10/DS l 0 are 15 .25 feet above the D/S contact, and so this interval was subtracted from the original values to represent the underlying D/S contact at that location. Stratal

27 thickness is nearly uniform throughout the cave, so this technique was valid for this purpose. All such adjusted values were then contoured using the minimum cu.rvature routine, which fits the data points with a contoured surface having the smallest possible curvature. The resulting structural contour map is shown in Figure 12. Survey points are shown as asterisks.
Contours in Figure 12 are least accurate in the northwest, northeast, and southeast comers of the map, where there are no measured points. The contouring routine assigned unlikely warped structures to these areas to fulfill the minimum-curvature requirements, and to avoid this a few arbitrary points were added in these areas to make the structure more realistic, although still obviously not correct. Unless actual data points are available for these areas, no amount of statistical manipulation can interpret what is going on there.
Contouring by hand is often better for geologic interpretations, as the computer program has no intuitive feel for the way geologic structures behave in real life. The adjustment of the contours in the comers described above is an example of the intuitive approach. However, the contours produced by the program were left intact in the cave area, where there were abundant data points, to avoid any bias in contouring. This impartial approach was important at Mystery Cave, because regardless which contouring routine was used, a distinct change in dip angle was observed in the vicinity of the junction between Fifth Avenue and the Angel Loop that seems to account for northwest-southeast passage trends in that part of the cave.
The northwest-southeast fissure passages in the cave are all located along or just east of the steepening of dip (compare Figure 12 with the cave maps included in the Appendices). Joints having this NW-SE trend appear throughout the cave, but they are enlarged to cave size by solution only in the northeastern part of the cave. Local stress in the rock must have been greater along the hinge line where the dip changes, widening the joints to the point where the cave could utilize them as easily as the other joint sets. Therefore, this flexure in the beds appears to have had a significant impact on the orientation of fissure passages in the cave. ·
The structural contour map shows a dip change from west-northwest at Mystery ~ave to southwest at Grabau Quarry, which is located north of the South Branch of Root River. The map shows a strike direction of 310 degrees (N 50° W) at the quarry. During the leveling survey to the quarry, we measured the local strike by positioning the tripod-mounted level at a distinct contact and rotating the instrument until its cross-hairs were superimposed on the same contact in the opposite wall of the quarry. This indicated a strike direction of 328 degrees (N 38° W). No attempt was made to account for the slight calibration error in the instrument over that distance (several hundred feet), so this strike estimate is imperfect. However, the local southwesterly dip on the structural contour map was verified.

0
z 0 1-f
,,,..-
5500
4500
I- 3500 <( f-(J)
LL 0
2500 I f-IL 0 z I- 1500 w w LL
500
_ 500 • > > > I K I > II > > I I I I I « I I I I > Q > 1 > I > > I > > I > > p > > U > I I I I l I I I I 11 l I I I I I I I I I I I ! I I I I • r I
0 ·1000 2000 3000 4000 5000 6000 7000 8000 FEET EAST OF STATION 01
Figure 12: Structural contour map of the Dubuque I Stewartville contact in Mystery Cave and surrounding areas. * = surveyed points. Refer to Figure l for passage relationships.
9000
N 00

29 GEOMORPHIC INTERPRETATION
The main discussion of the origin and developmental history of Mystery Cave is given in the Interpretive Report. The following section contains a summary of quantitative information that supports our conclusions. A summary of this interpretation is that the cave originated as an underground bypass for the South Branch of Root River, and that the passages developed in several stages: (I) an early west-to-east series of passages, including Fourth and Fifth Avenues; (2) passages in Mystery I and the Door-to-Door Route, with a general northeasterly trend; (3) lower levels that formed as the river level cut downward in its channel, allowing deeper cave development. This eveolution did not take place in discrete stages, as they overlap in time, and many of the original paths are still active in the lower levels, as well as periodically at all levels during floods. We view the cave as a dynamic floodwater cave that is intimately tied to the entrenchment history of the South Branch valley, rather than an enlarged remnant of a region-wide system of solutional fissures, although early solutional enlargement previous to the entrenchment of the river probably did contribute to the initial enlargement of some fractures. Entrenchment of the South Branch, and therefore the origin of Mystery Cave, depended on the entrenchment of the Mississippi River into the low-relief pre-glacial landscape. The Root River is tributary to the Mississippi and could not cut downward independently. This entrenchment began in the early or middle Quaternary Period, probably between 500,000 and 1,000,000 years ago, as indicated by the presence of old glacial deposits of presumed "Kansan" age in the valley. (The terms Nebraskan, Kansan, Illinoian, and Wisconsinan have long been used to designate what were thought to be four main glaciations in North America, but recent evidence makes this interpretation and these names a bit obsolete, although they are still used for general reference.) That would make the deepening of the river channel more than about 500,000 years ago.
Speleothem Dating
One of the few methods for obtaining absolute ages for cave features is radiomentric dating of calcite speleothems. Speleothem dates using 234u;230Th disequilibrium methods (Milske, Alexander and Lively, 1983), have made it possible to outline the more recent events in the cave's history. Most of the speleothem groups have already been sampled by Lively (of the Minnesota Geological Survey), and so only 5 additional dates were obtained as part of this LCMR project. These dates are summarized in Appendix 9.
A frequency plot of speleothem ages (Figure 13) shows several time intervals when caclite deposition was favored (mainly around 10-5 ka and 100-150 ka) with intervening periods of little or no deposition (ka = age in thousands of years -- a convenient abbreviation used mainly by those involved in geologic age dating). Some dates exceed the range of the method, and are therefore older than 350 ka. In accordance with earlier workers, Milske, Alexander and Lively (1983) interpreted this pattern with the view that speleothems form during interglacial periods, when vegetated soil is abundant and contributes C02 to the infiltrating water. During cold periods, when the area is either covered with ice or in the zone of permafrost, both the infiltration rate and the C02 production in the· . soil are low. Some caves were also deactivated by nearly complete filling with glacially derived sediment. Speleothem dates from Europe and elsewhere in North America ~ennig and others, 1983) show peaks of speleothem growth at 0-20 ka and around I 00 ka. Beyond that there are no significant peaks or breaks in the dates. The·data of Harmon and others (1977) for speleothems from caves in the Canadian Rockies show the first two peaks, but also two older around 200 and 300 ka. Because icefree and ice-covered conditions seem to have no sharp divisions in the midcontinent, it is impossible to

>-0 z w :::> a
14
12
10
8
w 6 0::: u..
4
2
.
.
.
.
.
0
.---......,
-
SPELEOTHEM DATES, MYSTERY CAVE
. Data by Richard Lively (listed in Appendix 9)
...
... ...
... 1>3501
- - - - -ii---,- -... ... i- - -
-- -- - ... i-- - - -- ...
I I 1111111111111 1111111111111111 50 100 150 200 250 300
AGE (thousands of years)
Figure 13: Distribution of speleothem ages, from Milske, Alexander, and Lively (1983) and from samples collected for this project. w
0

( (
-make sharp distinctions between cold and warm periods, and the the speleothem record reflects the haziness ofthe climatic boundaries.
3 J
The lack of clear peaks beyond about 150 ka in Mystery Cave is probably due to the fact that many of the older speleothems have been so recrystallized that their Uffh composition has been disrupted, and no dates could be obtained from them. Another factor of particular significance at Mystery Cave is that flooding tends to destroy speleothems, and so those that are preserved are mainly the younger ones that post-date the deeper levels in the cave.
Cave Sediment
The sediment study by Milske (1982) and the summary by Milske, Alexander, and Lively (1983) shows that the typical sediment distribution in Mystery Cave consists of thick silt overlain by thin layers of sand and gravel. They found that most of the sediment in the cave was derived from preIllinoian glacial deposits outside the cave. It was rarely derived from the bedrock. Both the cave sediment and the glacial material contain varying amounts of feldspar, montmorillonite and kaolinite; whereas the shale in the Dubuque does not contain these minerals. They interpreted the silt to have been deposited during the transition from deep phreatic to shallow phreatic conditions (phreatic means below the water table, where all openings are filled with water year round), and that the sand and gravel were deposited by swiftly flowing streams late in the history of the cave. Our intetpretation, based partly on the seismic data from the South Branch valley, is that silt is derived from the thick loess that covered the land surface late in the glacial history of the area, and that this material was carried in by the river and choked all the lower levels. The rapidly flowing streams that deposited the sand and gravel represented the same water, but flowing swiftly more or less at grade with the river and perched on the older silt.
On the basis of the speleothem dates, however, there appears to have been more than one stage of filling. Sediment in Enigma Pit is capp.ed by old speleothems (up to 180 ka), but those on the Door-to-Door Route are much younger (about 12 ka on the average). This age distribution may be misleading, because the Door-to-Door Route is still subject to flooding, and it is possible that early speleothems have been removed or were unable to form in the first place. These topics are discussed in detail in the Intetpretive Report.
The last glacial advance, the Des Moines Lobe, is probably represented by the break in speleothem deposition between 12-20 ka, and outwash from this lobe may have furnished the Door-toDoor sand and gravel, which was then overlain by thin silt and finally calcite dated at 8-12.6 ka. During the waning stages of the Des Moines Lobe, a series of large lakes ponded behind remnant ice in the Mississippi valley (Wright, 1985). When the ice dams broke, the river scoured its valley about 150 feet below its present floodplain. This channel has since filled with sediment back to about its original level. The South Branch of Root River at Mystery Cave apparently did not experience this short phase of entrenchment.

(
32 Past Water Flow in Mystery Cave
,5cal lop Data
Scallops are asymmetrical hollows in soluble bedrock formed by turbulent eddies in rapidly moving solvent water. They indicate two things of importance to interpreting cave origin: the direction and velocity of the last flow to significantly enlarge a given cave passage. This is convenient, because the scallops persist after the passage has been abandoned by the flow that formed it.
The direction of flow is indicated by the asymmetry of the scallops. The steep side of the divide between scallops is on the downstream side, as it is in a sand dune or current ripple mark. Running a hand along the wall, one finds that the sharp edges of the scallops feel rougher in the upstream direction than in the downstream direction. It helps to imagine the asymmetry to be like the teeth in a saw.
The velocity of flow is inversely proportional to the scallop length, measured in the direction of flow (Curl, 1974). A one-inch-long scallop represents twice the velocity of a two-inch-long scallop. Since the scallops in a passage exhibit a variety of lengths, a weighted mean is used that emphasizes the larger (and presumably better-developed) scallops. Measure the maximum crest-to-crest length of all scallops in a given area, cube each measurement, then square each measurement. The weighted mean recommended by Curl is the Sauter mean, in which the sum of all the cubed values is divided by the sum of all the squared values. In practice, there is little need for this amount of rigor, since we are interested in rough comparisons between different parts of the cave. Furthermore, if one selects just the well-developed scallops, a simple arithmetic mean (average) length is sufficient (Palmer, 1976).
The scallops indicate the flow velocity right near the wall. However, the velocity of turbulent water increases logarithmically away from the walls. Thus the velocity at a distance of two inches from the wall would be twice as great as the velocity at a distance of one inch from the wall. To obtain the average velocity within the passage, it is necessary to integrate the velocity across the entire passage radius. Curl (1974) provides solutions for two end members: tubes of circular cross section and narrow fissures. Considering the uncertainty of scallop preservation and interpretation, and the irregularity of passages, it is convenient simply to use the average scallop length to find the velocity near the wall and to consider that to be a representative velocity for the entire passage, or a particular part of the passage. Using the experimental results of Curl (1974), it is possible to simplify the otherwise complex calculation by using the following expression (Palmer, 1981):
velocity (cm/sec) = 350 IL
where L =scallop length in centimeters. Thus a passage containing scallops with an average length of 5 cm was last enlarged by water with a velocity of at least 70 cm/sec, or about two feet per second. Calculations can be easily made right in the cave and compared from one place to another.
The apparent origin of Mystery Cave by undergroWld piracy of the South Branch of Root River would seem to provide an ideal setting for scallop development. However, the mottled te)ft:ure of the Stewartville Formation is.not conducive to scallop development. Projections caused by differential solution interfere with the eddies that would otheiwise form scallops. In addition, scallops require rather Wliform bedrock texture to achieve their natural form. The best strata for preserving scallops
·are the transitional beds between the Stewartville and Dubuque and the limestone units within the

33 Dubuque. However, most of the Dubuque is exposed in high-level passages subject only to relatively static ponding during floods, and so scallops are largely absent from the Dubuque as well. As a final complicating factor, even well-developed scallops are scattered among many alternate paths of flow, so it is difficult to draw together their individual characteristics into a single cave-wide interpretation. We are left with relatively few interpretable scallops. ·
Scallops are best preserved in the Door-to-Door Route and in Mystery III. In both locations the Dubuque and transitional beds are exposed in passages low enough in elevation to allow invasion by high-velocity floodwaters. During the leveling project, scallops were observed in the following locations (calculated velocities are rounded off slightly):
Station Location Scallop Length Min. Velocity
H377 between Bomb Shelter and Big Fork 1.5 cm 230 cm/sec H401-403 crawl beyond Big Fork 3 cm 115 cm/sec H416 fissure beyond Big Fork lcm 350 cm/sec H429 fissure near Little Fork 9cm 40 cm/sec H646 Culverts 1.5 cm 230 cm/sec H655 fissures northwest of Culverts 3-6cm 60-115 cm/sec
All of the above indicate flow away from Mystery I toward Mystery II.
H22 Discovery Route (Mystery III) 12-15 cm 25-30 cm/sec H16 passage to 1st Triangle Room 2.5cm 140 cm/sec
H32 passage to Fifth Ave. West 2 .. 5-10 cm 35-140 cm/sec H29 passage to Rotunda Room 15 cm 25 cm/sec H27 above Lily Pad Lake 2.5 cm 140 cm/sec H33 Fingers area 2.5 cm 140 cm/sec
All of the above indicate flow toward the north, northeast, or east (depending on orientation of passage).
Rather high velocities are indicated by these scallop measurements. During floods, water moves very rapidly through narrow passages where there is no ·alternate route. Such passages commonly contain coarse sediment such as sand and gravel, although these coarse sediments may be concealed beneath a cover of fine-grained sediment deposited on top during ponding events. In places, water ponds. up in nearly static lakes where a downstream constriction prevents it from exiting a given passage at the same rate that it enters. Such areas of static ponding do not contain scallops and are recognized only by fine-grained sediment (clay and silt) and by injection floodwater features such as ceiling pockets and joint-controlled dead-end fissures.
Sediment Grain Size as a Velocity Indicator
From the above discussion, it is clear that sediment is an important indicator of flow velocity and should be used in conjunction with scallops in interpreting the hydraulics of the cave. There are various ways to estimate flow velocity from the grain size of sediment. The most commonly used method is the experimental graph ofHjulstrom (1935), which shows the minimum velocities at which
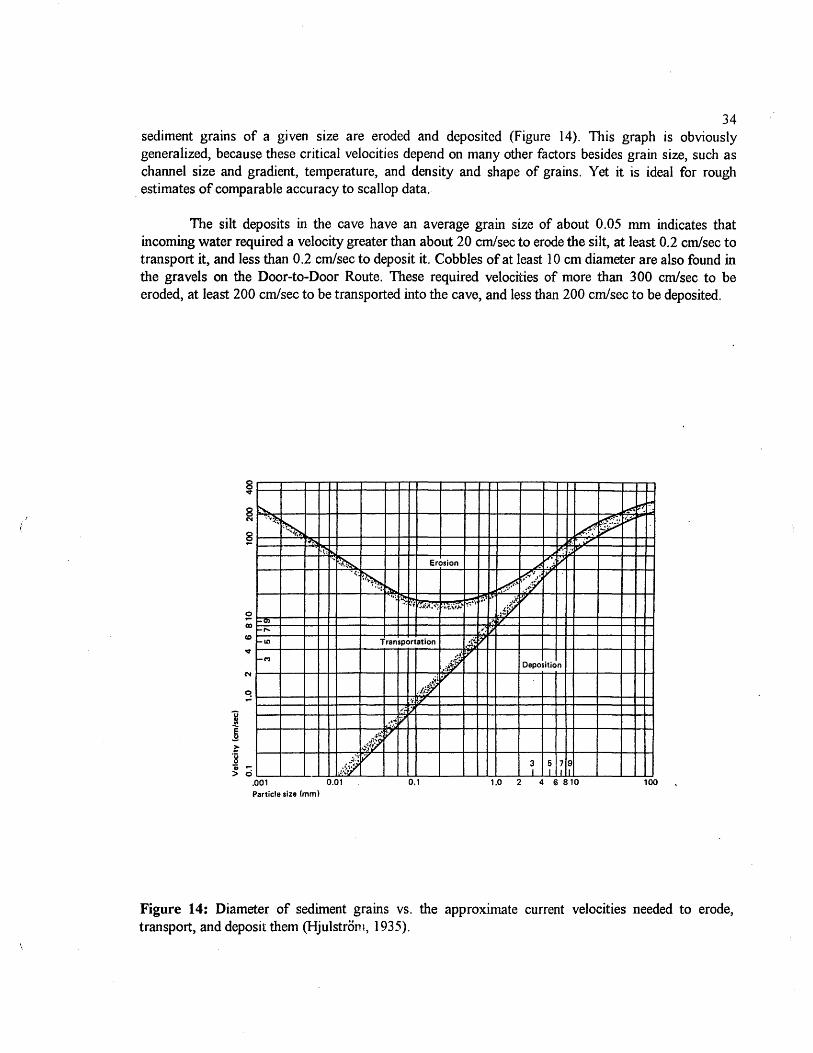
34 sediment grains of a given size are eroded and deposited (Figure 14). This graph is obviously generalized, because these critical velocities depend on many other factors besides grain size, such as channel size and gradient, temperature, and density and shape of grains. Yet it is ideal for rough
. estimates of comparable accuracy to scallop data.
The silt deposits in the cave have an average grain size of about 0.05 mm indicates that incoming water required a velocity greater than about 20 cm/sec to erode the silt, at least 0.2 cm/sec to transport it, and less than 0.2 cm/sec to deposit it. Cobbles of at least 10 cm diameter are also found in the gravels on the Door-to-Door Route. These required velocities of more than 300 cm/sec to be eroded, at least 200 cm/sec to be transported into the cave, and less than 200 cm/sec to be deposited.
~~~
~~~.,:::~'~ ..... . .
'~~ Erosion ~. ~j ~
"'' ~ °:i ·~;.~.<; "~X.1>- ~ -;.• ·' .:;~~~~ ;;;" ~~---=f---+--+-++---+--+-+-++--+--+--+-+=f<''"~·f.jY-+---+-t-++--+--+-t-H co ........ r,; co '""Ill Transportation .4£ 7 ~~-+---~H-+--+-----r-t--t--r---+-.:-~~·~·~idol'i-++---+--+-+-+-t----+--+-+-+-1
'""M t7 Deposition Nl----'----~~+-~---+-1-+-+-~'~!fi~·+-l-+-+--l----+-t--+-+-~--+-l-+-f
.~~ 0 .... 1----'---~~+-~---+--1-+-~··"~iif-+---+-1-t-+--+---+-1-+-+---+---~~
·~ !f
···v •lf~~
~ ~J'l/
J ci.__-L----~-L....L.~·~~~f/~f~Y'---......... ._._.....__._ __ .._~_.__.__~._._~51~;~~..__~--......... ~ .001 0.01 0.1 1.0 2 4 6 810 100 Particle size (mm)
Figure 14: Diameter of sediment grains vs. the approximate current velocities needed to erode, transport, and deposit them (Hjulstrom, 1935).

( ('
35 Velocity estimates like this arc tantalizing, but it is difficult to make much quantitative
headway beyond the obvious fact that silt and clay represent relatively stagnant water and sand and gravel represent fast-moving water. For example, the presence of gravel in the cave requires a supply of gravel on the surface. This may not have been available at all times during the history of the cave. The thick silt may represent widespread availability of windblown material at the surface during glacial events, rather than special aspects of cave development. Much can be done on this subject, but any gains will be hard won.
Sediment Thickness and Bedrock Configuration at Mystery Cave
Seismic profiles were conducted mainly to determine the depth to bedrock in the valley adjacent to the cave. Seismic data, locations, and interpretations are given in Appendix 3. The cross section of the valley fill in the valley of the South Branch of Root River at the Mystery I entrance is shown in Figure 15. The average depth of sediment fill in the valley is 20-23 feet, increasing to a maximum measured value of 27 feet below Grabau Quarry. Depth to bedrock appears to be comparable in the uplands. It is 22 feet above Garden of the Gods in Mystery II, and between 10 and 20 feet in the field west of Walnut Cave. Walnut Cave is located in a residual bench of limestone over which the soil depth is only about 10 feet. Apparently the South Branch had cut its channel about 20-2 7 feet deeper in the past than it is at present, and has since been partly filled with sediment.
The seismic velocity of the surficial material (evidently the entire thickness) is surprisingly uniform over the entire area at about 1000 ft/sec, which indicates dry unconsolidated material. The water table is at or below the bedrock surface. This means that the South Branch is perched above the water table on rather impermeable material and loses its water only where it encounters limestone or similar permeable material in its bed. The uniformity of this material in both thickness and seismic velocity over the entire area suggests that it is wind-deposited silt (loess). Further discussion of the topic is given in the Interpretive Report.

Altitude
1250 ft
1240 ft
123o·n
1220 ft
1210 ft
w
·.· .... >< ... . . :. ' -: -=-.-:..:.: -· _:. ;_:...., _·-~-·-:...:....-_._~
bedrock surface 200 feet south or Walnut Cave
Walnut Cave
100 feet
Mystery I Entrance land surface south of Walnut Cave
floodplain 01. DNR BM10
,,-c.: r_"":_-.,.: : : .• .-; ....... : : . , .... · .. ". : . . . . . & ', land surface at Walnut Cave • • • (1230.37 ft) •• :
' . ·. ' ... .' - ,
\
\ \
' sediment fill
'~ bedrock surface at Walnut Cave
·. ~>.<.: ·;; .; ...... ·:·:~:: : .. -.:::.·.:..;..: .. :.-.~:.----~'--~1~:~-.::1.~-·-- _. . • = depth determined by seismic refraction approximate sediment I bedrock contact at Mystery cave to Needle s Eye
E
~
1200ft ~ 1200ft -----------------------------~--------------------------------------~-------------i
Sediment Thickness in Valley of South Branch of Root River at Mystery I
From Seismic Refraction Profiles
Figure 15: Sediment thickness in the valley of the South Branch of Root River at the Mystery I entrance, as determined by refraction seismology.
w
°'

(
37 WATER CHEMISTRY
Although water chemistry is covered in a separate report by Calvin Alexander and Roy Jameson, two aspects of the subject are of concern to the geologic interpretation of the cave: (1) the nature of the water that fonned the cave, and (2) geochemical factors that control the mineral types and crystal habits of cave deposits. We made a few measurements specifically to investigate these questions, but our conclusions are based mainly on reports by others.
Chemistry of Cave-Forming Water
The location of Mystery Cave in a meander loop of the South Branch suggests that the cave originated by underground diversion of the river water, fonning a sort of subsurface meander cutoff with the cave as a byproduct. Today the river is usually supersaturated with calcite and dolomite, except during floods. The maze pattern of the cave can be attributed at least in part to flooding, where high-gradient, aggressive flow enlarges many different passages at comparable rates (Palmer, 1975). This view is supported by the fact that the river water is most aggressive during flood stage -- and in fact may not be able to enlarge the cave at all at .ather times. Streams in the cave are generally supersaturated during all but the highest flow (see report on the LCMR Hydrology Project).
From the field and lab data of Shiela Grow (1986), we calculated the saturation indices of calcite and dolomite (square-root version) and the Pco2 and plotted this information vs. river stage. Several points had to be deleted because of obvious inaccuracies or instrumental problems; but the remainder, despite considerable scatter, showed a strong inverse relationship between river stage and saturation index. The data showed no significant relationship between river stage and Pco2, although such a relationship is of little concern here.
River stage was measured on the metric staff gauge that was formerly located near the Mystery I entrance. Unfortunately the staff gauge was removed before it could be tied to our leveling survey. However, typical stage at base flow was about 40 cm, and this gives a rough idea of how the old values compare with more recent measurements.
The data pairs (stage vs. SI) were fit best by straight lines (Figures 16 and 17). The regression lines shown on the graphs do not include our 4-19-93 data point, as its relationship to the stage readings of Grow (1986) is uncertain. The correlation coefficient for the linear regression is -0.84 and the standard error is 0 .24, showing a distinct inverse - relationship. For dolomite the correlation coefficient is -0.84 and standard error is 0.27.
This information suggests that the river water today is aggressive with respect to either limestone or dolomite only when the stage exceeds about 62 cm, which represents a flood of only about 22 cm -- less than a foot. Such floods occur many times each year, and although they account for only about 10-20% of the time, they represent periods of significant cave enlargement under the conditions most favorable to the origin of a network maze.
During a moderate flood on April 19, 1993, the South Branch rose 3-4 feet, covering the floodplain around the Mystery·I ticket office. A water sample obtained no more than half an hour after the crest showed the river to have the following values: Sic= -0.52, Sld = -0.79, and Pco2 = 0.0011 atm. Although these points fall considerably above the regression lines, the aggressive nature of the floodwater was verified.
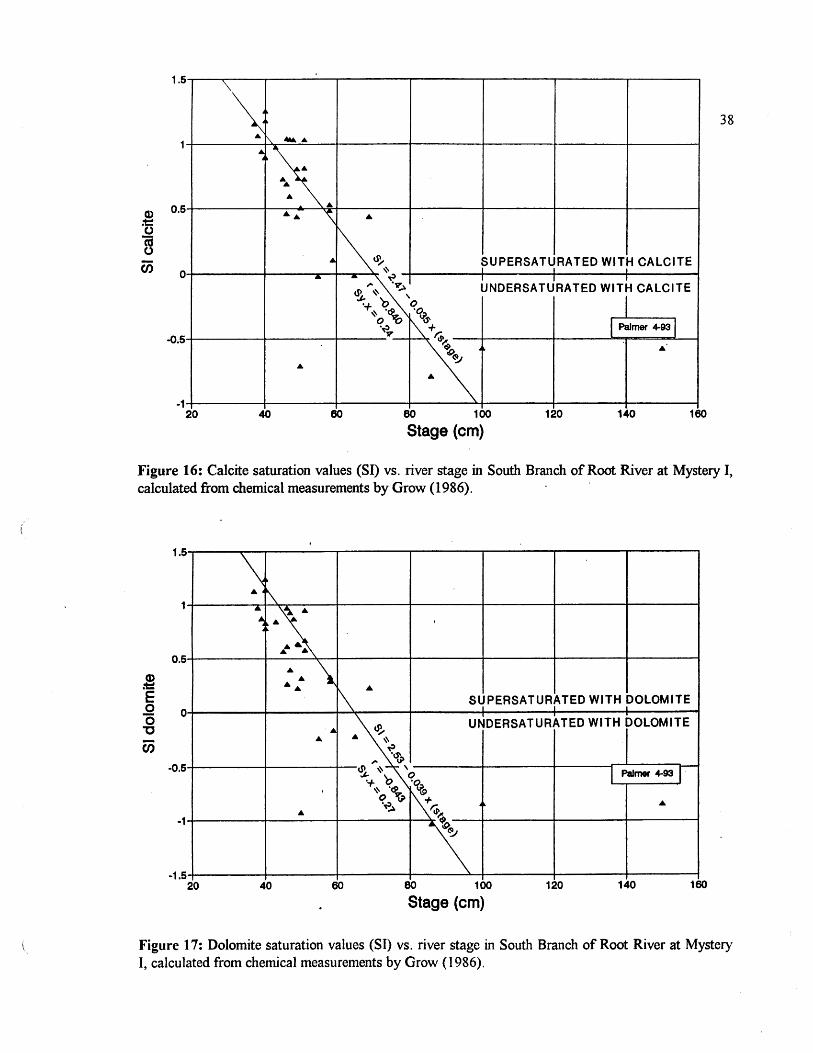
1.5
0.5
0
-0.5
-1 20
~\· •
.... "' .........
~.~ ..... ....
... -...
-
....
40
38
... ~ ...
·~~ SUPERSATURATED WITH CALCITE ~ I I I - i' I I I
,,.. '17 UNDERSATURATED WITH CALCITE tP. ~ ~ :I:- 'o 'o I +~ '% ·o
'q~ \ I Palmer 4-931
v_ !di~ ~ .. ... ~
...
60 80 100 120 140 160
Stage (cm)
Figure 16: Calcite saturation values (SI) vs. river stage in South Branch of Root River at Mystery I, calculated from chemical measurements by Grow (1986). ·
Q) ~
E 0 0 "C
en
1.5-----~\--r-----.-----,...------r---~-~----r------,
~
0.5
SUPERSATURATED WITH DOLOMITE
~~u> uNDERSATURilTED WITH rOLOMITE
4-----+-------1'-- ,-----+----~----r-"----·r~ q0
I Palmer 4-93
''o ~ ~+ ... ·,:i,,.l.~ -1-+------+----t-------t"--T\
-1.54------+----+-----+---..._+------+------iio-----t
0
-0.5
I I I
20 40 60 80 100 120 140 160
Stage (cm)
Figure 17: Dolomite saturation values (SI) vs. river stage in South Branch of Root River at Mystery I, calculated from chemical measurements by Grow (I 986).

39 At nearly the same time, a sample was obtained from a floodwater pool below the Dome
Room in Mystery I that yielded the foJJowing values: Slc = -0.22, Sid = -0.46, and PC02 = 0.00255 atm. The cave water was distinctly aggressive with respect to both limestone and dolomite during the flood. The aggressiveness had diminished slightly because of mixing with supersaturated cave water and probably with solution of bedrock, but the rise in Pco2 (because of mixing with cave water and uptake of C02 from the cave atmosphere) helped to maintain the aggressiveness. The concept of cave enlargement under floodwater conditions is clearly supported by the data. There is no reason why the initial stages of cave origin cannot be attributed to similar waters.
What is the solution rate of the limestone? During low flow the water is nearly always supersaturated with respect to both calcite and dolomite. However, it is unlikely that there is any net
. deposition of either mineral because of solution during high flow, and because of the erosive power of the streams and the presence of sediment on the floors and walls. However, active solution can take place during high flow.
The saturation index of calcite can be converted to degree of saturation (or saturation ratio), Cf Cs. The relationship is C/Cs = { antilog (SI)} 0·
35• From the resulting values, the limestone solution
rate can be detennined (Palmer, 1991):
Solution rate = 11. 7 k (1 - C/Cs)n cm/year,
where k is approximately 0.008 for typical limestone and n is approximately 2.2.
Therefore, on Figure 16, when the SI of calcite is -0.5, C/Cs = 0.67 and the approximate solution rate is 0. 008 cm/yr (80 microns/yr) -- although that rate of solution lasts only a few days or weeks during a normal year. At SI = -1.0, CICs = 0.45, and the approximate solution rate is 0.025 cm/yr (250 microns/yr). These estimates are probably high, because they are for non-dolomitic limestone, and they do not take into consideration shielding of the bedrock walls and floors by sediment. Still, the importance of low SI values is very clear. It is important to realize that this solution rate can be diminished by sediment armoring of the walls and floor. However, erosion by stream-home sand during high-velocity flow can increase the rate of cave enlargement, although not significantly at the slow velocities observed in Mystery Cave.
Variation of pH with Time and Depth in Cave Pools
We were curious to see whether there was any change in pH with depth in the cave pools. Our pH meter can be read to the nearest 0. 001 pH unit, although this degree of precision is not necessary (or even desirable) for most water-chemistry studies, since the pH is so sensitive to environmental changes that two decimal places is all that can be counted on. For detailed monitoring of fluctuations, however, the more precise instrument is ideal. ·
The results were surprising. Within the uppermost few centimeters in each pool the pH changed rapidly with depth. In pools agitated by drips or waterfalls the pH also fluctuated greatly with time, especially near the surface, but much less so with depth.
Most interesting was the fact that pH decreased with depth in some pools and increased with depth or remained constant in others. The Rock Garden and Turquoise Lake decreased in pH

40 downward; Sugar Lake was nearly constant in pH, with only a slight downward increase. The pH probe was waterproofed and heJd in place by a stiff wire to avoid motion. Measurements were repeated on three different days in Turquoise Lake and two different days in the Rock Garden. Measurements were made in three different places in Sugar Lake, with similar results.
In the Rock Garden (April 22, 1993) at a depth of 2 cm the pH stabilized at 8.307. At a depth of 5 cm it stabilized at 8.122. A large drip from the ceiling caused the pH to drop suddenly by 0.008 pH units, followed by slow recovery over the next few minutes back to 8.122. On an earlier day (April 12, 1993), the pH ranged from 8.222 at 2 cm to 8.045 at 5 cm.
In Turquoise Lake (April 22, 1993) at a depth of 2 cm the pH rose to 7.966 over the first 12 minutes, then dropped to 7.868 over the next 6 minutes, rose to 7.931 in 2 minutes, then dropped in an irregular pattern until the test was terminated at 25 minutes. Waves were visible from the waterfall at the far end of the pool, and turbulent eddies apparently caused the pH to fluctuate with a period of approximately I 0 minutes (much less frequent than the waves, which had a period of less than a second). Soon afteiward, at a depth of 60 cm, following recalibration, the pH rose gradually to 7.890 over the first 28 minutes, dropped suddenly to 7.882, then stabilized at 7.884 for 10 minutes. Apparently an eddy of slightly lower pH had moved into the area of measurement.
Earlier measurements in Turquoise Lake confirmed these findings: On April 12, 1993, the pH was observed to decrease from 7.930 at 2 cm to 7.815 at 15 cm. On April 20, 1993, the pH stabilized at 7.810 at 2 cm and 7.771at70 cm. The water entering the lake had a pH of7.51. Apparently a great deal of C02 is lost from the surface of the water in the lake. On April 21, 1993, over a period of 20 minutes, the pH at 2 cm was observed to rise slowly to 8.020, drop to 7.954, then rise to 7.968, and finally drop to 7.887. At a depth of 30 cm the pH remained rather stable between 7.862 and 7.867. At a depth of 60 cm the pH remained rather stable between 7.883 and 7.886. Note that while the overall pH decreased with depth, there was a slight increase between 30 and 60 cm. The difference is minimal and could have been induced by agitation of the water by insertion of the pH probe.
In Sugar Lake on April 21, 1993, at the western end, the pH stabilized at 7.930 at a depth of 2 cm, 7.967 at 5 cm, and 7.996 at 10 cm. Measurements elsewhere in the pool showed the same trend, but the differences were much smaller due to mixing caused by agitation during probe movement. The pH was monitored over a 23-minute period on April 23, 1993, showing an asymptotic rise to 7. 928 at a·depth of2 cm and 7.945 at 7 cm.
Mystery Pool (in Mystery II) showed decreasing pH with depth, from 8.062 at 2 cm and 8.051 at 15 cm. Repeating the shallow measurement yielded 8.063. The change with depth was distinct but not very substantial. Agitation of the water caused a rapid drop in pH to below'8, followed by a rapid rise to the former value when the water was allowed to stand.
Testing for drift with buffers showed a maximum of +0.02 units drift over 37 minutes. This is significant at the level of precision used in the monitoring, but the measured pH variations with time and depth were much greater. Furthermore, it does not affect the basic observations that pH varies with depth and over short time periods.
Water samples were ·taken at two depths in Turquoise Lake. At the surface, the water had a calculated Pc02 of 0.006 atmospheres and a calcite satur~tion index of +0.77. At a depth of 2.5 feet, the Pcm was 0. 007, with a calcite saturation index of +O. 7 4. The stream feeding Turquoise Lake had a P co2 of 0. 013 and a calcite saturation index of 0. 51. This brief test supported the view that the lake is

41 rapidly degassing, so it is more highly supersaturated at the surface than at depth. A more rigorous approach will be used in the future.
The preliminary interpretation is as follows: The water at the pool surfaces approaches C02 equilibrium with the local cave atmosphere fairly rapidly, whereas the chemistry of the relatively stagnant water below responds much more slowly. A downward decrease in pH could mean one of two things: either the surface has responded to a recent decrease in C02 in the cave atmosphere, or C02 is being generated at depth by biologic activity (oxidation of organic compounds, etc.). A downward increase in pH is most easily explained by a recent decrease in atmospheric C02, but a valid interpretation must await water and air analyses. Interestingly, the downward increase in Sugar Lake was observed on the same day that a downward decrease was observed in Turquoise Lake.
These observations do not invalidate the measurements made during normal water chemistry studies,. where a single pH and water sample are taken. Mixing of the water during this process usually provides an average pool chemistry. The variations in pH that we have measured with time and depth have only a slight effect on the saturation index and overall inteipretations.

(
42 LABORATORY ANALYSIS OF SPELEOTHEMS
Influence of Water Chemistry on Crystal Shapes in Pool Deposits
In general there are three major types of calcite crystals in Mystery Cave: needles, blades, and rhombs (parallelogram-shaped crystals). Examples are shown in Figures 18-20. The rate of C02
degassing in the pools correlates with the shape of the crystals forming there. Some pools in Mystery Cave are lined with needle-shaped crystals and some with rhombs. The needles form in the pools where there is rapid degassing of C02• Blades form below water drips that are degassing, in shrub-like clusters (described in the Interpretive Report as "calcite shrubs"). Rhombs form in standing pools with very low water input. One potential problem is that water chemistry that we measure at any given time may not represent the conditions present when precipitation occurs. The close association between water chemistry and the ccystal shapes of pool deposits suggests that this is not a great problem in Mystery Cave.
Turquoise Lake is fed by a small stream that is high in C02, and degassing in the lake causes the pH to rise near the surface, where the C02 content is lowest. The stream is floored with tiny needles, and, at the inlet side of the lake, calcite pool fingers grow from the wall. Tiny calcite needles coat the calcite crust on the walls of the pool itself The folia in Mystery Cave are found above the level of Turquoise Lake and represent a higher stand of the lake. F olia are found in only a few other caves associated with rapidly degassing C02 or H2S in caves such as Lechuguilla Cave, New Mexico, and are considered by some people to be hydrothermal in origin. These subhorizontal fins consist of layered, fibrous, subparallel crystals building outward like successive awnings as the water level changed. Precipitation at the former water surface has left a litter of calcite rafts, abundant shelfstone, and raft cones all the way to the Bomb Shelter.
Considering the rate of C02 degassing, calcite precipitation in pools like Turquoise Lake must be rapid. It appears that needle-shaped calcite crystals represent rapid precipitation. Needle-like or fibrous crystals can form either -above or below water if precipitation is rapid. Most vadose speleothems formed by degassing or evaporation are characterized_ by a fibrous texture of long, narrow crystals and probably have the same fast growth. For example, needle-shaped calcite crystals have formed on the pipe and catch basin near the' end of Old Mystery Cave at a known rate of about I mm per 30 years. Apparently Turquoise Lake is rapidly degassing most or all of the time, because all its crystals are needle-shaped.
Shrubs consist of bladed crystals that grow in V-shaped twins whose arms are typically oriented at approximately 45 degrees to the main axis of the speleothem (and where they form at a pool surface, at 45 degrees to that surface). Shrubs often alternate either with flowstone, cave ice or botryoidal fibrous clusters (MY135). They consist of layered bundles of radiating needles that have coalesced into blades (Figure 21). Each layer is only about 50 microns (0.05 mm) thick (Figure 22). If the rate of deposition is similar to that in Old Mystery Cave, each layer could represent an annual cycle, and the change from needles to blades could be caused by seasonal or slightly longerterm variations in the rate of C02 input. The needles are called crystallites, which are smaller unit crystals with discrete crystal faces (Kendall and Broughton, 1978). Evidence for the former needleshaped crystal structure is cominonly present as long narrow inclusions of incompletely cemented void space around the former crystals (MY138). KendaJI and Broughton used the inclusions as evidence for the presence of precursor crystallites that coalesced to former the larger fibrous crystals in stalactites. The 45-degree angle corresponds with the orientation of the faces of a unit rhombohedron rather than

Figure 18: Calcite needles in folia above Turquoise Lake (MY30). Enlargement= 6X (polarized light).
43
Figure 19: Bladed calcite crystals coating calcite raft (MY33a). Enlargement= IOOX (polarized light).
Figure 20: Calcite rhombs lining a pore in non-carbonate sediment (MY 152). Enlargement = 200X (polarized light).

44
'~ > ~-_;· -~J.~~:\ t
Figure 21: Bladed calcite crystals contain inclusions Figure 22: Layering within blades in cal-that outline the shapes of former needles (MY138). cite shrubs (MYl 1). Enlargement= 50X Enlargement= 20X (non-polarized light). (polarized light).
Figure 23: Triangular cross sections of bladed crystals (MY I 0). Enlargement ' 20X (polarized light).

45 a scalenohedraJ fonn of calcite (Dickson, 1978). Sometimes a central crystal grows with twinned crystals branching out on either side, forming a single stem with upward-facing, v-shaped crystals superimposed on the central crystal. In cross section, a single bladed crystal is triangular and consists of parallel rows of smaller triangles (Figure 23).
Fibrous calcite in pools that are rapidly degassing commonly contain organic filaments of unknown affinity. The organics are either carried in from outside or thrive on chemical reactions in the cave. Filaments less than a micron (.001 mm) wide meander through shelfstone deposits in pools that also contain calcite shrubs, both in Mystery Cave and in New York caves. Pool fingers cover the wall opposite the dam at Turquoise Lake. Pool fingers in New Mexico caves contain bundles of filaments in their centers. The filaments provided a substrate for calcite precipitation. Chenille spar, which consists of drape-like calcite deposits in pools, appears to be simply a thick, coalesced version of pool fingers.
In contrast, crystals with rhombic terminations form the calcite surface that lines standing pools like Sugar lake, Dragon's Jaw Lake, and the Tar Pit pools (see Figure 20). The chemistry of these pools is quite different from that of Turquoise Lake. In Sugar Lake the pH rises very slightly, if at all, with depth. This little pool contains bladed raft material and raft cones, like Turquoise Lake, but some of the rafts are coated with rhombs. Sugar Lake has no apparent recharge most of the time, but raft cones show that drips once entered it, or do so periodically. The chemistry of pools of this sort remains relatively constant. They are fed by water that has already degassed and precipitated flowstone. In places, thick, bladed flowstone coats sediment, in which the pores are lined by small calcite rhombs. This is an example of how rhombs are favored by a static chemical environment. In most cave pools in which degassing of carbon dioxide is minimal, the blades or rhombic crystal terminations are coated with very thin calcite sheets that diminish in area of coverage, so that the overall crystal appears to be shingled.
Current Hypotheses on Calcite and Aragonite Crystal Growth.
There is a lively debate about what controls the shape of calcite crystals, and why aragonite precipitates in some areas instead of calcite. (This is obviously one of the burning issues of our time.) The following questions have never been satisfactorily answered: why is aragonite the dominant carbonate mineral precipitated in seawater, and what causes the variation in calcite crystal morphology from needle-shaped to rhombic? Experiments by Bischoff and Fyfe (1968) showed that the Mg ion inhibited calcite crystal growth. In an elegant paper expanding on this theme, Folk (1974) proposed that the Mg ion "poisoned" the surfaces of calcite crystals, preventing lateral growth and promoting the growth of needle-shaped calcite crystals and aragonite. The Mg/Ca ratio was therefore thought to be important in controlling the shape of calcite crystals. Taking a different approach, Given and Wilkinson (1985) pointed out that the local degree of supersaturation controls the shapes of calcite crystals and that the Mg/Ca ratio has only an indirect effect. They hypothesized that needleshaped crystals would form where precipitation is driven by rapid degassing of C02 and/or evaporation, leading to high degrees of supersaturation. They showed that aragonite or needle-shaped calcite could grow in any environment irrespective of the Mg/Ca ratio, as long as the supply of CQ3=
ions is high enough. ·
Gonzalez, Carpenter, and Lohmann ( 1992), for the first time, presented actual chemical data from cave water in which different types of calcite crystals were forming .. Like Given and Wilkinson, they found that the calcite crystal shapes are controlled primarily by the degree of supersaturation. At

46 less than 6 times supersaturation, rhombs formed, whereas elongated crystals fom1ed at greater values of supersaturation. At more than 12 times supersaturation, crystal faces became curved. They also noted that water chemistry was not completely responsible for crystal shapes, because needles and rhombic crystals form in water with overlapping chemical variables. They suggested that the rate of water flow was also essential in forming needle-shaped crystals because crystal growth is supposedly faster when the flow is fast. Apparently laying the magnesium theory to rest, they pointed out that needle-shaped calcite or rhombs can occur as either high- or low-Mg calcite. (Although calcite consists of CaC03, it incorporates various amounts of magnesium as an impurity.) X-ray data on speleothem fragments from Mystery Cave also show that the shape of calcite crystals is unrelated to the magnesium content (Figures 24 and 25, and summary of data in Appendix 8). All were lowmagnesium calcite.
Our observations tend to support those of Gonzalez, Carpenter and Lohmann, in that growth rate seems to be the most important control over crystal morphology. However, we doubt that flow rate is significant. Needles and rhombs both form in pools in Mystery Cave, and the factor that controls them is clearly the rate of degassing. Supersaturation is the result of degassing of high-C02
water, which governs the growth rate and crystal structure. Comparing water chemistry in Mystery Cave with other caves in the United States, we found that needles can form in pools with either high or low magnesium content (see Tables 2 and 3, and Figures 26 a-c). The New Mexico cave pools have low levels of total Mg and Ca, with Mg distinctly higher than Ca becasue it is concentrated by evaporation. Water splashing onto fibrous-textured flowstone containing curved crystal terminations in Mammoth Cave, Kentucky, had the highest Ca/Mg ratio, while degassing pools with needles and shrubs were characterized by high Ca/Mg ratios. Static pools coated with shingled Ihombs had the lowest Ca/Mg ratios.
In Mystery Cave, as in other caves, speleothems formed by the initial growth of numerous tiny crystallites that eventually coalesced. As suggested by Jones (1989) and Walkden and Berry (1984), crystal growth begins as either an aggregate of tiny needles oriented perpendicular to the substrate, or as sheets parallel to the substrate, depending on the growth rate. Needles form more rapidly. We did not address the aragonite problem, because to our knowledge aragonite is not precipitating i!i_ ~y of the cave pools. However, we have observed pools lined with aragonite in Carlsbad Cavern that are high in Mg but low in Ca. This was the only aragonite we have ever seen precipitating in cave water. It almost always forms by evaporation in contact with air and usually forms .on dolomite bedrock. This is true in Mystery Cave, where aragonite is found on the Stewartville dolomite. This tends to support Folk's hypothesis that aragonite is favored by the presence of Mg ions.

,,---_,-o·<ij~
-1J
~ 0 ~
~ w :c 1--C\I en w w a: CJ w 0
'-~:
29.9-
29.oJ~-~--~~~~~~~---~~~~-~~-~--~~--~-~-~~---~-~-~--+
29.7-
... C'O c. .... :s
29.&~~~~~~~~~~~~:--~~~~~~-:~~~~-:::-~~~~~-..... ~~~- (/) 0 ~ Q) ~
- 0- c.c:-co Q) Q) Q) ~--0.·~- ... --a>-- (/) 0 u in c: c: c: "' u "' cu E c: (/)-- o-~
.xoc:oo11>£?11> c: -c5c:~oo ..aoo~c: Q) 1i) 1i) .a (/) .a Q) Q) 0 ° 2 C'O ~ e.x ~ ~ 2 ~ 2 .~.x "'~.x o c. c.~.c c. ....
!!! ~ Q) ~
co (/) a. c (/) Q)
g.e a. .a
ca 1i) c: Q)
.x 0
e u Q) .0
29s--r- ~ -----c
ls
(/) (/) (/) Q) Q) Q) -u u u (IJ co QJ
- - Q) .a .0 c:
I/) .x Q) 0
- 0 u .... QJ u Q) Q) c: .0
.x Cl Q)
g .a J§ = -0 2 0 ~ Q) ..c: 0 ..c: .a (/) a. 0
u u e o o .c o .c 0 e ~ o e o o ·c: co (/) 15 ~.a CC ll>C 11> .._.a ._.a .a a. a.u .._
a• 1,,,,,,,,,,,,,,,,,,,,,,,,,,,,,,,1,,,,,,,,,,,, SAMPLES
Figure 24: Maximum peak values (2-theta) for different kinds of calcite speleotherns in Mystery Cave. Higher values of 2-theta indicate greater amounts of magnesium in the calcite structure (see Figure 25).
~ -J

\ \ 31.0 ~~ i
()~\~ ~
() ~ co \ <"o ~~
\ ~ 30.5
<D
~\ \
'I C\I
en w w c: (!)
\ \
w 0
30.0
29.9
29.8
29.7
29.6
29.5
\~ ()I'S-
\\ ('\
I~ I <" i ":>.. I K i
I \ I I \. !
\ I \ ' ~ . . ,
~ LOW-Mg CALCITE ~
\ 60 55 50 45 40 35 30 25 20 15 10 . 5 0
MOL PERC~NT Mg
Figure 25: Molar percentage of magnesium in calcite vs. 2-theta angle of X-ray diffraction peak (from Scholle, 1978, modified from Goldsmith, Graf, and Heard, 1961).
48

49 Table 2: Sununary of typical cave-water chemistry, sorted by total Ca +Mg. Analyses by A.N. and M.V. Palmer, except where otherwise noted. J+A =Roy Jameson and Calvin Alexander, LCMR
Hydrology Project (1993); Oelker =Gregg Oelker, Pasadena, Calif. (1991). Average values are shown where more than one measurement is available for the same site.
Samples LD.No. Ca Mg Total mmol/L mmol/L mmol/L
Overlook, pool #1, Mammoth.Cave KY MCI 0.80 0.41 1.21 Camp Pit, Mammoth Cave KY MCC 0.84 0.45 1.29 Keller Shaft, Mammoth Cave KY MCK 1.36 0.10 1.46 Lake Lebarge, Lechuguilla Cave, NM (Oelker) LLB 0.83 0.88 1.71 Pelucidar drip, Lechuguilla Cave NM LP2 0.64 1.15 1.79 Deep Secrets, mammillary pool, Lechuguilla Cave NM LDS 0.61 1.28 1.89 Lake of Clouds, Carlsbad NM CLC. 0.62 1.36 1.98 Mary's Vineyard, Mammoth Cave KY MCV 0.88 1.14 2.02 Lak~ Louise, Lechuguilla Cave NM LLL 1.00 1.13 2.13 Liberty Bell drip, Lechuguilla Cave NM (Oelker) LBD 0.78 1.35 2.14 Sugarlands chenille pool, Lechuguilla Cave NM LSI 0.57 1.67 2.24 New Mexico Room, aragonite pool, Carlsbad Caverns NM CM6 0.48 1.84 2.32 South pool, Dreamland, McFail's Cave NY MF2 1.39 0.95 2.34 North pool, Dreamland, McFail's Cave NY MF3 1.49 0.87 2.36 New Mexico Room, aragonite pool, Carlsbad Caverns NM CM2 0.45 1.99 2.44 Sulfur Shores, Lechuguilla Cave NM (Oelker) LSS 1.10 1.34 2.44 New Mexico Room, Carlsbad Caverns NM CM3 0.42 2.03 2.44
11
(~ New Mexico Room, chenille pool, Carlsbad Caverns NM CMl 0.42 0.42 2.47 New Mexico Room, aragonite pool, Carlsbad Caverns NM CMS 0.49 2.01 2.50 Sugarlands, mammillary pool, Lechuguilla Cave NM LS2 0.82 1.77 2.59 New Mexico Room below chenille pool, Carlsbad Caverns NM CM4 0.49 2.13 2.62 Tar Pits, Mystery Cave MN (J+ A) MYT 1.17 1.47 2.64 Pelucidar lower pool Lechuguilla Cave NM LP3 1.60 1.20 2.80 Oasis Pool, Lechuguilla Cave NM (Oelker) LOP 0.82 2.12 2.95 Dragon's Jaw Lake, Mystery Cave MN (J+A) MYD 1.34 1.69 3.03 Blue Lake, Mystery Cave MN (J+A) MYB 1.65 1.39 3.04 Rock Garden, Mystery Cave MN (J+A) MYR 1.11 1.94 3.05 Sugar Lake, Mystery Cave MN (J+ A) MYS 1.61 1.49 3.10 Overlook, pool #2, Mammoth Cave KY MC02 0.94 0.31 3.19 Blue Lake drips, Mystery Cave MN (J+A) MYDI 1.74 1.45 3.19 Dreamland drip, McFail's Cave NY MFI 2.48 0.93 3.41 Lily Pad Lake, Mystery Cave MN (J+A) MYP 1.68 1.81 3.49 Frozen Falls pool, Mystery Cave MN (J+A) MYF 2.00 1.79 3.78 Frozen Falls drip, Mystery Cave MN MYFD 2.52 2.24 4.48. Frozen Falls drip, Mystery Cave MN (J+ A) MYD5 2.39 2.16 4.55 Broken stal drip MCI-2, Mystery Cave MN (J+A) MYD4 2.54 2.25 4.79 Rte. to Lake of Clouds, Carlsbad Caverns NM cc l.95 2.93 4.88 Turquoise Lake, Mystery cave MN (J+A) MYT 2.62 2.30 4.93 Ceiling stal, MCI-4, Mystery Cave MN (J+A) MYD3 2.68 2.35 5.03 Bedrock drips with syringe, Mystery Cave MN (J+A) MYD2 4.22 2.33 6.55 Granddad. Mammoth Cave KY MCD 4.42 9.09 13.51 Dilithium Pool, Lcchuguilla Cave NM (Oclker) LDP 14.15 2.00 16.15
( Bitter Water Pool, Lechuguilla Cave NM (Oelkcr) LBT 1.14 240.62 241.76
~'\,

Table 3: Description of carbonate crystals forming in analyzed water. See Table 2 for location and water chemistry.
Samples
MCI MCC MCK LLB LP2 LOS CLC MCV LLL LBD LSI CM6 MF2 MF3 LSS CM3 CMI LS2 CM4 MYT LP3 LOP MYD MYB MYR MYS MC02 MYDl MYP MYF MYFD MYD4 cc MYT MCD LOP LBT
Description
Fibrous, dogtooth spar + shrubs Twinned shrubs Fibrous, dogtooth crystals Curved fibrous Dogtooth, stacked plates Nonwarped fibrous Fibrous Warped, stacked rhombs Aragonite + hydromagnesite Rafts, cones, mammillary pool, dogtooth, fibrous Stacked rhombs Chenille spar, rafts, warped, stacked rhombs Needles with tiny rhombs on tips Shrubs Aragonite, huntite fell into pool also Non-warped blades on ice, dogtooth spar No aragonite, some chenille, stacked rhombs Aragonite, hydromagnesite nearby Warped, stacked rhombs No crystals in pool Stacked rhombs Fibrous, warped, some aragonite Some rafts, non-warped stacked rhombs Fibrous Blades Blades to rhombs Warped rhombs Dogtooth to needles Needles to blades Stacked blades to needles Shrubs with pyramidal crystals Twinned stalks ·stalks with stacked blades Needles Warped rhombs Gypsum blades Hydromagnesite balls, non-warped and non-stacked pyramids
50

_J -en ~ 0 E ~
MCKMC2 MC1 CM1 MbC MF3 UB MF1 MF2 Lll MCv t.P2 l..P3 Lbs l.88 LBo d..CM't8MYD1MYT MY8 LS1 MYJ l.82 MYF MYPcMe MYRCM2 LbP cMIScM:I LOP a.14MY'OIMYFIMY04MYTM'l'O:MY0.1 Cc Mal LBT
..!!? Ill ~ .!! Ill 't3 ~ 2l u c
~ = u
Location ID Mg:sorteci -t- ca H- =-=-rot8ica+M9-J
Ill Ill
i5 a: c
Figure 26A: Water analyses from a variety of caves including Mystery Cave, sorted by magnesium content. See Tables 2 and 3 for sample locations and description of speleothems.
v.

e.-1-~~~~~~~~~~~~~~~~~~~~~~~~~~~~~~~~~~~~~~~~~~~~~~~~~~~~~--1f--+--H
...J Cl> -- 4.-+-~~~~~~~~~~~~~~~~- ~~~~~~~~~~~-+~~~~~~~
0 ~ 0 E ~
mainly New Mexico caves
_J
Cl> II)
"(5 :::J
e-c=====:==:: .=
Location r- Total Ca+Mg D Ca - =-- Mg- --- ---]
Figure 26B: Cave water analyses, sorted by total Ca + Mg content. See Tables 2 and 3 for sample locations and description of speleothems. '.JI
N

_J -"' ~ 0 E ~ Evaporation increases
pool spar
Location _;
J .( 0 c8/M9:sortecf--*- ca * ti9.~ -- --- -]
t f l
Figure 26C: ·Cave water analyses, sorted by Ca/Mg ratio. See Tables 2 and 3 for sample locations and description of speleothems.
Vl w
54 A Few Observations about Speleothems in Mystery Cave
Stalactites and stalagmites
The stalactites in Mystery Cave have a pattern typical of most stalactites in having a primary thin (soda straw) core surrounded by layers of radial fibrous crystals. A stalactite fragment from near Dragon's Jaw Lake is a typical example. The initial drips that fonned the stalactite deposited a thin sheet of calcite plates. By making a number of microscopic offsets, the plates of the soda straw have grown downward and outward and become the radial fibrous crystals perpendicular to the soda-straw walls. This suggests an outside attraction such as evaporation, with wicking of intercrystalline water from the inside. In other stalactites the inner soda straw plates do not bend outward. Instead, layers of fibrous crystals grow perpendicularly from the outside of the initial soda straw, but their outer edges are truncated at various angles (Figure 27). The surface may have been dissolved periodically by floodwater or by condensation of water from air. Some stalactites have silt and clay elastic sediment between the outer layers, showing that water from outside the stalactite tube coated it with sediment, possibly during flood events.
The central tube of a stalactite fragment from the Tar Pits is almost completely blocked by monocrystalline calcite, except for a tiny central hole (Figure 28). This may have been caused by a decrease in the drip rate. In a closed system, with only a small amount of recharge, the central tube can act like a tiny pool environment and acquire crystals similar (but on a much smaller scale) to pool deposits. Such monocrystalline cores are common in many of the older stalactites in the cave and may represent a climate change from wet interglacial to dryer glacial conditions.
The Door to Door route contains many areas of naturally broken speleothems. For example, . MY 214 from the Culverts area probably represents a typical stalagmite. Dripping water fonned thin layers of fibrous spar perpendicular to the floor. The layering represents periods of growth with periodic interruptions, as shown by the fact that certain layers cover the truncated surfaces of the layer beneath, as in the Dragon's Jaw Lake stalactite. Because the layers of spar in stalagmites form in thin films of water, the crystals have the same morphology as those in flowstone. Sample MY2 l 4 contains layers that are very porous. The pores were once water filled and behaved as tiny pockets that were roofed over by later calcite. ·
Iron-rich speleothems
Shaly limestone from bed DSI 1 (MY76) in the western part of Fifth Avenue contains patches of hematite (iron oxide) and gypsum (Figure 29). Both the hematite and the gypsum were derived from the oxidation of former pyrite. Most of the gypsum forms concentric balls of crystals surrounded by a rim of hematite pushed outward by the gypsum.
Another sample is a small iron-rich stalactite that peeled off flush with the ceiling. Its upper end is flared so that its broken top is flat where it once was attached to the ceiling. The stalactite appears to have originated as a thin film of calcite on the ceiling, and as water eventually consolidated into a drip, it formed a soda straw with walls surrounding a narrow central canal. Layers of radial fibrous crystals formed around the central soda-straw core. The calcite layers are separated by layers of iron. oxide deposited by the water from the bedding plane above. This is apparently a miniature version of the iron-oxide-rich stalactites in the Formation Room.

Figure 2 7: Cross section of stalactite fragment MY130, showing truncated layers (arrow). Enlargement= 60X (non-polarized light).
Figure 28: Cross section of stalactite fragment in which the central tube is nearly filled with calcite (MY130). Enlargement= 8X (polarized light).
Figure 29: Gypsum clusters (white) surrounded by hematite (black) from the weathering of pyrite (MY78). Enlargement 3X (polarized).

56
Levels of Static Ponding
There are weIJ-defined levels of deposition that represent old water levels -- mainly shelfstone and rimstone. These were carefully measured during the leveling project. It is quite clear from their disparate elevations that almost none of them correlate with each other! Ponding is controlled entirely by local conditions, such as breakdown and sediment fill. Former water levels, as shown by shelfstone, can be traced for short distances with very little if any change in elevation. However, from one passage to another there is no correlation in elevation. They do not represent widespread ponding levels but are local pools fed by infiltrating water from the surface, as at Blue Lake, Dragon's Jaw Lake, and Turquoise Lake. Many are still actively forming, although some have been covered by later sediment, as in the Bomb Shelter area. In Mystery I much shelfstone was removed from the route between Turquoise Lake and the Bomb Shelter to help open the area to visitors during the early days of commercialization. This broken material was dumped into the low area below Frozen Falls to build up the trail in that area. This dump site was re-excavated in the early 1990s, and the fragments of shelfstone took yet another trip, this time to a dump pile by the driveway. Some of the better-looking pieces were moved to the Cathedral Room or to the old outhouse across the river. We salvaged some of the material from the dump pile and outhouse for analysis.

57 VIDRA TIOJ\·. MEASUREMENTS
The Bison seismometer was used in the Garden of Gods and nearby passages to determine the effect of surface-induced vibrations on the cave. This study was intended to shed light on the following: (1) possible damage to the cave as the result of future blasting in Grabau Quarry and movement of heavy trucks on the north-south road that passes over the cave near Garden of the Gods; (2) prolonged creaking or groaning noises in Mystery II, suggesting the movement of rocks; (3) vibrations felt in the cave when a bulldozer was operating near the Mystery II entrance.
Vibration energy from a shock source diminishes greatly with distance -- roughly with the square of the distance. Therefore a disturbance that produces a certain vibration at I 0 feet will produce only about 25% as much vibration at 20 ft. Local disturbances in the cave, such as footsteps and drips, can produce large vibration amplitudes over short distances, but their overall energy is tiny compared to shocks that disperse energy throughout large areas, such as quarry blasts.
The seismometer was first tested with normal footsteps near the geophone, which was planted in the gravel pavement of the trail near Garden of the Gods. At full gain, mean vibration level from normal sneakered footsteps at 10-ft distance was used as a personal standard (amplitude= 1.0 units). Background vibration in the dry parts of the route was undetectable.
The geophone was then planted in a crack in flowstone in contact with the bedrock wall of Garden of the Gods. The background vibration was 0.07 units because of much dripping water. There were occasional 5-10 sec episodes of intensified low-frequency vibration of 0 .1 - 0 .17 units, possibly because of disturbance of tree roots by gusts of wind, which were intensifying at the time. A moderately loaded Ford Econoline van was then repeatedly driven over the driveway near the entrance gate to the Mystery Cave property, closest to the Garden of the Gods. There was no measurable increase in vibration. The van was then repeatedly driven over a 6"-diameter log at the same location. During this time, short bursts of vibration up to 0 .1 unit were observed in the cave, barely exceeding the background level. Finally, a I "-thick aluminum plate was repeatedly struck with a sledge hammer at the same surface site. This produced short vibration bursts of 0.3 - 0.5 units. The hammering therefore produced vibration intensities about 3 to 5 times greater than that of the truck driven over the log. Neither was detectable without the seismometer.
The geophone was then moved to the sediment on the floor of Garden of the Gods. Vibration increased considerably because of the many nearby drips of water from the walls and ceiling. The greatest amplitude was caused by a drip from a height of 10 ft. into a slightly concave pocket in the sediment floor. At a distance of one inch, it drove the meter right off the scale -- at least twice the amplitude of the standard footfall. However, because of the close proximity to the geophone, the drip represented much less energy than the footfall ..
These vibration measurements shed a little light on the questions posed above. However, much more sophisticated analyses and vibration sources are needed for a full evaluation. Apparently normal traffic on the surface has minimal effect on the cave. Intense shocks, such as quarry blasts, would have a much greater effect. A drop of water or a footfall can send the meter off the scale at short distances, but the energy level is considerably smaller than vibrations generated by larger remote sources. Measurements within the cave are useful only in providing interesting comparisons. Widespread low-frequency, high-energy vibration is potentially the most damaging. Unfortunately it is difficult to estimate how much vibration energy the cave can tolerate before rockfall occurs. The

58 structural attributes of the cave are very complex compared to those of artificial structures.
A few observations may help to clarify the situation. In general, the cave passages are extremely stable. They have not been blasted out of the native rock, but enlarged by solution, with natural rockfall stabilizing otherwise unstable spots. The high, narrow fissure passages are most stable, but some of the wide flat-ceilinged passages in the Dubuque are rather unstable, and occasional rockfall in such areas is likely.
Sediment fill in the cave vibrates discontinuously with the bedrock. The amplitude of vibrations increases when shock waves encounter the sediment, and the overall potential for damage is greater for anything situated on the sediment (walls, stalagmites, etc.). In general the bedrock moves more or less as a unit, so the bedrock structure of the cave is relatively stable. Stalactites and stalagmites osc'illate at different frequencies and can snap off if the vibration is exceptionally great. This is unlikely. The many naturally broken speleothems in the cave probably met their fate during freeze-thaw cycles during the last glaciation, rather than as the result of an earthquake. Earthquakes, which represent the largest probable source of energy in the area, rarely have any significant effect on caves. Likewise, surface sources, although potentially closer, would have little effect; most of their energy is dissipated as surface waves that die out rapidly with depth below the surface.
The source of the creaking and groaning in the cave is enigmatic, and it is impossible to identify them without first-hand experience. However, similar sounds have been heard in other caves. Groaning Cave in Colorado was named for similar sounds whose source could not be identified. We have heard short-duration sounds of this sort in the vicinity of breakdown piles, particularly those cemented with a matrix. of sediment. Settling and shifting of blocks in such areas is common, especially during relatively wet periods.
In addition, water flowing into the west end of Fourth Avenue beyond the Yellow Flow during periods of high discharge produces a reverberating pounding sound reminiscent of the sounds reported by the guides. It is likely that many of the reported noises can be attributed to water movement, especially since ther~ is such a large fluctuation of water levels in the cave.
The source of natural disturbances in the cave is an interesting area for further study -although not necessarily a fruitful one. A triple array of continuously recording seismometers could be set up to identify the location of vibration sources, the nature of the vibrations, and possibly the direction of displacement that causes the vibrations, much like earthquake seismology.

59 CONCLUSIONS
Several lines of research have proved useful in the interpretation of Mystery Cave. Although this is only a preliminary report, to be updated and expanded in 1994, results to date include the following: (1) A geologic profile was made in the main passages of the cave. This apparently represents the most detailed survey of its kind in any cave. · (2) Bench marks were placed in many locations in the cave and on the surface and were tied to the 1989 DNR survey bench marks. Discrepancy between our underground survey and the DNR surface survey was within 5 cm. (3) Analysis of bedrock samples has provided infonnation about the environment of deposition of the rocks, explains the texture of the rocks as they appear in the cave, and gives new criteria (mainly dolomite content) for subdividing the Dubuque Fonnation into members. (4) Analysis of speleothems and water chemistry relate the crystal structure of the speleothems to pool chemistry. This information will help intezpret past conditions in caves that.are no longer active. (5) Seismic profiles show that the bedrock floor of the valley of the South Branch of Root River lies 20-27 feet below the present valley floor and is more or less at grade with the passages in Mystery Cave. The silt in the cave appears to be the same material (apparently mostly loess) that fills the valley. (6) The origin of the cave seems to have been intimately controlled by the entrenchment history of the South Branch and probably 500,000 - 1,000,000 years old. (7) Structural mapping shows that the northwest-southeast fissure passages in the northeastern part of Mystery Cave appear to be controlled by a shatp steepening of dip. (8) Nonnal traffic over the cave, including truck traffic, has little vibrational effect on the cave.
Mystery Cave proves to be a significant natural laboratory for scientific study. Few caves in the United States contain as much information about glacial history, structural control of passages, crystal growth, and water ·flow. Minnesota is fortunate to have a cave of this calibre.
60 REFERENCES
Bischoff, J.L., and Fyfe, W.S., 1968, Catalysis, inhibition, and the calcite-aragonite problem: American Journal of Science, v. 266, p. 65-79.
BJatt, H., Middleton, G., and Murray, R., 1980, Origin of sedimentary rocks (2nd ed.): Englewood Cliffs, NJ, Prentice-Hall, fuc., 782 p.
Compton, J.S., 1988, Sediment composition and precipitation of dolomite and pyrite in the Neogene Monterey and Sisquoc F onnations, Santa Maria Basin area, California, in Sedimentology and geochemistry of dolostones, Shukla, V., and Baker, P.A. (eds.): Society of Economic Petrology and Mineralogy Special Publication 43, p. 53-64. ·
Curl, R.L., 1974, Deducing flow velocity in cave conduits from scallops: National Speleological Society Bulletin, v. 36, p. 1-5.
Delgado, D.J., 1983, Deposition and diagenesis of the Galena Group in the Upper Mississippi Valley in Ordovician Galena Group of the Upper Mississippi Valley - deposition, diagenesis, and paleoecology, Delgado, D.J. (ed.): Guidebook for the 13th Annual Field Conference, Great Lakes Section, SEPM, p. Al-Al7.
Dickson, J.A.D., 1978, Length-slow and length-fast calcite: a tale of two elongations: Geology, v. 6, p. 560-561.
----, 1993, Crystal growth diagrams as an aid to interpreting the fabrics of calcite aggregates: Journal of Sedimentary Petrology, v. 63, p. 1-17.
Easton, W.H., 1960, fuvertebrate paleontology: New York, Haiper and Row, 701 p.
Folk, R.L, 1974, The natural history of crystalline calcium carbonate: effect of magnesium content and salinity: Journal of Sedimentary Petrology, v. 44, p. 40-53.
Friedman, G.M., 1980, Dolomite is an evaporite mineral: evidence from the rock record and from seamarginal ponds of the Red Sea, in Fossil algae, recent results and developments, Flugel, Erik (ed.): Springer-Verlag, N.Y., p. 66-73.
Given, R.K., and Wilkinson, B.H., 1985, Kinetic control of morphology, composition, and mineralogy ofabiotic sedimentary carbonates: Journal of Sedimentary Petrology, v. 55, p. 109-119.
Gonzalez, L.A., Carpenter, S.J., and Lohmann, K.C., 1992, fuorganic calcite morphology: roles of fluid chemistry and fluid flow: Journal of Sedimentary Petrology, v. 62, p. 382-399.
Grow, S.R., 1986, Water quality in the Forestville Creek karst basin of southeastern Minnesota: M.S. thesis, University of Minnesota, Minneapolis, MN, 229 p.

61 Hallberg, G.R., Witzke, B.J., Bettis, E.A., and Ludvigson, G.A., 1985, Observations on the evolution
and age of the bedrock surface in eastern Iowa in Pleistocene geology and evolution of the Upper Mississippi Valley, Lively, R.S. (ed.): Abstracts and Field Trip Guide, Minnesota Geological Survey, St. Paul MN, p. 15-19.
Hardie, L.A., 1987, Perspectives dolomitization: a critical view of some current views: Journal of Sedimentary Geology, v. 57, p. 166-183.
Harmon, R.S., Ford, D.C., and Schwarcz, H.P., 1977, Interglacial chronology of the rocky and Mackenzie Mountains based on 230Th/234U dating of calcite speleothems: Canadian Journal of Earth Science, v. 14, p. 2543-2552.
Hennig, G.J., Grun, R., and Brunnacher, K., 1983, Speleothems, travertines and paleoclimates: Quaternary Research, v. 29, p. 1-29.
Hill, C.A., and Forti, P., 1986, Cave minerals of the world: Huntsville, Ala., National Speleological Society, 238 p.
Hjulstrom, F., 1935, Studies of the morphological activity of rivers as illustrated by the River Fyris: Univ. ofUppsala, Geological Institute Bulletin 25, p. 221-557.
Hobbs, H.C., 1985, Quaternary history of southeastern Minnesota, in Pleistocene geology and evolution of the Upper Mississippi Valley, Lively, R.S. (ed.): Abstracts and Field Trip Guide, Minnesota Geological Survey, St. Paul MN, p. 11-14.
Jones, B., 1989, Syntax.ial overgrowths on dolomite crystals in the Bluff Formation, Grand Cayman, British West Indies: Journal of Sedimentary Petrology, v. ?9, p. 839-847.
Kendall, A.C., and Broughton, P.L., 1978, Origin of fabrics in speleothems composed of colwnnar calcite crystals: Journal of Sedimentary Petrology, v. 48, p. 519-538.
Leverson, C.O., and Gerk, A.J., 1983, Field recognition of stratigraphic position within the Galena Group of northeast Iowa (limestone facies), in Ordovician Galena Group of the Upper Mississippi Valley, deposition, diagenesis and paleoecology, Delgado, D.J. (ed.): Guidebook for the 13th Annual Field Conference, Great Lakes Section, SEPM, p. Cl-Cll.
Lively, R.S., and Alexander, E.C., 1985, Karst and the Pleistocene history of the Upper Mississippi River Valley in Pleistocene geology and evolution of the Upper Mississippi Valfey, Lively, R.S. (ed.): Abstracts and Field Trip Guide, Minnesota Geological Survey, St. Paul MN, p. 31-32.
Mason, J.A., 1992, Loess distribution and soil landscape evolution, southeastern Minnesota: M.S. thesis, University of Minnesota, St. Paul, MN, 407 p.
Milske, J .A., 1982, Stratigraphy and petrology of elastic sediments in Mystery Cave, Fillmore County, Minnesota: M.S. thesis, University of Minnesota, St. Paul, MN, 111 p.

62 Milske, J.A., Alexander, E.C., and Lively, R.S., 1983, Clastic sediments in Mystery Cave,
southeastern Minnesota: National Speleological Society Bulletin, v. 45, p. 55-75.
Mullins, H.T., Dix, G.R., Gardulski, A.F., and Land, L.S., 1988, Neogene deep-water dolomite from the Florida-Bahama platfonn in Sedimentology and geochemistry of dolostones, Shukla, V., and Baker, P.A. (eds.): SEPM Special Publication 43, p. 235-243.
Oelker, G.L., 1991, The Lechuguilla Cave water study: unpublished report.
Palmer, A.N., 1975, The origin of maze caves: National Speleological Society Bulletin, v. 37, p. 36-56.
----, 1981, A geological guide to Mammoth Cave National Park: Teaneck, N.J., Zephyrus Press, 210 p.
----, 1991, Origin and morphology of limestone caves: Geological Society of America Bulletin; v. 103, p. 1-21.
·Palmer, M.V., 1976, Ground-water flow patterns in limestone solution channels: MA thesis, State University ofNew York, College at Oneonta, 150 p.
Phillips,. W.R., and Griffen, D.T., 1981, Optical mineralogy, the nonopaque minerals: San Francisco, W.H. Freeman and Co., 677 p.
Scholle, P.A., 1978, Carbonate rock constituents, textures, cements, and porosities: American Association of Petroleum Geologists Memoir 27, 241 p.
Seyfert, C.K., and Sirlcin, L.A., 1979, Earth history and plate tectonics: New York, Harper and Row, 600p.
Sloan, 1985, Pleistocene fluvial geomorphology of southeastern Minnesota, in Pleistocene geology and evolution of the Upper Mississippi Valley, Lively, R.S. (ed.): Abstracts and Field Trip Guide, Minnesota Geological Survey, St. Paul MN, p. 27-30.
----, (ed.), 1987, Middle and Late Ordovician lithostratigraphy and biostratigraphy of the Upper Mississippi Valley: Minnesota Geological Survey, Report of Investigations 35, 232 p.
----, 1987, Tectonics, biostratigraphy and lithostratigraphy of the Middle and Late Ordovician of the Upper Mississippi Valley in Middle and Late Ordovician lithostratigraphy and biostratigraphy of the Upper Mississippi Valley: Minnesota Geological Survey Report of Investigations 35, p. 7-20.
Sloan, R.L., and Webers, G.F., 1987, Stratigraphic ranges of Middle and Late Ordovician gastropoda and monoplacophora of .Minnesota, in Middle and Late Ordovician lithostratigraphy and biostratigraphy of the upper Mississippi Valley, Sloan, R.E. (ed.): Minnesota Geological Survey Report of Investigations 35, p. 183.

63 Sloss, L.L., 1963, Sequences in the cratonic interior of North America: Geological Society of America
Bulletin, v. 74, p. 93-114.
Southgate, P.N., 1986, Cambrian phoscrete profiles, coated grains, and microbial processes in phosphogenesis: Georgina Basin, Australia, Journal of Sedimentary Petrology, v. 56, p. 429-441.
Walkden, G.M., and Berry, J.R., 1984, Natural calcite in cathodoluminescence: crystal growth during diagenesis: Nature, v. 308, p. 525-527.
Witzke, BJ., 1983, Ordovician Galena Group in Iowa subsurface in Ordovician Galena Group of the Upper Mississippi Valley - Deposition, diagenesis, and paleoecology, Delgado, D.J. (ed.): Guidebook for the 13th Annual Field Conference, Great Lakes Section SEPM, p. Dl-D26.
Wright, H.E., 1985, History of the Mississippi river in Minnesota below St. Paul in Pleistocene geology and evolution of the Upper Mississippi Valley, Lively, R.S. (ed.): Abstracts and Field Trip Guide, Minnesota Geological Survey, St. Paul MN, p. 1-2.

/ (
( <.

64 APPENDIX 1 -- Bench Marks in Mystery Cave
The following semi-permanent points serve as bench marks for elevations in Mystery Cave. Their locations are shown on the accompanying map and are described below. Some are located on features that may change with time, such as handrails; these are generally accompanied by a nearby permanent station such as a chiseled + in the wall. Bench marks are arranged in order as they are encountered in traveling from Mystery I to Mystery II.
Bench Mark Altitude (ft) Feature
Dl 1230.37 ft. nail in basswood tree
D861 1228.36 + on rock wall
D873 1244.41 + on cliff face
0863 1211.41 + on wall·
D868 1209.26 top· of basin
D879 1254.95 + on cliff face
Location
South of Mystery I ticket office, on east side of trees, 1 ft above ground. Walnut Cave entrance, + chiseled in rock face 2-3 ft south of entrance:
N
t
Chiseled + in bedrock wall 5 ft north of north end of Old Mystery Cave entrance, one foot higher than the top of the entrance arch, and in same bed that, . forms the top of the entrance arch. Chiseled + in northwest wall of Old Mystery Cave, 4.3 ft above floor in middle of bed DL3, 0.38 ft above old shelfstone top. Topmost point on south corner of artificial catch basin below waterfall near end of Old Mystery Cave:
Chiseled + on smooth recessed bed on west-facing section of cliff, one foot below geode in overlying bed, and located between geode and entrance; 3 ft south of entrance arch, on right wall (facing entrance).

D456 1228.92 bottom hinge on door
D460 1225.76 + in concrete
D2 1218.56 top of stalagmite
D698 1216.26 + on wall
D328 1210.46 top of stalagmite
D701 1213.28 + in artificial wall
D335 1209.54 top of railing
D728 1208.97 + on wall
65
Top surf ace of lower hinge on floodproof door at Mystery I entrance:
1" chiseled + in concrete wall to south of inner door of Mystery I Small stalagm;i. te on south side of main passage in Mystery I , across from opening to Needle's Eye passage, now below level of trail. In main passage of Mystery I, 1 inch below top of bed DL9, under ledge, 3 ft above trail on northwest side of opening to Needle's Eye passage. At Needle's Eye, top of small stalagmite on southeast wall of entrance of fissure that drops to stream:
00; N . ,.._ A --= WAl..L
M1P· -STOii( .;:;:=--
Chiseled + in bed DL6, on south side of concrete ramp in main passage of Mystery I leading to Formation Room passage, 1.5 ft above ramp, 1 ft to west of (and 4" below) phone box. In passage to Formation Room: top surface of northeast end of southeast handrail on bridge across fissure, next to bedrock wall:
Chiseled + on northwest wall of passage to Formation Room, 3 ft above floor, in bed DL1, at northeast end of grate over fissure in floor.

0348 1222.96
D3 1218.54
D704 1212.22
8360 1226.07
D4 1216.93
D707 1218.79
D37 1220.87
66
lower tip of stalactite Lower tip of broken stalactite with iron-oxide core -- easternmost and largest of deflected stalactites at north end of Formation Room, 6.2 ft above sediment floor:
top of railing
+ on wall
radio location
top of railing
+ on artificial wall
top of stalagmite
Top of northwest elbow of handrail at west end of bridge by Frozen Falls:
Chiseled + at entrance to passage to Cathedral Room, on west wall, 2 ft above trail at bottom of steps, in bed DL5. Nail with flagging in floor at top of stairs in Cathedral Room, marking radio transmitter station. Top of southeast elbow of handrail at east end of bridge by Frozen Falls:
Chiseled + in artificial rock face 1.5 ft above trail on south side of main passage of Mystery I, opposite western end of Rock Garden, about 2 ft west of western end of railing, 1. 8 ft below top of flowstone cap over sediment. Top of tiny stalagmite in Rock Gar~ den, immediately east of small dripstone co.lumn near north wall of.passage:
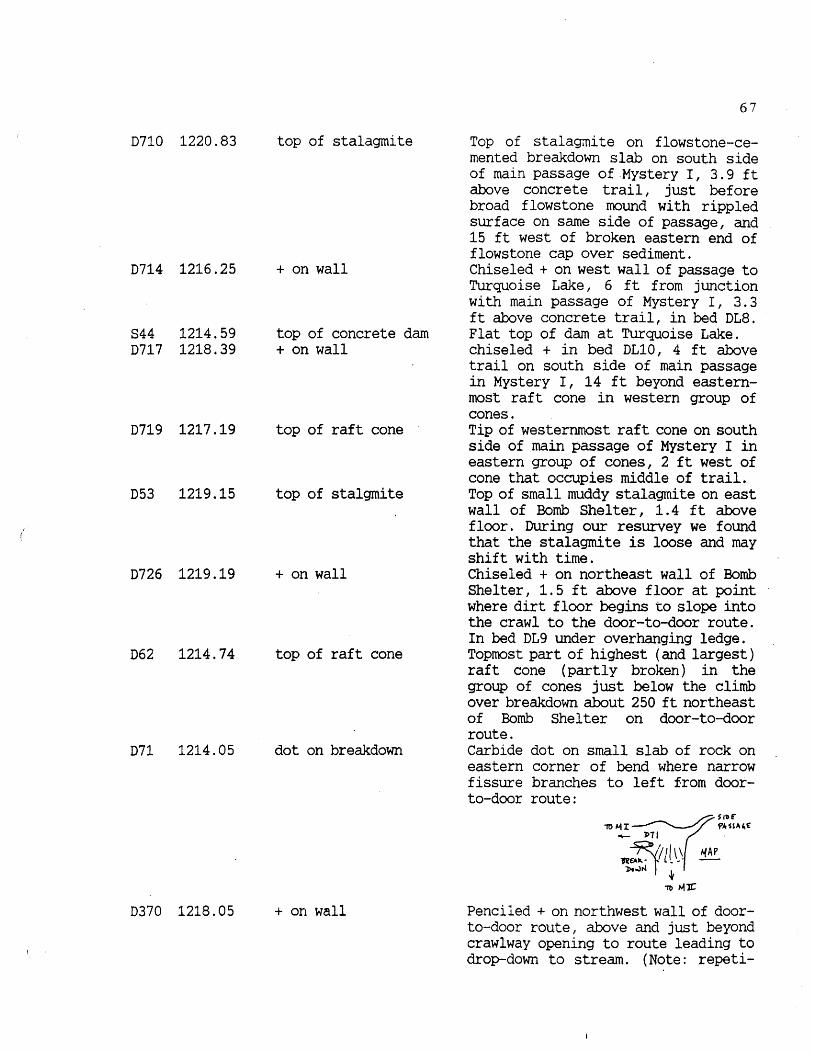
(
0710 1220.83
0714 1216.25
S44 1214.59 0717 1218.39
0719 1217.19
053 1219.15
0726 1219.19
062 1214.74
071 1214.05
D370 1218.05
top of stalagmite
+ on wall
top of concrete dam + on wall
top of raft cone
top of stalgmite
+ on wall
top of raft cone
dot on breakdown
+ on wall
67
Top of stalagmite on flows tone-cemented breakdown slab on south side of main passage of Mystery I, 3.9 ft above concrete trail, just before broad flowstone mound with rippled surface on same side of passage, and 15 ft west of broken eastern end of flowstone cap over sediment. Chiseled + on west wall of passage to Turquoise Lake, 6 ft from junction with main passage of Mystery I, 3.3 ft above concrete trail, in bed OL8. Flat top of darn at Turquoise Lake. chiseled + in bed DL10, 4 ft above trail on south side of main passage in Mystery I, 14 ft beyond easternmost raft cone in western group of cones. Tip of westernmost raft cone on south side of main passage of Mystery I in eastern group of cones, 2 ft west of cone that occupies middle of trail. Top of small muddy stalagmite on east wall of Bomb Shelter, 1. 4 ft above floor. During our resurvey we found that the stalagmite is loose and may shift with time. Chiseled + on northeast wall of Bomb Shelter, 1.5 ft above floor at point where dirt floor begins to slope into the crawl to the door-to-door route. In bed DL9 under overhanging ledge. Topmost part of highest (and largest) raft cone (partly broken) in the group of cones just below the climb over breakdown about 250 ft northeast of Bomb Shelter on door-to-door route. Carbide dot on small slab of rock on eastern corner of bend where narrow fissure branches to left from dootto-door route:
Penciled + on northwest wall of doorto-door route, above and just beyond crawlway opening to route leading to drop-down to stream. (Note: repeti-
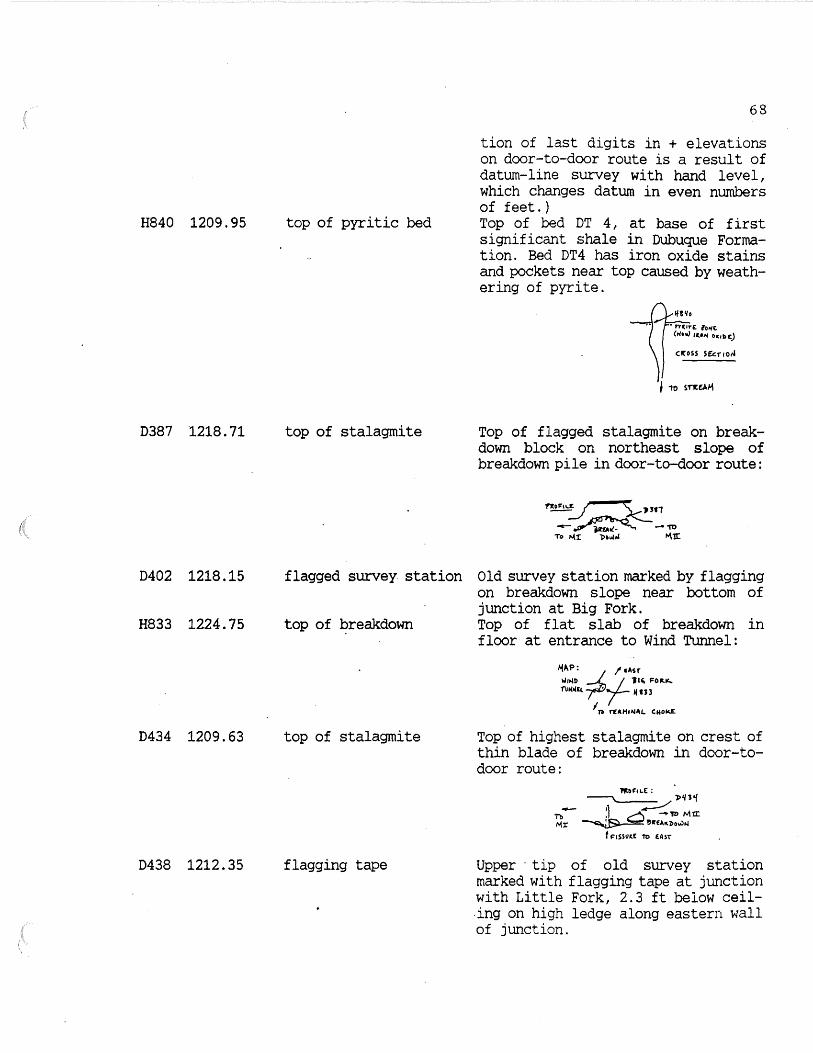
H840 1209.95 top of pyritic bed
D387 1218.71 top of stalagmite
D402 1218.15 flagged survey station
H833 1224.75 top of I?reakdown
D434 1209.63 top of stalagmite
D438 1212.35 flagging tape
68
tion of last digits in + elevations on door-to-door route is a result of datwn-line survey with hand level, which changes datum in even numbers of feet.) Top of bed DT 4, at base of first significant shale in Dubuque Formation. Bed DT4 has iron oxide stains and pockets near top caused by weathering of pyrite.
Top of flagged stalagmite on breakdown block on northeast slope of breakdown pile in door-to-door route:
Old survey station marked by flagging on breakdown slope near bottom of junction at Big Fork. Top of flat slab of breakdown in floor· at entrance to Wind Tunnel:
t.{~P: ,/ dSf Wit-II> --'-f-ll'i FOlt.I(.. fVIWEl ~ If IJ 3
I TD r£.-H1~"L. C:MOI<.£
Top of highest stalagmite on crest of thin blade of breakdown in door-todoor route:
Upper ·tip of old survey station marked with flagging tape at junction with Little Fork, 2.3 ft below ceil-ing on high ledge along eastern wall of junction.

0581 1213.23 top of stalagmite
D598 1216.05 pencil line on wall
D672 1215.85 + on wall
0676 1213.73 top of stalagmite
0634 1216.57 + on wall
0622 1213.46 top of stalagmite
0619 1213.02 top of stalagmite
0612 1208.51 top of stalagmite
69
Top 0£ small stalagmite at level of BP1 beneath white soda straws in door-to-door route:
t •rz.
'"' ~oss surrar4
Horizontal pencil line on northeast wall at junction with Incline, 3 ft below ceiling:
104'Lt>t(
_J lcl>S'fl
10+-~ "'·~:.:-:~! ! MI
Penciled + on ledge immediately below "CAMP" sign in Sand Camp, 2 ft below ceiling. Top of 9" stalagmite at edge of f issure in floor, 14 ft northeast of iron oxide drapery northeast of Sand camp. Penciled + on southeast wall at SW junction With cutoff I 1. 5 ft belOW ceiling and 4. 8 ft above edge of floor fissure, in fossil-rich limestone. Top of larger of two stalagmites on west side of passage northeast of cutoff, southwest of Boof er Pool. They are loose, apparently having been fractured by natural weathering, but are still in place. Top of stalagmite in southern corner of bend next to most impressive array of stalactites and stalagmites, 6~5 ft below ceiling:
~L.oot. T~ENC~
Top of stalagmite in fissure indentation in wall of floor slot at drop to Flim Flam Creek; it is the lower of two 2" stalagmites 1 ft below the

D72 1211.57
D787 1211.41
D77 1213.76
D783 1211.41
top of stalagmite
top of stalagmite
70
ledge overlooking the slot, and 2.5 ft northeast. of slot that drops to stream:
Top of stalagmite on northwest edge of fissure in floor, across from dripstone column, about 20 ft southwest of Bar:
Top of highest stalagmite in cluster on northwest side of passage 11 ft northeast of Bar: There is a little nubbin at the top where a stalactitic column once touched it but has been broken away:
bottom tip of popcorn Bottom tip of popcorn in a small cluster at junction of Angel Loop with passage to the Bar:
+ on wall Chiseled + on wall 2 ft above floor at northern edge of junction between Angel Loop and passage to the Bar · ( see above ) .

D794 1207.55
D779 1210.76
D187 1213.32
D111 1216.67
D731 1213.17
D104 1227.15
+ on wall
+ on wall
top of stalagmite
tip of. rock pendant
+ on wall
top of rock chip
71
Chiseled + on wall 9" above floor at joint intersection southwest of radon monitor in Angel Loop, 6" northeast of dropof f into fissure and 6" from the angle of rock at the joint intersection:
Chiseled + on wall at cross fissure along. joint in Angel Loop, 1 ft above floor in fissure indentation in south wall of passage:
Top of highest stalagmite beneath Carrot Sticks in Angel Loop. Bottom of prow-shaped rock pendant projecting downward into passage at northeastern end of Angel Loop, about 20 ft from eastern junction with 5th Ave., 6.6 ft above floor:
Chiseled + in north wall of 5th Ave. at eastern junction with Angel Loop, 1 ft above trail, on smooth tock face 2 ft west of small dead-end joint fissure. Uppermost tip of rock-chip scar above entrance to Fat Man's Misery:
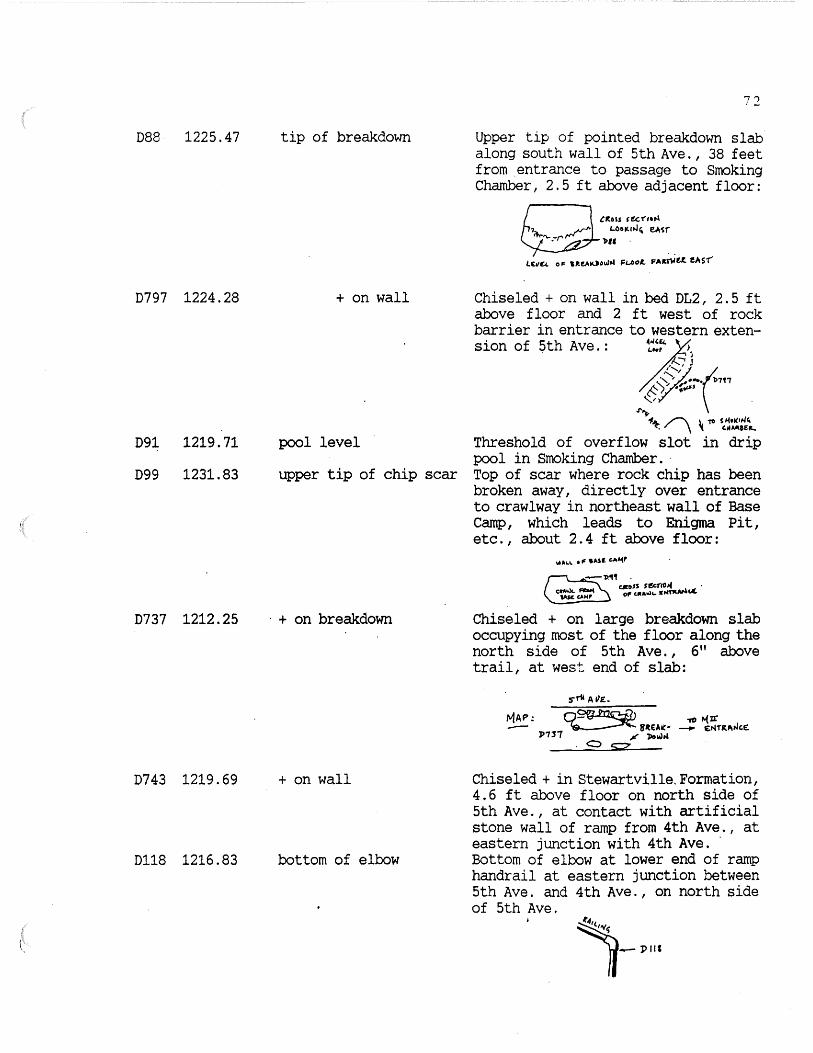
088 1225.47
0797 1224.28
D91 1219.71
D99 1231.83
D737 1212.25
D743 1219.69
0118 1216.83
tip of breakdown
'7 "') ,_
Upper tip of pointed breakdown slab along south wall of 5th Ave., 38 feet from entrance to passage to Smoking Chamber, 2. 5 ft above adjacent floor:
g_titou ftcno4 &..001wJ" e.A~r .,,, .
LU~ oF llt!AOOu>~ FL..001. FAit~tf. !AS'1"'
+ on wall Chiseled + on wall in bed DL2, 2. 5 ft above floor and 2 ft west of rock barrier in entrance to western exten-sion of 5th Ave. : ~".!::' >.
s:!~.(7'l"T ~ l '•tPJ' "-/ .
~ 1.1&.. ./""\ 1. TO S /o(tlCIN"
-c: , \ ' 'll~J<-
pool level Threshold of overflow slot in drip pool in Smoking Chamber. ·
upper tip of chip scar Top of scar where rock chip has been broken away, directly over entrance to crawlway in northeast wall of Base camp, which leads to Enigma Pit, etc., about 2.4 ft above floor:
, + on breakdown
+ on wall
bottom of elbow
Chiseled + on large breakdown slab occupying most of the floor along the north side of 5th Ave. , 6" above trail, at west end of slab:
stil A~£.
Chiseled+ in Stewartville.Formation, 4.6 ft above floor on north side of 5th Ave., at contact with artificial stone wall of ramp from 4th Ave., at eastern junction with 4th Ave. · Bottom of elbow at lower end of ramp handrail at eastern junction between 5th Ave. and 4th Ave., on north side of 5th Ave.

D802 1230.33 + on wall
D806 1226.70 + on wall
D810 1231.76 + on wall
D205 1239.72 rail top
D813 1237.49 + on wall
73
Chiseled + on wall at southwest corner of Dome Room, above middle step leading to Diamond Caverns, 2 ft above middle step, 2" above BP2, and 2 ft from southwestern corner of intersection at Dome Room:
Chiseled + on wall 6" above floor of Diamond Caverns, on south wall across from joint fissure in -~~11: ,4
~L_ ~ ~~1>0'ME'.
----- · ~ f{Oot-1 T6 :BL.11£.
&..Al(.£
Chiseled + on wall on northwest corner of entry.to Diamond Caverns from Blue Lake area, 2. 5 ft above floor .at base of steps in 4th Ave.:
Top of railing at eastern end of Blue Lake, at southeastern elbow, 3.1 ft above floor:
Chiseled + on south wall of 4th Ave. , 11 ft to east of bridge over Blue Lake, 10" abOve floor on fresh surface of shaly limestone, 2 ft east of jog in wall:

D203 1240.10 top of stalagmite
D818 1225.06 + on wall
D822 1238.93 :t on breakdown
D826 1228.94 + on wall
D746 1216.22 + on breakdown
74
Top of small stalagmite on large flows tone mound west of Blue Lake, 4.6 ft above trail, on opposite side of flowstone from Mushroom (Cross):
F<.olJs:n~~ ----·--·----1"WAll...
chiseled + in south wall of 4th Ave. above breakdown pile near low point of "valley" between Hills of Rome, 2.5 ft above trail:
MAP:
Chiseled + near east tip of large breakdown slab on south side of trail above top step on western end of "valley" between Hills of Rome, 3.5 ft above trail:
MAP':
Chiseled + on iron-oxide-stained rock face beneath overhanging ledge on southeastern corner of junction between 4th Ave. and Fat Man's Misery, 1.5 ft above top step leading from Fat Man's Misery:
Chiseled + on northeasternmost slab of breakdown in 17-Layer Rock, 1.4 ft above trail, on northwestern edge of slab:

D752 1213.81 + on wall
D124 1216.53 carbide dot on wall
D131 1214.89 top of stalagmite
D843 1210.99 + on wall
0136 1213.32 top of breakdown
D846 1209.89 + on breakdown
\ D849 1209.15 + on wall
75
Chiseled + on north wall of 5th Ave. , 1 ft west of junction with fissure from· Mystery II entrance, 9" above floor:
Apparently an old survey station, at junction of 5th Ave. and fissure from Mystery II entrance; 3. 2 ft above trail, on northeast corner of Junction:
·---- t>l2.'# \ cUl1J£. l>OTS o H WALL ·
Top of stubby yellow stalagmite on ledge on southwest wall of route to Garden of Gods, 3.45 ft above trail. Chiseled+ on triangular face on east end of tilted undercut breakdown block, along north wall of route to Garden · of Gods, 1 ft above lowest point on block and 2 ft above trail. ·Breakdown block is flared at bottom and rests on another larger block partly immersed in sediment fill. Topmost part of irregular breakdown block along S wall of route to Garden of Gods, just south of large semiburied slabs called "Texas Toast":
Chiseled + on
L.OOlt.tlol~ .SOc.1'114
south end of eastern slab of "Texas Toast" -- thin break-down slabs partly immersed in sedi-ment:
o~ ~ 6 ...... , ... ~ ~ SLAM
MAI' O(··· f \ 1)11/(,, •
Chiseled + on southwest corner of fissure intersection south of Coon

D851 1208.66 + on wall
D145 1218.09 ·top of stalagmite
D146 1216.82 top of railing
(\\ D233 1250.49 concrete floor
D240 1264.61 top of signpost
D244 1272.60 nail in power pole
D898 1271. 57 top of post
D932 1324.12 top of bolt on sign
D946- 1330. 65 top of bolt on sign
D157 1221.13 £lagging tape
76
Lake in route to Garden of Gods, 3.5 ft above edge of dropof f into lower fissure, just above overhang:
I <ROSS SECno..i
1.1>19£ P.t.R.r NCAll .. L.OOJt..
. & Jl'L~Gt'.1' O'tlt.I... F1ss11<c
Chiseled + on north wall, 8" above floor on projecting rock fin at beginning of Garden of Gods loop:
~~ l>SS'I L
-1.0ll)Et. ~vt.
fo1AP \ ~ ,,, ~·"'°' \ ol! 'iO)S
Top of large curved stalagmite beneath drip on breakdown slab in Garden of Gods, 3.4 ft above floor. Top of elbow in railing at top of stairs leading down from Garden of Gods. Floor of entrance building at Mystery II entrance, at head of stairs. Topmost point in post for. "Cave Tours" sign outside ticket off ice at Mystery II. DNR bench mark BM15 (1272.45 ft according to DNR survey) , 1 ft above ground. top of southern post of gate at entrance of Mystery II access road. Top of threaded section of uppermost bolt on back side of YIELD sign at junction between north-south road leading to Mystery II (and Grabau Quarry) and east-west road near junction with Rte. 5. Top of threaded section of 3rd bolt upward {2nd bolt downward) on back side of "left curve" sign on south side of Rte. 5 east of junction with Mystery II access road, 875 ft.east of D932. Small piece of flagging tape between blocks in low cairn in middle of floor in western part of 5th Ave., 1 ft above floor:
0-n~""·""4
~ -n'Ai'L. '91.0GKS

D178 1222.80
D167 1220.10
0174 1225.07
D175 1224.39
D8
D9
H27
D12
D13
1211.88
1212.09
1204.27
1212.76
1204.80
radio location
top of stalagmite
top of stalagmite
tip of stalactite
top of stalagmite
dot on breakdown
Lily Pad Lake
top of cairn
tip of soda straw
77
Top of nail in flagging tape at radio transmitting station. Highest point on compound stalagmite 1.5 ft south of iron oxide powder on floor of western extension of 5th Ave. Top of small stalagmite on ledge on east side of breakdown at western end of 5th Ave. Tip of stalactite directly below D174 stalagmite:
In Eureka Ave., top of small orange stalagmite 0. 8 ft above floor in middle of breakdown block across entrance to passage to Rotunda. Break.down also has an upright block on it to mark junction. carbide dot on top of 2-ft-square block in Eureka Ave. at entrance to Discovery Route:
~:;;Jf'· ~V£.
Top of rimstone in westernmost pool of Lily Pad Lake Topmost point of' cairn labeled "NO TOUCH" in Eureka Ave. at entrance to side passage to south:
Tip of 1" soda straw on northeast corner of junction of Eureka Ave. with route to First Triangle Room, 3.7 ft above floor.

D19 1224.72
H17 1192.57
D31 1206.44
D906 1227.51
H923 1225.21
D929 1225.73
D943 1231.26
D947 1229.91
D954 1230.54
D955 1233.94
78
tip of stalactite Tip of 1-ft-long corroded stalactite (with a slightly winged profile) 15 ft before western breakdown termination of Eureka Ave.
tip of breakdown block Topmost corner of triangular breakdown block in First Triangle Room.
radio. location Head of nail holding flagging at radio location (labeled "survey point") at entrance to the Finger Passages, west of Rotunda.
dot on wall Jtmction between 4th Ave. West and Under 4th Ave.; middle of old carbide dot in center of circle on south wall, in bed DSB.
former water level Top of thin light-gray band representing former water level, on south. wall of 4th Avenue West.
+ on wall Chiseled + on north wall of 4th Ave. West next to cross-shaped cairn at· beginning of Yellow Flow, above where flowstone cascade begins to drop below floor level of main passage; 1.3 ft below flat ceiling near base of bed DL12, below mud-man sculpture.
stalagmite tip Top of stubby stalagmite with orangebrown center, located between breakdown blocks at floor level:
+ on wall
stalagmite tip
dot on ceiling
Penciled + on north wall above entrance to passage leading north to Enigma Pit, above small breakdown block that partly blocks opening; in middle of bed DL5, 1.0 ft above top of breakdown block. Top of blob-shaped stalagmite on upper tip of long breakdown block along north wall of slope into Enigma Pit:
't>'J$''( Jlf(.H't>OM.111.1
~ S!:!!,.fr €"'1(t.1A hf"
Carbide dot on flat ceiling above edge of slope into Enigma Pit.

D962 1216.46 tip of arrow
D978 1209.21 carbide dot
D997 1213.21 dot on ceiling
ADDITIONAL POINTS OF INTEREST:
79
Tip of OUT arrow on south wall:
H6'Z ~+·-:::. TIP OF ARlol.I
Center of carbide dot on fin of rock above register jar at juction between Main Street and Labyrinth:
~II 1"1 Si'.
Carbide dot on flat ceiling, just after slight rise in ceiling level, above small cairn of breakdown blocks next to stream, at junction between Lily Pad Route and Helictite Route.
Top of new well casing at house at Mystery I (cap removed): 1258.48 ft.
Top of old well casing at·house at Mystery I (cap removed): 1255.21 ft.
Top of PVC stilling well on west bank of South Branch of Root River (installed for LCMR hydrologic study): 1230.86 ft.
Top of PVC stilling well at Flim Flam Creek, Mystery II (installed f9r LCMR hydrologic study): 1194.37 ft.
Dry bed of river at road crossing below Grabau Quarry: 1178.5 ft.
Floc>r of Grabau Quarry: 1269 - 1270 ft.


(
80 APPENDIX 2 -- Leveling Data
Survey coordinates from the geologic mapping of Mystery Cave are shown on the following pages. They are listed in the order in which they are encountered in traveling from Mystery I to Mystery II and III, with an occasional back-track into side passages. Semi-permanent bench marks are listed in Appendix 1, with locations shown on the map in Figure l. Measurements to stratigraphic and geomorphic features are listed in the second section (which also includes bench-mark data). Station locations can be determined from the X-Y scales on the base map. Vertical coordinates were obtained with a tripod-mounted surveyor's level in large passages and with a hand level in small (or less accessible) passages.
Surveys with the tripod-mounted level consisted of alternating foresights and backsights between the instrument and a metric survey rod, with readings to the nearest 0 .1 mm. Stadia readings on the rod were used to determine distance between stations, and azimuth was measured with a handheld SUUNTO compass. Measurements to features in the cave were made from the rod with a string level. Surveys with the hand level were made by projecting a horizontal line (datum line) through the cave from one rod to another, alternating foresights and backsights and measuring up or down to significant points from the datum line. Distances were measured with a fibreglass tape and azimuths with a hand-held SUNNTO compass. The datum line was shifted up or down an even number of feet wherever the configuration of the passage prevented the original line from being continued. Both leveling instruments were frequently calibrated with closed loops on the surface, and the level survey readings were corrected for calibration error.
The overall base station for the survey data is the 1989 DNR bench mark BMIO, which is the head of a spike driven into the base of a triple basswood tree south of the ticket office outside Mystery I. The DNR topographic map lists the.altitude of this station as 1230.37 feet above sea level. This is the first item (DI) on the list of survey data. Coordinates are given in FEET relative to this base station. ·
All figures on the following pages are in FEET. Columns are as follows:
STA= survey station in level survey. D =datum (semi-permanent bench mark). T =station at tripodmounted level. R = station at bottom of survey rod. S = same as R, except used for side shots not in sequence with the main level line. H =hand-level station (only significant ones are listed).
FROM= station from which the station listed in the first column was measured.
EAST= feet east of base station (BMIO =DI). Negative values indicate distance west ofbase'station.
NORTH= feet north of base station (negative values indicate distance south of base station).
VERTICAL= elevation of station in feet above sea level (BM 10 = 1230.37 feet used as datum). This figure is the floor or ground elevation for R and S stations. For D stations it is the exact elevation of the point. For T and H stations it is the elevation of the instrument (roughly 3 .5 feet above the floor for T stations).

81 Elevations of various features are shown in the last two columns, as measured at or near the
station. All are shown to the nearest 0.0 I foot, although some could not be reliably measured to that degree of accuracy (for example, irregular bedding planes). Abbreviations of features are as follows: BM = bench mark; CEIL (or C) = passage ceiling; FLOOR (or F) = passage floor (where not otherwise indicated, the floor level coincides with R and S stations and is about 3 .5 feet below T stations); BP = bedding plane; LS = limestone; SH = shale; SM = stalagmite; STAL (or ST) = stalactite; RST = rimstone; SHELFST = shelfstone; POPC =popcorn; PEND =pendant; SED = sediment; S+G = sand and gravel; ELBOW = elbow in railing pipe; DOT = carbide dot (from a previous survey?); N = north; E = east; S = south; W = west; WL = water level.
Positions of rock layers or bedding planes are noted in code as shown on the stratigraphic column. S =Stewartville Fonnation; D =Dubuque Formation; M =Maquoketa Formation. Contacts between beds are indicated in the following manner: D/S = Dubuque/Stewartville contact, etc. SXI -SX 3 =granular crystalline beds near top of Stewartville. DTI - DT4 =transitional beds at base of Dubuque, with little or no shale between them. BPI - BPl =major bedding planes near base of Dubuque. DLI - DL29 =limestone beds in Dubuque sandwiched between thin shale beds. DSI-DS30 =thin shale beds in the Dubuque, separated by limestone beds. Nomenclature for these thin limestone and shale beds may seem awkward at first, but the advantage is that in the field it is possible to count quickly upward or downward from a known bed, using only the projecting limestones or the recessive shales, without having to keep track of every bed. -

STA FROM EAST NORTH VERTICAL FEET
Dl o.o o.o 1230.37 BMlO=NAIL 1230.37 Rl Dl o.o o.o 1230.37 Tl Rl 6.8 15.6 1233.24 R2 Tl -52.4 4.1 1229.24 FLOODPLAIN 1229.24 T3 R2 -151.1 22.4 1233.09 R4 T3 -165.3 -24.0 1232.64 FLOODPLAIN 1232.64 TS R4 -243.4 -25.4 1238.16 R6 TS -268. 5- -28.4 1236.61 IR REG SURF 123.6. 61 T7 Rl 7.6 17.0 1233.11 S8 T7 68.6 -.5 1224.81 RIVER LEV 1224.81 89 T7 115.4 1.8 1230.47 PATH 1230.47 RlO T7 46.4 41.3 1228.21 Tll RlO 27.7 116.4 1233.42 FLOODPLAIN 1233.42 Rl2 Tll 7.9 241.5 1227.73 Tl3 Rl2 -28.7 295.8 1231.45 FLOODPLAIN 1231.45 Rl4 Tl3 -63.1 350.7 1226.85 Tl5 Rl4 -103.9 417.4 1230.88 Rl6 Tl5 -141. 3 497.7 1226.34 FLOODPLAIN 1226.34 Tl7 Rl6 -165.2 568.9 1229.83 Rl8 Tl7 -184.1 657.8 1225.17 Tl9 Rl8 -167.2 690.8 1228.81 R20 Tl9 -146.l 699.4 1222.31 WL AT FORD 1222.31 T21 89 129.3 -9.8 1231.96 R22 T21 137.5 -11.1 1226.12 T23 R22 165.1 -10.2 1226.12 R24 T23 193.9 -10.2 1220.54 CEIL 1227.75
FLOOR 1220.54 DS18/DL17 1226.28 DL16/DS16 1225.29 DS16/DL15 1224.96 DL15/DS15 1223.92 DS15/DL14 1223.64 DL14/DS14 1223.28 DS14/DL13 1223.03 DL13/DS13 1221.95 DS13/DL12 1221.36
T25 R24 217.3 -11.8 1221.49 R26 T25 255.5 -15.8 1215.68 D2 R26 255.5 -15.8 1218.56 SM TOP 1218.56 T27 R26 326.1 -30.2 1220.61 R28 T27 360.6 -34.7 1215.99 DS13/DL12 +221.96
CEIL 1225.83 D3 R28 360.6 -34.7 1218.54 RAIL TOP 1218.54 T29 R28 401. 7 -51.3 1216.52 POOL LEVEL 1204.25 R30 T29 444.3 -65.2 1213.47 R31 D3 360.6 -34.7 1215.13 T32 R31 400.8 -51.0 1215.96 R33 T32 437.5 -62.9 1213.41 D4 R33 437.5 -62.9 1216.93 RAIL TOP 1216.93
T34 R33 470.4 -61.2 1219.95
\ R35 T34 500.0 -61.7 1217.47 DS13/DL12 1222.79

CEIL 1225 .. 35 T36 R35 570.5 -80.6 1221.36 R37 T36 597.0 -88.2 1217.07 C=DL14/Sl4 1224.13
FLOOR 1224.13 SHELFST 1220.62
D37 R37 597.0 -88.2 1220.87 SM TOP 1220.87 T38 R37 649.1 -90.0 1221.37 R39 T38 695.8 -101. 7 1216.62 CEIL 1224.16
SEO TOP 1219.77 T40 R39 749.3 -118.0 1220.89 R41 T40 805.4 -131. 5 1217.00 T42 R41 784.6- -140.3 1217. 72 S43 T42 790.8 -140.0 1213.82 FOLIA TOP 1219.33
FOLIA BOT 1219.17 DLlO/DSlO 1218.28 DS10/DL9 1217.89
844 T42 765.8 -160.5 1211. 77 DAM TOP 1214.59 WATER LEV 1214.46 FOLIA TOP 1219.28 CEIL 1219.32
R45 T42 805.5 -130.1 1217.00 CONE TOP 1219.36 SHELFST 1218.94
T46 R45 846.8 -138.2 1220.08 R47 T46 922.9 -1S2.3 1216.97 CONE TOP 1217.49
OLD WL 1218.08 CEIL 1220.87 DLll/DSll 1220.87
T48 R47 938.7 -160.6 1218.66 R49 T48 974.7 -164.4 1215.4S CEIL 1220.83
OLD WL 1218.32 TSO R49 1017.4 -133.9 1218.07 R51 TSO 1058.7 -105.0 121S.08 CEIL 1220.9S
DLlO/DSlO 1220.9S DS9 1218.98 DS8 1217.83
T52 RSl 1100.7 -75.6 1218.29 R53 T52 1106.2 -86.7 1217.74 CEIL 1225.94
DL14/DS14 1225.94 D53 RS3 1106. 2 -86.7 1219.lS SM TOP 1219.lS T54 R53 1100.1 -77.0 1217.87 R5S T54 1100.5 -72.l 1214.79 CEIL 1218.40
FLOOR 1214.13
T56 R5S 1104.1 -52.7 1215.12 DL6/DS6 1215.77 CEIL 1218.73 LOW CEIL 1215.18
R57 T56 1125.7 -52.7 1213.69 CEIL 1219.85 DL10/DS10 1219.36 DS10/DL9 1219.07 DL9/DS9 1218.08 DS9/DL8 1217.72 DL9/DS9 1216.28 DS8/DL7 1215.72
T58 R57 1166.9 . -24.4 1216.71 R59 T58 1203.5 -S.3 1215.18 CEIL 1218.46
DL9/DS9 1218.46

FLOOR 1212. 5.2 T60 R59 1197. 5 8.9 1215.82 R61 T60 1215.9 26.0 1213.37 CEIL 1218.92
DL9/DS9 1218.92 DL9/DS9 1217.82 DL7/DS7 1216.95 DS7/DL6 1216.56
T62 R61 1270.0 16.5 1215.31 CONE TOP 1214.74 062 T62 1270.0 16.5 1214.74 CONE TOP 1214.74 R63 T62 1274.0 42.2 1212.61 DL9/DS9 1219.06 T64 R63 1274.1 49.0 1219.08 CEIL 1225.97
DL14/DS14 1225.97 R65 T64 1258.2 51.0 1217.44 DS13/DL12 1224.85
DL14/DS14 1225.90 CEIL 1225.90 DL12/DS12 1224.39 DS12/DL11 1223.70 DLll/DSll 1222.85 DSll/DLlO 1221. 90
T66 R65 1222.6 57.2 1222.51 R67 T66 1212.2 64.8 1217.91 CEIL 1225.78
DL14/DS14 1225.78 DS13/DL12 1224.96 DL12/DS12 1224.27 DS12/DL11 1223.61 DLll/DSll 1222.83 DSll/DLlO 1221.65 DL10/DS10 1220.50 DS10/DL9 1220.27 DS9 1219.35
T68 R67 1237.2 89.4 1218.57 R69 T68 1257.9 100.0 1215.46 CEIL 1219.36
DL9/DS9- 1219.36
T70 R69 1211.4 109.8 1216.95 R71 T70 1193.6 116.0 1211.08 CEIL 1219.94
DL9/DS9 1219.94 FLOOR 1209.61
071 R71 1193.6 116.0 1214.05 DOT ON BD 1214.05
R245 Dl o.o o.o 1229.67 T246 R245 9.0 13.9 1233.28 R247 T246 116.4 -2.1 1230.14 T248 R247 129.1 -15.7 1232.10 8249 T248 142.8 -21.4 1227.26 DL19/DS19 1229.58
DS19/DL18 1229.10 DL18/DS18 :1228.49 DS18/DL17 1228.17 DS18 1227.39 DL17/DS17 1225 • .1,9 DS22/DL21 1230.55 DL22/DS22 1231.07 DS23/DL22 1231.66 DL23/DS23 1231.87 DS24/DL23 1233.04 DL24/DS24 1233.92
(, DS25/DL24 1234.35

OL25/0S25 1234.68 SH BREAK 1235.20 SH BREAK 1235.93 SH TOP 1236.48
R250 T248 119.4 1.8 1231. 99 OL27 1237.81 M/O 1241.11
R320 02 255.5 -15.8 1215.48 T321 R320 256.4 -2.2 1215.97 R322 T321 262.7 4.8 1209.86 T323 R322 327.0 60.7 1214.93 R324 T323 377.0 109.0 1211. 34 OSlO 1216.53
DS9 1215.41 CEIL 1222.66 LS/SH 1222.66
T325 R324 402.2 105.4 1213.17 R326 T325 402.2 111.3 1209.87 T327 R326 402.2 123.7 1210.66 D/S 1202.26
STREAM 1180.76 R328 T327 402.2 123.7 1202.63 0328 R328 .402. 2 123.7 1210.46 SM TOP 1210.46 R329 D2 255.5 -15.8 1215.53 T330 R329 301.3 -23.9 1218.95 R331 T330 329.1 -23.4 1210.74 SP CEIL 1215.93
DL9/DS9 1215.93 T332 R331 352.6 -4.1 1214.36 R333 T332 378.3 3.8 1209.46 OS10/DL9 1217.07
CEIL 1222.81 OL14/DS14 1222.81 NEXT CEIL 1214.25 OL7/DS7 1214.25
T334 R333 417.2 28.l l211. 22 R335 T334 435.7 34.3 1206.19 0Sl/DT4 1208.84 0335 R335 435.7 34.3 1209.54 RAIL TOP 1209.54 T336 R335 458.8 49.3 1209.08 R337 T336 508.4 40.1 1206.18 DS1/DT4 1209.13
CEIL 1213.89 OL7/0S7 1213.89
T338 R337 552.1 65.3 1212.60 R339 T338 583.l 85.5 1209.97 DL7/DS7 1214.40
CEIL 1217.35 DL10/DS10 1217.35
T340 R339 610.3 107.9 1213.75 R341 T340 634.l 107.0 1208.92 OL7/DS7 1214.43
CEIL 1216.20 DL9/0S9 .1216. 20 FISSURE C 1218.76
T342 R341 661.8 128.7 1212.19 S343 T342 669.8 148.4 1206.89 DS1/DT4 1209.78
DS4/DL3 1212. en OL4/DS4 1212.14
R344 T342 670.6 154.1 1211.83 OL10/0S10 1218.13 NAUTILUS 1218.39
T345 R344 673.7 157.7 1217.80 R346 T345 678.4. 156.7 1217.74 T347 R346 683.0 162.8 1222.37

8348 T347 678.5 173.8 1216.72 0348 8348 678.5 173.8 1222.96 STAL TIP 1222.96 8349 T347 687.2 167.9 1217.98 CEIL 1229.53
0821 1229.53 R350 03 360.6 -34.7 1215.16 T351 R350 375.6 -44.5 1218.62 R352 T351 369.9 -47.2 1209.65 T353 R352 325.9 -81.0 1211.76 R354 T353 294.0 -106.8 1206.34 DS1/DT4 1208.99
CEIL 1213.09 DL6/DS6 1213.09
T355 R354 279.7 -107.6 1211.32 R356 T355 233.2 -142.6 1211.24 DS10/DL9 1216.79 T357 R356 229.3 -146.3 1220.58 R358 T357 226.4 -150.9 1220.41 T359 R358 210.9 -155.0 1230.12 8360 T359 202.8 -159.3 1225.53 RADIO LOC 1226.07 R361 T359 219.9 -164.9 1229.97 DS24/DL23 1234.56 T362 R361 187.0 -163.7 1238.05 R363 T362 181.0 -170.6 1236.76 M/D 1242.18
DL27 1239.13 T364 R363 177.7 -157.9 1243.19 R365 T364 174.3 -163.9 1243.10 BO TOP 1259.51
HIGHEST C 1249.66 H366 071 1175.0 110.0 1212.05 DL3/DS3 1213.35
CEIL 1216.35 DS6 1216.35 DS1/DT4 1211.65 BP 3 1209.95 FLOOR 1206.05
H367 071 1209.4 135.4 1218.05 CEIL 1220.05 FLOOR 1215.05 DL9/DS9 1218.65 DS10/DL9 1219.65
H368 H367 1244.0 161.9 1218.05 CEIL 1222.35 DS12 1222.35 FLOOR 1216.05 DL10/0S10 1219.95 OL9/DS9 1218.65
H369 H368 1250.6 181.2 1218.05 CEIL 1222.05 FLOOR 1215.65 OL10/0S10 1220.00 DL9/0S9 1218.75
0370 H369 1300.8 217.6 1218.05 + ON WALL 1218.05 H370 0370 1300.8 217.6 1218.05 CEIL 1220.05
DL10/DS10 1220.05 FLOOR 1214.45 OL9/0S9 1218.80 SP CEIL 1215.4~
OL6/0S6 1215.45 H371 H370 1353.9 259.9 1218.05 CEIL 1220.20
DL10/0S10 1220.20 D810/0L9 1219.70 DL9/0S9 1219.05 F (BO) 1211.05

H372 H371 1402.2 290.6 1217.05 CEIL 1218.15 FLOOR 1215.25 DL7/DS7 1217.25
H373 H372 1399.2 307.7 1217.05 CEIL 1222.55 DS10/DL9 1219.95 DL9/DS9 1218.95 DL8/DS8 1218.05 FLOOR 1214.45
H374 H373 1341.8 311.2 1217.05 CEIL 1218.70 DL9/DS9 1218.70 DL8/DS8 1217.50 DS8/DL7 1217.10 FLOOR 1214.55
H375 H374 1366.6 332.0 1217.05 CEIL 1219.35 DL10/DS10 1219.35 DL9/DS9 1218.25 FLOOR 1214.55
H376 H375 1392.4 334.2 1217.05 CEIL. 1218.85 DL9/DS9 1218.35 FLOOR 1214.05
H377 H376 1431.2 . 360.4 1217.05 CEIL 1219.65 DL10/DS10 1219.65 DL9/DS9 1218.60 FLOOR 1215.35
H378 H377 1461.5 383.2 1217.05 CEIL 1222.25 DL12/DS12 1222.25 DL9/DS9 1218.50 FLOOR 1213.65
(. H379 H378 1432.6 391.8 1217.05 CEIL 1221.05 J
DS10/DL9 1219.05 DL9/DS9 1218.20 FLOOR 1214.05 DL6/DS6 1215.35
H380 H379 1445.6 413.0 1215.05 CEIL 1216.40 DL7/DS7 1216.40 F (CLAY) 1214.85
H381 H380 1445.6 413.0 1217.05 DL9/DS9 1218.25
H382 H381 1452.7 417.2 1217.05 CEIL 1219.45 DL10/DS10 1219.45 F (BO) 1216.85
H383 H382 1462.1 419.8 1218.05 CEIL 1219.65 DLlO/DSlO 1219.65 FLOOR 1217.65
H384 H383 1464.4 424.8 1221.05 CEIL 1225.05 DL16/DS16 1225.05 FLOOR 1'220.75
H386 H384 1472.0 434.4 1222.05 Fe OXIDE 1223.45 Fe OXIDE 1222.45
H387 H386 1473.9 435.4 1220.05 0387 H387 1473.9 .435. 4 1218.71 SM TOP 1218.71
H388 H387 1478.1 437.6 1218.05 CEIL 1220.10 DL10/DS10 122Q.10 DL9/DS9 1218.85 FLOOR 1217.75
H389 H388 1526.8 478.4 1218.05 CEIL 1219.05

DL9/DS9 1219.05 FLOOR 1216.25
H390 H389 1541.1 493.5 1218.05 CEIL 1221. 55 DL10/DS10 1220.25 DL9/DS9 1218.90 FLOOR 1216.55
H391 H390 1555.7 498.8 1218.05 CEIL 1218.90 DL9/DS9 1218.90 FLOOR 1216.05
H392 H391 1578.8 494.5 1217.05 CEIL 1218.35 DL8/DS8 1218.35 FLOOR 1215.75
H393 H392 1595.8 510.7 1217.05 CEIL 1220.25 DL10/DS10 1220.25 DL8/DS8 1218.35 FLOOR 1216.45
H394 H393 1616.3 522.5 1218.05 CEIL 1220.45 DL10/DS10 1220.45 FLOOR 1216.95
H395 H394 1694.l 585.5 1218.05 CEIL 1220.65 DL10/DS10 1220.65 DL9/DS9 1219.25 FLOOR 1214.55
H396 H395 1747.2 631.7 1216.05 CEIL 1218.55 DL9/DS9 1218.55 DL7/DS7 1216.90 FLOOR 1214.05
H397 H396 1779.9 625.6 1216.05 CEIL 1218.05 ( DL8/DS8 1218.05
DL7/DS7 1217.01 DS6/DL5 1215.60 FLOOR 1214.25
H3q8 H397 1798.3 644.6 1215.05 CEIL 1215.85 DS6/DL5 1215.40 FLOOR 1213.65
H399 H398 1812.9 659.7 1215.05 CEIL 1216.75 DL7/DS7 1216.75 F (BD) 1214.45
H400 H399 1816.3 668.0 1216.05 DL7/DS7 1216.90
H401 H400 1823.7 673.0 1217.05 DLlO/SlO S 1219.80 DLlO/SlO N 1218.75 DL7/DS7 1216.75 F (BD) 1216.05
H402 H401 1822.4 680.9 1221.. 05 0402 H402 1822.4 680.9 1218.15 FLAGGING 1218.15
HH402 H401 1839.9 676.4 1217.05 'CEIL 1217.95 DL9/DS9 1217.95 DL7/DS7 1216.~5
DL6/DS6 1215.65 F (BD) 1214.55
H403 HH402 1853.0 678.4 1215.05 CEIL 1216.05 DL7/DS7 1216.05 FLOOR 1213.55
H404 H403 1873.5 674.0 1215.05 CEIL 1216.60 \ DL7/DS7 1216.60

FLOOR 1214.55 H405 H404 1918.3 672. 4 1215.05 CEIL 1217.30
DL7/DS7 1217.30 DS5/DL4 1215.15 F (BD) 1213.05
H406 H405 1934.7 672.7 1215.05 CEIL 1215.55 DL5/DS5 1215.55 DS5/DL4 1215.25 DL3/0S3 1214.85
H407 H406 1973.1 670.0 1215.05 CEIL 1216.20 DL4/DS4 1216.20 DS3/0L2 1215.55 FLOOR 1213.05
H408 H407 2020.6 669.2 1215.05 CEIL 1215.75 DL3/0S3 1215.75 0Sl/DT4 1214.05 F (BO) 1209.75
H409 H408 2032.7 668.8 1211.05 CEIL 1213.05 BP3 1212.45 BP2 1209.65 FLOOR 1207.55
H410 H409 2041.4 666.8 1211.05 CEIL 1214.05 BP2 1212.15 F (CLAY) 1207.95
H411 H410 2058.4 665.7 1211.05 CEIL 1213.25 BP2 R 1210.20 BP2 L 1209.75 FLOOR 1209.05
· H412 H411 2075.5 663.0 1211.05 CEIL 1213.85 BP2 1209.85 FLOOR 1209.85
H413 H412 2080.8 663.6 1211.05 CEIL 1214.05 BP2 1209.65 FLOOR 1209.65
H414 H413 2093.0 661.9 1211.05 CEIL 1212.65 BP2 R 1210.25 BP2 L 1209.75 FLOOR 1208.65
H415 H414 2121. 2 677.2 1210.05 CEIL 1212.05 BP2 1210.25 BPl 1208.55 F (CLAY) 1204.55
H416 H415 2135.6 673.9 1207.05 CEIL 1211.15 BP2 1210.05 BPl ·1208.55 FLOOR 1205.25
· H417 H416 2150.5 675.8 1210.05 CEIL 1214.55 BP2 1210 •. 25 FLOOR 1206.45
H418 H417 2189.5 691.9 1210.05 CEIL 1213.55 BP2 1210.30 FLOOR 1206.05
H419 H418 2200.9 . 702.0 1210.05 CEIL 1210.65 BP2 1210.·05 FLOOR 1207.05

H420 H419 2209.0 704.4 1210.05 CEIL 1213.15 F (BO) 1209.55
H421 H420 2236.8 717.9 1211.05 CEIL 1215.05 BP2 1210.40 F (BO) 1208.05
H422 H421 2249.0 728.6 1211.05 CEIL 1214.05 BP2 1210.60 FLOOR 1206.55
H423 H422 2251. 3 740.4 1211.05 CEIL 1214.85 BP2 1210.45 FLOOR 1206.55
H424 H423 2272.5 755.0 1212.05 CEIL 1214.55 BP2 1210.55 FLOOR 1207.75
H425 H424 2275.8 755.7 1209.05 H426 H425 2279.7 756.5 1209.05 H427 H426 2291.8 753.9 1209.05 CEIL 1210.65
FLOOR 1207.05 H428 H427 2297.8 752.6 1209.05 H429 H428 2319.0 748.l 1211.05 CEIL 1214.45
BP2 . 1211. 30 F (CLAY) 1209.65
H430 H429 2322.7 755.1 1211.05 CEIL 1216.05 BP2 1211.10 F (CLAY) 1210.35
H431 H430 2340.2 769.3 1212.05 CEIL 1215.55 BP2 1211.15 FLOOR 1207.55
H432 H431 2358.1 784.5 1211.05 CEIL 1215.85 BP2 1211.30 BPl 1209.80 BP3 1214.35 FLOOR 1206.55
H433 H432 2380.0 800.5 1211.05 CEIL 1214.05 BP2 1211.55 FLOOR 1206.05
H434 H433 2388.0 816.2 1211.05 CEIL 1215.25 BP2 1211.40 BPl 1209.95 FLOOR 1206.55
0434 H434 2388.0 816.2 1209.63 SM TOP 1209.63 H435 H434 2417.5 839.2 1211.05 CEIL 1216.05
BPl? 1211. 75 F (CLAY) 1205.55
H436 H435 2447.6 861.6 1212.05 CEIL 1214.05 BPl 1211.25 F (CLAY) 1203.05
H437 H436 2453.8 864.4 1213.05 H438 H437 2461. 0 867.8 1211.05 CEIL 1214~65
BP2 1212.35 F (CLAY) 1204.05 BPl 1210.95
0438 H438 2461. 0 867.8 1212.35 FLAGGING 1212.35
H439 H438 2461.7 875.4 1211.05 H564 'H439 2471.8 880.3 1212.05 BP2 1212.05

BPl 1210.65 H565 H564 2504.1 905.1 1212.05 CEIL 1214.75
BP2 1212.25 BPl 1210.75 F (CLAY) 1203.75
H566 H565 2518.2 915.0 1211. 05 CEIL 1214.35 BP2 1212.15 BPl 1210.65 FLOOR 1204.05
H567 H566 2524.2 916.2 1201. 0·5 CEIL 1214.05 BP2 1212.25 BPl 1210.65 FLOOR 1203.55
H568 H567 2535.6 925.l 1207.05 CEIL 1214.05 BPl 1210.85 FLOOR 1203.05
H569 H568 2541.5 928.1 1207.05 H570 H569 2566.9 949.0 1207.05 CEIL 1214.55
BP2 1212.85 BPl 1211.35 FLOOR 1203.35
H571 H570 2568.9 952.5 1208.05 H572 H571 2576.0 960.5 1210.05 CEIL 1214.45
BP2 1212.35 BPl 1210.85 F (CLAY) 1206.55
H573 H572 2586.6 966.4 1210.05 CEIL 1214.65 BP2 1212.35 BPl 1210.75 F (CLAY) 1206.95
H574 H573. 2597.3 974.7 . 1210.05 CEIL 1215.25 BP2 1212.70 BPl 1211.00 FLOOR 1206.25
H575 H574 2613 .• 4 978.5 1211.05 CEIL 1216.05 BP2 1212.95 BPl 1211.45 FLOOR 1206.25
H576 H575 2624.7 979.6 1212.05 BP! 1211.65 FLOOR 1206.25
H577 H576 2644.6 983.5 1212.05 CEIL 1215.15 BP2 1213.45 BP! 1211.85 FLOOR 1206.35
H578 H577 2661. 2 983.l 1212.05 CEIL lr214.55 BPl 1212.25 FLOOR 1203.55
H579 H578 2680.2 984.4 1212.05 CEIL 1214.35 BP2 1214.05 BPl 1212.55 BP 1211. 35 FLOOR 1201. 55
H580 as19 2694.5 984.9 1214.05 CEIL 1215.65 BP2 1214.35 BPl 1212.85

FLOOR 1202.05 H581 H580 2736.9 991.6 1214.05 CEIL 1216.55
BP2 1214.60 FLOOR 1199. 95
0581 H581 2736.9 991.6 1213.23 SM TOP 1213.23 H582 H581 2769.8 999.8 1214.05 CEIL 1217.25
BP2 1214.90 BPl 1213.50 FLOOR 1199.15
H583 H582 2817.8 1001.9 1214.05 CEIL 1217.25 BP2 1215.45 BPl 1213.85 FLOOR 1199.55
H584 H583 2843.2 1004.6 1214.05 CEIL 1218.05 BP2 1215.80 BPl 1214.35
H585 H584 2867.9 1007.6 1214.05 CEIL 1219.75 BP2 1216.05 BPl 1214.65 FLOOR 1199.35
H586 H585 2898.1 1013.0 1214.05 CEIL 1219.35 BP2 1216.25 BPl 1214.85 FLOOR 1198.85
H587 H586 2932.1 1019.0 1214.05 H588 H587 2936.l 1021.9 1214.05 CEIL 1218.05
BP2 1216.35
f BPl 1215.00 \ CHOCKS 1210.05
H589 H588 2942.8 1021.6 1214.05 H590 H589 2967.0 1029.9 1214.05 CEIL 1216.55
BPl 1215.25 H591 H590 2978.4 1032.1 1214.05 ·OEIL 1216.65
BPl 1215.20 BP 1214.05 FLOOR 1198.25
H592 H591 2989.9 1037.5 1214.05 H593 H592 3014.4 1041.4 1214.05 CEIL 1217.35
BPl 1215.50 BP 1214.95 FLOOR 1198.05
H594 H593 3033.0 1046.4 1214.05 H595 H594 3042.5 1049.5 1203.05 F (CLAY) 1198.05
H596 H595 3072.8 1053.7 1203.05 FLOOR 1197.75
H597 H596 3108.4 1053.4 1202.05 H598 H597 3116.6 1053.5 1202.05 F (CLAY) 1197.55 0598 H598 3116.6 1053.5 1216.05 LINE 1216.05
CEIL 1219.05 BPl 1216.85
H599 0598 3143.6 1054.9 1216.05 H635 0598 3113.6 1056.2 1216.05 H636 H635 3114 .1 1068.4 1216.05 CEIL 1217.45
BPl 1217.05 F (CLAY) 1207.25
H637 H636 3112. 7 1079.4 1216.05 CEIL 1217.45

BPl 1216.70 LEDGE 1212.85 FLOOR 1211.05
H638 H637 3122.6 1087.0 1214.05 H639 H638 3125.7 1088.l 1214.05 CEIL 1216.05
LEDGE 1211.85 F=FST/S+G 1210.85
H640 H639 3127.2 1092.8 1214.05 H641 H640 3137.1 1101. l 1214.05 C POCKET 1218.15
CEIL 1216.05 LEDGE 1213. 25 F (FST) 1210.25
H642 H641 3151.3 1110.0 1213.05 CEIL 1217.05 LEDGE 1213.75 F (S+G) 1211.25
H643 H642 3122.5 1115.3 1214.05 C FISSURE 1220.65 BPl 1217.05 LEDGE 1213.75 F (FST) 1211.05
H644 H643 3099.5 1119.6 1214.05 CEIL 1217.05 BPl 1216.80 LEDGE 1213.00 SHELF ST 1210.49 F (S+G) 1209.55
H645 H644 3076.9 1104.9 1214.05 CEIL 1218.85 BPl 1216.40 LEDGE 1212.95 FLOOR 1210.05
H646 H645 3075.7 1101.7 1214.05 H647 H646 3044.6 1107.2 1213.05 CEIL 1216.55
BPl 1216.05 LEDGE 1212.35 F (S+G) 1208.15
H648 H647 3036.5 1109.5 1213.05 H649 H648 3031. 9 11.02.0 1213.05 CEIL 1214.55
LEDGE 1212.25 FLOOR 1208.45
H650 H649 3010.2 1105.6 1214.05 CEIL 1215.35 LEDGE 1212.25 TRENCH F 1207.75
H651 H650 3001.0 1110. 2 1214.05 H652 H651 2979.3 1115.1 1213.05 CEIL 1216.05
BPl 1215.70 F (S+G) 1207.95
H653 H652 2968.8 1117. 0 1213.05 CEIL 1216.25 BPl 1215.45 LEDGE 1211.75 F (CLAY) 1207.95
H654 H653 2987.9 1133.0 1212.05 H655 H654 2989.8 1137.4 1212.05 CEIL 1217.45
LEDGE 1211.95 FLOOR 1207.25
H656 H655 3011.6 1153. 8 1212.55 H657 H656 3018.3 1157. 7 1212.55 CEIL 1216.55
BPl 1216.40

Fe OXIDE 1213.15 F (CLAY) 1208.05
H658 H657 3024.4 1159.7 1212.55 H659 H658 3028.5 1164.4 1213.05 CEIL 1218.05
BP 1217.15 BPl 1216.50 F (BD) 1210.05
H66.0 H659 3008.3 1168.8 1213.05 CEIL 1216.35 F (CLAY) 1206.25
H661 H660 3019.1 1177.6 1213.05 H662 H661 3043.9 1197.7 1211.05 CEIL 1220.55
BP 1218.05 BPl 1216.55 LEDGE 1212.75 FLOOR 1206.15
H663 H662 3045.4 1200.4 1211.05 H664 H663 3059.6 1211.4 1211.05 CEIL 1220.05
FLOOR 1205.75 H665 H664 3071.6 1221.5 1209.05 H666 H665 3059.4 1223.5 1209.05 CEIL 1216.95
BPl 1216.55 BP 1215.95 F (BD) 1206.95
H667 H666 3079.8 1237.8 1209.05 FLOOR 1204.95 H668 H667 3089.5 1247.8 1209.05 H669 H668 3102.4 1256.2 1209.05 CEIL SLOT 1221.05
BP 1216.95 BP 1215.95 FLOOR 1204.45
H670 H669 3093.0 1258.7 1209.05 H671 H67,0 3052.6 1267.3 1212.55 CEIL 1217.95
CROSS JT 1220.05 BPl 1216.35 FLOOR 1212.55
H672 H671 3021.4 1279.9 1216.05 CEIL 1217.85 BPl 1216.25 MUDCRACKS 1213.75 F (S+G) 1213.45
D672 H672 3021.4 1279.9 1215.85 + ON LEDGE 1215.85 H673 H672 3003.4 1308.7 1216.05 CEIL 1219.55
BPl 1216.95 LEDGE 1212.85 F FISSURE 1206.65
H674 H673 3040.5 1337.7 1216.05 CEIL 1219.75 BPl ·1217. 25 BP 1216.45 LEDGE 1212.85 F FISSURE 1207.15
H675 H674 3073.3 1352.9 1216.05 CEIL 1218.55 BP 1217.35 BP 1216.75 BP 1215.75 LEDGE 1211.55 F FISSURE 1208.35
\ H676 H675 3105.2 1369.9 1216.05 CEIL 1220.65

BP 1217.75 BP 1216.90 BP 1216.35 BP 1215.45 LEDGE 1213.05 F FISSURE 1206.45
0676 H676 3105.2 1369.9 1213.73 SM TOP 1213. 73 H677 H676 3171. 0 1404.9 1216.05 0634 H677 3171.0 1404.9 1216.57 + ON WALL 1216.57 H634 0634 3171. 0 1404.9 1216.57 CEIL 1218.07
BPl 1215.37 FLOOR 1211. 77 TRENCH 1203.77
H633 H634 3129.6 1419.l 1216.57 CEIL 1217.52 BPl 1215.57 FLOOR 1212.97
H632 H633 3128.l 1426.0 1219.57 H631 H632 3136.4 1430.4 1219.57 CEIL 1221.27
F (BO) 1216.57 H630 H631 3152.8 1442.7 1219.57 CEIL 1221.07
F (BO) 1215.57 H629 H630 3161.6 1454.9 .1218.57 CEIL 1219.97
F (BO) ·1211.01 H628 H629 3165.7 1458.8 1217.57 H627 H628 3170.0 1461. 7 1215.57 CEIL 1219.57
BPl 1215.67 F (BO) 1213.07
H626 H627 3200.6 1493.4 1215.57 CEIL 1218.77 BP2 1216.77 BP 1215.92 BPl 1215.47
H625 H626 3260..6 1479.5 1215.57 CEIL 1221.67 BP 1216.52 FLOOR 1211.97
H624 H625 3290.8 1504.0 1213.57 CEIL 1221.87 BP2 1217.77 BP 1216.37 . BPl 1215.77 GRAVEL 1212.42 F SLOT 1210.97
H623 H624 3329.4 1536.9 1213.57 CEIL 1221.07 BP2 1218.42 BPl 1215.97 WIDEST 1212.57
H622 H623 3328.7 1562.4 1213.57 0622 H622 3328.7 1562.4 1213.46 SM TOP 1213.46
H621 H622 3336.4 1570.4 1213.57 CEIL 1221.07 BP2 1217. 7,2 BP 1216.22 BPl 1215.37 F (CLAY) 1203.27
H620 H621 3369.5 1607.8 1212.57 CEIL 1220.07 BP2 1217.57 BPl 1215.62 FLOOR 1202.07

H619 H620 3408.6 1638.4 1212.57 CEIL 1219.57 BP 1216.47 BPl 1215.57 F (CLAY) 1200.57
D619 H6I9 3408.6 1638.4 1213.02 SM TOP 1213.02 H6I8 H6I9 3440.2 I633.l I2I2.57 BPI I2I5.82
CEIL I219.82 BP 1212.37 F (CLAY) 1200.07
H6I7 H6I8 3468.9 I659.9 1212.57 CEIL 1220.07 BP2 1217.77 BPI 1215.67 WIDEST 12I2.07 F (CLAY) 1198.07
H616 H617 3504.6 1677. 3 I212.57 CEIL 1221.67 BP2 1218.42 BP 1217.07 BPl 1215.97 WIDEST 1211. 77 F (CLAY) 1198.07
H615 H616 3522.7 1695.1 1212.57 CEIL I221.27 BPl 12I6.47 WIDEST 1211.57 F (CLAY) 1197.57
H614 H615 3558.8 1728.7 1211. 57 CEIL 1218.17 BP2 1218.17 BPl 1216.27 WIDEST 1211.57 F (CLAY) 1179.57
H613 H614 3576.2 1725.0 1211.57 CEIL 1220.27 BPl 1216.57 WIDEST 1212.27
H612 H613 3585.() 1753.7 1211. 57 LEDGE 1210.07 PVC TOP 1194.37 STREAM 1166.00 FLOOR ·1164.57
0612 H612 3585.0 1753.7 1208.51 SM TOP 1208.51
H611 H612 3598.1 1775.5 1212.57 CEIL 1222.57 BPl 1216.57 LEDGE 1210.67 F (CLAY) 1166.97
D72 H611 3639.6 1803.5 1211. 57 SM TOP 1211.57
H827 H401 1818.8 677.9 · 122i. 05
H828 H827 1811.0 680.9 1228.05 DOME CEIL 1236.55 CEIL .1230.55 DL20/DS20 1230.55 DS17/Ll6 S 1228.25 DS17/Ll6 N 1227.95 DS17/Ll6 E 1227.55
H829 H828 1762.2 686.8 1228.05 CEIL 1231.50 DS21/DL20 1231.50 DL20/DS20 1230.65 F (BD) 1224.05 DS17/DL16 1227.70
~ H830 H829 1715. 2 689.3 1228.05 CEIL 1233.45

DL23/DS23 1233.45 DS17/DL16 1226.90 FLOOR 1224.35
H831 H830 1669.0 695.0 1229.05 CEIL 1232.95 DS17/DL16 1226.80 FLOOR 1225.05
H832 H831 1635.0 698.6 1229.05 CEIL 1234.95 DS17/DL16 1226.35 F (BD) 1226.35
H833 H832 1586.8 701.9 1228.05 CEIL 1228.70 DL20/DS20 1228.70 DS17/DL16 1225.75 F (BD) 1224.75
H834 H833 1513.5 704.5 1227.05 CEIL 1227.85 DL20/DS20 1227.85 DS17/DL16 1224.95 MUCK TOP. 1224.05 F (BD) 1223.05
H835 H370 1282.8 221.8 1215.05 CEIL 1215.75 DL6/DS6 1215.75 F (BO) 1213.05
H836 H835 1264.1 225.4 1213.05 CEIL 1214.65 DL5/DS5 1214.65 DS4/DL3 1213.65 F (BO) 1212.05
H837 H836 1241.1 229.9 1213.05 CEIL 1213.85 DL4/DS4 1213.85
( DS1/DT4 1211.45 F (SILT) 1207.35
H838 H837 1232.5 228.2 1208.05 CEIL 1211.55 BP3 1209.75 F (SILT) 1206.55
H839 H838 1211.4 232.3 1208.05 CEIL 1208.85 F (SILT) 1205.25
H840 H839 1180.8 241.6 1208.05 C POCKET 1216.55 CEIL 1212.95 DS3/DL2 1212.35 DS1/DT4 1209.95 WAVY BP 1207.85 STREAM 1171.55 FLOOR 1170.55
R72 072 3639.6 1803.5 1210.75 CEIL 1223.87 LEDGE 1210.75
T73 R72 3659.7 1818.1 1213.37 R74 T73 3684.6 1812.4 1210.28 CEIL 1219.30
BPl 1217.33
T75 R74 3722.3 1847.6 1215.04
R76 T75 3743.5 1863.8 1210.71 C POCKETS 1222 .. 19 CEIL 1219.67 BPl 1217.99
T77 R76 3781. 5 1888.5 1212.58
R77 T77 3781. 5 . 1888.5 1212.58
( D77 R77 3781. 5 1888~5 1213.76 POPC BOT 1213.76
\': R78 T77 3762.1 1892.4 1209.39 CEIL 1217.66 BPl 1217.26

BP 1211. 59 T79 R78 3715.6 1901. 9 1211. 31 R80 T79 3696.8 1940.5 1206.56 CEIL 1216.08
BPl 1216.11 BP 1211. 29
T81 R80 3728.8 1962.1 1211.80 R82 T81 3716. l 1991. 3 1210.77 BP2 1218.19
BPl 1216.61 BP 1211. 33
T83 R82 3728.6 1998.1 1219.72 R84 T83 3734.9 1998.5 1217.59 BP3 1221.33 T85 R84 3737.7 2005.5 1225.81 S86 T85 3745.3 2005.3 1221.60 BP3 1221.60
0Sl/OT4 1223.27 OL2/0S2 1223.86 OL3/0S3 1224.68 OL4/0S4 1225.54 OL5/0S5 1226.27 OL6/0S6 1226.95 SP CEIL 1229.28
S87 T85 3785.9 1996.6 1225.39 OL4/0S4 1226.18 OL9/0S9 1230.41 OL10/0S10 1231.56 CEIL 1235.24
S8S TS5 3772.5 1990.4 1222.96 oss SSS 3772.5 1990.4 1225.47 BO TIP 1225.47 RS9 TS5 3763.3 2032.5 1217.9S CEIL 1228~07
OL3/0S3 1224.71 ( BP3 1221.66
T90 R89 3812.5 2062.6 1225.30 S91 T90 3S05.2 2054.2 1218.99 091 S91 3S05.2 2054.2 1219.71 POOL LEVEL 1219.71 R92 T90 3S24.l 2072.9 1224.42 CEIL 1231.SO
OS3/0L2 1226.03 T93 R92 3S67.2 2107.1 1229.18 R94 T93 3923.6 2094.1 1225. 44 . CEIL 1232.50 T95 R94 399S.S 2079.5 1229.14 S96 T95 39S9.7 207S.O 1224.91 OS3/0L2 1226.89 R97 T95 4054.3 2120.0 1225.S4 CEIL 1233.39
OS3/0L2 1227.75 T9S R97 4076.l 2137.1 1230.0S R99 T98 40S4.0 2153.7 1229.42 099 R99. 40S4.0 2153.7 1231.S3 CHIP TOP 1231.83 RlOO 088 3772.5 1990.4 1222.43 TlOl RlOO 3S37.l 1991.5 1229.S3 Rl02 TlOl 3S92.4 1991.5 1225.97 .OS10/0L9 1232.79
OS9/0L8 1231.5S Tl03 Rl02 3939.3 1978.1 1230.43 Sl04. Tl03 3908.8 1991.0 1222.87 0104 Sl04 3908.S 1991. 0 1227.15 CHIP TOP 1227.15 Rl05 Tl03 3981. 5 1976.6 1224.21 OL10/0S10 1234.06 Tl06 Rl05 4002.4 1971. 4 1225.98 Rl07 Tl06 4065.8 1965.9 1219.73 CEIL 1232.20
BP3 1222.55
~. Tl08 Rl07 4078.9 1963.S 1221.24

Rl09 Tl08 4102.5 1963.6 1215.10 CEIL 1227.57 BP3 1222.98
TllO Rl09 4127.2 1963.2 1216.75 Slll TllO 4109.7 1941. 5 1210.07 Dlll Slll 4109.7 1941. 5 1216.67 PEND TIP 1216.67 Rll2 TllO 4195.1 1961.4 1212.13 CEIL 1226.89
BP! 1222.30 BP 1213.11
Tll3 Rll2 4275.9 1960.0 1215.91 Rll4 Tll3 4364.6 1955.3 1211.62 CEIL 1231.31
BP 1214.31 Tll5 Rll4 4435.4 1960.3 1216.80 Rll6 Tll5 4507.4 1955.2 1212.39 BP 1215.18
Tll7 Rll6 4607.l 1958.7 1219.02 Rll8 Tll7 4706.8 1955.2 1214.74 CEIL 1231.15
BP! 1224.58 BP 1216.45
0118 Rll8 4642.0 1960.9 1216.83 ELBOW BOT 1216.83 Tll9 Rll8 4737.7 1906.6 1219.36 Rl20 Tll9 4785.7 1896.4 1215.64 BPl 1223.19 Tl21 Rl20 4832.7 1895.6 1220.18 Rl22 Tl21 4908.1 1886.4 1214.15 CEIL 1227.27
Tl23 Rl22 4966.2 1874.0 1217.05 Sl24 Tl23 4964.3 1879.8 1213.31 Dl24 Sl24 4964.3 1879.8 1216.53 WALL DOT 1216.53
Rl25 0124 4964.3 1879.8 1213.37 Tl26 Rl25 4977.9 1870.l 1216.53 Rl27 Tl26 5008.4 1872. 7 1211.87 POOR BP 1215.78
BP 1213.28
Tl28 Rl27 5074.6 1910.2 1216.64 Rl29 Tl28 5110.8 1896.6 1211. 78 CEIL 1226.22
BIOSPARITE 1219.72 POOR BP 1216.24
Tl30 Rl29 5127.4 1864.0 1214.57 S131 Tl30 5107.8 1885.8 1211. 43 0131 Sl31 5107.8 1885.8 1214.89-· SM TOP 1214.89
R132 Tl30 5179.1 1859.5 1210.00 POOR BP/XT 1216.17
Tl33 Rl32 5228.0 1853.5 1214.43 Rl34 Tl33 5270.3 1848.3 1209.07 BP= SPAR 1219.57
BP= SPAR 1216.92
Tl35 R134 5295.3 1801. 4 1213.30 8136 Tl35 5302.7 1798.7 1208.13 0136 Sl36 5302.7 1798.7 1213.32 BD TOP 1213.32
Rl37 Tl35 5353.6 1799.4 1209.16 CEIL 1225.56 D/S 1225.56 LOW SPAR 1217.23 SED TOP 1212.37
Tl38 Rl37 5384.0 1790.6 1211.54 Rl39 Tl38 5397.7 1753.0 1205.09 C SLOT 1221.83
CEIL 1218.55 LOW SPAR 1216.91
Tl40 Rl39 5456.l . 1751. 0 1211. 69 Rl41 Tl40 5512.5 1749.0 1207.16 CEIL 1220.28
LOW SPAR S 1217.99 LOW SPAR N 1217.33

Tl42 Rl41 5549.7 1747.7 1212.52 Rl43 Tl42 5555.3 1730.5 1210.71 CEIL 1222.20
UPPER SPAR 1218.75 LOW SPAR 1216.62
Tl44 Rl43 5615.2 1729. 4 1219.04 Rl45 Tl44 5645.4 1729.4 1214.73 FLAT CEIL 1222.60
BP 1220.17 SEO TOP 1220.14
0145 Rl45 5645.4 1729. 4 1218.09 SM TOP 1218.09 Sl46 Tl44 5631.5 1739.8 1213.87 0146 8146 5631.5 1739.8 1216.82 ELBOW TOP 1216.82 Rl47 088 3772. 5- 1990.4 1223.04 Tl48 Rl47 3739.9 2005.6 1225.68 Rl49 Tl48 3685.9 2002.8 1218.23 OS3/DL2 1224.41
DLl/081 1222.76 Tl50 Rl49 3618.8 2006.3 1223.23 Rl51 Tl50 3580.9 2010.0 1221.74 CEIL 1232.76
OL9/DS9 1227.96 Tl52 R151 3526.3 2017.6 1225.43 Rl53 Tl52 3457.5 2020.0 1220.67 CEIL 1229.86
OL12/DS12 1229.86 OL9/DS9 1226.15
Tl54 Rl53 3399.7 2025.1 1223.73 Rl55 Tl54 3348.2 2026.0 1219.41 CEIL 1228.10
OL9/0S9 1224.56 Tl56 Rl55 3294.3 2031.7 1225.28 8157 Tl56 3325.9 2027.2 1219.95
( Dl57 8157 3325.9 2027.2 1221.13 FLAGGING 1221.13 Rl58 Tl56. 3228.8 2035 .• 1 1219.69 CEIL 1229.77
DL9/D89 1223.01 Tl59 Rl58 3164.5 2032.8 1223.63 Rl60 Tl59 3110.1 2036.2 1220.25 OL10/DS10 ·1222.61
CEIL 1228.45 Tl61 Rl60 3066.3 2040.0 1226.36 Sl62 Tl61 3064.2 2044.1 1223.21 CEIL 1231.58 Rl63 Tl61 3038.7 2039.8 1217.57 CEIL 1227.74
OLlO/DSlO 1222.20 Tl64 Rl63 3003.4 2038.5 1226.49 Rl65 Tl64 2954.5 2038.5 1220.03 CEIL 1226.95
OS14/DL13 1226.95 Tl66 Rl65 2892.5 2048.3 1223.91 Sl67 Tl66 2930.9 2045.0 1219.73 Dl67 8167 2930.9 2045.0 1220.10 SM TOP 1220.10 Rl68 Tl66 2844.5 2046.7 1221.84 OS14/0L13 1225.68 Tl69 Rl68 2818.3 2048.5 1224.77 Rl70 Tl69 2793.8 2052.8 1224.55 CEIL 1229.01
OL17/DS17 1229.01 OL16/0S16 1227.87. OL15/0S15 1227.01
Tl71 Rl70 2729.0 2054.5 1226.05 Rl72 Tl71 2653.8 2057.1 1223.12 CEIL 1227.17
DL17/DS17 1227.17 OL16/0S16 1226.14 OL15/0S15 1224.89
\ Tl73 Rl72 2614.9 2064.0 1223.72

Rl74 Tl73 2603.0 2061. 9 1221. 99 DL15/DS15 1224.54 Dl74 Rl74 2603.0 2061.9 1225.07 SM-ST TOP 1225.07 Dl75 Rl74 2603.0 2061. 9 1224.39 STAL TIP 1224.39 Sl75 Tl73 2634.7 2062.6 1220.70 CONE TOPS 1219.78 Rl76 0157 3325.9 2027.2 1219.80 Tl77 Rl76 3280.9 2030.0 1225.51 Sl78 Tl77 3271. 8 2029.1 1222.73 Dl78 Sl78 3271. 8 2029.1 1222.80 RADIO LOC 1222.80 Rl79 077 3781. 5 1888.5 1209.46 Tl80 Rl79 3792.9 1884.2 1213.75 Rl81 Tl80 3833.1 1882.8 1210.18 C FISSURE 1224.94
BPl 1218.02 Tl82 Rl81 3916.l 1868.2 1214.08 Rl83 Tl82 4011. 4 1859.8 1209.64 CEIL 1219.49
SPAR BED 1215.29 Tl84 Rl83 4048.4 1856.9 1213.86 Rl85 Tl84 4070.9 1864.9 1210.43 CEIL 1219.94
BP! 1219.94 SPAR BED 1216.30
Tl86 Rl85 4053.6 1897.5 1214.46 Sl87 Tl86 4055.4 1902.4 1210.57 Dl87 Sl87 4055.4 1902.4 1213.32 SM TOP 1213.32 Rl88 T186 4085.8 1926.5 1210.13 CEIL 1223.26
SPAR BED 1215.64 Tl89 Rl88 4107.5 1938.0 1214.21 Rl90 Tl89 4117 .1 1944.5 1210.06 Dlll Rl90 4117 .1 1944.5 1216.68 PEND TIP 1216.68 Rl91 Dl04 3908.8 1991.0 1222.45 DS9/DL8 1231.73 Tl92 Rl91 3935.9 2011.0 1225.19 Rl93 Tl92 3945.1 2020.6 1224.58 Tl94 Rl93 3965.5 2026.5 1231.02 Sl95 Tl94 3957.1 2022.5 1228.69 CEIL 1241. 49
DL10/DS10 1233.56 R19G Tl94 4003.1 2025.8 1230.83 CEIL 1241.99
DL10/DS10 1234.28
T197 Rl96 4038.8 2021.7 1238.67 5198 Tl97 4029.1 2022.4 1236.62 CEIL 1245.48
R199 Tl97 4046.8 2021.5 1231.03 T200 Rl99 4052.4 2018.9 1231.68 R201 T200 4115.1 2010.7 1230.01 DL10/D510 1235.65
T202 R201 4155.9 2000.9 1237.23 R203 T202 4172.3 1998.7 1235.45 FLAT CEIL 1244.17
SHELF ST 1241.50
D203 R203 4172. 3 1998.7 1240.10 SM TOP 1240.10
T204 R203 4245.1 1985.9 1239.19 5205 T204 4240.6 1989.9 1236.59 CEIL 1243.06
LAKE LEVEL ·1226.62 CONE TOP 1229.85
D205 5205 4240.6 . 1989.9 1239.72 RAIL TOP 1239.72
R206 T204 4287.3 1978.4 1234.08 CEIL 1241. 40 DL10/D510 1237.41
T207 R206 4315.1 1974.5 1234.96 R208 T207 4329.9 1974.8 1229.83 CEIL 1236.65
DL9/DS9 1236.65
T209 R208 4411. 7 1969.1 1231.77

R210 T209 4403.2 1982.8 1223.01 CEIL 1235.21 BP2 1225.53
T211 R210 4384.3 2012.9 1224.72 R212 T211 4393.9 2017.6 1221.68 CEIL 1230.76
SED TOP 1228.89 BP2 1225.09
T213 R212 4426.0 2012.8 1223.97 R214 T213 4460.3 2023.2 1220.08 CEIL 1227.40
BP2 1225.22 T215 R214 4510.2 2016.2 1222.71 R216 T215 4541. 3. 2010.8 1220.14 CEIL 1226.27
BP2 1224.14 T217 R216 4552.8 2018.3 1223.35 R218 T217 4579.7 2015.7 1221.06 CEIL 1231.56
BP3 1228.87 BP 1225.64 BP2 1224.22
T219 R218 4589.1 2021.1 1226.80 R220 T219 4606.6 1971.6 1223.26 C 4TH AVE 1234.91
SED TOP 1230.05 BP 1226.12 BP2? 1224.81 BPI 1224.05
T221 R220 4615.5 1969.7 1224.33 R222 T221 4642.2 1962.0 1214.74 Dll8 R222 4642.2 1962.0 1216.83 ELBOW BOT 1216.83 R223 Dl24 4964.3 1879.8 1213.18 BP 1218.49
( T224 R223 4942.1 1923.4 1218.85 R225 T224 4931.4 1941.1 1218.04 CEIL 1227.23
BP2 1227.23 BP 1218.38
T226 R225 4929.9 1945.4 1225.10 R227 T226 4923.5 1942.9 1224.92 DS1/DT4 1231.71
SED TOP 1235.42 T228 R227 4917.2 1944.2 1233.54 R229 T228 4913.8 1946.9 1233.23 CEIL 1243.57
DL10/DS10 1239.96 T230 R229 4910.4 1948.4 1239.69 R231 T230 4905.3 1950.S 1239.33 CONCR C 1249.82 T232 R231 4896.4 1952.3 1248.75 R233 T232 4894.3 1957.3 1248.69 0233 R233 4894.3 1957.3 1250.49 BLDG FLOOR 1250.49 R234 0233 4894.3 1957.3 1249.95 T235 R234 4909.3 1967.0 1255.27 R236 T235 4933.0 1999.0 1255.09 T237 R236 4971.3 2037.3 1264.16 R238 T237 5008.7 2078.9 1261.54 T239 R238 5062.8 2114.0 1263.75
"R240 T239 5110.7 2115.3 1259.69 D240 R240 5110.7 2115.3 1264.61 POST TOP 1264.61
T241 R240 5083.9 2082.8 1268.87 R242 T241 5066.1 2076.0 1267.32 T243 R242 5052.0 2055.8 1276.21
\ R244 T243 5031.8 2049.1 1271. 92 D244 R244 5031.8 2049.1 1272.60 BMlS=NAIL 1272.60

Hl Dl74 2535.0 2072. 0 1222.07 CEIL 1232.07 DS16/DL15 1225.32 FLOOR 1221. G7
H2 Hl 2555.0 2091.0 1223.07 CEIL 1224.G2 LOW CEIL 1222.G7 SPAR TOP 1221.77
H3 H2 2585.0 2116.0 1223.07 RST TOP 1222.57 WL 8-7-91 1222.17 CONE TOPS 1222.37 LAKE BOT 1218.87
H4 H3 2619.0 2150.0 1228.07 CEIL 1232.07 F (FST) 1226.37
HS H4 2594.0 2170.0 1228.07 CEIL 1228.97 DL17/DS17 1225.82 FLOOR 1223.17
HG HS 2427.0 2180.0 1228.07 CEIL 1231. 47 DL17/DS17 122?.87 FLOOR 1225.57
H7 HG 2299.0 2195.0 1222.07 CEIL 122G.52 DL17/DS17 1223.12
H8 H7 2255.0 2195.0 1217.07 FLOOR 1211.07 08 H8 2255.0 2195.0 1211.88 SM TOP 1211.88
H9 H8 2201.0 2200.0 1215.07 09 H9 2201.0 2200.0 1212.09 DOT ON BD 1212.09
HlO H9 2102.0 2214.0 1217.07 CEIL 1223.77 DL17/DS17 1221.57 F (BO) 1212.07
(l Hll HlO 2063.0 2219.0 1202.07 DS1/DT4 1199.87 BP3 1199.30 F (MUD) 1195.27
H36 Hll 2014.0 2234.0 1216.07 CEIL 1221.87 DL17/DS17 1220.87 F (MUD) 1213.72
Hl2 H36 1837.0 2259.0 1216.07 CEIL 1224.57
012 Hl2 1837.0 2259.0 1212.76 CAIRN TOP 1212.76
Hl3 Hl2 1777.0 22G8.0 1206.07 -OS10/DL9 1211.07 FLOOR 1201.07
013 Hl3 1777.0 2268.0 1204.80 SSTRAW TIP 1204.80
Hl4 Hl3 1778.0 2271.0 1203.07 SP CEIL 1206.27
Hl5 Hl4 1807.0 2293.0 1200.07 CEIL 1205.47 BP 1198.37 CRAWL CEIL 1198.37 FLOOR 1195.37
HlG HlS 1871.0 2313.0 1198.07. CEIL 1204.07 DLl/DSl 1200.47 BP3 1198.77 BP2 1196.57 F (S+G) 1191. 57.
Hl7 Hl6 1925.0 2347.0 1198.07 CEIL 1200.57 BP 1199.07 D/S 119G.97 ROCK TOP 1192.57 STREAM 1170.07
,! Hl8 Dl3 1728.0 2278.0 1206.07 DS10/DL9 1209.92 ,I
\' F (SAND) 1203.22

Hl9 Hl8 1610.0 2293.0 1226.07 CEIL 1229.57 F (BD) 1224.07
019 Hl9 1610.0 2293.0 1224.72 STAL TIP 1224.72 H20 09 2201.0 2200.0 1215.07 DS10/DL9 1212.96 H21 H20 2250.0 2239.0 1210.07 CEIL 1219.37
F (BO) 1207.07 H22 H21 2319.0 2288.0 1208.07 CEIL 1215.47
DS10/DL9 1213.07 FLOOR 1203.07
H23 H22 2378.0 2337.0 1203.07 D/S 1198.67 FLOOR 1196.57
H24 H23 2462.0 2327.0 1201.07 CEIL 1211.07 D/S 1198.47 F (BO) 1195.57
H25 H24 2575.0 2421.0 1201.07 WATER LEV 1169.57 FLOOR 1167.07
H26 H25 2580.0 2421.0 1202.07 BP3 1201. 97 BP 1200.72 D/S 1199.27
H27 H26 2619.0 2416.0 1205.07 CEIL 1210.87 DS2 1208.17 DS1/DT4 1207.07 BP3 1205.22 WATER LEV 1202.27
H28 D8 2240.0 2180.0 1215.07 DL10/DS10 1213.47 H29 H28 2147.0 2101.0 1215.07 CEIL 1218.87
DL10/DS10 1212.67
( F (BD) 1211.27
H30 H29 2043.0 2126.0 1219.07 CEIL 1223.97 DS17/DL16 1220~77
FLOOR 1213.87
H31 H30 1748.0 2150.0 1209.07 CEIL 1219.57 SEO TOP 1215.87 DL10/DS10 1210.17 F (SAND) 1206.07
D31 H31 1748.0 2150.0 1206.44 RADIO LOC 1206.44
H32 H31 1709.0 2111.0 1210.07 CEIL 1215.07 FLOOR 1207.07
H33 H32 1659.0 2077.0 1210.07 DOME CEIL 1223.07 C 6TH.AVE 1216.47 SEO TOP 1214.77 DSll/DLlO 1209.73 F (SAND) 1208.07
H34 H33 1556.0 1993.0 1212.07 HIGH CEIL 1218.77 BD TIP 1210.35 THRESHOLD 1209.92 DL10/DS10 1209.47 F (SAND) 1208. 5,2
H35 H34 1526.0 1958.0 1213.07 CEIL 1217.37 DL10/DS10 1209.07 F (MUD) 1208.33
R795 088 3772.5 1990.4 1222.41 T796 R795 3755.6 . 1999.4 1225.31 R797 T796 3735.9 2009.0 1223.18 D797 R797 3735.9 2009.0 1224.28 BM + 1224.28

R852 01 o.o 0.0 1229.40 T853 R852 13. 2 9.8 1233.04 R854 T853 -25.6 63.1 1229.23 T855 R854 -66.8 115.9 1233.69 R856 T855 -95.5 185.l 1228.91 T857 R856 -133.4 239.2 1233.29 R858 T857 -176.2 282.8 1228.94 T859 R858 -227.7 318.2 1232.22 R860 T859 -282.2 316.8 1226.54 0861 R860 -282.2 316.8 1228.36 + ON ROCK 1228.36 R862 01 o.o o.o 1229.40 T863 R862 15.9 -53.7 1232.85 R864 T863 7.1 -120.5 1228.42 T865 R864 -1.6 -190.9 1233.50 R866 T865 -13.l -253.2 1228.49 T867 R866 -17.0 -317.7 1231.71 R868 T867 28.8 -323.3 1227.38 T869 R868 41.4 -320.l 1236.61 R870 T869 48.7 ...;326. l 1235.25 T871 R870 55.7 -334.9 1244.77 R872 T871 58.2 -327.7 1240.86 0873 R872 58.2 -327.7 1244.41 + AT ENT 1244.41
R874 T871 39.9 -350.4 1235.87 T875 R874 28.7 -392.2 1244.65 R876 T875 33.l -388.5 1243.46 T877 R876 45.0 -396.4 1253.26 R878 T877 58.0 -401.l 1252.56 0879 R878 58.0 -401.l 1254.95 + AT ENT 1254.95
R880 0205 4240.6 1989.9 1236.74 T881 R880 4247.4 1987.4 1239.55 S882 T881 4215.0 1991.4 1236.14 0883 8882 4215.0 1991.4 1239.19 RAIL TOP 1239.19
S884 T881 4210.5 1992.6 1236.01 0885 8884 4210.5 1992.6 1239.01 RAIL TOP 1239.01
LAKE LEVEL 1233.21
R886 T881 4280.6 1978.5 1234.85 T887 R886 4305.9 1975.0 1236.37 8888 T887 4298.8 1976.8 1233.07 TOP SEEP 1233.28
LOWER SEEP 1233.12
R889 0240 5110. 7 2115.3 1259.94 T890 R889 5143.8 2059.0 1269.59 R891 T890 5207.9 2017.4 1267.12 T892 R891 5275.0 1990.3 1271.76 R893 T892 5338.5 1960.0 1267.71 T894 R893 5408.4 1931.0 1271.47 R895 T894 5514.3 1881.7 1266.79 T896 R895 5577.4 1856.1 1271. 00 R897 T896 5653.0 1824.0 1266.94 0898 R897 5653.0 1824.0 1271.57 POST TOP 1271.57
T899 R897 5696.4 1792.5 1273.09 R900 T899 5696.9 1739.8 1272.98 T901 R900 5695.9 . 1685.l 1282.55 R902 T901 5696.9 1647.7 1282.21 T903 R902 5695.1 1596.l 1291. 84 R904 T903 5695.6 1564.7 1291. 74

T905 R904 5694.5 1521. 2 1300. 71 R906 T905 5694.2 1483.6 1300.57 T907 R906 5692.3 1431.5 1309.37 R'108 T907 5694.1 1365.0 1309.32 T909 R908 5694.1 1307.1 1314.46 R910 T909 5698.5 1205.3 1310.03 T911 R910 5700.0 1147.8 1315.98 R912 T911 5703.6 1065.3 1315.55 T913 R912 5706.2 1016.7 1323.31 R914 T913 5709.1 968.7 1323.25 T915 R914 5712.3 923.3 1331.80 R916 T915 5714.4 874.3 1331.79 T917 R916 5717.0 825.1 1340.66 R918 T917 5718.6 779.6 1340.52 T919 R918 5721.0 733.5 1349.18 R920 T919 5724.2 659.9 1349.09 T921 R920 5727.4 598.3 1353.77 R922 T921 5733.2 515.5 134.6 .10 T923 R922 5733.2 458.6 -1347.78 R924 T923 5736.1 376.5 1340.77 T925 R924 5735.0 314.7 1343 .• 55 R926 T925 5737. 3 - 227.2 1337.77 T927 R926 5739.3 169.2 1340.59 R928 T927 5740.1 87.5 1332.07 T929 R928 5742.0 43.3 1333.55 R930 T929 5742.6 -30.2 1324.86 T931 R930 5742.0 -98.7 1326.19 R932 T931 5736.1 -183.8 1320.10 D932 R932 5736.1 -183.8 1324.12 BOLT TOP 1324.12 T933 R932 5770.4 -242.1 1323.41 R934 T933 5821. 4 -296.7 1317.99 T935 R934 5856.7 -338.0 1322.30 R936_ .. T935 5913.8 -389.4 1318.99 T937 R936 5981. 5 -409.5 1324.06 R938 T937 6054.7 -352.3 1322.43 T939 R938 6112.4 -~14.1 1328.90 R940 T939 6195.4 -273.6 1326.52 T941 R940 6250.5 -255.2 1331.66 R942 T941 6340.5 -228.6 1328.77 T943 R942 6416.1 -219.9 1332.91 R944 T943 6460.2 -213.0 1329.77 T945 R944 6534.3 -213.0 1333.83 R946 T945 6610.3 -224.3 1326.98 D946 R946 6610.3 -224.3 1330.65 BOLT TOP 1330.65 R947 0946 6610.3 -224.3 1326.97 T948 R947 6675.6 -213.4 1333.28 R949 T948 6758.5 -209.0 1329.42 T950 R949 6830.3 -211.5 1332.90 R951 T950 6934.9 -208.8 1328.48 T952 R951 7009.5 -211.4 1332.46 R953 T952 7103. 2 -208.9 1327.89 T954 R953 7172.4 -208.3 1332.14 R955 T954 7277. 5 -197.3 1327.50
( T956 R955 7351. 7 -182.2 1331.45 R957 T956 7448.7 -148.8 1326.29

T958 R957 7521. 4 -117. 2 1330.24 R959 T958 7611. 3 -63.2 1324.74 T960 R959 7666.5 -21.6 1328.41 R961 T960 7734.7 42.0 1322.85 T962 R961 7784.0 96.8 1326.33 R963 T962 7841.7 172.0 1319.92 T964 R963 7879.8 235.4 1325.48 R965 T964 7914.6 315.5 1318.34 T966 R965 7940.4 379.4 1320.23 R967 T966 7966.9 450.0 1312.67 T968 R967 7994.9 519.5 1313.77 R969 T968 8025.6 599.3 1305.40 T970 R969 8051.3 668.2 1306.56 R971 T970 8081.1 743.9 1298.05 T972 R971 8105.8 811. 7 1299.27 R973 T972 8132.6 881.5 1291.68 T974 R973 8158.5 948.9 1292.94 R975 T974 8190.1 1023.4 1284.71 T976 R975 8217.9 1088.8 1285.96 R977 T976 8256.3 1162.6 1277.81 T978 R977 8291.7 1227.9 1278.92 R979 T978 8338.9 1303.3 1270.55 T980 R979 8379.0 1363.9 1271.94 R981 T980 8426.2 1427.7 1263.88 T982 R981 8470.9 1486.0 1265.26 R983 T982 8527.6 1546.7 1256.54 T984 R983 8577.8 1600.6 1257.86
(! 8985 T984 8593.5 1593.8 1249.36 DT4 PYRITE 1249.52
R986 T984 8637.1 1654.0 1249.29 T987 R986 8691.7 1700.6 1250.03 R988 T987 8730.7 1709.3 1240.58 BPl 1243.59
H900 091 3805.2 2054.2 1224.71 DS1/DT4 1223.79
H901 H900 3778.9 2054.9 1228.71 H902 H901 3756.3 2052.1 1228.71 DS10/DL9 1231.01
CEIL 1240.11 DL16/DS16 1240.11 F (BD) 1226.91
H903 H902 3729. 9 2058.7 1232.71 CEIL 1238.66 DL15/DS15 1238.66 F (BD) 1231.11 DS13/DL12 1235.61 DL13/DS13 1235.91 DL14/DS14 1236.66
H904 H903 3710.9 2061.7 1232.71 CEIL 1238.21 DL15/DS15 1238.21 DS10/DL9 1229.89 F (BD) 1227.21
H905 H904 3678.9 2066.2 1227.71 F (BD) 1223. 71
H906 H905 3662.9 2062.4 1227.71 DS10/DL9 1229.61 F (BD) 1222.71
0906 H906 3662.9 2062.4 1227.51 DOT 1227.51
H907 H906 3618.l 2071.9 1227.71 CEIL 1235.01 DL14/DS14 1235.01 DS10/DL9 1228.76 F (BD) 1223.21

MYSTERYL
STA FROM EAST NORTH VERTICAL FEET
H908 H907 3592.5 2075.1 1228. 71 CEIL 1234.81 DL14/DS14 1234.81 F (BD) 1228.21 RED SH 1228.11
H909 H908 3546.4 2080.0 1230. 71 CEIL 1234.21 DL14/DS14 1234.21 F (BD) 1229. 71
H910 H909 3497.0 2086.9 1230.71 CEIL 1231.46 DL12/DS12 1231.46 F (BD) 1227.71
H911 H910 3447.9 2093.0 1229. 71 CEIL 1230.91 DL12/DS12 1230.91 DS10/DL9 1226.61 F (BD) 1225.81
H912 H911 3399.0 2097.2 1229. 71 CEIL 1230.21 DL12/DS12 1230.21 F (BD) 1226.31
H913 H912 3371. 2 2099.7 1228.71 CEIL 1229.81 DL12/DS12 1229.81 F (CLAY) 1227.31
H914 H913 3326.l 2104.4 1227.71 CEIL 1229.01 DL12/DS12 1229.01 F (CLAY) 1225.91
H915 H914 3322.9 2104.6 1226.71 CEIL 1227.71 F (CLAY) 1224.31
H916 H915 3316.5 2105.8 1224.71 H917 H916 3282.0 2107.6 1224.21 C (BOXWK) 1224.91
F (MUD) 1223.51 H918 H917 3277.0 2108.1 1224.21 C=SHELFST 1225.61
F (CLAY) 1224.21 H919 H918 3277.0 ·2100.1 1227.61 H920 H919 3227.3 2118. 7-- 1227.61 CEIL 1229.61
DL14/DS14 1229.61 F (BD) 1225.81 SIDE F 1223.61
H921 H920 3188.0 2123.5 1227.61 CEIL 1228.86 DL14/DS14 1228.86 F (BD) 1226.11 NORTH F 1223.61
H922 H921 3156.2 2126.0 1227.61 CEIL ,1228.61 DL14/DS14 1228.61
H923 H922 3132.0 2131.6 1225.61 CEIL 1226.61 DL12/DS12 1226.61 WATER LEV 1225.21
H924 H923 3130.l 2132.0 1226.61 CEIL 1228.11 DL14/DS14 1228.11
H925 H924 3099.l 2138.9 1226.61 CEIL 1229.21 DL16/DS16 1229.21 DL14/DS14 1228.11
( F (BD) 1226.61 DEEP F 1224.11

H926 H925 3063.6 2147.1 1227.61 CEIL 1229.61 DL16/DS16 1229.61 F (BD) 1227.01
H927 H926 3047.5 2151.6 1227.61 CEIL 1229.51 DL16/DS16 1229.51 DL15/DS15 1228.76 F (BD) 1226.21
H928 H927 2997.5 2155.5 1226.61 CEIL 1227.21 DL14/DS14 1227.21 F (CLAY) 1223.41
H929 H928 2977 .6 2157.2 1226.61 CEIL 1227.11 DL14/DS14 1227.11 F (RST) 1223.61
0929 H929 2977.6 2157.2 1225.73 + ON WALL 1225.73 H850 D873 58.2 -327.7 1242.41 H851 H850 71.9 -340.7 1237.41 H852 H851 79.1 -334.9 1237.41 CEIL 1246.31
DL27/DS27 1238.98 F (BD) 1233.41
H853 H852 94.9 -339.l 1234.41 F (BD) 1230.41
H854 H853 105.0 -344.0 1227.41 F (BD) 1226.71
H855 H854 121.3 -345.7 1227.41 F (BD) 1222.91
H856 H855 126.6 -350.0 1223.41 CEIL 1226.01 F (BD) 1219.41
H857 H856 131.3 -348.6 1220.41 CEIL 1222.71 F (BD) 1215.91
H858 H857 137.3 -349.4 1216.41 CEIL 1222.71 DL14/DS14 1222.71
L DL13/DS13 1222.21 'I·
F (BD) 1211.41
H859 H858 141.7 -344.4 1212.41· DS4/DL3 1211.51 FLOOR 1208.91
H860 H859 146.? -325.7 1211.41 CEIL 1214.31 DL7/DS7 1214.31 F (MUD) 1206.91
H861 H860 191.8 .:.332.1 1211.41 CEIL 1214.11 DL7/DS7 1214.11 F (MUD) 1206.81
H862 H861 241.3 -337.3 1211.41 CEIL 1213.41 DS4/DL3 1211. 71 DS3/DL2 1210.66 DS2/DL1 1209.91 DS1/DT4 1209.31 F (MUD) 1206.91
H863 H862 278.0 -340.5 1211.41 CEIL 1213.51 DL6/DS6 1213.51 DS1/DT4 1209.41 SHELF TOP 1210.H F (MUD) 120.6.91
D863 H863 278.0 -340.S 1211.41 + ON WALL 1211. 41
H864 D863 287.1 -325.3 1210.41 CEIL 1212.76 DS4/DL3 1210.86 F (MUD) 1205.81
H865 H864 327.S -294.3 1210.41 CEIL. 1211.91
\ DLS/DSS 1211.91

DS3/DL2 1210.01 FLOOR 1205.91
H866 H865 368.7 -264.4 1210.41 CEIL 1213.41 DS3/DL2 1210.96 F (SAND) 1206.91
H867 H866 403.8 -242.5 1210.41 CEIL 1215.21 SHELF TOP 1208.21 DS1/DT4 1209.76 FLOOR 1206.21
D868 H867 403.8 -242.5 1209.26 BASIN TIP 1209.26 H869 H867 418.4 -234.0 1210.41 CEIL 1214.71
DS1/DT4 1209.56 SHELF TOP 1208.14 F (CLAY) 1207.01
H930 D99 4084.0 2153.7 1229.93 CRAWL CEIL 1231.73 DL8/DS8 1231.73 FLOOR 1229.33
H931 H930 4090.3 2169.0 1229.43 CEIL 1230.33 DL7/DS7 1230.33 F (BD) 1227.63
H932 H931 4089.7 2171. 7 1228.83 H933 H932 4090.5 2172.4 1228.83 H934 H933 4090.9 2173.4 1228.23 H935 H934 4091. 4 2188.9 1227.73 CEIL 1230.23
DL7/DS7 1230.23 LOW CEIL 1228.23 HIGH CEIL 1230.88 DL8/DS8 1230.88 F=BD+CLAY 1226.98
H936 H935 4098.7 2193.4 1228.73 CEIL 1233.13 DL7/DS7 1230.08 FLOOR 1228.43
H937 H936 4103.1 2199.0 1229.73 FLOOR 1226.73 H938 H937 4112.1 2201. 9 1230.33 H939 H938 4144.4 2195.3 1231.63 DS10/DL9 1233.53
F (BD) 1227.13 H940 H939 4174.6 2226.1 1231.63 DL10/DS10 1234.83
LOW CEIL 1232.53 DL8/DS8 1232.53 F=BD+CLAY 1227.13
H941 H940 4193.3 2239.6 1231.63 DS10/DL9 1233.98 F (BD) 1230.63
H942 H941 4198.2 2243.8 1233.63 H943 H942 4211.4 2244.2 1233.63 DL9/DS9 1233.78
F (BD) .1231.13 D943 H943 4211.4 2244.2 1231.26 SM TOP 1231.26 H944 H943 4215.0 2252.8 1232.53 DL8/DS8 1233.98
F=BD+CLAY 1228.13 H945 H944 4249.8 2287.0 1229.33 CEIL 1233.06
DL8/DS8 1233.06 F (CLAY) 1228.33
H946 H945 4231.8 2297.4 1230.03 CEIL 1231.63 DL7/DS7 1231.63 F=BD+CLAY 1227.73
D947 H946 4231.8 2297.4 1229.91 + ON WALL 1229.91

H948 H946 4247.1 2309.2 1228.53 CEIL 1229.83 DL5/DS5 1229.83 F (CLAY) 1226.93
H949 H948 4267.4 2310.8 1227.63 CEIL 1230.23 DL5/DS5 1230.23 DS1/DT4 1226.66 F (CLAY) 1225.63
H950 H949 4282.7 2319.1 1227.63 CEIL 1230.88 DD6/DS6 1230.88 F (CLAY) 1226.83
H951 H950 4293.9 2325.2 1230.63 CEIL 1232.08 DL7/DS7 1232.08 F=BD+CLAY 1229.63
H952 H951 4329.5 2358.3 1231.03 CEIL 1232.93 DL8/DS8 1232.93 F (CLAY) 1229.13 F SLOT 1216.03
H953 H952 4350.6 2366.6 1232.03 CEIL . 1233. 23 DL9/DS9 1233.23 F (CLAY) 1231.53
H954 H953 4373.5 2354.5 1231.03 PIT FLOOR 1210.63 BD/SED 1231.43
0954 H954 4373.5 2354.5 1230.54 SM TOP 1230.54
0955 H954 4373.5 2354.5 1233.94 CEIL DOT 1233.94
H955 0947 4208.5 2295.9 1229.91 CEIL 1231.11 DL7/DS7 1231.11
H956 H955 4204.l 2297.4 1225.91 DS1/DT4 1226.26 F (CLAY) 1220.61
I H957 H956 4198.3 2297.9 1219.91 CEIL 1222.21 I I
FLOOR 1218.51
H958 H957 4172.5 2302.4 1219.91 CEIL 1221.11 BP 1221.11 BPl 1219.51 WAVY BP 1218.71
H959 H958 4158.3 2305.2 1217.91 CEIL 1220.31 BP 1220.31 BPl 1219.21 FLOOR 1212.51
H960 H959 4147.1 2301.6 1215.91 CEIL 1220.21 BPl 1219.11 F (CLAY) 1210.71
H961 H960 4098.0 2309.8 1213.91 CEIL 1219.81 BPl 1218.41 F (CLAY) 1209.81
H962 H961 4079.8 2313.2 1213.91 CEIL 1219.31 BP! 1218.11 FLOOR 1210.61
0962 H962 4079.8 2313.2 1216.46 ARROW TIP 1216 .• 46
H963 H962 4070.9 2333.3 1213.91
H964 H963 4068.4 2342.2 1213.91 CEIL 1218.41 FLOOR 1210.81
H965 H964 4057.7 2362.2 1211. 61 CEIL 1215.61 FLOOR 1209.61
H966 H965. 4053.0 2374.l 1211.61 CEIL 1216.51 FLOOR 1210.86

H967 H966 4043.5 2390.0 1213.61 CEIL 1215.91 FLOOR 1210.91
H968 H967 4016.4 2381. 9 1211.61 CEIL 1215.21 FLOOR 1210.71
H969 H968 4002.5 2378.3 1211.61 CEIL 1213.61 FLOOR 1210.41
H970 H969 3994.1 2381.6 1211.61 CEIL 1213.61 F (CLAY) 1210.61
H971 H970 3976.4 2384.2 1211.61 CEIL 1213.61 F (CLAY) 1210.61
H972 H97.l 3960 •. 7 2386.7 1211.61 CEIL 1213.61 F (CLAY) 1210.51
H973 H972 3941.8 2388.7 1211.61 CEIL 1214.11 F (CLAY) 1210.51
H974 H973 3925.8 2391.7 1211.61 CEIL 1214.11 F (CLAY) 1210.41
H975 H974 3908.4 2394.7 1211.11 CEIL 1213.21 F (CLAY) 1209.81
H976 H975 3898.2 2397.6 1210.61 CEIL 1213.41 F (CLAY) 1209.51
H977 H976 3888.6 2401.8 1210.61 CEIL 1213.81 BP 1213.66 F (CLAY) 1207.11
H978 H977 3880.2 2401.8 1207.61 C = BP 1213.41 BP 1209.26 FLOOR 1203.41
0978 H978 3880.2 2401.8 1209.21 WALL DOT 1209.21
( H979 H978 3858.0 2404.6 1207.61 CEIL 1212.71 BP 1209.11 F (CLAY) 1204.21
H980 H979 3841.3 2399.0 1208.61 CEIL 1212.91 BP 1208.91 FLOOR 1204.41
H981 H980 3824.0 2403.9 1209.61 CEIL 1213.11 BP 1208.71 FLOOR 1204.81
H982 H981 3776.8 2411.8 1209.61 CEIL 1213.31 BP (POOR) 1208.36 BP 1212.56 F (CLAY) 1204.51
H983 H982 3727 .1 2417.1 1209.61 CEIL 1212.31 BP 1211.81 F (CLAY) 1205.01
H984 H983 3697.8 2420.4 1209.61 CEIL (BP) 1212.31 BP 1211.46 MUCK TOP 1206.51 F (CLAY) 1205.11
H985 H984 3676.9 2424.8 1209.61 CEIL (BP) 1212.01 BP (WAVY) 1211.06 FLOOR 1205.31
H986 H985 3642.1 2412.9 1209.61 CEIL 1212.11 WAVY BP 1210.71 BP 1211. 71
\, F=SILT 1204.91
H987 H986 3624.2 2412.5 1209.61 CEIL 1211.76

BP 1211. 54 WAVY BP 1210.51 F (SAND) 1205.01
H988 H987 3614.5 2412.6 1209.61 CEIL 1211.91 BP 1211. 41 WAVY BP 1210.51 FLOOR 1205.01
H989 H988 3591.1 2416.8 1209.61 CEIL 1211. 71 BP 1211.61 BP 1210.97 WAVY BP 1210.16 MUCK TOP 1207.11 FLOOR 1205.01
H990 H989 3577.0 2417.6 1207.61 CEIL 1212.81 BP2 1211.21 BP! 1210.81 WAVY BP 1210.11 F (STREAM) 1203.11
H991 H990 3528.2 2425.4 1208.61 C=BP+PYRIT 1213.61 BP 1212.25 BP 1211.81 BP 1211.41 BP 1211.01 BP 1210.31 WAVY BP 1209.31 F (STREAM) 1204.81
H992 H991 3481.6 2431.5 1209.61 CEIL 1212.71
c BP 1211.81 BP 1211.36 BP 1210.41 BP 1209.91 WAVY BP 1209.01 F (STREAM) 1206.71
H993 H992 3463.5 2436.2 1209.61 CEIL 1213.61 CONTACT? 1211.66 WAVY BP 1208.96 F (STREAM) 1206.96
H994 H993 3452.2 2424.7 1211.61 CEIL 1214.91· BP+SHALE 1214. 51 . BP+ SHALE 1214.08 BP+ SHALE 1214.01 BP+ SHALE 1213.71 BP+ SHALE 1213.21 BP+ SHALE ).212.94 MAJOR BP 1211.11 BP 1210.26 BP 1209.71 WAVY BP 1208.91 F (STREAM) 1207.71
H995 H994 3433.2 2427.4 1211.61 CEIL 1213.56 MAJOR BP 1211.11 F (STREAM) 1207.91
H996 H995 3440.2 2438.6 1211.61 CEIL 1213.91
( MAJOR BP 1211.01 F (STREAM) 1208.21

8997 8996 3425.0
D997 8997 3425.0 END OF FILE
(
2467.2 1210.11
2467.2 1213.21
CEIL 1213.21 MAJOR BP 1210.74 F (STREAM) 1208.41 CEIL DOT 1213.21

APPENDIX 3 -- Seismic Refraction Data
Picnic area across river from Mystery I:
1. At w~t end offoot.bridge, extending 120 feet to north (azimuth 350 deg).
X(ft) forward time (msec)
0
5
10
15
20
25
30
40
50
60
70
80
90
100
110
120
vl = 1050 ft/sec (dry sediment).
v2 = 11, 770 ft/sec (limestone).
Deph to bedrock approx. 18 ft.
Irregular bedrock surface.
0
4.37
8.79
13.32
19.7
23.6
28.6
28.8
32.1
40.0
40.0
40.2
41.8
44.2
44.0
46.6
Arrivals were indistinct in reverse shot.
reverse time (msec)
46.5
42.9
39.2
39.2
39.1
41.7
38 .. l
37.4
30.4
30.0
24.1
19.2
7.1
0
2. From west end offootbridge, extending 120 ft to west (azimuth 270 deg):
X(ft) forward time (msec)
0 0
10 8.58
20 21.8·
30 27.1
40 30.l
50 31.7
60 36.1
70 39.9
80 39.0
90 39.0
100 39.8
110 40.7
120 42.5
vl = 820 ft/sec (dry sediment).
v2 = 7150 ft/sec (weathered b~ock'?).
Depth to bedrock approx. 10 fl?
Slig}tt bedrock slope toward west.
~ -- reverse time (msec)
49.0
49.0
49.6
49.6
47.5
44.4
43.2
35.3
34.9
34.9
28.9
15.7
0
I 16

(
3. Continuatioo of #2 toward west:
x (ft) forward time (msec)
0
10
20
30
40
50
60
70
80
90
100
110
120
vl = 1110 ft/sec (dry sediment)
v2 = 9900 ft/sec (bedrock)
Depth to bedrock = 23 ft.
Slight bedrock slope toward east.
Very little relief on bedrock.
0
8.8
18.0
26.4
35.7
45.5
46.1
47.1
49.9
49.4
49.5
50.1
51.1
117
reverse time (msec)
52.3
52.7
50.7
49.2
48.7
47.0
45.8
45.3
35.6
26.4
17.4
0
4. Eastward fr.om picnic grotmds road, to 20 ft from western river bank (azimuth 70 deg), 250 ft south offord (now bridge) over river:
X(ft) forward time (msec)
0
10
20
30
40
50
60
70
80
90
100
vl = 1160 ft/sec(dry sediment).
v2 = 8450 ft/sec (bedrock).
Depth to bedrock 20 ft.
0
8.9
17.6
26.5
35.7
39.2
42.1
41.2
43.1
43.1
45.9
Little relief on bedrock surface.
Bedrock slopes gently toward east.
reverse time (msec-)
45.9
45.1
43.3
41.5
39.1
38.1
33.6
25.8
7.4
0

1/
~
5. Northward, tcnninating at eastern end of #4, parallel to west.em river bank. 20 ft from river, azimuth 335 deg:
x (ft) forward time (msec)
0
10
20
30
40
so 60
70
80
90
100
vl = 1150 ft/sec (dry sediment).
v2 = 13,300 ft/sec (limestone).
Some scatter in bedrock arrivals.
Depth to bedrock approx. 20 ft.
0
8.5
17.6
26.5
29.6
32.1
41.8
40.1
41.4
40.1
41.2
reverse time (msec)
41.9
42.2
40.6
39.4
42.0
37.2
35.0
26.6
17.6
8.6
0
118
6. Parallel to western boWldary of Park, along faint road, azimuth 0 deg, on low terrace, from south em edge of patch of woods toward
Walnut Cave:
X(ft) forward time (msec)
0
10
20
30
40
so 60
70
80
90
100
vl = 14SO ft/sec. (dry sediment).
v2 = 12,800 ft/sec (limestone).
Depth to bedrock 23 ft.
Forward arrivals indistinct.
0
13.2
17.S
23.9
26.7 32.8,
41.8
43.3
51.0
S2.0
51.8
reverse time (msec)
40.S
38.4
37.8
36.6
32.2
27.2
23.6
17.8
8.4
0
7. Ten feet from river, parallel to west bank of river, starting 30 feet from ticket office, directly across from Mystery I entrance,
azimuth 190 deg.
X(ft) forward time (msec) reverse time (msec)
0 0 43.3
s 7.35
10 12.5 37.1
15 17.5
20 21.3 37.l
25 25.9
30 31.l 38.3
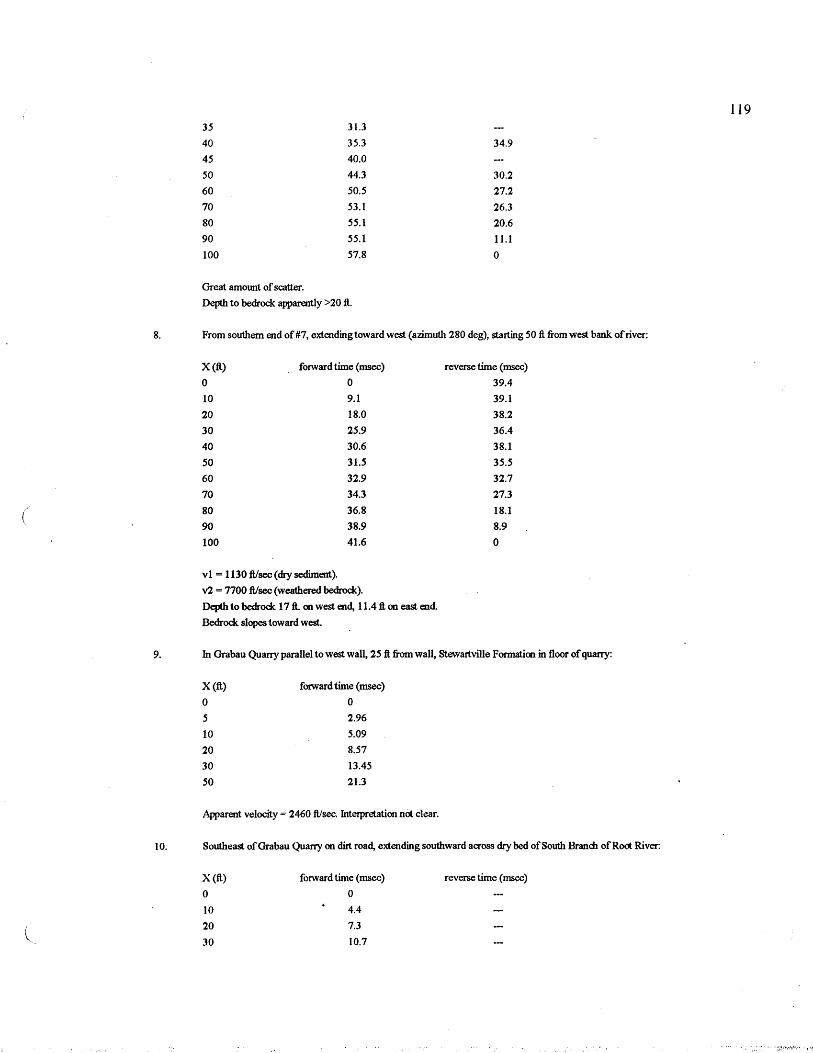
l
35 31.3
40 35.3 34.9
45 40.0
50 44.3 30.2
60 50.5 27.2
70 53.1 26.3
80 55.1 20.6
90 55.l 11.1
100 57.8 0
Great amowit of scatter.
Depth to bedrock apparently >20 ft.
8. From southern end of#7, extending toward west (azimuth 280 deg), starting 50 ft from west bank of river:
X(ft) forward time (msec)
0 0
10 9.1
20 18.0
30 25.9
40 30.6
so 31.5
60 32.9
70 34.3
80 36.8
90 38.9
100 41.6
vl = 1130 ft/sec (dry sediment).
v2 = 7700 ft/sec (weathered bedrock).
Depth to bedrock 17 ft. on west end, 11.4 ft on east end.
Bedrock slopes toward west.
reverse time (msec)
39.4
39.1
38.2
36.4
38.1
35.5
32.7
27.3
18.l
8.9
0
9. ht Grabau Quarry parallel to west wall, 25 ft from wall, Stewartville Formatioo in floor of quarry:
X(ft) forward time (msec)
0 0
s 2.96
10 5.09
20 8.57
30 13.45
so 21.3
Apparent velocity = 2460 ft/sec. Interpretation not clear.
I 0. Southeast of Grabau Quarry on dirt road, extending southward across dry bed of South Branch of Root River:
x (ft) forward time (msec) reverse time (msec)
0 0
IO 4.4
20 7.3
30 10.7
119

I (
\: '-....~
40 15.9
50 21.5
60 23.3
70 26.9
80 31.1
90 31.3
100 34.2
110 35.0
120 36.6
Reverse shot gave indistinct arrivals beyond 30 ft.
vl = 2400 ft/sec (compact or moist seclimenl).
v2 = 7270 ft/sec (weathered bedrock).
Depth to bedrock = 27 ft.
--- readings obscure
19.4
13.7
5.3
0
11. ParaJJeJ lo dry bed of South Branch, on south side, extending west, in puJloff 100 feet south of dry bed:
X(ft) forward time (msec) reverse time (msec)
0 0
10 6.0
20 13.0
30 23.0
40 28.2
so 32.2
60 33.9
70 34.9
80 36.8
90 38.Z
100 38.9
110 43.3
120 45.2
vl = 1300 ft/sec (dry sediment).
v2 =high limestone velocity (actual value not clear).
Depth to bedrock approx. 19 ft.
Average slope on bedrock about S.S deg to west (in line of traverse).
Moderate relief on bedrock surface.
38.8
35.6
35.6
34.6
34.2
34.9
34.8
34.8
31.1
25.6
16.9
8.1
0
120
12. Almost directly over Gardw of the Gods in Mystery II, south of driveway, extending westward just north of fence line across
driveway from flagged stake (about 100 feet west of gate to Mystery II driveway):
X (ft) forward time (msec) reverse time (msec)
0
10
20
30
40
so 60
70
80
90
100
0 U4
9.1 43.5
18.7
27.5
36.4
40.5
43.7
44.4
44.9
45.6
42.8
42.3
41.0
36.6
35.5
27.1
18.2
9.5
0

\
vl = 1110 ft/sec (dry soil and sediment).
v2 = 16,570 ft/sec (limestone).
Depth to bedrock = 22 ft.
Rather wtif onn bedrock surf ace.
13. Extension of #6 toward north along faint dirt road over Walnut Cave:
X(ft) forward time (msec)
0
5
10
20
30
40
50
60
70
80
90
95
100
vl = 1160 ft/sec (dry sediment).
v2 = 8860 ft/sec (bedrock).
0
7.2
9.18
14.1
18.4
21.2
22.5
27.4?
25.6
26.5
30.1
31.7
Depth to bedrock about 10 ft. over Walnut Cave.
Irregular bedrock surface.
reverse time (msec)
25.9
24.8
24.5
22.4
22.6
21.3
20.1
17.4
9.0
4.5
0
14. Perpendicular to #13, from a point 15 ft south of southern end of#l3, ~xtendingwest-southwest aaoss field:
X(ft) forward time (msec)
0
5
10
20
30
40
50
60
70
80
90
95
100
vl = 1060 ft/sec (dry sediment).
v2 = 9300 ft/sec (bedrock).
0
.4.1
8.7
17.5
24.0
24.0
26.7
27.0
29.4
32.2
34.2
35.1
Depth to bedrock 10.7 ft at east end, 14.4 ft on west end.
reverse time (msec)
35.2
33.7
33.4
33.9
32.0
30.6
29.6
25.7
20.1
9.0
5.8
0
Bedrock. surface rather flat~ land rises about 3.5 degrees toward west.
121

122 15. Continuation WSW from WC!>tcrn end of 1114:
x (ft) forward time (msec) reverse time (msec)
0 0
10 9.1 40.0
20 22.9 37.9
30 32.0 37.0
40 36.1 36.8
so 36.3 29.8
60 37.3 26.7
70 39.0 26.0
80 43.3 21.4
90 44.2 7.9
100 45.1 0
vl = 906 (loose dry sediment).
v2 = 4400 ft/sec (weathered bedrock?).
Great amount of scatter: irregular bedrock swface.
16. Continuation WSW from western end of# 15:
X(ft) forward time (msec) reverse time (msec)
0 0 34.9
10 10.2 35.8
20 21.6 33.0
( 30 26.1 33.8
40 27.7 31.S
so 30.7
60 28.8 29.9
70 29.8 27.2
80 32.9 22.0
90 33.0 9.7
100 35.0 0
vl = 910 ft/sec (dry, loose sediment or soil).
v2 = 8400 ft/sec (bedrock).
Depth to bedrock 11 ft.
Rather unifonn bedrock surface.
17. Continuation WSW from western end of#l6:
X(ft) forward time (msec) reverse time (msec)
0 0 (wind interference)
10 8.8
20. 21.6
30 26.8 31.S
40 28.6 31.2
50 30.6 31.3
60 34.0 31.9
70 34.S 27.2
80 • 34.7 17.9
90 36.0 8.8
\{ 100 36.4 0

(
vi -= 1030 ft/sec (dry sediment).
v2 o: about 15,000 ft/sec (limestone).
Depth to bedrock about 12-15 ft.
Land rises gently toward west, but bedrock surface is rather flat.
18. Continuation WSW from western end of#l7to edge of woods, at a relativelyhig}t part offield:
x (ft) f0rward time (msec)
0 0
10 8.7
20 18.1
30 26.4
40 32.0
so 35.2
60 37.4
70 39.7
80 42.3
90 43.2
100 44.1
vl = 1130 ft/sec (dry soil or sediment).
v2 = indistinct, but hig}t (limestone).
Depth to bedrock approx. 15-20 ft.
reverse time (msec)
45.5
45.5
45.8
45.6
45.2
35.5
26.6
17.9
8.6
0
"•')
123
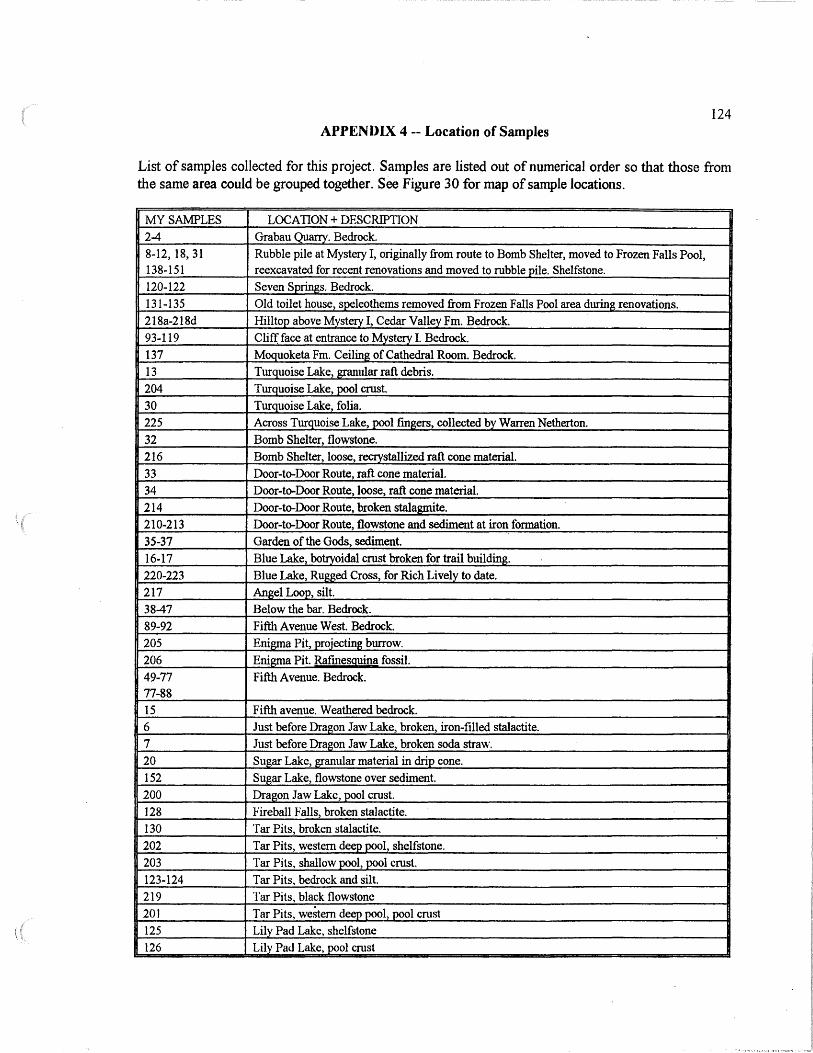
124 APPENDIX 4 -- Location of Samples
List of samples collected for this project. Samples are listed out of numerical order so that those from the same area could be grouped together. See Figure 30 for map of sample locations.
MY SAMPLES LOCATION+ DESCRIPTION 2-4 Grabau Quarry. Bedrock. 8-12, 18, 31 Rubble pile at Mystery I, originally from route to Bomb Shelter, moved to Frozen Falls Pool, 138-151 reexcavated for recent renovations and moved to rubble pile. Shelfstone. 120-122 Seven S~s. Bedrock. 131-135 Old toilet house, speleothems removed from Frozen Falls Pool area during renovations. 218a-218d Hilltop above Mystery I, Cedar Valley Fm. Bedrock. 93-119 Cli~ face at entrance to Mvsterv I. Bedrock. 137 MOQuoketa Fm. Ceiling of Cathedral Room. Bedrock. 13 Turquoise Lake, granular raft debris. 204 Turquoise Lake, oool crust. 30 Turquoise Lake, folia. 225 Across Turquoise Lake, pool fingers, collected bv Warren Netherton. 32 Bomb Shelter, flowstone. 216 Bomb Shelter, loose, recrvstallized raft cone material. 33 Door-to-Door Route, raft cone material. 34 Door-to-Door Route, loose, raft cone material. 214 Door-to-Door Route, broken stalagmite. 210-213 Door-to-Door Route, flowstone and sediment at iron formation. 35-37 Garden of the Gods, sediment. 16-17 Blue Lake, botryoidal crust broken for trail building. 220-223 Blue Lake, Rugged Cross, for Rich Lively to date. 217 Aru?el Loop, silt. 38-47 Below the bar. Bedrock. 89-92 Fifth Avenue West. Bedrock. 205 Eni1m1a Pit, projecting burrow. 206 Enisnna Pit. Rafinesouina fossil. 49-77 Fifth Avenue. Bedrock. 77-88 15 Fifth avenue. Weathered bedrock. 6 Just before Dragon Jaw Lake, broken, iron-filled stalactite. 7 Just before Dragon Jaw Lake, broken soda straw. 20 Sugar Lake, 2f8.tlular material in drip cone. 152 Sugar Lake, flowstone over sediment. 200 Dragon Jaw Lake, pool crust. 128 Fireball Falls, broken stalactite. 130 Tar Pits, broken stalactite. 202 Tar Pits, western deep pool, shelfstone. 203 Tar Pits, shallow pool, pool crust. 123-124 Tar Pits. bedrock and silt. 219 Tar Pits, black flowstone 201 Tar Pits, we~tem deep pool, pool crust 125 Lilv Pad Lake, shclfstone 126 Lily Pad Lake, pool crust

MY93-119
--/'~ MY13, MY204 ~ MY
30
MY137 MY225
--~
N
t 500 feet
200 meters
MYSTERY CAVE
Fillmore County, Minnesota
Figure 30: Location of bedrock and speleothem samples analyzed for this project. -N Vl

' ( \: \
SAMPLE #
MY38
MY39
MY40 MY41
MY42
MY43
MY44
MY45
MY46
MY47
MY49
MY52
MY50
MY53
MY55
MY54
MY56 MY57
MY58 MY59
126 APPENDIX 5: Description of Bedrock Samples Analyzed for this Project
DESCRWTION INSOLUBLE % if measured
STEWARTVILLE FORMATION 23 ft below top of Stewartville. Massive, mottled medium brown, burrowed, dolomitic fossiliferous limestone. Dolomite in burrows is sugary textured. Fossils float in patches of spar. 20 ft below top of Stewartville. Massive, black mottled, burrowed, dolomitic limestone. Dolomite in burrows is sugary textured. 18 ft below top of Stewartville. Massive, sparry, dolomitic limestone. 13 ft below top of Stewartville. Massive, mottled-brown, burrowed, dolomitic, orange limestone wackestone. Dolomite in burrows is sugary textured and weathering out. 10 ft below top of Stewartville. Massive, brown-mottled, burrowed, pinkish, dolomitic limestone wackestone. Scattered patches of spar. Dolomite in burrows. Some dolomite is partly altered to calcite. Stvlolites. Bed SXl. Resistant, granular, mottled burrowed, medium brown, dolomitic limestone wackestone. Dolomite is dissolved at cave wall. Bed SX2. 1-2 inch thick, friable, granular, orange-mottled burrowed, light gray, dolomitized limestone wackestone. Dolomite in burrows is sugary. Stylolites. Dolomite is partly altered to calcite and is dissolved at cave wall. Spar replaced some fossils. Topmost bed of Stewartville. Resistant, dark brown, mottled, burrowed, dolomitic fossiliferous limestone. Dolomite partly altered to calcite. Dissolved at cave wall. Spar fossils weather outward and make the wall feel gritty. Burrow was recrystallized to spar -(gypsum?) Top ofMY45 =Bedding Plane 1, the top of the Stewartville Formation. Bed SX3. Granular, brown "marker bed" sometimes defined as the top of the Stewartville Fm. Marker bed grades laterally into wavy disconformity with up to half a foot of relief. Dolomitized limestone wackestone with iron oxide after pyrite lined spar after gypsum in vugs and cracks. Dolomite is partly assimilated in spar.
Topmost bed in Stewartville. Granular, yellow-mottled, dolomitic limestone wackestone, just below bedding plane 1. Bedrock has been brecciated and clasts float in soar after gypsum. Soar is concentrated along joints. DUBUQUE FORMATION Bed DTl. Knobby, orange, dolomitic wackestone. Dolomite is partly altered to calcite and is dissolved at cave wall. Bed DT2. Brown dolomitic wackestone. Dark concentrations of iron and manganese oxides associated with dolomite. Overgrowths on some fossil fral!Illents. Bed DT3. One of several closely spaced, .3 foot-thick, undulose beds. Medium gray dolomitic limestone mudstone and wackestone. Black-mottled iron oxide in dolomite. Bed DT3. One of several closely spaced, 0.3 foot-thick, undulose beds. Massive brown dolomitic limestone wackestone. Dolomite is partly altered to calcite. Overgrowths on some fossil fragments. Bedding plane 3 is at the top of the sequence oftmdulose beds. Bed DT4. Light gray, slightly dolomitic limestone wackestone. Black iron oxide. Dolomite is partlv altered to calcite and is dissolved at cave wall. Bed DT4. Gray, slightly dolomitic limestone wackestone with large balls of iron oxide after p\rite. Dolomite is partly altered to calcite and is dissolved at cave wall. Hed DS 1. First significant shale. Shaly, dolomitic limestone. 49% Bed DL 1. Medium .crystalline, light gray-brown dolomitic limestone wackestone. Dolomite is corroded at cave wall. Bed DS2. Calcitic shale. Phosphatic fossil fragments. Iron oxide. Trace glauconite. 57% Bed DL2. Gray mudstone to wackestonc. Spar replaced some fossils.

127 MY60 Bed DS3. First major shale bed. Some dolomite, phosphate and iron oxide. 52% MY61 Bed DL3. Light brown limestone wackestone. Slightly dolomitic weathering to pores at
cave wall. Soar has replaced some fossils. Some iron oxide. MY63 Bed DIA. Gray-brown, slightly dolomitic limestone mudstone to wackestone. Dolomite
weathers to pores at cave wall. Some iron oxide and phosphate grains. MY65 Bed DL5. Slightly shaly, yellow-gray limestone wackestone. Some iron oxide and
phosphate grains. MY66 Bed DS6. Slightly dolomitic, fissile, shaly limestone wackestone. Phosphate grains, 34%
some iron oxide. MY67 Bed DL6. Slightly dolomitic, unlaminated, brown-gray limestone wackestone. Fe oxide MY68 Bed DS7. Unlaminated, shaly, light gray limestone wackestone. Phosphate grains and 46%
iron oxide. MY69 Bed DL7. Massive, yellow-gray, shaly limestone wackestone. Iron oxide. MY70 Bed DS8. Dolomitic, shaly, nonlaminated, medium gray limestone wackestone. Iron 52%
oxide and phosphate grains. Poorly recessed, shaly zone. MY71 Bed DL8. Orange-brown, shalv limestone wackestone. Iron oxide and phosphate szrains. MY72 Bed DS9. Yellow, calcitic shale. Iron oxide and phosphate szrains. 65% MY73 Bed DL9. Slightly dolomitic, shaly gray limestone wackestone. Spar fills voids between
grains. Iron oxide and phosphate grains. Dolomite is dissolved next to cave. MY74 Bed DSIO. Slightly dolomitic, calcitic shale. Iron oxide and large amount of phosphate 49%
w:ains. Dolomite looks detrital with corroded edges. MY75 Bed DLlO. Shaly, medium brown, limestone wackestone. Spar filled some fossils. Iron
oxide and some phosphate grains. MY76 Bed DSI 1. Slightly dolomitic, shaly, yellow-gray, fissile, laminated limestone
wackestone. Iron oxide and phosphate suains. MY78 Bed DS 11. Large masses of gypsum and iron oxide from the oxidation of pyrite in shale.
Much iron oxide is moldic after euhedral gypsum crystals. MY77 Bed DL12. Shaly, fissile, limestone wackestone with yellow laminae. Iron oxide and
phosphate grains MY79 Bed DL13. Shaly, brown, limestone wackestone. Iron oxide and phosphate grains. Trace
dolomite. MY80 Bed DS 14. Laminated, slightly dolomitic, calcitic dark brown shale. Iron oxide and
some phosphate grains. Candidate for bentonite (still investigating). MY81 Bed DS14. Brown finely laminated, calcitic shale with fossils, iron oxide, phosphate. 72%
MY82 Bed DL14. Shaly, light brown limestone wackestone. Iron oxide and phosphate grains. Trace dolomite that has dissolved next to cave.
MY83 Bed DS 15. Dolomitic, shaly yellow-gray limestone wackestone. Iron oxide and .. phosphate grains.
MY84 Bed DL15. Slightly dolomitic, shaly, yellow limestone wackestone. Some iron oxide and phosphate w:ains.
MY85 Bed DS 16. Thick, gummy dolomitic, calcitic, brown massive shale. Iron oxide and 69% phosphate grains. Dolomite is altered to calcite.
MY86 Bed DL16. Slightly shaly, light tan limestone wackestone. Trace dolomite. Iron oxide and phosphate grains.
MY87 Bed DS17. Dolomitic, shaly, unlaminated limestone mudstone. Phosphate grains. 77% Dolomite is altered to calcite.
MY88 Bed DL17. Shaly, gray, limestone wackestone. Iron oxide and some phosphate grains. Trace dolomite.
MY93 Bed DS 18. Mediun1 gray-brown shale. Trace dolomite. Few large fossil fragments. 79% Phosphate.

128 MY94 Bed DS 19. Dolomitic, shaly, medium gray-brown limestone wackcstonc. Iron oxide and
phosphate Slfains. MY95 Bed DL 19. Dolomitic, shaly, brown-gray wackestone. Iron oxide and phosphate grains. MY96 Bed DS20. Dolomitic, shalv, light brown limestone wackestone. Iron oxide. MY90 Bed DS20. Gummy, dolomitic, yellow-brown, calcitic shale. Strong Jimonitic stain near 58%
base. Dolomite is altered to calcite. Iron oxide and phosphate grains. MY91 Bed DL20. Dolomitic, yellow, calcitic shale. Some fossils contain spar. 48% MY97 Bed DL20. Brown, fossiliferous limestone wackestone. Trace dolomite and shale.
Dolomite is dissolved to pores. Iron oxide and spar bind clusters of fossils. MY92 Bed DS2 l. Soft, yellow-gray, massive, calcitic shale with infrequent laminations of shell 68%
fragments and iron oxide. Phosphate grains and trace dolomite. MY99 Bed DL2 l. Shaly, white, massive limestone wackestone. Iron oxide. MYIOO Bed DS22. Dolomitic, calcitic, dark gray shale. Iron oxide and phosphate grains. 72%
Concentration of fossil fragments at shale/limestone contact. MY101 Bed DL22. Shaly, yellow-orange, limestone wackestone. Iron oxide and phosphate
c-~ grains. Burrow filled with soar (fossil floating in spar) after gypsum. MY102 Bed DS23. Dolomitic, dark gray, calcitic shale. Iron oxide, phosphate, chitinozoans. MY103 Bed DL23. Massive, dolomitic, light brown limestone wackestone. Spar has replaced
scattered large fossils. Phosphate. MY104 Bed DS24. Dolomitic, thick, dark gray, shaly limestone wackestone. Phosphate grains, 49%
iron oxide and chitinozoans. MY106 Bed DS25. Thick dolomitic, brown, calcitic shale. Large amount of tiny, phosphatic 60%1
fossils. Chitinozoans. MY107 Bed DL25. Dolomitic, gray-brown limestone wackestone. Phosphate grains and iron
oxide. Some dolomite is altered to calcite. MY108 Bed DS26. Dolomitic, shaly, gray to yellow limestone wackestone. Nodules of spar. 37%
Phosphate grains and iron oxide. MY109 Bed DL26. Dolomitic, shaly, brown, limestone mudstone to wackestone. Phosphate
szrains and iron oxide. MYllO Bed DL27. Brown shale with flecks of organic material along bedding. Iron oxide and
chitinozoans. MYIII Bed DS28. Dolomitic, calcitic, dark gray-brown shale. Iron. oxide and chitinozoans. 80% MY112 Bed DL28. Incompetent, dolomitic, shaly, light gray limestone wackestone. Iron oxide,
phosphate grains and chitinozoans. MY113 Bed DL28. Dark brown, shaly dolomite. Fossils, iron oxide, some phosphate grains and 28%
chitinozoans. MY114 Bed DL29. Incompetent, brown, shaly dolomite. Scattered fossils. Irregular clusters of
fossils cemented by overgrowths and soar. MY115 Bed DS30. Mottled, gray-bro\\'n, shaly dolomite. Scattered fossils. Iron oxide and
chitinozoans. Some dolomite is altered to calcite. This is the last definite shale bed at the top of the Dubuque Formation. MAQUOKETA FORMATION
MY116 Base of Maquoketa. Yellow, shaly, dolomitic limestone wackestone. Scattered large fossils. Some phosphate. Some fossils replaced by spar. Undulatorv bedding at base.
MY117 3 ft above base of Maquoketa. Dolomitic, calcitic, yellow shale. Some phosphate grains and iron oxide.
MY118 5 ft above base of Maquoketa. Medium gray, fissile, shaly dolomitic wackestone. Phosphate grains and iron oxide.
MY119 9 ft above base of Maquoketa. Flaggy, medium-thin bedded, burrowed, light tan, shaly dolomitic mudstone. Iron oxide.

129 APPENDIX 6: Grain Composition of Bedrock Samples
Point-count results for thin sections of bedrock samples are shown here. "Pores" in the dolomite column represent rhombic pores that were once dolomite but have since dissolved. They were not counted in the percentages. See Figure 2 for exact locations in the stratigraphic colunm.
SAMPLE '1oSPAR %CALCITE %DOLOMITE %FOSSILS %NON
-- MUD CARBONATE
MY38 (S'ville) 15 10 40 35 1
MY39 " 42 36 21
MY40 " 24 56 21
MY41 " 29 50 18 3
MY42 " 42 19 39
MY43(SX1) 34 41 25 .5
MY44(SX2) 3 48 6 42
MY45 (S'ville) 44 6 41 9
MY46(SX3) 38 8 30 23
MY49IDT1) 7 67 27
MY52(DT2) 22 27 51
MY50(DT2) 33 52 15
MY53(DT2) 48 19 33
MY55(DT4) 64 DOl'CS 34
MY54IDT4) 50 12 38
MY57(DL1) 15 oon:s 25
MY58(DS2) 13 trace 27 60
MY59(DL2) 74 26
MY60IDS3) 17 trace 17 67
MY61 (DL3) 81 trace 19
MY63(DL4) 47 oores 38 16
MY65(DL5) 63 trace 7 29
MY66(DS6) 43 10 13 34
MY67(DL6) 88 9 3
MY68(DS7) 25 25 50
MY69(DL7) 73 9 18
MY70(DS8) 37 DOl'CS 26 37
MY71 (DU) 62 12 26
MY72(DS9) 22 26 52
MY73(DL9) 68 nores 25 8
MY74(DS10) 16 trace 38 46
.MY75 (DL10) 62 28 10
MY76(DS11) 45 oorcs 50 5
MY77(DL12) 77 12 11
MY79(DL13) 13 33 !4
MY80(DS14) 6 21 73
MY81 (DS14) 5 24 71
MY82(DL14) 58 27 1'
r...fY83 (DS15) 9 9 55 27
MY84(DL15) 72 16 12
MY85(DS16) 40 3 6 51

130 MY86(DLl6) 70 24 6
MY87(DS17) '4 trace 3 43
MY88(DLl7) 64 30 6
MY93 (DS18) 1 2 97
MY94(DS19) 67 3 JS 15
MY9S(DL19) '4 18 15 13
MY96(DS20) 16 13 38 34
MY90(DS20) -- 33 3 6 58
MY91 (DL20) 69 24 6
MY97(DL20) 53 POt'CiS 45 2
MY92(DS21) 5 9 86
MY99(DL21) 74 12 14
MYlOO (DS22) 6 3 3 88
MY101 (DL22) 69 16 15
MYI02 (DS23) 5 26 13 57
MY103 IDL23) 37 27 36
MY104 (DS24) 23 14 30 33
MY106 (DS2S) 4 6 27 63
MY107(DL2S) 9 8 82 1
MY108 IDS26) 20 9 48 23
MY109 (DL26) 9 4S 15 31
MYl 10 (DL27) 3 97
MYttt IDS28) 3 10 19 68
(/ MYl 12 (DL28) 26 24 41 9
MYl 13 (DS29) 5S 33 12
MYl 14 (DL29) 64 16 20
MYl lS (DS30) 41 33 26
MYl 16 fM'keta) 6 4S 29 IS 5
MY117 " 44 4 52
MY118 " s 69 18 8
MY119 " 91 1 8

131 APPENDIX 7: Clay Content of Bedrock Samples (from X-ray Diffraction)
SAMPLE QUARTZ IL LITE MUSCOVITE CHLORJTI. KAOLINITE
MYS6 x x x
MYS8 x x x
MY60 x x
MY66 x x x
MY68 x x x
MY70 x x x
MY72 x x x
MY74 x x x
MY81 x x x MY85 clav x x x
MY85 coarse x x x x
MY87 x x x MY90 x x x x MY91 x x x
MY92 x x x MY93 coarse x x x MY98 x x ·x
MYlOO x x x MY104 x x x
MYlOS x MY106clav x x x x
MY108 x x x MY113 x x x
MY131 x x
MY137 x x x

132 APPENDIX 8: X-ray Analysis of Speleothem Samples
Sample Calcite, deg. Silica (Sio,) Description 2-theta
MY8 29.50 2% needles and blades from chenille spar, Mystery I MY12 29.50 0 outer bladed crystals on ice, Mystery I
MY13 29.54 0 granular drip cone precipitate on floor of Turquoise Lake MY14 0 anuzonite wall near Garck.'>fl of Gods. Bedrock = dolomite MY16 29.50 0 acicular crust on botryoids
29.53 0 twinned pyramidal crystals Blue Lake pool crust
MY17 29.57 0 both inner yellow layer and outer layer, Blue Lake acicular pool .. , crust
MY19·· 29.51 0 tiny bladed crystals on shrub-like stalk 0 orange acicular crust
29.50 Mvstervl MY30 29.52 0 folia, Turquoise Lake MY32 29.52 0 Flowstone (twinned blades), Bomb Shelter MY33a 29.52 0 raft cone fragrnents, Door-to-Door Route MY33b 29.54 0 raft cone fragments, Door-to-Door Route MY34 29.56 2% cave ice from raft cone
station T62 Door-to-Door Route MY38 29.54 aragonite Below the Bar, Stewartville bedrock, Mystery Il MY82 29.50 46% weathered, yeilow bedrock
29.51 7% unweathered, gray bedrock MY86 29.47 5% Bedrock MY95 29.50 7% Bedrock MY116 29.47 0 Moonmilk on dolomite bedrock MY129 29.52 0 yellow inside soda straw
29.58 1% outer white crust ·-· Tar Pits
MY131 29.49 12% limestone bedrock 29.495 8% white crust on limestone
MYI32 29.45 0 white, chalky crust on stat 29.46 0 yellow center of stal
Old Toilet House MY143 29.52 0 acicular flowstone layer over shrubs
shrubs 29.55 1% Mystery I
MY154 29.52 0 acicular flowstone layer 29.52 6% shrubs
Mvsterv I MY155 29.50 8% shrubs below flowstone
29.52 0 flowstone Mvsterv I
MY201 29.54 1% subaqueous stacked plates to needles, Tar Pits deep lake MY202 29.56 1% shelfstonc, vertical rhombs and silt, Tar Pits deep lake MY203 29.575 0 botryoidal cmst, vertical, stacked rhombs, Tar Pit shallow lake MY204 29.505 0 chenille spar, bladed to stacked needles, Turquoise Lake

133 MY214 29.52 1% outer edge, stalagmite
29.53 0 center, stalagmite Door-to-Door Route·
MY225 29.50 1% pool fingers, stacked to radiating needles Input side of Turquoise Lake
(
.;· :·1 ... j •' :·

134 APPENDIX 9: Speleothem Ages
Speleothem ages detennined by Richard Lively, Minnesota Geological Survey, including measurements made for the LCMR Geology Project, arranged by age from y~ungest to oldest. See Figure 31 for map of sample locations.
SAMPLE AGE (ka) ERROR SITE DESCRIPTION -- (years)
MC28d .s . 1 Mystery III, base of mud pit, east of Eureka Ave .
MC28c 2 . 1 Mystery III, base of mud pit, east of Eureka Ave .
MC28b 3.4 .1 Mvsterv Ill, base of mud pit, east of Eureka Ave.
MC28a 6 .4 Mystery III, base of mud oit.. east of Eureka Ave.
MC9 7.7 .4 Mystery I, Bomb Shelter, top of flowstone layer
MC24 8.6 .5 Door-to-Door route, Big Fork. west of entrance to Wind Turuiel
MC8 9.6 .5 Mvsterv I, Bomb Shelter, middle layer oftlowstone, shrubs
MC8609 10.3 .6 Mystery III. ~before entratce to second a-awl. Small joint on
ril?bt side of passage going in
MCI 11.98 1.3 Mvstervil,AngelRoute
MC25 I2 .4 Door-to-Door route, entrance to Wind Tunnel, Big Fork area
MC7 12.2. .4 Mystery I, Bomb Shelter, base of thick flowstone overlying gravel
deposit, shrubs
MC29 12.2 .4 Mystery I, main commercial passage about 150 feet west of en-
trance to Turquoise Lake
MC25a 12.3 .7 Door-to-Door route, entrance to Wind Twmel
MCI I2.3 .3 Mvsterv 11, Angel Route
MCI 12.6 .7 Mvsterv II, Angel Route
MC25b 12.7 .6 Door-to-Door route, entrance to Wind Turmel
MC27 13 .6 Mystery III, Fonnation Route Creek
MCI 14.4 .8 Mvsterv II, Angel Route just east of Carrot Sticks
MC8603 I4.5 .4 Mystery III. Along Helictite route iust before boxwork
MC30 IS .2 Mystery Ill, above entrance to Helictite Route
MCI I5.4 I Mvstervil,AngelRoute
MC8503 IS.5 .3 Mystery II, area beyond Garden of the Gods
MC8605 16 .5 Mystery III. Boxwork area, after first crawl, and near second
crawl; left side going in
MCI 16.8 3.1 Mvsterv II, Angel Route
MC8503 I8 .5 Mystery II, area beyond Garden of the Gods
MCI 19.6 1.3 Mystery II, Angel Route
MCI 26.2 1.7 Mysterv II, Angel Route
MC8505 34 1 Mystery II, top of side passage, entrance to Garden of Gods area,
may not be original location
MC19d 36 2 Mvsterv IL west end of 5th Ave.
MC26a 38 1 Mystery II, 4th Ave., 112 to 2/3 dirumce from Wishing Well
MC19c 38 2 Mystery IL west end of 5th Ave.
MC21 4I 1 My~iery Ill, Eureka Ave. entrance of passage going to Rotunda
Room
MY222 49 . 2.4 Mystery IL Blue Lake, top half ofuppennost part of more recent
flowstone next to lake
MC8505 57 2 Mystery II, top of side passage, entrance to Garden of Gods area,
may not be original location

135 MC19b 57 5 Mystery II, west end of 5th Ave.
MC19a 61 5 Mystery II, west end of 5th Ave, growing on top of breakdown,
covered by newer breakdown
MC222 77.9 3.5 Mystery II, Blue Lake, lower half of uppennost, more recent flow-
stone next to lake
MC8501 81 4 Mystery II, left side passage off commercial tour just prior to
Garden of the Gods
D2 85 s Mystery II, Dome Room, east of Blue Lake
MCS 85 3 Mvsterv II, west end of 5th Ave.
MY223 89 3.4 Mystery LI, Blue Lake, botryoidal calcite below flowstone mound,
subaqueous.
MCS 93 3 Mystery II, west end of 5th Ave.
MC5 97 4 Mystery II, west end of 5th Ave.
MC5 97 8 Mystery IL dig site ODPOSite Dragon's Jaw Lake
MC13 101 4 Mystery II, layer caooing sediment
MCS 101 4 Mysteiy II, west end of 5th Ave.
MCS 101 s Mystery Il, west end of 5th Ave. dig site
MCS 104 8 Mystery II, west end of 5th Ave. dig site
MCS 104 21 Mystery II, west end 5th Ave. dig site
MC20b 106 5 Mysterv II, west end of Sth Ave., near Dragoo's Jaw Lake
MC17 109 6 Mvsterv II, 4th Ave.
MCS 113 9 Myst.eiy II, west end of 5th Ave., dig site
MC26b 116 7 Mystery II, 4th Ave., 112 to 2/3 of the way from Wishing Well to
end ofoaMage
MClOa 117 11 Mystery II, Eniema Pit, top of sediment, left side
MC26 119 s Mystery Il, 4th Ave., between Wtshing Well and west end
MC18 121 6 Mystery Il, 4th Ave., between wishing well and west end
MC8502 121 8 Mystery II. area beyond Garden of the Gods
MC14 122 11 Mvsterv II, Eniema Pit, middle flowstone layer
MC26d 123 s Mystery II, 4th Ave., 112 to 2/3 from wishing well to end of pas-
sage
MC4hg 124 7 Mystery II, dig site oooosite Dragoo Jaw Lake
MC3 126 11 Mvsterv II, west end of 5th Ave., near Dragon Jaw Lake
MCllb 128 6 Mystery II, Eniema Pit, on wall above sediments
MC3g 136 12 Mystery II, west end of 5th Ave. near Dragon's Jaw Lake
MC8504 137 7 Mystery II, base of broken stat on N side at east end of Gaden of
the Gods before ertrance to Beyond Garden of the Gods
MC860lb 138 8 Mystery III. Along Lily Pad Route just up from Helidite Route
MC20a 141 11 Mystery II, west end of Sth Ave. near Dragon's Jaw Lake
MC3c 142 11 Mystery II, west end of 5th Ave. near Dragon's Jaw Lake
MClla 142 9 Mystery II, Enigma Pit, north side of wall above sediment
MC16 146 10 Mystery II, Eniema Pit, 30 an below tOP of sediment
MC16a 147 6 Mvsterv II, Enil!llla Pit, 30 an below top of sediment
MClOb 150 19 Mvsterv II. Eniema Pit, top of sediment, north side
MC2 151 13 Mystery II. Enigma Pit, embedded uorieht in flowstone layer
MCS 151 32 Mystery II, west end of 5th Ave. dig site
MC8601a 152 8 Mvsterv III. Lily Pad Rte. west ofjund.ion with Helidite Route
MC6 158 10 Mystery II. entrance to Dragon's Jaw Lake, from ceiling of crawl
MC860lc 158 11 Mystery Ill, Lily Pad Route just bevond entrance to Helidite Rte.
MC4a 161 14 Mystery II, Tar Pits west end of 5th Ave.

136 MY220 179 10 Mystery II, oldest flowstone at mound by Blue Lake, same age as
"Mushroom"
MC2a 183 16 Mystery II, Eni2Jtla Pit, flowitone
MRl 258 28 Mystery II, pit west of Blue Lake
MY221 >3SO Mystery II, Blue Lake, topmost shelfstone on west end of
flowstone mOWld, shrubs
MC3h >3SO Mvsterv II, west end of Sth Ave. near Dragon's Jaw Lake
MRI >JSO Mvsterv II, next to Blue Lake
(r \

Ir--.. -~\
MC02, MC10, MC11, MC13, MC14, MC16 7 / ./ CS17A-L
.....- MC07, MCOB, MC09 CS10-13 CS18-20
---
r/.
MC01
N
1 500 feet
200 meters
MYSTERY CAVE
Fillmore County, Minnesota
Figure 31: · Location of speleothem samples used for radiometric dating by Richard Lively, (Minnesota Geological Survey) and for this project, and sediment samples (labeled CS) analyzed by Milske 1982).
MC8502, MC8503
-w -.....)