Geology and Mineralogy This document consists of 155 pages, plus
230
Geology and Mineralogy This document consists of 155 pages, plus 20 figures. Series A UNITED STATES DEPARTMENT OF THE INTERIOR GEOLOGICAL SURVEY RESULTS OF GEOLOGIC DRILLING, 1953, LAND-PEBBLE PHOSPHATE DISTRICT, FLORIDA* By James B. Gathcart and Lawrence J. McGreevy January 1956 Trace Elements Investigations Report 576 This preliminary report is distributed without editorial and technical review for conformity with official standards and nomenclature. It is not for public inspection or quotation. *This report concerns work done on behalf of the Division of Raw Materials of the U« S. Atomic Energy Commission.
Transcript of Geology and Mineralogy This document consists of 155 pages, plus

Geology and Mineralogy
This document consists of 155 pages, plus 20 figures. Series A
UNITED STATES DEPARTMENT OF THE INTERIOR
GEOLOGICAL SURVEY
RESULTS OF GEOLOGIC DRILLING, 1953, LAND-PEBBLE
PHOSPHATE DISTRICT, FLORIDA*
By
James B. Gathcart and Lawrence J. McGreevy
January 1956
Trace Elements Investigations Report 576
This preliminary report is distributed without editorial and technical review for conformity with official standards and nomenclature. It is not for public inspection or quotation.
*This report concerns work done on behalf of the Division of Raw Materials of the U« S. Atomic Energy Commission.

2
USGS - TEI-576
GEOLOGY AMD MINERALOGY
Distribution (Series A) No. of copiesAtomic Energy Commission, Washington ........... 2Division of Raw Materials, Albuquerque .......... 1Division of Raw Materials, Austin,, ....... ....* 1Division of Raw Materials, Butte .<>........... 1•Division of Raw Materials, Casper. ............ 1Division of Raw Materials, Denver„ 0 ........... 1Division of &aw Materials, Ishpeming ...... o .... 1Division of Raw Materials, Phoenix ............ 1Division of Raw Materials, Rapid City. .......... 1
, Division of ^aw Materials, St. George. .......... 1f Division of Raw Materials, Salt Lake City. ........ 1Division of Raw Materials, Washington. .......... 3Exploration Division, Grand Junction Operations Office . . 1Grand Junction Operations Office ............. 1Technical Information Extension, Oak Ridge ........ 6U. S. Geological SurveysFuels Branch, Washington ................. 1Geochemistry and Petrology Branch, Washington. ...... 1Geophysics Branch, Washington. .............. 1Mineral Deposits Branch, Washington. ........... 3P. C. Bateman, Menlo Park. ................ 1A. L. Brokaw, Grand Junction ............... 1No M. Denson, Denver .................... 1A. H. Koschmann, Denver. ... 0 ............. 1R. A. Laurence, Knoxvilte* ................ 1L. R. Page, Washington . . . „ . ............. 1Q. b. Singewald, Beltsville. ............... 1A. E. Weissenborn, Spokane ................ 1TEPCO, Denver. ...................... 2•EEPCO, RPS, Washington, (including master) .......... 2
41

CONTENTS
Page
Abstract . . 0 . . „ ........... „ . . ...... o . . 10Introduction . „ . . . . . . . . ................ o 12General geology 0 ......................... 15Stratigraphy ........................... 16
Eocene series, ....................... 1?Ocala limestone ..<,................« 1?
Oligocene series . 0 .^............•.•••• 18Suwannee Iimestone 0 .................. 18
Miocene series ....................... 20Tampa limestone ............A......* 20Hawthorn formation. ...... 0 ...» . ^ * «,.. *c* 23Hawthorn(?) formation, unnamed member ........ , 26
Pliocene(?) series ..................... 29Alachua(?) formation. ................. 29Bone Valley formation 0 ................ 30
Pleistocene series .................... 32Terrace sands ....................', 32
Mineralogy ............................ 32Chemistry ............................ 33feathering ............................ 37Economic geology ......................... 39
Calcium-phosphate zone ................... 39Aluminum phosphate zone. ............. o ... *y" 41General relations. .....................' 43
Suggestions for exploration. ................... 45Discussion and explanation of figures. .............. 46
General. .......................... 46Line 15 figure 2 ...................... 46
Stratigraphy. ..................... 46Suwannee ..................... 46Tampa q ...................... 46Hawthorn ..................... 4£Bone Valley. ................... 48Terrace sands. ....... . .......... 48
Economic geology, ................... 48'Line 2^ figure 3 » ..................... 49
Stratigraphy. .................,..._ 49Suwannee ..................... 49Tampa* .............. . ...... . ., '49Ha'wrbhorn .................... 0 "50Bone ?alley a ................... r 50Terrace sands. ......*........... 50
Economic geology. ................... 50Line 3^ figure 4 ...................... 51
Stratigraphy. ............... .,„... 5!Tampa, ....................... 51Hawthorn ..................... 51Bone Valley. ................... 52Terrace sands. .................. 52
Economic geology. . ......... . ........ $2

Page
Discussion and explanation of figures—Continued.Line 4, figure 5 . . 8 . . „ . 0 ............... 53
Stratigraphyo ..................... 53Tampa 0 ...................... 53Hawthorn 0.00000. ............. 53Bone Valley. ................... 53Terraee sands. .................. 54
Economic geology,, ................... $4Line 5> figure 6...................... 54
Stratigraphy. ..................... 54Hawthorn .<>. 0 ................. 54Bone Valley. ................... 55Terrace sands. 0 ..... o ....... ^ ... 55
Economic geology. ................... 55Line 69 figure 7 . ..................... 56
Stratigraphy. ..................... 56Hawthorn ..................... 56Bone Valley. ................... 56Terrace sands. .................. 56
Economic geology 0 .. „ ................ 57Line 7* figure 8 . . . . ...... . ........... 58
Stratigraphy. ..................... 58Hawthorn ..................... 58Bone Valley. ................... 58Terrace sands. .................. $8
Economic geology. ................... 5&Line 8, figure 9 , ... . ................. 59
Stratigraphy* ......... ........... e 59Hawthorn ..................... 59Bone Valley. ................... 59Terrace sands. .................. 59
Economic geology. ................... 60Line 9* figure 10. ..................... 60
Stratigraphy 0 ..................... 60Hawthorn ..................... 60Bone Valley. ................... 6lTerrace sands. . ................. 6l
Economic geology* ....... ............. 61Line 10, figure 11 ..................... 63
Stratigraphy. ..................... 63Hawthorn ...................... 63Hawthorn(?), unnamed member,, ........... 63Bone Valley. .. 0 ................ 63Terrace sands. .................. 64
Economic geology. ................... 64

Page
Discussion and explanation of figures — ContinuedLine 11, figure 12 , * e , « » » „ P « , . „ . , . » „ . « e $ 65
Stratigraphy . .«..,................' 65Hawthorn 0 . * » «, . « . 0 « o «. . « * * . . . . * 65Hawthorn (?)$ unnamed member ..,.«...,,. 65Bone Valley,, ................... 65Terrace sands, .,,,..<,.........«. 65
Economic geology „ e 0 „ e 9 9 . 9 9 , . e , „ 9 9 a e » 65Line 12, figure 13 . . . . . . . , ....... . . . . . , 6?
Stratigraphy* . „ . . „ . . . ............ o 6?.
Hawthorn (?)unnamed member ......*....« 68Bone Valley. ................... 68Terrace sands. .................. ,68
Economic geology, ....... 0 ........... 69Line 13, figure 14 ..................... 70
Stratigraphy c .............. ....... 70Hawthorn «,««*..... « , « . » «...«. ?0Hawthorn (?) unnamed member . 0 0 0 « ..,..,. 71Bone Valley, ....... . . , e . . , . , . . . 71Terrace deposits *.,..*«« .' 0 ....„«. 71
Economic geology a .,,...,.....,,..... 71Line 14, figure 15 ...................... 72
Stratigraphy «,,.,.,....,.......,. 72Tampa ...................... 72Hawthorn- ,,.*...,............. 72Hawthorn, (?) unnamed member. ........... 73Bone Valley. ................... ,73Terrace sands. . 0 a ............... -73
Economic geology. ................... 74Line 15, figure 16 ..................... 75
Stratigraphy. ..................... 7'5Ocala ... o . . o . . . . ... * ,..*.„»* », . ,-,.„. J75Hawthorn „. 0 .................. /75Hawt.horn(?), unnamed member. ........... 75Bone Valley c ................... . 76Terrace deposits ................. 76
Economic geology. ................... 76Line 16, figure 17 ..................... 77
Stratigraphy 0 ..................... 77Ocala ...................... 77Hawthorn ............. ........ 77Bone valley. ................... ,78Terrace sands. .................. ,78
Economic geology ...................... 73

PageDiscussion and explanation of figures—Continued
Line 17, figure IB ..................... 7°-Stratigraphy. .*.«>.. ................ 79
Suwannee ..................... 79Tampa. ...................... 79Hawthorn ..................... 79Alachua (?)................. t .. 79Bone Valley. ................... 80Terrace sands. .................. 80
Economic geology. ................... 80Line 18, figure 19 ..................... 81
Stratigraphy. ..................... 81Hawthorn ..................... 81Bone Valley. ................... 82Terrace sands. .................. 82
Economic geology. ................... 82Tonnage calculations ....'.*................. 83
Aluminum phosphate zone. .................. 83Calcium phosphate zone (Matrix). .............. 83Tables of analytical data and tonnage and grade suianaries. , 85
Literature cited ......................... 154
ILLUSTRATIONS
Figure 1. Index map of the land-pebble phosphate district, Florida, showing location of drill holes and cross-sections and limits of calcium phosphate and aluminum phosphate zones ...... * .. In
la. Explanation of symbols used in figures 2 to 19 . -,In envelope
2. Cross-section, line 1. ............. In envelope
3. Cross-section, line 2. ............. *. In envelope
4. Cross-section, line 3. ............. In enveloped » * *•
5. Cross-section, line 4. ............. * In envelope
6. Cross-section, line 5. ............. In envelope
7. Cross-section, line 6. ............. ,* In (envelope
8. Cross-section, line 7. ............. .»In envelope
9. Cross-section, line 8. ............. In envelope
10, Cross-section, line 9.... ...<....... In envelope

7
ILLUSTRATIONS—Continued
Page
Figure H. Crossesection, line 10 .............. ife envelope
12„ Cross-section, line 11............ e Jp,envelope
13. Cross-section, line 12............* »lp* envelope
14c Cross-section, line 13 . . . . . . . . . . . . « *fe envelope
15 o Cross-section, line 14 ........... „ .> *I*fc envelope
16 0 Cross-sect ion, line 1$ .......... o . , <£& envelope
17c Cross-section, line 16 ............ ^ envelope
18. Cross-section, line 1? ............ a, J^ envelope
19. Cross-section, line 18. ............ lfl .envelope
20. Isometric block diagram, land-pebble phosphatedistrict, Florida, showing stratigraphic relations.Based only on geological drilling. ...... In envelope
TABLES
Table 1. Comparison of screen size distribution and chemical analyses o Averages of samples from different stratigraphic intervals. ............. 34
2. Economic factors, calcium phosphate *zpng &....« 40
3. Summary of lifchologic criteria used in siratigraphiccorrelation .«».p. ................. 47
4. Analytical and screen data, samples from holes inline 1 ...... o ..... o . c .. o . o .. B5
5. Tonnage computations, line 1
6. Analytical and screen data, samples from holes inline 2. .....-'I. ....':..•......• 89
7. Tonnage computations, line 2............ 92
8. Analytical and screen data, samples from holes inline 3«« ••••«oo. oo. .o. ...... 93

8
Page
TABLES— Continued
Table 9» Tonnage computations, line 3 « »-«•••«•»»•• 95
10 o Analytical and screen data, samples from holes inline 4 » o o . o . . o . o . . o . . . . o o «, . . . 96
11 t Tonnage computations, line ^.••••••••••••* 97
12 o Analytical and screen data, samples from holes inline 5. ... - . o .-...*........... 93
13. Tonnage computations, line 5 ••••••••• • • • • »100
14. Analytical and screen data, samples from holes inline 6 ... o o ......... o o .... o ... 101
15 « Tonnage computations, line 6 .............. 103
16. Analytical and screen data, samples from holes in* line 7 ...... o o o o ............ o . 104
17.* Tonnage computations, line 7
18 0 Analytical and screen data, samples from holesin line 8. ...................... 108
19. Tonnage computations, line B . „ ............ 110«
20. Analytical and screen data, samples from holes• in line 9* ••••••••• ............ Ill
21 o Tonnage computations, line 9 .............. 116
22. Analytical and screen data, samples from holesin line 10 ...................... 118
23. Tonnage computations, line 10........*..... 126
24 o Analytical and screen data, samples from holesin line 11....................... 129
025 o Tonnage computations, line 11. . ............ 133
26. Analytical and screen data, samples from holeso in line 12 ...................... 134
27. Tonnage computations,, line 12.... .......... 137

9
TABUS—Gont inued
Page
Table 28. Analytical and screen data, samples from holesin line 13 ..... . . . » . » . . . . . . . . . , 138
29. Tonnage computations^ line 13
30. Analytical and screen data, samples from holes in line 14. •..........•....
31. Tonnage computations^ line 14
32. Analytical and screen data5 samples from holes in line 15 <, . . . . . . . . . . . . ...<,
33. Tonnage computations^ line 15. ..•••••••••• 146
34. Analytical and screen data ? samples from holesin line 16 . . . . . . . . . ....... «,.«,.. 147
35. Tonnage computations^ line 16* ............ 148
36. Analytical and screen data 5 samples from holesin line 17 • * ................... 149
37. Tonnage computations , line 17. • . . . ........ 151
38. Analytical and screen data 5 samples from holesin line 18.. '.............•...•• 152
39. Tonnage computations , line 18. .••....... o . 153

10
RESULTS OF GEOLOGIC DRILLING, 1953, LAND-PEBBLE PHOSPHATE DISTRICT, FLORIDA
By James B 0 Cathcart and Lawrence J» McGreevy
ABSTRACT
A program of core drilling to delimit the uranium and phosphate-
bearing strata (the aluminum and calcium phosphate zones) of the land-
pebble phosphate (district, and to study the stratigraphic relations of
the Bone Valley formation was carried out in the fall of 1953•
A series of cross sections, an isometric block diagram, and a
series of tables summarize the lithologic, stratigraphic, analytical,
and economic data derived from the drilling <>
The Bone Valley formation of Pliocene(?) age was deposited by a
transgressing sea. In most of the district, the Bone Valley overlies
limestone or dolomite of the Hawthorn formation (middle Miocene); but
in the northern part of the district in northern Polk County, where the
Hawthorn thins to an erosional feather edge, the Bone Valley overlies
the Tampa formation (early Miocene), and farther to the north, in Pasco
County, clayey sands of the upper Bone Valley overlie the Suwannee lime
stone (Oligocene). To the east and south, however, the Bone Valley
overlies a micaceous, phosphatic, clayey sand, containing fossils of
late middle Miocene age. This material in turn overlies the limestone
or dolomite of the Hawthorn formation. The material is thought to be an
unnamed member of the upper part of the Hawthorn.
In the northernmost line of holes drilled, material lithologically
similar to the Bone Valley overlies a sandy clay containing angular white
phosphate particles, material very similar to the hardrock phosphate.

11
It is thought that this material may represent the Alachua(?) formation,,
It appears, therefore^ that the Bone Valley is in part equivalent to the
Alachua(?) formation, but that a part of the Bone Yalley formation may
be somewhat younger than the Alachua(?) 0 Three holes in the northeast
penetrated the Ocala limestone (Eocene). Indications are that this lime
stone may occupy an upthrown fault block.
Since the deposition of the Bone Valley, weathering altered the
formation, changing fluorapatite to wavellite and crandallite (pseudo-
wavellite)^ and forming the aluminum phosphate zone.
In the northwest part of the land-pebble district, the aluminum
phosphate zone extends beyond the limits of the calcium phosphate zone.
To the east and south, the calcium phosphate zone extends beyond the
limits of the aluminum phosphate zone. In the northern part of the area
where the phosphate deposition was thinnest, the entire Bone Valley
formation may have been leached, while to the south, where the formation
was thicker, only the top part of the formation was leached, and both
zones are present. Still farther to the south, in Hardee and Manatee
Counties, the Bone Valley formation may not have been exposed to subaerial
weathering, and the aluminum phosphate zone was not formed. The present
limit of the aluminum phosphate zone is the result of a combination of
erosion after the zone was formed, and the possibility that to the east
and south, phosphatic sediments were not exposed to weathering in the
Pliocene. The aluminum phosphate zone and the calcium phosphate zone
both cut across stratigraphy. This is clearly shown in some of the lines
where, for example, aluminum phosphate minerals have formed in the Bone
Valley, the Hawthorn, and the Tampa formations. The calcium phosphate

12
zone may be entirely within the Bone Valley formation, entirely within
the Hawthorn formation, or most commonly, it includes the bottom part
of the Bone Valley, and the weathered top of the Hawthorn formation.
The phosphate deposits of the land-pebble district are thus complex-
partly residual, partly marine reworked, and partly phosphatized clay .
INTRODUCTION
The land-pebble phosphate district is located in west-central
peninsular Florida between 27°00 f and 2S°15 f North latitude and 81°45 !
and 82°15' West longitude. The district is divided on the basis of
phosphate content and tonnage into a northern, high-grade part in Polk
and Hillsborough Counties, and a southern, lower-grade part in Hardee
and Manatee Counties (fig« 1).
A program of core drilling to delimit the uranium- and phosphate-
bearing strata of the Bone Valley formation and to study the stratigraphic
relations of the Bone Valley formation was undertaken by the U. S.
Geological Survey, on behalf of the Division of Raw Materials of the
U. S. Atomic Energy Commission. A spoke-like pattern of lines of drill
hole/sit,es was laid out; the first site in each line was selected within
the limits of the land-pebble phosphate district. Drilling permits from
the land-owners were obtained under the direction of Emerson C. Villey
of the Geological Survey,, A sampler followed the drilling in the field,
checked core recovery, and collected chip samples from the core at one
foot intervalso A total of 115 holes aggregating 7,112 feet were drilled
from May 26 to October 215 1953, using a truck-mounted rotary drill.
13
Heavy drilling mud was used to prevent caving and contamination during
coring. Average core recovery was ?4 percent; losses were noted and are
shown on the cross-sections„ Holes with low recovery were redrilled to
recover enough sample for analytical purposes„& All holes were cased
with 1-1/2-inch (inside diameter) cast-iron pipe, and gamma-ray logs
were made. Casing was necessary to prevent caving prior to gamma-ray
logging.
Samples corresponding to the high-peak areas on the gamma-ray
logs were split from most cores for analysis. These samples represent,
at least in part, the aluminum phosphate zone. Where visual inspection
showed abundant phosphate grains, a sample was also taken that represented
the calcium-phosphate zone or "matrix." The sample was weighed and then
washed over a 14-mesh screen, and the oversize retained, dried, and
weighed. The undersize was screened on 35- and 150-mesh screens. The
material retained on the 35-mesh screen was dried and weighed. If
phosphate minerals were present in the -35+150 mesh material, it was
treated in a laboratory flotation cell to separate the quartz sand and
phosphate minerals. The material passing the 150-mesh screen (the slime
fraction) was dried, weighed, and retained. Weight percents of sample
fractions were computed from the dry weights. Equivalent uranium and,
where necessary, chemical uranium were determined for all sample splits.
The samples highest in uranium content were analyzed for P2^5* ^a^> F,
and AlpO-a.
The drill holes were logged by the following geologists: D. C.
Alverson, W e J« Carr, 3. B. Catheart, K. B* Ketner, L. J. McGreevy, and
R. G. Petersen of the U. S. Geological Survey, Samples of the

14
fossiliferous material were examined by F. Stearns MacNeil of the
U. So Geological Survey, and all fossil determinations and age
assignments from fossils were made by him.
Studies of the limestone cores from lines 1 through 4 were made
by W. J. Garr and D. C. Alverson (1955). The writers have used their
age assignments for non-fossiliferous limestones in those lines. A. M«
Coleman and Charlotte Axsell assisted the writers in the preparation of
the tables and illustrations. All analytical work was done by the
U. S. Geological Survey Laboratory, Washington, D. Co Radioactivity
analyses were made by J. Goode and B. McCall under the direction of
F. Flanagan. Chemical analyses were made by J. Smith, W. Tucker,
J. Budinsky, L. Jenkins, E. Campbell, I. Barlow, R. Smith, S. Betbee,i
Ro Moore, A. Sweeney, T. Murphy, J. Waving, and G. Daniels under
direction of I. May.
All of the factual data obtained during the drilling are presented
in tables 1-39. The even-numbered tables show all the mechanical and
chemical analyses for all samples. The odd-numbered tables give tonnage
and grade computations for the aluminum-phosphate and calcium-—phosphate
zones o
A series of cross-sections, one for each line of drill holes,
summarize the lithologic, stratigraphic, and economic data* Lithologic
correlations were made from geologists 1 logs of the core, plus the
authors' examination of the core chips with the binocular microscope.
The authors' stratigraphic correlations are based on lithology, except
for the few fossiliferous beds. The fossil lists and age Identifications
are given in the text.

15
The delineation of the aluminum-phosphate and the calcium-
phosphate zones as shown on figures 2-19* was made with the use of the
chemical analyses of the samples,, and for the aluminum-phosphate zone,
from the high peaks on the gamma-ray logs.
GENERAL GEOLOGY
The land-pebble phosphate district is a part of the Gulf Coastal
Plain and is underlain by thin, nearly flat-lying formations s that dip
very gently to the south and southeast. King (1951) has pointed out
that the geology of peninsular Florida differs from that of the remainder
of the coastal plain in that Florida was a positive, relatively stable
area during a large part of Mesozoic and Cenozoic time and, because of
its distance from the main part of the North American continent, it
received relatively small amounts of land-derived sediment i „
Phosphate deposits in the land-pebble district are part of the
Bone Valley formation of probable Pliocene age and/or phosphate-bearing
sandy clays of the Hawthorn formation. The Bone Valley formation was
deposited on the eroded surface of the underlying phosphatic Hawthorn
formation of middle Miocene age, and in the northern part of the district
where the Hawthorn formation thins to an erosional feather edge, on the
Tampa formation of early Miocene age. On the fringes of the district
(to the north, west, and east), drilling penetrated rocks of the Suwannee
limestone of Oligocene age and the Ocala limestone of Eocene age, and on
the northern edges of the district, clayey sands, possibly equivalent to
the Bone Valley formation, rest on the Suwannee limestone.

16
The Bone Valley formation was deposited by a transgressing sea
that reworked and partly sorted the residual mantle formed on the
Hawthorn at the close of the Miocene, Sirice its deposition, the upper
part of the Bone Valley has been deeply weathered„ Much of the phosphate
in this upper zone has been removed, and some of the phosphate combined
with alumina from clay minerals to form aluminum-phosphate minerals 0 The
Bone Valley deposits are thus complex—partly residual, partly marine
reworked, and partly phosphatized clay.
The district is covered by a blanket of loose, quartz sand of
probable Pleistocene age. Wind-blown sand, swamp deposits, and bars
and flood plains of streams are probably Recent.
STRATIGRAPHY
Details of the stratigraphy and local stratigraphic relations,
are shown on figures 2-19. Stratigraphic relations and the geographic
distribution of the formations based on geological drilling is shown on
figure 20.

17
Eocene series
Ocala limestone
The Ocala limestone was named by Ball and Harris (1892, p. 103 ) 9
for the city of Ocala in Marion County. Cooke (1915, p. 117 ) believed
the Ocala was of late Eocene age. Vernon (1951* P* 111-113) divided
the Ocala into the Ocala limestone (restricted) at the top and the
Moodys Branch formation at the base. The Moodys Branch formation is
divided by hiis into a lower, Inglis member and an upper, Williston
member. Because only a few, short cores of the Ocala were obtained in
the present study, it was not possible to sub-divide the Ocala, and the
term is used in this report as synonymous with the Jackson group (Cooke,
1945, p. 53)o
The Ocala is a white, cream to yellow, very pure limestone, in
places containing over 99 percent calcium carbonate. It varies in
thickness from about 50 to almost 400 feeto Fossiliferous Ocala lime
stone was identified from the following locations?
Line 15. hole 5, (SMJ of SWi sec. 3, T. 27 S.» R. 26 E.)
Amusium ccalanum.
Line 16, hole la (SWj of SWr sec. 21, T« 26 S. 9 R. 25 E.)
Chlamys spv cf. Co spillmani „ Tubulostum -sp. Lepidoeclina ocalana .
Line 16. hole 2 5 (NWJb of MWj sec, 21, T. 26 S... R. 25 E.)
Lepidoeyclina sp. cf . L. pseud omarginata

18
The altitude of the Ocala limestone in these holes is about the
same as the altitude of the Hawthorn formation in adjacent holes (See
figs. 16 and 17 •! Calcareous clays, assigned to the Hawthorn, overlie
the Ocala limestone at these drill holes„ fhis indicates that a part
of the Hawthorn formation, the Tampa limestone and the Suwannee limestone
may have been cut out. Thus, the Ocala limestone here may occupy an
upthrown fault block (fig. 20). If this is a fault block, the age of
the faulting is probably pre-Bone Valley, because sediments assigned
to the Pliocene(?) are apparently not affected by the faulting.
Qligocene series
Suwannee limestone
The name Suwannee limestone was proposed by Cooke and Mansfield
(1936, p. 71) for limestone exposed along the banks of the Suwannee
river. Cooke (1945* p. 88) says the Suwannee is the equivalent of
the Chickasawhay limestone of late Oligocene age* MacHeil (1947)
indicates that the Suwannee limestone is the equivalent of the Byram
and the Chickasawb^r formations combined and thus includes rocks of
middle and upper Oligocene age.
The Suwannee limestone is a yellow or cream limestone. It is
commonly soft and granular. Small solution holes, filled with green
clay, probably residual from the limestone, are abundant. In places,
the lime has been leached from the surface of the limestone, leaving
a mass of flint. Chemical analyses (Mossom, 1925) show that the
Suwannee contains between 91 and 98 percent calcium carbonate.
19
The Suwannee limestone lies unconformably on the Ocala and is
unconformably overlain by the Tampa limestone of early Miocene age or
by younger rocks 0 The thickness of the Suwannee limestone in the land-
pebble district is about 130 feet (MacNeil^ personal communication, 1956 )
Fossiliferons Suwannee limestone was identified from the following
localities?
Line l a hole 4. (SWj of KEj sec. 19. T 0 27 S. B R» 22 E.)
Phacoides (Milt ha) sp. aff . £a chipolanus ffurritella n. sp 0 (?) Turritella sp. aff. T. bowenae Kuphus JUicrassattis
Line 2 S hole 4, (NEt of SWj sec. 6 ? T 0 28 S. a R. 21 E.)
Sorites sp.Peneroplis sp eChlamys sp. cf. G. brooksvillensisKuphus incrassatus
Line 17. hole 5. (SWjof SWi sec 0 8 9 T. 26 S,, Ro 23 E.)
Turritella halensisGlycymeris suwannensisPi varicella sp 0Pitar sp 0Corbula sp 0^yrtaea sp. cf . M 0 taylorensisChlamys sp 0 cf „ £0 brooksvil lensisOrthaulax hernandensisAmauropsis sp. (?)Chione sp pPitar sp 0 cf «, £ e heilpriniAnatina sp.Venus sp 0
Line 17. hole 6 a (mi of m%. sec P 1. To 26 S.. R. 22 E.)
Tritiaria n. sp 0 (?) Yenus sp 0 Barnea sp 0 Goskinolina floridana

20
Line 17, hole 9. (SWt of SE£ sec. 13, T« 25 S., R. 21 B.)
Peneroplis sp.Asterigina subacula floridensis
Line 17. hole 10, (Sift of NEi .sec, 11. T. 25 S.. R. 21 E.)
Peneroplis sp.Sorites sp.Asterigina subacula floridensis
Line 17. hole 11, (MWj; of SEj; sec. 22. T. 24 S,, R. 21 E.)
Sorites sp.
In addition to the fosMli£«*tm$ limestones, material at the
bottom of hole 5, line Ij hole 3, line 2j and holes 3 and 3, line 17,
was tentatively assigned to the Suwannee. All of the drill holes that
penetrated Suwannee limestone are at the northern end of the mapped
area (fig» l). In this part of the area, the Hawthorn and Tampa
formations, which normally overlie the Suwannee, are thinning. None of
the holes in the south, east, or west penetrated the Suwannee limestone,
indicating a general thickening of the younger formations to the south.
Miocene series
Tampa limestone
The name "Tainpa formation" was first used by Johnson (1888, p. 235)5
Cooke and Mossom (1929> p. 78-93) changed the name to "Tampa limestone."
Both Cooke (1945) and Maclfeil (1947) put the Tampa limestone in the Early-
Miocene.
The Tampa limestone is much more variable in composition than either
the Suwannee or Ocala. It is a white to cream, sandy and clayey limestone,
and contains abundant chert fragments and very few phosphate nodules. The
limestone is interbedded with beds of clay and sandy clay and is often
covered with a residual mantle of greenish calcareous clay, containing
chert and limestone fragments and sparse phosphate nodules.

21
The Tampa limestone lies unconforaably on the Suwannee limestone^,
but the relations between the Tampa and the overlying formations are
uncertain., Cooke (1945* p. 115) indicates that in the northern part
of Florida^ near the Georgia state line,, the contact between Tampa
limestone and Hawthorn formation is gradational and conformable 0 Recent
work in the land-pebble district by Carr and Alverson (1953* p. 1&2)
indicates that the contact between the Tampa and the Hawthorn is marked
by an erosional interval.
According to Mansfield (1937* P« 14) the Tampa limestone is about
65 feet thick near Tampa,
Fossiliferous Tampa limestone was identified from the following
localities;
Line 1. hole 3, (Kgjfc of SEJ sec 0 31. T. 27 3.. E. 22 B.)
Helisoma. sp.
Line 2. hole 3* .(SEt of SEj sec. 8, T. 28 S.,. R 0 21 E.)molds and casts in siliceous bed at top of calcareous clay e
Helisoma sp.
Line 3, hole 2, (SEj of SEj sec. 35* T- 28 S.. R. 20 E.) fossils in limestone fragments in green clay.
Trigonoeardia sp. Caroerina sp e Sorites sp.
Line 4. hole l a (SWJ of SWj sec,, 4, T. . 0 3. 9 R. 20,,E.)
Murex sp f cf. M. trophonoformis Area irregularis Cardium, sp, cf . C^ anclotensis Anomaloeardia penita
Line 4. hole 3 9f.(Wj of SEj sec 0 13. T 0 30 S 0 , E» 19 1.)
Sorites sp.

22
Line 14. hole 7. (NV& of S£j sec. 15, T. 28 3.. R. 26 B.)
Turritella tampae Turritella hillsboroensis Amauropsis sp. Arcopsis sp 0 Chlamys crocus
•" Phacoldes sp." f
Line 14. hole 8. (NWjb of SEt sec 0 14, T. 28 S«. R. 26 E.)
Venus sp, Sorites sp. Gamerina sp 0 Peneroplis sp e
Line 17, hole 4. (NEt of SW£ sec. 27. T. 26 S.. R. 23 E.)
Terebra sp.Knefastia sp e cf. K. brooksvillensisOlivella sp. cf. 0. postiTurret ej-la atactaAnadara latidentataChlamys sp.Cardium delphicumCallocardia sp.Pitar sp 0 / /Venus sp* ;' ,Corbula sp.Architectonica, n. sp, (?)
Line .17. hole 9» (HWt of SE^ sec. 13. T. 25 S.. R. 21_E.)
Glycymeris sp.
In addition to the fossiliferous localities, limestone or elastics^
lithologically similar to the Tampa were cored at holes 1, 2, and 4 of
line Ij hole 4 of line 2; holes 1, 3, 4, and 5 of line 3; hole 4 of line
14^ and holes 3, 5, 6, 7, S, and 10 of line 17. All of the drill holes
that intersected limestones or elastics of the Tampa are in the northern
half of the area mapped, but, in the northernmost holes of lines 1 and
17, the Tampa was missing, and the formation thins to the north. Because
the formation extends further to the north than does the overlying Hawthorn,
the thinning may be in part, at least, erosional.

23
Hawthorn formation
The Hawthorn* formation was named for the town of Hawthorn,
Alachua County, by Dall and Harris (1892, p. 10?). The Hawthorn was
called Middle Miocene by Cooke (1945) and MacNeill (1947). In the land-
pebble district the Hawthorn formation consists of interbedded limestones
or dolomites, sands, sandy clays, and greenish-blue or gray clays 5 all of
which contain abundant phosphate nodules. Where exposed in the mining pits
of the land-pebble district, the Hawthorn formation is a soft buff to
yellow, sandy, clayey, phosphate-bearing dolomite e In studying cuttings
from a deep well Berman (1953) found an abrupt change at 80 feet from
dolomite to limestone. It is believed that the upper dolomitic zone
may be a replacement of the limestone.
A thin, discontinuous deposit of soft, water-saturated plastic
sandy calcareous clay (called bedclay by the phosphate companies) overlies
the dolomite of the Hawthorn formation in most of the pits d,n the district 6
This clay is gradational with the material below and probably was derived
from the hard dolomite beneath by leaching.
No limestone of the Hawthorn formation was found in the drill
holes in the northern fringe of the district. (See figs* 2, 3> 18, and
19,) The formation in this area is very thin and pinches out to the
north. In the southern part of the area, the drill holes penetrated
sandy clays, clays, and sands of the Hawthorn formation, but many
bottomed in limestone or dolomite of the Hawthorn. (See figs. 8 S 9> 10,
and 11,) The Hawthorn formation is unconformably overlain by the Bone
Valley formation of Pliocene(?) age or by sands of the Pleistocene. The
Hawthorn ranges in thickness from a feather edge to the north of the
district to a maximum of several hundred feet to the south.

24
Fossiliferous Hawthorn was identified from the following localities
Line 4 9 hole-2 9 JSWj of SKjLsec 0 _J.8 q T^JO_3^E 0 20. JE.,,)
Ostrea sp 0
Line 10. hole 8, (.S¥j of SWj sec, 15, T 0 34 S,, R 0 25 £<.)
Anadara sp 0 Chione sp«
Line 11, hole 1, (Nlft of Mfe sec, 1, T 0 34 5.. R, 25 E.) (upper Hawthorn age)
Cancellaria sp 0 Sendcassis (?) Glycymeris sp c Anadara sp<, Plicatula sp<, Phacoides sp . Venericardia sp 0 Cardium sp 0 Dosinia sp 0 Venus sp»
Line 11. hole 5, (Ngfc of SEj sec 0 35. T 0 33 So, R a 26 E.)
Glycymeris sp 0 Phacoides sp 0
Line 11, hole 6 0 (HEt of S£j sec 0 31> T 0 33 S 0 , R a 27 Eo)
Chlamys sp 0 Venericardia sp 0 Chione sp 0 Venus sp 0
Line 12. hole I 9 .j>ec. 36, T 0 31 S.. R a 25 E.) (Hawthorn (?)1
Anadara sp 0
Line 12 9 hole 6. (NW& of NEi sec 0 31. T. 31 S os R. 27 E») (fossils are in a limestone gravel)
Chlanys sp 0
Line 12. hole 8. (.NEJb of S^i sec 0 33, T 0 31 S.. Ro 27 E.)
Turritella sp Chlamys sp 0 Pecten sp 0

Liae 13. hole I. (S& of
*»
Chlamys sp 0 Venericardia sp. Phacoides sp 0
Line lg f hole 2, (HWJ of SEfr sec . 17. T. 30c S.. R. 26 E.)
Anadara sp,, Chione chipolana
Line 13, hole 5. (NWj of S£^ seco 13. To 30 S. t R 0 26 E.)
Carditmi (Trachycardium) sp. Chlamys sp« (probably sayanus) Tellina sp«
Limestones and elastics, lithologically similar to the Hawthorn
formation^ were cut by all drill holes except for holes 4 and 5 of
line 15 and holes 4 through 11 of line 1?. (See figs,2 and 18 0 ) The
approximate northern limit of the Hawthorn formation is shown on
figure 20. The thinning and pinch out of the Hawthorn to the north is
shown on figures 2 and 18„ In addition^ figure 4 indicates a thinning
of the Hawthorn to the west 0 The northern thinning of the Hawthorn is
believed to be erosional^ outliers of the formation are shown on the
geologic map of Florida (Cooke 5 1945)<» to the north of the area mapped.
The thickening of the formation to the south is shown from logs of deep
we11So

26
Hawthorn(?) formation, unnamed member
Fossils, identified as late middle Miocene or early late Miocene
in age^ were found in two areas. On the eastern fringe of the district
, F 0 S 0? written communication, 1956« MacNeil says further; I would prefer to see this zone labeled Middle Miocene(?) 0
Inasmuch as the Middle Miocene is called the Hawthorn formation in peninsular Florida it might be called Hawthorn(?) formation, unnamed member«,"
in eastern Polk County the easternmost drill holes in lines 12 and 15
(figSo 13 and 16) penetrated a bed of micaceous clayey sand, olive-green,
fine to very fine-grained, with abundant shell fragments, and minor
black phosphate grains. Lithologically similar material was identified
in lines 11, 13, and 14 (figs. 12, 14, and 15) and is tentatively
correlated with the late middle Miocene, The fossiliferous material in
hole 8 of line ~\2 (fig. 13) overlies fossiliferous limestone of the Hawthorn
formation, and in hole 6 of line 15 (fig. 16), the fossiliferous material
overlies limestone that is lithologically similar to the Hawthorn,
To the south, at the north end of DeSoto County, in line 10, hole
14 (figo 11) fossils identified as late Miocene(?) were found in a
white to cream, sandy and clayey limestone with a trace of black phosphate
nodules e This fossiliferous bed overlies a non-fossiliferous limestone
that is lithologically similar to the Hawthorn. According to Bergendahl
(in preparation) most of the upper Miocene is sand, containing variable
amounts of clay 0 This sand from its description is similar to the sand
in the east and was penetrated in holes 12, 13> 15> and 16 at the south
end of line 10.

27
The clayey sand beds lie to the east of a subsurface ridge that is
parallel to and east of the Peace River. The land-pebble phosphate
district as an economic unit does not extend to the east of this ridge,
(fig. 1) although subeeonomic phosphate beds overlie the middle Miocene(?)
beds east of the ridge.
The total thickness of the middle Miocene(?) beds is unknown. In
line 12, hole 8, (fig. 13) a tan sand, containing abundant coarse
phosphate, overlies the olive-green clay sand with late Miocene fossils.
This material is tentatively put into the Bone Valley; a/id, if this
correlation is correct, the middle Miocene(?) beds are only 10 feet
thick in this drill hole from a depth of 59,8 feet (the base of the
phosphorite bed) to 70.1 feet (the top of the fossiliferous Hawthorn).
In line 15, hole 6, (fig. 16) the fossiliferous middle Miocene(?) beds
are overlain by a tan sand with coarse phosphate nodules, also tenta
tively put into the Bone Valley, and are underlain by non-fossiliferous
limestone, lithologically identified with the Hawthorn. The middle
Miocene(?) beds extend from a depth of .74*4 to#86«0 feet, a thickness of
only 11.6 feet. This may represent the approximate shoreline of the
late middle Miocene sea, and the formation thickens to the east and
south as shown on the cross-sections, figures 11 through 16. In hole
16, line 10, (fig. 11) the olive-green sand tentatively correlated with
the middle Miocene(?) extends from a depth of 28.0 to 84.0 feet, a
thickness of 56 feet.

28
Fossils identified are as follows?
Line 10. Hole 14. (N& of S£ see. 21, T. 36 S., R. 25 E.)
Ostrea sp. aff, Q* puelchanaChlamys sp.Cardita sp eCardium sp.Venus ?Spisula ?
The oyster (0. sp 0 aff. 0. puelchana) is unlike anything in
the Hawthorn^ and this assemblage is tentatively put into the Upper
Miocene 0
Line 12, hole 8 9 (NE| of NWi sec. 33. To 31 S.. R 0 27 E.)
Anadara sp. Chlamys sp. Anomia sp. Phacoides sp, Dosinia sp. Mulinia orthria
Mulinia orthria is known only in the Shoal River. (This is
a high middle Miocene assemblage).
Line 15. hole 6, (NB£ of mi sec c 7, To 27 S.. R. 27 E.)
say anaCancellaria sp. cf 0 C tabulataTurrit ella sp c cf . T. alumensisCrepidula sp.Anadara sp 0 of A 0 idonea harveyensi^Chlamys (Plagioctenium) eboreus supsp 0 watsonensisPecten (Pecten) sp,Venus sp eSpisula (Hemimactra) delumbis

29
PlioceneC?) series
Alachua(?) formation
The name Alachua was applied by Dall and Harris (1892, p. 127)
to the bone-bearing beds found in sinks in Alachua County.
Cooke,(l945, p. 199) puts the Alachua in the middle Pliocene.
Vernon (1951, p. 183) suggests that the Alachua formation ranges in
age from lower Miocene to the Pleistocene and represents the terrestrial
equivalent of the entire marine Miocene of Florida. Fossils found in
the Alachua include bones of Miocene and Pliocene animals, which Simpson
(1930, P« 176) regarded as the indigenous fauna, and bones of Pleistocene
animals.
The formation is a blue, gray, or green sandy clay, which weathers
to a yellow or red. The sand fraction is medium to coarse, and the
formation also contains white, angular fragments of phosphate.
Sediments assigned to the Alachua(?) formation were cored only in
holes 8 through 11 of line 17 (fig. 18). The sediments are non-fossil-
iferous, coarse sandy clays containing angular white phosphate fragments,
They overlie rocks assigned to the Tampa in holes 8 through 10 and
Suwannee limestone in hole 11. Coarse quartz grains are not found in the
Tampa, Suwannee, or Ocala limestones, but are characteristic of the
Hawthorn. It is likely, therefore, that the sediments assigned to the
Alachua were derived largely from the Hawthorn, if they are not a
residuum of the Hawthorn. The angular phosphate fragments are probably
phosphatized Ocala or Suwannee limestone. The fragments are present
throughout the Alachua(?) and may indicate some reworking. The Alachua(?)

30
is overlain at hole 10 of line 17 by a sandy clay with phosphate nodules,
similar lithologically to the lower part of the Bone Valley. In holes
8, 9, and 11 of line 17 5 the Alachua(?) is overlain by clayey sands
lithologically similar to the upper Bone Valley 0 It seems likely, there
fore, that these sediments assigned to the Alachua(?) are at least in
part equivalent to the Bone Valley but may also be somewhat older.
Bone Valley formation
The Bone Valley gravel was named ty Matson and Clapp (1909, p. 138-141),
from a railroad stop west of Bartow, Fla. They divided the Bone Valley
gravel into lower beds rich in phosphate nodules and an upper, non-economic,
unit containing only traces of phosphate. Cooke (1945, p. 203)
suggested a change in name to Bone Valley formation, as gravel makes up
only a small part of the material.
The Bone Valley formation is generally regarded as Pliocene in
age on the basis of land vertebrates (Simpson, 1929), although it may
be latest Miocene. Brodkorb (1955, p. 38-39), sayss "The avifauna,
therefore, must be of late Miocene to middle Pliocene age, and the
agreement is closest to other avifaunas recorded from the early or middle
parts of the Pliocene." Bergendahl (in preparation^) shows an interfingering
of "undifferentiated phosphate," in part equivalent to the Bone Valley
formation, with a sand containing marine invertebrates which may be very
late Miocene in age. At present, this discrepancy in age assignment has
not been resolved.
The Bone Valley formation consists of a lower zone composed of
phosphate nodules, sand and clay and an upper zone composed predominantly
of clayey sand with minor amounts of phosphate nodules.

31
The lower zone., which ranges in thickness from a feather edge
to more than 30 feet at hole 1, line 8 (fig. 9) 5 is composed of
interbedded5 lens-»like beds of sand5 clay,, and clayey sand. All of
the beds contain phosphate particles, and individual beds may vary
from almost barren clay or sand to those which are almost entirely
phosphate nodules„ The upper part of the Bone Valley formation ranges
from a slightly clayey sand to a sandy clay and generally contains a few
phosphate nodules„ The contact between the lower and upper zones of
the Bone Valley formation is gradational over a vertical distance of a
few inches. The upper part ranges in thickness from a feather edge to
about 68 feet at hole 6> line 12 (fig. 13),. Toward the fringes of the
district (line 1? fig. 2) the phosphate beds of the lower Bone Valley
are not present, and the Pliocene(?) is represented by clayey sands.
These beds are lithologieally similar to the upper part of the formation.
The lower, phosphorite unit of the Bone Valley formation is present
almost throughout the area. The limits of the calcium phosphate zone,
shown on figure 15 also represent, at least roughly,, the limits of the
lower unit of the Bone Valley formation The lower unit is not present,
except as small patches north of Polk and Hillsborough Counties. The
limits of the formation to the south are not knowni the southernmost
drill holes contained material lithologieally similar to the Bone Valley.
The upper clayey sand unit of the Bone Valley formation is present
throughout the area mapped. The distinctive lithology, a medium to fine
quartz sand, lightly bound with white clays was noted in every drill hole.

32
Pleistocene series
Terrace sands
The loose sands overlying the Bone Valley are probably Pleistocene
in age. No fossils were found in any of the drill cores, but a few
horse teeth of Pleistocene age have been found in the loose surficial
sands in the land-pebble district„ The sands are nearly pure quartz,
with only traces of clay, heavy minerals, and as much as 0.5 percent
^2%° They are generally white in color but locally are stained gray
with organic material, or light brown or tan with iron. Wind-blown
sand, swamp deposits, and bars and flood plain deposits of streams are
considered Recent in age.
MINERALOGY
The mineralogy of the land-pebble phosphate district has been
described by Altschuler and others (1955)» For the purposes of this
report$ the mineralogy will be described only briefly-
Berman (1953) points out that the deeper, unaltered Hawthorn
limestone in a deep drill hole contains calcite, quartz, minor apatite^
and the clay minerals, either kaolinite or montmorillonit|j«, The
Hawthorn formation consists of dolomite, attapulgite, quartz and apatite
closer to the surface| the "matrix" of the Bone Valley formation is
quartz, montmorillonite, and apatitei and the overburden is quartz with
minor montmorillonite 0 This section is typical of those areas where
aluminum-phosphate minerals were not formed.

33
X-ray spectrometer analyses of a series of vertical channel
samples, each sample representing a very limited vertical interval,
were made by L 0 V 0 Blade of the Geological Jurvey in 1952. All of
the sections were taken from the surface to the base of the pit at
mines in the district 0 The following are generalizations from several
sections which are believed typical of areas that were leached and
where aluminum-phosphate minerals were formed„
The loose surface sand contains only quartz, except near the
contact with the clayey sand of the upper Bone Valley, where minor
kaolinite was detected 0 The clayey sand of the upper Bone Valley,
whether obviously leached or not^ contains kaolinite, wavellite,
crandallite, and possibly a minor amount of montmorillonite„ Quartz
is ubiquitous. The same minerals are present at the top of the lower
Bone Valley, but at the upper contact or slightly above it, montmorillonite
is the most abundant clay mineral, apatite is abundant and commonly
crandallite is more abundant than wavellite 0 In the lower Bone Valley
("matrix") apatite and montmorillonite are the most abundant minerals5
kaolinite and aluminum-phosphate minerals are minor constituents. The
residual Hawthornv ; (bedclay) contains calcite and dolomite in addition
to apatite and montmorillonite.
CHEMISTRY
Table 1 was made from the analytical and screen data from the
drilling 0 Only samples which were clearly in one of the stratigraphic
intervals shown were used. Many of the samples taken included more

34
Table 1 0 --Comparison of screen size distribution and chemical analyses. Averages of samples fromdifferent stratigraphic intervals.
+ 14 (pebble)-14 + 35 (feed)-35 + 150 "-35 + 150(concentrate)-35 + 150 (tall)-150 (slime)
1-9.310.7
I/
10.125e 5340 4
5.1130 0
10,545 0 126.2
8 0 318.0
10 0 649 6 6130 5
11.214,7
6.2540 513.4
8,3140 3
6.844.026,4
1.617.066.5
140 9
Percent Pn O e z oV
PebbleConcentrateSlime
17,922 0 9
22,130 0 1
25.630.0
27.031 0 5
; Percent U
PebbleConcentrateSlime
0 0 0070 0 006
O a 0090 0 008
0.0140 0 011
0 4 0130 6 Q10
CaO/P0O K ratio£t O
PebbleConcentrateSlime
30 152 0 67
1.621.4*7
1 8 691.37
1,471 0 39
31,8340 1
11.2none120 4
0 0 01600 012
1,321.38
00 008none0 0 020
0.61none00 49
F /P2Og ratio
PebbleConcentrateSlime
0.1190.115
0.1140.110
0.1140.112
0.1140.114
0.108O.J.10
0 0 079none0,052
The -35 + 150 mesh feed fraction was separated, by flotation into a concentrate and sand tailings fraction. No concentrate was present in the samples from the aluminum phosphate 2one of the Bone Valley formation.


35
than a single stratigraphie intervale For example, in many of the
drill holes, a single sample of the calcium phosphate zone was taken?
the sample may include phosphate of both Bone Valley and Hawthorn„
The weight distribution shows that samples of the limestone of
the Hawthorn contain the highest percentages of pebble, and the analyses
show that the pebble fraction is low in phosphate, and from the calcium/
phosphate ratio, contain excess calcium. Probably the pebble sample
contains abundant particles of slightly phosphatized limestone, as well
as the coarser particles of calcium phosphate 0 The limestone also
contains the highest percentage of slime, and the lowest percentage of
quartz sand (the tails fraction) of any of the samples„
Hawthorn clastics 5 however, have much less pebble, slightly less
slime, much more sand, and about the «ame amount of concentrate as the
limestone,,
The phosphate of the unnamed member of the Hawthorn (?) formation
differs from the Hawthorn principally in the amount of the slime
fraction, which is only half of that in the Hawthorn. The pebble
fraction is higher, the concentrate about the same, and the sand fraction
is increased slightly.
Phosphorite of the Bone Valley has been divided into those deposits
characterized by black phosphate nodules and those characterized by
lighter colored nodules (white, tan and gray). The darker material
contains a high pebble percentage and a lower concentrate fraction than
the middle Miocene(?) or the lighter material of the Bone Valley 0 Also,
the slime fraction of the darker material is low^ half as much as in the
lighter material.

36
The aluminum phosphate zone is characterized by a very minor pebble
fraction,, high, sand,, with no concentrate^ and medium slime c
SeYeral generalizations about the phosphate content of the nodules
in the different stratigraphic units can be made? First, the pebble
fraction always has less phosphate than the concentrate fraction! second,
the phosphate content of the aluminum phosphate zone is only about half
that of the calcium phosphate zone; and third, the phosphate content of
the nodules is highest in the Bone Valley5 and gets progressively lower
in the middle Miocene(?)| Hawthorn elastics, and is lowest in the
Hawthorn limestone„
The uranium content also varies in a more or less regular manner
and follows the variations in phosphate content. In general, the uranium
content of the phosphate nodules is greater in the coarser fraction, is
higher in the calcium phosphate zone of the Bone Valley and middle
Miocene(?) than in the Hawthorn elastics^ and the limestone of the
Hawthorn contains the least amount of uranium. It is also notable that
the highest average uranium content is found in the slime fraction of
the aluminum phosphate zone.
The calcium/phosphate ratio is lowest in the aluminum phosphate
zone, increases regularly through the Bone Valley, middle Miocene(?)
and Hawthorn elastics, and is greatest in the Hawthorn limestone. This
change in ratio corresponds to a change in mineralogy—from aluminum
phosphate to calcium phosphate to calcium phosphate plus calcite. It is
also interesting to note that the ratio is generally higher in the pebble
fraction than in the concentrate fraction c The calcium/phosphate ratio in
fluorapatite (Palache, and others^, 1951) is slightly more than 1 0 3 ? and

37
only those samples highest in phosphate^ (the pebble fraction of the
light phosphate of the Bone Valley? the concentrate fractions of the
Bone Valley and middle Mioeene(?) approach this theoretical ratio. All
of the other samples contain an excess of calcium,,
The fluorine/phosphate ratio is less than 0.1 only in the samples
of the aluminum phosphate zone^, is about the same for all of the samples
of the calcium phosphate zone 5 and is slightly higher in the samples
from the Hawthorn limestone. Fluorapatite has a theoretical ratio slightly
in excess of 0.10. The pebble fraction of the light phosphate of the
Bone Valley formation approaches this theoretical ratio most closely;
it is also these samples that are closest to the theoretical calcium/
phosphate ratio for fluorapatite 0
WEATHERING •"
Intense weathering has altered the rocks in the land-pebble
district., apparently several times„ Lack of fossils and the similarity
of the rock types make it difficult to separate the different weathering
cycles 0 The unconformable relations between the Bone Valley and the
Hawthorn formations cannot be demonstrated from the drilling,, but these
relationships have been noted in mining pits where basal phosphorite
conglomerates of the Bone Valley rest directly on the irregular, eroded
surface of limestone or dolomite of the Hawthorn formation. It seems
likely that a period of weathering followed the deposition of the Hawthorn.
This weathering dissolved the calcium carbonate, leaving behind a residuum
enriched in phosphate particles„ The transgressing sea of the Bone Valley

38
reworked this residuum and deposited the Bone Valley formation on the
irregular karst topography of the Hawthorn 0 It has been noted that the
limestone of the Hawthorn has been dolomitized close to the surface„ That
this dolomitization took place after the deposition of the Bone Valley
formation is indicated by the fact that the phosphate particles of the
Bone Valley, many of which are phosphatized limestone,, contain no
magnesium; complete analyses show that phosphate particles average less
than 0.1 percent Mg05 whereas the Hawthorn "limestone" may contain 20
percent MP0 or more. Weathered sections of the Hawthorn (the thickero
sections of calcareous bedclay) are close to and apparently related to
the present land surface 0 Deeper beds in the Hawthorn are fresh5 un-
weathered rocks. Therefore 5 it is believed that the residuum formed
on the Hawthorn surface prior to the deposition of the Bone Valley
formation may have been entirely reworked into the Bone Valley.
The intense weathering that formed the aluminum phosphate or
leached zone took place after the deposition of the Bone Valley 0 This
zone of alteration underlies and is older than the surficial soil
profile 9 a ground-water podzo!5 typified by the acid Leon soi!5 (Fowler^
1927 5 P» 11)» Figure 7 illustrates the typical soil profile—loose light
gray surficial sand, overlying a dark-brown to black iron-cemented and
organic sand. Below this layer the sands are loose and stained brown
with iron 0
The alteration is generally confined to the upper part of the Bone
Valley formation and to the top of the lower part 5 although there is
some aluminum phosphate as low in the stratigraphic section as the
Hawthorn formation, (line 15 fig. 2); and even the Tampa (line 17 5 fig.

39
The alteration changed calcium phosphate minerals to aluminum
phosphate minerals, and the dominant clay mineral from montmorillonite to
kaolinite. It is possible that in addition this period of weathering also
altered the limestone of the Hawthorn to a dolomite and, by continued
leaching, changed the limestone to calcareous clay.
The formation of the surfieial soil profile is the last episode of
the weathering and presumably occurred during one or more of the Pleistocene
withdrawals of the sea.
ECONOMIC GEOLOGY
Two zones of economic significance are shown on the cross-sections
(fig. 2-19). These zones are the calcium-phosphate zone or "matrix," and
the aluminum-phosphate or "leached" zone. Neither term is used in a
stratigraphic sense; both units cut across the stratigraphy. (See fig. 11,
holes 11, 12, 13.)
Calcium-phosphate zone
The calcium-phosphate zone is that part of the stratigraphic section^
which is characterized by nodules or particles of carbonate-fluorapatite
(Altschuler and Cisney 5 1952). This ?,one it nearly synonymous with the
"matrix," which is that part of the section which can be mined profitably
under existing economic conditions. The calcium-phosphate zone may be t
entirely within the lower zone of the Bone Valley formation^ or it may be
entirely the residual Hawthorn (the calcareous "bedclay") or a combination
of the tifvo.
Many of the drill holes bottomed in formations olde,* than the
Hawthorn. In many of the holes, sections of core from the Hawthorn
contained phosphate nodules. These sections of phosphate-bearing
Hawthorn are not included in the calcium-phosphate zone when they are
separated from the lower phosphatic unit of the Bone Valley formation
40
by barren clays or sandy clays. The phosphate-bearing calcareous clay
of the Hawthorn formation is considered a part of the calcium-phosphate
zone only when it immediately underlies the Bone Valley formation and
is close enough to the surface to be mined„ The calcium-phosphate zone
as used in this report is not synonymous with "matrix" because some of
the factors necessary for deciding whether a given drill hole contains
economic phosphate could not be computed. Factors that must be
considered in separating economic from non-economic phosphate ares
(l) thickness of waste material (overburden) above the zone (computed
in cubic yards of material removed to recover one ton of product), (2)
amount of recoverable phosphate (computed in tons per acre), (3) amount
of waste material in the phosphatic zone (computed in cubic yards of
matrix per ton of product),, (4) P^Oc content of the phosphate particles
(computed as percent bone phosphate of lime-BPL), (5) thickness of the
zone in feet, and (6) total combined iron and alumina in percent. If
any of these factors are above the maximum allowable limit or below a
given minimum limit, the deposit is probably not minable. Because each
active company in the district has slightly different standards for
each factor, the figures given in table 2 are approximate„
Table 2.—Economic factors, calcium-phosphate zone
Maximum Minimum
Cubic yards overburden per ton of recoverable product 15-20Cubic yards matrix per ton of recoverable product 5-7Thickness (in feet) of matrix bed 3.0Tons per acre foot of recoverable product 400Percent B.P.L.^(percent P205 x 2.185) 66.0Percent combined iron and alumina (I&A) 5.0 _/ B.P.Lo =bone phosphate of lime.

41
These factors are not absolute 0 For example, a deposit containing
only 66 percent BPL phosphate must have a smaller factor of cubic yards
per ton and a greater factor of tons of product per acre than a deposit
containing 75 percent BPL. In addition, a single drill hole might
contain some factors.that were not economic; but, if located in an area
containing better than average material, it would be mined if the
average of the larger area was economic. To block out a deposit 16
holes per 40 acres are drilled, or one hole in each two and one-half
acre block„ The area of a standard drill hole is about one-millionth
of the area of the 2-1/2 acre block. Thus, the accuracy of tonnage and
grade estimates for this drilling is extremely low, and tonnage and
grade figures are not projected but are given only in tons per acre, or
cubic yards per acre.
Aluminum-phosphate zone
The aluminum phosphate zone is that part of the section that has
been strongly altered by acid ground waters. The zone is characterized
by the presence of aluminum phosphate minerals, kaolinite, and generally
by the highest uranium content as indicated by the high peaks on the
gamma-ray Iogs 0 The alteration is generally confined to the upper part
of the Bone Valley formation and the top of the lower part, although
aluminum phosphate minerals were developed as low as the Hawthorn
(fig. 2) or the Tampa (fig e 18). The zone can be identified by some or
all of the following features; vesicular-like texture, secondary cements,
white color, low specific gravity, and indurated or friable character.

42
Factors concerned in the economics of the aluminum-phosphate zone
are more uncertain than those for the calcium-phosphate zone because
so little is known as to the possible processes that may be used to
recover the various materials in the zone. For example, any one or
combination of three products, phosphate, alumina and .uranium might be
obtained from this zone 0 For purposes of this report, it is assumed
that phosphate and uranium will be recovered, and that alumina will not
be a product. The lines of possible economic correlation on the cross-
sections are drawn on this assumption. If alumina should be recovered
as a third product, some of the upper clayey sands that have been
excluded from the aluminum-phosphate zone on the cross-sections may
become economic„ However, because these clayey sands are low in uranium,
they were not analyzed for phosphate or alumina 0 Therefore, it is not
possible to say whether they contain enough alumina or phosphate to be
economic,,
If the above assumptions are correct, the factors that affect the
economics of the aluminum-phosphate zone ares (1) thickness of the
waste material above the zone, (2) thickness of the zone, (3) phosphate
and uranium content of the zone in percent, (4) CaO and ALpOo content
of the zone in percent, and (5) whether economic calcium-phosphate zone
underlies the aluminum-phosphate zone,, At present, all mining of the
zone must be integrated with the mining plans of the active companies
for the phosphate matrix. As indicated oh figure 1, fringe areas to
the west and northwest of the central part of the land-pebble district
are underlain by aluminum-phosphate zone, which is not underlain by matrix.

43
An absolute figure for excessive overburden thickness cannot be
given. However, because the digging depth of the largest draglines
is about 70 feet, more than about 90 feet of waste material overlying
the zone would be excessive„
The cutoff value of contained 1?2®5 ^ias ^een arbitrarily placed at
5 percent, principally because large areas contain aluminum-phosphate
zone with more than 5 percent PpO,.* and other large areas are underlain
by clayey sands which contain less than 5 percent 1?2®5'
A lower limit of 0.005 percent uranium has been chosen because
most of the samples which were above this value had high contents of
uranium in the slime fraction (in which the aluminum-phosphate minerals
are concentrated). The uranium content of the slime fraction tends to
be greater than 0.010 percent in samples where the head assays range
from 0.005 to 0.010 percent U. Conversely, in samples where the head
assay is less than 0.005 percent uranium, the slime fractions tend to
be less than 0.005 percent.
Little is known about the effect of high or low CaO content, but
processing costs possibly could rise with high calcium.
If the final product is to be a fertilizer, a high alumina content
could be somewhat less desirable than a lower content, but it is not
possible to evaluate the effect of varying alumina content.
General relations
The index map, figure one, shows the location of the drill holes,
the limits of the calcium phosphate zone, and the limits of the aluminum
phosphate zone c The ^imits of the phosphate zones are based only on the

44
115 drill holes shown. Figure 1 shows that to the northwest the aluminum
phosphate zone extends beyond the limits of the calcium phosphate zone
(see lines 1, 2, 3, k$ 17 5 and 18), and that the aluminum phosphate zone
apparently extends farther to the south, in Harde2 and Manatee Counties
than was previously known. This extension is based on lines 9 and 10,
and because of limited data it is possible that only patches of aluminum
phosphate zone are present in this area. East and south the calcium
phosphate zone extends beyond the limits of the aluminum phosphate zone.
The difference in position of the two lines may be explained by the facts
that 1) iri the northwest phosphate deposits were thinnest, the entire
calcium phosphate zone apparently was leached, so that only remnants of
it remain, and 2) where -the Bone Valley formation was thicker to the
south, only the top part of the formation was leached, and hence both
zones are still present„ Still farther to the south, in Hardee and
Manatee Counties, the formation may not have been exposed to subaerial
weathering, and no aluminum phosphate zone was formed. (See discussion
.of lines 7, &, and particularly, 9») The limit of the aluminum phosphate
zone on the east coincides approximately with the present topographic
ridge to the east of the Peace River. The land east of the ridge, which
is lower in elevation than the land to the west, also probably was not
exposed to subaerial weathering. The present limit is the result of a
combination of two factors? (1) erosion after the zone was formed, and
(2) the possibility that somewhere to the east the phosphatic sediments
were not exposed to weathering.

45
SUGGESTIONS FOR EXPLORATION
The area east of R. 26 E., even though there may be some
leached material present, is deeply buried by barren sands of the
overburden and is not a good area for exploration. The most
promising areas for exploration, based on the results of this drilling
program* are first, the area*, to the northwest in Hillsborough and
Pasco Counties, where the aluminum phosphate zone is not underlain
by economic matrix, and second, the area to the south, in Hardee and
Manatee Counties, where extensive deposits may be present. This
latter area has not been extensively explored by the private companies
because of the low grade of the phosphate nodules in the matrix. It
is most probable that the area is not entirely underlain by aluminum
phosphate zone, but in some localities, particularly adjacent to the
Peace River, aluminum phosphate zone material may be present. Results
of scattered drilling west of the Peace River, in Hardee and Manatee
Counties, indicate that patches of the aluminum phosphate zone are
present. This area should be explored further if it becomes necessary
to outline reserves of the aluminum phosphate zone more fully. The
remainder of the district, in Polk and Hillsborough Counties, probably
has been well-enough explored by private companies at least for pre
liminary estimates of tonnage and grade.

46
DISCUSSION AND EXPLORATION OF FIGURES
General
Table 3 is a summary of the lithologic characteristics used in
stratigraphic correlation. The table shows, for example, that the
elastics of the Hawthorn formation are loose sands, clayey sands,
calcareous clays, or green or blue sandy or silty clays; all contair
phosphate particles, low in P 0,. content. The elastics of the Hawthorn*~ P
contain more phosphate particles and fewer chert fragments than the Tampa
elastics. The criteria as shown on the table are not invariable but are
in general characteristic of the formations. For example, chert
fragments do not always occur in the elastics of the Tampa formation,
and occasional chert fragments or silicified fossil fragments are found
in the Hawthorn formation. However, chert fragments in a calcareous clay
overlying fossiliferous Suwannee limestone (fig. 2) were considered
enough evidence to classify this material as Tampa.
Line l s figure 2
Stratigraphy
Suwanflee.- -Fossils from the bottom of hole 4 were identified as
Oligocene in age. Hole 5 was bottomed in a very hard bed, probably-
siliceous limestone, that is correlated with the Suwannee limestone
of hole 4.
Tampa.— Fossils from the bottom of hole 3 were identified as early
Miocene in age. In addition, the sandy calcareous clay from sample 13
(table 4) contained no phosphate particles and is included in the Tampa.
The limestones in holes 1 and 2 are lithologically identical with that in

TA
BL
E
3S
UM
MA
RY
OF
LITH
OLO
GIC
C
RIT
ER
IA
US
ED
IN
S
TR
AT
IOR
AP
HIC
C
OR
RE
LA
TIO
N
-FO
RM
AT
ION
TE
RR
AC
ES
AN
DS
UP
PE
R
BO
NE
V
AL
LE
Y
LO
WE
RB
ON
E
VA
LLE
Y
HA
WT
HO
RN
C
LA
ST
ICS
HA
WT
HO
RN
LIM
ES
ON
E
TA
MP
AC
LA
ST
ICS
TA
MP
A
LIM
ES
TO
NE
SU
WA
NN
EE
LIM
ES
TO
NE
OC
AL
ALIM
ES
TO
NE
w
•^> o
to Nl
cu +
-V
) k-
0 0
O 3
_J c
r
y X X
oT — o
<_
> co
X X X
0
O
C
>^
O
«
?l
o e y
o» .5 "
c o
2-^
- Q
. ta
T3 t.
C
0
O
XT
h.
_ y X
E£
.?*&
£ ,
V>-,
o_
-C.
<Q
.
A TR TR
CA
LC
IUM
P
HO
SP
HA
TE
N
OD
ULE
S
lO
0 -C o» £ X X
in
o CJ
0. o X y X X i
o»
o c c
o
t- TR A X y TR
-
TR
CO a. s* "e o«»: X X
a> 3 >
,S
z
H-
._
V) <u c
^
Sill
X X
n
O v_
O
^0
o—
—
o
00 X X
LIM
ESTO
NE:
^ X
CO
JC
v.
«.! y
w
a>
^!o .
tlk.
W<P
-3
•o
a.
If X '
(0*-
«c —
o ±
1T
3
i^C
3
TS a
.
5.! y A
T) a>
H- o ^ V
•
A -
ab
un
da
nt;
X
= p
res
en
t;
TR =
tr
ace
om
oti
flts

48
hole 31 they are correlated on this basis. In holes 1, 2, and 4> the
calcareous clay above the limestones contains chert fragments, limestone
fragments, and very sparse phosphate nodules5 this material is tentatively
called Tampao
Hawthorn.—Greenish silty clays, calcareous clays and sands, all of
which contain phosphate nodules, overlie the sandy clays of the Tampa
formation in holes 1, 2, and 3« These materials are tentatively correlated
with the Hawthorn formation. The contact between the Hawthorn and the
Bone Valley is marked in holes 1, 2, and 3 by a green silty clay under
lain by a bed of quartz sand containing amber phosphate nodules. The
Hawthorn formation pinches out to the northj apparently it is not
represented in holes 4 and 5.
Bone Valley.—Slightly clayey sands overlie the greenish clay of
the Hawthorn formation in holes 1 and 3> the calcareous clay of the
Tampa formation in hole k> and the hard material on which hole 5 was
bottomed. Phosphate sand is between the clayey sand and the green clay
of the Hawthorn formation in hole 2. The clayey sand and the phosphate
sand are believed to be Pliocene in age and equivalent to the Bone
Valley formation.
Terrace sands.—White, loose, quartz sands overlie the iron-stained
clayey sands in each drill hole. These surficial sands are lithologically
alike and are believed to be of Pleistocene age.
Economic geology
The calcium phosphate zone was cut only by hole 2, where it is
thin, low grade, low in tonnage (table 4)> and not economic. Small
amounts of phosphate nodules, low in Po^c content were found in samples
/
49
of the Hawthorn formation from holes 1 and 31 because of excessive
depth, low tonnage, and low grade, these samples are not included in
the calcium phosphate zone,.
The aluminum phosphate zone was penetrated by holes 1, 2 3 3> and
4j tonnages and uranium contents are given in table 5. The thick section
of clayey sand in hole $ probably contains some aluminum phosphate
minerals, but the content is too low for the sand to be an economic
source of phosphate and uranium.
All of the analytical data and results of screen-size analysis
are shown in table 4.
Line 2, figure 3
Stratigraphy
Suwannee„—Fossils from the limestone of hole 4 were identified
as Oligocene in age 0 The hard material at the bottom of hole 3 is
tentatively correlated with the Suwannee because fossils of early
Miocene age were found above the hard material. The Suwannee was
probably not intersected in drill holes 1 and 2.
Tampac—-Casts and molds of fossils identified as lower Miocene in
age were found in a thin bed of siliceous material cut by hole 3.
Although it is possible these fossils are reworked, the lithology of
the material in which they are found is similar to the lithology of
the core from hole 4 that overlies the Suwannee.

50
Hawthorn.-°The greenish silty clays, sandy clays, and clayey sands,
all of which contain phosphate grains, are lithologically similar to the
Hawthorn«> These materials overlie material lithologically like the
Tampa in holes 1, 3^ and 4° The Hawthorn is thickest at hole 1 and
is a little thinner to the northwest „
Bone Valley.—The Bone Valley formation is thickest at hole 1,
and thins to the northwest to hole ks except that at hole 2, in the
sink hole, the formation thickens«, and the base was not reached. The
calcium phosphate zone is present at holes 2 and 3* is absent at hole 4>
and may be present at hole 1 9 in the section of core that was not
recovered 0
White, gray or brown (iron-stained) clayey sands form the upper
part of the Bone Valley formation at holes 1, 2, and 3- At hole 4 the
entire Pliocene(?) is clayey sand,3, lithologically similar to the clayey
sand of holes 1 5 2 5 and 3»
Terrace sands.-=-The base of the Pleistocene(?) at hole 1 is put
at the base of the highly organic sando The great thickening of the
section at hole 2 is due to the filling of a sink hole. The base of
the Pleistocene(?) at holes 3 and 4 is the contact of the loose, surficial
sands with the clayey sands of the upper part of the Pliocene(?) 0
Economic geology
Although the calcium phosphate zone is present at holes 1, 2, 3*
and 4> no economic material is present. Samples 21 and 22 (tables 6
and 7) from hole 1 contain calcium phosphate nodules, but they are low

51
in grade, low in tonnage, and are covered by too great a thickness
of barren material (overburden) to be economic| therefore^ this material
is not considered a part of the calcium phosphate zone.
The aluminum phosphate zone, a part of the clayey sand of the upper
part of the Pliocene(?) Bone Valley formation or its equivalents, varies
in its position in the section. It forms the bottom part of the clayey
sands at holes 1 and 2, the upper part the clayey sand at hole 3 5 and at ,
hole 4 the entire zone of clayey sand is possibly aluminum phosphate zonf.
The highest gamma-ray peak (2700 counts per minute—cpm) in the aluminum
phosphate zone is in hole 1. In hole 2 the high peak is greater than
1800 cpm, in hole 3 it is less than 1800 cpm, and in hole 45 the high
peak barely reaches 900 cpm,, Thus, there seems to be a decrease to the
northwest and toward the fringe of the district in the concentration of
uranium,
Line 3» figure 4
Stratigraphy
Tampa.---- Early Miocene fossils were found in limestone fragments in
sandy clay in the bottom of hole 2. Lithologically similar material
from holes 1, 3$ 4$ and 5 is considered a part of the Tampa, No fossils
were found in the limestone cores from holes 1, 3 9 k> and 5, but these
limestones are lithologically like the Tampa limestone and are tentatively
correlated with the Tampa.
Hawthorn.---Greenish sandy clays and clays, in part containing
nodules of calcium phosphate are tentatively correlated with the
Hawthorn 0 The contact of the Hawthorn with the underlying Tampa at
52
hole 2 is the base of these phosphate bearing clayfc, with the somewhat
different sandy clays which contain fossils. The Hawthorn formation
thins to the west.
Bone Valley.—The Bone Valley formation at hole 1 consists of an
upper zone of clayey sand, with traces of soft white phosphate nodules,
and a lower phosphorite zone. The lower zone contains abundant coarse
phosphate. At holes 2, 3, k> and 5> the lower zone is not present, and
the Bone Valley is represented by white or tan clayey sand, probably con
taining some aluminum phosphate minerals. The clayey sand is lithologically
similar in all holes.
The top of the Bone Valley at hole 3 is marked by a gray clay bed.
This clay is not like any other clay in the cross-section.
Terrace sands.—Loose, gray, tan or white quartz sands overlie
the clayey sands of the upper Bone Valley(?) in all drill holes. These
sands are tentatively classed as Pleistocene.
Economic geology
The calcium phosphate zone was penetrated only by hole 1, where it
is thin, but very high in BPL,,content. (See tables 8 and 9») The
analyzed material from hole k> (sample 35) is high enough in BPL content
to be a part of the calcium phosphate zone, but tonnages are very lowj
therefore* it is not included in the calcium phosphate zone. The phosphate
bearing material from hole 3 was not analyzed5 visual inspection of the
core indicated that only uneconomic amounts of phosphate were present.
The aluminum phosphate zone, at holes 1 and 2, at the top of the
section of clayey sand, was delineated by analysis and by the high radio
activity shown on the gamma-ray logs. The clayey sands of holes 3> 4,
and 5 > analyzed only from hole 4* are too low in uranium content and

53
probably in phosphate content to be economic, although aluminum phosphate
minerals are probably present. The material, therefore, is not included
in the aluminum phosphate zone.
Line 4» figure 5
Stratigraphy
Tampa.—Fossils from the limestone cores at the bottom of holes 1
and 3 were identified as early Miocene in age. A zone of iron-stained
and cemented, laminated sandy clays at hole 1 occurs above the limestone.
The lithology of this material does not resemble anything in the Hawthorn
and is very tentatively correlated with the Tampa.
Hawthorn.—The limestone at the bottom of hole 2 contained fossils
identified as probably middle Miocene. The greenish sandy clay above the
Tampa at hole 1, plus the phosphate-bearing sandy clay of sample 41 are
tentatively correlated with the Hawthorn. The phosphate-bearing calcareous
clay from hole 1 together with the calcareous clay above it are put into
the Hawthorn.
Bone Valley.—Lower Bone Valley was penetrated by holes 1, 2, and 3»
At hole 1, the contact of the Bone Valley with the Hawthorn is at the top
of the sandy clay of sample 41> which contains lower £2®$ content nodules
than the clayey sand of sample 40 (table 10). The lower unit of the Bone
Valley rests on Hawthorn limestone at hole 2. The contact between the
units is sharp| the phosphorite above the contact is bedded and non-
calcareous. At hole 3* the lower unit of the Bone Valley rests on greenish
calcareous sandy clay of the Hawthorn. The upper clayey sand of the Bone
Valley is present at holes 1 and 2, but is absent at hole 3, where highly
carbonaceous sands rest directly on the lower unit of the Bone Valley.

54
Terrace sands.—The loose, slightly iron-stained and highly organic
sands at the surface are tentatively correlated with the Pleistocene.
Economic geology
Possibly economic calcium phosphate zone was penetrated by all
drill holes in this line (table II). The calcium phosphate zone at
holes 1 and 3 is made up of the lower unit of the Bone Valley formation
and the phosphate-bearing beds of the Hawthorn formation. However, the
entire calcium phosphate zone at hole 2 represented by the lower unit of
the Bone Valley formation.
Possibly economic aluminum phosphate zone material was penetrated
only in hole 1, where it is delimited by the gamma-ray log. Hole 2
penetrated upper Bone Valley clayey sand, probably containing some
t - Aluminum phosphate minerals. This material is not considered a part of
the aluminum phosphate zone because the gamma-ray log was not above back
ground in the interval represented by the clayey sand. Clayey sand of
the upper part of the Bone Valley formation was not penetrated by hole 3»
Tonnages and grades for the possibly economic parts of the cores are
given in table 11.
Line 5» figure 6
Stratigraphy
Hawthorn.—Phosphate-bearing sandy, clayey limestone at the bottom
of holes 3 and 4 is correlated with the Hawthorn. Although no limestone
was recovered in holes 1 and 2, the holes were bottomed on hard material
which is assumed to be limestone of the Hawthorn. Calcareous, sandy,
phosphatic clays overlying the limestone at hole 3> and similar clays
in holes 1 and 2 are tentatively correlated with the Hawthorn.

55
Bone Valley,—The lower zone of the Bone Valley formation was
penetrated in holes 15 2 S and 3« The contact with the underlying
Hawthorn is put at the top of the calcareous clays. Clayey sands of
the upper part of the Bone Valley formation are present in all drill
holes. The contact of the upper unit with the lower unit is placed
at the appearance of calcium phosphate nodules«,
Terrace sands.—Loose quartz sands 5 tentatively assigned to the
Pleistocene were cut by each drill hole. The contact with the upper
Bone Valley formation is placed at the base of the iron-stained loose
sand.
Economic geology
The calcium phosphate zone is present at holes 1, 2, and 3 (tables
12 and 13)o At holes 2 and 3 the zone includes phosphate deposits of
both the lower Bone Valley and the Hawthorn formation. The basal
calcareous clay at hole 1 was excluded from the calcium phosphate zone
because of probable very low tonnages. The analyzed material from
hole 4, although it is not too different in phosphate content from the
material in other drill holes, is excluded from the calcium phosphate
zone because it is in a limestone which would be very difficult to mine
and process.
The aluminum phosphate zone is present at holes 2 and k* The zone
was delimited by the use of the gamma-ray logs. The material of sample
42, hole 1 contains aluminum phosphate minerals but was excluded from
the aluminum phosphate zone because the computed head analysis would be
too low in phosphate and uranium contact. (See tables 12 and 13o)

56
Line 6 9 figure 7
Stratigraphy
Hawthorn.--Limestone was penetrated only by hole 3« The limestone
contains abundant phosphate particles, sand, and clay and is therefore con
sidered to be a part of the Hawthorn formation , The remaining holes in this
line bottomed on a hard material from which no core was recovered. This
material is tentatively considered to be limestone of the Hawthorn
formation. The calcareous, sandy, phosphate bearing clays at the bottom
of each hole are considered to be Hawthorn. Except at hole 5> the
phosphate particles in these calcareous clays contain very low amounts
of P205 .
Bone Valley.—The lower phosphorite zone of the Bone Valley is
present at holes 1, 2, and 3> but is absent from holes 4 and 5« The
contact of the Bone Valley with the Hawthorn in these holes is placed
at the top of the calcareous clay c In addition, the phosphate particles
of the Bone Valley contain much higher amounts of ?2®5 than the phosphate
particles in the calcareous clay of the Hawthorn (table 34). The upper
clayey sand of the Bone Valley formation is present at all drill holes.
This unit contains trace amounts of apparently unleached phosphate
particles at holes 3 and 4° The material is leached at holes 1 and 2
where aluminum phosphate minerals are present.
Terrace sands.--The loose surficial sands show evidence of a typical
Leon soil profile,, At holes 2, 3* 4> and 5> the loose, white surficial
sands are underlain by iron-stained and organic sands, which are under
lain by brown and tan loose sands. The contact of the Pleistocene(?)

57
with the Bone Valley formation is placed at the top of the clayey sands
where the iron-staining becomes insignificant. At hole 5 the contact
is placed in the middle of the section of core that was not recovered,
at the point where there is a slight rise in the gamma-ray log. This
rise probably coincides with an increase in clay content.
Economic geology
The calcium phosphate zone was penetrated by holes 1, 2, and 3*
where it is entirely within the lower unit of the Bone Valley formation.
Analyzed material below the calcium phosphate zone, in the Hawthorn
formation contains too little P00 to be economic; this material is2 5
therefore not considered a part of the calcium phosphate zone. (See
tables 14 and 15*) Phosphate-bearing calcareous clay of the Hawthorn
formation in holes 4 and 5 is excluded from the calcium phosphate zone
because of excessive thicknesses of overburden and too little tonnage
of phosphate.
The aluminum phosphate zone is present at holes 1, 2, and possibly
at hole 3- The top contact in each of these holes is placed at the rise
in the gamma-ray log; the basal contact, at the appearance of calcium
phosphate particles» At hole 3* the material called aluminum phosphate
zone because of the rise in the gamma-ray log contains phosphate nodules,
and may be calcium phosphate zone.

58
Line 1, figure 8
Stratigraphy
Hawthorn. —Limestone core was recovered only from hole 4; all
other holes bottomed in hard material, presumed to be limestone of
the Hawthorn. Sandy, clayey, phosphate-bearing, calcareous clays at
the bottom of all holes are tentatively correlated with the Hawthorn.
Bone Valley.—The lower1, phosphorite zone of the Bone Valley formation
was penetrated by all drill holes. The contact of the Bone Valley with
the Hawthorn is the top of the calcareous clays. ?2®5 contents °£ ^ne
phosphate nodules are higher above this contact than below it. (See
table 16.) The upper clayey sands of the Bone Valley formation were
also penetrated by all drill holes in this line.t
Terrace sands.—Loose, white, surficial sand is underlain by iron-
stained, cemented, and highly organic sand, which is in turn underlain
by brown, loQse sand* These sands probably form a soil profile, and
are tentatively assigned to the Pleistocene„ The contact of the
Pleistocene(?) with the underlying Bone Valley is at the top of the
clayey sand. This contact generally coincides with a rise in the radio
activity, as shown by the gamma-ray logs.
Economic geology
The calcium gfaosphate zone was penetrated by all drill holes54- V
however, stratigraphically this zone is made up of Bone Valley, Hawthorn,
or both, in this section. The zone is composed of botfc Hawthorn and
Bone Valley at holes 1, 2, 3 3 and 4. The entire calcium phosphate zone
at hole 5 is represented by the lower unit of the Bone Valley formation.
(See tables 16 and 1?.)
59The aluminum phosphate zone is present only at holes 1, 2, and 3
where it is delimited by the high peaks on the gamma-ray logs. The>
high peak at hole 4 is apparently entirely within the calcium phosphate
zone, and radioactivity as shown by the gamma-ray log at hole 5 is only
about twice background; too low for the clayey sand to be considered
possibly economic.
Line 8, figure 9
Stratigraphy
Hawthorn.—Although no limestone cores were recovered from any of
the drill holes, each hole bottomed on hard material, presumed to be
limestone, probably of the Hawthorn formation. The greenish, calcareous,
sandy clays and clayey sands at the bottom of holes 1, 2, and b, are
tentatively Correlated with the Hawthorn, because of their high phosphate
content, color, and general appearance. At hole 3> phosphorite of the
Bone Valley(?) formation rests directly on the hard material.
Bone Valleyo—The lower, phosphorite zone of the Bone Valley is
present at all drill holes. The material consists of quartz sand, and
coarse black phosphate particles, with only a small amount of clay. The
screen analyses in table 18 show that the clay content of the Bone Valley
is less than the clay content of material correlated with the Hawthorn.
The upper clayey sands of the Bone Valley formation were penetrated by
holes 1 and 3, and are absent at holes 2 and 4» The upper contact of the
lower unit of the Bone Valley is put at the rise in the gamma-ray log.
Terrace sands.— Loose quartz sands at the surface, iron-stained or
cemented sands 5 and highly organic sandy clays are all tentatively correlated
with the Pleistocene. Organic sands are close to the surface at holes 1
and 4, but at holes 2 and 3> a very highly organic sandy clay is at the base
of the KLeistoeene(?) 0

60
Economic geology
The calcium phosphate zone was penetrated by all drill holes.
The coarse fraction (pebble) is invariably too low in PO^S content
to be economic, but the concentrate fraction is, in most of the samples,
high enough in phosphate content to be considered economic. Material
from both the Bone Valley and Hawthorn has been included in the calcium
phosphate zone, except at hole 3, where a thin gravel probably representing
the base of the Bone Valley rests on hard material that was not recovered.
Tables 18 and 19 show that generally, the phosphate particles in the
Hawthorn are somewhat lower in ¥flc content than are the particles in
the Bone Valley.
The aluminum phosphate zone is not present in this cross-section.
Clayey sands of the upper Bone Valley(?) are present only at holes 1
and 3* and gamma-ray logs indicate these clayey sands contain no
abnormal radioactivity. At holes 2 and 4> sands of the Pleistocene(?)
rest on the lower, phosphorite zone of the Bone Valley.
Line 9» figure 10
Stratigraphy
Hawthorn.—Limestone, lithologically similar to the Hawthorn,
was recovered only from hole 12; the remaining holes in this line
bottomed on hard material which is presumed to be limestone of the
Hawthorn formation.. Greenish, calcareous, clayey sands, containing
phosphate nodules, were cored in each drill hole and vary in thickness
from less than 2.0 feet in holes 1, 2, and 6, to a maximum of about 30

61
feet in hole 9. These calcareous sands are tentatively correlated
with the Hawthorno Phosphate nodules in the calcareous sands contain
lower amounts of PpOc than the phosphate nodules in the non-calcareous
sands above them. (See table 20.)
Bone Valley,— The lower, phosphorite unit of the Bone Valley
formation was penetrated by each drill hole. The unit is a quartz
sand, with a high percentage of dominantly black phosphate nodules.
The upper clayey sand unit of the Bone Valley formation was also present
at each drill hole, except for hole 6, where loose, white sands overlie
the lower unit. At the south end of the line, in holes 10, 11, and 12,
the upper unit contains traces of fresh appearing, black phosphate
nodules; these nodules are not present in the upper zone in holes 1-9.
This may indicated that the clayey sand in the south and of this cross-
section was not leached.
Terrace sands 0—Loose, white quartz sands, iron-stained in holes
2> 3) &, 9) 10, 11, and 12, are tentatively correlated with the
Pleistocene.
Economic geology
The calcium phosphate zone was penetrated by each drill hole in
line 9. The zone ranges in thickness from about 8 feet at hole 11,
to 41 feet at hole 9> and includes phosphate from both the Bone Valley
and Hawthorn formations. (See tables 20 and 21*) Phosphate from the
Bone Valley was penetrated by every hole, but the calcareous clayey
sands of the Hawthorn were riot included in the calcium phosphate zone

62
in holes 2, 7, 85 and 10, because of the low content of PJ3 in the
phosphate nodules. Tables 20 and 21 show the variation in phosphate
content of the nodules in the Bone Valley and Hawthorn, and in addition
show that the Hawthorn contains a higher percentage of concentrate
fraction than does the Bone Valley. The ratio of pebble to concentrate *
fraction in the Bone Valley formation is always more than one; while
in the Hawthorn the ratio is lower, and in most cases is less than one.
In general, the phosphate content of the nodules is highest at the north
end of the section, decreases to the south, to hole 11, where there is
a rise in phosphate content. The reasons for this variation are not
immediately apparent.
The aluminum phosphate zone is present at holes 1 through 9*
except for hole 6, where no clayey sand is present, and loose sands of
the Pleistocene(?) are in contact with the lower unit of the Bone
Valley formation. This may represent an old stream channel, where the
clayey sand of the upper Bone Valley was removed by erosion„ At holes 10, 11,
and 12, the upper clayey sand unit of the Bone Valley contains small to
trace amounts of apparently unleached phosphate nodules; no aluminum
phosphate minerals are present in the clayey sands. In the area of
these holes, the Bone Valley formation apparently was not subjected to
weathering. No samples of the aluminum phosphate zone were analyzed,
the zone is delimited entirely by the gamma-ray logs; the upper contact
is placed at the sharp rise in radioactivity (fig. 10). The lower
contact of the zone is put at the point where phosphate nodules become
abundant and high in PJX content, as shown by analyses. (See tables 20 and 21.)
The zone is thickest at hole 1, gradually decreases in thickness to hole 6,

63
and then increases again in hole 7. The zone is more or less constant
in thickness from hole 7 through hole 9> and is absent from holes 10
through 12.
Line 10, figure 11
Stratigraphy-
Hawthorn.—The limestone cored at most drill holes but containing
identifiable fossils only at hole 8, is classed as Hawthorn because of
its high phosphate content and abundant sand and clay impurities. The
light green calcareous clayey sand or sandy clay containing a high
percentage of fine-grained typically amber or black phosphate nodules is
tentatively correlated with the Hawthorn.. The calcareous sandy clay
is present at holes 1 through 12, but is absent at holes 13-16, where
the only material assigned to the Hawthorn is the basal limestone.
Hawthornf?). unnamed member.—Fossils from limestone in hole 14
were classed as late Miocene(?). (See fossil list, page 28.) A dark
olive green to gray calcareous clayey micaceous sand in holes 12, 13,
15, and 16, is lithologically similar to fossiliferous middle Miocene(?)
sand in line 12, hole 6 and line 15, hole 6. Thus this sand is tenta
tively correlated with the middle Miocene(?). This sand is not litho
logically like any other material in line 10. The material also contains
shell fragments, which were not identifiable.
Bone Valley.—The lower phosphate-bearing unit was penetrated by
drill holes 1-14. It is a clayey sand, non-calcareous and typically
contains white or gray phosphate particles which tend to be coarser in

64
size than the amber phosphate siaterial of the Hawthorn. The upper
clayey sand unit of the Bone Valley was penetrated by all drill holes.
It thickens somewhat on the topographic highs (see holes 3 and 6, fig. 11)
and is somewhat thicker in the southern part of the section. The material
is white and slightly clayey and the quartz sand fraction tends to be
somewhat coarser than the material below or above it. The color of the
clay in the unit tends to become darker toward the south.
Terrace sands.—Loose quartz sands tentatively correlated with the
Pleistocene were penetrated by each drill hole. Organic material below
the loose sand was also, and rather arbitrarily placed in the Pleistocene,
as was done in other lines of drill holes.
Economic geology
The calcium phosphate zone was penetrated by drill holes 1 through
14. (See tables 22 and 23.) The zone is made up of both Bone Valley
and Hawthorn in roughly equal amounts at holes 1 through 10. However,
at hole 11, the calcareous clay of the Hawthorn makes up the entire
calcium phosphate zone; at hole 12, only the top part of the calcareous
clay contains enough phosphate of high enough grade to be possibly-
economic 5 at holes 13 and 14, the entire calcium phosphate zone is within
the Bone Valley formation! and at holes 15 and 16, where the lower zone
of the Bone Valley formation, and calcareous clays of the Hawthorn form
ation were not penetrated, the phosphate-bearing material is assigned
to the Hawthorn(?), unnamed member, and it is much too low in tonnage
and percent BPL to be economic. This cross-section (fig. ll) is a good
example of the crossing of stratigraphic lines by the calcium phosphate
zone, particularly between holes 12 and 13.
65
The aluminum phosphate zone was present at all holes in this line,
except for holes 13 and 15, where the clayey sand, as shown by the
gamma-ray logs, was not abnormally radioactive. Samples of the
aluminum phosphate zone were taken from a few of the cores, but in
general, the zone is delimited, at the top, by the rise in the gamma-ray
log, and at the base, by the contact with the calcium phosphate zone.
Line 11, figure 12
Stratigraphy
Hawthorn.—Fossils from limestone cores at the bottom of holes 1,
5, and 6 were identified as middle Miocene in age. Limestone cored in
the other holes is lithologically similar to the fossiliferous material,
and is correlated with the Hawthorn. Greenish, calcareous sandy clays
containing phosphate nodules overlie the limestone at holes 1, 2, 7, and
8, and are tentatively correlated with the Hawthorn. The contact of the
Hawthorn with the Bone Valley formation is put at the top of the cal
careous clays at holes 1 and 2, and at the top of the limestone at holes
3, 4, and 5.
HawthornC?), unnamed member.—Dark olive calcareous sandy clays
containing black phosphate nodules and mica flakes are lithologically
similar to the fossiliferous middle Miocene (?) in lines 12 and 15, and
are tentatively correlated with the upper Hawthorn(?)« This material
is present at holes 6, 7*

66
Bone Valley.— The lower, phosphorite unit of the Bone Valley
formation is present at holes 2, 3$ 4* and 5. The lower unit over
lies calcareous clay of the Hawthorn at holes 1, 2, and 3* and lime
stone of the Hawthorn at holes 4 and 5° The lower unit is absent at
holes 1, 6, 7$ and 3.
The upper unit of the Bone Valley formation was penetrated by ali
drill holes. It is thinnest at hole 1, thickens markedly at hole 29
and remains thick in the other holes of this line. The lower part of
the upper unit contains traces of phosphate nodules at holes 3$ 5? 6,
7, and 8. The contact of the lower unit with the upper unit of the
Bone Valley formation is put at the point below which the phosphate
content rises sharply.
Terrace sands.—Loose surficial iron-stained quartz sands, con
taining organic material, are tentatively correlated with the Pleistocene,
These sands are present at all drill holes.
Economic geology
The calcium phosphate zone is absent from holes 1 and 8; in the
remaining holes it represents different stratigraphic intervals. For
example, at holes 2, 4> and 5* the calcium phosphate zone is the lower
unit of the Bone Valley formation! at hole 3 it is both Bone Valley and
Hawthorn5 and at holes 6 and 7 it is the lower part of the unnamed
member of the Hawthorn(?) 0
The zone is economic in holes 2 and 3> but because of low grade, is
questionably economic in holes 4 and 5» The zone is covered by thick
overburden at holes 6 and 7, and is also vfi^jc, 10w grade, particularly
in the pebble fraction (tables 24 and 25). For these reasons, the zone
is probably not economic at holes 6 and 7.

The aluminum phosphate zone is present at holes 2, 3? and 4? but
is thin, and is high in the section of clayey sands of the upper unit
of the Bone Valley formation. It is, therefore, probably not economic
in these holes. The gone was delimited by the use of the gamma-ray logs
in all of these holes. The analyzed samples (table 24) are too low in
uranium content to be economic. The phosphate content of the slime
(D) fraction of samples 49? 52* and 54 is high, indicating the presence
of aluminum phosphate minerals. It is possible that the thick sections
of clayey sands in these drill holes could be economic for alumina*
phosphate and uranium* if the three product process is used.
Line 12, figure 13
Stratigraphy
Hawthorn.—Fossils. identified as middle Miocene in age* were
identified from limestone cores at holes 1 and 8, and from a conglomerate
at hole 6. Limestones cored at holes 2 and 3 are lithologically similar
to the Hawthorn, and holes 4 and 6 bottomed on hard material which- is
presumed to be limestone of the Hawthorn. Green, calcareous, sandy clays^
containing abundant phosphate were intersected by holes 1, 2, 3? and 4?
and are tentatively correlated with the Hawthorn. The contact of the
Hawthorn with the lower unit of the Bone Valley at holes 1, 2* 3? and 4 is
placed at the top of the calcareous clay. The contact of the Hawthorn
with the unnamed upper member of the Hawthorn(?) is located on fossil
evidence at the top of the limestone at hole 8; at hole 6, it is put at
the contact of the fossiliferous conglomerate of the Hawthorn with the
olive green calcareous clayey sand.

68
Hawtfyorn(?). unnamed member.—Fossils. identified as middle
Miocene(?) in age were found at hole B in an olive green slightly
calcareous clayey sand, containing flakes of mica, and low grade black
phosphate nodules. Lithologically similar material overlies the
conglomerate at hole 65 this material is tentatively correlated with
the middle Miocene(?). At hole 8, the upper contact of the fossiliferous
material is put at the contact of this material with a phosphate and
quartz sand which is in sharp contact with the calcareous clayey sand
beneath. Holes 1, 2, 3> and 4 did not intersect any material litho-
logically like the fossiliferous middle Miocene(?). It is believed
that this material was not deposited on or to the west ridge on which
hole 4 was drilled.
Bone valley.—The lower, phosphate unit of the Bone Valley formation
was penetrated at holes 1, 2, 3, 4, and 8 where it is a sand or clayey
sand containing abundant white phosphate nodules. The nodules are
somewhat coarser than those in the underlying Hawthorn. The lower unit
apparently was not deposited at the location of hole 6. The upper clayey
sand unit of the Bone Valley formation was penetrated by all holes.
The unit thickens markedly to the east to the location of hole 6, then
thins somewhat at hole 8. The upper contact of the clayey sand unit
of the Bone Valley formation is placed at the base of the iron-stained
loose sand of the Pleistocene(?) at holes 2, 3, and 6, and at the base of
the loose sand at holes 1, 4> and 8 0
Terrace sands.—Holes 1, 2, 6, and 8 penetrated only loose, or
slightly iron-stained quartz sands of probable Pleistocene age. At holes
3 and 4> however, the section is somewhat different. At these holes the

69
section of core represented by samples 70 and 73 contained lumps and
fragments of aluminum phosphate cemented sand and fragments of calcium
phosphate. (See sample 73 A, table 26.) At both holes, this material is
underlain by thick sections of loose quartz sand. The material in these
samples appears to be reworked; it is therefore correlated with the
Pleistocene, rather than the Bone Valley. At hole 4> from a depth of
14«5 to 28.6 feetj a red and white mottled clayey sand was cored. This
material is lithologically unlike anything else in the cross-section and
is higher than the collar elevations of the other drill holes. The
material is lithologically similar to material called Citronelle by
Cooke (1945* p. 230). It is correlated with the Pleistocene(?) in this
cross-section because of its elevation and position and because it is
underlain by loose sand, and the possible reworked aluminum phosphate
zone material of sample 73.
Economic geology
The calcium phosphate zone was penetrated by holes 1^ 2 S 3> &n&
4* and consists of both Bone Valley and Hawthorn phosphorites. The
phosphate nodules in cores from these holes are high in ?2®
(tables 26 and 27) and contain more concentrate than pebble. The
calcium phosphate zone is probably economic at holes 1, 29 and 3
because of its depth is probably not economic at hole 4. Calcium
phosphate nodules are present at holes 6 and 8, but are too deep, and
too low in tonnage and grade to be possibly economic; they are not
considered a part of the calcium phosphate zone.

70
The aluminum phosphate zone was penetrated at holes 1, 2, and 3
where it includes the entire upper clayey sand unit of the Bone Valley
formation. Cores from holes 1 and 2 were sampled; the analytical data
are given in table 26. No sample was taken of the aluminum phosphate
zone at hole 3; the zone is delimited by the sharp radioactivity peak
shown by the gamma-ray log. (See fig, 13») Although thick clayey
sands of the upper Bone Valley were penetrated at holes 4> 6, and 8,
the material was not above background radioactivity as indicated by
the gamma-ray logs. This material is not considered a part of the
aluminum phosphate zone. At holes 3 and 4> an upper zone of possibly
reworked aluminum phosphate material was penetrated. This material was
analyzed; analytical results are shown in tables 26 and 27. The material
represented by sample 70 contains very high phosphate and uranium in the
slime fraction. It is possibly economic. The material of sample 73 9
while lithologically similar is not as high grade; it is of questionable
economic importance.
Line 13» figure 14
Stratigraphy
Hawthorn.—The impure limestone cores from the bottom of holes 1,
2, and 5 contained fossils identified as middle Miocene in age. The
remainder of the drill holes bottomed in lithologically similar limestone,
tentatively correlated with the Hawthorn. Calcareous clays at holes 1
and 2 are tentatively assigned to the Hawthorn.

71
Hawthorn(?) g unnamed member.—Dark olive-gray calcareous, micaceous
clayey sands and sandy clays, containing black phosphate particles^ overlie
Hawthorn limestone at holes 3 to B. These dark sands are lithologically
like material in hole 6 of line 12, which contained fossils of middle
Miocene(?) age e They are therefore tentatively assigned to the unnamed
member of the Hawthorn(?) formation.
Bone Valley,—The lower phosphorite zone of the Bone Valley was
penetrated only at holes 1 and 2 5 it is apparently absent from the
locations of holes 3 to 8. The bottom contact of the Bone Valley at
holes 1 and 2 is placed at the top of the calcareous clay of the
Hawthorn. The upper clayey sand unit of the Bone Valley is divided
into a lower fine-grained clayey sand and an upper coarser clayey sand.
The clay fraction is very minor and is white. The contact of the upper
unit of the Bone Valley with the middle Miocene (?) is placed at the
top of the dark, olive, micaceous phosphate-bearing sand at holes 3 to 8.
Terrace deposits.—Loose surficial quartz sands are tentatively
correlated with the Pleistocene. In addition, a red and white mottled
clayey sand at holes 1 and 5, lithologically similar to the clayey sand
of hole 4, line 12, is considered a part of the Pleistocene(?). (See
discussion of line 12, page 87.)
Economic geology
The calcium phosphate zone was penetrated by all drill holes in
this Iine 5 except for hole B. The zone includes both Hawthorn and
Bone Valley at holes 1 and 2 (tables 2B and 29). At holes 3 to 7$ the
calcium phosphate zone is a part of the unnamed member of the Hawthorn(?).

72
The zone is probably not economic at holes 3 through 7 because of
excessive thickness of overburden, but it is high in ?2^5 and ^n
tonnage. At hole Bs the zone contains too little phosphate of too
low grade to be eeonomicj thus it is not considered a part of the
calcium phosphate zone at this location.
The aluminum phosphate zone, at holes 1 and 2 is a part of the
Bone Valley formation; at holes 3 and 4> it is a part of the unnamed
upper member of the Hawthorn(?). The zone is not present at holes 5
through So The zone was delimited by the high radioactivity of the
gamma-ray logs at holes 1 and 2; at holes 3 and 4, a sample representing
the high peak section of the gamma-ray log was split out from the core
and analyzed.
Line 14» figure 15
Stratigraphy
Tampa.—Cores at the bottom of holes 7 and 8 contained fossils of
early,Miocene age. Non-fossiliferous limestone cores at the bottom of
holes 3 and 4 were similar in lithology to the fossiliferous material;
this limestone is tentatively correlated with the Tampa.
Hawthorn.—Limestone cored at holes 1 and 2 is impure (sandy, clayey,
and containing phosphate nodules); it is lithologically similar to the
Hawthorn. Greenish, calcareous sandy clays with abundant phosphate
nodules at holes 1, 2, k3 1, and 8 are tentatively correlated with the
Hawthorn.
73
Hawthorn(?).» unnamed member.--Olive green, calcareous, phosphate-
bearing, micaceous clayey sand and sandy clay at the location of holes
3 to 8 are lithologically similar to the material of hole 6, line 15,
and are tentatively correlated with the middle Miocene(?). The material
is lower in elevation than the limestone of hole 2, and forms an eastward
thickening wedge of lithologically distinct material.
The upper contact of this material is placed at the base of the
slightly clayey sands of the upper Bone Valley(?), at a distinct
lithologic break.
Bone Valley.—The lower, phosphorite zone of the Bone Valley is
present only at hole 1. The contact of this unit with the underlying
Hawthorn is placed at the top of the greenish calcareous clay.
The upper clayey sand unit of the Bone Valley formation is present
at all locations in this line. The unit consists of an upper, coarse
sand, with minor white clay, and a lower fine to very fine grained sand,
with minor white clay. *•>
Terrace sands.—Loose, iron-stained or cemented, and white quartz
sands at the surface at each drill hole location are tentatively
correlated with the Pleistocene. The basal contact of the terrace sands
is placed at the bottom of the iron-staining, and at the point where the
sand becomes slightly clayey. At hole 8, the bottom half of the terrace
sands is the red and white mottled slightly clayey sand lithologically
similar to material in line 12 (fig. 13). It is arbitrarily placed at
the base of the Pleistocene.

74
Economic geology
The calcium phosphate zone was penetrated by holes 1 and 2» At
hole 1, the zone consists of both Hawthorn and Bone Valley phosphorite;
at hole 2, the zone is entirely within the Hawthorn (tables 30 and 31^.
Phosphate above the limestone at hole 3 is correlated with the middle
Miocene(?)e It is not put into the calcium phosphate zone because of
low Pp^5 content (table 30) 9 low tonnage, and excessive depth of over
burden o Phosphate at holes 4* 7> and 8, is not put into the calcium
phosphate zone because of excessive overburden thickness 0 The phospho
rite was so deep and contained so few phosphate nodules at these holes
that it was not sampled.
The aluminum phosphate zone is present only at hole 1. Analysis of
sample 94 showed the slime (D) fraction to be high in phosphate and
uranium and low in calcium (table 30). The material represented by
sample 97 at hole 2 is possibly aluminum phosphate zone, but the
analysis is probably too low in phosphate and uranium for the material
to be economic. Gamma-ray logs indicated no abnormal radioactivity at
holes 3 and 4o At holes 7 and 8, the high peak of the gamma-ray log is
probably aluminum phosphate material, but the excessive depth of over
burden makes it unlikely that this material is economic. Sample 3> at
hole By was taken of this high count material. The sample analyses
indicate the material is calcium phosphate, with too low phosphate
content to be economic (table 30).

75
Line 15 s figure 16
Stratigraphy
Ocala.— Fossils from limestone cored at the bottom of hole 5
were identified as Eocene. Although no other fossiliferous limestone
was cored in this line, the limestones at the bottom of the other drill
holes are lithologically similar to the Hawthorn. If this is true,
both the Tampa and the Suwannee are not present, and it is possible
that the location of hole 5 represents an upthrown fault block. Because
there is no indication of faulting above the Ocala, the faulting, if
present, is at least pre-Bone Valley in age.
Hawthorn.—Sandy, clayey, phosphate-bearing limestone at holes 1,
2, 4> and 6 is tentatively correlated with the Hawthorn. Calcareous,
phosphate-bearing, sandy clays above the limestone in holes 1, 2, 3^ 4,
and 5 are also tentatively correlated with the Hawthorn. The contact
of the Hawthorn with the overlying Bone Valley is placed at the top of
the calcareous clays.
Hawthorn(?) s unnamed member.—Fossils from the bottom of a section
of core of olive-gray, micaceous, calcareous clayey sand, containing
black phosphate nodules, were identified as late middle Miocene in
age. This material is lithologically distinctive and is present only
at hole 8. It is overlain by a loose sand with brown and black
phosphate nodules, correlated with the Bone Valley. At the bottom of
drill hole 8, the unnamed member of the Hawthorn(?) rests on limestone
correlated with the Hawthorn.

76
Bone Valley.—- The lower phosphorite unit of the Bone Valley
formation was penetrated by all drill holes. The unit is a clayey
sand, with brown, tan, gray and white phosphate nodules. The unit
rests on calcareous clay of the Hawthorn in all drill holes except
number 8, where it rests on the olive micaceous clayey sand member of
the Hawthorn(?).
The upper clayey sand unit of the Bone Valley consists of a medium
to coarse grained slightly clayey sand. The clay fraction is white.
Terrace deposits.—Loose white, to slightly iron-stained sands at
the surface at each drill hole location are correlated with the Pleistocene*
In addition, a mottled red and white slightly clayey sand was penetrated
at holes 3, 4> and 5« This material is lithologically distinct and like
the material in line 12. At hole 3* it is high in the section, at holes
4 and 5, it forms the basal part of the Pleistocene(?). The base of the
Pleistocene at hole -2 is put at the base of the sand with some phosphate
particles. The phosphate in this section of core consists of fine
grained, angular fragments. It appears to be broken particles of
phosphate nodules and is thought to be reworked.
Economic geology
The calcium phosphate zone was penetrated by all drill holes
except for number 6. The zone is entirely within the Bone Valley at
holes 1, 2, 3* and 4* but consists of both Hawthorn and Bone Valley at
hole 5. At hole 6, the phosphate is deep, low in P2®5 content, and low
in tonnage5 this material is not included in the calcium phosphate zone.

77
The phosphate at holes 3 and 4 is covered by a thick section of
barren material (overburden) and is probably not economic for that
reason (tables 32 and 33).
The aluminum phosphate zone is present at holes 1, 2, 3» and 4.
At these holes the top contact of the aluminum phosphate zone is taken
at the mid-point of the sharp rise in radioactivity as shown by the
gamma-ray logs (fig 0 16). The zone is uniformly thin and is covered
by thick barren quartz sand| it is probably not economic in this section.
Line 16, figure 17
Stratigraphy
Ocala»—Fossils from limestone at the bottom of holes 1 and la
were identified as Eocene in age. As mentioned in the discussion of
line 17, the Ocala limestone here may be in an upthrown fault block.
Hawthorn.--Limestones cored at the bottom of holes 1 and 3 are
lithologically similar to the Hawthorn. In addition, calcareous sandy,
phosphate-bearing clays above the limestone at all holes except 4 are
tentatively correlated with the Hawthorn. At hole 4 a thick section
of greenish silty and sandy clays, phosphate bearing at the botton and
about the middle of the section, is tentatively correlated with the
Hawthorn. This material may be equivalent to the Alachua(?) and may
represent a channel or sink-hole filling of reworked Hawthorn. The
material is somewhat similar to the Hawthorn but is also similar to
material in line 17 that is correlated with the Alachua(?).
78
Bone Valley.—The lower phosphate unit of the Bone Valley
formation is apparently not present in this section 0 The upper unit
is divided into a lower zone of slightly clayey fine-grained sand and
an upper zone of clayey coarse-grained sand. The clay fraction of
the upper Bone Valley is white 0
Terrace sands.—Loose, quartz sands, stained with iron, and con
taining organic material at holes la and 2, are correlated with the
Pleistocene. At hole 1, the middle part of the terrace deposits consists
of red and white mottled slightly clayey sand; and at hole 4 the bottom
half of the terrace sands is composed of this material. The red and
white mottled material is lithologically distinctive; it is arbitrarily
placed in the Pleistocene(?). (See discussion, line 12.)
Economic geology
The calcium phosphate zone was penetrated at holes la, 2, and 5>
and is entirely within the Hawthorn formation. It is absent at the
location of the remainder of the holes in this line. ( See tables 34
and 35.)
The aluminum phosphate zone is present at holes 1, la, 2, 3> and 5»
The zone is very thin and questionably economic. Except at hole 5> where
it is within the Hawthorn, the zone is the basal part of the Bone Valley.

79
Line 17 9 figure 18
Stratigraphy
Suwannee,—Fossils from limestone at the bottom of holes 5> 6 5
9 5 10, and 11 were identified as Oligocene in age 0 Lithologically
similar limestone was cored at holes 3 and 8.
Tampa,— Greenish,, sandy,, calcareous clays, containing chert
fragments and nodules^ contain fossils identified as early Miocene at
holes 4 and 9° Lithologically similar clays at holes 3$ 5 5 6 5 7S &>
and 10 are tentatively correlated with the Tampa. Impure limestone
cored at hole 2 is tentatively correlated with the Tampa 0 At hole 3>
the Tampa is overlain by calcareous phosphate sandy clay of the
Hawthorn 0 At holes 4* 5$ 6-» and 7 the Tampa is overlain by slightly
clayey sands of the upper Bone Valley, and at holes 8, 9* and 10 the
Tampa is overlain by sandy clays of the Alachua(?).
Hawthorn ..--Calcareous, sandy, phosphate-bearing clays at holes 1,
2 9 and 3 are tentatively correlated with the Hawthorn 0 At holes 1 and
2 9 the calcareous clays are overlain by green clays or sandy clays,,
also assigned to the Hawthorn„ The Hawthorn is overlain at holes 1 and
2 by white clayey sands of the upper Bone Valley,, and at hole 3* by
phosphorite of the lower Bone Valley. The Hawthorn is absent at holes
4 through 11 <» although the material assigned to the Alachua(?) at holes
8 through 11 may be a residuum of the Hawthorn.
Alachua(?).—-Coarse to medium grained sandy clays, green to blue
to shades of red and yellow and containing fragments of angular white
phosphate^ were penetrated at holes 8 through 11. This material is
80
lithologically distinct. The material overlies elastics assigned to
the Tampa at holes 8, 9> and 10, and limestone of Oligocene age at
hole 11. It is overlain by clayey sand of the upper Bone Valley at
holes 8, 9> and 11, and by phosphorite of the lower Bone Valley at
hole 10. From its position in the section, and distinctive lithology,
this material is tentatively correlated with the Alachua(?) formation,
although it is possible that the material is equivalent to the lower
part of the Bone Valley.
Bone Valley.— The lower phosphorite zone of the Bone Valley, was
intersected only at holes 3 and possibly 10. The zone is absent in the
remaining drill holes. At hole 3, the lower unit overlies calcareous clay
of the Hawthorn; at hole 10 the material overlies sandy clays of the
Alachua(?) formation. In both cases the contact is distinct.
The upper clayey sand unit of the Bone Valley formation was inter
sected at all drill holes. The unit is distinctive lithologically,
consisting of medium to fine sand with minor amounts of white clay.
The unit apparently contains aluminum phosphate minerals, as indicated
by the rise in the gamma-ray logs, at most drill hole locations.
Terrace sands.—A thin blanket of loose quartz sands, stained with
iron at some locations, was penetrated at each drill hole location. The
loose sands thicken at hole 10, at the ridge, and the thickening may be
due to the increased elevation at this locality.
Economic geology
The calcium phosphate zone was penetrated at holes 1, 2, 3> and
10; it is absent at the remaining locations. At holes 1 and 2, the
zone is entirely within the Hawthorn formation, while at holes 3 and

81
10, it is entirely within the Bone Valley formation. Analyses of the
samples from holes 2 5 3 5 and 10 indicate the zone is probably economic.
(See tables 36 and 37.)
The aluminum phosphate zone was penetrated at all drill holes.
The zone is delimited by the high peak of radioactivity as indicated
by the gamma-ray logs. The zone was not sampled in this line. Line
1? is an excellent example of the nature of the aluminum phosphate zone,
and the way the zone crosses stratigraphic lines. At holes 4, 5, 7, 10,
and 11, the entire upper unit of the Bone Valley formation is aluminum
phosphate zone. At holes 3> &, and 9, only the basal part of the upper
Bone Valley is aluminum phosphate zone a At holes 1 and 2 the basal part
of the upper Bone Valley plus the top part of the Hawthorn make up the
aluminum phosphate zone, and at hole 6, the aluminum phosphate zone is
within the Tampa formation. Although the zone varies in radiation
intensity, it is marked in every drill hole by a peak of radiation
intensity. (See figure 18,)
Line 18, figure 19
Stratigraphy
Hawthorn.—Limestone cored at the bottom of hole 1 is impure, sandy,
clayey, and phosphate-bearing5 it is correlated with the Hawthorn.
Calcareous clays overlying the limestone at hole 1 are also lithologically
similar to the Hawthorn. Green slightly sandy clays at the bottom of
hole 4 are tentatively correlated with the Hawthorn. The contact of the

82
Hawthorn with the Bone Valley at hole 1 is placed at the top of the
calcareous, phosphatic clay. At hole 2, the Hawthorn-Bone Valley
contact is placed at the base of the white slightly clayey sands of
the upper Bone Valley.
Bone Valley.—The lower phosphorite of the Bone Valley was
penetrated at hole !<, The upper slightly clayey sand of the Bone
Valley was penetrated at holes 1 and 4. At hole 4> the upper clayey
sands of the Bone Valley rest directly on green sandy clay of the
Hawthorn,
Terrace sands,—Loose, slightly iron-stained quartz sands, that
contain organic material, are correlated with the Pleistocene. They
are present at both locations in this line.
Economic geology
The calcium phosphate zone was intersected only at hole 1, where
it consists of the lower phosphorite zone of the Bone Valley plus the
top of the calcareous clay of the Hawthorn,, No phosphorite is present
at hole 4. (See tables 38 and 39.)
The aluminum phosphate zone was intersected by both drill holes of
line 18 0 At hole 1, the zone is the lower part of the clayey sand of
the upper Bone Valley, while at hole 4 the aluminum phosphate zone is
entirely within the Hawthorn. The zone was not sampled and was delimited
entirely by use of the gamma-ray logs.

83
TONNAGE CALCULATIONS
Aluminum-phosphate zone
Tonnages were calculated by a modification of the method used
in the district for calculating the matrix tonnages. The method is
based on the thickness of the deposit and the weight per cubic foot
of rock in place„
A bed one foot thick contains 1,613 cubic yards per acre.
(1) 43*560 (sq 0 fto/acre) x 1 (thickness in feet) = 43,560 cu. ft./ acre foot,
(2) 43*560 (cu. ft./acre foot) r 1613.33 cubic yards per acre-foot, 27 (cuo ft./ cue yd.)
and, rounding,
(3) 1,600 x thickness (in feet) - cubic yards per acre.
Cubic yards per acre is shown on all of the tables because the
weight per cubic foot of aluminum-phosphate zone material varies between
wide limits. This figure may be changed to tons per acre by using a t
factor of 90 pounds per cubic foot, the approximate average weight of
a cubic foot of aluminum-phosphate zone material. This is equivalent
to 2,430 pounds per cubic yardj 1,088 long tons per cubic yard, or 1.215\
short tons per cubic yard.
Calcium-phosphate zone (Matrix)
The tonnage calculations used in this report are based on the
thickness of the phosphate bed, its percentage of contained pebble
or concentrate, and the specific gravity of the deposit. The phosphate
companies use the weight of a cubic foot of matrix instead of the

84
specific gravityo For much of the area, this weight is about 125
poundso Thus 5 the tonnage calculations are as follows?
(4) Square feet per acre (43.560) x 125 = 2430.8, or long ton (2240 pounds;
(5) 2430 f. constant, 2430 x thickness (feet) x percentage of pebble,
(or concentrate) =. tons of pebble (or concentrate) per acre.
No correction was made for the variation in weight per cubic foot.
However, this variation is smallj computation shows that a change of 1
pound in weight of a cubic foot of matrix changes the total tonnage
1/5 ton per foot of matrix for one percent of pebble, or concentrate.
Long tons are used in this report to conform with general practice
in the phosphate field. Long tons can be converted to short tons
(2000 pounds) by multiplying the given tonnage figure by Iol2»
(6) 2240 = 1.12 2000
Grade is shown in percent BPL (bone phosphate of lime) the
conversion factor iss
(7) P 0 percent x 2.185 - BPL percent. 2 5


^**
^£a£«p§ti
OJF>—
sda"d
r=SC
1
a1
12 >*
< S
M°tHi03
ife
CO
© SBHI P>08 fco
@ ®CD «t®
03 51H
0
S
_ri _«.ftr*i! DO
©
&
• ft^o
CM
d <s
&•»
OfiSo
^"C&CM
l1 O
(2
©©^-0
o
®
10ca
© O O H 0 O 0 O
o e 0 e0 O O 0
H
Oo
O
u\e
\£frCM
*&
e
i
t*°cf**S
UN^^j. <9OnSjj OO
i^*0 CB^ ^^OO
C^ ^ CO ^rtrt>rxrt
•^s^s43 ^ 43 4369 CB CO ffl© © ffi ©9383
•Hjl5 \f^\ C& C3*
"J JHI 15HI u\
0 f*^8
COe
OH)
0HI
0
0^
HI
A
UN«? as co0 ©
O 0
o o
01 CMrtO
(
o
9^
1o
H
oHI
CMHI
o*$"
oOQH,
«*''*© HI
o o^ o oe-CM
'Z'S'S'S
co9
COH
0CO
o
3i
CM0
O O £o o o
0 0 e0 0 O
fV
HQ
00
vOo
•*HI
UNc©
o0
Ofr-(
Os
CM0
c*=>
CM ©00
m mmHI UN ***
SB'S
0
Cfs
8CO
o
a
m8
HI
vffi ^^ ^Hi O Oo o o
O 0 0
O 0 O
«* HJ"HI O
© 0O 0
0 O
S0
°»
CM
OHI
$
OQm
oe
E*9CM
** + CM
HI Hi t-
4^ CQ £2-^ IIM^ • v
CMe
\0CM
0UN0€M
*0
Hi
ao0
O
HJ
Os
S
0CM^0
0CM
o
CM
i
UNA
UN"* HI CM O O O O O 0 O O
0 • 0 O
o o o o
_•o0
0o
nrHCO
oO
Of^
£
CMH
CO0
t»=,
O vD «* 0
HI HJ C->O
'5'5"o"a1
CMe
6*«f*"^
0HJ
0
*
s©C
HJ
O O O Oo o o o9000
o o o o
CMoO
oO
O
0
HI
OsO
e
CM
HI•UN
HI
*# OSOO 0
CM f*^ O **UN **
^-9^3
oHI^fIs©o^^
fr".0
HJ


Table
4~~Analyti@al
and
screen d
ata
9 samples
fs°®m h@
les
in l
ine 1—
Contin
ued
Hol
e N
»o
& Sa
mpl
e Jl©
.
2-8
2=9
3=1©
3=11
3-12
3=13 4=
14
Sam
ple
Inte
rval
(i
n f
eet)
5.0=
9ol
9.1-
12.1
7.1-
20.5
20.5
-22.0
29
.5=
37
.6
52.4
-78.5
5.o=
i5°o
Scre
en S
ize
4=14
mes
h (A
)-1
4*35
mes
h (B
)=3
54-1
50 m
esh
(C)
-150
mes
h (D
)
(A)
(B)
(0)
(B)
(A)
(B)
(0)
(A)
(B)
(C)
(A)
(B)
(C)
(D)
(A)
(B)
(C)
(B)
(B)
(c)
(D)
I/
Wei
ght
Per
cent
0.8
8.1
72.9
18 o
2
1.8
12 o
454
o831
*0 0*4
£, Q
^
TO
^
26.7
29 .6
5*
847
.117
*5 3.2
14.8
55*3
26o7 1.4 4o4
74.1
20 o
l
4.8
60.7
34.5
A vi
ol
v^ 4
*^>
Q 1
I^
Q^O
I*
iy%
v\
/aT
*^i ^
avi*
4^
fl A
UcL
Ljf
vl
v S
.JU
U
cL V
@L
\ A
ll
p^S
JLv
@I2
. w /
P2°
5
18.7 7.3
16 o
4
12.2
18.5
9.2
0.55
GaO 29 0
6
10.6
0,84
0.1
1
Oo
lO
0.03
Oo5o
F 2o40
Oo8
3
0.9
6
Io4
4
1.4
0
006
l
0.35
Al2
0j
12.8
28.5
25oO
14c9
U 0.0
02
0.0
12
0.0
04
0.0
03
0.0
20
0.0
21
0.0
12
Oo0
02
0.0
06
@U
0.0
01 a a
0.0
02
0.01
30.0
03
0.0
02
0.00
5
Oo00
5 a aO
JDO
l
0.0
18
0.00
50
.00
20.
018
0,00
90
.00
2 a0
.01
2
OoO
Ol a a
0.0
02 a a
0.0
04


Table 4—Analytical a
nd sc
reen
dat
a9 sa
mple
s fr
om hol
es i
n li
ne l
=«Co
ntin
ued
Hole N
o.&
Samp
le N
o.
4-15
5-16
5-17
Sample
Inte
rval
(in
feet)
»
15*0
-19 o
4
5.0~
20«9
20 .9-57 o4
Screen S
iae
414 mesh (
A)=14435 mes
h (B
)~35tl50 me
sh (
C)-1
50 mesh
(D)
(B)
(c)
(»)
(B)
(c)
(D)
I/Weight
Percent
9.1
61.8
29 a 2ol
69*7
28 ol
4.3
77.8
17 o9
Analytical da
P205
9.0
CaO
2.93
F 0.21
ta (in
perc
ent)
A120
^
29.4
U 0.00
6
0.00
1
0.00
2
0U
a a0.006 a a a a a
w0.
001
-<
I/ We
ight
percent r
etai
ned
on sc
reen
.2/
Blanks i
ndicate
no a
naly
sis*
V
waw eq
uals
less
than 0
.001.
fiv
*
All
samp
les
are
from l
ot 25
45•


Table 5e—Toxmage computations* line 1
Bole Hb»
X2a3
u5
Depth Internal (in feet below the surface)
9.1-19.37.0-9.1 9.1-12«1
20*5-22.0
5.0-19.U
Blank Hole
Aliiminum-PhosphateGu. yds, per acre
16,300
3<>200
2,1*00
23,000
Percent TJu0»007
O.OL1
0.003
ZoneC«F*rl«
s/
800
Calcium-FhosiTons per
acre
P-030^
3kate ZonePercent
BPL
U0o5
Head assay calculated from analyses of individual fractions* Counts per minute computed from gamma-ray log* See fig. 2. P 8 pebble fraction (*li* mesh). Hb concentrate.


0
u>
IH O o
0 IH
o
IH
O O 0s
Oo
H 0
to
vno
0sO 0s 0s o o oIH €»to
0soto
too
O oO O
O IH
OOOOOOOO
OOOOp p Q to
O
IH 0 to
00s O
© O o o
IH o
©OoOH ©
Vto o
too
o
IS3IH IH1
IH 0
IS3
too
!s> Vi IH0s
OOOO JOOOO
OOOOO O O H1,0000
'oooo
IHIHooo
IH o© O
O oOo 0s
H>
Oo
ICD
OOOO9 O O
OOOO
0 €0
0tooH
IH O IH O o o o
0
So
eo
H«
C
H«
f


Table 6—
Analytical a
nd screen d
ata
9 sa
mple
s from hol
es i
n line 2
—Con
tinu
ed
Hole
N*o
& Sa
mple
Ho
0
3=>2
4
3-25
3=26
3-2?
4=28
4=29
Sample
Inte
rval
(in
feet)
14oO
~l5o
6
I5o7~20ol
20ol
-33<>9
36oO
°43«
0
606=
160 ?
16*7
~21*
9
Scre
en S
ize
4=14 mesh
(A)
°14t35 »®s
h (B
) °35<fl50 mes
h (C
) -1
50 mesh
(D)
(A)
(B)
(C)
(D)
(A)
(B)
(c)
(D)
(A)
(B)
(C)
(D)
(B)
(c)
(D)
(A)
(B)
(O
(D)
I/
Weight
Percent
Ooi
5o8
75o6
1806 Oo4
3*7
49 o5
46 04
0.5
4«4
64o5
30 <»
6
n»o
3o4
48 oO
37 o5
19 o3
69 «2n o5
Ool
9o?
58o4
31*8
Analytical d
ata
(in
perc
ent)
P205
12.1
7o3
16 oO a/ 9o6
14o3
CaO 5o6
2o8
8ol
4o4
1003
F Oo56
0C33
Oo83
Oc63
Oo84
A120
3
32oO
24»4
^
U
Oa024
OoOO
l Oo022
Oo02
2
Oo02
2
Oo006 *
OoOO
l
Oo002
Oa009
Oo00
4
. eU
0,02
6 Oo004
OoOO
l 0
0020
0«02
1 O
e003
0^
001
0,019
0,00
80»003 a
Q0007 a
Oo00
2 a OoOOl a a
0*00
3
OoOl
O a a Oo
003
O


Table
6=°Analytical
and
scre
en d
ata9 sa
mple
s from hol
es i
n line 2
-=Co
ntin
ued
Hol
e N
oo&
Sam
ple
N®0
4=30
Sam
ple
Inte
rnal
(in
feet)
22o6
~26o
4
Scr
een
Siz
e
<f!4
mes
h (A
)-1
4* 3
5 m
esh
(B)
~35*
150
mes
h (C
)-1
50 m
esh
(D)
I/
Wei
ght
..P
erce
nt
2,2
13o?
50o2
33o7
An
«lv
t1cal
data
fi
n
Tia
nffi
flua
t^P
205
CaO
FA
1203
U 0*00
5
eU
Oo0
04O
oOO
l a0.
005
I/ Weight p
ercent r
etained
en s
cree
n0
2/ Blanks i
ndicate
no an
alys
iso
3/
MaM
equals l
ess
than
OoO
Olo
^as?
**
All
samp
les
ar®
from Let
2545o
SO:

r

Table 7»—Tonnage computations, line 2
No
Depth Internal (in feet below
the sisrfaee)
AliimlmmwPhosphate ZoneCu,per acre
Percent UZone
Tons per Percent BPL
17600 0.010
10200 IT0*010
31-0-33.90.003
I Head assay calculated from analyses of individual fractionsa Counts per minute computed from gamma-ray log* See fig« 3« Possible calcium-phosphate zone* Top contact taken f&'om gamma- ray log* Bottom contact at base of lost core* Possible calcium=phosphate zone* Not sampled^ but coarse phosphate pebble present,, Tonnage is low.Base of sample 260 Samples show phosphate nodules* Not analyzed for ?C* Possible calcium-phosphate zone 0 Tonnage is low*

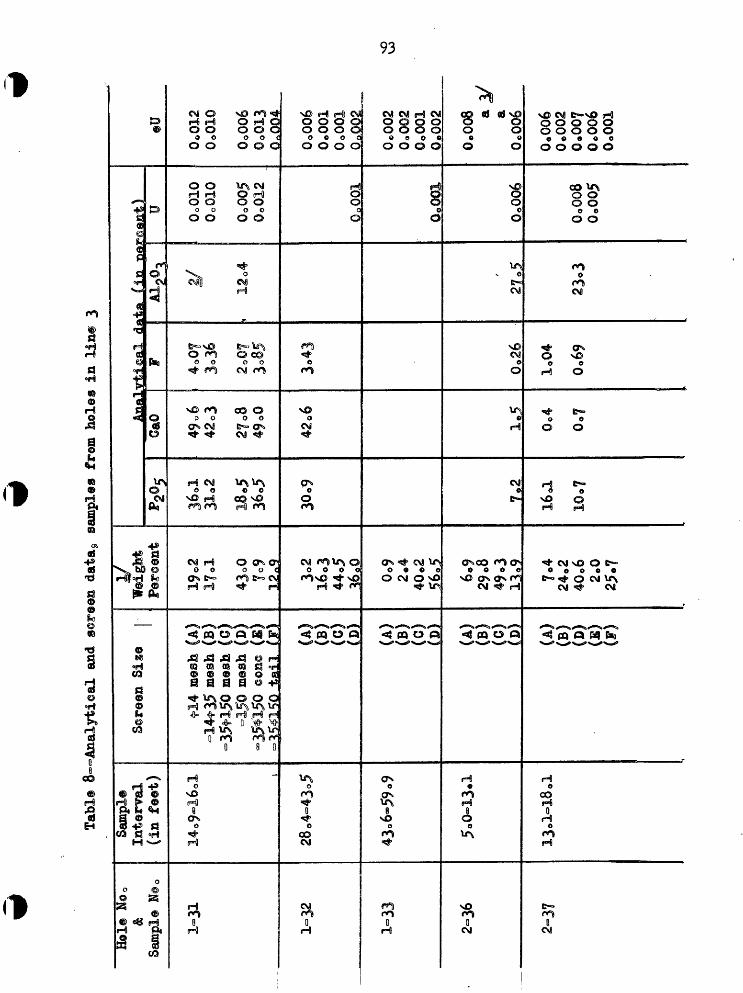
Tabl
e 8—Analytieai a
nd se
rees
dat
a9 sa
mple
s from hol
es i
n li
ne 3
Hoi® H
o0
&Sample N
©0
1-31
1-32
1-33
2-36
2-37
Samp
l®In
terv
al(in
feet
)
14.9-16.1 i
28.4-4
3.5
4306
-59.
9
5.0-
13.1
13.1
=18.
1
Scre
en S
ize
t!4 mesh (
A)=•14*35 me
sh (
B)-3
5^15
0 mesh (
C)-150 mesh
(D)
-35*150
cone (K
)=15*150 ta
il (f
)
(A)
(B)
(C)
(»)
(A)
(B)
(0)
(D)
(A)
(B)
(C)W (A)
(B)
(0)
^ ff
(B)
(F)
I/We
ight
Perc
ent
19 o2
17ol
43 oO
7°9
12«9 3o2
I6o3
44o5
36 00
Oo9
2.4
40.2
56o5 6.9
29 Is
49 o3
13«9 7o4
24^2
40o6 2.0
Analvtleal data fin
nar&
airf
c)p£05
36ol
31o2
18.5
36.5
30o^ 7.2
16 a
10o7
GaO
49,6
4203
27 08
49 oO
42o6 1.5
0*4
o«7
F 4o07
3o36
2o0f
3 085
3.43
0.26
1.04
0.69
A120^
I/<=!/ 12o4 '
27.5
23.3
U OoOl
OOo
OlO
O0oo
500012
Off 001
00001
OoOO
S
0.008
0.005
@u
Oo012
0.010
OoOo6
0001
30^004
OoOQ6
0.00
1OoOOl
.^JsLaJKliL
0C002
00002
0.001
0.00
2
0.008 a
«3/
ao«oo6
0.006
0.002
0.00
70.006
OoOOl
vO


Table 8—Analytical a
nd screen d
ata?
sample®
frem h
oles
in
line
3
Bile
Ne»
&Sa
mple
N©
0
4-34
4=35
Samp
leIn
terval
(in
feet)
6.9-14
.0
21o8
~22.
9
Scre
en Si
ze
£•14
mes
h (A
)~ •
«* -e
• /~* \
<£**v*r^
a/ au^0&& %"/
=35^150 me
sh (C
)°1
50 mes
h (D)
(A)
(B)
(c)
(D)
' I/
Weight
Percent
108
12 9
64 oO
2103
Ooi
6oO
43oO
50*0
P2°5
32 o5
Aaal
GaO
41o9
ytie
al data (i
n per©ent)
F 3o39
Al2°3
2/ M
u Go 006
00002
®U
Oo00
4 ao<
>oo6
0^00
5Oo002 a J/
f\ f\f\Q
~V O VVifc
I/ Weight pe
rcen
t re
tain
ed ®
n sc
reen
«2/ Bl
anks
ind
icat
e no
ana
lysi
s0
j/
wan equals l
ess
than
OoO
Olo
All
samp
les
are
from Let
254
5


Table 9o—Tonmge computations 9 lin® 3
BoleDepth IntermL(in feet below the s-orfaee-)
Cu« yds aper acre BPL
X 1
8^,000 1500P-562 78
2 12,
Holes 3j, UD and 5 had no aliimnum-phosphate or
Head assay calcinated from analyses of individual fractions* Counts per mijiut© computed from gainnia«ray log» See fig* ho P s pebble fraction (*U4 mesh)| C s concentrate fraction
(-35*150 mesh)»


Table
10--Analytical a
nd screen d
ata
2 samples
from
hol
es i
n line 4
Hol
e N
o.
Sam
ple
No.
1«4Q
1-41
2-38
3-39
Sam
ple
Inte
rval
(in
feet)
19.2
-35
.9
35.9
-39.
9
17.6
=24.
5
28.6
-45*
4
Scr
een
Siz
e
4=14
mes
h (A
)-1
4435
mes
h (B
)=3
5tX
50 m
esh
(C)
-150
mes
h (D
)
(A)
(B)
(c)
(»)
(A)
(B)
(c)
(D)
(A)
(B)
(0 (»)
UW
eigh
t ,
Per
cent
2,9
8.1
60.3
28,6 2ol
3o6
59*3
35.0 1*6
4.7
47
.046
.8 3.7
8.0
51 .1
37«2
An
nl
P205
35
ol
30.7
29 o
l
30.2
CaO
46C2
41 »9
44.9
45.2
feit
sal
dat
F 3-79
3<>2
9
3«50 3*
21
(in r
>ar
Al2
0^ a/
cant
)U 0»007
0.0
02
0.0
02
0«00
1
eU
0.01
30.
004
0.00
20.
005
0.00
60.
003
0.0
02
0.00
3
000
120.
004
0.00
30.
002 ay
0.00
20.
001 a
vO
I/ We
ight
percent r
etai
ned
on s
cree
n*
Z/ Bl
anks
ind
icat
e no
an
alys
is e
«aw
equals l
ess
than
0.0
01.
All
samples
are
from
Let
25
45


97'
Table 11.—Tonnage computations^ line U
HoleNo*
1 1 123 3
Depth Interval (in feet belov the surface)
10*5-19.2 19.2-35.9 35«9-39.917a6~2i.521«2«28«6 28«6-ii5*li
_Aluminum-Phosphate ZoneCu. yds* per acre
13,900
Percenttr
C.P»M.V
1000
Oalcium-fhosphate Zone ,Tons per acre
P-1168 £/F«l8TF-2TO
^1530
Percent BPL
76.567*163»5
66«0
I Counts per minute computed from gamma-ray log* See fig* P s pebble fraction (*lU mesh)» No concentrate. Possible calcitzm-phosphate zone* Not sampled0


Tabl
o* 1
2<~»
Anal
ytic
al a
nd screen d
ata
g sa
mple
s from h
oles
in
line
5
Hol
e N
o.&
Sam
ple
No.
1=42
1-43
2-44
2-45
3-46
Sam
ple
Inte
rval
(in f
eet)
49.2
-56*
1
56*1
-71
.9
28.1
-3*o
6
34.6
-48.
9
22 .5
-32
08
i y
Scr
een
Siz
e I
Wei
ght
±14
mes
h (A
)~1
44»3
5 m
esh
(B)
=35*
150
mes
h (C
)-1
50 m
esh
(D)
(A)
(B)
(O (D)
(A)
<*)
(O (D)
(A)
(B)
(D)
~35*
"150
con
es
(K)
»35*
150
tail
(F
)
(A)
(B)
<»
)*(B
)(F
)
Per
cent
0.4
44.1
50
.3 5»2
7o7
17 »9
6004
14
.0
2o7
14 o
355
ol27
.9
2.1 7*5
52.3 6.8
31*3 2e7
15*2
38.4
15..0
28.7
Anal
yti
cal
dat
a (i
n p
erce
nt)
P205 5-7
10.3 ?4 18.6
30
.4
16.4
30.6
CaO 3o
5
6.2
8.9
39 o5
43 o4
24.7
45.0
F 0.2
Oo4
9rf 2.6
3<>5
1.9
3o6
A120
3
I/ 21.2
l^Z
u 0.01
2
0.00
4
0B0
0?
0.00
1
0.0
03
eU
0.00
60.
001 » y
0.00
6 a0.
004
0.00
20.
002
0.01
40.
008
0.00
4Q
nQQ
4
0.00
80.
006 a
0.00
80.
009
0.00
60.
006
0.00
20.
008
0.00
3*
NO


Tab
le 1
2~=
Ana
lyti@
al a
nd
scre
en d
ata^
sa
mpl
es f
r®m
ho
les
in l
ine
5=ra
C®
ntin
ia@
d
&Sampl®
Inte
rval
(in
feet
)Analytical d
ata
(is
perc
F
39
0,011
•35*150 ta
il (F
)
Oo00
4
^/ Weight p
ercent r
etai
ned
ongf
Bl
anks
indicate
n« a
naly
sis,
/ Ma
w eq
uals
les
s th
an O
cOOl
o
All
samp
les
ar®
from
Lot
2545*


IOC
Table 13*—#onnage computations,, line
Hole No*
Depth (in feet the
ZoneOiu yds, per acre
Percent U
Calcium«Phosphate Zoneons peracre
PercentBFL
F-29902880 1000
"66 J*P-655 C-3600
35*8
2880 2500
I/ Counts per minute computed from gamma-ray logs* See fig* 6« 2/ Possible calcium-phosphate zone,, analyzed cut both aluminum-
phosphate and calcium-phosphate zones« 3/ P ffl pebble fraction (*lU mesh)| C m concentrate fraction
(-35*150 mesh)* Some phosphate present in limestone« Not calcium-phosphate zone«


Tabl
e*
14—
An
alyt
ical
and
s@
r«®
n da
ta.,
sam
ples
fr
om h
old
s ii
r li
ne
6
Sam
ple
GaO
ata
(in p
erU
mes
h (0
) m
esh
CD)
0,00
5O
o004
1-49
(B)
Oo0
08
OoO
Ol
(D)
I6o8
68
06
0«
00
8o
(B)
(D)
•35=
150
e®n®
(K
)-3
5-15
0 ta
il
(F)
Io2
^06
.25
*5
2o4
3ol
OoO
Ol
0.0
08
0.0
04
2-52
27. 1
=32
oO(A
)8.
533
o3
ifil
4ol
0.01
6
0.0
02
0*00
2
2-53
(B)
(G)
iDl
1.7
1836
.22.
3
55o4
36
060*
001
0.00
8Oo
002
0.001
0.00
2


Table
14=<
=Ana
lyti
cal
and
scre
en d
atag
, sa
mple
s fr
om hel
es i
n li
ne 6
°~Co
ntin
ued
Hole
Ne0
&Sa
mple
H«0
3=54
3-55
5=56
Samp
leIn
term
L(in feet)
67.2
=680
8
68o8-71.9
46*3
-48 e6
Screen S
ize
+14 mesh (
A)=1
4*35
mesh
(B)
=450 mesh
(D)
=35*150
c«me (B)
«?3&150
tail (F
)
(A)
(B)
(D)
(B)
(F)
(A)
(B)
(D)
(B)
(F)
yWeight
Percent
Ilo3
14o5
30.7
4o4
TOol
2400
13»8
35o9 3-0
23*3 5«o
10.0
35oO
19 *5
30,5
Anal
ytic
al d
ata
(ia
perc
ent)
*&S
40»0 8.7
18.4
15.8
33o8
CaO
45o2
33o4
39«7
37«6
43o8
f 3.6
lol
109
1.7
3»2
A12^
i/
u OoOl6
00003 a
Oo00
60.
001
eU
0.01
60,008
Oo004
OcOl
lOnOOO
Oo00
4 a »y0,
004 a
0.00
70.
007
0.00
10.009
0.003
l/ Weight p
erce
nt r
etai
ned
en s
creen.
2/ Bl
anks
indicate
ne a
nalysis.
3/
wan equals l
ess th
an 0.0
01.
All
samp
les
are
from let
2545o


103
Table I5o—-Tonnage computations 5 line 6
Hole No0
1 1
2
3 3
U5
Depth Interval (in feet below the surface)
22*6-37.6 37.64&0 6
2100-27ol 27.1-32.0
62*9-67o2 67o2-68o8
77.2-8lo2U6.3-W.6
Aluminum-Phosphate ZoneCnZ yds'o per acre
21^000
9,760
6^880
Percent UI/
00 003
CaFaM*
2/
900
800
Calcium-Phosphate ZoneTons peracre
P-1Q20 No concentrate
P-S30 No concentrate
F4*Uo2/ C-170¥P-3UO C-9UO
Percent BPL
69.5
72»6
87.3 69.1
3U.5 - 73.8 a
I/ y 3V
U/
Head assay calculated from analyses of individual fractions,. Counts per minute computed from gamma-ray logs« See fig. 7. P • pebble fraction (*Ih mesh)$ C * concentrate fraction
(-35*150 mesh)0 Possibly calcium-phosphate zone0 Not analyzed^ overburden too
thick;, tonnage too low to be economic. Possibly calcium-phosphate zone. Overburden too thick,, strata
too thin to be economic*


Table
l6°«Analytical a
nd s
cree
n da
tas sa
mple
s from hol
es i
n line 7
Hele
Hoe
&Sample N
®*
1-57
1-58
1-59
2-60
2-61
2-62
Sample
Inte
rval
(in feet)
30*6
~36*
1
36*1
-45*
5
45.8
-55.
8
20*3
~28*
1
28*1
-34*
4
34o4
~45o
9
Screen S
ize
£14 mesh (
A)-1
4*35
m«s
h (B
)~35fcl50 mesh
(C)
-150 mesh
(D)
(A)
(B)
(D)
-354150
OMIG
(S
)~35f»l50 tai
l (F
)
(A)
(B)
(D)
(B)
(F)
(A)
(B)
(D)
U) ^F)
(A)
(B)
(D)
(K)
(y)
(A)
(B)
(D)
(I?)
I/
Weight
Percent
4.1
10*3
77o4 802
5e4
7*0
11 a 6
13»0
63.0 1.3
11^3
31o4
12«3
43«7 6o5
13^7
I5o5 7*0
57 o4
Ic4
6o9
43*1 1*9
46o7 3o8
6o7
24 »9 7.8
.56.
9
Anal
ytic
al d
ata
(in percent)
P20ij
32 o4
11 »1
32*8
32*5
30*8
13*2
34d
31*6
38.4
31*1
31*6
CaO
38 o5 8*8
47*0
46 «1
44*7
12 06
37 o9
46*4
43*0
45*2
45 «5
F 3o3
ill
3*8
3*5
3.8
1*5
3.3
3e8
3o5
3*6
3»6
i 1
Al2°
3
I/
16*3 -• *
\
u Oc03
4
Oo044
0*005
0*00
2 a
0*00
6
0.00
1
0«002
eU
0*036
0*01
20*
003
0*045
0*015
0*005
0*002
0.00
8 a V
0*01
00*005
0*00
10*007 a
0*014
0*00
60*
006
0*01
10*
001
0*01
20*005
0*002
OcOl
O0,
002
Oc01
20*004
0*001
OeOO? a.
H


105
1o00
SI «H
© HI
•8•d
§
1
****
1o© p
S^»
«*"8
•H
a
%HIM
5§©
CO
w °§H
0
0 *8H
3
»
CM
fe
O
21
o
^"*»
<D
SI ••— <»
o
&Hi
O O O Oo o o o
o o o o O O O 0
H H 0 0 0 0
t> o O O
J*oo O®o o
CM CM
CM •*0 0
ON ON
vO CMo o
CO H
H *ACMNO g
itB CQi CA QA Get
OB 03 CO S3 »H§ ® • e oj8 3 3 o •*»"* ^AO O O
-fr jh HI HI HI
HI Xf\\f\
8 i
Hi ocm
vO8
o
cm0
CM
HxO CVS CO Hi Hi O O O O O O O O O
o o o o o O O O 0 O
0o
o O
CM cm0 9
cm cm
is** H o o
. o o t?*= 0s CM CM
e-=NO NJO ON CMHI NO «*NO O
o1CO
o
NO
Hi O O O 0 0 O 0
e o e a O O O O
o o
o O
C3 sO o e
cm cm
e» CM e o
o oNO H CM en
\f\ C5 GO CO ^9^
HI CM <•*
Oo
NO
8 ON
0
4
O O O Oo o o o9 o e o
O O O O
aJ
e *CM cm
cm Ho o
e o -* OCM cm
lf\ <()• O CO fTi
v3 %O fc^oO t***
ONo
oNO
\O
s^
4
©Hi•


Table
16and
scre
en d
ata$
sa
mple
s fr
om h
oles
in
line
Hole
N«
0&
Sample N
®0
5-6?
Sample
Inte
rnal
(in
feet
)
41o4
~y3c
O
Screen S
ii©
*14 mesh (
A)-14435 mes
h (B
)-1
50 mes
h (D
)-35*150
cone (E
)~35«150
tail
(F
)
uWe
ight
Per©ent
Io9
60?
14«6 5*4
71 o4
Anal
]P2
05
2?o9
3lo9
OaO
43«1
46o6
^ti^
al D
ata
(in
percent)
F 3o2
3*6
AloC
h»
Jbu 0,00
2
©U
OoOl
OOo
004
Oc002
0000? «,
3/ Weight re
tain
ed ©
n scre
en0
2/ Blanks i
ndicate
n® analysis
03/
Ma
w equals l
ess
than 0
*001,
All
samp
les
are
from Lot
2545«
H o

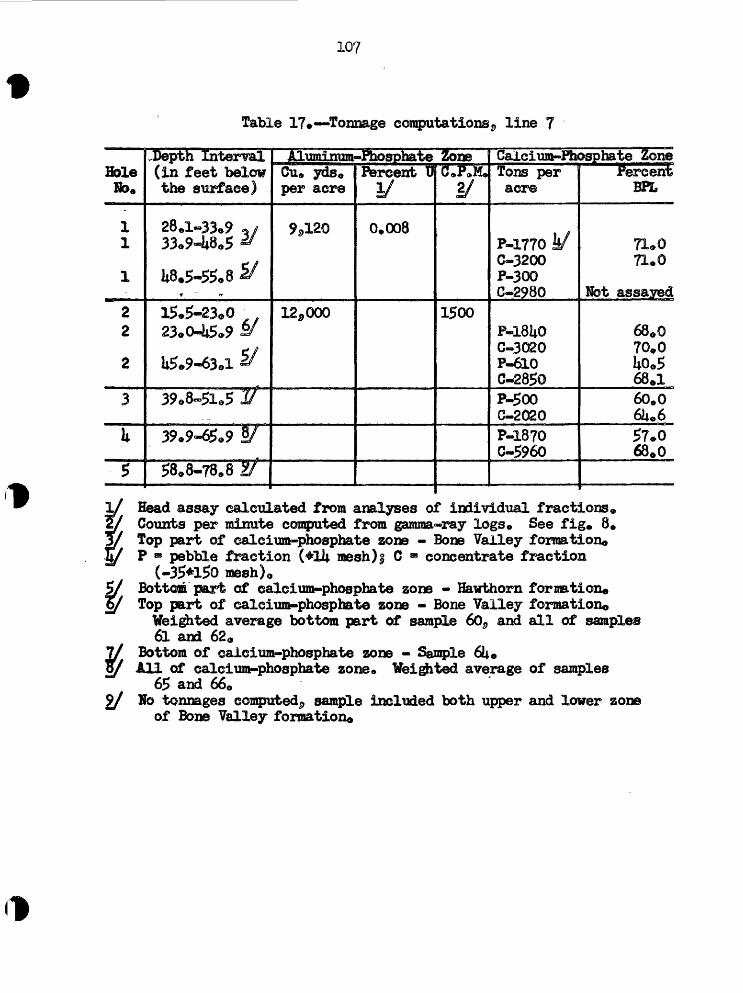
107
Table 17.—Tonnage computations $ line 7
Hole Ho.
1 1
1
2 2
2
3
U
$
,Depth Internal (in feet belowthe surface)
28el-33*9 ./33«9-48*5 ^
1*8.5-55*8 S/
15*5-23*023«0-45»9 ST
U5*9-63ol &
39o8~5lo5 J/
39.9-#o9 W
$808-78.8 H
Aluminum-Phosphate ZoneCu» yds0 per acre
9*120
12^000
Percent Us/
0,008
C»P.M.2/
1500
Calcinitt-Fhosphate ZoneTons peracre
p-i77o yC-3200 P-300 C-2980
P-1840 C-3020 P-filO C-2850P-500 C-2020P-1870 C-5960
Percent BPL
71*0 71.0
Not assayed
68«0 70,0 ItOoS 68,160*0 6lu657*0 68,0
Head assay calculated from analyses of individual fractions e Counts per minute computed from gamma-ray logs. See fig* 8« Top part of calcium-phosphate zone - Bone Valley formationo P m pebble fraction (*Ui mesh)| C m concentrate fraction
(-35*150 mesh)oBottom part of calcium-phosphate zone - Hawthorn formatione Top part of calcium-phosphate zone - Bone Valley formation*,Weighted average bottom part of sample 605 and all of samples61 and 62a
Bottom of calcium-phosphate zone - Sample 61*» AH of calcium-phosphate zone. Weighted average of samples
65 and 66e No tonnages computed^ sample included both upper and lower zone
of Bone Valley formation*


Tabl
e 18
—Ana
lyti
cal
and
scre
en d
ata$ sa
mple
s fr
om hol
es i
n line 8
Hole N
e«&
Sample N
ee
1-68
1-69
2-70
2-71
2-72
.
Sample
Inte
rval
(in
feet
)
5loO
=83oO
83«0=94.0
39o2~5
2o4
57. 5
=77 o
l
77 08-83*5
Scre
en S
ize
£14 me
sh (A)
-14435 mes
h (B)
"150
mes
h (D)
-35*
150
c®ne (B
)-3
5*15
0 ta
il (F)
W (B)
(D)
(S)
(F)
(A)
(B)
(D)
(B)
(F)
(A)
(B)
(D)
UO
(F)
(B)
(D)
(*)
(F)
i/We
ight
Percent
10*4
32.7
11.9
11.7
33o3 l»3
7ol
45»0 6»1
40o5 9oO
18 oO
20oO 400
49 oO
3*o
3*0
29.0 6»o
59 »o 1.8
58o9 2o5
37 oO
Anal
P205
I6o8
31o9
18 »4
27 ol
I8o6
31.5
13*5
28 »5
28o7
CaO
37o5
46o2
38ol
40 a
30o6
44oO
22.3
42 o3
42 *5
ftical d
ata
(in percent)
F 1,9
3o?
2.2
2 08
2o3
3.5
1.5
3o4
3ol
A120
,
I/
U Oo005
Oo00
4
0,00
1 81
Oo003
Oo002
eU
0-00
70,
006
0.003
0,01
0 *y0.
009
Oo00
4 a0.
008 a
0.01
00.
002
0.003
0.010 ft
0*00
40.
002
0.00
20.
006
0.00
1
Oo00
20.
002
0.00
7OoOOl


Tabl®
l8~~
Anal
ytic
al a
nd sc
reen
data
9 samples
£r©m h
oles in l
ine
S~-C®n
tinu
ed
Hole
1 & Sample
Sample
Weight
Anal
ytic
al data (i
n pe
rcen
1 U
megh
(A)
-144
35 mesh
>35<*150 G©n@ (1)
=354
-150
tai
l28
Oo002
(B)
32 08
Oo008
0*011
Oo00
2IH O
25*6
lloO
12
Oo013
40o2
(F)
606
6l«6
30oO
OoOOl
0*009
0*01
2
OoOl
OOaOOl
I/ We
ight
percent
retained ®
n2/ Bl
anks
ind
icat
e n®
an
alys
is*
j/
waw eq
uals
les
s th
an O
oOOl
o
All
samples
are from Lot


110
Table 19«—Tonnage computations 5 line 8
HoleDepth Interval(in feet belowthe surface),
Cu« yds 9 per acre
PercentC.P.M.
Tons peraere
Percent BPL
1
1
51*0-83.0 P-8076 C-9087 P-3U7 C-1630
39*2-52<A
52.U-87.C-1260 P-2636 C-6379
29.1*
30.258.6
h k
1*5*5-50.3 3/
50.3-56.1 56.1-63*1*
P-1800C-630Not analyzedP-1570 5008
65.6
vBo aluminum-phosphate zone present in this line of drill holes.
Top sample of calcium-phosphate zone * Bone Valley formation. P s pebble fraction (*lb mesh)! C s concentrate fraction
(-35*150 mesh).Bottom sample of calcium-phosphate zone - Hawthorn formatione Weighted average of samples 71» 729 and 73« Total calcium-phosphate zone - Bone Valley formatione


Table 20
—Ana
lyti
cal
and
scre
en d
ata^ sa
mple
s from hol
es i
n line 9
Hole N
oc
&Sample N
e«
1°78
1-79
(
2-80
2-81
3-82
Samp
leIn
terv
al(in
feet)
26o6
-35o
4
35.4~43o3
38,7=4806
48,6-50,2
23o6~38o9
Screen S
ize
£14 mesh (
A)=14435 mesh
(B)
=150
mesh
(D)
~35tl50
cenc (f
i)-35*150
tail (F
)
(A)
(B)
(D)
(B)
(F)
(A)
(B)
(D)
(B)
(F)
(A)
(B)
CD)
(*)
(F)
(A)
(B)
(D)
(a) (y)
I/We
ight
Perc
ent
7*6
18 o5 2*3
2«8
68 o9 4,8
14ol
38o6
10,9
31e6
26,2
12 o5
11 06 6oO
43o7
13o8
13 08
21,8
15<>
734,9
19 .6
13oO 9 08
9 08
46.8
Anal
]^20?
31o2
3lo6
22*4
14,8
30 o5
32,7
If ol
18,6
33*1
24*6
1806
29.6
31 06
12,7
26*7
CaO
44,7
44*3
41.4
24o6
46o8
46o9
25^3
28 o9
47o4
43 ol
34«0
4402
45o7
17.7
36,4
rtic
al d
ata
(in
perc
ent)
F 3<>6
3o6
2,5
1,6
3«4
3o6
Io9
2o2
3o7
298
2^
3<>2
3o7
lo3
3 08
A12°3i
I/ caff ?,6
12.5
u 0.01
9
Oo007
OoOi
9Oo003
Oo01
3
OoOo
6
OoOO
lOoOlO
Oo006
eU
0.019
o«oo8
09008
0.01
3 a V
0,014
0,02
00,002
0,011
0,00
1
0,015
0*00
70,
007
0,013 au
0,01
10,
009
0,002
0,010
OoOO
l
Oo01
40,008
0.00
7OoOlO a


Tabl
e 20
<=«A
naly
tica
l an
d sc
reen
data
9 sa
mple
s fr
om h
oles
in
lin® 9
=-Go
Dtin
u@d
Hols
No*
& Sample N
®9
3-83
3=84
5=85
5-86
5-8?
Samp
le
Interval
(in
feet
)
42o6-53oO
53oO-59o3
1707
-280
?
28.7
-51.
4
51.4
-57.
4
Scre
en Size
t!4 mesh (A
) ~14t35 m«s
h (B
) -1
5© m«s
h (D
) =35*150
cone (f
i)
=35*
150
tail
(F
)
(A)
(B)
(D)
(B)
(F)
(A)
(B)
(D)
(«)
(F)
(A)
(B)
(D)W (F
)
(A)
(B)
(B)
(B)
(F)
I/
Weight
Perc
ent
'12o
l 23
o9
24o5 808
30o7 5.8
12o5
28 oO
8«6
45«1
15o9
Ilo9
32 «1
2 0
837 o3 3.5
19 o4
23 08
10o7
42
96
8ol
22o9
I6o4
10o5
42
ol
Analytical d
ata
(in
perc
ent)
F205
29 06
3lo5
28 oO
30*8
28,7
32 o5
27 oO
32.7
24*1
30o4
OaO
43o7
44 08
4204
44o6
40o6
46 o5
42o7
47.1
41 o5
54o5
F 3ol
3o5
3ol
3o4
2o7
3o7
3*1
3o7
2o8
3o5
A120
^
I/
U OoOOl
Oo00
3
OoOo
6
Oo00
3
®u
OoOl
O Oo006
0o002
Oo009 a
Oo012
Oo00
6 Oo
OOl
0*007
0«001
00014
O«OOT
0.005
0*01
2 aV
OoOl
OOo
005
Oo002
Ooooe
OoOO
l
Oo009
00005
0.003
0.00
9OoOOl
H K


Table
20°-Analytical a
nd scre
en d
ata9 samples
from
hol
es in
lin
e 9=
"Con
tinu
ed
H®le
Ne
0ft
Sample N
@0
6=77
7=88
"8-8
9
4
8-90
/
8-91
9-»2
Sample
Inte
rval
(in
feet
)
31*4
=39 o3
22oQ
~39o
O
35,6
-49.
0
49.0-66.2
66.2-72.3
34o8
=51o
2
Scre
en Size
£14 me
sh (A
)-14435 mesh
(B)
-150 mesh
(D)
=35f
l50
cone (£
)=3
5*15
0 ta
il (F
)
(A)
(B)
(D)
(B)
(F)
(A),
(B)
(D)
(jg)
(F)
(A)
(B)
(D)
(B)
(F)
(A)
(B)
(D)
(JE)
(F)
(A)
(B)
(ct)
CD)
UWeight
Perc
ent
Ilo5
14o2
10o6 5ol
58.5 6o2
21o9
n.7
3d
57 ol
25o4 3o4
9 08
53o4
,
3o4
9a 8oO
13*9 2«9
3*8
30<»2
9ol
54 o© 2.2
20.2
65*9
11.7
Anal
P?0«?
22o4 6.0
28 92
27 06
32*3
27.9
33*7
2?.l
31 oO
15*7
26o5
OaO
40o7
23 05
41 o2
38o6
45*1
39 08
47 o2
39*9
45*9
34*8
39*5
rtical d
ata
(in
percent)
F 2o7
Oo8
3 A,
o f
2 08 3*6
3*2
3*9
3*2
3*6
2.0
2.9
Al^O
i
6*3
.. _
u Oo00
7
0000
3
0.00
9
0.00
3 aO0
oo6
0.003
eU
0.011
0.004
Oo00
4Oo
OlO m.
O0oi3
Oo00
40.007
OoOi3 a
OoOi3
0.005
0.004
0.01
0 m
0.00
9 .
0.005
0.002
0.00
8 a
0.00
60.
004 a
0.00
6 m
0.013
0.00
1 *0,00*


Table
20=>~
Aaal
yti©
al a
nd s
creen
data
9 sa
mple
s from h
oles i
n li
ne 9—Continued
Hole
Ne
0&
Samp
le N
o.
9-93
9-94
9-95
10-^6
10-97
Sample
Inte
rval
(in feet)
51*2
-62*
0
62.0-75.3
75.3
-81.3
37.3
-55.
2
55.2
-75.
2
Screen S
ize
£14 me
sh (
A)-144=35 me
sh (
B)-354-150 mes
h (C
)•=
150 me
sh (D
)
(A)
(B)
(D)
-35fl50
©®n©
(B
)-35*150
tail
(F
)
U) (B)
(n)
(K)
(F)
(A)
(B)
(B)
(K)
(?)
(A)
(B)
(»)
(s)
(F)
I/We
ight
Perc
ent
3.6
14.7
63.8
17 o9 0.3
9.1
9.7
3»2
77-7
42.0
13.4 6.4
7.2
31.0 0.1
leO
36.8 2.5
59.6 5o5
15.1 8.7
3.5
61.2
Analytical d
ata
(in
perc
ent)
**2^
5
24.8
24.7
29.6
18.7
28.8
19.1
28.7
28.6
27.2
GaO
39.2
40.1
43.7
40.0
44.7
33.3
38.9
39.0
42.3
F 20
oO
2.8
3.4
2.4
3.2
2.5
3.1
3.1
3*4
A120
3U OoOOl
0.006
0.00
1
0.003
0.008
0.00
1
0.00
4
eU
0.01
20.005
0.001
0.001
0.00
8 &0.
002
0*01
0 a
0.010
0.00
50.003
0.01
0 a
0.006
0.00
10.
002
0.007. m
0.013
0.00
30.
004
0.01
00.001


2 $ t
•«
tooco 800eoC
OO
'0 9
00
°0>Q
8I80°tl
TU
(sr)
(a
« 90
0°0
too°o
8ioco
C
(sr)(G(a
H
I00
°0
200*0s»#*
2° 8
1*0
U)
(a) (a)
001-T
t
800C0
^00
*0tO
O°0>o
0°2
9
t°8
(a)
(a) tfsew
(H)
lf8®T
B
86-01
a


116
Table ZU—Tonnage computations <, line 9
HoleNoe
1 1
1
2 2
2
3 3
3
5
5
6 6
7 7
S 8
Depth Interml (in feet below the surface)
8.3-26*6 _, 26o6-3$»lA y
35JA3.3 ^
32.2-39*7 0/ 39»7-W»6 £/
M.«0o3 ^
35«l*-23a6 « /23*6-38^9 =f'.•*U2.6-£9«3 &/
16»0»17*7 ,,/ 17*7-28«7 &
28.7-^7*14 ^
27»0-31«U c/ 31^-39*3 ^
1U»0-19*7 «/ 19*7-39«0 &
29»7-35«6 9/ 35*6-66^2 S/
Aluminuin-Phospfcate ZoneCiu yds. per acre
29,200
I2d 000
13,200
2,720
9,100
9,1£0
Percent U
C.PJM.a/
1000
1500
1300
l5oo
1000
i5oo
'Calcium-FhosTons per
acre
P-1650 2/C-630p^taC-2120
P-5720C-1310 P-5oo C-580
P-7350 G-3700 P-^950 0-1*250
P4*25o C-750 P-3120 C-7530Not sampled P-22UO C-1190
P-2560 C-Ut90
P-3690 C-8900
3hate ZonePercent
BPL
68.X 69»0Wi9 6600
n^72ait
53o7 6b*6
69.060»l4 6i*oO 67<,0
62^6 71*0 58^0 69oO
1*9*0 61*6
60.lt 70»5
60.0 69.0


117
fable 21«-=>Tonnage ©amputations <> line 9—C©nt0
HoleDepth Interval(in feet
Zoneyds Percent
U
GalciunF>Ph0sphate ZoneTons per Percent
BH.
1000F-880
SuOC-980
10 F-2680 C«l?00 59
ix 11 50.6-53*7
P-1600C-1020 P-70
61^5 TSofe 5lo7
12 P-3Q&I0 G-5160 67*0
Counts per minute computed from gaimaa-ray logsa See fig0 10« Upper part of calcium-phosplmte zone ~ Bone Yalley formation P e pebble fraction (#li|. mesh)f C ffi concentrate fraction
(-35^150 mesh).Loner part of ealciuia-phosplmte zone - Hawthorn formation* One sample of calciums-phosphate zone - Bone Valley
Hawthorn formations,,


-ao
10
9
M
H H
* O© O
=»3 ON6 o«
M3
<UJ«
ON
© O O
€$ O OH O H
© O O O9999o © o © H H © fO
10
o
M tJ
(Ulco
H
* o e
H o<UJ
u>0
°«4*to
4* o
o O
O © O ©• « • oo o o oH O O • -
8
VA
v
T
w
U» 10 §0 H
O CDOOIPO
<^> JO (U>O o o© O CXS
03
© OO 9O ©
SJH1 ©
o O
© © © © o • » • eo o © o o~ H H O H
10
W
PO GO CO ?Ovn *«> © ONIS: 00909
=^le
9ON
O
O
© © © © ©e e » o oO O O © Op o o .© ~
H
VA
soo ON
0 8 VnVn
-I H-fr -fr
© © «#•
O • 901 9B QB p* sr &•
o o * e" © © N
« ON
€90e
e 03
OoO
© © © © ©« o o o
O © © © © O H H .0 H
SO
H
«*-*w I0*1 3IS (5^2»"(ft
CO•1
sCOHO
©
0


Table 22
—Analytieal
and
screea d
ata^
, samples
from
hol
es i
a li
n® 1
0~°C
©nti
nu@d
Hol
e N
o.
& Sa
mpl
e N
®,
5-5
5-6
6-7
6-8
6-9
7=10
Sam
ple
late
rmi
(ia f
eet)
22,4
-26o
Q
31.2
-34.
8
35.0
-39.
8
41.7
-56.
1
56.1
-60,
9
7.0-
22oO
Ser
eea
Siz
e
£14
mes
h (A
) -1
4f35
mes
h (B
) »3
5*15
0 m
esh
(C)
-150
mes
h (D
)
(A)
(B)
(D)
-35*
150
oeao
(B
) »^^1^0 t
ail
(F
)
(A)
(B)
-35*
150
mes
h (C
) (D
)
(A)
(B)
(D)
(B)
(F)
(A)
(B)
(B)
(B)
(F)
(A)
(B)
(0)
(D)
UW
eigh
tP
er c e
at
9*2
65.1
22
,8
14.8
34
*216
.022.}
Oo
l
7.4
9*3
11.9
36
.19
.5
40.6
1.0
1
6.4
43.3
29^7 0.2
14,5
67
.7
17.7
An
aly
tica
l dat
a (i
a p
erce
nt)
P2o5
30.3
12,8
29 ,0
29.7
10,6
25,6
29.9
32.1
24.7
30.1
13.5
CaO
41,6
12,4
43,8
44o7 9.5
0.7
44.1
45.9
40.1
45,8
10,3
10,7
F 3.3
1.2 3*4
3*6
1.1
1.1
3.6
3.7
2.9
3.5
1.0
1.2
M2°
3
17.3
32.0
20,7
U 0,00
7
0.00
2
OoO
Ol
0.02
2
eU
0,00
9 0.
004
0.00
20.
005
0.0
10
0.00
7 0.
003
0.0
04
0*00
2
0,0
03
0.0
01
0,0
29
0,01
30
.00
2
0.0
04
0
.01
0 &
OoO
lO0,0
04
0.0
01
0.00
70
.00
2
0,0
12
0.0
03
0,0
02
0*01
8


120
I°H
00
O H
©
fee
©
tf
©© © O Q
o o o© © © O
© HI •* CM © ©
o o © ©
OQ-vfi) CM O © © © O © © ©
o o o o © © © O
©o
©
0©
o CM«M
SS3 ©3 ^o © © o
o o o© © © O
o©
00
G
HI © HI ©O © © ©
O o o oO O © ©
© fi
e o o © © ©
CO o
CM
e o o
O ©" © O © © O © © ©
o o o o © © © O
o H
o©
o CO
e&=> CM
CM) o@> H O © O
© o o o oo o o o e
© © O © ©
o e
CM
%•»
S
«H
€M CM
a* £•«
CO " O O O O
feCNI
& © . _ ._,O O O O 0
£ CMe o o o
j> o NO
r=8 H © H W! 01
o o o o o&«=> CM *& fr«=> O"* CM H CM HI HI
A OMfe, PQ 0 O «
M
CO
{4CQ
jQ «ti <€
© ® «
* *HHI
© ©
H)H
B 0
HIo
00
1o
CM
CMo
1o o
CM
0
OCM
eCO
0
HI
^8 (*4 g.
S I8fr
CMHI
0 0 CO
0OO


Tab
!® 2
2—A
sia3
.yti.
sal
and
scre
en d
ata^
sa
mpl
es f
r«a
hol
es i
n l
is®
10-
~G@
ntin
u®d
H®1®
N®
0&
Sam
pl®
N®
0
9-17
10-1
8
MW
9
10-2
0
10-2
1
1©~2
2
Sam
pl®
Inte
rval
(is
feet
)
20 o
w<='2
j o
©
O oO
0! g
oi
I7ol
-t5o
l
25*1
-36*
9
36*9
-46*
5
52*4
-57o
4
Scr
een S
iz®
£14
mes
h (A
)-1
44*3
5 »®
sh
(B)
-150
ffi®@
h (B
)=.
35^1
50 ©
en© (
B)-3
5£15
0 ta
il
(F)
(A)
(B)
=35
*150
»«§
!» (
C)
(B)
(A)
(B)
(0)
(D)
(A)
(B)
(D) («) (?) (A)
(B)
(D)
(K)
(y) (A)
(B)
(B)
(F)
J/
W»I
ght
farc
aat
1*6
7 08
23o6
22*3
44o7 Oo4
ua
65o4
20 a 0.2 5«*9
63*9
A0«
0
5.4
16 «9
21*8
10o8
45*1 Io3
4*7
30 oi
10 o
l
8o7
10*9
32*0
14*8
33«6
An
aly
tical
dat
a (i
n p
erce
ntl
.P2
°5
28 *6
32oO 7o
6
12*6
31o7 §^3
30.8
31
*3
25*8
28*4
I5o5
28 o3
OaO
42*1
48*2 6o
3
5«l
42*1 8.9
43*1
45*1
39 08
43*2
32*7
45*1
w 3*1
3«7
0.7
0.7
3.1
Iftl
3*©
3*2
3*0
3o4
2*0
3»5
i
M2°
3
29 c3
17*5
f! 0*00
2
0*02
6
C«Q
04
0*00
1
*u
0*01
10*
005
0*00
10
(f%r\o
y O%
?W 2 m
OoO
OS m
0*00
10
.02
7
0*00
90*
003
0*00
20*00 f
0*00
90*
007
0,0
02
0*00
8 ft
0*00
80*
004
0*00
10,
008
0*00
60*
005
0*00
20*
00? %


122
3 «H
*©O
00
S3 •H
eg© H
fto <^
•rf 9*
fto © €9
t»
•H•R
0801
«
•H
^J
© OSj
© ©
s©
S3
CO
CO
"^ff•a
c©o
OS
os©
OS
HI CO vO o o o o
c©
0
OB (Q CQ OB
HI-fr -ft-Hi'HI
oj Q
08
AH
H © O _© © © ©
0 O O© © © ©
3a
oo
C© 6^=0©o o o
OJ _HI
os© OJ
oOS
© "*• OS G@ HI © © O © © © ©
o a o « © © © ©
o
O?
CO ©s© HI o o o o o
O8H HI Hi
0 ©
HI
0 0
HI o
o oo
O ogO O
o 9 o o© © © ©
os
s OS
00000dl fr» !?«•» Oi ©HI Hi Oil H ^n
«»5
rt
o
gw O
© ©
e H
«
H
oH
H o
KJ
OOo o o o
O cr^Hio©Hi 6*°
Kt o
7OO
o
H
H © O- O © © © ©
O O O O© © © ©
H! ©
eO
HI o
© o
0
Ofl
o
OJ
oGO
O OKl
H!
CMHI
HI e
08 Oil
OS<'.H!


Tabl
® 22
=~Analyti@al a
nd scre
en d
ata$
samples
from
hoi
as i
n li
a® 1
0°°C»n
tinu«d
H»l9 H9
0
&
Sample N
®0
12-2
9
.
12-3
0
12-31
13-3
2
13-3
3
Samp
leIn
terv
al(in
f99t
)
31o5
-34*
2
34«2
-38.
5 "'
3805-43.l
2^=3
8.0
3800=39.6
Sera
en S
ix*
*14 B«sh (
A)-1
4*35
»••!» (
B)-1
50 B«*h
(B)
=35*
150
c«ne (
K)-35*150
tail
(F) (A)
(B)
PI
(S)
(F) (A) (B)
(D)
(B)
(F)
(A)
ft»\
\BJ
W W (F)
(A)
(B)
(B)
(B)
(F)
yWeight
P«r*9nt
4o6
17 o9
26o5 9 06
41 o 4 8o3
29 o5
1204
36 o2
12*5
36 o4
23o3
21o? 1.1
III
7ol
32 oO
III
18 Oo8e4
60 ol
Anali
P205
29 o2
30o8
27o2
25o6
26oO
30o4
29 «o 9ol
32 ol
2? of
28o©
CaO
43o3
44o3
42o7
39ol
2806
3l«3
28 *2
11.6
30 o?
28o6
27 «1
rti@al d
ata
(in
p ere
eat)
F 3o2
3<»5
3JL
3oO
3oO
3oO
3«3
0.7
3 06
3oa
2 08
A120}
0 OoOOl
OoOO
l
0,016
Oo01
3
90
OoOlO
00002
Oo002
Oo00
8 a
OoOll
0,00
4
Oo00
6 %
OoOO
lOo
005
OoOOl
OoOO
fOoOOl
0.01
?
0,013
OoOll
OoOO
l
00012
oloi
OoOO
l
K


Table
22~~Analytieal a
nd sc
reen
data
? sa
mple
s fr
em hol
es in
line
10~°C
@nti
n«ae
d
H®le N
«0
&Sample N
®0
13-3
4
13-3
5
14-36
14=37
14-38
Samp
leIn
tern
al(in
feet
)
39o6
~54o
3
54.3~55<»5
23o3-25.o
25*0-29.1
29.1
-34.
0
Sere
en S
ize
f 14 mesh (
A)-1
4f35
m®sa
(B)
~150
mesh
(D)
-35*150
een© (I
)-35*150 tail (F
)
(A)
(B)
(D)
(K)
(F)
(A)
(B)
»35*150 mean (
C) (D)
(A)
(B)
(K)
(F)
U)
(B)
(D)
(K)
(F)
I/We
ight
Percent
9.2
16.0
5*7
16 .4
52,7
17 o9
10.7
39 e3
8oO
24 d loO
13 00
63.0
18 oO
2.9
8.5
32.2 3o4
53.0
42.3 5<>7
42 .3
2.6
7,1
Analytical da
ta (in
perc
ent)
P205
29 o5
29 o2
19 o7
26 o5 8o9
4o5
30.0
15*5
30oO 3*6
9f±
O fc
GaO
29*9
28.0
26aO
27o6 7o2
2.9
29 o5
16.7
31 el
35*0
49.2
F 3o3
3ol
2.1
2.7
0.7
0.3
3.0
lol
3.4
0.4
1.1
A120
3U Oo003
0.001
OoOl8
eU
OoOl
20,004
0.003
0.007 *i
0.01
00.004
0.00
10.
007 at
0.01
20.
002 a
0.01
3
0*01
7Oe006
Oa006
0.01
30.001
0.002
Oo00
20.002
0.00
4 %
H


Table
22--Analytical a
nd screen d
ata
9 sa
mple
s from hol
es in l
ine 10
—Con
tinu
ed
Hole N
e.&
Samp
le N
e.
14-39
15-40
15-4
1
16-4
2
16-43
16-4
4
Samp
le
Inte
rval
(in
feet)
35.0
-37 oO
40.2
-49*
7
51.3
-54.
1
10.2
»13o
l
20.7
-32.
3
78,4
-84.
1
Scre
en S
ize
t!4 mesh (
A)
-14*
35 m«s
h (B
) =1
50 mes
h (D
) -35tl50 se
ns (fi)
-35*150 ta
il (F
)
(A)
(B)
(D)
CD
(F)
(A)
(B)
(D)
(is)
(F)
(A)
(B)
-354150 mesh (
C)
(D)
(A)
(B)
(O
(D)
U)
(B)
(B)
(F)
UWeight
Perc
ent
46.0
15
.8
11.8
13
.8
12 06
2.5
17.0 3.5
2.1
74.9
27.5
7.7
28.6 7o5
28.7 0.1
16.5
76.7
6.6
0.2
5.6
79.7
14.5 2.8
3.1
19.1 5.8
69.2
Analytical d
ata
(in
percent)
P205 3-8
24.2
27.7
19.4
24.9 9.4
7.6
21.0 1.5
10.3
26.2
CaO
30.9
33.3
35.2
41.0
39.2
43.1
10.3
4.2
33.9
3.7
41.4
43.4
F 0.4
0.4
2.6
3.2
2.3
2.9
0.9
0.3
2.5
0.2
1.2
3.2
A120
3U 0.007
0.048
OoOlO
•U
0.002
0.002
0.001
0.00
1 a
0.01
2 0.004
0.003
0.009 a
0.01
1 0.
007
0.001
0.00
9 a
0.010
0.00
30.
002
0.02
7
0.009 a a
0.003
0.00
7 0.003
0.00
2 0.011
0.00
1
K vn
parG
eat
reta
ined
©&, sc
reen
. in
di@a
t® m
e an
alys
is.
All
i" e
qual
s le
ss t
han
0.00
1.
samples
ar®
from L»t
2546o


0*59
1*99
090C-0
0001
9
9
99
5 0*9900^0
oot^ctn n
0*99OOIC-D
oogt009*62
0*69019^0
001*01
z
09SC-DI
©JOB dad
01
921


127
Table 23«—Tonnage computations <> line 10~-Cont0
HoleNo.
7 7
7 7
8 8
8
99
9
1010
10
10
10 10
Depth Internal(in feet below the srurface)
7,0-22*0 , 22oG-28»l 2f
28.1-33.1 c/ 33.1-1*3«2 £/
18.0-22*9 _, 22.9-^6 ^ X^feC.«7F "i0?Uo.J? cad1
ft/
36d3-37e2 ^
UuQ-liub' H|08-20»6
20.6-23.6
800-17a ./17*1-25*1 ^/25a,-36.9 5/
36^4t6o5 S/
U6.$-$2.h ... 52*U-57oli 3/
Aluminom-Phosphate ZoneCu0 yds*per acre
2U,000
7,81^0
No economic
1U*500
Percent Uy0«006
O.OQiii
0.0(5
C.PJU2/
500
Gaielum-FnosphTons per
acre
p-a^oMo concentrate Not sampledP-18%5 C-3060
F-1940 C-66^0 P-660C-420
P-826 C-1580P-120 C-1670
P-390 No concentrateP-1570 C-3lUo P-350 C-232G Not sampled P-1C50 C-1800
ate ZonePercent
BPL
66.2
toa67e2
68^8 714*7 19»0 6Q»k
66.9 68*8 68«5 70»0
69»0
67.2 68.1* 56.4 62 00
33»961.8


128
Table 23,—Tonnage computations«, line 10—Gont*
Hole No.
tepth nterval (in feet belowthe surface)
Ctu yds* per acre
Percent tJ3/
Zone Calcium-Phosphate ZoneTons per
acre BPL
1111
1111
20.3-22*0P-300
Kb recoveryP-liilO
P-290 C-280
66.9 U0.5
12it12
12
P- 600 0
31.5-3t*.2 P-330 C-700 P-2170 C-1990
67*2 58*0
23
13
13
P-1870C-1730P-3700C«6260P-430C-200
63o5 70«2 63*6 63.1* U3«l 58a O
11*
Hi
8160 800P-2C-330Not computed 8<
65*6 65*6
1516 0*0(5
Head assay calculated from analyses of tadirldtfal fractions.Counts per minute computed from gamma«ray logs. See fig. 11.Top sample of calcium~ph0sphate zone » Bone Valley formation*P s pebble fraction (*lb, mesh)3 C ffi concentrate fraction
(-35*150 mesh).5/ Bottom sample of calcium-phosphate zone « Hawt-horn formation. §/ Sample not assayed*T/ One sample includes both Hawthorn and Bone Valley formations B/ Hawthorn limestone samples 0 Not caleiiiffi-phosphate zone. 2/ Sample includes Bone Valley and late middle Miocene (?)<> Not
"Wf Weighted average of samples 30 and 31.Hawthorn (f) unnamed wanafosTi weighted average of samples 33 and 3h°
Not ec©n©mi©o Hawthorn (?) tanmmed member« and Hawthorns Not economic•

Tabl
e 24-=Analytical a
nd s
cree
a data,
samples
frem
hol
es i
n lint 1
1
Hole N
e0
&Sa
mple N
®0
1-45
2-46
2-47
2-48
3=49
3-50
Samp
leIn
tern
al(ia
feet)
13.3
-16.
9
18.6-32.0
32.0-39.3
39.3=41.9
8.9=21.4
39.8
-51.
5
S©reea S
ize
•*14 mesh
(A)
-14435 mes
h (B
)=1
50 mesh
(D)
-35*150
eea© (S
)-3
5*15
0 tail (F)
CB)
-35^150 mesh (
C) CD)
(A)
(B)
(c)
CD)
W (B)
(D)
(B)
CF)
(A)
(B)
(C)
(D)
(A)
(B)
(D)
(B)
(F)
HWe
ight
Per©
eat
51o4
14 o0
Ilo2 3«3
20ol
•JQ A
1.70V
9o5
0*3
10.5
79.0
10.1
1606
23o2 3*9
4.5
51 A 0.2
1*6
73<»
025
.2
12.5
18 o0 9o5
5.4
54 06
Anal
ytic
al d
ata
(ia
pereeat)
P2°5 5o2
4«4
8*9
4.5
13o8 9,2
30o4 6o9
32 06
13*0
11*5
29 o5
11.9 3«7
30.7
C5mO
32 ol
33o5 3*3
4o6
11.8 4.5
44o3 8.9
47 o5
11.9 9.6
44 o 4
16.1
y" £
5« 6
46 o©
F 0.7
i
©.6
.
0.4
0.3
Oo?
0.4
3«4
Oo4
3.7
lol
0.6
3.5
l.l.
0.5
3oT
A120
3
a/
u 0*005
0.016
OoOO
l
0.00
1
00019
eU
Oo008
0.00
6Oo
002
00 004
00003
0.003 a
0oOl8
0.00
8 a ft0.010
Oo014
0.006
0.00
60.013 %
00006 a %
0.00
6
0.010
0.00
70.
006
0*001
0.00
9
K


ON
A
IHto9
S9CO
0 O td {>
8o-«a(U» SO <£» © o o e o© vn ^ H
oo O
2
O O0 »O O O O«o p p» Vn
X
u<ON9o069%0
Q><^<Q"Q"p>
JN fO
O IO««3 PO'X
U» IOIH ONO 9
£ $ 0 *O H
u> u»* «Vn t**
00009 o 9 oO O O O00 0 IH
1
\y\080£
£49<**•
O O W {B»
JO ON JO --3 OOH
H <«*> C0<=*9
=•3
w
O9
O0
O O0 9
§ 8 Vn l» » fo
-'
£
vnoo<$»i
ON0Vl
<5'&'5"S'<P
^> GO 80 IH
QO^O <ffc O^O
^ U 9 0O IH
6^ ro
9 0IH <vO
t^J fc*>9 0««a o
O O O O O999*90 0 0 0 0O IH O O IH
3190
IH
eO8
9(TO
0UuVn•ffH^l\
O
3oasr
3 O cd &
J O C»O
IH GOO IH
IH IH 3 UJ
9 Oj =^a
IH
9> 4h
O IH9
O O0
5 O
0 Vn P
vniH0vn
0vnaVO
8 8,*>U; o^n. Vn IH•0- -CK 0 4*>IH IH IH * -ft-Jl ^Jl ^|\ &A^ ^^
o o ovn*«*• o @ @ 3D 0 « O O-!•> 3 58 SB EfiH o er gr gar«?'i?<5'^'?'
ON IH IH
• O 9 9 0ON<**> O O O
00 50
e oUJ CO
fi S O 9
0 O<ya oo
© 0 0 090090 0 O 0 0 0 O 0
» <=»g IH <£» IH
COtt PJ
•d »-»
r?® 0o
^fH° S CO (M »^ AA
O §
Elpi
A
^-x
CO
^o**°JN
Jf• *&
13 s*-
fOO
vn
„o
(M
SOou*
a
c
J3
IH
€8
&
|
P13
d
1«*•
Iso
IQB
IH ® KB
rIH
P
IH IH
00OO
5
OCl


131
•a•§•HI
tiOo
0AH
S•H
©Hi
S !fc,
I«
»?
1
CM
H
3
«•"*»•8H
ft
&<*4
t6•**
1•HI
1•q
f*3
Hl]}°H
$
•
•H03
•
O03
§ •112O3 0
W
o
25
5 «**HI3«
&
£3
0CM
^
fro
\
o5
o£•
1E£
«»"•*>49
0*
$s•H
v^«>
o
SB
©HI
1w 03
© CM CM CM «8 HI O O HI O O O O o o e oO O O O
© «*0 O
CM m
HI «<*O 9
# *
O O
3 3
CM U\U\ gs 0^
HI NO rn^ <*\)fc\HI CM
«3 (q O (U| fee
43 43 43 © HI(8 n tt $3 «Hi4} 4) tt> 4} Coa a s o 4s«* u\o o oHI f^ f\ \f\\T\
<$ fl *^ ^p=d v/\ \j>
9 ^^ r*^8 0
CMo
O
1NO
ONOvO
***Tjf1
0NO
qd> — -fl qd> f\£ g|
HI O O HI 0000
« o o o O O O O
CM CMj-gjj ^^
ci c50 0
O ©
C^ l^T)0 0
m rn
o «*o o
* *
O 0
*N r± CM rn
t^tQ^ti' O •&
CM CM «* m c-»* *
SSS3S
©so
CIS
oCIS
o<^>«*1
£Q•f^
§*-
CM «* rn CM HI 0 0 O 0 O 0 O
o o e o O O O O
CM
80
0
oHI
^o
S
o
CM
O t— ft*"* CMNO f*\ f*Tl f*^ **"
HI HI HI Vr\
HIe
\O
VGS
oOS**
OS\^|e-
S ag ag \fV
0 §e o
O O
O O
9O
HIo
O
*t«
O
09o
H
«*• O * CM
CM HI ONOCM CM U\
<5«"o"S'
43BO
_jiff*T>
\f\
Pfy
0
oo
(!"">CM
09
0CM
OsO
8CO
tf CM CM s© O O C O © O
O O O
NO
Ooe
O
oO
r*<
0o
CM O CM *N&
O f^ HI X*^CM fe«»
•HB pQ ^j O
CM0
O
sO0
UNNO
r4NO
0CO
sO CM CM HI fl* O O O Hi 0 O O ©
O © O O
riooo
O
© ©o o
rf) ff%
t= s©o e
2 ^
0 O
CM CM
o o o o o
H] CM *«\
q-S-^w^
0o
&=>fe«
0CM
oOfe«
CMs©
00®


00
©oo
* -&» 0H H H
0 0H
1H
® O 9 O 63 E8 Q> SB
H O W {»
o o o o o
OO o0s
oH
H o
H oH
O O O OO O 9 Oo o o oo o o o
CO
§*T*
,, gH SJ» O
0 «*•
?*
O>
COO10>
N
O
a
SaP.P> d-
H«
H
6V9
t
B
8-
88
as
0 oo oP.


13;
Table 25«~-Tonnage computations,, line 11
Hole No.
12 2
3 3
It h
5
6
7
8
Depth Internal(in feet belw the surface)
Blank Hole22.5-28.0 '&.39»3-t*1.8 W
ZL.34kJ&&39»7-sui y13*0-15*1 y,U7.5-51.8 2/36*04*8.8 J/
66«5-7Xo9 J/
3U.8-SuO ¥
Blank Hole
Jllurrdnum-Phospfaate ZoneCu» yds. per acre
8,800
1*,960
35360
I^rcent U
Co P» Ma
i/
1000
1000
Galcium-Biosphate ZoneTons per
acre
p-icao yG-270
F-31490 C-1510
f /UF-600 C-1000
P-1UO C-630
P-2200 C-1390
Percent BH,
66.571*2
6k»6£vy &&OfaJ
57ol* 68,4
37*0 68.557*0 66.0
ss
2/
Counts per minute computed from gauuna-ray logs. See fig. 12*Interval between aluminum-phosphate zone and calcium-phosphate
zone is clayey sand, not economic.Upper part of calcium-phosphate zone^ Bone faxley formation*P & pebble fraction (*lli mesh)| C s concentrate fraction
(-35*150 mesh).Aluminum-phosphate zone based on lithology - No analysis on gamma-
ray data available.One sample of cate ium-phosphate zone5 Bone Valley and Hawthorn
formations.ifet computed - sample analysis includes iuU feet limestone berieatli
calcium-phosphate zone.Calcium»phosphate zone in middle Miocesse ft) unnamed member.
Sample 58 and part of 59 "osed to compute tonnage and grade*


Tabl
e 26
—Ana
lyti
cal
and
scre
en d
ata
£ sa
mple
s frem h
eles
in
line
12
Hele
N*
0&
Sample H
»«
1-64
1-65
1-66
2-67
2-68
Samp
leIn
terv
al(in
feet
)
6*0-11*0
11.0
-19.
0
22ol-28oO
8.5-
17*2
17.2
-26*
5
Scre
en S
ize
414 mesh (
A)-14f35 mesh
(B)
-150 mesh
(D)
~35*150
cenc (E
)-35*150
tall
(F
)
(A)
(B)
(x»
(1)W (A
)(B)W
(1)
(F)
(A)
(B)
-35*150 mesh (
C) (x»
(A)
(B)
(D)
(s)
(F)
I/Weight
Percent
9o3
9o3
36o2 Oo9
44 a 3o2
1400
25*0 8ol
49 08
7.3
8o3
28 o 3
24e8
31o3 1.2
30.4
49.4
19 oO 2 06
15o8
32*7
19 o4
29 o5
Analytical d
ata
(in percent)
P2o5
14o4
22e4
17*5
33o6
23.6
35o2
34.8
37«5
10.9
33o4
32o6
CaO 2*9
6.3
13*3
45.6
21 o 4
50*7
50*6
52*0 6.5
48 01
48.6
F 0*3
008
Oo9
3*2
Io4
3o8
400
4*3
Oo5
4*0
3*6
A120
3
2/
U 0*01
0
Oo023
OoOi5
Oo014
0*01
6
0*009
OoOi
6
0*01
7
Oo014
0*004
eU
0*01
10*005
Go 02£
Oo01
7O
e002
0.012
0*00
7Oo
014
Oc01
2Go 004
OoOl
60*
011
0.01
1 0»
0l6
0.005
Oo00
5 »yOo
OOl
0*01
9
0*01
50.
008
0.00
50*
010
OoOOl
G

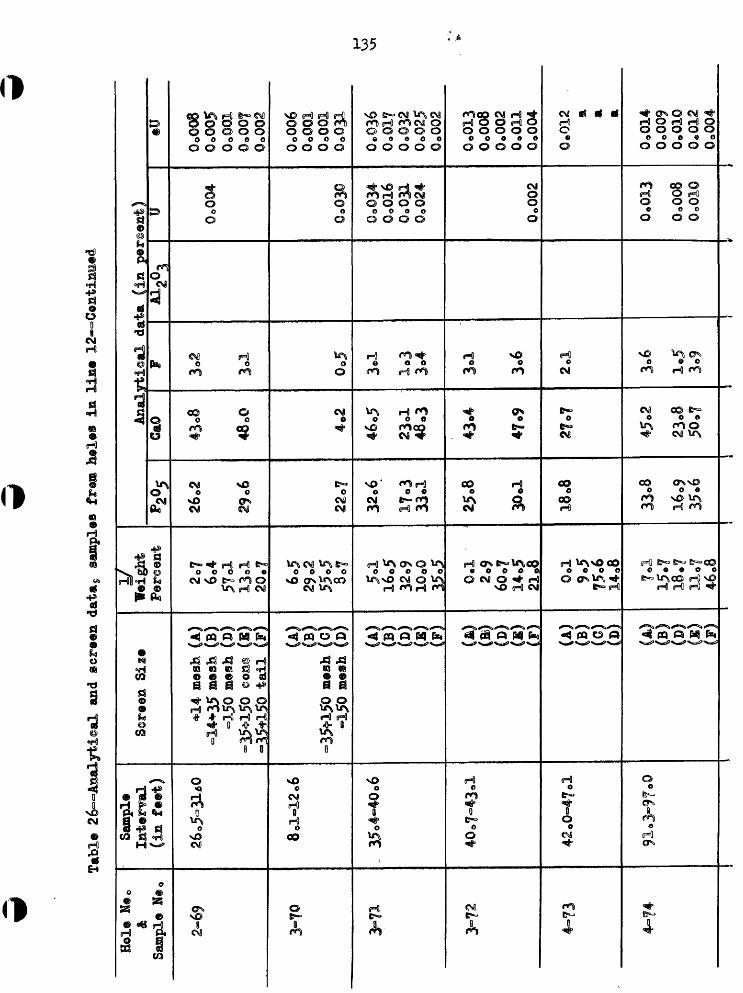
Table
26~«
Anal
yti©
al an
d screen dat
ag sa
mple
s frasa heles
1m l
ime 12
—Con
tinued
Hol
e N©
0&
Sam
ple
N®0
2-69
3-70
>71
3=72
4-73
4-74
Sam
ple
Inte
rnal
(in f
eet)
26.5
-31*
0
8o
l-12,6
35.4
-40*
6
40
.7-4
3*!
42.0
-47*
1
9i.3
-9?*
0
Scr
een
Siz
e
*14
mes
h (A
)=
14*3
5 m
«sh
(B)
=i50
mes
h (D
)-3
5*15
0 co
n®
(K)
-35fl
50 t
ail
(F
)
(A)
(B)
=35*
150
mes
h (C
)-1
50 m
esh
(D)
(A)
(B)
(D)
(B)
(F)
W (B)
(D)
(B)
(F)
(A)
(B)
(s)
(D)
(A)
(B)
(D)
(s)
(F)
yT
eight
Fer
e an
t
2o7
6^4
57 o
l13
oi
20*7 6.5
29 0
255
*5 8o7
5.1
16*5
32*9
10oO
35o5 ©a
•2*
960
*71
4.5
21 «8 0*
19*
575
*614
o8 7*1
15^7
18.7
11.7
46 0
8
Ana
lP2
°5
26.2
29*6
22o7
32.6
17o3
33.1
25.8
30.1
18.8
33*8
16 *9
35*6
CaO
43*8
48 o© 4.2
46
.5
23*1
48.3
43*4
47.9
87.7
45.2
23
*8
50.7
rfcl
sal
dat
a (i
n p
er@
ent)
F 3.2
3.1
0.5
3*1
1*3
3.4
jJoA
j.O
2.1 3*6
1*5
3*9
A12
03U Oo0
04
0*03
0
Oo0
34O
oOl6
Oo0
31O
o024
Oo0
02
0^01
3
OoOo
80
001©
eU
0.00
8o<
.oo5
OoO
Ol
0.00
7Oo
ooa
0*00
60.
001
0.00
10.
031
0.03
60*
017
0*03
2O
o025
0*00
2
0*01
30*
008
0.00
20.
011
0*00
4
0.01
2 a, a a
Oo0
14O
o009
0.0
10
0*01
2O
o004


Table
26=>~Analyti@al
and
sere
en dat
a$ samples
frem
hol
es in line l
2="»
Cent
inue
d
Hole
N*.
&
Samp
le M
««
4-75
6-76
8-78
Samp
le
Interval
(in
feet)
97.0
-99*1
101.4-
103.
5
50.9-59.9
Screen Siz
e
*14 mesh (
A)
=14+35 mes
h (B
) ^150 mesh
(D)
~35*150
cene (K
) «35*-150 t
ail
(F)
(A)
(B)
(D)
(E)
(F)
(A)
(B)
-35+
150 me
sh (
C)
(»)
Weight
Percent
Io2
12«,0
21^2
29
.6
52 ol
9.
4 19 .8
3.
6 15
*1 8.6
14.4
57.1
19.8
Anal
ytic
al d
ata
(in
percent)
P2°5
32.0
19.3
23.7
8.9
26.7
OaO
28^9
51.0
42o2
30.0
45.6
40.6
F 2^3
3.7
3.1
1.1
3.2
3.4
Al20
jU Oo02
0
0.00
6 0.019
0.01
8
0.014
0.001
eU
0.02
20.
012
0*00
50,021
0.006
0.00
9 0.006
0.020
0.00
9 0.
007
0.01
60.002 a
0*003
\J Weight p
ercent re
tain
ed e
n sereen.
2/ Bl
anks
ind
icat
e ne a
naly
sis 0
3/
waw eq
uals
less
than
0«001.
All
samples
are
from
Let
2546


137
Table 27«—Tonnage computations5 line 12
BoleNbe
1 11 1
22
3 3 3 3
k k h
h
6
7
Depth Interval(in feet belowthe surfaoe)
6«0»H*0 «/ 11.0-19.0 &
19«0.22»1 tf/ 22.1-28«0 &
8o5-17.2 " *17o2-26p5 Si
8a-12o6 I/ 12^7-30*5 30,5-35*4 A/ 3S.li«4o^6 3^
Ii2«0447*l U?a-9U3 «/ 91*3-97*0 ^
97*0-99ol S/
Blank Hole (ft
Blank Hole (Lc
AluminumCu0 yds a per acre
83 000
13*900
7,200
7,850
8,160
losphate to
w grade,-, 1
-PhosphateJBercent TJ
3/
0»CE2
O^OQb
0»OQ5
o deep)
ow tonnage
ZongC.P.M,
*/
2500
800
)
Caleiimj-Phos]Tons per
acre
P-620^ C-3570Not sampledP-1060C-3620
0421*0
Barren loose
P-6000-1200
Barren beds«P-95© C-156I*P-60 C-103©
phate ZonePercent
BPL
73o£ 77*0
76*0 8200
73*0 71*2
sand*
n*272«2
7^ Ofj»y 77o6 7000 7l*o$
Head assay calculated from analyses of individual fractions.,, Counts per minute computed from gamma-ray logo See figo 13« Upper part of calcium-phosphate zone0 Bone ?alley« P « pebble fraction (*lU mesh)| C » concentrate fraction
(-35*150 mesh)aLower part of calcium-phosphate zone. Hawthorn* One sample of calcium-phosphate zone - both Bone Valley and
Hawthorn. Upper,, possibly reworked aluminum-phosphate materiaU

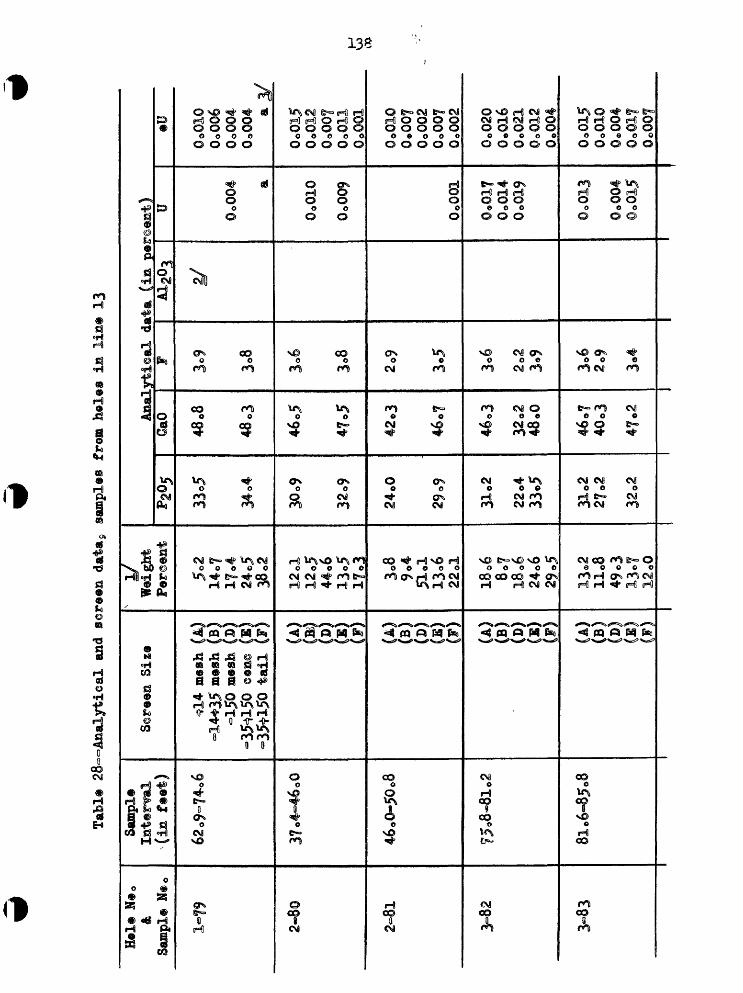
Tabl
e 28--Analytical and
sereen d
ata
£ samples
from h
oles i
s li
n« 13
Hoi*
N$
0&
Sample M
*o
1-79
2-80
2-81
>82
3-83
Samp
leXatsrml
^(in
f«et)
62o9
~74o6
37o4°46oO
46oO
-50o8
<? 5*8-81
02
8l»6
-85»8
S@z°9ea
Si 20
«*14
mes
h (A
)-14*35 m®s
h (B)
°150
aes
fe (B
)-35^150
c®a© (B
)»3
5tl5
0 ta
il (F
)
(A)
(a»
(»)
(E)
(F)
(A)
(B)
(D)
(E)
(?)
(A)
(B)
(D)
(B)
(F)
(A)
(B)
(D) w (»)
I/Weight
Per@@nt
5c2
14o?
I?o4
24c5
38 o2
12 d
12o5
44o6
I3o5
17o3 3o8
9o4
51 ol
I3o6
22ol
I8o6 80?
1806
24«6
29 °S
13 «2
llo8
49 c3
13c?
12 00
Anal
ytic
al d
ata
(in percent)
P2o5
33o5
34o4
30o9
32o9
2400
29 «9
31o2
22o4
33o5
3lo2
27 »2
32o2
GaO
48,8
48 o3
46«5
47^5
42*3
46*7
46o3
32 02
48.0
46*7
40o3
4702
F 3o9
3o8
3<»©
3o8
2o9
3«5
3*6
202 3»9
3*6
2o9
3*4
A120
3
S/
u 0o004 a
OoOlO
Oo009
OoOO
l
0*017
0«014
Oo01
9
0,013
Oo004
©aoi5
*u
©oOl
O0^006
Oo00
40«004 *y
OoOi
500012
OoOOT
OoOl
l00001
OoOlO
0.007
Oo002
Oo00
70»002
Oo02
00.
016
Oooai
Oo01
20.004
0*01
5OoOlO
0,004
00©lf
OcOO
T


Table
28~~Analyti©al a
nd screen d
ata9
samples
fr$m
holes i
n line 1
3=~C
®nti
nued
Sample M
@
Sample
Screen S
ize
Weig
htAnal
OaO
UeU
4=14 mes
h
mesh
(<
£)
mesh
(D
)83
o411 ol
Ool
loO
24o5
OoOO
l
Oo00
200001
0000
2
59 <>:
280-*
4o2
Oo4
c
•35*150
©@n© (E
) =3
5*15
0 tailjjl
12o2
27 ol
29 08
Oo00
8
OoOO
fOo
Oo5
OoOlO
36o2
14 o5
1106
Jo?
34 o©
j&i
sy Jl
«722
oO
48,
3o5
2 08
4oO
Oo012
0«,0
06
OoOll A
9*2
BOo004
Oo01
4<Me«
OoOOl


140
*©O
n
HJ
fl
©H
Iffi©•rfP*
coCM
HJ•8
is©oc.ffi Pi
&
afOf
•a€3
•a
iH|«H^®
S
©
03
.— Ji j£)
fsw 4s
CO S3H
e
S3
s
"
en©
CM
*
O
O
oCM
O
£
+**!>
O©
©HJ
1cs03
CM Hi H H G © © © © ©
© © © © ©
CM Hi HI HI © © © O
o o o o© © © ©
O 0 6 Of*T) CM HI f^i
\l\ 4^P j=jj H^
o o e e
"VJ9 1"^^ C\i ""4°
to, «* CM HiO O 0 0
Ox CO to, CMCM CM Hi rO
^.^c*Tl !*•*> Q> HI xO
<j pq o pq f«fl
® oa as S3 °H
S g g SS 4»
««j° to, © O © HJ rn»\A\A,lt>*A* _JL grffjl grffS onJ)^^ ^jr im tm B^TJ
•* 9 * * Hf Xr^uS
8 f»T) r*" 0 8
V®o
? '
©D
HI O © O © © © © © O
© © © © ©
^*y O"^ HI O O ©
0 «© ©
*& C© ^*1 o o o
fO O r*l
Ox Hi "<l° o » »
•* CM ^
c© ^ ^ o o e
CM CM
HI CM toj^ fc*»
H Hi CM Hi CM
^^S"WN-
oH co
e CM
HJ
1
Ofxc© rj CM ^ H © Hi Hi © © © © © O
© © © © ©
£**•=* O*^HI O© ©
O 0© ©
e o e
P^j f^J CO e * e
«*• CM •*
* e o © CM r^
<M CM CM •* ©
r^ r<*| r*^ © ©H HI HI H *>
3SS5S
o COt—
8e
xO
CO 0
© o o c© © © ©
oe
©
HI *A © *&
© © © O- CO HJ
Q> CQ^?"S
m9
©
0
xO0
A0
Ox vO
CM Ox
0 CO
H H © C 0 © © ©
© © © ©
^ CM HJ © © ©
o o © ©
x© to,0 O
CM CM
CD •* e o
mm,
cocoO 0
«*• © CM CM
xD ^*- CMC©
xD C\
3SSS
CM o
?O
oxD
0 CO
CM
eeH
03


141
Table 29«-—Tonnage computations 5 line 13
Hole No.
1 1
22
2
33
U h
5
6
7
8
Depth Intertal (in feet belowthe surface)
57*0-62.9 ,/ 62.9-71u6 &
29.2-32.532.5-37.1*
37.Mi6»o 2/
72.3-75.8 Sf,75*8-81.2 U
70.0-75.0 f^ 75.0-81.5 U
80.9-85.9 U
67.14-79.5 2/
76.9-80.7 9/
Blank Hole
JULuBiinum-Phosphate ZoneGu* yds»per acre
9*500-
5,280
5«>600
8,000
Percent U]y
O.OOij.
0*006
C*P»Mos/
1000
1700
Galcium->Fhosphate ZoneTons per
acre
F-1500 ^f C-6850
Percent BEL
73*2 75*2
Bbt sailed - calcium-phosphate &one P-2500 67.5 C-2780 71*9
P-2l*80 C-3290
P-1880 0-1^280P-890 C-90P-liOOOC-3500P«1250 C-1000
68.2 73.2
6lu765.159.2 67.561i9 5 67.866.5 73*5
Head assay calculated from analyses of indi*?idual fractions. Counts per minute computed from gamma-ray log. See fig. 11*. Total calcium-phosphate zone., Bone Valley and Hawthorn formations* P ffi pebble fraction (*!!* meshjf C » concentrate fraction
(-35*150 mesh). 5/ Bottom of calcium-phosphate zone. Hawthorn formation. |/ Aluminum-phosphate zone. Hlddle HLoeens(?) imnamed member. T/ Calcium-phosphate zone. Middle MLocene(f). £/ Calcium-phosphate zone* Middle Mioeene(?)« Weighted average of
samples 90 and 91*9/ Calcium-phosphate zone* Kiddle Miocene(?)» Includes 2.0 8 of core
not recoTerede


Tabl
e 3Q
~»An
alyt
ical
and
sc
reen
data^,
samp
les
£r«m
holes in l
ine
Hole
H®,
S@r©
@n S
ize
Anal
ytic
al d
ata
(in
per@
ea1
GaO
Fu
• oA^^vo"!
8*9
=35*150 me
sh (
C]
°150
m@sh
(D]
Oo021
OcOO
l
=354
=150
tai
l (F)
20o3
52
06
OoOl
l Oo
002
00012
CD)
24o4
Oo00
20*
012
0*01
3
18,
69 14o6
11 ol
2108
13o2
39 o3
33o
26 0
3*5
2o9
5o«,
o
Oo
Oo
OoOlO


Table 30
—Analytical
and
scre
en d
ata$>
samp
les
fr®m
hol
es i
n line 1
4~<=
G®nt
inue
d
Hol
e N
®,
&Sa
mpl
e N©
*
3=99
3-10
0
4-4
8-3
Sam
ple
Inte
rval
(in
feet)
65,6
-73<
>4
73*4
~75o
S
58,o
-75o
O
98,0
-101
,0
Scr
een
Siz
e
4>14
mes
h (A
)-1
4*35
mes
h (B
)=1
50 m
esh
(D)
~35<
£150
con
©
(S)
=35*
150
tail
(F
)
(A)
(B)
(D)
W (F)
(A)
(B)
-35*
150
mes
h (C
)(D
)
(A)
(B)
(c)
(D)
yW
eigh
tP
er©
ent
5*8
6.4
17 <>
52,
368
»0
13o4
11 o3
30«3 7 0
837
o2 0*2
22*3
53*9
23 »6 2,3
14*1
73*5
10*2
An
aly
tica
l dat
a (i
n p
erce
nt)
P2°
5
26 08
O "7
O
& 1
o
26*5
16,9
21*5 2*
5
GaO
42
.6
32*8
43,8
28*7
51*1 1*
7
F 3o3
3o3
3*3
2,1 2,7
0,2
A12
°3U Oo0
20
0,00
3
0«0l
6
0,04
7
eU
0,02
20*
008
0,00
40,
012
0*00
2
0,01
6O
oOlO
0*00
80,
008
0,00
2 a0,
001
Oo0
02
0*00
50,
003
0*00
20,
046
I/ Weight p
erce
nt r
etai
ned
en s@reen«
2/ Bl
anks
ind
icat
e n®
analysis*
i/ w
aw e
quals
less t
han
Oo
Samp
les
94 t
hrough 100
are f
r@m Le
t 2546|
samp
les 3^4 a
re f
r®m Le
t


ILL
Table 31»—Tonnage computations* line Ik
HoleNo.
1 1
2
Depth Internal (in feet belowthe mxrfa®©}
38*0^©o85/ to,8-to^
teoWtf.W
Aliiminuiii-Phosphate toneCu* yds. per acre
U,Wo
Percent U
C.P*M*
ll^OO
Calci-um-Phosphate ZoneTons per
acre
P-l55o2/ 04^990P-2130 C-1920
^rcent BEL
51*7 75oOflul 73«2
Holes phos te*
and 8 intersected no aluminum phosphate or calcitim
Counts per minute computed from gamma-ray logs* See fig* 15. One sample of calcium-phosphate zone,, Bone Valley and Hawthorn
formations* 3/ P • pebble fraction (*lU mesh)| G » concentrate fraction
(-35*150 mesh). Lower part of calcium-phosphate zone,, Hawthorn formation.


Tabl«i 32—Analytical
and
screen d
ata
9 samples
frea
holes in l
ine
15
Hele
Ne
a&
Samp
le N
@0
1-1
2-2
3=5
4=6
5-7
Sample
Inte
rnal
(in
feet)
I6o9
~25o
9
4l.9
-45«
9
57o?
-5fo
9
64o8
-68o8
55o5
-66.
5
Scre
en Size
414 me
sh (A
)-14435 »®s
h (E
)=3
5fl5
0 me
sh (G
)=1
50 mes
h (D)
(A)
(K)
(B)
=35*150
«s»ns
(K)
-35*150
tail
(i
1)
(A)
(B)
(D)
(fi)
(F)
(A)
(B)
(D)
(a)
(F)
(A)
(&)
(D)
(f)
3/Weight
Perc
ent
Ool
5<>o
84.3
10.6
13o4
I6o4
11.9
53l8
20o? So6
41o3 3°3
26ol 9o4
12 oO
27»3
10,0
41.3 8.1
fo6
26«5 ":I
Anal
P2°5
i/ 4oO
<?*$ r*
R*
3io6
35o8
22.3
I6o3
34 »5
32*5
11,8
33o9
31.1
22 o5
30o5
^ Ga
O
loO
41.6
46o6
48 o4
3109
22.8
46©7
46.2
17.3
48.0
43o5
33ol
44.0
srti
eal data
(i
n percent)
F Oo3
3o6
3o9
3o9
2.5
1.3
3o8
3.7
1.0
3.8
3o4
2o7
3o5
A120
3U OoOi5
0.00
1
Oo02
60.018
0.026
Oo01
4
09016
0.015
0.00
2
0.015
Oo014
eU
0.00
4 a 3/
OoOO
i©oOo6
0.01
6Oo
OOf
OoOO
S
OoOO
l
Oo028
OoOlS
Oo01
20<>027
0.005
0.015
00012
O.Ol
fOo
OlS
0.00
2
0.01
70.
011
0.00
90.
016 9,
111
samp
les
are


146
Table 33*~~Tonnage computations,, line 15
HoleNo.
1 1
2 2
3 3
k k
5
6
Depth Internal (in feet belowthe surface)
21.0-21^5 2lu5-29*0
3$«Q-kO*Q lil.9-45.9
5it<,0"*56.5 56.5-59.9
60»0-6M 6U.8-68.8
55«5-66a5
Blank Hols
Aluminum-Phosphate zoneCu« yds* per acre
5,600
85 000
il^OOO
75 680
Percent tJ
CaPoMo
V
1100
600
1800
2000*
Oalcium^FhoaiTons per
acr@
phate Zon©Percent
Possible ealcium~ phosphate sone<» Sample not analyzed.
P-1300 */ G-liUO
P-1760 C3-280
p»920 C-9?0P-2160 G-2860
60<»3 69,0
n«hl$.k
71«0 7l*.l68.0 67.6
I/ Counts per minute computed from gamma-ray logs* See fig. 16« "2/ P s pebble fraction (*ll* mesh)| C m concentrate (-35*150 mesh


Table
34°aAnalyti©al a
nd se
re®s
data^,
samp
l®s
fr®m h®i
es i
n line
Hole H
e,&
Sample N
e.
la~19
2«al
*»
&> Jt
^?
3-16
5=20
Samp
leIn
tern
al
(in
feet)
5® oj^c 1 °5
50 o Q**5® o 4
35.5
-37.
4
% 39 -2-42 o4
Screen S
ise
4*14 mes
h (A)
=14*35 m»s
h (B)
=150
m»s
h (D)
=35*
2.50
GOR@ (S)
=35*150
tail (F
)
(A)
(B)
-35*150 m»sh (
C) (D)
(A)
(B)
(C)
(A)
(B)
(D)
(B)
(F)
I/
Wtig
ht
Ptrc
ent
7,4
601
2206
5o4
58 o5 3o8
50^7
39 o3 5.3
9«>3
70.5
14.7
10,4
18.3
5o3
60,8
Anal
ytic
al data
(i
n percent)
^205
24o4
32o2
18.3 7oO
26,7
14.0
2ol8
32.0
GftO
35*9
*t J O<=
26,5
10o3
39.7
21.1
41.4
47.3
F 2,8
3°8
2ol
Oo6
3.1
1.5
ill
3.6
AiaOj
I/
u 0.011
00©l6
0*015
00012
0,
002
0,01
3
OoOl?
0,017
eU
0001
30
0012
0.008
0.01
6OcOOl
0,017
0,014
0.003
0,01
5
0,010
Oo014
0,00
1
0,01
8 0,014
0,008
0,023
0,00
1
^/ We
ight
percent r
etained
en s
creen.
2/ Bl
anks
ind
icat
e ne
analysis.
All
samp
les
are
fr®m Let
2547

Table 35>«-~Tonnage computations, line 16
Hole No*
1 1 1
21 ———h$ $
Depth Internal (in feet below the surface)
78.0-82.0 $6.0-58.5 58.5-71.5 I/
Ii7»3-52<»it32.8-35*5Blank Hole36*5-39*2 39.2-42.U 2/
AluminuiJ^Phosphate ZoneCu. yds* per acre
65 UOO ii5 000
8S 160U9 320
U,320
Percent UC,P«M0v1100 900
moo900
1300
Calcima^Phos1Tons per acre
P-23UO 2/ C-1700
P-379 O-380
phate ZonePercent
BPL
53»U 70.5
58.5 70.3
Counts per minute computed from gamma«ray logs* See fig. 17» Lower part of calcium-phosphate zone - Hawthorn formation^ P • ebble fraction (^lij. mesh)| C » concentrate fraction
mesh).

Tabl
e 36-=Analytical a
nd s©r®«a d
ata
£, sa
mple
s from n®l
«s i
n line
H*le &
Sample N
$0
Sample
Weight
Analytical d
ata
(in
p@r@
@nt)
Oa©
u
2-12
mesh (
A)
mesh (
B)
mesh
OoO
©o
©
o©
Ool
4300
-52 o©
3
•15*
150
-15*
150
25.3
0.017
Oo©
2©
OoO
Ol
(A)
0.0
11
OoO
l1?
Oo014
OcC02
V
V
(B)
0*3
Io7
41
.510
0.7
10-9
3<>9
591© 20©
29.8


Tatel® 3
6~~Analytieal
and
s©r®
«n d
ata
9 samples
frtm h
©l«s
ia
lint
o,70
(w fl
o'
»3
S35*
150
tail
reta
ined
en
n®
All
@ampl«s
are
from
Let 25
47o
H vn O

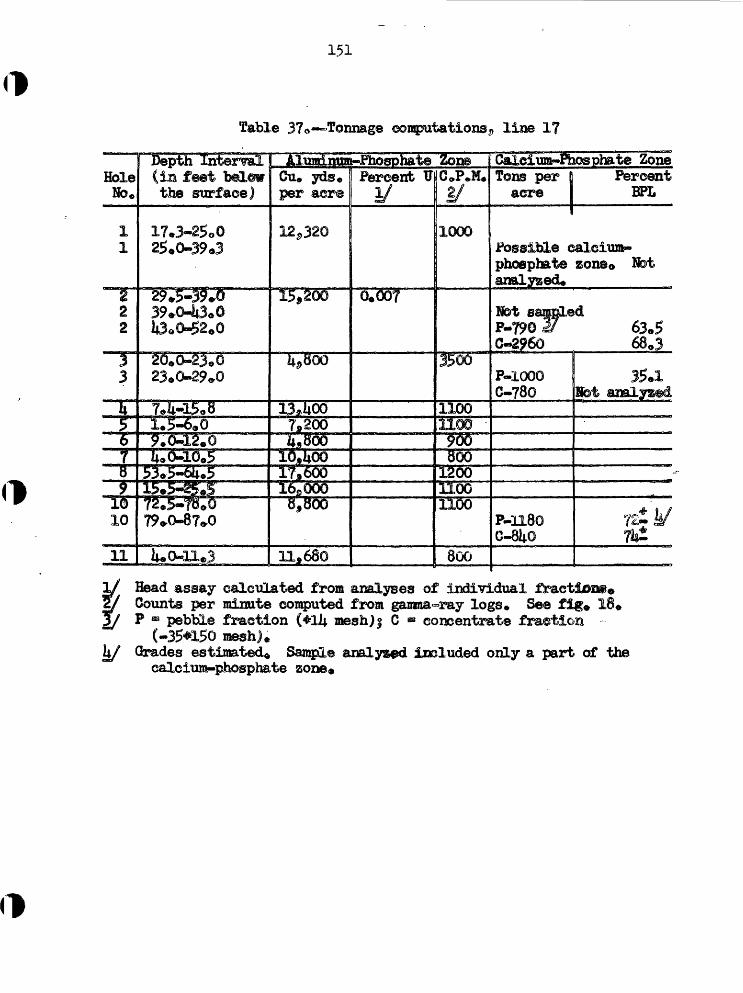
151
Table 37 computations,, line 17
HoleNo 0
1 1
2 22
5 3-*•6?8$
It) 10
11
Depth Internal (in £@©t fc@l©» the surface)
17*3-25«Q 25*0-39*3
29,5-3^039*04*3,0l|3oO-52.0
20.0-23,0 23,0-29*0
7»Wt5,81.5-6,09.0-12.0b, 0-10,5
53»5-Su5J> Wl mj atjpjll JW-
!>,:>"^e^7§«5-to»o 79*0-87*0
1^0-11*3
Alundnto^-Fhosphat® ZoneCu« ydsoper aere
125320
15^200
14^00
13^0079200^*SOO
lO^UOO17*60016C 000
8,800
11,680
Percent IT
0,007
CoP*M.g /
1000
3500
11002100 "900800
1200moo1100
800
Caleium-Fhosphate Zonetons per j Percent
acre | BPL
Possible calcium- phosphate zone* Hot analysed*
Hot sampledP-790 2T 63,5 C-2960 68<,3
P-1000 G-780
p-n8oG-8UO
35,1 Not aimlyz@d
12tW 7i£
Head assay calculated from analyses of individualCounts per minute computed from gamraa^ray logs. See fig, '.P s pebble fraction (*li± mesh)| C s concentrate fraction
(-35*150 mesh). Grades estimated* Sample analysed included only a part of
calcium-phosphate zone.the

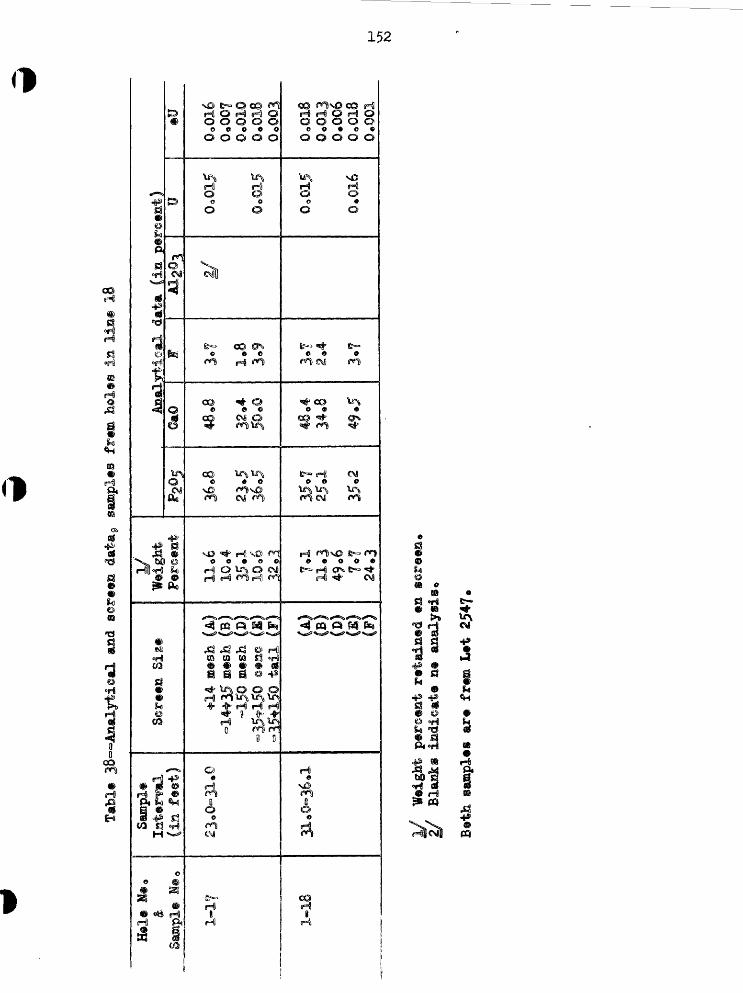
CM
100*0
€to°o°«<?5sC
=,/r%«'
€00° 0"0t
9°It
tn
ptzw


n15:
Table 39»-»Tonnage computations5 line 18
Hole No,
1 1
1
k
Depth Interval(in feet below
the surface) »
20*0-23.0 f , 23«0~31«Q ^/
38oJ>-55«0
Aluminum-Phosphate ZoneCua yds. per acre
U.,800
26^00
Percent UC if*
1300
1000
Calcium-Phospate 2©si©Tons per acre
P-2260 3/ C-2050 P-860 C-930
Percent BPL
if-
79^678.0 76.9
Counts per minute computed from gamma-ray logs. See fig, 19« Tapper part calcium=phosphate zone « Bone Valley f ormation0 P a pebble fraction (*lli mesh)| C « concentrate fraction (-3£ Lower part calcium-phosphate zone - Hawthorn formation*
fl
(1

154
LITERATURE CITED
Altschuler, Z. S 0 , and Cisney, E e A 0 , 1952, X-ray evidence of the nature of carbonate apatite, (abst.) Geol. Soc. America Bull., v. 63, no. 12, part 2.
Altschuler, Z. S 8 , and others, in preparation, U. S 8 Geol. Survey Bull.
BergendahL, M. H., in preparation, Stratigraphy of parts of DeSoto and Hardee Counties, Florida; U. S. Geol. Survey Bull. 1030-B.
Berman, Robert, 1953 > A mineralogic study of churn drill cuttings from a well through the Bone Valley formation, Hillsborough County, Florida: (abst.) Nuclear Science Abstracts, V. 7 5 no. l6A.
Brodkorb, P. 1955, The avifauna of the Bone Valley formation: Florida Geol. Survey Rept. of Invest. 14.
Carr, W. J., and Alverson, D. C., 1953* in Geologic Investigations of Radioactive deposits - Semi-annual progress report, June 1 to November 30, 1953: U. S. Geol. Survey TEI-390, U. S. Atomic Energy Comm., Tech. Inf. Service, Oak Ridge, Term.
Cooke, C. W., 1915, The age of the Ocala limestone: U. S. Geol. Survey Prof. Paper 95.
________, 1945, Geology of Florida: Florida Geol. Survey Bull. 29.
Cooke, C. ¥., and Mansfield, W. C., 193&, Suwannee limestone of Florida: (abst.) Geol. Soc. America. Proc. for 1935.
Cooke, C. ¥., and Mossom, D. S 8 , 1929, Geology of Florida: Florida Geol. Survey, 20th Ann. Rept.
Ball, W. He, and Harris, &«, D., 1892, Correlation papers: Neocene: U. S. Geolo Survey Bull. 84.
Fowler, E. D e , and others, 1927, Soil survey of Polk County, Florida: U. S. Dept. of Agriculture, Soil Survey Rept. 39.
Johnson, L. C 0 , 1888^ The structure of Florida: Am. Jour. Sci., ser. 3> v. 36.
King, P. B., 1951, The tectonics of middle North America: Middle North America east of the Cordilleran System. Princeton University Press. 203 P.
MacNeil, F. S., 1947* Correlation chart for the outcropping Tertiary formations of the eastern gulf region: U. S. Geol. Survey, Oil and Gas Invest. Prelim. Chart 29.


155
Mansfield^ W 0 C 0 , 1937 s Mollusks of the Tampa and Suwannee limestones of Florida? Florida Geol>-Survey Bull. 15.
Matson, G 0 C 0 , and Clapp, F* G ojl 1909, A preliminary report on the geology of Florida with special reference to the stratigraphy? Florida Geol. Survey, 2nd Ann 0 Rept.
Mossom, Do S 0 , 1925 5 A preliminary report on the limestone and marls of Floridas Florida Geolo Survey, 16th Ann, Rept.
Palache, G 0 , Beraan, H» 5 and Frondel, Do, 1951- The system of mineralogy of James Dwight Dana and Edward Salisburg Dana, Yale University5 1837-1&92 0 v 0 2, Halides, borates, carbonates, sulfates, phosphates, arsenates^ tungstates^ molybdates, etc., ?th. ed. revised. 1124 p. New Yorko John Wiley and Sons, Inc e
Simpson, G 0 G.,, 1929, The extinct land mammals of Florida? Florida Geol. Survey, 20th Ann 0 Repto
Simpson, G 0 G. 1930, Tertiary land mammals of Florida? Am 0 Mus. Nat. History Bull., v. 59, art. II.
Vernon, R. 0., 1951? Geology of Citrus and Levy Counties, Florida? Florida Geol 0 Survey Bull. 33.


![Asbestos: Geology, Mineralogy, Mining, and Uses27] USGS Asbestos Report 02-149.pdfAsbestos: Geology, Mineralogy, Mining, and Uses by Robert L. Virta1 Open-File Report 02-149 Prepared](https://static.fdocuments.net/doc/165x107/60778c28e72dc926ad0b0169/asbestos-geology-mineralogy-mining-and-27-usgs-asbestos-report-02-149pdf-asbestos.jpg)