
Geological Mapping of Remote Mountainous … · Geological Mapping of Remote Mountainous Regions...
48
Mitt, österr. geol. Ges. 77 1984 S. 115-149 11 Fig., 5 Tab., 15 PI. Vienna, December 1984 Geological Mapping of Remote Mountainous Regions Using Metric Camera Imagery Initial Experiences with Photogrammetric Space Images *) By Manfred F. BUCHROITHNER With 11 figures, 15 plates and 5 tables Abstract The applicability of Metric Camera space imagery for geological reconnaissance mapping and for more detailed studies up to a scale of 1 : 50 000 is demonstrated. Three mountainous regions of different geological structure in western Saudi Arabia, in the Afghan Hindu Kush and in the East Nepalese Himalaya are stereoscopicly analysed using colour-infrared photographs. Detailed examples are given. The author summarizes the advantages and drawbacks of Metric Camera imagery for geological mapping in remote areas. Resume L'applicabilite des images d'espaces faites par la Camera Metrique pour la carto- graphic geologique de reconnaissance et pour des recherches plus detailles jusque ä l'echelle 1 : 50000 est montree. A l'aide de photographies en coleurs infrarouges trois regions de montagne, differentes en structure geologique, en Arabie seoudite occidentale, ä I'Hindou Kouch en Afghanistan et ä I'Himalaya en Nepal d'Est sont evaluees stereoscopiquement. Des exemples detailles sont montres. Les avantages et les desavantages des photographies faites par la Camera Metrique pour des re- cherches geologiques dans des regions lointaines sont presentes. Zusammenfassung Die Verwendbarkeit von Weltraumbildern der Metrischen Kamera für geologische Erkundungskartierungen und detailliertere Untersuchungen bis zum Maßstab 1 : 50 000 wird aufgezeigt. Anhand von Farb-Infrarot-Photographien werden drei im geologischen Aufbau unterschiedliche Berggebiete im westlichen Saudi-Arabien, im afghanischen Hindukusch und im ostnepalesischen Himalaya stereoskopisch Author's address: Univ.-Doz. Dr. Manfred F. BUCHROITHNER, Institute for Image Processing and Computer Graphics, Graz Research Center, Wastiangasse 6, A-8010 Graz, Austria. *) Published within the scope of ESA Metric Camera Experiment "High Mountain Research in Southern Central Asia" and research project no. P 5668 of the Austrian Fonds zur Förderung der wissenschaftlichen Forschung (Austrian Science Foundation). 8*
Transcript of Geological Mapping of Remote Mountainous … · Geological Mapping of Remote Mountainous Regions...
Mitt, österr. geol. Ges. 77
1984 S. 115-149
11 Fig., 5 Tab., 15 PI. Vienna, December 1984
Geological Mapping of Remote Mountainous Regions Using Metric Camera Imagery
Initial Experiences with Photogrammetric Space Images *)
By Manfred F. BUCHROITHNER
With 11 figures, 15 plates and 5 tables
Abstract
The applicability of Metric Camera space imagery for geological reconnaissance mapping and for more detailed studies up to a scale of 1 : 50 000 is demonstrated. Three mountainous regions of different geological structure in western Saudi Arabia, in the Afghan Hindu Kush and in the East Nepalese Himalaya are stereoscopicly analysed using colour-infrared photographs. Detailed examples are given. The author summarizes the advantages and drawbacks of Metric Camera imagery for geological mapping in remote areas.
Resume
L'applicabilite des images d'espaces faites par la Camera Metrique pour la cartographic geologique de reconnaissance et pour des recherches plus detailles jusque ä l'echelle 1 : 50000 est montree. A l'aide de photographies en coleurs infrarouges trois regions de montagne, differentes en structure geologique, en Arabie seoudite occidentale, ä I'Hindou Kouch en Afghanistan et ä I'Himalaya en Nepal d'Est sont evaluees stereoscopiquement. Des exemples detailles sont montres. Les avantages et les desavantages des photographies faites par la Camera Metrique pour des recherches geologiques dans des regions lointaines sont presentes.
Zusammenfassung
Die Verwendbarkeit von Weltraumbildern der Metrischen Kamera für geologische Erkundungskartierungen und detailliertere Untersuchungen bis zum Maßstab 1 : 50 000 wird aufgezeigt. Anhand von Farb-Infrarot-Photographien werden drei im geologischen Aufbau unterschiedliche Berggebiete im westlichen Saudi-Arabien, im afghanischen Hindukusch und im ostnepalesischen Himalaya stereoskopisch
Author's address: Univ.-Doz. Dr. Manfred F. BUCHROITHNER, Institute for Image Processing and Computer Graphics, Graz Research Center, Wastiangasse 6, A-8010 Graz, Austria.
*) Published within the scope of ESA Metric Camera Experiment "High Mountain Research in Southern Central Asia" and research project no. P 5668 of the Austrian Fonds zur Förderung der wissenschaftlichen Forschung (Austrian Science Foundation).
8*
116 Manfred F. Buchroithner
ausgewertet und Detailbeispiele gebracht. Die Vor- und Nachteile von Aufnahmen der Metrischen Kamera für geologische Untersuchungen in entlegenen Gebieten werden dargelegt.
Contents
1. Introduction 116 1.1 General Remarks on the Metrie Camera Experiment 116 1.2 Mission Objectives of the Metrie Camera Experiment 117 1.3 Metrie Camera Imagery 118
2. Methodical Remarks 119 2.1 General Notes 119 2.2 Procedures of Interpretation 119
3. Saudi Arabia Scene 121 3.1 Image Characteristics 121 3.2 Geological Image Interpretation 121
4. Hindu Kush Scene 127 4.1 Image Characteristics 127 4.2 Geological Image Interpretation 127
5. Himalaya Scene 130 5.1 Image Characteristics 130 5.2 Geological Image Interpretation 132
6. Conclusion 140 7. Acknowledgements 146 8. References 146
1. Introduction
Since the beginning of 1984 a new type of space image data is available: geometrically well-defined high-resolution space photography. Despite the existence of operational tools like Landsat MSS and TM data a present trend of emphasizing the importance of photogrammatric space photography can be obviously noticed. This development shows its clear expression in the Metric Camera and the Large Format Camera (LFC) Experiment with its associated Attitude Reference System (ARS) designed by the U. S. National Aeronautic and Space Administration (NASA). The possibility of better photogrammetric data collection and, hence, more effective topographic map production over large areas seems to be one of the major impulses for this new step in earth-oriented remote sensing.
1.1 General Remarks on the Metric Camera Experiment
The first Spacelab mission of the European Space Agency (ESA) was launched on NASA's Space Shuttle flight No. 9 from Cape Canaveral in the USA on November 28, 1983, the Shuttle landing in Dryden, California, on December 7, 1983. This manned mission was jointly conducted by ESA providing the Spacelab and NASA offering the Shuttle flight. The mission carried 37 major experiments, one of them (no. 33) being the Photogrammetric (Metric) Camera Experiment (KONECNY &
Geological Mapping of Remote Mountainous Regions 117
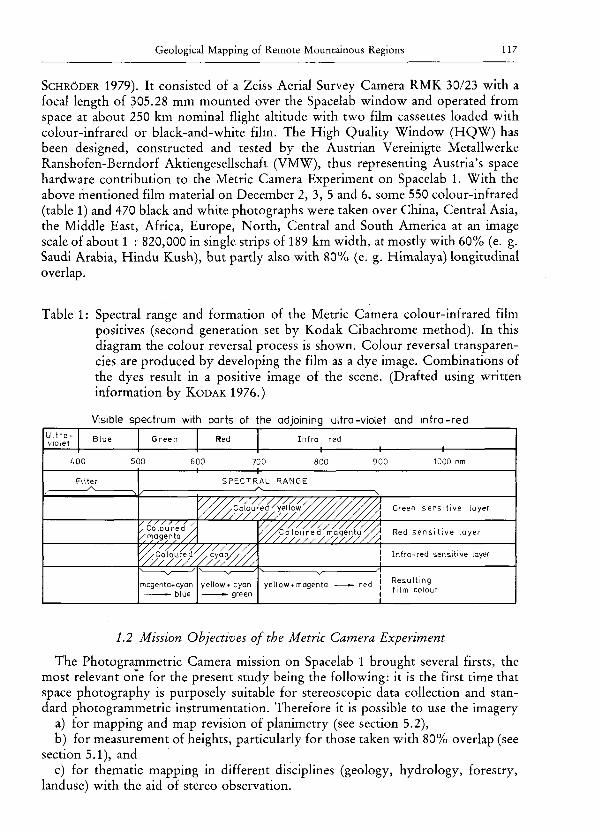
SCHRÖDER 1979). It consisted of a Zeiss Aerial Survey Camera RMK 30/23 with a focal length of 305.28 mm mounted over the Spacelab window and operated from space at about 250 km nominal flight altitude with two film cassettes loaded with colour-infrared or black-and-white film. The High Quality Window (HQW) has been designed, constructed and tested by the Austrian Vereinigte Metallwerke Ranshofen-Berndorf Aktiengesellschaft (VMW), thus representing Austria's space hardware contribution to the Metric Camera Experiment on Spacelab 1. With the above mentioned film material on December 2, 3, 5 and 6, some 550 colour-infrared (table 1) and 470 black and white photographs were taken over China, Central Asia, the Middle East, Africa, Europe, North, Central and South America at an image scale of about 1 : 820,000 in single strips of 189 km width, at mostly with 60% (e. g. Saudi Arabia, Hindu Kush), but partly also with 80% (e. g. Himalaya) longitudinal overlap.
Table 1: Spectral range and formation of the Metric Camera colour-infrared film positives (second generation set by Kodak Cibachrome method). In this diagram the colour reversal process is shown. Colour reversal transparencies are produced by developing the film as a dye image. Combinations of the dyes result in a positive image of the scene. (Drafted using written information by KODAK 1976.)
Visible spectrum with parts of the adjoining ultra-violet and infra-red Ult vio
/
r a -et Blue
£00
Fitter
Green Red Infra - red
500 600 700 800 900
\ SPECTRAL RANGE
/ \
, Coloured / / m a g e n t a / /
/ / / / ///////'////////////A / / / / ^ C o l o u r e d 'yel low ///////////
/ / C o l o u r e d / , c y a n / / / /
magenta+cyan — blue
yellow + cyan
9
/ / / / / / / / / / / / / / / / / / / / C o l o u r e d magenta//J ////////////////^
yellow + magenta — red
1000 nm
Green sens i t ive layer
Red sens! t i ve layer
Infra-red sensitive layer
Resulting f i lm colour
1.2 Mission Objectives of the Metric Camera Experiment
The Photogrammetric Camera mission on Spacelab 1 brought several firsts, the most relevant one for the present study being the following: it is the first time that space photography is purposely suitable for stereoscopic data collection and standard photogrammetric instrumentation. Therefore it is possible to use the imagery
a) for mapping and map revision of planimetry (see section 5.2), b) for measurement of heights, particularly for those taken with 80% overlap (see
section 5.1), and c) for thematic mapping in different disciplines (geology, hydrology, forestry,
landuse) with the aid of stereo observation.
118 Manfred F. Buchroithner
On Spacelab 1 within 4 operating hours, 11 million km2 of the earth's surface were photographed, 70% of which were suitable for mapping. This amounts to 5% of the land surface of the earth in a single experimental mission.
1.3 Metric Camera Imagery
For the Spacelab 1 mission the Shuttle was launched with a 57° inclination, providing photography of areas up to 58° northern and southern latitude (KONEC-
Table 2: Specification of the STS 9/Spacelab ESA Metric Camera Experiment (after an ESA-ESRIN-Earthnet Programme Office Publication).
Mission/Parameter: Launching: Landing: Altitude: Inclination: Velocity: Scale of Image: Ground Coverage
of one image: Image motion: Film:
Camera: Type: Lens: Calibrated Focal
Length: Max. Distortion: Resolution: Film Flattening: Shutter: Exposure: F/Stops: Exposure Frequency: Image Format: Film Width: Film Length:
Dimensions: Camera: Magazine:
Mass: Camera: Magazine: Field of View:
28 November, 1983 8 December, 1983 240-257 km 57° 7.7 km/sec about 1 : 820 000
approx. 189X189 km2
at /soo sec exposure time 18 m (= 16 m on the ground) KODAK Double-X Aerographic film 2405 (B/W) KODAK Aerochrome Infrared Film 2443 (Colour)
modified ZEISS RMK A 30/23 TOPAR A 1 with 7 lens elements
305.128 mm 6 m (measured) 39 line pairs/mm A WAR on AVIPHOT Pan 30 film by blower motor incorporated in the camera body Aerotop rotating disk shutter (between the lens shutter) /250 to Viooo sec in 31 steps 5.6 to 11.0 in 31 steps 4 to 6 sec and 8 to 12 sec 23 X 23 cm2
24 cm 150 m = 550 image frames
46 X 40 X 52 cm3
32 X 23 X 47 cm3
54.0 kg 24.5 kg (with film) diagonal 56°, across 41.2°
Geological Mapping of Remote Mountainous Regions 119
NY & SCHRÖDER 1979). However, the late time of launch, combined with the launch window of 16:00 h GMT at Cape Canaveral resulted in solar illumination at all photographed areas that was never more than 30° at the beginning of the mission and 10° at the end of the mission. This meant that the full scene exposures of /IOOO sec. had to be prolonged to /soo or Vim sec. resulting in image motions of up to 14 m or 28 m during the exposures. Furthermore, the low sun angle reduced image contrast (depending, of course, on relief and surface cover). Because of these unfavourable conditions, NASA agreed to refly the mission with the originally scheduled 3 film cassettes on the NASA Earth Observation Mission 1 (EOM-1), to be launched on June 12, 1985 (KONECNY 1984). Table 2 shows the Spacelab 1 mission performance and Photogrammetric Camera design data.
The first generation diapositives reserved for the ESA principal investigators were produced at the Deutsche Forschungs- und Versuchsanstalt für Luft- und Raumfahrt (DFVLR) at Oberpfaffenhofen. The black-and-white film was developed at DFVLR only 3 days after the landing of the Shuttle, and the colour-infrared film was developed at the Institute Geographique Nationale (IGN) at Creil 4 days after the landing (Table 2). The photographs treated in the present studies were submitted to the author together with over hundred offical Metric Camera experiments all over the world within the course of June 1984. This means a delay in data dissemination that is far beyond the originally planned "some weeks after the mission" (cf. KONECNY, REYNOLDS & SCHRÖDER 1982); a fact that should change for further missions due to the requirements of fast information acquisition in certain fields. Some of the early results for the geological applicability of Metric Camera data shall be given in this paper.
2. Methodical Remarks
2.1 General Notes
The studies presented this paper were carried out within the ESA-accepted research project "High Mountain Research in Southern Central Asia (HMR in SCA). Experiment for the Metric Camera Experiment in the First Spacelab Payload (Earth-Oriented Mission). STS 9/Spacelab ESA. 28. November-8. December 1983" (except the Saudi Arabia scene). Principal Investigator of the above mentioned ESA Project is R. Kostka, Technical University of Graz.
Using imagery from three regions with completely different morphological, geological and cultural features, the applicability of photogrammetric camera images of mountainous areas for geological mapping was studied. This resulted in some initial reference data for forthcoming photogrammetric remote sensing images, such as the U.S.-initiated Large Format Camera (cf. KONECNY, REYNOLDS & SCHRÖDER
1982).
2.2 Procedures of Interpretation
The geological interpretation of the 23 cm X 23 cm colour-infrared film positives from the Hindu Kush area and the Himalaya was carried out on a light table by means of a Wild ST4 mirror stereoscope using l x , 3x and 8X binoculars. These magnifications correspond to the scales 1 : 821 700, 1 : 273 900 and 1 : 102 700
120 Manfred F. Buchroithner
respectively. Both scenes were evaluated in a 1 : 1 mode on a transparent overlay, except the various enlarged subscenes (fig. 2, 3, 8). Those were interpreted in the scales given in the respective figure captions. It is logical that for a relevant geological interpretation the three magnifications used had to be applied in an alternate, interactive way. As already mentioned before, except the Himalaya scene with 80% overlap, the other two scenes had 60% overlap in flight direction. Nevertheless small portions of the Saudi Arabia and Himalaya imagery were also analysed in areas where no stereoscopic effect was available. These monoscopic photo interpretations were admissible in areas with almost no relief, where one could easily extrapolate from the respective stereomodels (that is the coastal plains of the Red Sea in the Saudi Arabia scene and the Ganges plains in the Himalaya scene). In the first case, this value amounted to 40% of the area of a whole image frame (a big portion of it being occupied by sea) and to 20% of the southernmost Himalaya scene.
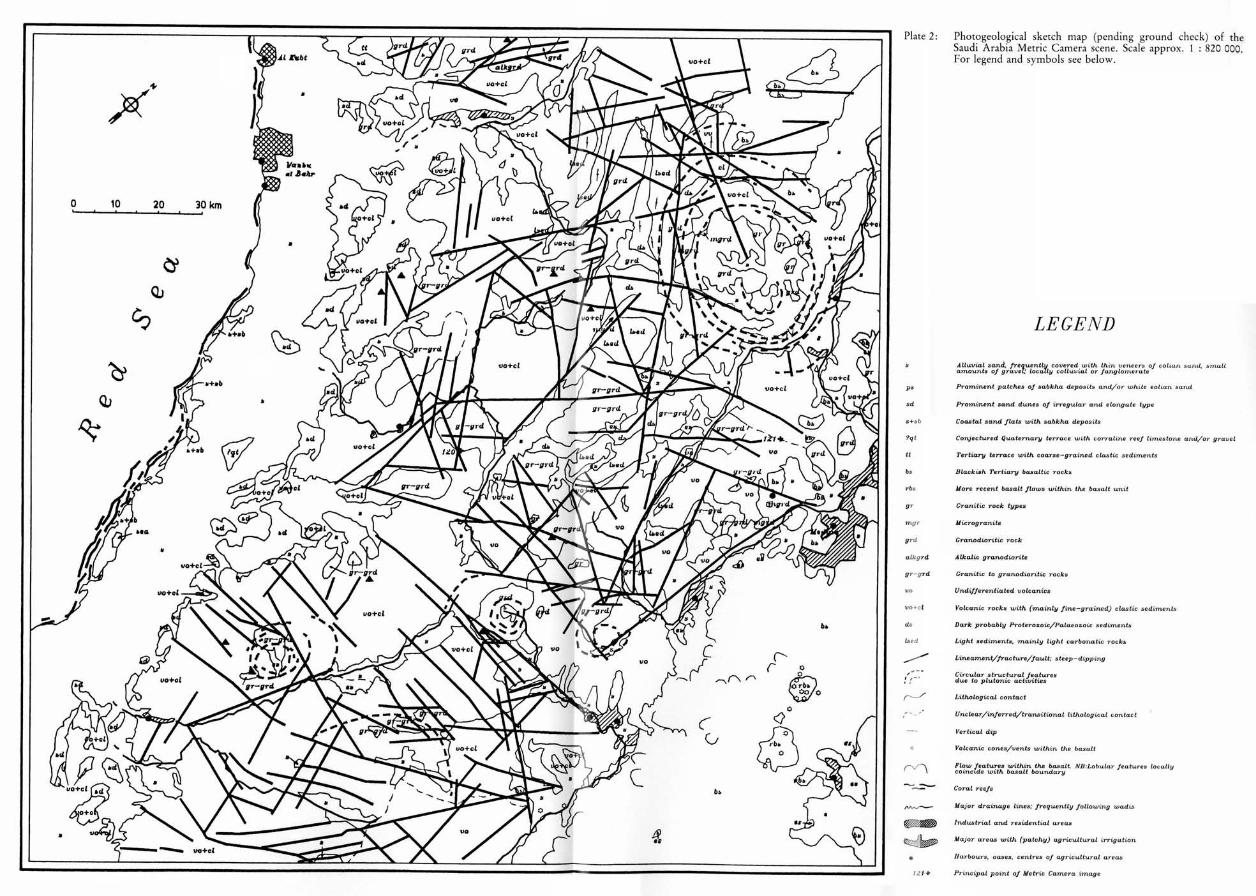
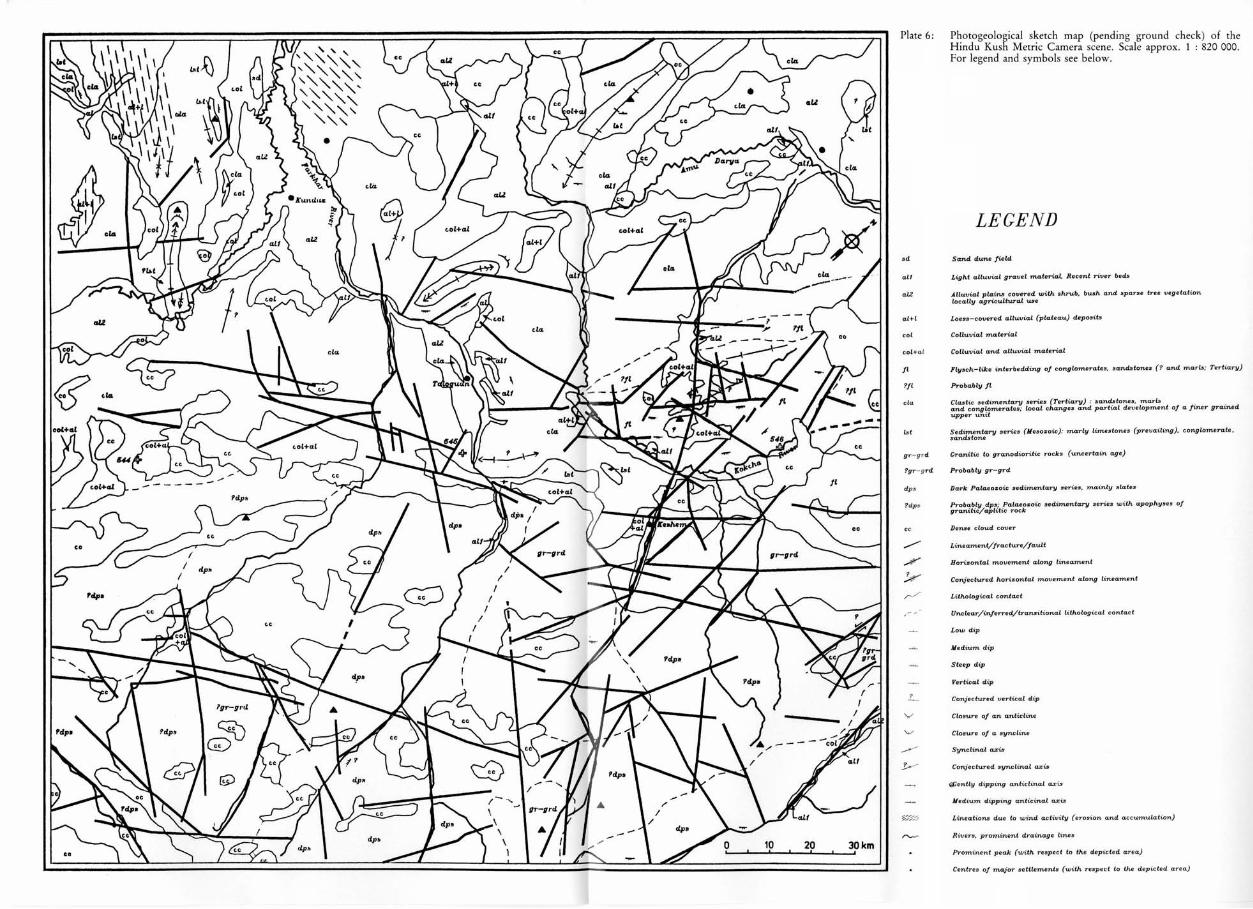
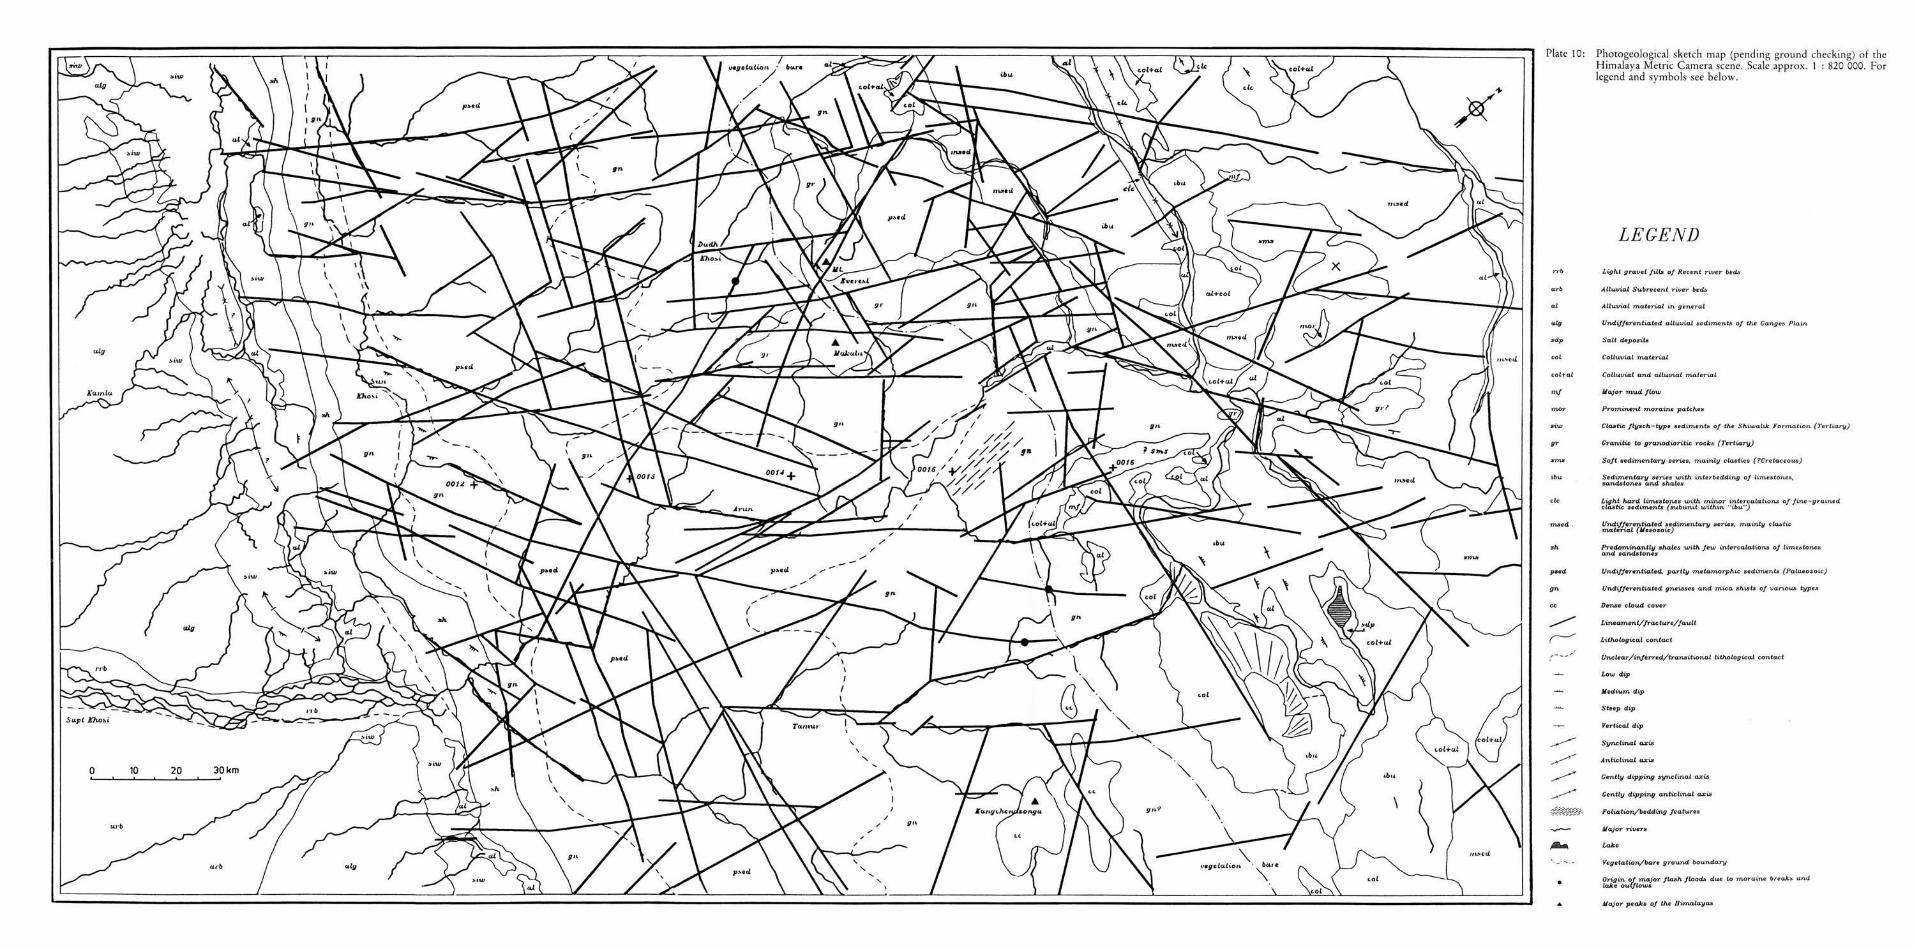
The areas shown in the tentative geological interpretation sketch maps (plates 2, 6, 10) of the various scenes are
21 350 km2 in Saudi Arabia, 35 570 km2 in the Hindu Kush area, and 62 630 km2 in the Chinese-Nepalese Himalayas. The Saudi Arabia stereo-image pair was analysed directly at the graphic working
station of the Institute for Image Processing and Computer Graphics of the Graz Research Center at a scale of approx. 1 : 820 000. Photographs and mirror stereoscope were mounted on a Summagrid digitizing light table. The linear interpretation elements and border lines of two-dimensional surface features were, instead of using a pencil, traced with a cursor. The resulting drawing could be visualized and checked on a Tektronix 4014 graphic screen, using the subsystems MDS, IDAD, and MAPOUT of the DESBOD software package, all developed at the above mentioned institute (RANZINGER, KAINZ & LEBERL 1981; KAINZ & RANZINGER 1983; BUCHROITH
NER 1984; HÜTTER 1984; KAINZ, RANZINGER & HÜTTER 1984; BUCHROITNER in
preparation). The result of this "digital interpretation" was then plotted on a Benson 1212 3-colour drum plotter, offering the opportunity to select almost any desired scale within a certain range.
The drawing of the profile line of the north-south cross section through the Himalayas (plate 11) was carried out on a Kern DSR-1 analytical stereo plotting system using the CRISP software package developed at the Institute for Image Processing and Computer Graphics of the Graz Research Center (FUCHS & LEBERL
1984). The same hard- and software facilities were also, besides the conventional method of using a Rost Type 644 planimeter, used for the interpretation and computation of the 1 : 50 000 erosion study in the upper Solu Khumbu area, Nepal (cf. fig. 7-9, plates 13 and 14, tab. 3; BUCHROITHNER 1984, BUCHROITHNER, in prep.).
In comparison with the interpretation of multispectral space data, Metric Camera imagery offers the advantage of using well-established and better known methods of "conventional" black-and-white and colour-infrared photo interpretation respectively.
Apart from the major terrain features, such as prominent peaks and major drainage lines/rivers, lake/sea shores, vegetation boundaries and settlements, the
Geological Mapping of Remote Mountainous Regions 121
major linear structural features (lineaments/faults/fractures) and two-dimensional surface features (photogeological units) were included into the geological sketch maps. For these interpretations, only major geological guide lines or in-depth data from comparatively small areas (say some 30 X 30 km2) were known. Intentionally, almost no detailed information on larger portions of the studied scenes was used to demonstrate to what degree of soundness and detail a first geological reconnaissance mapping can be achieved with only a small amount of collateral data in a comparatively short period of time. The esteemed reader and expert on the respective regions is invited to evaluate the validity and accuracy of the space photo mapping presented in this paper.
Knowledge from earlier trips passing through parts of the Hindu Kush and Himalaya region depicted on the Metric Camera scenes were quite beneficial for the interpretation. Further, a field study in an area few hundred km NW of the Medina scene, some 15 years ago, yieled a general understanding of this type of landscape.
3. Saudi Arabia Scene
3.1 Image Characteristics
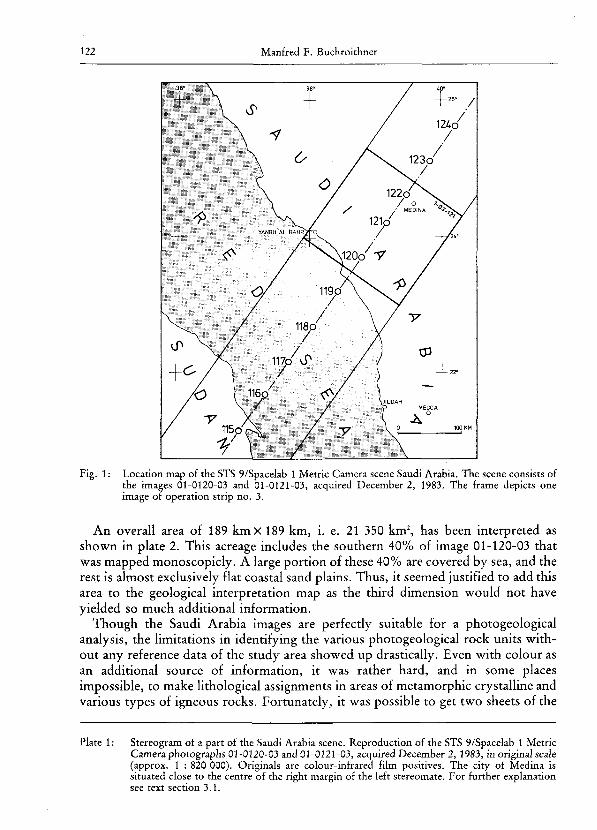
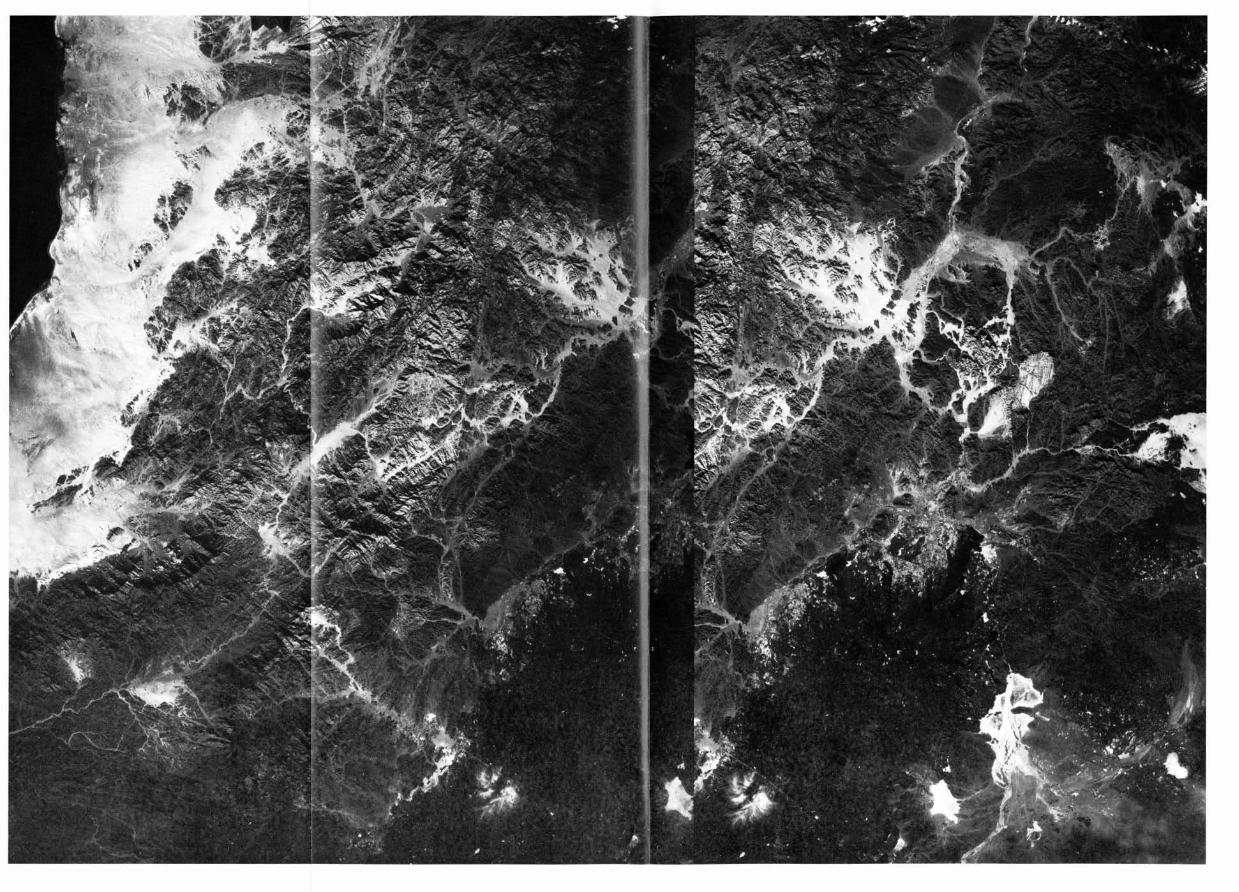
The Metric Camera image stereopair available from Saudi Arabia covers a portion of the Hejaz, the region between the city of Medina (Al Madinah) and the Red Sea (fig. 1, plate 1). It consists of the images 01-0120-03 and 01-0121-03, the first figure indicating the Spacelab mission, the second the number of the photograph within an operation strip (i. e. flight line) and the third one the operation strip number. The data were acquired on December 2, 1983, at 06-28-41 and 06-28-50 GTM, with a forward overlap of 60%.
The depicted area lies within the range of the opening rift valley of the Red Sea. This is a region of high interest for geologists, providing different types of basement, igneous, volcanic and sedimentary rocks, besides an interesting pattern of faulting tectonics and ring structures.
The Saudi Arabia scene shows the highest quality of the three scenes studied. It exhibits neither cloud cover (save for a 4 X 10 km2 and a 5 X 7 km2 thin cirrus-type patch) nor snow and contains practically no natural vegetation, the artificially irrigated fields representing a negligible percentage of the whole area. Relief and, therefore, shadows are subdued in comparison with the other two regions treated in this paper. Thus, the Saudi Arabia imagery provides ideal conditions for structural and lithological photogeological mapping.
3.2 Geological Image Interpretation
Three major surface types dominate the scene (plate 1 and 2): a portion of the Red Sea, the Red Sea coastal plains, and the mountains formed by the western margin of the Arabian Shield (cf. CHAPMAN 1978 a, 1978 b, BAYER 1984), reaching an altitude up to 2404 m in that region. A fourth prominent surface class, extensive lava flows that show in deep black hues, may be separated within the Arabian Shield. The above-mentioned (section 3.1) lineaments and ring structures form other eyecatching elements.
122 Manfred F. Buchroithner
Fig. 1: Location map of the STS 9/Spacelab 1 Metrie Camera scene Saudi Arabia. The scene consists of the images 01-0120-03 and 01-0121-03, acquired December 2, 1983. The frame depicts one image or operation strip no. 3.
An overall area of 189 kmX 189 km, i. e. 21 350 km2, has been interpreted as shown in plate 2. This acreage includes the southern 40% of image 01-120-03 that was mapped monoscopicly. A large portion of these 40% are covered by sea, and the rest is almost exclusively flat coastal sand plains. Thus, it seemed justified to add this area to the geological interpretation map as the third dimension would not have yielded so much additional information.
Though the Saudi Arabia images are perfectly suitable for a photogeological analysis, the limitations in identifying the various photogeological rock units without any reference data of the study area showed up drastically. Even with colour as an additional source of information, it was rather hard, and in some places impossible, to make lithological assignments in areas of metamorphic crystalline and various types of igneous rocks. Fortunately, it was possible to get two sheets of the
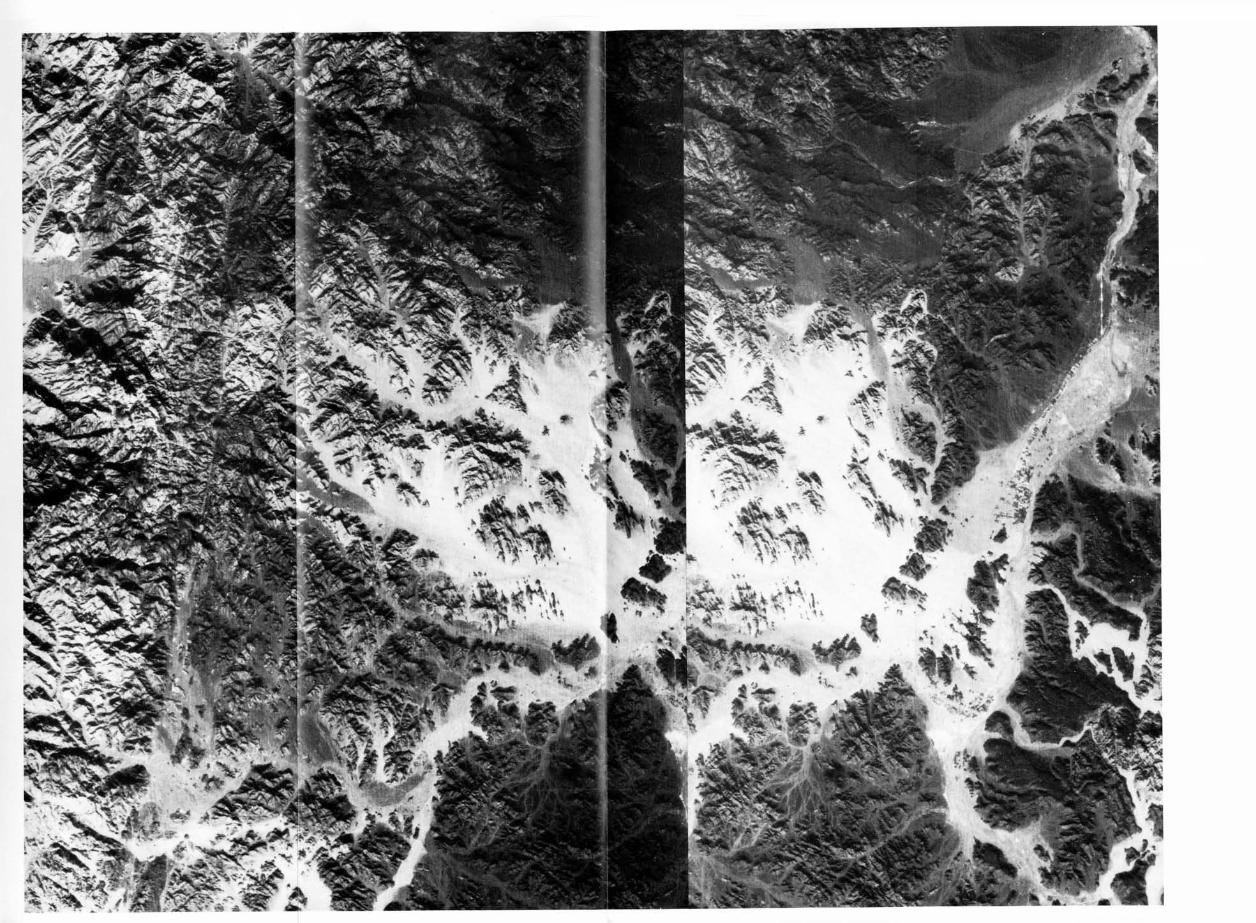
Plate 1: Stereogram of a part of the Saudi Arabia scene. Reproduction of the STS 9/Spacelab 1 Metric Camera photographs 01-0120-03 and 01-0121-03, acquired December 2, 1983, in original scale (approx. 1 : 820 000). Originals are colour-infrared film positives. The city of Medina is situated close to the centre of the right margin of the left stereomate. For further explanation see text section 3.1.
Geological Mapping of Remote Mountainous Regions 123
geological map 1 : 250,000 of the Kingdom of Saudi Arabia, which cover a part of the interpreted area (PELLATON 1979, 1981). H. HÖTZL and H.-J. BAYER (University of Karlsruhe) who provided these maps which can only be obtained in Saudi Arabia. Their courtesy is highly appreciated.
The Red Sea shore over long distances exhibits coral reefs, locally interrupted by major tidal channels. Close to the sea, there are spots with white salt crusts, or sabkha deposits, or mixtures of light coral sands and salt precipitates. In some places the coastal plains seem to carry remnants of elevated older Quaternary surfaces, probably consisting of either gravel or corraline rocks (cf. plate 2).
Dispersely distributed over the coastal plains, one finds fields of prominent eolian sand deposits. These fields become more frequent towards the margin of the Arabian Shield and are quite abundant in front of its foothills (windward side, see below). Some minor dune fields are also evident in wider wadis inside the mountainous terrain. Most of these dunes - especially those on the coastal plains - belong to the parallel wavy or crescentic, the parabolic, the stringers and, to a lesser extent, to the star or radial type of the five major types of eolian sand deposits established by MCKEEN, BREED & HARRIS 1973 and MCKEEN & BREED 1974 respectively. They are obviously caused by winds predominantly blowing from W and WSW, thus reflecting the conditions in December 1983. Multitemporal studies, perhaps by means of Landsat data, could prove whether these sand fields are stable or shifting. For detailed investigations concerning shape and intra-dune distances, however, the high spatial resolution and stereoscopic coverage of the Metric Camera imagery is far superior to Landsat MSS as well as Thematic Mapper data (cf. section 6.). The pronounced linear transverse dunes in front of the mountains show maximum lengths of some 8 to 10 km. Height measurements of these prominent dunes by means of a Kern DSR-1 analytical plotter yielded maximum values of some 80 m (mean of several measurements). The asymmetric profile is clearly visible, but the cross-sections of small dunes of whatever shape can be defined, as long as their height reaches a certain extent (say some 25 m) when interpreted at approx. 1 : 50 000 magnification.
An intensely dissected and eroded scarp (cf. CHAPMAN 1978 b) forms the southwestern periphery of the Arabian Shield mountains. These mountains mainly consist of Precambrian to Palaeozoic rocks (CHAPMAN 1979 a, BAYER 1984). Upper Pro-terozoic (PELLATON 1979, 1981) volcanic rock material predominates. These dark series contain zones of prevailing intercalations of light-grey rocks. The latter should be mafic dikes and fine-grained epiclastic sediments. They display clearly visible sedimentary contacts (facial interfingering). They are wedged (± vertical dip) along a NW-SE trending major lineament (graben, cf. below). To the SW of this feature, the above mentioned material shows a minimum thickness of 3-4.5 km (plate 2).
Granitic to granodioritic rocks also occur. They are dealt with in connection with granitic intrusion features further below.
Tertiary volcanism (CHAPMAN 1978 a, PELLATON 1981), due to the plate tectonic activities in the reach of the Red Sea rift system, is represented by an obviously extensive lava field SE of Medina. Locally, flow structures in the range of tens of meters can still be descerned in the Metric Camera stereomodel. This effusive series also occurs in isolated caprocks (and fills of ancient wadis?) farther to the NW of the
124 Manfred F. Buchroithner
continuous lava cover. Obviously it represents an equivalent to the Harrah Basalt farther in the SE (cf. NEBERT 1969). The young age of the basaltic effusives can be easily inferred from the "overflow" over the old basement, their "fresh" blackish hue and their still well-preserved flow features on the surface. Volcanic vents/cones as well as small isolated patches of saline playa deposits can be found on and at the margin of the basaltic rock material.
Two major sets of lineaments can be separated. The most eye-catching one of these linear features is a major "fissure" trending NW-SE, ± parallel to the Red Sea axis, which cuts through most of the scene. Locally, this fissure widens to a graben-like structure up to 3.3 km in width (see Sa'Adin Graben, PELLATON 1981). This feature (and its less prominent perpendicular complementary lineament set) perfectly fits into the supra-regional tectonic pattern of Post-Triassic fractures along the Red Sea (FURON 1968). The prevailing lineaments - which obviously are the surface expression of faults, run ± E-W and ± N-S. A conjugate pair strikes ± NW-SE and ± NE-SW, thus forming faults trending parallel and transverse to the axis of the Red Sea (plate 2). It may be noticeable that it is not the latter pair of faults but the E-W trending one which shows the better expression on the surface. The direction of wadis (and other drainage lines) is largely controlled by these two sets of comparatively very young faults (relative to the age of the rocks, cf. NEBERT 1969).
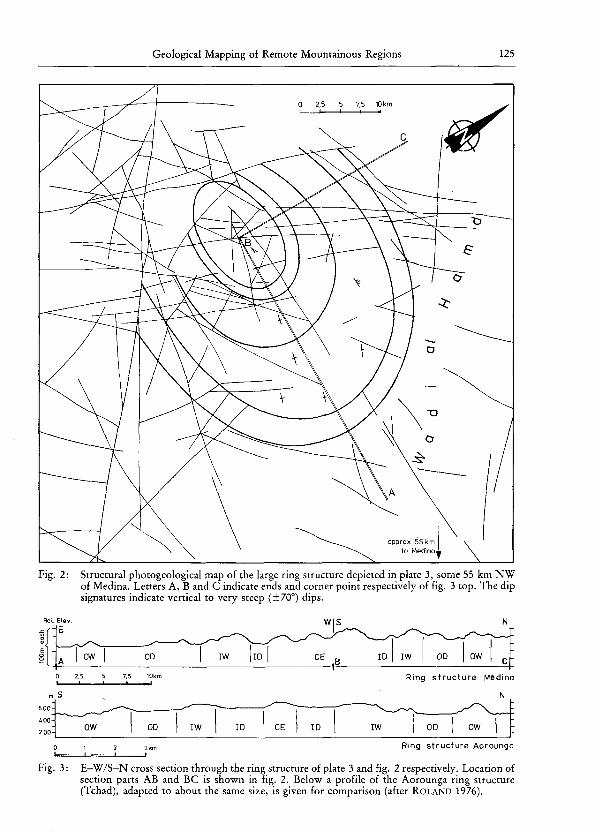
One of the most eye-catching elements of the whole Saudi Arabia scene is the large ring structure in the N of the stereomodel (plate 1-3, fig. 2). Apart from its asymmetry in morphological expression, it is nearly a textbook example and correlates almost perfectly to the structural elements of the Aorounga ring structure in the Borkou area of the southern Sahara (Tchad). In particular, the "inner and outer sand-filled ring ditches", which have been described from Aorounga by ROLAND 1974 and 1976, are easily identifiable in the eastern portion of the structure. The whole feature shows an elliptic shape and a diameter of some 35 to 55 km, with its long axis trending ± E-W. For comparison, the Aorounga structure only has a radius of some 8 km, though it displays a rather perfect circular shape. The better discernability in the E might be related to a lower relief and fluviatile erosion in the ring ditches, whereas the western part is formed by the backbone of a mountain chain (plate 1 and 3).
Farther to the W-WSW of the stereomodel, a few more ring structures and circular features can be seen (plate 2). Their diameters reach some 15 km, thus being more or less of the size of the Aorounga structure. These rings, however, are not as clearly expressed as the large one mentioned above.
It is evident that the ring structures and the lava flows in the Saudi Arabia scene have a genetic relation to the rifting mecanism of the Red Sea. ROLAND 1976 mentions exactly 20 different geological phenomena which might cause circular features. Ring structures of the Aorounga type and that one described in the present paper, however, can be best explained by granite diapirism (cf. SORGENFREI 1971). Alkalic granite intrusion plugs of circular or subcircular shape are known from the environment of the whole East African-Arabian rift system. PELLATON 1981, based
Plate 3: Stereogram of the large ring structure of the Saudi Arabia scene. Enlargement of plate 1 to 1 : 250 000. Location see plate 1 and 2 as well as fig. 1 and 2.
Geological Mapping of Remote Mountainous Regions 125
0 2,5 5 7,5 10km
of
^
Fig. 2: Structural photogeological map of the large ring structure depicted in plate 3, some 55 km NW of Medina. Letters A, B and C indicate ends and corner point respectively of fig. 3 top. The dip signatures indicate vertical to very steep (±70°) dips.
Ring structure Aorounga
Fig. 3: E—W/S—N cross section through the ring structure of plate 3 and fig. 2 respectively. Location of section parts AB and BC is shown in fig. 2. Below a profile of the Aorounga ring structure (Tchad), adapted to about the same size, is given for comparison (after ROLAND 1976).
126 Manfred F. Buchroithner
on field mapping, named the feature W of Medina "Jabal 'Adamar Batholith", formed by "alkalic to calc-alkalic granitoid". This large ring structure may count as one more classical example for granite diapirism.
Several major and minor lineaments cut the ring structures (plate 1-3; fig. 2). These non-radial linear faults probably represent rejuvenated old planes of in-homogeneity. Based only on space image analysis, it is not so easy to make genetic statements in this respect, though slight vertical as well as horizontal movements along the lineaments before and after the intrusion seem to be rather likely.
As far as major lineaments are concerned, evidence for vertical movements along parallel trending faults is given in the central and north-western portion of the scene. This may lead to the concept of a horst-graben structure similar to that one described by NEBERT 1969 in a region some 100 km to the SE (cf. plate 2).
Presently, the U.S. Geological Survey and the Deputy Ministry for Mineral Resources in Saudi Arabia are carrying out a cooperative program that should lead to a geological mapping at 1 : 250 000 scale of the whole Saudi Arabian territory by means of Landsat MSS data. Ground control for the project was established by the USGS personnel using a helicopter and a Geoceiver (DOYLE 1984). None of the first results achieved within this project were available to the author. Although no resources were available to support field checking, from the geometrical point of view the present photogeological mapping (plate 2) should be more accurate than all previous geological reconnaissance mappings (including the one just mentioned) of that region carried out using either Landsat data or any other space imagery. The study was conducted very efficently demonstrating methodology that has considerable potential for a sound geological mapping when completed with ground reference data from integrated field work.
In 1969 H. E. C. van der MEER MOHR made a geological interpretation of a nearly vertical Gemini IV photograph acquired in 1965 of a part of the Hejaz area centered around the city of Medina with a scale of 1 : 500 000 (cf. also van der MEER MOHR in MEKEL 1978). He points out that, for this Gemini image, the amount of visible detail can only be appreciated when the photograph is compared with the geological map (U. S. Geological Survey 1963). Such a comparison, according to van der MEER MOHR, shows that most of the geological details of the map can be identified on the image, and that in some places photo evidence strongly suggests that the existing map could be revised. As to the topographical detail, the photograph definitely compares favourably with the map and the advantages of synoptic terrain photography are demonstrated dramatically. Naturally, a comparison of the Metric Camera space imagery and the Gemini photograph was of high interest; not surprisingly the new photogrammetric space imagery was far superior to these hand-held photographs in all respects.
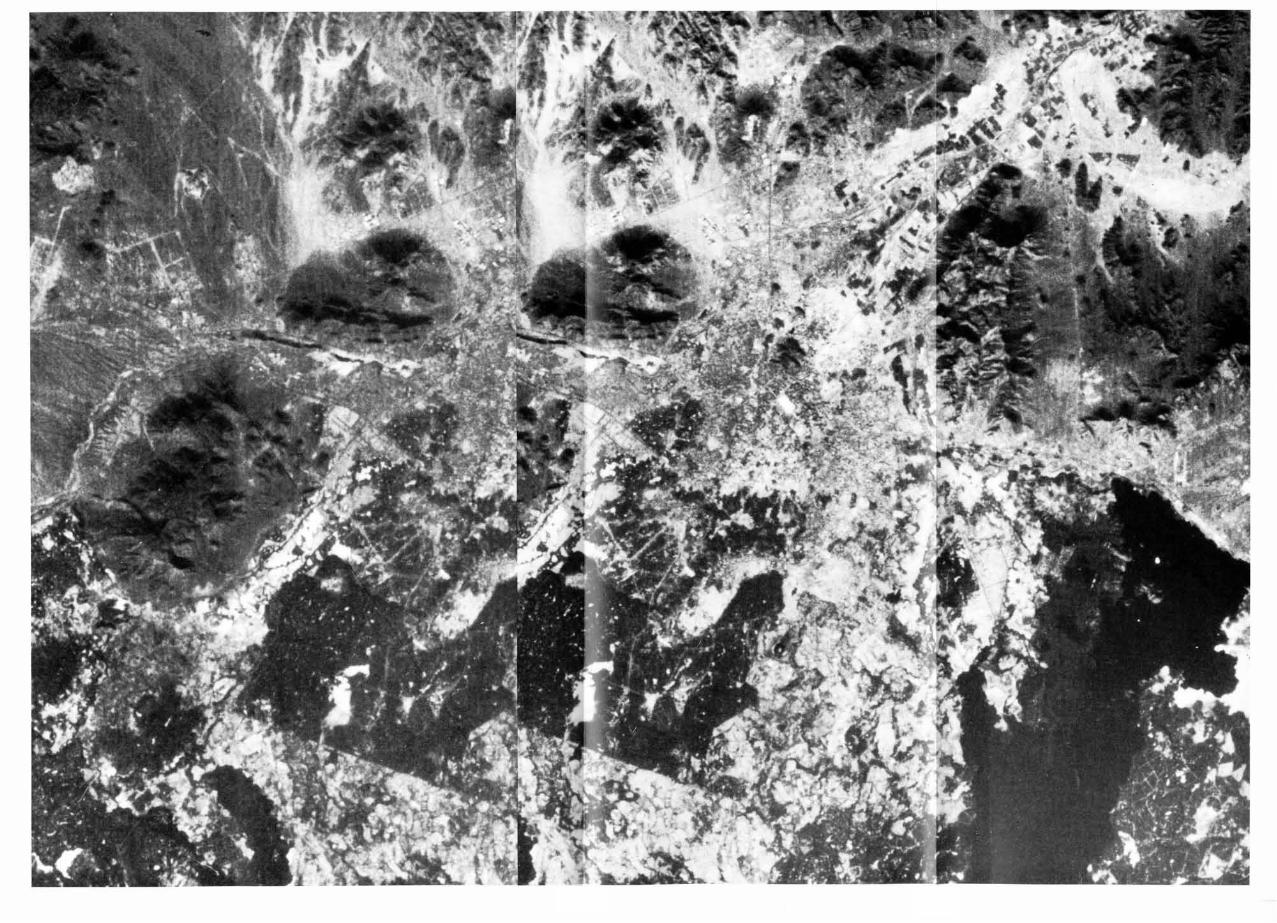
Plate 4: Stereogram of the city of Medina (Al Madinah) and surroundings. Enlargement of a part of plate 1 to 1 : 100 000. Location see fig. 1 and plate 1 and 2. Strong photographic magnification, printing and the loss of colour result in a considerable degradation of this stereopair. Moreover, the left stereomate is situated at the very right margin of the original Metric Camera photograph. Still, stereoscopic view yields an obvious surplus of information. Various details mentioned in the text (section 3.2) can be identified.
Geological Mapping of Remote Mountainous Regions 127
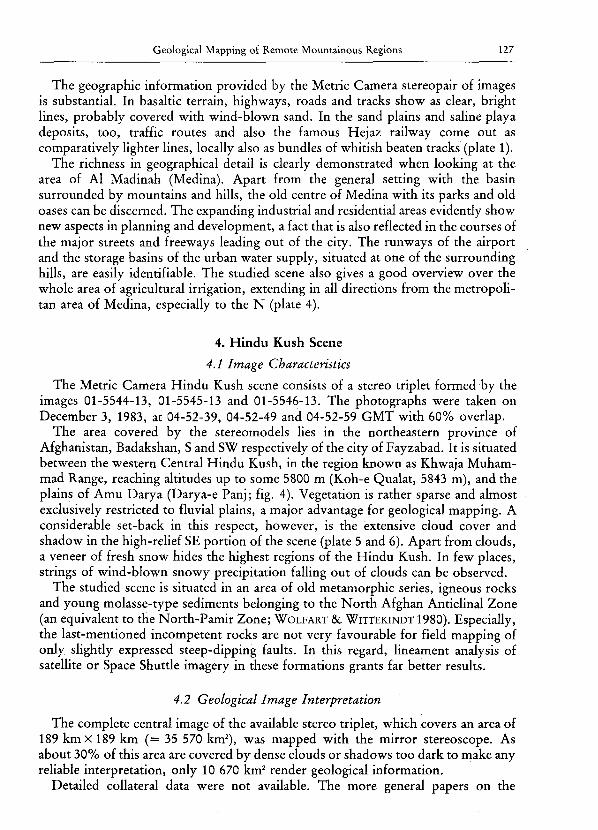
The geographic information provided by the Metric Camera stereopair of images is substantial. In basaltic terrain, highways, roads and tracks show as clear, bright lines, probably covered with wind-blown sand. In the sand plains and saline playa deposits, too, traffic routes and also the famous Hejaz railway come out as comparatively lighter lines, locally also as bundles of whitish beaten tracks (plate 1).
The richness in geographical detail is clearly demonstrated when looking at the area of Al Madinah (Medina). Apart from the general setting with the basin surrounded by mountains and hills, the old centre of Medina with its parks and old oases can be discerned. The expanding industrial and residential areas evidently show new aspects in planning and development, a fact that is also reflected in the courses of the major streets and freeways leading out of the city. The runways of the airport and the storage basins of the urban water supply, situated at one of the surrounding hills, are easily identifiable. The studied scene also gives a good overview over the whole area of agricultural irrigation, extending in all directions from the metropolitan area of Medina, especially to the N (plate 4).
4. Hindu Kush Scene
4.1 Image Characteristics
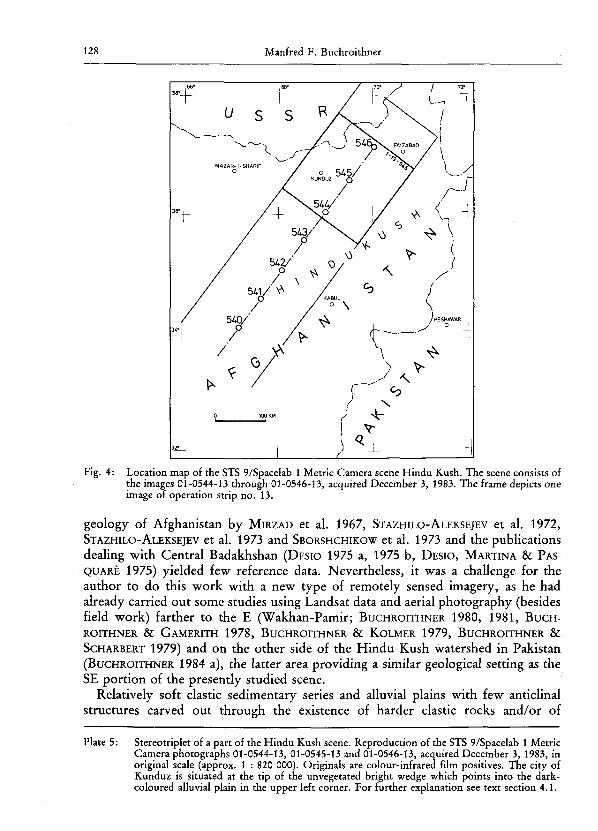
The Metric Camera Hindu Kush scene consists of a stereo triplet formed by the images 01-5544-13, 01-5545-13 and 01-5546-13. The photographs were taken on December 3, 1983, at 04-52-39, 04-52-49 and 04-52-59 GMT with 60% overlap.
The area covered by the stereomodels lies in the northeastern province of Afghanistan, Badakshan, S and SW respectively of the city of Fayzabad. It is situated between the western Central Hindu Kush, in the region known as Khwaja Muhammad Range, reaching altitudes up to some 5800 m (Koh-e Qualat, 5843 m), and the plains of Amu Darya (Darya-e Panj; fig. 4). Vegetation is rather sparse and almost exclusively restricted to fluvial plains, a major advantage for geological mapping. A considerable set-back in this respect, however, is the extensive cloud cover and shadow in the high-relief SE portion of the scene (plate 5 and 6). Apart from clouds, a veneer of fresh snow hides the highest regions of the Hindu Kush. In few places, strings of wind-blown snowy precipitation falling out of clouds can be observed.
The studied scene is situated in an area of old metamorphic series, igneous rocks and young molasse-type sediments belonging to the North Afghan Anticlinal Zone (an equivalent to the North-Pamir Zone; WOLFART & WITTEKINDT 1980). Especially, the last-mentioned incompetent rocks are not very favourable for field mapping of only slightly expressed steep-dipping faults. In this regard, lineament analysis of satellite or Space Shuttle imagery in these formations grants far better results.
4.2 Geological Image Interpretation
The complete central image of the available stereo triplet, which covers an area of 189 km X 189 km (= 35 570 km2), was mapped with the mirror stereoscope. As about 30% of this area are covered by dense clouds or shadows too dark to make any reliable interpretation, only 10 670 km2 render geological information.
Detailed collateral data were not available. The more general papers on the
128 Manfred F. Buchroithner
Fig. 4: Location map of the STS 9/Spacelab 1 Metrie Camera scene Hindu Kush. The scene consists of the images 01-0544-13 through 01-0546-13, acquired December 3, 1983. The frame depicts one image of operation strip no. 13.
geology of Afghanistan by MIRZAD et al. 1967, STAZHILO-ALEKSEJEV et al. 1972, STAZHILO-ALEKSEJEV et al. 1973 and SBORSHCHIKOW et al. 1973 and the publications dealing with Central Badakhshan (DESIO 1975 a, 1975 b, DESIO, MARTINA & PAS-
QUARE 1975) yielded few reference data. Nevertheless, it was a challenge for the author to do this work with a new type of remotely sensed imagery, as he had already carried out some studies using Landsat data and aerial photography (besides field work) farther to the E (Wakhan-Pamir; BUCHROITHNER 1980, 1981, BUCH
ROITHNER & GAMERITH 1978, BUCHROITHNER & KOLMER 1979, BUCHROITHNER &
SCHARBERT 1979) and on the other side of the Hindu Kush watershed in Pakistan (BUCHROITHNER 1984 a), the latter area providing a similar geological setting as the SE portion of the presently studied scene.
Relatively soft clastic sedimentary series and alluvial plains with few anticlinal structures carved out through the existence of harder clastic rocks and/or of
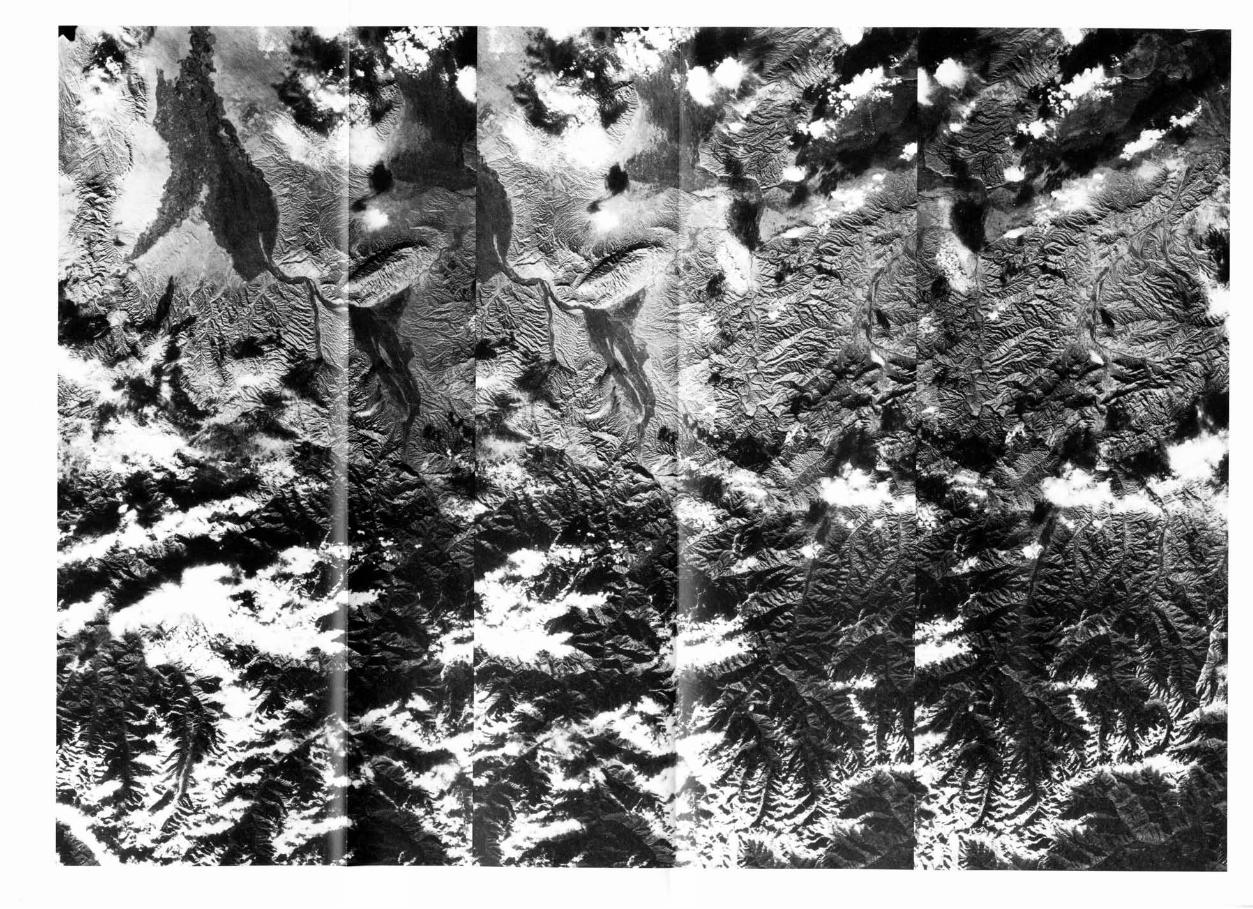
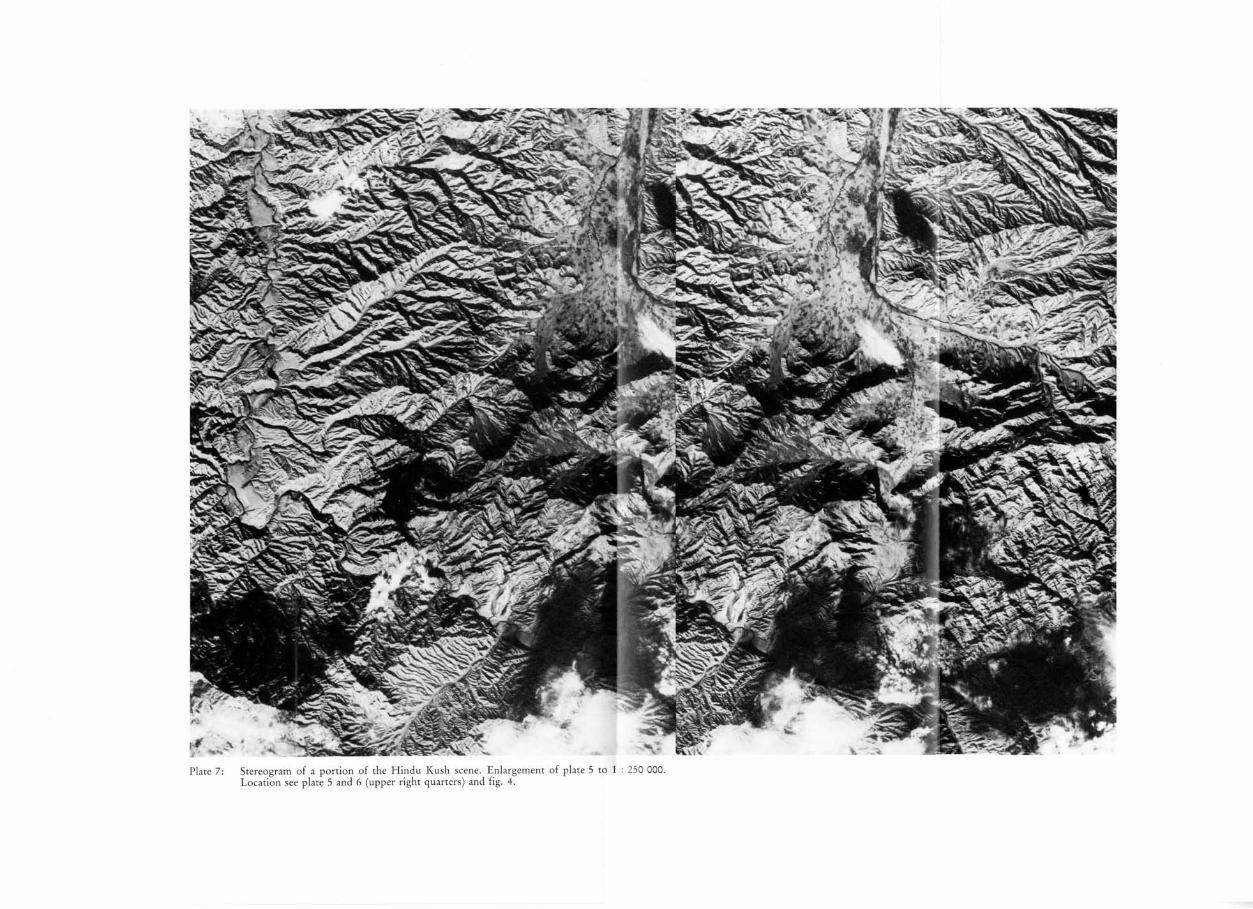
Plate 5: Stereotriplet of a part of the Hindu Kush scene. Reproduction of the STS 9/Spacelab 1 Metric Camera photographs 01-0544-13, 01-0545-13 and 01-0546-13, acquired December 3, 1983, in original scale (approx. 1 : 820 000). Originals are colour-infrared film positives. The city of Kunduz is situated at the tip of the unvegetated bright wedge which points into the dark-coloured alluvial plain in the upper left corner. For further explanation see text section 4.1.
Geological Mapping of Remote Mountainous Regions 129
limestones are the prevailing two-dimensional surface elements. Frequently, flat-irons in competent beds indicate strike and dip. Anticlines and synclines are not always clearly discernible. In several cases, however, they can be mapped by tracing their closures (plate 6, fig. 5).
Alluvial plains over large areas are clearly evident as dark patches indicating areas covered with non-chlorophyll-bearing shrub and bush vegetation with scattered tree stands. This type of terrain, frequently interrupted by patches of cultivated land, can already be identified with the mirror stereoscope using an 8X lens system, i. e. a scale of almost 1 : 100 000. The Kern DSR-1 analytical plotter offers the possibility to map even minor landuse details of this type of surface cover, e. g. the paddy and cotton fields in the alluvial plains around Kunduz. Traces of ancient meanders visible in the vegetation-covered alluvial plains of the Amu Darya and Farkhar River valleys would represent an interesting study object for more detailed investigations.
In the western corner of the Hindu Kush scene, features of eolian sand deposits can be recognized (plate 6). For identification, however, we had to use the 8X binocular of a Wild ST4 mirror stereoscope, or the analytical plotter. A part of a playa of some 16.5 X 19 km2 in extension, surrounded by low relief hills of more resistant rocks, displays prominent long-distance stringer dunes with a spacing of some 400 to 500 m. They are NNE-SSW trending and indicate winds blowing from ± NNE. On the other side of the surrounding hill chain, in the alluvial plains of the Farkhar River, another field of eolian sand deposits can be observed. This elongate field of some 2.5x6.0 km2 size consists of parabolic, U-shaped and stringer-type dunes (MCKEE, BREED & HARRIS 1973) with some irregular sand deposits inbetween. Transition types of the parabolic dunes and the stringers also occur. This dune field is caused by winds blowing from northern directions. On the other (southeastern) side of the Farkhar River, one more part of a large field of eolian deposits, some 16.5 X 25 km2 in size (also cut by the margin of the image), displays narrow-spaced dunes of the stringer type. Their shape and direction also indicate winds blowing from the N. It is an interesting fact that even minor morphological features can locally change the prevailing direction of wind, which has its clear expression in the differently trending stringer dunes on both sides of the hilly chain mentioned above (cf. also plate 6).
Locally areas of varying extent show the typical smooth surface of very finegrained wind-blown sediments, indicating veneers of loess (plate 6).
The most pronounced major lineaments strike NNE-SSW, with a complementary set of faults running in ± E-W direction. The conjugate CLOOS pair of lineaments trends ± NNW-SSE and ENE-WSW, the latter direction beeing the least pronounced. This fault pattern and also its expression in relief very well fit into the general structural setting of NE Afghanistan and the adjacent part of the Soviet Pamir (cf. SBORSHCHIKOV et al. 1973, WOLFART & WITTEKINDT 1980).
Although horizontal and, especially, vertical movements along lineaments are difficult to identify in the comparatively soft sedimentary rocks of the low hum-mocky terrain, some statements on structural displacements can be made. Figure 5 shows the interpretation of the stereomodel given in plate 7 as an example of what can be achieved in structural mapping. In this subscene, genetic aspects can be evaluated in that respect, that an act of undulating folding of all series has been
9 Mitteilungen der Österr. Geol. Ges., Bd. 77
130 Manfred F. Buchroithner
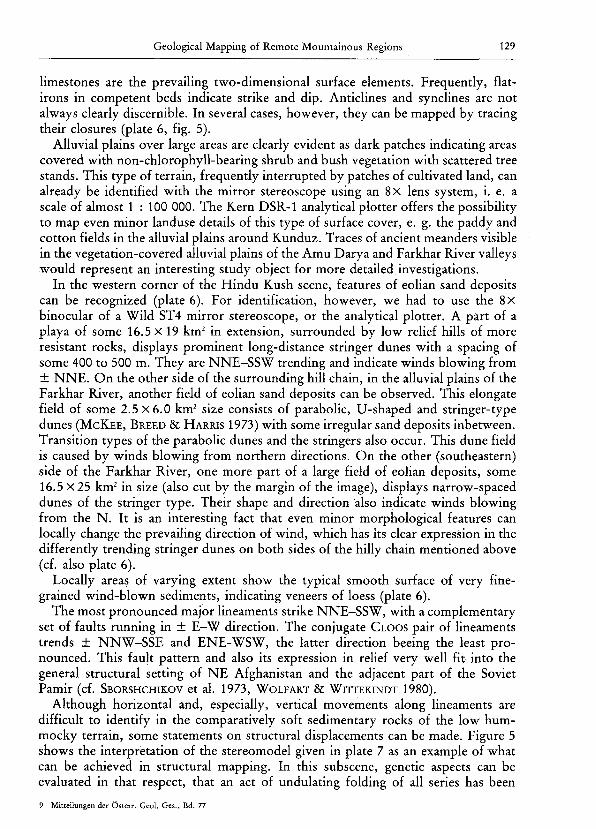
Fig. 5: Structural photogeological interpretation of the area depicted in plate 7. For legend and symbols see plate 6.
followed by faulting tectonics causing horizontal as well as vertical movements. No statements, however, can be made on the genetic relation of these two acts, whether they were one- or two-phase events. Slip faulting in the plate 7 area evidently has to be seen in connection with the genesis of the Kokca Graben (cf. WOLFART & WlTTEKINDT 1980) .
5. Himalaya Scene
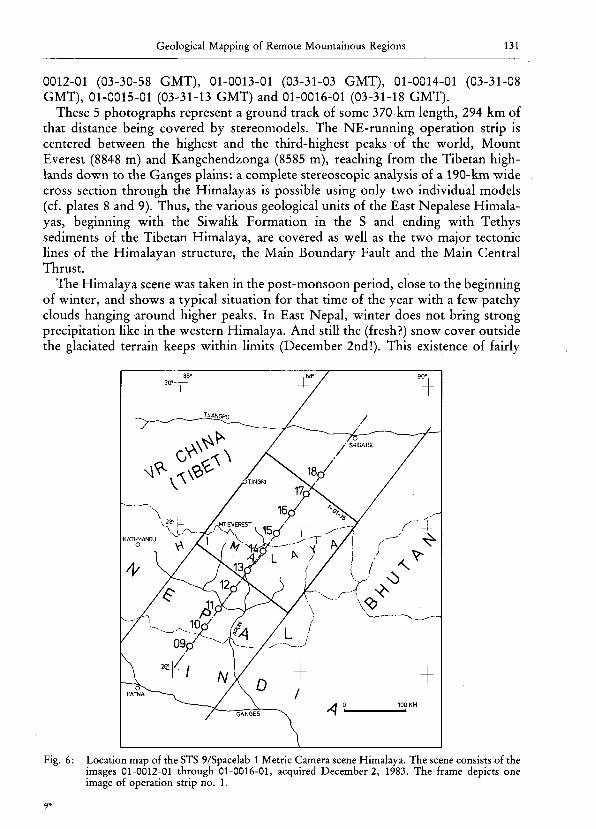
5.1 Image Characteristics
The largest continuous area covered by Metric Camera photographs is the Himalaya scene which comprises 5 images with 80% overlap each. They were taken on December 2, 1983, and their indices and respective times of acquisition are 01-
Geological Mapping of Remote Mountainous Regions 131
0012-01 (03-30-58 GMT), 01-0013-01 (03-31-03 GMT), 01-0014-01 (03-31-08 GMT), 01-0015-01 (03-31-13 GMT) and 01-0016-01 (03-31-18 GMT).
These 5 photographs represent a ground track of some 370 km length, 294 km of that distance being covered by stereomodels. The NE-running operation strip is centered between the highest and the third-highest peaks of the world, Mount Everest (8848 m) and Kangchendzonga (8585 m), reaching from the Tibetan highlands down to the Ganges plains: a complete stereoscopic analysis of a 190-km wide cross section through the Himalayas is possible using only two individual models (cf. plates 8 and 9). Thus, the various geological units of the East Nepalese Himalayas, beginning with the Siwalik Formation in the S and ending with Tethys sediments of the Tibetan Himalaya, are covered as well as the two major tectonic lines of the Himalayan structure, the Main Boundary Fault and the Main Central Thrust.
The Himalaya scene was taken in the post-monsoon period, close to the beginning of winter, and shows a typical situation for that time of the year with a few patchy clouds hanging around higher peaks. In East Nepal, winter does not bring strong precipitation like in the western Himalaya. And still the (fresh?) snow cover outside the glaciated terrain keeps within limits (December 2nd!). This existence of fairly
Fig. 6: Location map of the STS 9/Spacelab 1 Metric Camera scene Himalaya. The scene consists of the images 01-0012-01 through 01-0016-01, acquired December 2, 1983. The frame depicts one image of operation strip no. 1.
9»
132 Manfred F. Buchroithner
good meteorological conditions makes the present scene of the East Nepalese Himalaya even more useful. Despite the low sun angle and extensive shadows, these Metric Camera images are by far better in quality than all other published satellite imagery (hard copies) providing the possibility to be enlarged to a comparable scale of about 1 : 100 000, that were available to the author (e. g. MAYER 1981, WORLD
BANK 1981), save for one Landsat scene from March 1977 published by SHEFFIELD
1981. A comparison of Metric Camera with Landsat data will be given at the end of section 5.2.
The present sequence of 5 space images from Tibet to the Ganges Basin, moreover, clearly demonstrates the influence of vegetation on photogeological mapping. Half of the mapped area is covered by active (chlorophyll-bearing) vegetation, and one sixth shows non-active vegetation (i. e. the Ganges plains; plate 10). Lineaments, at least of regional extent, can very well be mapped in vegetated area. Lithological analysis, however, is by far better accomplished in the non-vegetated NE portion of the scene. The bare highlands of Tibet provide excellent terrain for descrimination of rock units (cf. plates 9 and 10).
5.2 Geological Image Interpretation
Using 5 Metric Camera images, an area of 189 km X 332 km has been mapped. This acreage of 62 630 km2, however, also comprises some 7150 km2 evaluated in monoscopic mode, which are situated in the Ganges plains, a terrain where, due to the flat relief, the third dimension does not yield much additional information.
Reasonable topographic data could only be obtained from the Solu Khumbu (Mount Everest) area, where the so-called "SCHNEIDER map" (RESEARCH SCHEME
NEPAL HIMALAYA 1978) gives excellent detailed information. Besides the publications of BORDET 1961 on the Makalu and BORTOLAMI, LOMBARDO & POLINO 1977 on the Lhotse area, the standard hand book by GANSSER 1964 about the geology of the Himalayas was used as geological background information. For photogeological mapping, it only gives rough data on a Himalaya-wide scale. No collateral geological information was obtainable from the Tibetan portion of the scene, apart from a 1 : 2,000.000 map enclosed in GANSSER'S book. And even there, the reliability seems to be limited as some differences between the photogeological evidence and the respective parts of this map were detected.
As mentioned before (section 5.1), about half of the mapped area is covered with a reasonably dense vegetation canopy. Although in most of this terrain vegetation veils a considerable part of lithological information, in the southern foothills of the Himalayas it provides significant additional characteristics. They enable the photo-
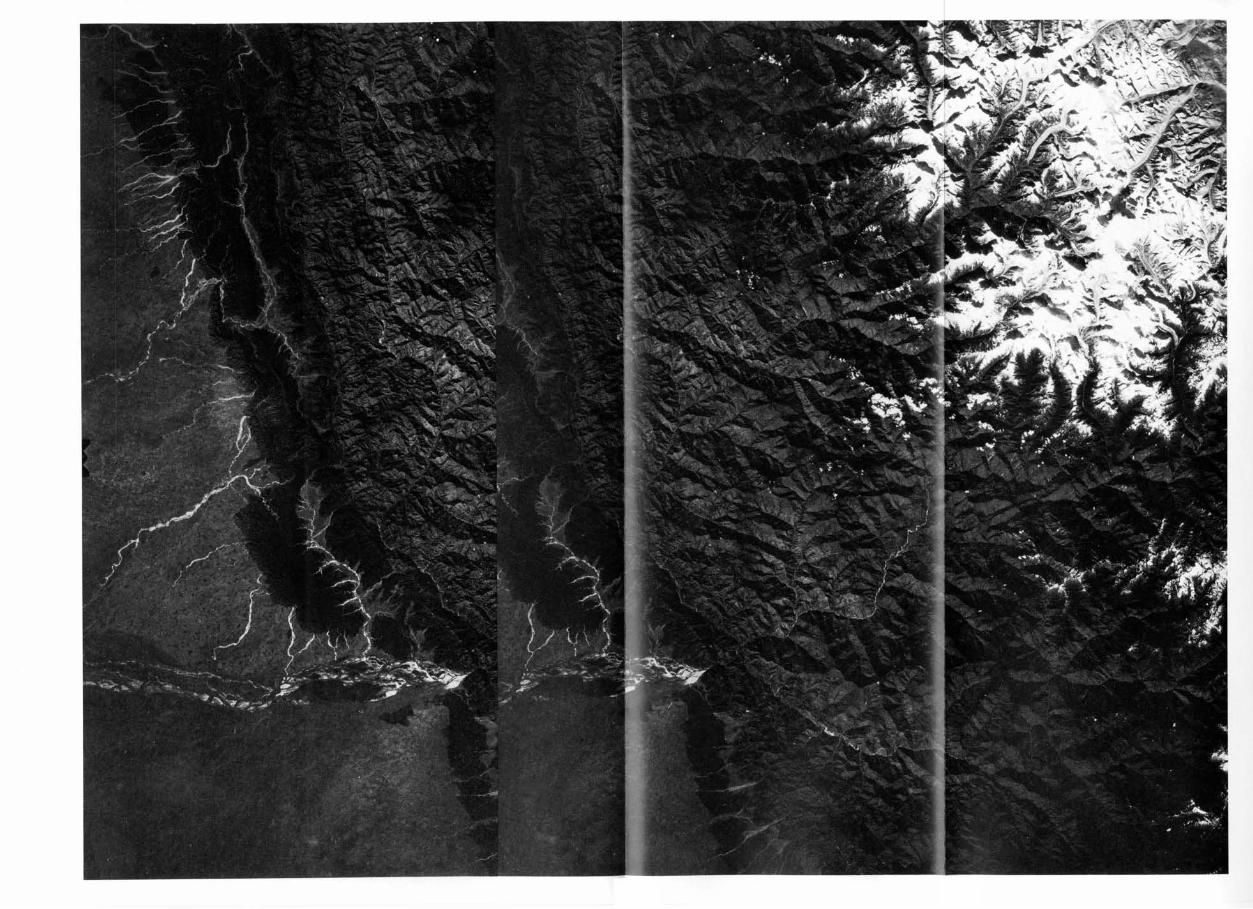
Plate 8: Stereogram of the southern part of the Himalaya scene. Reproduction of the STS 9/Spacelab 1 Metric Camera photographs 01-0012-01 and 01-0013-01, acquired December 2, 1983, in original scale (approx. 1 : 820 000). Overlap 80%. Originals are colour-infrared film positives. Mount Everest (8848 m) is situated close to the upper right corner (cf. fig. 6 and plate 10).
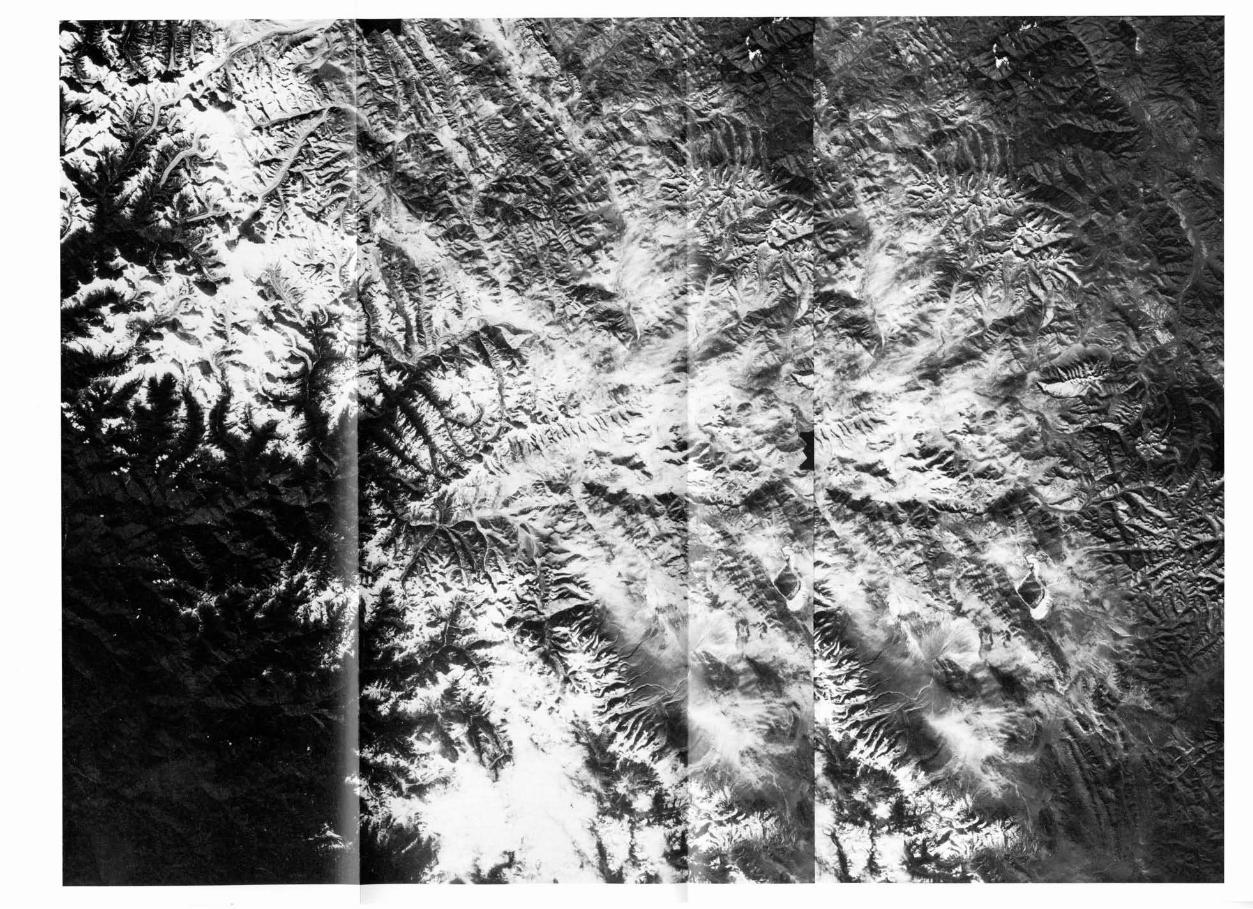
Plate 9: Stereogram of the northern part of the Himalaya scene. Reproduction in original scale (approx. 1 : 820 000) of the STS 9/Spacelab 1 Metric Camera photographs 01-0015-01 and 01-0016-01, acquired December 2, 1983. Overlap 80%. Originals are colour-infrared film positives. Mount Everest in situated close to the upper left corner (cf. plate 8).
Geological Mapping of Remote Mountainous Regions 133
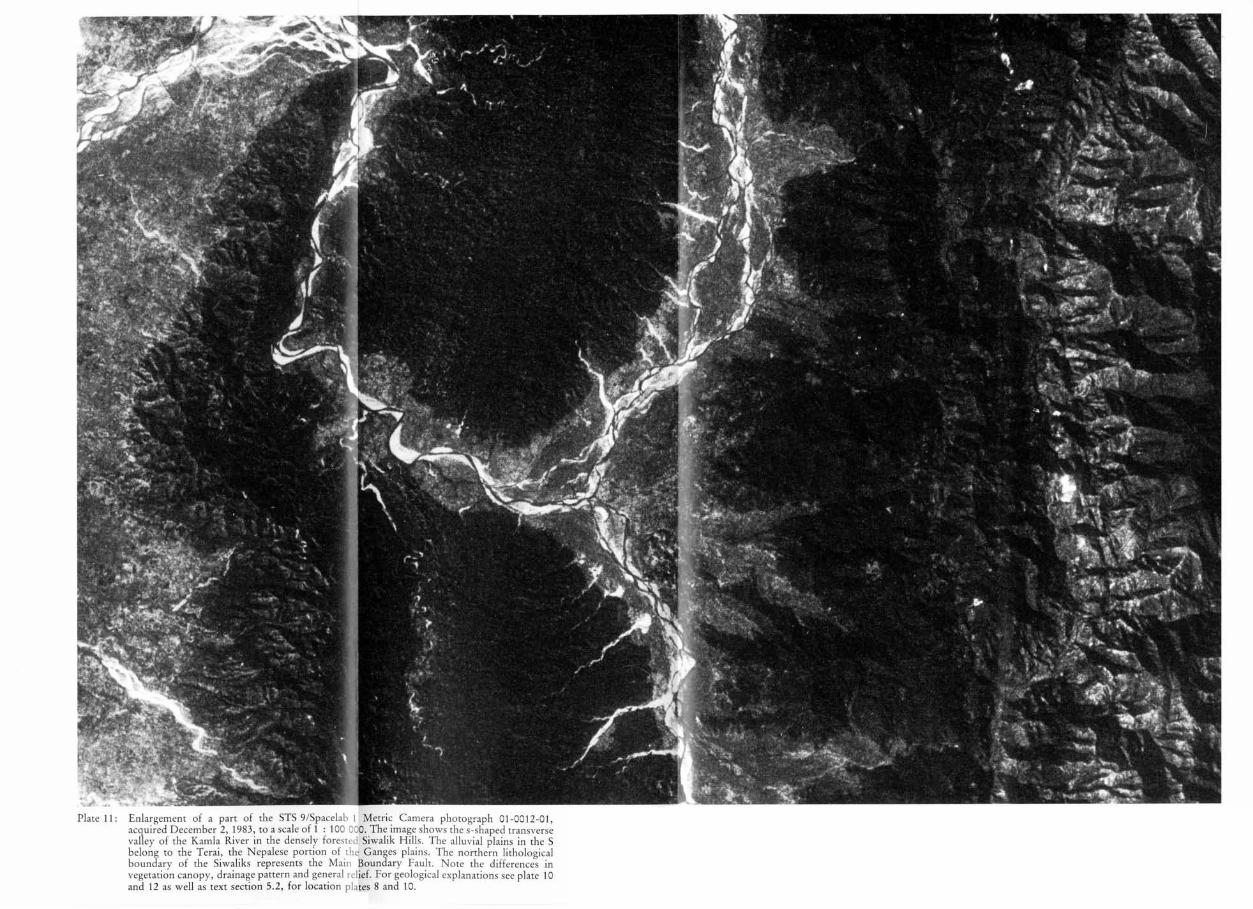
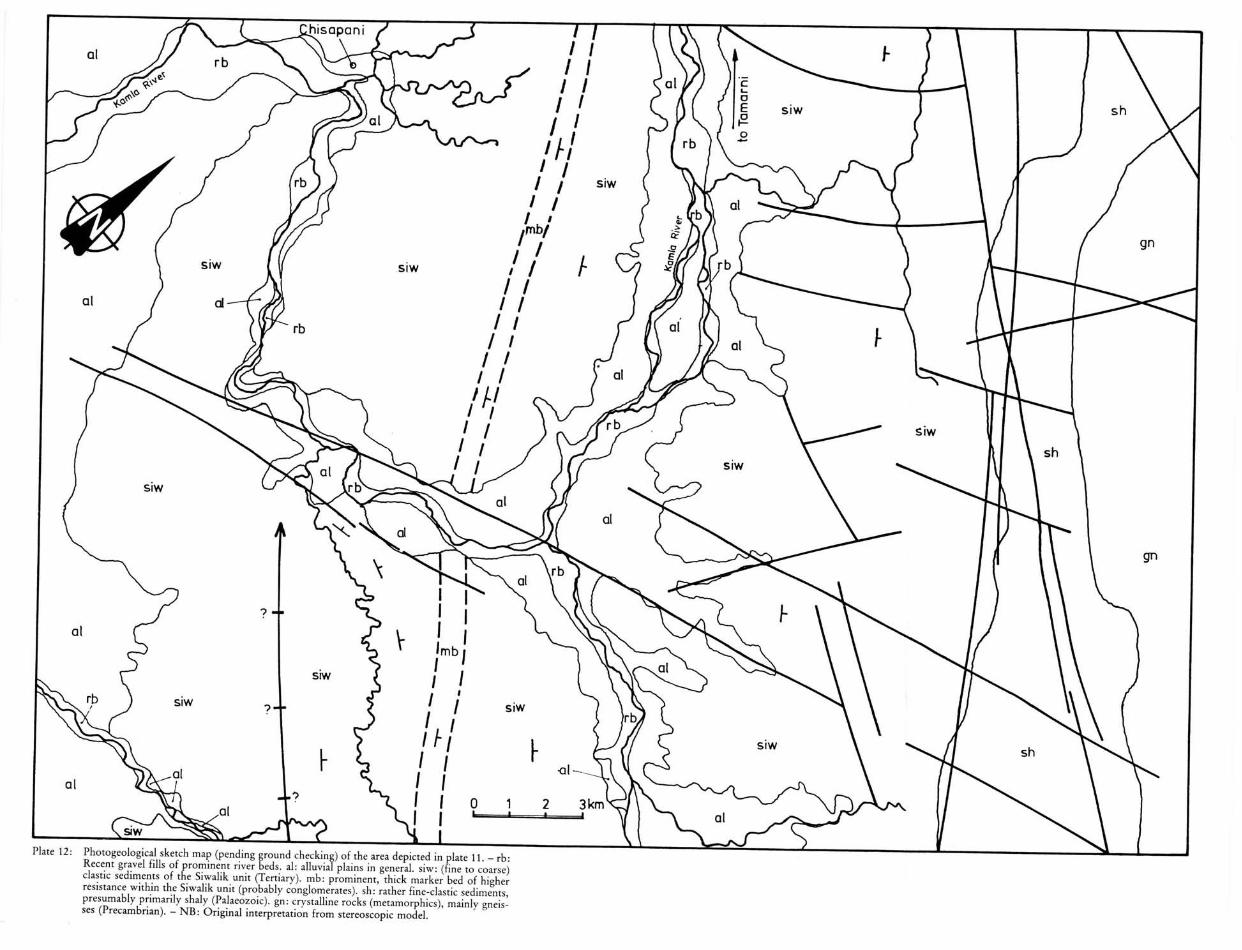
geologist to discern the molasse-type sedimentary series of the Siwalik Formation as well as its adjacent northern seam of fine-clastic (Palaeozoic, GANSSER 1964) sediments (sandstones, shales), which differ from the first-mentioned not only in vegetation but also in drainage characteristics (lighter, more reddish colours in comparison with the dark-brown Siwalik terrain, more subparallel and coarser developed drainage system in contrast to the very fine-dentritic type of the Siwaliks; plate 11 and 12). Over long distances, based only on photogeology, the boundary with the northwards following zone of gneisses is vague and difficult to draw.
The northern boundary of the latter unit with a region of metamorphic sedimentary rocks (slates, perhaps conglomerates, quartzites etc.) is even less clear. It was but traced following slight alterations in the "overall" relief. Only rarely, effective changes in drainage type, pattern, texture, or hue could be observed. Knowing that this very lithological boundary also represents the Main Central Thrust, which is one of the most prominent detachment planes in the whole structure of the Himalayan system, it was once more proved, that even really substantial thrust planes cannot always be easily detected in space imagery if there are no striking changes in rock resistance and if the dip is too gentle. Thus, the Main Central Thrust could only be inferred from the "overall" geomorphology and the presumptive terrain intersection of the plane. Areas of sedimentary (also metamorphic) series inserted in this crystalline terrain are also almost impossible to be detected.
The northern margin of the Siwaliks, however, is clearly mapable and also provides photogeological evidence of a medium-steep northward dip. This boundary is formed by the Main Boundary Fault (cf. GANSSER 1964), implying that, in contrary to the Main Central Thrust, in this case a major fault - or rather thrust-plain (though with medium-steep dip angle) - can be mapped from space with sufficiently high accuracy (plates 8, 10, 11 and 12). Locally, the fault/thrust nature of the Main Boundary Fault could be inferred from the stereomodel.
Mapping of areas with granitic rocks in the Higher Himalayas (GANSSER 1964) is an undertaking which is made more difficult by the frequent cover of fresh snow and the extensive wrapping with thick moraine material. Moreover, cloud cover is much more likely to veil geomorphological information (as is the case in the Kangchend-zonga Massif in the present Metric Camera photographs). Nevertheless, colour (in these non- or almost non-vegetated areas) and relief can be used as delicate indications to discern granitic or granodioritic terrain with a reasonable degree of certainty. (This means "overall" granitic areas, because small "xenoliths" of sedimentary rock are as difficult to map as are apophyses of granite or aplite in the surrounding material.) Most of the granite boundaries have to be taken as "transition lines" (plate 10). Only from a scale of 1 : 25 000 upwards it makes sense to separate plutonic apophyses and to draw interfingerings with surrounding metamorphics in the range of some tens of m (cf. BUCHROITHNER & Huss 1978). This, however, implies image data sources which, at all, enable the photogeologist to map these features.
The Tibetan highlands N of the Higher Himalayas, like the Saudi Arabia scene, provide ideal conditions for geological mapping with Metric Camera imagery: no vegetation, almost no snow cover, practically no or at least negligible cloud cover, and a very clear, haze-free atmosphere. The sedimentary series of mainly fine-clastic
134 Manfred F. Buchroithner
Tethys Sediments can be discerned to a high degree of accuracy, according to their photogeological characteristics. Unfortunately, too little collateral information from defined reference spots is available (GANSSER 1964). Otherwise a sound geological map of these highlands up to a scale of, say, 1 : 50 000 could be prepared.
Taking GANSSER'S general map of the Himalaya (which is about 1.5 times smaller in scale than the original Metric Camera photographs), some local discrepancies Between this map and the present photointerpretation have been noticed. These divergencies refer to river courses as well as to the separation of lithological units, primarily granitic rocks; though one has to admit that most of these bodies are only indicated with dashed boundary lines in GANSSER'S map.
The prevailing directions of the major lineaments are N-S to NNE-SSW and ±E-W (equivalent to the strike direction in this sector of the Himalayas). The conjugate MOHR type system is not that clearly pronounced. This predominance of transverse faults might be of more local character but still seems to have some substantial meaning. The importance and genetic relationship between Himalayan transverse faults (and folds) and their parallelism with subsurface structures of the North Indian plains have been discussed by VALDIYA 1976, SINHA ROY 1978 and MISRA 1979, albeit no conformable opinions on this topic could be obtained.
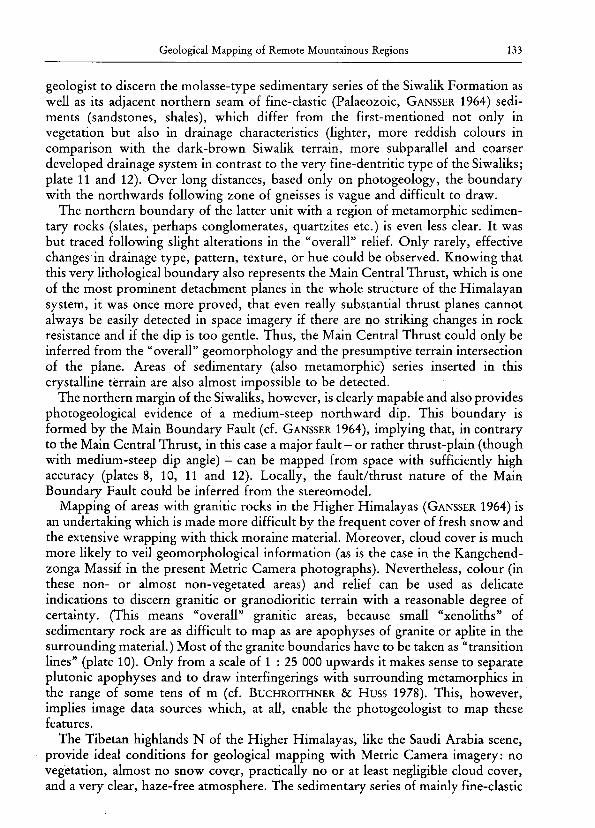
Fig. 7: Sketch map of the Khumbu area. For scale compare fig. 8, and plate 14. NB: Namche Bazar. PA: Pangpoche.
Geological Mapping of Remote Mountainous Regions 135
Legend:
River
Mountainrange
Footpath, Bridge
Village
>
o S3
Glacier uncovered
Glacier covered with scree
Moraine
Spot with number
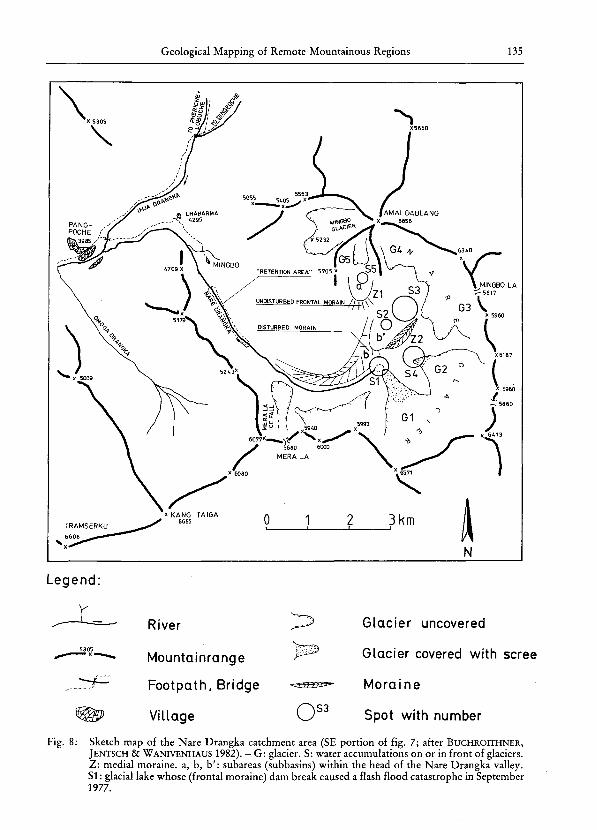
Fig. 8 : Sketch map of the Nare Drangka catchment area (SE portion of fig. 7; after BUCHROITHNER, JENTSCH & WANIVENHAUS 1982). - G: glacier. S: water accumulations on or in front of glaciers. Z: medial moraine, a, b, b ' : subareas (subbasins) within the head of the Nare Drangka valley. SI: glacial lake whose (frontal moraine) dam break caused a flash flood catastrophe in September 1977.
136 Manfred F. Buchroithner
Anyhow, the present lineament mapping seems to corroborate the importance of the N-S strike direction in faulting tectonics of the Eastern Himalayas.
Only rare indications for movements along lineaments could be observed. Locally, the Siwalik Formation and its adjacent northern units are obviously displaced along lineaments cutting their strike direction in an obtuse angle (± N-S). Rarely, in the Lesser Himalaya (between Siwaliks and Higher Himalaya) tributary rivers have been dragged at their mouths, thus giving evidence of active movements along lineaments. Moreover, much of the drainage system is structurally controlled (cf. also NiTZ & MUKERJI 1982). In the Higher Himalayas and, especially, in the Tibetan highlands no noticeable indications (features pointing to sub-recent movements, like dragging and "intersection blurring") or real displacements of units were observed.
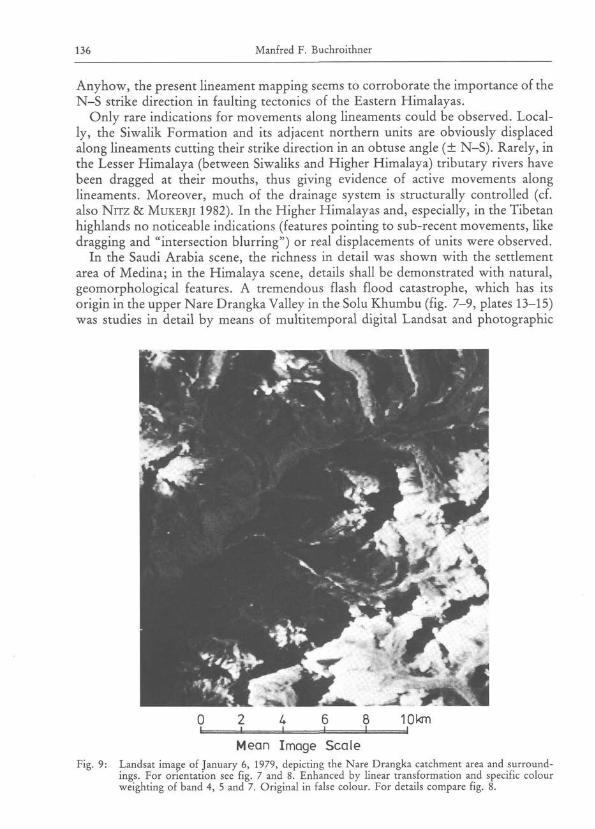
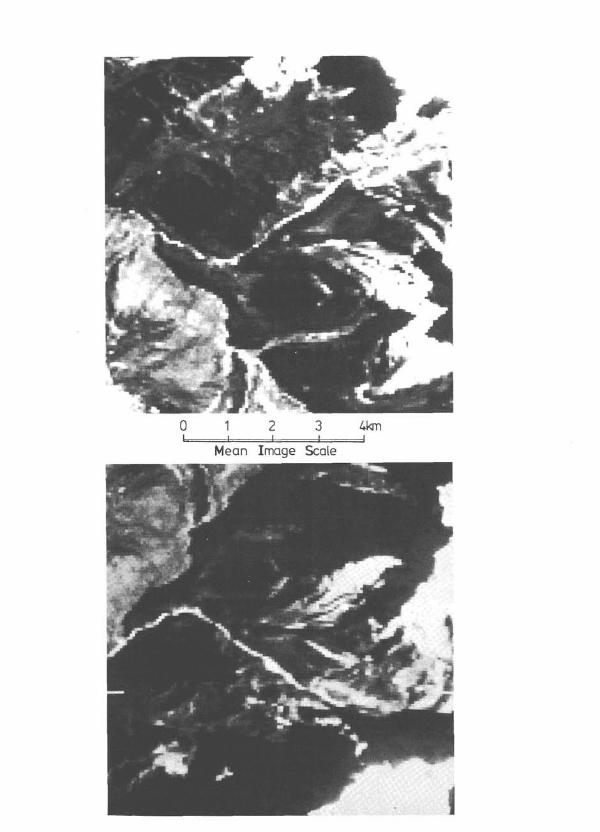
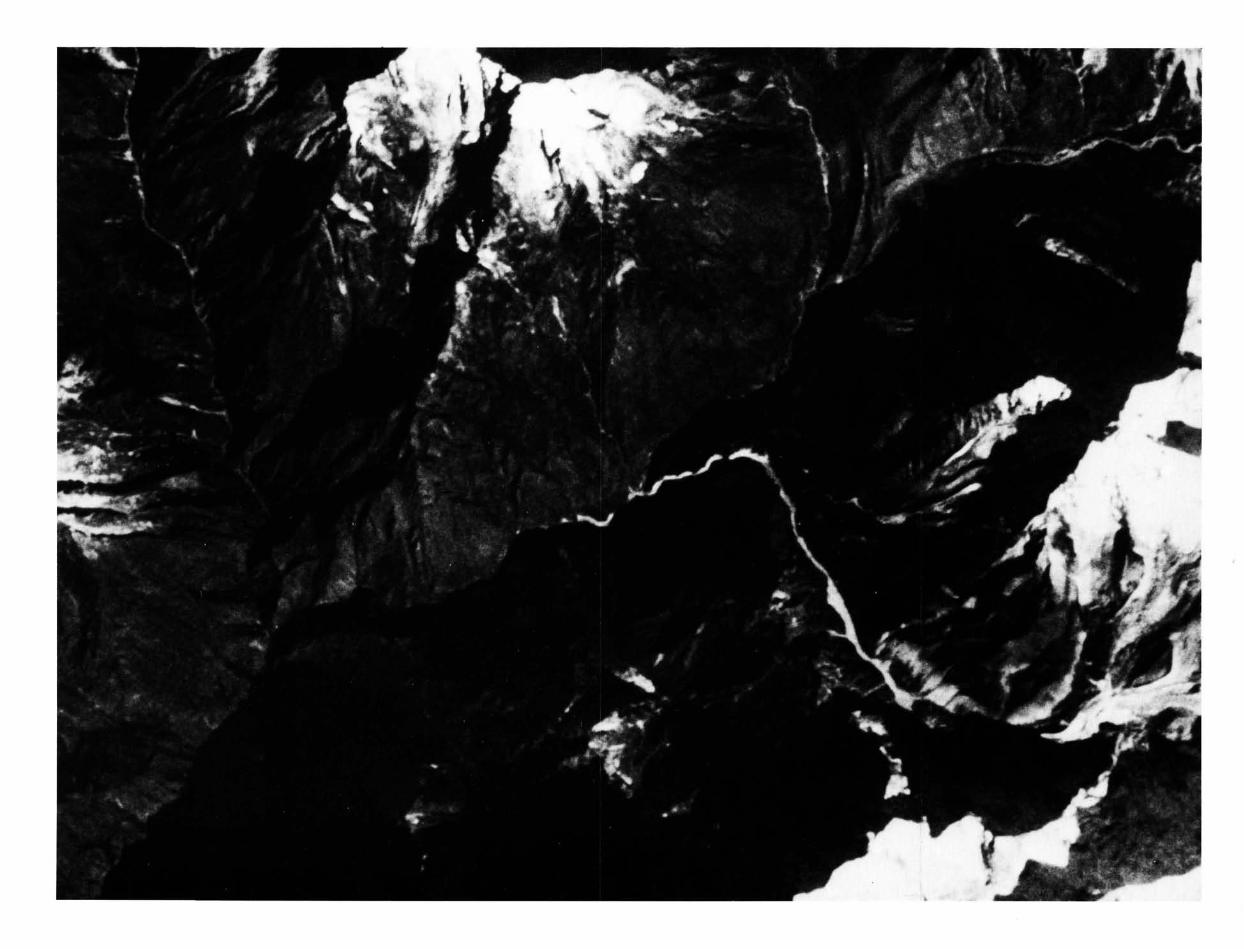
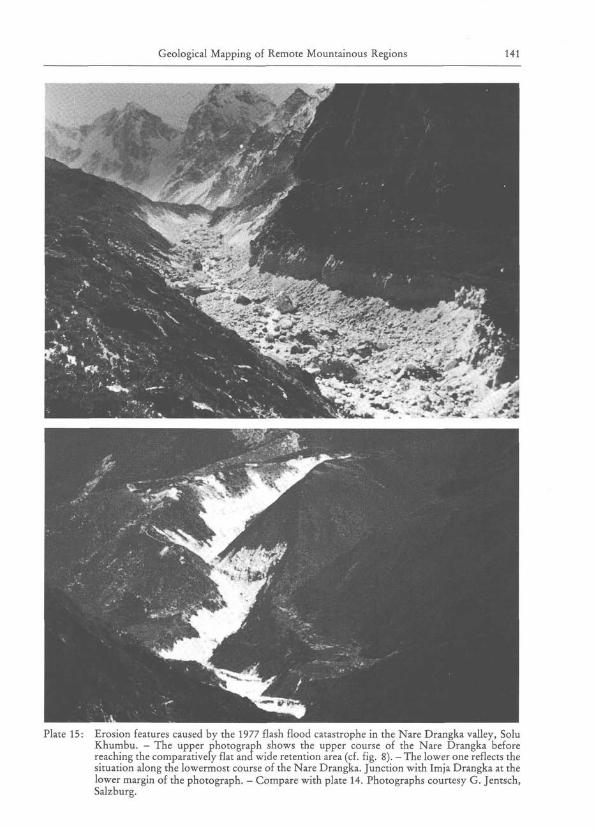
In the Saudi Arabia scene, the richness in detail was shown with the settlement area of Medina; in the Himalaya scene, details shall be demonstrated with natural, geomorphological features. A tremendous flash flood catastrophe, which has its origin in the upper Nare Drangka Valley in the Solu Khumbu (fig. 7-9, plates 13-15) was studies in detail by means of multitemporal digital Landsat and photographic
Fig. 9: Landsat image of January 6, 1979, depicting the Nare Drangka catchment area and surroundings. For orientation see fig. 7 and 8. Enhanced by linear transformation and specific colour weighting of band 4, 5 and 7. Original in false colour. For details compare fig. 8.
Geological Mapping of Remote Mountainous Regions 137
Metric Camera data (BUCHROITHNER, JENTSCH & WANIVENHAUS 1982, BUCHROITH-
NER 1984 b). Some 4.9 million m3 water ran out of a glacial lake dammed behind a frontal moraine that broke. The subsequent flash flood resulted in extensive erosion, land slides and gravel accumulations (plates 14 and 15). The kinetics and mechanics of such an extreme case of flooding can be described by the principle of a shallow water wave (non-linear differential calculus; SCHEIDEGGER 1975).
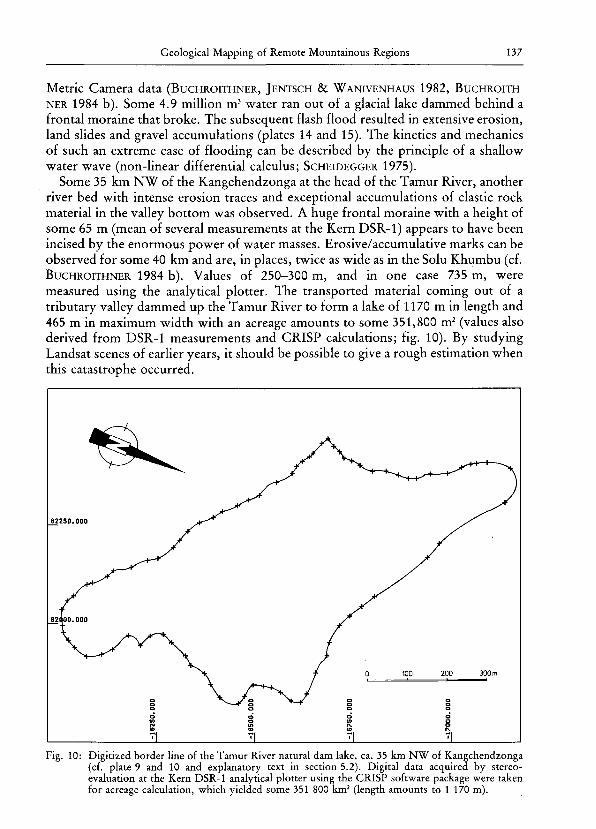
Some 35 km NW of the Kangchendzonga at the head of the Tamur River, another river bed with intense erosion traces and exceptional accumulations of clastic rock material in the valley bottom was observed. A huge frontal moraine with a height of some 65 m (mean of several measurements at the Kern DSR-1) appears to have been incised by the enormous power of water masses. Erosive/accumulative marks can be observed for some 40 km and are, in places, twice as wide as in the Solu Khumbu (cf. BUCHROITHNER 1984 b). Values of 250-300 m, and in one case 735 m, were measured using the analytical plotter. The transported material coming out of a tributary valley dammed up the Tamur River to form a lake of 1170 m in length and 465 m in maximum width with an acreage amounts to some 351,800 m2 (values also derived from DSR-1 measurements and CRISP calculations; fig. 10). By studying Landsat scenes of earlier years, it should be possible to give a rough estimation when this catastrophe occurred.
Fig. 10: Digitized border line of the Tamur River natural dam lake, ca. 35 km NW of Kangchendzonga (cf. plate 9 and 10 and explanatory text in section 5.2). Digital data acquired by stereo-evaluation at the Kern DSR-1 analytical plotter using the CRISP software package were taken for acreage calculation, which yielded some 351 800 km2 (length amounts to 1 170 m).
138 Manfred F. Buchroithner
Traces of a third flash flood catastrophe, evidently older than the two just mentioned (inferred from the darker grey tone of the erosion/accumulation features), were observed in Tibet. Their origin lies approximately 85 km due E of Mount Everest. The gravel fills and erosion marks in one of the tributaries of the Arun River can be traced for about 45 km. Even farther downstream land slides and sheet erosions in steep slopes (evidently subject to undercutting) are discernible, albeit no erosion/accumulation features were obvious.
It is remarkable that in all three cases of observed flash flood traces, the places of origin are situated in areas where major geological lineaments intersect minor ones (plate 10). This observation suggests that tectonic forces (earthquakes) could, in the very first instance, be responsible for these catastrophes (BUCHROITHNER 1984 b).
Table 3 gives comparative figures of one- and two-dimensional measurements of identical distances and areas in the Nare Drangka Valley from digital Landsat images and Metric Camera photographs, using Landsat pixel counts, planimetry of enlarged Metric Camera images (1 : 50 000, plate 14) and Kern DSR-1 analytical plotter evaluation of a stereomodel. It is interesting and a little surprising that the acreage resulting from pixel counts lies some 157 000 m2 beyond the mean value achieved by using the Rost Type 644 planimeter. Apparently the origin of this divergence is subject to the number of mixed pixels which is hard to evaluate visually. The figure resulting from stereophotogrammetric evaluation at the DSR-1 is still 77 000 m2
higher than the planimetric value. Detailed studies of these photogrammetric problems by experts are underway.
Calculation of the real, non-projective area eroded during the flash flood event, by means of a DSR-1 CRISP program written at the Institute for Image Processing and Computer Graphics in Graz (M. Gruber), yielded an acreage of some 479 000 m2, a figure 92 000 m2 (24%) larger than the projective area computed at the DSR-1 (cf. Tab. 3). The possibility to calculate real areas and, consequently, also volumes up to the shown degree of precision clearly demonstrates the potential of photogrammetric space photography.
In this connection it may be noted that up to a range of some 10 km the difference between topographic map and enlargement of Metric Camera images is negligibly small for thematic mapping (in the range of few mm with a 1 : 50 000 map scale). This accuracy has been tested in the Namche Bazar - Nare Drangka area in the Solu Khumbu, an area with differences in elevation up to 4 010 m (Amai Dablang summit to Thumbug, S of Namche Bazar) and, therefore, comparatively high relief displacements.
It is unnecessary to denote that the Himalaya scene also provides plenty of valuable general geographic information. The interesting explanations by HAFFNER
1982 and Nrrz & MUKERJI 1982 concerning Landsat MSS December scenes of the East Nepalese Himalayas (MAYER 1981) can unrestrictedly be applied to the Metric Camera images as geographic background information.
Plate 13: Comparison of the Nare Drangka erosion/accumulation features before and after the 1977 flash flood by means of Landsat MSS data. - The upper image shows the situation on March 20, 1977, the lower one on January 6, 1979. The increase in erosion/accumulation area is clearly visible (cf. text section 5.2). Same enhancement as in fig. 9. For scale compare fig. 8. Compare also table 3. After BUCHROITHNER, JENTSCH & WANIVENHAUS 1982.
140 Manfred F. Buchroithner
Table 3: Comparison of one- and two-dimensional measurements in Landsat and Metric Camera imagery of the Nare Drangka Valley before and after the September 1977 flash flood catastrophe. The "total erosion/accumulation area" refers to the portion between end of side moraines and river mouth. The Metric Camera figures for 1977 have been calculated using the percentage derived from Landsat data. Planimeter measurements on the enlarged Metric Camera photograph have been carried out with a Rost Type 644 planimae, and acreage calculation on a Kern DSR-1 analytical plotter using the CRISP software package (cf. p. 120). With the pixel counts the mixed pixels have been taken into consideration.
Parameter
Width of valley
bottom
Dir. downstream Nare Glacier
frontal moraine
Adjacent 300 m
Adjacent downstream portion &
retention area
Projective Mingbo retention area
(Ground truth: JENTSCH 1982)
Projective total
erosion/ accumula
tion area
m2
%
Landsat imagery enhanced with linear transformation
(orig. on display screen ca. 1 : 100 000)
March 1977
River bed smaller than
valley bottom
January 1979
100-150 m
ca. 50 m
widening to 100-250 m up to
ca. 200 m
140 000 m2
(Estimation based on Landsat and field data)
Mean of 4 pixel counts:
94 pixels 123 pixels
415 860
100
544 150
130.8
Metric Camera image enlarged to 1:50 000
before Sept. 1977
see Landsat
Dezember 1983
shadow
ca. 50 m
widening to 120—150 m, up to ca. 235 m
165 000 m2
(Mean of 6 planimetric measurements)
Recalculated
acreage: 355 500 m7 295 900 m2
100
Mean of 6 planimetric measurements/
Kern DSR-1 calculation: 464 000 m2/387 000 m2
130.8
6. Conclusion
Much has been written on the advantages of metric space photography before the first Metric Camera mission was flown. And indeed, despite initial adverse aspects, this type of imagery has demonstrated outstanding usefulness for thematic mapping up to a scale of 1 : 50 000 or even more (cf. TOGLIATTI & MORIONDO 1984: fig. 2). In geological applications, where (with exceptions; cf. text section 5.2 i. a.) the
Plate 14: Enlargement of a part of the STS 9/Spacelab 1 Metric Camera photograph 01-0015-01, acquired December 2, 1903, to a scale of 1 : 50 000. The depicted area shows the erosion/ accumulation features of the 1977 flash flood catastrophe in the Nare Drangka valley. Further explanation see text section 5.2 (cf. fig. 8 and table 3).
Geological Mapping of Remote Mountainous Regions 141
Plate 15: Erosion features caused by the 1977 flash flood catastrophe in the Nare Drangka valley, Solu Khumbu. - The upper photograph shows the upper course of the Nare Drangka before reaching the comparatively flat and wide retention area (cf. fig. 8). - The lower one reflects the situation along the lowermost course of the Nare Drangka. Junction with Imja Drangka at the lower margin of the photograph. - Compare with plate 14. Photographs courtesy G. Jentsch, Salzburg.
142 Manfred F. Buchroithner
dynamic processes are generally much slower than in any of the anthropologically controlled or influenced thematic fields, Metric Camera photographs realized the positive expectations. For geological mapping the irregular or even non-existent repetition rate is of subordinate importance. The possibility of "easy access" to remote and rugged regions (like the ones investigated in this study) by means of "photogeological reconnaissance flights" at a comparative altitude of about 1000 m (or even less, see above) provided by Metric Camera stereomodels is of invaluable benefit. (NB: When flying at an altitude of approximately 1000 m, the naked eye -f = 17.5 mm - allows the perception of plain ground at a 1 : 50 000 mean scale.)
The striking advantage of Metric Camera imagery for geological reconnaissance mapping is the fact that photo analysis can be carried out in synoptic view aiming at major structures for 60 or even 80% of an image area as well as very much in detail (up to the scale just mentioned) using one stereomodel only. For a first reconnaissance mapping, it is a rather cumbersome job to work through piles of conventional aerial photographs. And often enough (at least, when using large-scale photographs, say, of 1 : 30 000 mean image scale and larger) the photogeologist has to fret at the difficulty, if not impossibility, to overview the regional geological context, which in many cases provides a key for the solution of local problems.
As already mentioned in this paper and in other publications (KONECNY 1981, 1984, KONECNY & SCHRÖDER 1979, KONECNY, SCHUHR & Wu 1982, DOYLE 1984), the possibility of stereoviewing is a tremendous advantage not only for topographic but also for thematic evaluation. According to KONECNY, SCHUHR & Wu 1982, with stereoscopic observation ground pixels can be twice as large as with monoscopic interpretation to obtain an equivalent amount of information. With regard to Ultra-High Altitude Photography (UHAP) GIERLOFF-EMDEN 1983 and GIERLOFF-EMDEN
& DiETZ 1983 state the potential of stereopairs for interpretations of higher quality in comparison with monoscopic observation. For mapping of lithological units and geological structures these authors take about 30 m as lower limit for the requirement in ground resolution. These demands are already met by the Landsat Thematic Mapper data, and will be exceeded by far by the European SPOT system. The specified resolution of 39 line pairs/mm of Metric Camera images is equivalent to some 20 m on ground (cf. KONECNY, SCHUHR & Wu 1982). This quality still enables a thematic photo-interpreter to detect (even short, approx. 100-150 m long) linear features of less than 10 m in width in stereoscopic observation, as long as a decent contrast and/or difference in colour exists. Examples are given in plate 4 and plate 14, showing the area of Medina (streets, roads, etc.) and part of the Solu Khumbu (runway, rivers, settlements), enlarged to 1 : 100 000 and 1 : 50 000 respectively (cf. also section 3.2 and 5.2). The recognizability (identificability) of features of this size and shape, however, is not always easy, particularly subtle geological ones. Punctiform features, logically, still have to be larger to be detected and are much harder to identify. The importance of context knowledge is quite obvious and has been emphasized before.
One more word shall be given to the relation in quality with Landsat Multispectral Scanner (MSS) images and space photographs of earlier manned missions (cf. section 3.2). The superiority of Metric Camera images to Landsat MSS with respect to better ground resolution and stereoscopy is evident. Especially for the geologist, who very
Geological Mapping of Remote Mountainous Regions 143
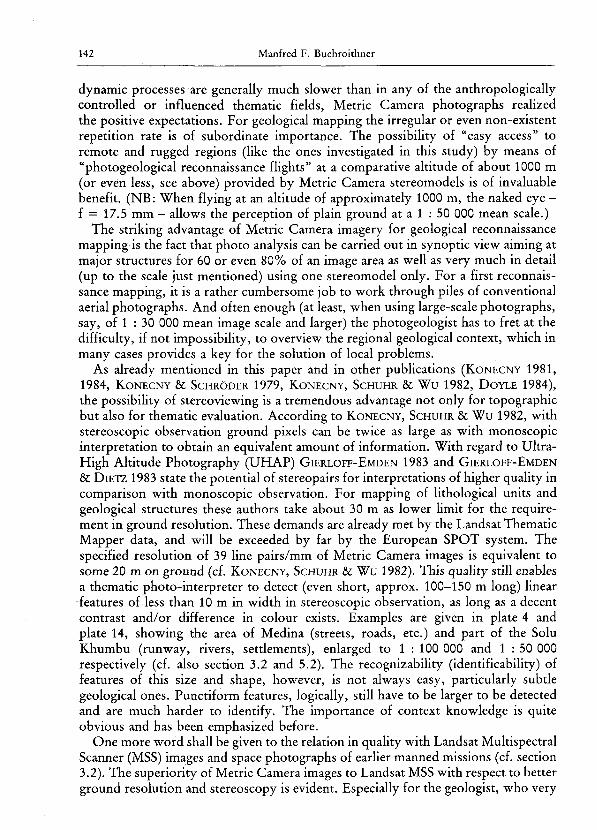
Table 4: Comparison between the number of conventional 23 X 23 cm2 aerial photographs of different scales covering the area of a Metric Camera stereo-model. For the airborne photography a forward overlap of 60 or 80% and?a-sidelap of of 20% were considered. The figure before the x always gives the number of photographs in a flight line, the second one the number of flight lines.
Number of photographs/
Area
Number of Metric Camera images
Area covered by Metric Camera stereo model
Number of aerial photographs
Area covered by Metric Camera stereo model
Number of aerial photographs
Mean image scale of aerial photograph
1 : 30 000
2
1 : 50 000
2
1 : 100 000
2
21 432 km2
43x35 = 1505 26X21 = 546 14x11 = 154
28 577 km2
56X35 = 1960 34x21 = 714 18X11 = 198
Metric Camera percentage of overlap
60%
80%
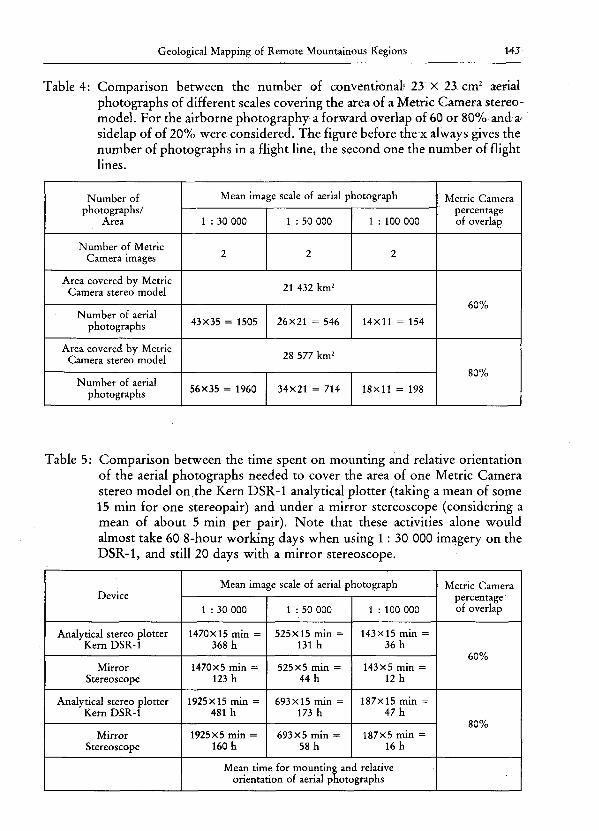
Table 5: Comparison between the time spent on mounting and relative orientation of the aerial photographs needed to cover the area of one Metric Camera stereo model on the Kern DSR-1 analytical plotter (taking a mean of some 15 min for one stereopair) and under a mirror stereoscope (considering a mean of about 5 min per pair). Note that these activities alone would almost take 60 8-hour working days when using 1 : 30 000 imagery on the DSR-1, and still 20 days with a mirror stereoscope.
Device
Analytical stereo plotter Kern DSR-1
Mirror Stereoscope
Analytical stereo plotter Kern DSR-1
Mirror Stereoscope
Mean image scale of aerial photograph
1 : 30 000
1470X15 min = 368 h
1470x5 min = 123 h
1925X15 min = 481 h
1925X5 min = 160 h
1 : 50 000
525X15 min = 131 h
525X5 min = 44 h
693x15 min = 173 h
693x5 min = 58 h
1 : 100 000
143X15 min = 36 h
143X5 min = 12 h
187X15 min = 47 h
187x5 min = 16 h
Mean time for mounting and relative orientation of aerial photographs
Metric Camera percentage of overlap
60%
80%
144 Manfred F. Buchroithner
much relies on third dimension, stereoscopy is an essential tool for the interpretation. On the other hand, sets of digital multispectral data provide the possibility to accomplish improved automated (supervised) classification. In comparison with landuse mapping, for example, computer-aided classification only plays a subordinate role in geological mapping with space data, at least in areas which do not offer bare soil or rock. It shall not be ignored, however, that for the field of previsual geobotanical prospection Landsat MSS data (and TM data the more) represent an excellent means. Their advantage of guaranteed repetition of data acquisition (weather permitting) has been stressed often enough.
Metric Camera photographs are superior to earlier photographs of manned space missions due to their well-defined geometry and consistant stereo-coverage. Comparisons with space sensors as Seasat and SIR-A shall not be given here, as the whole character of active sensing systemes is completely different. However, used together with Metric Camera imagery which could provide data for digital elevation models, space radar should yield interesting additional geological information.
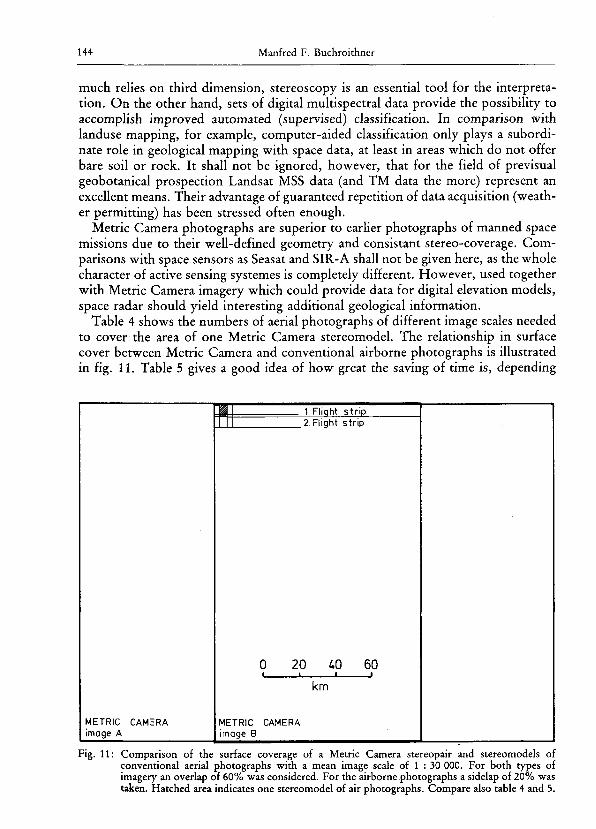
Table 4 shows the numbers of aerial photographs of different image scales needed to cover the area of one Metric Camera stereomodel. The relationship in surface cover between Metric Camera and conventional airborne photographs is illustrated in fig. 11. Table 5 gives a good idea of how great the saving of time is, depending
METRIC CAMERA image A
1.Flight str ip .2.Flight strip
0 1_
20 W 60 i
km
METRIC CAMERA image B
Fig. 11: Comparison of the surface coverage of a Metric Camera stereopair and stereomodels of conventional aerial photographs with a mean image scale of 1 : 30 000. For both types of imagery an overlap of 60% was considered. For the airborne photographs a sidelap of 20% was taken. Hatched area indicates one stereomodel of air photographs. Compare also table 4 and 5.
Geological Mapping of Remote Mountainous Regions 145
whether you use geometrically relevant interpretation at a photogrammetric stereo-plotter or "simply" a mirror stereoscope. The facts given in these tables and fig. 11 are rather self-explanatory.
For most countries of the world neither panchromatic nor infrared aerial colour photographs are available. As the importance of colour in airborne photography is uncontested, this fact is another great advantage besides stereoviewing. Also for the photogeologist, who frequently uses vegetation as an identifaction or at least detection key, infrared colour photography represents an enormous benefit in mapping.
In general, the content of geographic information of Metric Camera imagery is certainly considerable and rich enough in detail to make it an operational tool for scientific studies as well as for applied research, e. g. regional planning (where geology has its influence again). Geographical analyses of the Metric Camera scenes treated in this paper are surely interesting (e. g. the irrigated agricultural areas of Saudi Arabia and Afghanistan), and compare favorably with analyses from Landsat data. Studies of the Hindu Kush and Himalaya scenes concerning landuse and natural vegetation are in progress and will be published in the proceedings of the ESA research project "High Mountain Research in Southern Central Asia".
It would not be realistic and fair to neglect the drawbacks of photogrammetric space images. Thus, to the end of this paper, it seems justified to give some critical aspects on the Metric Camera system (and the planned Large Format Camera, too), in passages following the statements of DOYLE 1984.
Although the technical and economical feasibility to produce topographic and -that is the main target of a geologist - thematic maps of 1 : 100 000 and even 1 : 50 000 can be demonstrated, there are many problems remaining, the major one probably being the financial aspect. The primary goal of this type of metric space photographs is the production of topographic maps. To a certain degree thematic mapping is only a "fellow traveller". If there is no financial support for topographic map production using photogrammetric space imagery, the thematic aspect will be the less influential to materialize further projects. NASA has agreed to fly the Large Format Camera (LFC) on two missions (in summer/fall 1984, NASA announced a third flight of the LFC in a 28.5° inclination orbit which would take place in December 1984), but photographs from those missions will be acquired simply where it is convenient for the flight plan rather than where the demand is greatest. Apparently, plans for future flights, either governmental or commercial, are at the best nebulous.
No matter, whether the photographs are eventually acquired by governmental, intergovernmental or commercial enterprises, the user will have little control over the circumstances of acquisition. Different users will certainly need images from different seasons, or even multitemporal photo coverage. With the seasonal aspect, degrading features like snow, haze, clouds and shadow due to relief come into the game. The problem of the correct sun angle (>30°) has already been treated by GIERLOFF-EMDEN & DIETZ 1983 and KONECNY 1984 (cf. also section 5.1 and 5.2). Haze, due to the favourable geographical/climatic position, did not degrade the scenes studies within this project too much. Definite statements on the influence of hazy atmosphere, however, would require in-depth meteorological investigations.
10 Mitteilungen der Österr. Geol. Ges., Bd. 77
146 Manfred F. Buchroithner
Lack of experience in handling metric space photography, black-and-white as well as colour-infrared, will hopefully be diminished by the production and first thematic interpretations of Metric Camera images. The present analyses shall help to develop the actual procedures for utilizing photographs acquired by the future Large Format Camera to the best advantage. As already mentioned earlier, one of the major benefits of film systems over electro-optical data transmission systems is, that the photographs are immediately useable in instruments such as analytical plotters, which are rapidly replacing the conventional analog stereoplotters around the world. Doubtless, some emendments in software will be required for exploitation of photogrammetric space imagery. First steps towards the realization of this objective have been made in developing additional programs for the analytical plotter CRISP software package at the Institute for Image Processing and Computer Graphics in Graz (cf. section 5.2 and tab. 3).
With a resolution of 100 line pairs/mm and original image scales of 1 : 400 000 to 1 : 600 000, depending on flight altitude, the photographs acquired by the Large Format Camera will be more than two times better in resolution than the Metric Camera images (cf. tab. 1 and section 5.2): perspectives that are stimulating for optimistic exspectations in geological mapping by means of metric space photography.
7. Acknowledgements
I am grateful for the kind assistance of or discussion with H. FUCHS, M. GRUBER,
K. HAFNER, H. HAUSER, R. HÜTTER and M. RANZINGER all Institute for Image Processing and Computer Graphics of the Graz Research Center, regarding programming, photogrammetric evaluation, digitizing and plotting. My thanks also goto R. KOSTKA, Technical University of Graz, who, years ago, invited me to carry out these studies, and who provided useful topographic and other collateral data.
8. References
BAYER, H.-J. (1984): 1. General Geology of Western Saudi Arabia. 1.1. The Arabian Shield. - In: A. R. JADO & J. G. ZöTL (Ed.): Quaternary Period in Saudi Arabia. 2. Sedimentological, Hydrogeological, Hydrochemical, Geomorphological, Geochronological and Climatological Investigations in Western Saudi Arabia: 5-13; Vienna - New York (Springer).
BoRDET, P. (1961): Recherches Geologiques dans l'Himalaya du Nepal, Region du Makalu. - 285 p. ; Paris (Edition du Centre National de la Recherche Scientifique).
BoRTOLAMI, G., LOMBARDO, B. & POLINO, R. (1977): Geologia. Osservazioni Geologiche sull'alta Imja Khola (Gruppo dell'Everest). - In: M. FANTIN & G. NANGERONI (Ed.): Estratto da Lhotse '75. Spedizione Alpinistico-Scientifica del CAI all' Himalaya del Nepal. Le Osservazioni Scientifiche: 95-112; Torino.
BUCHROITHNER, M. F. (1980): An Outline of the Geology of the Afghan Pamirs. - Tectonophysics, 62 (1980), 13-35; Amsterdam.
BUCHROITHNER, M. F. (1981): Geological Setting and Chemical Geothermometry of Some Hot Springs in the Wakhan (NE Afghanistan). - Verh. Geol. Bundesanst., 1981, 2, 19-29; Vienna.
BUCHROITHNER, M. F. (1984 a): Geological Map of the Tirich Mir Area, Hindu Kush (Northern Pakistan). 1 : 50 000. - Coloured manuscript map to be published with explanatory text in Jb. Geol. Bundesanstalt, 1985, Vienna.
BUCHROITHNER, M. F. (1984 b): Identification of Extensive Flash Flood Erosions in Remote Areas Using Landsat MSS and Metric Camera Data. - Proc. 1984 World Conf. Remote Sensing, Bayreuth (FRG), Oct. 8-11, 1984; Bayreuth.
BUCHROITHNER, M. F. (in prep.): Thematic Mapping and Erosion Monitoring with Metric Camera Imagery Using Computer-Aided Methods. SSS Cerma Internat. Conf. Series.
Geological Mapping of Remote Mountainous Regions 147
BUCHROITHNER, M. F. & GAMERITH, H. (1978): Pamir-e Wakhan-Dardistan. Geological Map of Selsela Koh-e Wakhan (Pamir-e Wakhan) and Parts of the High Hindu Kush, Hinduraj and Western Karakoram. 1 : 250 000. - In: R. SENARCLENS DE GRANCY & R. K.OSTKA (Ed.): Grosser Pamir: Enclosure; Graz (Akad. Druck- und Verlagsanstalt).
BUCHROITHNER, M. F., Huss, H. (1978): Darrah-e Issik-e Payan. Lower Issik Valley. Vegetation and Geology. 1 : 25 000. - In: R. SENARCLENS DE GRANCY & R. KOSTKA (Ed.): Grosser Pamir: Enclosure; Graz (Akad. Druck- und Verlagsanstalt).
BUCHROITHNER, M. F., JENTSCH, G. & WANIVENHAUS, B. (1982): Monitoring of Recent Geological Events in the Khumbu Area (Himalaya, Nepal) by Digital Processing of Landsat MSS Data. - Rock Mechanics 15, 181-197, Vienna.
BUCHROITHNER, M. F. & KOLMER, H. (1979): Notes on the Wakhan Formation of the Great Afghan Pamir and the Eastern Hindu Kush. - Afghanistan J., 6, 2, 54-61; Graz.
BUCHROITHNER, M. F. & SCHARBERT, S. M. (1979): Geochronical Data from the Great Afghan Pamir and the Eastern Hindu Kush. - N. Jb. Geol. Paläont. Mh., 1979, 8, 449-456; Stuttgart.
CHAPMAN, R. W. (1978 a): 1. General Information on the Arabian Peninsula. 1.1. Geology. - In: S. S. AL-SAYARI & J. G. ZöTL (Ed.): Quaternary Period in Saudi Arabia. 1: Sedimentological, Hydro-geological, Hydrochemical, Geomorphological and Climatological Investigations in Central and Eastern Saudi Arabia: 4—19; Vienna — New York (Springer).
CHAPMAN, R. W. (1978 b): 1. General Information on the Arabian Peninsula. 1.2. Geomorphology. -In: S. S. AL-SAYARI & J. G. ZöTL (Ed.): Quaternary Period in Saudi Arabia. 1: Sedimentological, Hydrogeological, Hydrochemical, Geomorphological and Climatological Investigations in Central and Eastern Saudi Arabia: 19-30; Vienna - New York (Springer).
DESIO, A. (1975 a): Introduction. Geology of Central Badakhshan. - In: A. DESIO (Ed.): Italian Expeditions to the Karakorum (K2) and Hindu Kush., Sei. Rep., Ill, 3, 1-22, Leiden (Brill).
DESIO, A. (1975 b): Tectonics. Geology of Central Badakhshan. - In: A. DESIO (Ed.): Italian Expeditions to the Karakorum (K2) and Hindu Kush., Sei. Rep., Ill, 3, 311-338, Leiden (Brill).
DESIO, A., MARTINA, E. & P ASQUARE, G. (1975): Stratigraphy. Geology of Central Badakhshan. - In: A. DESIO (Ed.): Italian Expeditions to the Karakorum (K2) and Hindu Kush., Sei. Rep. Ill, 3, 23-227; Leiden (Brill).
DOYLE, F. J. (1984): The Economics of Mapping with Space Data. - ITC Journal, 1984, 1, 1-9; Enschede.
FUCHS, H. (1984): Interactive Bundle Adjustment with Metric and Non-Metric Images Including Terrestrial Observations and Conditions. — Proc. 15th Conf. of ISPRS, Rio de Janeiro, June 17-29, 1984; Rio de Janeiro.
FUCHS, H., LEBERL, F. (1984): Universal and Analytical Plotter Software for Photographs with Perspective Geometry (CRISP). - Proc. ASP - ACSM Convention, Washington D. C , March 11-16, 1984: 774-781; Washington D. C.
FURON, R. (1968): Geologie de PAfrique. - 374 p. ; Paris (Payot). GANSSER, A. (1964): Geology of the Himalayas. - 289 p. ; London - New York - Sidney (Interscience
Publ) . GlERLOFF-EMDEN, H. G. (1983): UHAP (Ultrahigh Altitude Photography). Analyse und Anwendung
von Luftbildern aus 20 km und 15 km Höhe. - Proc. Jahrestagung 1983, Deutsche Ges. Luft- und Raumfahrt, Munich, October 17-19, 1983: 21 p. ; Munich.
GIERLOFF-EMDEN, H. G. & DlETZ, K. R. (1983): Auswertung und Verwendung von High Altitude Photography (HAP). (Hochbefliegungen aus Höhen von 12-20 km). Kleinmaßstäbige Luftbildaufnahmen von 1 : 125 000 bis 1 : 30 000 mit Beispielen von UHAP und NHAP aus den USA. -Münchner Geographische Abhandlungen, 32, 106 p. ; Munich.
HAFFNER, W. (1982): Osthimalaya - Vegetationsstufen. - In: H. ASCHE (Red.): Diercke Weltraumbild-Atlas. Textband: 217-218; Braunschweig (Westermann).
HÜTTER, R. (1984): MAPOUT. Ein interaktives System zur Herstellung thematischer Karten. - Engin. Dipl. Thesis, 155 p. ; Techn. University Graz, Graz.
JENTSCH, G. (1982): Ablauf der Flutwelle Nare Drangka 1977, Nepal, Himalaya. - Engin. Dipl. Thesis, 113 p. ; Univ. Bodenkultur, Vienna.
KAINZ, W. & RANZINGER, M. (1983): DESBOD, a Geographie Information System. - Proc. CAMP '83, Computer Graphics Application in Management and Productivity: 1344-1362; Berlin.
KAINZ, W., RANZINGER, M. & HÜTTER, R. (1984): DESBOD. Jahresbericht 1983/1984. Geodatenerfas-sung III. Geodatenanalyse und -darstellung I. - 76 p., Institute for Image Processing and Computer Graphics, Graz Research Center; Graz.
KODAK (Eastman Kodak Company, 1976): Kodak Data for Aerial Photography (Fourth Edition). -92 p., Rochester, N. Y. (Eastman Kodak Comp.).
KONECNY, G. (1981): Das europäische Weltraum-Fernerkundungsprogramm. - Nachrichten aus dem Karten- und Vermessungswesen, Reihe I, 82, 67-105; Frankfurt/Main.
10*
148 Manfred F. Buchroithner
KoNECNY, G. (1984): The Photogrammetric Camera Experiment on Spacelab 1. - Bildmessung und Luftbildwesen, 52, 3, 195-200; Karlsruhe.
KONECNY, G., REYNOLDS, M. & SCHRÖDER, M. (1982): The Metric Camera Experiment on the First Spacelab Flight. - 6 p., Deutsche Forschungs- und Versuchsanstalt für Luft- und Raumfahrt (DFVLR); Oberpfaffenhofen - Köln-Porz.
KONECNY, G. & SCHRÖDER, M. (1979): Einsatz von photographischen Meßkammern im Weltraum. -Allgemeine Vermessungsnachrichten, 1979, 275-265; Karlsruhe.
KONECNY, G., SCHUHR, W. & Wu, J. (1982): Untersuchungen über die Interpretierbarkeit von Bildern unterschiedlicher Sensoren und Plattformen für die kleinmaßstäbige Kartierung. - Bildmessung und Luftbildwesen, 50, 6, 187-200; Karlsruhe.
MAYER, F. (Compiling Ed., 1981): Diercke Weltraumbild-Atlas. - 176 p.; Braunschweig (Westermann). McKEE, E. D., BREED, C. S. & HARRIS, L. F. (1973): A Study of Morphology, Provenance, and
Movement of Desert Sand Seas in Africa, Asia and Australia. - NASA Goddard Space Flight Center, Second Symp. Significant Results Obtained from ERTS-1, New Carrollton, Md., March 1973, Proc , vol. 1, sect. A: 291-303; Washington, D. C. (NASA).
M C K E E , E. D. & BREED, C. S. (1974): An Investigation of Major Sand Seas in Desert Areas throughout the World. - NASA Goddard Space Flight Center, Third Symp. Significant Results Obtained from ERTS-1, Washington D. C , December 1973, Proc , vol. 1, sect. A: 665-679; Washington, D. C. (NASA).
Van der M E E R M O H R , H. E. C. (1969): Geological Interpretation of Hyperaltitude Photographs from Gemini Space-Craft. - Photogrammetria, 24, 14, 167-174.
MEKEL, J. F. M. (1978): The Use of Aerial Photographs and Other Images in Geological Mapping. - ITC Textbook of Photo-Interpretation, Vol. VIII, 206 p. ; Enschede (ITC).
MIRZAD, S. H., MICHAILOV, K. I., MANUCHARIANTS, O. A. et al. (Ed., 1967): Geological Map of Afghanistan. Scale 1 : 500 000. 5 sheets. - Ministery of Mines and Industries of Afghanistan, Pres. Min. Geol.; Kabul.
MlSRA, K. S. (1979): Himalayan Transverse Faults and Folds and Their Parallelism with Subsurface Structures of North Indian plains - Discussion. - Tectonophysics, 56, 299-302; Amsterdam.
NEBERT, K. (1969): Geology of the Jabal Samran and Jabal Farasan Region, Kingdom of Saudi Arabia. -Mineral Resources Bulletin, 4, 32 p. ; Jeddah.
NlTZ, H.-J. & MUKERJI, A. B. (1982): Gangesebene/Himalaya - Profil. - In: H. ASCHE (Red.): Diercke Weltraumbild-Atlas. Textband: 219-220; Braunschweig (Westermann).
PELLATON, C. (1979): Geologic Map of the Yanbu' al Bahr Quadrangle, Sheet 24C, Kingdom of Saudi Arabia. Scale 1 : 250 000. - Ministry of Petroleum and Mineral Resources, Deputy Ministry for Mineral Resources; Jeddah.
PELLATON, C. (1981): Geologic Map of the Al Madinah Quadrangle, Sheet 24D, Kingdom of Saudi Arabia. Scale 1 : 250 000. - Ministry of Petroleum and Mineral Resources, Deputy Ministry for Mineral Resources; Jeddah.
RANZINGER, M., KAINZ, W. & LEBERL, F. (1981): DESBOD - Systemspezifikation. - DIBAG-Reports, 2, 133 p., Institute for Image Processing and Computer Graphics, Graz Research Center; Graz.
RESEARCH SCHEME NEPAL HIMALAYA (Ed., 1978): Khumbu Himal (Nepal). Topographic Map. Scale 1 : 50 000. Second Edition. - Vienna (Freytag-Berndt & Artaria).
ROLAND, N. W. (1974): Methoden und Ergebnisse photogeologischer Untersuchungen im Tibesti-(
Gebirge (Zentrale Sahara). - Pressedienst Wissenschaft FU Berlin, 5, 1974, 37-49; Berlin. ROLAND, N. W. (1976): Die Ringstruktur Aorounga (Borkou, Süd-Sahara). - Geol. Jb., A33: 117-131;
Hannover. SBORSHCHIKOV, I. M., DRONOV, V. I., CHMYRIOV, V. M., KAVARSKIY, A. Kh., KAZIKHANI, A. R.,
SALAH, A. S., SLAVIN, V. L., TELESHEV, G. I. & ABDULLAH, J. (1973): The Main Features of the Tectonics of Afghanistan. - In: Ministry of Mines and Industries of the Republic of Afghanistan. Department of Geological Survey (Ed.): Geology and Mineral Resources of Afghanistan. Edition 1, 1-30; Kabul.
SCHEIDEGGER, A. E. (1975): Physical Aspects of Natural Catastrophes. - 289 p. ; Amsterdam - Oxford -New York (Elsevier Sei. Publ.).
SHEFFIELD, Ch. (1981): Earth Watch. A Survey of the World from Space. - 160 p. ; London (Sidgewick & Jackson).
SINHA ROY, S. (1978): Himalaya Transverse Faults and Folds and their Parallelism with Subsurface Structures of North Indian plains: Discussion. - Tectonophysics, 45, 229-237; Amsterdam.
SORGENFREI, Th. (1971): On the Granite Problem and the Similarity of Salt and Granite Structures. -Geologiska Föreningens Förhandlingar, 93, 2, 371-435; Stockholm.
STAZHILO-ALEKSEJEV, K. F., CHMYRIOV, V. M., MIRZAD, S. H., DRONOV, V. I. & KAVARSKIY, A. Kh. (1973): The Main Features of Magmatism of Afghanistan. - In: Ministry of Mines and Industries of the Republic of Afghanistan. Dept. of Geological Survey (Ed.): Geology and Mineral Resources of Afghanistan. Edition 1, 31-43; Kabul.
Geological Mapping of Remote Mountainous Regions 149
STAZHILO-ALEKSEJEV, K. F., DRONOV, V. I., KALIMULIN, S. M., KAVARSKIY, A. Kh., KATCHESKOV, A. Yu., MIRZAD, S. H., SALAH, A. S., SPORSHCHIKOV, I. M., FEOKTISTOV, V. P., CHMYRIOV, V. M. & CHATVAN, M. A. (Comp., 1972): Scheme of Magmatic Complexes of Afghanistan Arrangement. Scale 1 : 2,500,000. - Supplement to: Ministry of Mines and Industries of the Republic of Afghanistan. Department of Geological Survey (Ed.): Geology and Mineral Resources of Afghanistan. Edition 1; Kabul.
TOGLIATTI, G. & MORIONDO, A. (1984): Analysis of the Metric Camera B & W Images over Italy. -Proc. IGARSS '84 Symposium, Strasbourg, ESA Spec. Publ. 215, vol. I: 15-17; Paris (ESA).
U. S. GEOLOGICAL SURVEY (1963): Geology of the North-Eastern Hijaz Quadrangle, Kingdom of Saudi-Arabia, 1 : 500 000. Map I, sheet 205 A. - Reston (USGS).
VALDIYA, K. S. (1976): Himalayan Transverse Faults and Folds and Their Parallelism with Subsurface Structures of North Indian plains. - Tectonophysics, 32, 353-386; Amsterdam.
WOLFART, R. & WITTEKINDT, H. (1980): Geologie von Afghanistan. - 500 p. ; Berlin - Stuttgart (Borntraeger).
WORLD BANK (Resource Planning Unit, 1980): Nepal. Scale 1 : 500 000. (Satellite Image Map). - 2 sheets (E and W), Washington, D. C. (World Bank).


