Geological Fieldwork 1983 - British Columbiacmscontent.nrs.gov.bc.ca/geoscience/Publication... ·...
270
Geological Fieldwork 1983 a summary of field activities of the geological branch, mineral resources division Paper 1984 -1 Province of British Columbia Ministry of Energy, Mines and Petroleum Resources
Transcript of Geological Fieldwork 1983 - British Columbiacmscontent.nrs.gov.bc.ca/geoscience/Publication... ·...

Geological Fieldwork 1983
a summary of field activities
of the geological branch,
mineral resources division
Paper 1984 -1
Province of British Columbia Ministry of Energy, Mines and Petroleum Resources

British Columbia Cataloguing in Publication Data
Main entry under title: Geological fieldwork. -- 1974-
(Paper, ISSN 0226-9430) Annual. Issuing body varies: 1974-1980, Geological Division;
1981- , Geological Branch.
Ministry of Energy, Mines and Petroleum Resources) Subseries, 1979- , of: Paper (British Columbia.
A summary of field activities of the Geological Division, Mineral Resources Branch."
I ,
ISSN 0381-243X = Geological fieldwork
1. Geology - British Columbia - Periodicals. 2. Geology, Economic - British Columbia - Periodicals. 3. Mines and mineral resources - British Columbia - Periodicals. I. British Columbia. Geological Division. 11. British Columbia. Geological Branch. 111. British
Resources. IV. Series: Paper (British Columbia. Columbia. Ministry of Energy, Mines and Petroleum
Ministry of Energy, Mines and Petroleum Resources)
QE187.G46 1974 557.11'05
British Columbia Victoria
Canads
January 1984

FOREWORD
This is the tenth year of publication of Geological Fieldwork, a publicatiorl designed to acquaint the interested public with the preliminary results of fieldwork of the Geological
Branch as soon as possible after the field season. The reports are written without the benefit of extensive laboratory or office studies. Figures in this year’s publication were
done by our draughting section.
This edition of Geological Fieldwork continues with the two-section format adopted in 1981 (Geological Branch Paper 1982-1). The Project and Applied Geology section includes reports of metallic and coalfield investigations by Project and District Geologists, and property examinations related to some mineral properties funded in part by Ministry programs. The Other Investigations section consists mainly of reports of work done a t the University o f British Columbia in cooperation with the Ministry.
The cover photograph shows a geologist measuring a section a t the Sullivan horizon in Aldridge Formation rocks in the Purcell Mountains of Southeastern British Columbia.
Output of this publication was coordinated by A. Panteleyev and W. J. McMillan. Manu- script input was by J. Patenaude and layout and design were by D. Fehr of the Publication section. Draughting of the figures in the Project and Applied Geology section of the report was by R. Hoensen. P. Chicorelli, M. Taylor, and J. Armitage of the draughting office.
A. Sutherland Brown, Chief Geologist, Geological Branch,
Mineral Resources Division.
3


TABLE OF CONTENTS
PROJECT AND APPLIED GEOLOGY
1
2
3
4
5
6
7
8
9
10
11
12
13
14
15
16
17
18
19
20
21
22
23
24
25
26
27
28
29
Church. B . N . . Geology and Self-potential Survey of the Sylvester K Gold-Sulphide Prospect Page
(82E12E) . . . . . . . . . . . . . . . . . . . . . . . . . . . . . . . . . . . . . . . . . . . . . . . . . . . . . 7
Church. B . N .. The Farleigh Lake Radioactive Occurrence (82E15W) . . . . . . . . . . . . . . . . . 15
Addie. G . G . . Discussion of Tillicum Mountain Self-potential Test Surveys to Date (82F113) . 19
Addie. G . G .. Amazon Mine (Ainsworth Mining Camp) (82F115) . . . . . . . . . . . . . . . . . . . . 22
Hoy . T . . Structural Setting. Mineral Deposits . and Associated Alteration and Magmatism. Sullivan Camp. Southeastern British Columbia (82F . G) . . . . . . . . . . . . . . . . . . . . . . . 24
Grieve. D . A. . Tonsteins: Possible Stratigraphic Correlation Aids in East Kootenay Coalfields (826115.82J12) . . . . . . . . . . . . . . . . . . . . . . . . . . . . . . . . . . . . . . . . . . . . . . . . . 36
Ray. G . E .. Coombe. S., and White. G .. Harrison Lake Project (92H/5 . 12; 92G/!3) . . . . . . . . 42
Ray. G . E .. Coquihalla Gold Belt Project (92H/ l l . 141 . . . . . . . . . . . . . . . . . . . . . . . . . . 54
McMillan. W . J .. Report on the East Pit of the Highmont Operation (92117E) . . . . . . . . . . . . 67
Smyth. W . R . . Mineral Evaluation Study of the Cluckata Ridge Area. Taseko Lakes Map-Area (92013) . . . . . . . . . . . . . . . . . . . . . . . . . . . . . . . . . . . . . . . . . . . . . . . . . . . . . . 78
Koo. Jahak: The Telkwa. Red Rose. and Klappan Coal Measures in Northwestern British Columbia (93L . M; 104Hl . . . . . . . . . . . . . . . . . . . . . . . . . . . . . . . . . . . . . . . . . . 81
Schroeter. T . G .. AG Prospect (93M17W) . . . . . . . . . . . . . . . . . . . . . . . . . . . . . . . . . . . 91
Schmitt. H . R . . Regional Geochemical Surveys . Hazelton and Manson River MapAreas (93M.N) . . . . . . . . . . . . . . . . . . . . . . . . . . . . . . . . . . . . . . . . . . . . . . . . . . . . . . 93
Kilby. W . E .. Tonsteins and Bentonites in Northeast British Columbia (930. P. I) . . . . . . . . . 95
Kilby. W . E . . The Character of the Bluesky Formation in the Foothills of Northeastern British Columbia (930. P . I) . . . . . . . . . . . . . . . . . . . . . . . . . . . . . . . . . . . . . . . . . . . . . . 108
Kilby. W . E .. A Useful Micro-computer Program . . . . . . . . . . . . . . . . . . . . . . . . . . . . . . . 113
Legun . A. . Stratigraphic and Depositional Relationships between the Bluesky Marker Unit. Gething Marine Tongue. and Upper Coal Measures of the Gething Formation (930. P) . . 117
Legun. A. . Butler Ridge Map.Area. Peace River District (94B/1) . . . . . . . . . . . . . . . . . . . . 123
Schroeter . T . G .. Bill Prospect (94E113) . . . . . . . . . . . . . . . . . . . . . . . . . . . . . . . . . . . . 131
Schroeter . T . G .. Toodoggone River Area (94E) . . . . . . . . . . . . . . . . . . . . . . . . . . . . . . . 134
Panteleyev. A. . Stratigraphic Position of ‘Toodoggone Volcanics’ (94E12. 3.6. 7 . 11. 12. 13) . 136
Diakow. L . J .. Geology between Toodoggone and Chukachida Rivers (94E) . . . . . . . . . . . . . 139
Legun. A .. Geologic Reconnaissance of the Wokkpash Park Proposal Area (94KJ . . . . . . . . . 146
Alldrick. D . J . . Geologic Setting of the Precious Metal Deposits in the Stewart Prea (104011) . 149
Alldrick . D . J . and Kenyon . J . M .. The Prosperity/Porter Idaho Silver Deposits (103P113) . . . 165
Maclntyre . D . G .. Geology of the Alsek-Tatshenshini Rivers Area (114P) . . . . . . . . . . . . . . 173
Johnson. W . M .. British Columbia Geochemical Reconnaissance Survey Data Summary . . . . . 185
Hora. 2 . D . and Kwong . Y.T.J.: Industrial Zeolites and Rutile . . . . . . . . . . . . . . . . . . . . . . 211
Hora. Z . D .. Industrial Minerals and Structural Materials . . . . . . . . . . . . . . . . . . . . . . . . 213
5

TABLE OF CONTENTS ICONTINUED)
OTHER INVESTIGATIONS Page
30 Hansen, M. C. and Sinclair, A. J.: A Preliminary Assessment of Zeballos Mining Camp (92L) , . 219
31 Sinclair, A. J. and Bentzen, A.: A Preliminary Report on Resource Estimation using Gridded Geological Data, I: Guichon Creek Batholith 1921/6. 7. 10, 11) . . . . . . . . . . . . . . . . . . 233
32 Goldsmith, L. 8. and Sinclair, A. J.: Triangular Graphs as an Aid to Metallogenic Studies of Polymetallic Vein Deposits.. . . . . . . . . . . . . . . . . . . . . . . . . . . . . . . . . . . . . . . . . 240
33 Sinclair. A. J., Moore, D., and Reinsbakken, A,: Geology of Gyp0 Quartz Vein, Oliver, British Columbia (82Ei4). . . . . . . . . . . . . . . . . . . . . . . . . . . . . . . . . . . . . . . . . . . . . . . . 246
34 Sketchley, D. A,, Sinclair, A. J., and Somerville, R.: Preliminary Report on Wallrock Alteration, Erickson Gold Mine, Cassiar District (104P) . . . . . . . . . . . . . . . . . . . . . . . . . . . . . . . 260
35 Matysek, P. F. and Sinclair, A. J.: Statistical Evaluation of Duplicate Samples, Regional Sedi- ment Surveys, British Columbia. . . . . . . . . . . . . . . . . . . . . . . . . . . . . . . . . . . . . . . 263
6

PROJECT AND APPLIED GEOLOGY
GEOLOGY AND SELF-POTENTIAL SURVEY OF THE SYLVESTER K GOLD-SULPHIDE PROSPECT
(82E/2E)
By B. N. Church
INTRODUCTION
This report gives the results of geological and self-potential geophysical surveys completed on Sylvester K and adjacent Crown-granted claims centred 1.5 kilometres northwest of the Phoenix mine and 5 kilornetres east of Greenwood. The area has experienced an accelerated program of gold exploration, initiated mainly by Kettle River Resources Ltd.
HISTORY
the century when it was first staked. Several hand-dug trenches and a few shallow shafts on pyrite stringers The Sylvester K claim was, until recently. without much mining exploration activity since the beginning of
are the only remnants from the early years of prospecting.
For many years Sylvester K was included in the extensive holdings of the Phoenix Copper Division of The Granby Mining Company Limited. In 1980 control passed to Noranda Mines, Limited and recently Kettle River Resources Ltd. acquired an option interest in the property.
tonnes of ore was shipped to the Trail smelter from the Marshall Crown-granted ctaim. owned b'y San The only production from the immediate area was recorded in the period 1967 to 1!371. A total of 249
Jacinto Explorations Ltd. These deliveries yielded 11.94 kilograms of gold, 14.56 kilograms of silver, 472 kilograms of copper, 2 142 kilograms of lead, and 380 kilograms of zinc.
GEOLOGICAL SETTING
The stratigraphic, lithologic, and structural interpretation of the area is based on numerous scattered out- crops and excavations. The main units are sedimentary rocks of the Triassic Brooklyn Formation, a micro diorite stock and associated dykes, and a number of Tertiary intrusions (Fig. 1). Steeply dipping beds, typical of the area, are the result of important folding and a complicated history of fault movement.
BEDDED ROCKS
The Brooklyn Formation underlies most of the map-area. This is divided into two principal members comprising mainly sharpstone conglomerate a t the base and a limestone sequence above. An argill3ceous transition zone separates these members.
ldegroot
1983

The sharpstone member consists of immature polymictic conglomerate 450 to 600 metres thick. It is characterized by an abundance of purple and grey, pebble-sized, angular chert clasts intermixed with greenstone fragments and accessory jasper, diorite, and limestone. Chemical analysis o f a sample of the conglomerate from Knob Hill near the Phoenix pi t (analysis No. 1, accompanying table) closely resembles the sharpstone conglomerate from Deadman Hill east o f the map-area (see Church, 1976, analysis No. 2, accompanying table). Conglomerate beds are intercalated with green sandstone and siltstone, several limestone lenses, and discontinuous argillite layers. The 'Rawhide shale' is a local, thick shale facies developed near the base of the sharpstone member southeast of the Phoenix mine (analysis No. 2, accom- panying table)
CHEMICAL ANALYSES OF SOME TYPICAL ROCKS FROM THE SYLVESTER K AND PHOENIX AREA
Oxides Recalculated t o 100 SiO, 74.81 TiO, 0.89
9.55 0.83
FeO MnO
4.91 0.06
Ma0 3.69
1
AI, 0 3
Fez 0,
p* os 0.25
Molecular Norms- ClZ
Or 43.9 7 .O
Ab 15.7 Ne 0 .o A" 12.2 WO Ell
0.0 10.4
FS 7.3 Fo 0 .o Fa II
0.0 1.3
Mt Cr
0.9
100.0 1.3
2
68.04 0.81 13.82 0.43 6.81 0.06 4.30 1.07
3.29 1.37
100.00
0.20 2.39
1.60 0.29 0.21
31.2 19.8 12.5 0.0 5.5
12.1 0 .o
10.4 0.0 0 .o
0.5 1.2
6.8 100.0
183E12EI
3
41.05
13.08 0.75
6.74 8.59 0.32 4.49 24.41 0.04 0.53
100.00
0.25 3.82
1.21 1.59 0.20
3.7 3.7 0.3 0 .o 39.0 20.0 14.2 9.8 0 .o 0.0 1.2 8.1
100.0 0.0
4
54.19
15.64 0.37
6.42 1.12
0.13
10.39 8.49
0.64 2.61
I 00.00
2.41
10.10 0.1 1
0.16 0.20
3.7
23.7 3.8
29.5 0.0
23.8 4.5
9.3 0.0 0.0 0.5 1.2 0.0
100.0
5
63.12
15.43 0.91
2.38 2.73 0.08 3.30 4.67 3.33
100.00 4.05
0.29 1.78
1.80 0.01 0.28
24.0 13.6
30.0
15.3 0.0
1.6 9.1
0.0 2.6
0.0 1.3 2.5 0.0
100.0
6
60.23 1.25 18.17
4.29 0.56
0.09 1.59 1.95 4.92
100.00 6.95
0.54 1.86
0.55 0.01 0.21
0.0 40.2 40.7 1.5 6.9 0.5 0.0 0.0 3.3 4.6
0.6 1.7
0.0 100.0
2 -Rawhide Shale ITriarric), 500 metres south o f Snowshoe Pit in rock cut on main haulage 1 - Sharpstone conglomerate (Triassic), from upper north slope o f Knob Hill.
4 - Microdiorite (JurarricICretaceous ?I, cutting Triassic beds 1.5 kilometres southeast o f 3 - Skarn from routheart corner of Snowshoe pit.
5 - Pyroxene-feldspar porphyry (Tertiary), from Observatory Hill 700 metres north of Phoenix
6 ~ Feldspar porphyry (Tertiary). 500 metres southeast of Phoenix pit.
road.
Phoenix p i t ,
pit.
The base of the sharpstone section in the map-area is apparently a low angle fault a t a vertical depth of about 150 metres (see diamond-drill hole No. 20, Fig. 1 ) . Here the contact of the conglomerate is marked by fault gouge and crushed grey chert of the basement complex. A similar relationship, obscured somewhat
8

Figure 1. Geology and self-potential survey of the Sylvester 'K'goldsulphide prospect 182E/2EI
The sharpstone member passes upward into a 60-metre-thick transitional zone of lnassive argillite with
conglomerate with carbonate bands. The argillite of this transition zone may correlate with the 'footwall lenses of carbonate, layers of banded argillite and siltstone, and beds of mature sandslone and chert pebble
argillite' of the Phoenix pit.
The Brooklyn limestone member is best exposed in the central and northern part of the map-area. It con- sists mainly o f massive limestone, several hundred metres thick, with some intercalations of argilli1:e such
9

as near the road to Providence Lake by the east boundary of the map-area. East of the map-area, strati- graphic relationships are unclear. There the Brooklyn limestone is apparently succeeded upward by another layer of sharpstone conglomerate, followed in turn by 'Stemwinder' limestone breccia. The Stemwinder is a peculiar, blocky breccia possibly related to a late volcanic episode cogenic with the Upper Triassic Eholt Formation seen near the Oro Denoro mine several kilometres to the east (Church, 1976, p. 4).
IGNEOUS INTRUSIONS
The main igneous intrusion is an irregular microdiorite stock several hundred metres in diameter exposed just south of Providence Lake. This is a greenish grey rock with a fine, even-grained texture. Thin.section studies show a predominance of rectangular, clay-altered plagioclase cyrstals, 0.5 to 1.5 millimetres in diameter, intermixed with a scattering of chloritized amphibole laths set in a matrix of altered feldspar, ferromagnesian minerals and a minor amount of quartz. Epidote is present in variable amounts, up to
plagioclase crystals. 10 per cent, occurring mostly in replacements of the ferromagnesian minerals and the calic cores of some
Porphyritic grey dykes. found scattered widely throughout the maparea, appear to be offshoots of the Providence Lake microdiorite body. These rocks are fine grained with conspicious needle-like prisms of black amphibole 2 to 6 millimetres in length. In thin section, crowded, rectangular, and polygonally zoned plagioclase 0.5 to 1 millimetre across is mixed with subhedral amphibole prisms and glomeropheno- crysts of magnetite and amphibole (-15 per cent) in a matrix of altered feldspar, chlorite, magnetite, and epidote.
Other significant microdiorite intrusions lie east of Providence Lake and near Hartford junction, 1.5 kilo- metres southeast of the Phoenix pit. Chemical analysis of a sample from the Hartford location is given in the accompanying table (No. 4). The age of the microdiorite is believed to be similar to the Greenwood batholith which has been dated by KIAr methods a t 125 to 140 Ma (Church, 1974, p. 49; 1976, p. 5).
Tertiary intrusions include a wide variety of pulaskite, pyroxene, and feldspar porphyry sills and dykes, many of which have been intersected in drilling. These rocks are generally fresh and show little sign of faulting or metamorphism. They follow fractures, are irregular in outline and dip, and commonly change orientation abruptly.
An irregular pyroxene-feldspar porphyry is the largest Tertiary intrusion. It cuts the Brooklyn Formation in the southeast part of the map-area. The rock is brownish with scattered cream-coloured polygonal feldspar phenocrysts and dark green augite subhedra. In thin section, augite (-5 per cent). zoned plagio- clase crystals (15 per cent), and glomerophenocrysts, t o 4 millimetres in diameter, are set in a matrix of
analysis of a sample of this rock from the hill east of the maparea is given in the accompanying table interlocking alkali feldspar, plagioclase, and accessory biotite, quartz, magnetite, and apatite. Chemical
(No. 51.
A Tertiary feldspar porphyry intrusion 0.5 kilometre southeast of the Phoenix pit is an alkaline, two- feldspar rock with no visible or normative quartz (see analysis No. 6, accompanying table). This dyke-like body intrudes a major gravity fault marking the contact between Early Tertiary sedimentary and volcanic rocks and skarnified sharpstone conglomerate.
STRUCTURAL GEOLOGY
The area in vicinity of the Phoenix pit and extending beyond Providence Lake and the Sylvester K prospect is an easterly tilted half-graben structure. Vertical displacements ranging to several hundred metres occur on some of the northlsouth and eastlwest bounding gravity faults. This structure, which is known to be of Early Tertiary age and has been extensively intruded by Tertiary dykes, is superimposed on folded and faulted rocks of the Brooklyn Formation.
10

According to Fyles (1982, Assessment Report 10 632. pp. 3-16] early deformation of the Brooklyn strata
a gently northwest-dipping easterly limb. The axis of this fold, which plunges 10 to 15 degrees to the resulted in formation of an asymmetrical syncline with a vertical northerly trendinp westerly limb and
north-northeast, passes east of the Sylvester K map-area to be intercepted by the Snowshoe fault north of Providence Lake. The Snowshoe fault is a major southeasterly trending low angle thrust or tear fracture displaced by the Tertiary graben structure.
Important faulting also occurs where the Brooklyn beds are exposed on the steep west limb of the syn- cline. For example, an eastlwest-trending left lateral strike slip fault on Providence Creek offsets the sharpstone and limestone contacts approximately 120 metres. Low angle faulting is also revealed by the drill results, where pre.Triassic basement rocks were intercepted a t relatively shallow depth.
MINERALIZATION
Discovery of significant mineralization on the Sylvester K claim was announced by Kettle River Resources
gold-bearing pyrite beneath 3.4 metres of soil and gossan. Ltd. on October 18, 1982. Backhoe trenching of a strong VLF electromagnetic anomaly revealed a zone of
Previously, the area seemed unpromising for exploration, except for pyrite in old pits where grab samples assayed as much as 0.26 ounce of gold. The only other encouraging evidence wa!, a private report by W. H. White, dated September 1950, which outlined a copperlzinc biogeochemical anomaly close to the New York Crown-granted claim boundary near the present discovery.
Trenching has revealed a zone of massive sulphides exposed intermittently over a total length of 160 metres. The zone attains a thickness of more than 2.5 metres, dips steeply to the east, and strikes 015 degrees azimuth (see Fig. 1 and Plate 0. The mineralization appears to be concordant with transitional strata between Brooklyn limestone and sharpstone conglomerate.
The following is a brief description of core from diamond-drill hole No. 6 which is rnidway on the zone:
THICKNESS IN METRES DESCRIPTION
DRILL COLLAR
> 12.0 0.6
Grey sandstone and conglomerate with carbonate matrix -some r u t on joints
3.6 Mottled massive argillite with orbicular structures Light-coloured sandstone and some conglomerate with well-rounded chcrt pebbles
2.0 1.2 Hornblende porphyry diorite dyke
Chert pebble conglomerate with acce6sory Clasts Of varied cOmpOSition 3 .O Chert sandstone and grit 2.3 Limestone wi th many sesame reed-like chert grains 3.0 0.6
Mars~ve grey, silccarich limestone Hornblende porphyry diorite dyke
5.2 1.8
Banded argillite with a few pyrite bands White hard limestone with mosaic pattern of small cracks
0.6 Mottled pyritic argillite 1 .2 Calcarenite with thin greenish argillaceous band 3 .O Zone Of massive rulphider (mostly pyrite) with some argillaceour impurities 9.4 Light brown to grey massive argillite with orbicular structures and many joints with thin
>25.6 Hornblende porphyry diorite dyke with xenoliths of chert and epidotixd argillite seams of p y r m
75.1 metref total thickness of strata in diamond-drill hole NO. 6
According to company reports, assay results on the 3-metre intersection of massive sulphide in dri l l hole
yielded 5.6 metres assaying 9.12 grams per tonne gold, 7.54 grams per tonne silver, and 0.14 per cent No. 6 yielded 11.96 grams per tonne gold. A t surface on baseline 200N. sampling acloss the sulphide zone
copper. In the same area the footwall argillite assayed 1.99 grams per tonne gold and 3.77 grams per tonne silver across 18.0 metres.
11

Plate I. Discovery trench on Sylvester K massive sulphide zone
The mineralogy of the ore zone is simple. Pyrite, the principal sulphide, is accompanied by accessory
formed early from warm mineralizing solutions and marcasite developed later in a cooler environment. pyrrhotite and marcasite, and trace amounts of chalcopyrite. In paragenetic sequence, pyrrhotite probably
Gangue minerals include carbonates, quartz, and chlorite. These are intermixed with sulphide grains or interbanded forming lenticular masses.
Secondary alteration by oxidation and groundwater action produced a limonite-goethite cap several metres
oxidation of newly exposed pyrrhotite and marcasite in the trench produces a white powdery coating con- thick above the ore zone. Trenching of this gossan has revealed peculiar Karst-like cave structures. Rapid
sisting of a mixture of rozenite and melanterite.
12
In a similar setting, the San Jacinto sulphide zone, 120 metres west of Providence Lake on the Marshall Crown-granted claim, contains an even wider range of minerals. which includes magnetite, specularite, galena, garnet, epidote, and amphibole.
The targets for mineralization are thin limestone beds in the transition zone, exemplified by the Sylvester K and San Jacinto prospects, and limestone lenses in the sharpstone unit which host the 'Timer' and
and Burt (1982). Accordingly, it i s theorized that the metasomatic fluids followed the course of th,? micro- Marshall shaft prospects. These are classified as calcic exoskarn deposits following the system of Einaudi
diorite dykes into the stratigraphic pile then infiltrated bedding planes. Recrystallization of the cabonate
eventual wholesale replacement. units by these warm fluids produced granular or sugary textures that facilitated further infiltra1,ion and
The effect of the mineralizing solutions on wallrocks of the ore zone is well displaved on the Sylvester K claim. For example, the footwall argillite on line 200N. which is normally pale green, has been transformed into a light brown fine-grained biotite-bearing hornfels. Here numerous thin pyrite stringers carry gold and silver values for more than 10 metres outward from the massive sulphide zone. In other areas, chlorite and hematite are common on joints and cracks in the host rocks.
Diffusion metasomatism in the argillite i s manifest by reaction of the host with carbonate clasts. In this pro- cess the clasts are transformed to orbicular or ameboid-shaped structures, 0.5 to 2 centimetres in diameter, with carbonate-epidote cores and tremolite-actinolite rims. The argillite consists of very fine-grained quartz. feldspar, biotite, and small amounts of pyrite and chlorite. In some orbicular structurc?s pyrite has formed in the cores together with calcite and epidote.
The source of the mineralizing solutions is believed, by some Kettle River geolo~~ists, t o be the micro- diorite, although exposures of this rock are small and no significant mineralization is visible ,south of Providence Lake where it intrudes the Brooklyn limestone. However, considering the wide distribution of microdiorite in the area, including the broad distribution of related dykes. it is oossible that the main parent plutonic body lies a t depth.
A volcanogenic origin of the mineralization has been considered and dismissed by K. Dawson of the Geolog
this theory is calc-silicate assocation and textural features pointing to infiltration and replacement by ore ical Survey of Canada who visited the area with the writer. The principal lines of evidence arguing against
solutions. N o 'tuff' or 'vent rocks' have been identified with confidence by the writer in the immediate area.
SELF POTENTIAL SURVEY
A self-potential survey was completed covering the Sylvester K prospect and adjoining areas southwest of Providence Lake. Where the targets are conducting massive sulphide bodies such as the Sylvester K
useful exploration tool in delineating buried mineralization. discovery or Phoenix-type deposits, the self-potential geophysical method is known to be a particularly
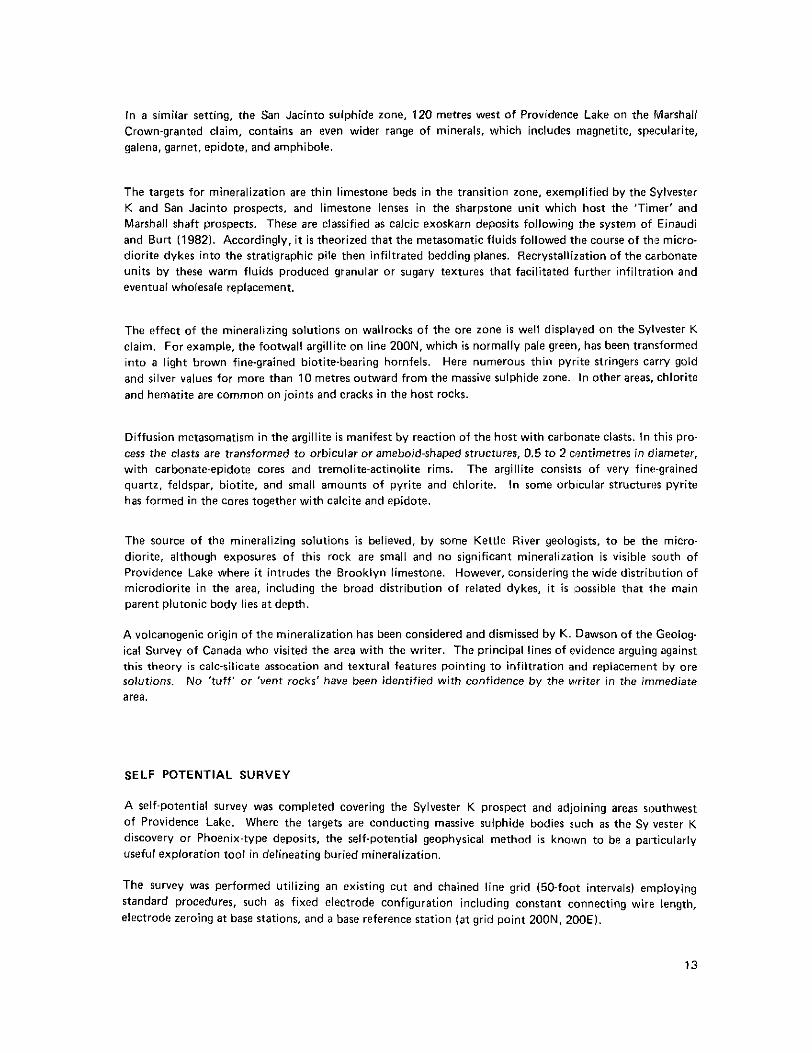
The survey was performed utilizing an existing cut and chained line grid (50-foot intervals) employing standard procedures, such as fixed electrode configuration including constant connecting wire length, electrode zeroing a t base stations, and a base reference station ( a t grid point 200N. 200E).
13

The results from 324 stations surveyed show a range of values, mostly between -8 and +39 on the milli- volt scale. The lowest readings obtained all coincided with sulphide mineralization:
PROSPECT READING
Sylvester K -329 Sam Jacinto Timer
-215 -1 94
Marshall shaft -262
To illustrate the main results, isopotential contours a t 0 and -50 millivolt levels were drawn from the grid and superimposed on the geological map (Fig. 1).
The survey shows two northerly trending anomalies which coincide with Sylvester K prospect, in the central part of the map-area, and the Timer zone about 100 metres to the northwest. The Timer anomaly is especially interesting because it suggests buried mineralization extending over a length of about 150
of sulphides from a trench near the south end of the Timer zone yielded assay results ranging to 5.1 grams metres, approximately the same size as the Sylvester K prospect. According to company reports, sampling
per tonne gold across a 3-metre width.
On the north, the Timer anomaly points beyond the survey grid area toward the San Jacinto deposit. A connection here would almost double the estimated length of the inferred mineralized zone, however, this projection would transgress local stratigraphy and the Providence Creek fault lineament. Alternatively. the Timer zone might be displaced by faulting about 120 metres t o the west, which would result in general alignment with the Marshall shaft prospect. In either case, the self-potential results show that the area holds additional opportunities for exploration.
ACKNOWLEDGMENTS
Many thanks for assistance in conducting this study are owing officers of Kettle River Resources Ltd., including Dr. J. T. Fyles, G.O.M. Stewart, W. Gilmour, and K. Daughtry. Mr. G. Addie of Nelson was especially helpful in loaning self-potential equipment and offering professional advice on implementing the surveys. Advice and assistance were also rendered by Dr. K. Dawson. metallogenist with the Geological Survev of Canada.
REFERENCES
B.C. Ministry of Energy, Mines & Pet. Res..' Assessment Reports 809. 827. 882. 10 613, 10 632, 11 119. Church, E. N. (1976): Geology in Vicinity of the Oro Denoro Mine, B.C. Ministry of Energy, Mines &
Einaudi, M. T. and Burt, D. M. (1982): Terminology, Classification, and Composition of Skarn Deposits,
Minister of Mines, B.C.: Annual Reports 1905, p. 176; 1938, p. D38. 1948, p. 128; 1967, pp. 228-230; McNaughton, D. A. (1945): Greenwood-Phoenix Area, Geol. Surv.. Canada, Paper 45-20.
Seraphim, R. H. (1956): Geology and Copper Deposits of the Boundary District, B.C., C.I.M., Bull., Vol.
White, W. H. (1950): Copper and Zinc Content of Trees -Phoenix, private report.
Pet. Res., Geology in KC., pp. G1-G13.
Econ. Geo/., Vol. 77, No. 4, pp, 745-754.
1968, p. 232; 1969, p. 305; 1971, p, 376; 1973, p. 40.
49, No. 3, p. 684.
14

THE FARLEIGH LAKE RADIOACTIVE OCCURRENCE (82€/5W)
By B. N. Church
INTRODUCTION
the time of the Provincial moratorium on uranium exploration. Work completed to 1980 by Petro Canada The Farleigh Lake area, 11 kilometres west of Penticton, was a focus of interest and investigation up until
Exploration Inc. included 40 kilometres of linecutting on the Astro claim, that was followed by geochem- ical and geophysical surveys, then a program of diamond drilling. The targets of this activity were radio- active areas in basal Tertiary beds.
GEOLOGICAL SETTING
The Farleigh Lake area is underlain by an eroded JurassicCretaceous granitic complex that is partly covered by basal Tertiary volcanic and sedimentary rocks. The Kettle River Formation is the oldest Tertiary unit and consists of granite boulder conglomerate. arkose, and rhyolite tuff that unconformably overlies the granite. Disconformably above this are purple and grey volcanic rocks, wackes. and siltstone; of the
trachytes of the Nimpit Lake Member of the Marron Formation and dacitic lavas and feeder dykes of Yellow Lake Member of the Marron Formation. These units are succeeded upward by slightly wunger
the Marama Formation (see Fig. 2 and accompanying table).
Structurally, the area is relatively simple. The Tertiary beds are inclined gently to the south and southwest, dipping outward from the granite complex. which is exposed in the north and north-central part of the map area. Important gravity movement occurred east of the Marron Valley fault which slices north-northwest across the eastern part of the map-area. A number of subsidiary faults, marked by minor movement and lineaments, intersect the granite complex and the Tertiary rocks.
RADIOACTIVE ROCKS
During the course of the geological survey of the map-area, 39 stations were established to meawre the radioactivity of the various rock types. This was achieved using a portable gamma ray scintillometer (Geo MetricsIExploranium Model GRS-101) which yielded the following results:
ROCK TYPE ME-AN
X STANDARD NUMBER OF DEVIATION
CPS
SAMPLES CPS
Yellow b k e Member Volcanic Rocks 1 59 30 Sedimentary Rocks
31
15
4 Wacke. shales 213 Pink grit
Kettle River Formation
300600 _. ."
Rhyolite tuf f 100 34 5 Conglumerate and arkore 162 " 3
Granitoids 83 21 12
Clearly the most radioactive rocks are the pink grits. These occur as a subunit wilhin wacke-shale lenses intercalated in the Yellow Lake alkaline volcanic assemblage. In the Kett le River Formation. the conglom- erates and arkosic beds are more radioactive than the rhyolite tuffs.
15
ldegroot
1983

Figure 2. The Farleigh Lake radioactive occurrence (82E/5W)
16

FROM THE FARLEIGH LAKE AREA CHEMICAL ANALYSES OF ROCKS
182E/5W1
1 2 3 Oxides Recalculated to 100- SiO, TiO,
76.16 62.57 0.38
56.09 0.68 1.04
16.19 18.60 16.43 1.77 3.30 4.51 0.32 1.58 1.97 0.03 0.10 0.47
0.10 1.21 4.52
A l l 0 3 Fez 0 3 FeO MnO Ma0 cao
~
Na, 0 K, 0
0.35 0.58 4.52
1.49 6.17 3.84
100.00 3.75 5.95
100.00 5.33
100.00
Oxides as Determined - H,O+ H,O-
s
3.12 0.26
1.74 0.38 0.48
1.02
0.01 0.25
0.01 0.01 0.36
cox 0.25 0.25
p* 0, 0.30 0.09
4
58.48
20.25 0.76
2.97 1.29 0.11
4.58 1.70
4.42
100.00 5.44
0.69 1.06 0.31 0.01 0.34
Key t o Analvres: 1 -Rhyol i te tuff breccia from Kettle River Formation. 3 kilo-
metres northwest of Farleigh Lake.
3 - Mafic phonolite lava from Yellow Lake Member, 400 metres 2 - Radioactive tuff . Skaha Creek area.
west of south end of Farleigh Lake. 4 -Clarke Butte sill. Yellow Lake Member. 3 kiiometrer north-
west o f Farleigh Lake.
Pink grit is best exposed in the section near the Petro-Canada drill hole immediately west of the north end of Farleigh Lake. Here the beds are 30 metres thick. They occur below the lowest mafic phonolite lavas of the Yellow Lake Member and overlie tuffaceous sandstones and siltstones. The grit is 'well layered, however.
caused by numerous broken alkali-feldspar crystals and pebbles of feldspathic rhomb porphyry lava. Where it displays few examples of grading, crossbedding, or scour structures. The pink colour of this rock is
the grit is most deeply eroded several tuffaceous layers and a few very thin coal seams, 1 to 3 centimetres thick, are exposed.
In the Petro-Canada drill hole, 200 metres west of the exposed section, the grit diminished in thickness to only 3.8 metres, perhaps indicating that it is a channel deposit. According t o company reports, assay
seam gave 65 ppm uranium) and 185 ppm thorium. The drill hole intercepted the K e t t l e River Fotmation results on core yielded an average of 29 ppm uranium and 110 ppm thorium. A single sample frorn a coal
glomerate. Although no assay resultsareavailablefrom thiscore, grabsampleselsewhereareencouraging. For below the Yellow Lake Member. The hole cut 46 metres of rhyolite breccia resting on 29 metres of con-
example, trenching in the Kettle River conglomerate and arkose by Brinco Mining Limited, imms?diately south of Brent Lake t o the north of the map-area, produced surprising assay results it? the range of 1 to 1.5 per cent U30s on samples from a thin carbonaceous seam.
DISCUSSION
Basal units of the Early Tertiary assemblage are the source of radioactive anomalies and have provided interesting targets for uranium exploration. The pink grit, near the base of the Yellow Lake Member of the Marron Formation, is unusual in that the unit appears to represent a channel deposit of reworked alkaline ash and ash flow material. The source of this material could be the Riddle Creek radioactive ,volcanic
17

centre several kilometres to the northwest. The boulder conglomerates and arkose of the Kettle River
granitoid complex. In the future the Penticton area may provide a unique opportunity for investigation Formation are more in keeping with the 'basal uranium' model where the metal source is the underlying
of these two diverse, yet spatially related, uranium-thorium occurrences.
REFERENCES
Eoyle, D. R. and Ballantvne, S . 6 . (19801: Geochemical Studies of Uranium Dispersion in South-Central
Brown. H., Hopkins, H., Racicot, F., Salazar, G., Spencer, W., and White, G. (1980): The 1979Program. British Columbia, C.I.M., Bull., Vol. 73, No. 820, pp. 89.108.
Church, 8. N. (1980): Anomalous Uranium in the Summerland Caldera, B.C. Ministry of Energy, Mines& Astro Claim - Farleigh Lake Area, Petro-Canada Exploration lnc., private company report.
........_. (1982al: The Riddle Creek Uranium-Thorium Prospect, 6.C. Ministry of Energy, Mines & Pet. Res., Pet. Res., Geological Fieldwork, 1979, Paper 1980-1. pp. 11-15.
....._._.. (1982b): Preliminary Geological Map of the Penticton Tertiary Outlier, 6.C. Ministry of Energy, Geological Fieldwork, 1981. Paper 1982-1, pp. 17-22.
Church, 6 . N. and Johnson, W. M. (1978): Uranium and Thorium in Tertiary Alkaline Volcanic Rocks in Mines& Pet. Res., Prelim. Map 35, revised May 1982.
Culbert, R. R . and Leighton, D. G. (1978): Uranium in Alkaline Waters, Okanagan Area, British Columbia, South-Central British Columbia, Western Miner, Vol. 51, No. 5, pp. 33, 34.
Salazar, G. (1978): Okanagan Uranium Program, White Lake Basin - Astro Claims, 1978 Field Season C.I.M., Bull., Vol. 71, No. 783,pp. 103-110.
Report, by Pacific Petroleums Ltd., 6.C. Ministry of Energy, Mines & Pet. Res., Assessment Report 7095.
18
DISCUSSION OF TlLLlCUM MOUNTAIN SELF-POTENTIAL TEST SURVEYS TO DATE
(82F/13)
By G. G. Addie
INTRODUCTION
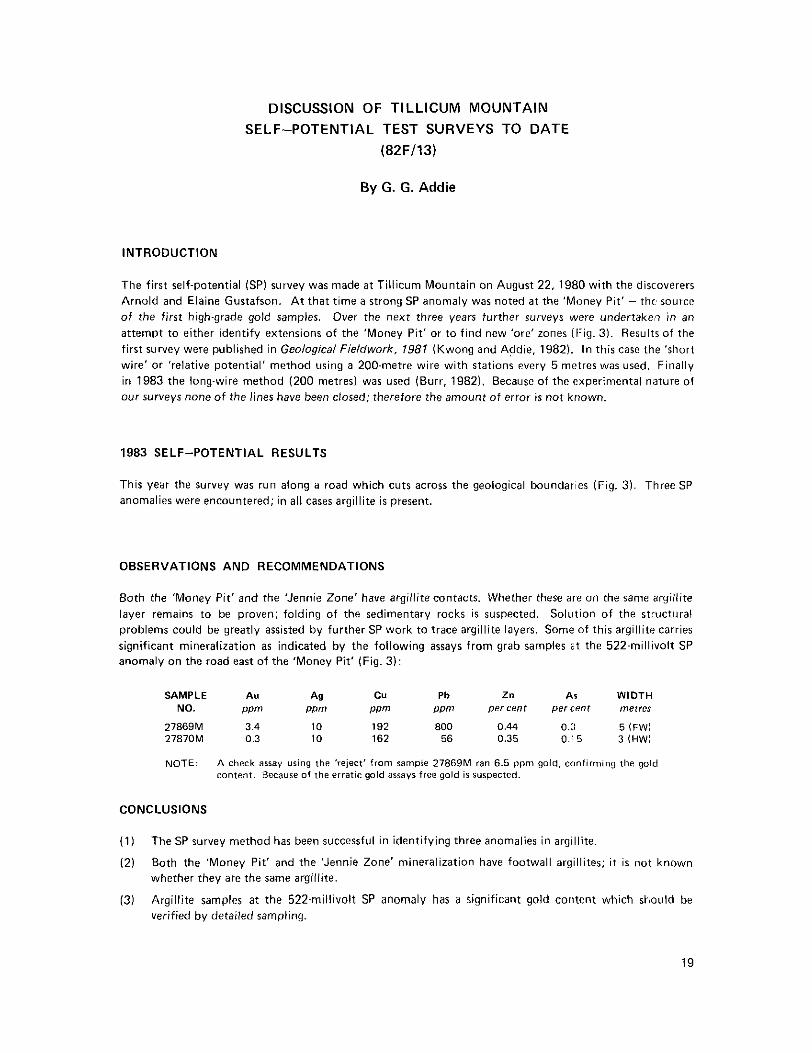
The first self-potential (SP) survey was made at Tillicum Mountain on August 22, 1980 with the discoverers
of the first high-grade gold samples. Over the next three years further surveys were undertaken in an Arnold and Elaine Gustafson. A t that time a strong SP anomaly was noted at the 'Money Pit' - the source
attempt to either identify extensions of the 'Money Pit ' or to find new 'ore' zones (1-ig. 3). Results of the first survey were published in Geological Fieldwork, 1981 (Kwong and Addie, 1982). In this case the 'short wire' or 'relative potential' method using a 200-metre wire with stations every 5 metres was used. Finally in 1983 the longwire method (200 metres) was used (Burr, 1982). Because of the experimental nature of our surveys none of the lines have been closed; therefore the amount of error is not known.
1983 SELF-POTENTIAL RESULTS
This year the survey was run along a road which cuts across the geological boundanes (Fig. 3). Three SP anomalies were encountered; in all cases argillite is present.
OBSERVATIONS AND RECOMMENDATIONS
Both the 'Money Pit' and the 'Jennie Zone' have argillite contacts. Whether these a te on the same argillite layer remains to be proven; folding of the sedimentary rocks is suspected. Solution of the stwctural problems could be greatly assisted by further SP work to trace argillite layers. Some of this argillite carries significant mineralization as indicated by the following assays from grab samples a t the 522-millivolt SP anomaly on the road eas t o f the 'Money Pit' (Fig. 3):
SAMPLE AU NO. w m PDm
C" Pb 2" PDm
A9
DPm WIDTH
percent percent metres
27669M 3.4 0.2 5 IFW1 27870M
10 0.3
192 10
600 162
0.44 56 0.35 0.'5 3 (HW1
NOTE: A check a ~ s a ~ using the 'reject' from sample 27869M ran 6.5 p p m gold, confirming the gold
Ag
content . Because of the errat ic gold assays free gold is Suspected.
CONCLUSIONS
(1) The SP survey method has been successful in identifying three anomalies in argillite
(2) Both the 'Money Pi t ' and the 'Jennie Zone' mineralization have footwall argillites; i t is not known whether they are the same argillite.
(3) Argillite samples at the 522-millivolt SP anomaly has a significant gold content which should be verified by detailed sampling.
19
ldegroot
1983

TILLICUM MTN. -7.00
Figure 3. Tillicum Mountain self-potential survey map (8ZF/131
20

REFERENCES
Burr, S.V. (1982): A Guide to Prospecting by the Self.Potential Method, Ontario Geol. Surv.. Miscel-
Kwong, J. and Addie, G. G. (1982): Tillicum Mountain Gold Prospect. B.C. Ministry of Energy, Mines&
Lajoie, J. J. and Thornton. J. M. (1980): S.P. Surveying Notes and Operational Hints, B.C. Mhistry of Pet Res., Geological Fieldwork, 1981, Paper 1982-1. p. 42.
Energy, Mines & Pet. Res., Geophysical Class Notes, Fourth Annual Mineral Exploration Course for Prospectors. pp. 18-20,
laneous Paper 99, p. 5.
21

I I I
Figure 4. Amazon mine (Ainsworth Mining Camp1 (8ZF/15)
22

AMAZON MINE (AINSWORTH MINING CAMP)
(82F/15)
By G. G. Addie
GENERAL
The Amazon mine (Mineral Inventory 82FiNE-7) has been converted to an excellent mining museum by Mr. David May. The only map available of the mine was a partial map signed 'W.M.S.' dated July 20. 1953. We completed this survey using the 'Road Runner Underground Survey' method; a one-man survey pro- cedure with the same accuracy as the traditional chain and compass method (Fig. 4).
GEOLOGY
graphically the mineralization is in dolomitized Lardeau Group metamorphic rocks (Middle Cambrian to The geology of the area and the Amazon mine is well described by Fyles in Bulletin 53 11967). Strati-
Ordovician in age). The intrusions (lamprophyre) and veins are believed to be Tertiary. The f'xtent of dolomitization is not known. The presence of tin in the assays suggests a genetic association with granite. Perhaps a magnetic anomaly on the east side of Woodbury Creek represents a subsurface granltic plug. If so, this area should be prospected for vein and replacement deposits.
We only have four observations to add to the description of Fyles (1973):
( 1 ) The veins are tension veins. (2) The rake of the 'ore' is suspected to be steeply to the southeast as defined by a stope (3) The veins are post-lamprophyry (believed to be Tertiary in age), (4) The garnet schist contains meta-autunite.
ASSAYS
Laboratory Submitters NO.
27600M' 051083-1 c0.3 <10 0.38 2.92 10310N 505w
PPrn Mark Au Ag Pb
Per ceric 2" Location
~~
27601 M -2 t .25 2.83 11085N 6,22W <0.3 <10 27602M - 3 27603M
<0.3 <10 -4
350 PPm 4.57 11075N 537W
27604" <0.3 <10 450 ppm 700 P D ~
051 283 <0.3 85 10.5 3.8 11790N 610W 11070N 6OOW
~~
'Sn = 0.3 per cent
REFERENCE
Fyles, J.T. (1967): Geology of the Ainsworth.Kaslo Area, British Columbia, 6.C. Ministry 01' Energy, Mines 8, Pet. Res.. Bull. 53, 125 pp.
23

PHANEROZOIC 0 Undifferentiated
White Creek batholith
HELIKIAN-PURCELL SUPERGROUP j - . j Van Creek, Nicol Creek and younger
Creston and Kitchener
Aldridge / Fort Steele
Thrust fault ..................................... Normal fault .................................. P Anticlinal fold ................................ 4
Figure 5 . Regional geological map showing location of Sullivan deposit.
24

STRUCTURAL SETTING, MINERAL DEPOSITS, AND ASSOCIATED ALTERATION AND MAGMATISM
SULLIVAN CAMP, SOUTHEASTERN BRITISH COLUMBIA
(82F. G)
By T. Hoy
INTRODUCTION
The Sullivan deposit i s a large, essentially stratiform lead-zinc-silver orebody in late Proterozoic Aldridge Formation turbidites in southeastern British Columbia. It is located near the eastern margin of tht? Purcell anticlinorium, just west of the Rocky Mountain Trench (Fig. 5). It has been the focus of a number of recent studies. including i ts geology (Hamilton, et a/., 1982, 1983; Hamilton, in press), structure (McClay, 1983). alteration (Shaw, in preparation), and isotopic signature (Nesbitt, et a/., 1982; Campbell, et a/.,
on fieldwork in 1982 and previously published maps by Schofield (1915). Rice (19371, and Leech (1958. 1978). Recently regional geology in the vicinity of the deposit has been described by Hoy (1983, based
1960).
The purpose of this paper is t o describe in more detail geology in the immediate ,vicinity of the Sullivan mine. The report focusses on the structural setting of Sullivan and describes a n?gional Sulliva!? 'camp' alteration zone. As well, evidence is presented which suggests that the thick accumulation clf Movie gabbroic sills within the Aldridge Formation is a magmatic event in Lower Aldridge and early Middle Ald- ridge time, in part prior to lithification of the sedimentary pile, rather than a post-lithification intrusive event.
STRUCTURE
The structure in the vicinity of the Sullivan deposit is dominated by two prominent fault sets that cut shallowplunging broad open folds. Sullivan-type faults trend north to northeasterly (Fig. 6 ) , dil2 steeply to the west, and generally have normal, west-side-down offsets of a few tens of metres (faults a, b, c, d.
they may in fact involve cumulative movements on a number of smaller northeast-trending faults as shown Fig. 7) (Hamilton. e r a / . , 1983: McClay, 1983). Those east of the deposit (c, d ) are drawn schematically;
on Figure 2.4 of Hamilton, et a/. (1983). Sullivan-type faults cut a number of east-west-trending. north-
deposit a t depth (Hamilton, personal communication, 1983). It has an apparent rset normal displacement dipping faults. The most prominent of these, the Kimberley fault, cuts the north fringes of the Sullivan
against Middle and Lower Aldridge rocks (Fig. 6 ) . of at least 2 500 metres (Hamilton, et a/., 1982; McClay, 1983) and juxtaposes Cl-eston Formation rocks
A steep, generally west-dipping cleavage is prominent throughout the area. The cleavage is widely spaced (approximately 5 centimetres) in competent quartz wacke beds, is more closely spaced in siltites. and
The cleavage is axial planar to broad, generally open folds (illustrated in the sections of Fig. 711. South- locally comprises a penetrative foliation in phyllite (near the southwest corner of tl?e map-area, see Fig. 6).
west of Sullivan on North Star Hill (domain 1. Fig. 8). folds are locally tight with fold hinges that plunge variably to the north or !;outh. In general, however, bedding i s relatively flat lying to east dipping, cleavage dips steeply west, and beddinglcleavage intersections plunge a t low angles to the north or south, parallel to fold hinges. In the Sullivan mine area (domain 2 , Fig. 8). regional bedding is also relatively flat lying to east dipping, cleavage dips variably to the west, and cleavagelbedding intersections and fold axes, although
25
ldegroot
1983

w
26

A
E T ABOVE S L
K
METRES A n V E S L
E E'
- . zoo0
1000
0
C C' C"
F ~ u r e 7. Vertical structural sections, Sullivan deposit area: see Figure 6 for locations.
scattered, generally trend north-northeasterly or south-southwesterly; plunges are up to a fevv tens of degrees. These folds and associated cleavage are correlative with Phase 2 structurm?s described hy McClay (19831 in the Sullivan deposit. The greater scatter o f structural elements in the deposit is uncloubtedly because of lower competency of the thinly laminated sulphides (compare Fig. 17 oi McClay with domain 2 of Fig. 8). East of the Sullivan deposit and in the Concentrator Hill area (domain :I, Fig. 8) bedding trends north and dips 20 to 30 degrees east. Cleavage dips steeply west-northwest; lineations and beddingicleavage intersections plunge a t low angles to the north-northeast.
A late crenulation cleavage locally overprints the pronounced regional fold and associated cleavage
folds that verge eastward; they are probably related to west.dipping thrust faults and associated east- Regional fold deformation in the Kimberley-Cranbrook area i s dominated by larcge, open to locally tight
trending tear faults. These structures deform and offset Paleozoic rocks but appear to predate Late Cretaceous granite bodies (H6y. 1983). and are, therefore, probably related to the regional Mesozoic orogeny as suggested by McClay (1983).
27

N N
b i 38 i i : b
I
e = 4
SULLIVAN
MARK CREEX / DOMAIN 2 /
/ DOMAIN3 IIEMWINDEP
x NORTH STAK I
b = 108 I CI = 25 e . 2 o
LINEATION OR BEDDING~CLEAVAGE INTERSECTIONS D
CLEAVAGE . . . . . . . . . . . . . . . . . . . . . . . . . . =
BEDDING. . . . . . . . . . . . . . . . . . . . . . . . . . . .
Figure 8. Equal area projections of $twctural data, Sullivan deposit area.
PURCELL SUPERGROUP STRATIGRAPHY
The Purcell succession in the Kimberley area has been described recently by Hamilton, et al. (1983) and H6y (1983); it wil l be reviewed only briefly here. Within the thick succession of rusty weathering, gener- ally laminated siltite and argillite of the Lower Aldridge Formation is a 250-metre-thick sequence of grey- weathering quartz wacke and quartz arenite beds (unit PEalq) that is lithologically similar to the basal part of the Middle Aldridge Formation. This unit crops out on the western and southern slopes of North Star
is more rusty weathering and somewhat thinner bedded. The Lower Aldridge grades up section into grey- Hil l and on the western slope of Concentrator Hi l l (Fig. 6 ) . The sequence, where exposed in Mark Creek,
weathering quartz wacke, quartz arenite. and more rusty weathering laminated siltite of the Middle Aldridge
has been placed below the first appearance of prominent blocky, grey-weathering quartz wacke beds. Formation (unit PEa2). The LowerlMiddle Aldridge transition is poorly exposed. Where outcrop allows. it
28

The Upper Aldridge Formation consists of approximately 300 metres of rusty to dark-grey-weathering laminated argillite and silty argillite. The Creston Formation ( P W is composed of grey, green, or mauve- coloured siltite and quartzite with numerous shallow water subtidal to intertidal sedimentary struc:tures.
MINERAL DEPOSITS
The Sullivan deposit, and a number of smaller stratabound lead-zinc-silver deposits, occur in a north- northwest-trending regional alteration zone that extends from Sullivan southward to North Star Hill.
The Sullivan deposit is one of the largest base metal deposits in the world; it has produced 116 million i.onneS of ore grading 6.7 per cent lead, 5.8 per cent zinc, and 79 grams silver per tonne. Rsmaining reserves are approximately 45 million tonnes containing 4.5 per cent lead, 6.0 per cent zinc, and 38 grams silver per tonne. I t s geology has been described recently by Hamilton, et a/. (1982, 1983). In brief, the deFlosit is a large, generally conformable lens of massive pyrrhotite, galena, and sphalerite that lies near the top of the
overlies a brecciated and tourmalinized footwall alteration zone (Fig. 9); the orebody is overlain by an Lower Aldridge Formation. Its western part, comprising generally massive to irregularly layered sulphides,
albite-chlorite-pyritecarbonate alteration halo. I ts eastern part consists of a number of thinly laminated sulphide layers separated by fine-grained clastic rocks.
METRES FEET
0 200 - METRES
e3 ALBlTlZATlON 0 TOURMALINIZATION
LA CHlORlTlZATlON FOOTWALL CGL.+ BRECCIA
r3 PYRRHOTITE
SULPHIDE ORE DIORITE
@ *UNALTERED" METASEDIMENTS
Figure 9. Schematic vertical section through the Sullivan deposit lsimplified from Hamilton. etal. , 19821.
Numerous small vein occurrences, a few thin stratabound sulphide lenses, and a number of larger strata- bound deposits occur within a few kilometres south of Sullivan. The North Star deposit, located approxi- mately 4 kilometres south-southwest of Sullivan (Fig. 6). is a small, but very high-grade, stratiform deposit
per cent lead, less than 1 per cent zinc, and about 1 000 grams silver per tonne (Hamilton. et al.. 1983, in Lower Aldridge siltstones. The deposit produced 70 000 tonnes of hand-sorted material containing 46
p. 45). It is described (Schofield, 1915) as a conformable lens of massive galena only partly preserved in synformal structures on the eastern slopes of North Star Hill. Construction of thl? North Star :;ki hil l complex has largely covered the old workings.
29

The Stemwinder is located between Sullivan and North Star. It produced approximately 25 000 tonnes containing 3.7 per cent lead, 15.6 per cent zinc, and 76.3 grams silver per tonne. Reserves include approxi- mately 125 tonnes of 82 grams per tonne silver, 3 per cent lead, and 16 per cent zinc (Hamilton, et a/., 1983, p. 45). The deposit trends northerly and dips steeply west. I t is interpreted to be a vein deposit that occurs in a tight, faulted synclinal structure (Freeze. 1966).
REGIONAL ALTERATION IN THE SULLIVAN CAMP
Lead-zinc-silver deposits in the Sullivan camp are enclosed within a north-northeast-trending zone of intensely altered Lower Aldridge siltstone and quartzite. The zone is approximately 6 000 metres in length, 1 500 to 2 000 metres wide, and locally. beneath the Sullivan deposit (Hamilton, 19831, extends through a known stratigraphic interval of a t l eas t 500 metres. On North Star Hill tourmalinized rock was intersected in drill holes to depths exceeding 200 metres (D. H. Olson, personal communication). The alteration zone appears to be restricted to Lower Aldridge rocks; that is, rocks that stratigraphically underlie the Sullivan deposit. It is characterized by:
(1) A marked increase in the abundance of disseminated and irregularly laminated pyrrhotite and, to a lesser extent, pyrite. Surface exposures are typically highly oxidized.
(2) An increase in the number of pyrite, galena, and sphaleritebearing veins.
(3) An increase in the number of ‘massive‘ sulphide occurrences, such as North Star, Stemwinder. and a number of other smaller occurrences.
(4) Zones of pervasive tourmalinized and silicified rock, similar to those described in the footwall of the Sullivan deposit. These alteration zones are commonly irregular in outline with either sharp or gradational contacts; they cross lithologic boundaries. Locally, thin tourmaline-rich laminations occur in siltstone. The tourmalinite is a dark, hard siliceous rock that breaks with a conchoidal fracture.
(5) Irregular zones of breccia or ‘conglomerate’. The conglomerate is generally diamictite with sub- rounded siltite clasts up to 2 centimetres in diameter supported by a siltstone matrix. Pyrite and pyrrhotite with minor amounts of sphalerite and galena typically occur in the matrix. Often, the conglomerate grades into massive (lacking bedding) siltstone or quartzite. The conglomerates may define beds but can form clastic dykes. Similar rocks in the footwall of the Sullivan, termed ‘fragmentals’ are interpreted to have formed by injection and local surface extrusion, rather than by collapse of fault scarps (Hamilton, in press).
( 6 ) Obliteration of bedding by intense sulphide alteration, tourmalinization. silicification, or develop- ment of ‘conglomerate’.
Many of these features extend beyond the limits of the intense alteration zone described previously. For example, thin laminations of tourmalinite occur 3 to 4 kilometres south of the North Star deposit in Lower Aldridge siltite, and a crosscutting conglomerate occurs on a small hill nearby (A. Hagen. personal com-
transition (Sullivan horizon) on Concentrator Hill, which is 5 kilometres east o f North Star Hill. munication, 1980). As well, anomalous numbers of sulphide laminae occur a t the LowerIMiddle Aldridge
MOYlE INTRUSIVE ROCKS - A PRELlTHlFlCATlON MAGMATIC EVENT?
the Lower and the lower part of the Middle Aldridge Formation. They are generally a few tens to several Laterally extensive sills, which are predominantly gabbroic in composition (accompanying table), intrude
hundred metres thick, with medium to coarse-grained equigranular central parts and finer grained margins. A thin hornfelsic zone occurs adjacent t o some sill contacts. Locally, Moyie intrusions also form dykes. Although Moyie intrusions have isotopic ages indistinguishable from the host Aldridge rocks (approximately
30

1433 Ma, Zartman, et al., 1982). it has generally been accepted that they are coeval with deposition of the Upper Aldridge Formation or Creston rocks (Zartman, e t a/., 1982). or perhaps with Nicol Creek lavas (McMechan, 1981). However, Hoy (in press1 suggested that they are early and were emplaced into water- saturated Aldridge sediments a few tens to a few hundreds of metres below the sediment surface. I f this is correct, the Moyie sills may be evidence of a regional igneouslthermal event during deposition of Lower to
example of intrusion of basaltic sills into highly porous unconsolidated turbidite sediments was dexribed Middle Aldridge rocks, hence during formation of contained stratiform sulphide deposits. A modern
by Einsele, eta/. (1980) from drill sites in the Guaymas Basin, Gulf of California.
Moyie sills have a number of features in common with Guaymas Basin sills: they are basaltic in com-
Sears and Price, 1978; Price, 1981). Intrusion of 2 000 to 3 000 metres of Moyie sills (see Reesor, 1958; position (accompanying table; Fig. 10). intruda turbidites, and occur in a basin formed by rifting (see
siderable uplift of the surface rocks; no such upl i f t is evident in post-Aldridge time. I f it occurred, major Htiy and Diakow. 1982) into lithified Aldridge rocks could only be accommodated i f there were con-
unconformities or coarse clastics would be apparent in the overlying succession of dominantly platformal rocks. Room is not a problem i f the sills were injected into unconsolidated, water-saturated sediments; expulsion of pore fluids results in little change in relief of the sea floor (Einsele, eta/., 1980). Crosscutting, sheeted fracture zones containing calciteepidote-chlorite-quartz and, locally, sulphide assemblages and vein concentrations near sill margins are common in Moyie sills. These may be evidence of hydrothermal activity associated with water expulsion and escape through the sills. Transgressive zones of disrupted bedding, such as occurs on Highway 3 a t the south end of Moyie Lake, could be large dewatering structures associated with sill injection. Perhaps the best direct evidence that some sills were injected into wet,
Moyie sills (Plate 1 1 ) ; similar structures have been observed by Dave Pighan (personal communication, unconsolidated sediments are local development of flame and load cast structures a t the base of some
1983). As well, a thin (20 to 30-centimetre) contact zone with large hornblende crystals is commorl a t the base of some sills; this suggests hydrothermal growth in a mixed magma-crystal-sediment mush. Other sill contacts have fine-grained chilled margins and hornfelsic country rocks, suggesting intrusion into cool, lithified rocks.
and early Middle Aldridge time, dying out in late Middle Aldridge time a t the same time as the volume of Many of the Moyie sills are alkaline basalts (Fig. 10). Magmatism was essentially restricted to early Aldridge
striction to a stratigraphic interval dominated by turbidite deposition suggests that Lower Aldridge and coarse turbidites decreased. Their abundance, volume, composition, spatial, and suggested temporal re-
early Middle Aldridge sedimentation took place during a period of continental rifting.
Figure 10. Alkali-silica plot of Movie gabbroic sills in thE Lower Aldridgf (PEall , Middle Aldridge lPEa21, and Fort Steele I f ) Formations. A number of sills in younger Kitchener Formation l P 6 k l are also platted.
31

3 l h \',\\, \\ LATE CLEAVAGE
s H A R p C m l ~ " - - - -~ ~~
-~ - ~~~~
" - ~
- - ~
~
- - ~- "_ ~
A -:"-LAMINATED SILTITE = = - ~~ ~
~ ~~
"
- - . . , . . . . . . . . . . . . . . .
. . . . . . . . . . . . . . . .
. . . . . . . . . . . . . . . . . . . . . . . . . . . . . . . . . . . . . . . . . .
. . . . . . . . . . . . . . .
..: . . . . . . . . . . . . . . . . . . . . . . . . . . . . . . . . . . . . . . . . . . . . . . . ...... ~ . . .... ; . . . . . . . . . . . . .
. . . . . . . . . . . .
: . . . . . . . . . . . . . . . . . . . . , .;.. : . . , ,
. . . . . . . . . . . . . . . . . . . . . . . . .
. .
. . . . . . . . . MASSIVE QUARTZ WACKE
. . . .: . . . . . . . . .
. '
GRADED AC TURBIDITE BED . . .
. .
Plate 11. Detail Of Moyie sill-Middle Aldridge Formation turbidite contact: note features which suggest that the sill war iniected prior to lithification Of
the quartz wacke. such ar flame and load cast structures at the bare of the sil l . and a mixed sedment - coarsegrained hornblende contact zone.
32

SILICATE ANALYSES OF MOYlE SILLS IN ALDRIDGE AND FORT STEELE FORMATIONS
SAMPLE
M 1-7
M20-1
E8-15 E75-2
M7-209 M7-214
M7-223 M7-218
M7-233 M7-228
M7-240 M7-241 M7-249 M7-251
M7-261 M7-256
M7-265 M7-270
0,414-15 M12-27
K38-4 K23-2
D3-7A E4-1 E6-1
E55-4
SiO,
50.80
50.05
53.46 52.04
46.82 46.15
46.72 46.68
46.1 7 45.95
44.94 45.64 45.50 45.57
44.88 46.05
44.66 44.99
60.02 49.25
61.04 51.87
43.87 54.40
50.08
50.30
AI, 0,
14.63
15.94
14.39 13.49
13.77 13.96
13.76 13.49
13.33 13.48
13.81 13.67 13.49 13.48
13.55 13.36
13.12 13.68
16.53 13.28
11 5 5 14.23
14.36 13.98 14.62
14.53
Fa, 037
9.55
14.67
9.83 11.32
16.62 16.56
16.18 16.62
16.68 16.24 17.05 16.88 16.74 17.00 16.64 17.17
17.67 17.48
9.1 1 12.18
8.88 6.09
11.32 12.12
12.62
9.52
MgO
8.25
5.02
8.03 6.83
5.51 5.49
5.35 5.52
5.65 5.61 5.65
5.51 5.47 5.49
5.37 5.35
5.28 5.27
0.97 8.33
2.64 7.74
6.44 6.73
9.55
8.13
cao
11.98
10.06
2.88 6.40
9.07 10.55 9.77
9.85 9.54
10.25 9.67
9.80 9.93
10.04
9.93 9.23
10.25 8.14
10.54 4.86
9.93 7.87
10.96 10.42
2.79
11.43
Na,O
1.549
2.439
2.430 2.176
2.952 2.746
2.925 2.889
2.709 2.786
2.660 2.768 2.797 2.841
2.839 2.602
2.750 3.208
1.406 3.069
1.476 4.254
2.196 1.435 0.263
1.562
K, 0
0.322
0.227
0.815 0.461
1.115 0.711 0.823 0.934 0.970 1.078 0.968
0.801 0.846
0.924
0.753 1.496
0.469 0.782
0.992 2.045
4.484 1.795
0.687 2.753
2.000
0.429
Sample M1-7 - in Middle Aldridge Formation, sheet 82G/5 fMovie). Sample M20-1 - in Middle Aldridge Formation,rheet 82G/4 IYahkl Sampler E8-15 and E75-2 - in Middle Aldridge Formation, sheet 82Gil2E. 13E. Sampler M7-209 to M7-270 - in Middle to Lower Aldridge transition, Sheet 82Gi4 (Yahkl
Samples M12-22 and M14-15 - in Lower Aldridge Formation,rheet 82G/5 (Moyiel.
Sampler D3-7A to E 5 5 4 .- in Fort Steele Formation. sheets 82GilZE. 13E. Sampler K23-2 and K38-4 - in Lower Aldridge Formation, sheet 82G/12 ICranbrookl.
TiO,
0.739
1.108
0.948 0.844
2.606
2.758 2.607 2.628 2.713 2.603 2.854 2.831 2.746 2.791
2.831 2.775
2.729 2.789
0.627 7.312
0.199 0.625
2.535 0.736
0.690
1.167
nmo
0.152
0.201
0.113 0.141
0.259 0.249
C1.252 (1.258
0.257 (1.257
0.265 (1.268 0.267 0.270
0.296 0.262
0.280 0.282
11.187 11.166
13.320 11.149
0.180 3.199
0.141
0.154
33

DISCUSSION
formed by venting of hydrothermal. metal-charged brines onto the sea floor. The deposits occur within The Sullivan and other smaller stratabound lead-zinc-silver deposits in the Sullivan camp presumably
a broad area of intense alteration that is restricted to the Lower Aldridge Formation. This suggests that initially a thermal convective cell was operative over a wide area with local well-established discharge points; later it became more localized and in late Lower Aldridge time it formed the Sullivan deposit. The hydrothermal system continued to be active after sulphide deposition ceased; it caused chlorite-pyrite alteration of the central part of the Sullivan massive sulphide lens and albite-chlorite-pyritecarbonate alteration of overlying Middle Aldridge sediments (Hamilton. etal. . 1983).
Aldridge turbidites and contained stratiform base metal deposits. It is unlikely that these sills supplied It is suggested that intrusion of Moyie sills was, at least in part, contemporaneous with deposition of
source to drive a convective cell. Their presence does, however, indicate an elevated geothermal gradient, a substantial magmatic component to the source hydrothermal fluids, or that they directly provided a heat
and the associated thick accumulation of turbidites probably reflects contemporaneous tectonic activity in the form of crustal extension. Movements on deep-rooted basement faults have been documented in Aldridge rocks just east of the trench IHOy, 1982; in press). This tectonic activity. concentrated near the intersection of a north-trending rifted continental margin (Price, 1981) with a pronounced southwest- trending tectonic zone (Kanasewich, 1968; H6y. 1982). both triggered and localized a thermal convective cell system.
gabbroic sill intrusion decreased, indicating waning tectonic and magmatic activity. Local tourmalinite Through Middle Aldridge time, as the Purcell basin was being filled, the rate of turbidite deposition and
and convective systems continued on a local scale. By Upper Aldridge time only dark fine-grained s i l ts and and 'conglomerate' occurrences in Middle Aldridge rocks indicate, however, that faulting, rock fracturing,
muds were being deposited, indicating relatively stable tectonic conditions.
ACKNOWLEDGMENTS
This report is based on fieldwork during 1982 and 1983. The assistance of M. Fournier and I. Webster is gratefully acknowledged. Discussions with Cominco Ltd.'s geologists, G. D. Delaney, A. Hagen, J. M.
K. R. McClay of Goldsmiths College, London, England, are much appreciated. Part of the geological Hamilton, D. Pighan, and P. W. Ransom; with L. Diakow of the University of Western Ontario; and with
of North Star Hill were improved considerably by incorporating studies and notes of R. E. Gale and 0. H. map (Fig. 61 is taken largely from published maps by Hamilton,eta/. (1982, 1983);detailsof the geology
Olson of Asarco Exploration Company of Canada Limited. The paper was improved by comments and suggestions of Don Maclntyre, British Columbia Ministry of Energy. Mines and Petroleum Resources.
REFERENCES
Campbell, F. A, Ethier, V. G., Krouse, H. R., and Both, R. A (1978): Isotopic Composition of Sulfur in
Cressman, E. R. (in press): Paleogeography and Paleotectonic Setting of the Prichard Formation - A Pre- the Sullivan Orebody. British Columbia, €con. Geol., Vol. 73, pp. 246-268.
liminary Report, in Program and Abstracts, Belt Symposium 11, Montana Bureau of Mines & Geology, Special Publication.
Einsele, G.. et a/. (1980): Intrusion of Basaltic Sills into Highly Porous Sediments, and Resulting Hydro- thermal Activity, Nature, Vol. 283, pp. 441-445.
Freeze, A. C. 11966): The Origin of the Sullivan Orebody, Kimberley, B.C., in Tectonic History and Mineral Deposits of the Canadian Cordillera, C.I.M.M., Spec. Vol. 8, pp. 263.294.
34

Hamilton, J. M. ( in press): The Sullivan Deposit, Kimberley, British Columbia - A Magmatic Cow~ponent to Genesis ?, in Program and Abstracts, Belt Symposium (I, Montana Bureau of Mines & Geo/ogy,
Hamilton, J. M.. Bishop. D. T., Morris, H. C., and Owens, 0. E. (1982): Geology of the Sullivan Orebody. Special Publication.
Kimberley, British Columbia, Canada, in Precambrian Sulphide Deposits, Geol. Assoc. of (Canada, Special Paper 25, R. W. Hutchinson, C. D. Spence, and J. M. Franklin, Editors, pp. 597-666.
Hamilton, J. M., Delaney. G. D.. Hauser. R. L., and Ransom, P. W. (1983): Geology of the Sullivan Deposit, Kimberley, British Columbia, Canada, in Sediment-hosted Stratiform Lead-Zinc Depositn. D. F.
Hay, T. (1982): The Purcell Supergroup in Southeastern British Columbia: Sedimentation, Tectonics and Sangster, Editor, Min. Assoc. Canada, Short Course Notes.. Vol. 8, pp. 31-83.
Stratiform Lead-Zinc Deposits, in Precambrian Sulphide Deposits, Geol. Assoc. of Canada, Special Paper 25, R. W. Hutchinson. C. D. Spence, and J. M. Franklin, Editors, pp. 127-148.
.......... (1983): Geology in the Vicinity of the Sullivan Deposit, Kimberley, British Columbia, B.C. /Ministry of Energy, Mines & Pet, Res., Geological Fieldwork, 1982, Paper 1983-1, pp. 9-17,
_....,.... ( in press): The Purcell Supergroup near the Rocky Mountain Trench, Southeastern British Colum- bia, in Program and Abstracts, Belt Symposium 1 1 , Montana Bureau of MinEs & Geology, Special
Hay, T. and Diakow, L. (1982): Geology of the Moyie Lake Area, British Columbia, B.C. Ministry of Publication.
Kanasewich, E. R. (1968): Precambrian Rift : Genesis of Stratabound Ore Deposits, Science, Vol. 161,
Leech, G. 8. (1958): Fernie Map-Area, West Half, British Columbia, Geol. Surv., Canada, Paper 58-10,
........._ (1960): Geology, Fernie (W%), Kootenay District, British Columbia, Geld. Surv., Canada, Map
McClay, K. R . (1983): Structural Evolution of the Sullivan Fe-Pb-Zn-Ag Orebody, Kimberley. British
McMechan, M. E. (1981): The Middle Proterozoic Purcell Supergroup in the Southwestern Purcell Moun- Columbia, Canada, Econ. Geol., Vol. 78. pp. 1398-1424.
tains, British Columbia and the Initiation of the Cordilleran Miogeocline. Southern Canada and Adjacent United States, Cdn. Pet. Geol., Bull., Vol. 29, pp. 583.621.
McMechan, M. E. and Price, R. A. (1982): Superimposed Low-Grade Metamorphism in the Mount Fisher Area, Southeastern British Columbia - Implications for the East Kootenay Orogeny, Cdn. Jour.
Nesbitt, 8. E. and Longstaffe, F. J. (1982): Whole Rock, Oxygen Isotope Results for Country Rocks and Earth Sciences, Vol. 19, pp. 476-489.
Alteration Zones of the Sullivan Massive Sulphide Deposit, British Columbia, in Current Research, Pan C, Geo/. Surv., Canada, Paper 82-1C, pp. 51-54.
Price, R . A. (1981): The Cordilleran Foreland Thrust and Fold Belt in the Southern Canadian Rocky Mountains, in Thrust and Nappe Tectonics, K. R . McClay and N. J. Price, Editors, Geol. SOC. London,
Reesor, J. E. (1958): Dewar Creek MapArea with Special Emphasis on the White Creek Batholith, British Special Publication 9, pp. 427-448.
Columbia, Geol. Surv., Canada, Mem. 292, 78 pp. Rice, H.M.A. (1937): Cranbrook MapArea, British Columbia, Geol. Surv., Canada, Mem. 207,67 pp. Schofield, S. J. (1915): Geology of Cranbrook Area, Geol. Surv., Canada, Mem. 76, 245 pp. Sears, J. W. and Price, R. A. (1978): The Siberian Connection: A Case for Precambrian Separation of the
Shaw. D. R. ( in preparation): Wall-Rock Alteration a t the Sullivan Mine, Kimberley, British Columbia, North American and Siberian Cratons, Geology, Vol. 6 . pp. 267-270.
Zartman, R. E., Peterman, Z. E., Obradovich, J. D.. Gallego, M. D.. and Bishop, D. T. (1982): A~3e of the Unpub. Ph.D. Thesis, Queen's University, Kingston, Ontario.
Crossport C Sill near Eastport, Idaho, in Society of Economic Geologist!;. Coeur d'Alene Field Conference, R. R . Reid and G . A. Williams, Editors, Idaho BureauofMines& Geology, Bull.. Idaho. 1977, Vol. 24, pp. 61-69.
Energy, Mines & Pet. Res., Prelim. Map 46.
pp. 1002-1005.
40 PP.
11-1960.
35

TONSTEINS: POSSIBLE STRATIGRAPHIC CORRELATION AIDS IN EAST KOOTENAY COALFIELDS
(82G/15, 82J12)
By D. A. Grieve
INTRODUCTION
Tonsteins are kaolinitic fine-grained sedimentary rocks associated with coal and coal-bearing strata; they are superficially similar to the shale partings found in most coal seams. Tonsteins are normally thin, but often have considerable areal extent, a factor which has made them extremely useful as correlation tools in many coalfields.
The term 'tonstein' does not, strictly speaking, imply any particular mode of formation. Much recent work suggests that many tonsteins are the end product of the reworking andlor alteration of volcanic ash lfor example, Price and Duff, 1969; also see paper by Kilby, this volume). Work i s a t present too preliminary to allow genetic classification of the samples from southeast British Columbia discussed here.
Presence of tonsteins in the Balmer (No. 10) seam in the Sparwood area was reported by Mkriaux (1972). During reconnaissance mapping in the south half of the Elk Valley Coalfield (Grieve, 1982; Grieve and Fraser, 1983), samples were taken of unusual-looking argillaceous partings from several coal seams. Thin- section and X-ray diffraction analysis of one example from the Ewin Pass property revealed a texture and mineralogy consistent with tonstein lithologies.
As a follow-up it was decided to tes t the local continuity of two of the discoveries to assess the potential of using tonsteins for regional stratigraphic correlation in the East Kootenay Coalfields. The current lack of known regionally extensive marker horizons in the coalfields is a problem to geologists in exploration and mining; this was an incentive for conducting this study.
Coal rights in the study area are held by Crows Nest Resources Ltd
SAMPLE LOCATIONS
€WIN PASS: The Ewin Pass property is approximately 7 kilometres north of Line Creek (Fig. 11). The 1981 discovery of a tonstein iidentification number 81-217) in 7(?) seam was made in the bank of a now- reclaimed exploration road (between lines 1200N and 1300N on the company grid). At the time a complete section of the coal-bearing Mist Mountain Formation was measured, which included this same exposure (see Grieve, 1982, Fig. 2). For this follow-up study. a new partial section was measured approximately 1 400 metres to the north, on an open, east-facing slope. The section measured is believed, from both the author's and the company geologists' detailed mapping, to correspond to the interval between 8 seam and 5 seam (local nomenclature only). Corresponding portions of both sections are plotted on Figure 12. A tonstein occurs in a coal seam a t the same relative stratigraphic position (identification number 83-10). No other tonsteins were noted.
36
ldegroot
1983

Figure 11. Line Creek area. Elk Valley Coalfield
so-called Line Creek Extension property (Fig. 11). A closely spaced pair of tonsteins was found a t an adit LINE CREEK RIDGE: Line Creek Ridge is the site of Crows Nest Resources’ Line Creek mine, and i t s
s i te in 108 seam on the Line Creek Extension (identification number 82-146). A nearly identical pair also occurs a t the same stratigraphic level in the high-wall of Line Creek mine, 1.4 kilometres to the south (identification number 83.188). At the mine two other tonsteins were noted, one overlying the clouble band by 140 centimetres and the other underlying by 15 centimetres. They are not int:luded in the f83110w ing descriptions and discussion.
DESCRIPTION OF SAMPLES
Thickness of the Ewin Pass tonsteins (numbers 81-217 and 83-10) averages 5 t o 6 centirnetres. Their colour is brownish black, with irregular dark brown patches: streak is also brown. They are vl?ry fine grained with visible, light grey rounded blebs (up to 0.5 rnillimetre) scattered randomly throughout. Lack of laminations or internal partings and two well-developed, closely spaced sets of fractures, both perpendicular t o be,dding,
Some of the samples display a conchoidal breakage fracture. make these rocks distinctive. The fractures impart a distinctive blocky appearance in outcrop and float.
37

OXIDE ANALYSIS OF EWlN PASS TONSTEIN TABLE 2
181.2171
Per Cent SiO. 35.52
Na,O K2 0
<0.02
TiO, <0.03
MnO 1.020
Total H,O <0.002 14.38
S 0.09
38

The two bands in the Line Creek Extension locality (number 82-146) are separated by 1.2 centirnetres of dark grey, very fine-grained carbonaceous rock. The lower tonstein. which is 1.2 Ncentimetres thick, is medium brown with black carbonaceous stringers; it has a white streak. It is very fine grained and has two regular sets of fractures. similar to those in Ewin Pass samples. Some fracture planes have a vitreous lustre.
also occur in the enclosing 4 to 5 millirnetres of dark grey carbonaceous rock. The band is very diffic:ult to Rounded light grey blebs up to 2 millimetres in Size are concentrated near the contacts of the band, and
physically separate from i ts enclosing rock. The upper band is 5 millimetres thick, is medium brownish grey, and has a white streak.
The pair of tonstein bands in Line Creek mine high-wall (number 83-1881 are separated by 1 centimetre of
t o the corresponding unit described previously. carbonaceous rock. The lower brown band is 1 centimetre in thickness, but in all other respects is identical
PETROGRAPHY OF SAMPLES
Petrographic examinations were necessarily supplemented by X-ray diffraction analyses. Both Ewin Pass samples are characterized by a microcrystalline groundmass of gorceixite IBaAI, (PO, l2 (OH), .HzO1 with or without kaolinite, with thin stringers of organic material, and with minor amounts of euhedral apatite crystals. Irregular subrounded ovoid bodies of microsrystalline kaolinite containing minor amounts of gorceixite, known as 'graupen', occur throughout. Their long axes generally lie in the bedding plane. In hand specimen the graupen form light grey blebs. Some of the kaolinite in the graupen is in vernlicular form.
Only the lower brown band from the Line Creek Ridge samples was examined. Microcrystalline kaolinite forms the groundmass; it is cut by stringers of organic matter and carries angular t~ subrounded .apatite clasts, rare euhedral apatite crystals, and subangular quartz clasts. Many of the quartz clasts have cliffuse, corroded outlines. Sample 83-1BB also has rare plagioclase (?) laths. Graupen with highly irregubr out- lines are most abundant near the margins of the band. They are composed of microcrystalline kaolinite, some of which is vermicular. The organic stringers bend around the graupen.
Contact with the enclosing dark rock is sharp; it is marked by the sudden occurrence of thick stringers of organic material (liptinite ? ) separated by elongated. flattened graupen and kaolinitic groundmass material. This corresponds with observations in hand specimen that graupen occur both within the brown band and
enclosing rock. in the enclosing rock, and that the brown band is very difficult to physically separale from i t s immediate
CHEMISTRY OF SAMPLES
Semiquantitative emission spectrographic trace element analyses of four samples are listed in Table 1; an oxide analysis of 81-217 is given in Table 2. Notably all have high titanium values (0.2 to 1.7 per cent).
analysed. Trace amounts of boron, copper, gallium, yttrium, ytterbium, and lead are also colnmon to all samples
Relatively higher values of phosphorus and barium in the Ewin Pass samples reflect the mineral gorc:eixite; perhaps it also accounts for relatively high strontium contents (assuming some solid solution between gorceixite and goyazite [SrAI, (PO, jZ (OH), ,HzO1.
Trace zirconium is restricted to the Ewin Pass samples, while trace scandium is restricted to the Line Creek Ridge samples. Analyses were semiquantitative; these values may not be significant.
39

\ '\
VERTICAL SCALE (metres)
/ // SECTION B
SILTSTONE AND FINER ROCKS
[LD CARBONACEOUS UNll <SO% COAL K/// .""" ~
PREDOMINANTLY COAL
EVIDENCE OF FAULTING ..............* SAMPLE IDENTIFICATION
NUMBER ........................... 83-217 SECTION A
Figure 12. Detailed stratigraphic sections from two locations on Ewin Parr property showing mapped correlations of 5 $earn and 8 Seam and proposed correlation of tonstein horizon.
40

Other elements detected include lithium, vanadium, chromium, manganese, cobalt, zinc, molybdenum. silver, lanthanum, cerium, and tungsten.
DISCUSSION
Preliminary work suggests that tonsteins have potential as stratigraphic correlation tools in the East Koot- enay Coalfields. The occurrence of a double band of tonsteins with very similar charaszteristics a t the same relative stratigraphic level a t both Line Creek Ridge and Line Creek Extension is impressive evidence for a t least local lateral persistence of the tonsteins; further it demonstrates the ut i l i ty o f simple macroscopic
tonstein a t the same relative stratigraphic position a t two locations emphasizes the potential of tonsteins parameters, such as colour, thickness, and grouping of bands. On the Ewin Pass property, discovery of a
t o aid in stratigraphic correlation. The proposed correlation is reinforced by the presence of gorceixite at both locations.
In both cases cited a certain amount o f stratigraphic control was utilized in deciding where to search for second occurrences of the tonsteins. On a regional scale, where stratigraphic control is often non-existent. petrographic and chemical criteria may prove to be key elements in identification and correlation of spec- ific tonsteins.
Pass (Fig. 12) mainly results from facies changes. Faulting recognized in the area o f the more southerly
As an aside, the marked contrast in thicknesses of the two 8-seam t o 5-seam intervals measured or, Ewin
section (one zone was noted) may also occur in covered intervals and account for some of this difference. For correlation under such geological conditions the need for reliable regional markers, like tonsteins, is great. Further work will be directed toward determining abundance, regional extent. composition, and origin of tonsteins in the East Kootenay Coalfields.
ACKNOWLEDGMENTS
the author to the sample site in Line Creek mine. In the Ministry, Laboratory Scientist J. Kwong provided Crows Nest Resources' staff gave permission to visit their properties. P. Gilmar (of the company) conducted
advice on interpretation of X-ray diffraction results, and discussions with Project Gsologist W. Kilby were very beneficial.
REFERENCES
Grieve, D. A. (1982): Mount Banner Area, Elk Valley Coalfield, B.C. Ministry of Energy, Mines & Pet,
Grieve, D. A. and Fraser, J. M. (1983): Line Creek and Crown Mountain Areas, Elk Valley Coalfield, Res., Geological Fieldwork, 1981, Paper 1982-1, pp. 47-50.
Mkriaux, E. (1972): Les Tonsteins de la Veine de Charbon No. 10 (Balmer) 'a Sparwood Ridge dans le B.C. Ministry of Energy, Mines & Pet. Res, Geological Fieldwork, 1982, Paper 1983-1, pp. 20-26.
Bassin de Fernie (Columbie Britannique), Geol. Surv., Canada. Report of Activities, Paper 72-18.
Price, N. R. and Duff, P. McL. D. (19691: Mineralogy and Chemistry of Tonstein!; from Carborliferous pp. 11-22.
Sequences in Great Britain, Sedimentoloyy, Vol. 13, pp. 45-69.
41
HARRISON LAKE PROJECT (92H/5, 12; 92G/9)
By G. E. Ray Ministry of Energy, Mines and Petroleum Resources
and
S. Coombe and G. White Rhyolite Resources Inc.
INTRODUCTION
The northwest-trending Harrison Lake fracture system, approximately 100 kilometres east-northeast of Vancouver, is associated with regional hot spring activity and sporadic gold mineralization. Most of this gold was found before the turn of the century; it includes numerous occurrences and several small pro- ducers such as the Providence (Mineral Inventory 92H/NW-301 and RN (Mineral Inventory 92HlSW-92) mines. Since the 193O’s, extensive parts of the Harrison Lake area have not experienced much exploration activity or regional geological mapping.
In 1981-1982 Rhyolite Resources Inc. started drilling some gold-bearing quartz-sulphide veins a t Doctors
companies realized that areas adjacent to the Harrison Lake fracture system had favourable potential for Point, on the western shore of Harrison Lake. The results of this work led to a large staking rush, as some
both epithermal and mesothermal gold mineralization. Part of this activity involved the re-evaluation of some former mines and occurrences in the area; this included work by Abo Oil Corporation on the disused RN gold mine (also known as the ’Geo‘ occurrence, Mineral Inventory 92HlSW-921, situated approximately 4 kilometres northeast of Harrison Hot Springs.
The current British Columbia Ministry of Energy, Mines and Petroleum Resources’ project was initiated in response to the widespread exploration interest in the area. The project involved the following:
(1) Geological mapping a t a scale of 1:5 000 of a 3-square-kilometre area in the Doctors Point vicinity (Fig. 13). This mapped area includes all the surface mineralized gold showings discovered and drilled to date by Rhyolite Resources Inc.
( 2 ) Sampling the mineralized veins and unmineralized host rocks for precious metal assaying, whole rock and trace element analyses, and thin-section studies.
(31 Geologically mapping the immediate vicinity of the disused Providence mine (Mineral Inventory 9ZH/NW-30) at a scale of 1:l 000 (Fig. 16). This included detailed mapping of the main (No. 3) adit on the property (Fig. 17) and collecting mineralized and host rock samples for analyses and thin- section examination.
(4) Reconnaissance geological mapping a t a scale o f 1 :25 000 of the area between the Providence mine and Doctors Point.
(5) A brief examination and sampling of the disused RN gold mine [Mineral Inventory 92H/SW.92) which is currently being re-evaluated by Abo Oil Corporation,
REGIONAL GEOLOGY
The Harrison Lake fracture system forms a major, southeasterly trending dislocation over 100 kilometres in length, which in parts passes along, and parallel to, Harrison Lake. The system separates highly contras- ting geological regimes (Roddick. 1965; Monger, 1970). To the northeast, the rocks include well-deformed
42
ldegroot
1983
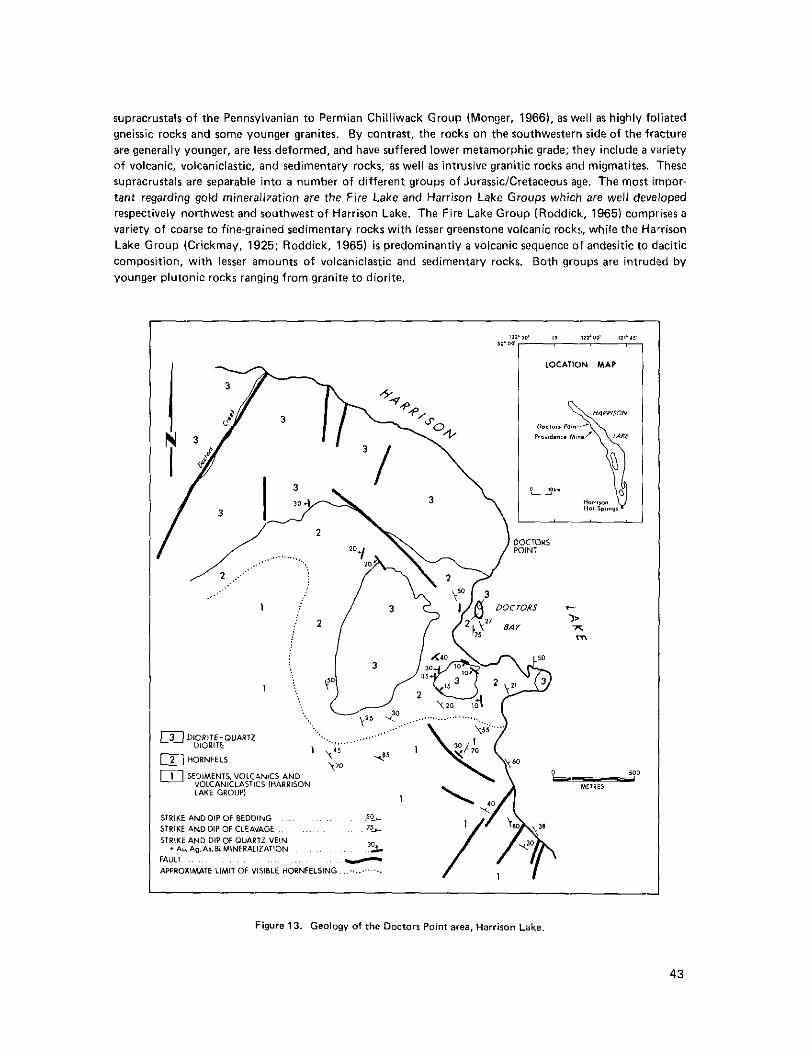
supracrustals o f the Pennsylvanian to Permian Chilliwack Group (Monger, 1966). as w d l as highly foliated gneissic rocks and some younger granites. By contrast, the rocks on the southwestern side of the fracture are generally younger, are less deformed, and have suffered lower metamorphic grade: they include a variety
supracrustals are separable into a number of different groups of JurassicICretaceous age. The most impor- of volcanic, volcaniclastic, and sedimentary rocks, as well as intrusive granitic rocks and migmatites. These
tant regarding gold mineralization are the Fire Lake and Harrison Lake Groups which are well developed respectively northwest and southwest of Harrison Lake. The Fire Lake Group (Roddick., 1965) comprises a variety o f coarse to fine-grained sedimentary rocks with lesser greenstone volcanic rockr, while the Ha1,rison Lake Group (Crickmay. 1925: Roddick, 1965) is predominantly a volcanic sequence o f andesitic to dacitic composition, with lesser amounts of volcaniclastic and sedimentary rocks. Both groups are intrud'jd by younger plutonic rocks ranging from granite to diorite
Figure 13. Geology of the Doctors Point area, Harrison Lake.
43

The Harrison Lake fracture system is associated with regional hot spring activity; this includes two hot
on the southeastern extremity of the lake. The gold mineralization along the system is hosted in rocks of springs along the Lillooet River valley, northwest of the lake, as well as one situated a t Harrison Hot Springs
various ages and lithologies. The Fire Lake gold camp, situated approximately 20 kilometres northwest of Harrison Lake, includes six mineralized occurrences, a l l of which are found in quartz-rich veins that cut the Fire Lake Group. Five of these veins are hosted in greenstones and carry chalcopyrite and native gold. These quartz veins are not continuous but form lenses and gash fillings. The sixth mineral occurrence in the camp, the Dandy (Mineral Inventory 92G/NE-l0). is hosted in brecciated sedimentary rocks and carries lead-zinc mineralization in a quartz-calcite vein.
A t the RN mine (Geo), situated close to Harrison Hot Springs, the gold is hosted in sulphide-bearing quartz veins that cut both highly deformed metasedimentary rocks of the Chilliwack Group and intrusive diorite plutons.
The Providence mine, situated 5 kilometres southeast of Doctors Point, represents a fracture-filled vein deposit hosted in andesitic rocks of the Harrison Lake Group. The rocks in the Doctors Point area, where Rhyolite Resources Inc.'s mineralization was discovered, were originally assigned to the Fire Lake Group (Roddick, 1965) and the Mysterious Creek Formation (Monger, 1970). However, the prevalence of acidic to intermediate volcanic rocks in the area suggests they probably belong to the Harrison Lake Group. In the Providence mine vicinity, andesites and andesitic breccias predominate, but northward toward Doctors
with coarse volcanic breccias, tuffs, and a variety of sedimentary rocks. A t Doctors Point this supracustral Point they become less abundant and are replaced by volcanic rocks of more acidic composition, together
assemblage is intruded by several diorite-quartz diorite plutons which are surrounded by wideand prominent thermal metamoprhic aureoles, The gold-bearing veins a t Doctors Point exhibit a pronounced spatial relationship to the diorite pluton margins, but current geological data suggest the intrusions were not necessarily genetically related to the gold mineralization.
DOCTORS POINT AREA
INTRODUCTION
In the late 1970's. Mr. G. Nagy discovered gold-silver mineralization a t Doctors Point, on the southwest shore of Harrison Lake, approximately 45 kilometres north-northeast of Harrison Hot Springs (Fig. 13). In 1981 Rhyolite Resources Inc. purchased the Nagy claims and subsequently conducted an exploration program involving geological mapping, soil sampling, trenching, and drilling. During August and September
gold-silver-bismuth mineralization in sulphide-bearing quartz veins; the best intersections were in holes 1981, Rhyolite Resources Inc. put down 13 NQ drill holes totalling 890 metres. This program intersected
81R-8 and 81R-11 which respectively intersected 3.2 metres of 7.1 grams gold per tonne (0.21 ounce gold per ton) and 3.9 metres of 4.2 grams gold per tonne (0.125 ounce gold per ton). In July 1983 Rhyolite
drill indicated and probable mineralized reserves of 450 000 tonnes grading 3.1 grams gold per tonne Resources Inc. announced they had completed 60 diamond-drill holes totalling 4 570 metres and had
(0.1 ounce gold per tonl and 31 grams silver per tonne (1 ounce silver per tonl.
GEOLOGY
The simplified geology of the area is shown on Figure 13. The southern part is underlain by a varietv Of
generally moderately dipping volcanic, volcaniclastic, and sedimentary rocks that probably belong to the Middle Jurassic Harrison Lake Group. To the north these supracrustals are intruded by five diorite-quartz diorite bodies that vary in size from only 25 metres in diameter to over 1 kilometre across. The volcanic
44

rocks are fine to medium grained, are generally highly altered, and range from andesite to dacite in com- position. Both porphyritic and non-porphyritic varieties are seen, and abundant disseminated pyrlte is a widespread feature; the dacitic varieties are commonly devitrified and silicic. Most (of the volcanic rocks are massive; flow banding is rarely seen.
The sedimentary rocks range from massive, black argillites, some of which contain rounded concretionary structures, through to finely bedded siltstones that in places display excellent graded bedding. Mosl: o f the sedimentary rocks indicate deposition in a low-energy environment but some siltstones contain argillitic
clastic rocks vary from finely bedded, often siliceous tuffs through to massive, chaotic volcanic breccias rip-up clasts and others show signs of soft sediment deformation and chaotic slumping. The volcani-
having angular to subangular clasts exceeding 0.3 metre in diameter. Most breccias are oligomici:ic, but some of the coarser varieties contain clasts of both dacitic and andesitic volcanic rock:;, as well as fragments of bedded sedimentary material and broken quartz and felspar crystals. The more mafic breccias are Inarked by rounded clots o f calcite rimmed by epidote. In places the bedded tuffs and breccias are interlayered with volcanic flows that also sporadically contain angular, lithic clasts. Consequently, it is often difficult to distinguish between these tuffaceous lavas and the volcaniclastic rocks, particularly where devitrification is widespread.
The plutons intruding the supracrustals (Fig. 13) range from diorite to quartz diorite in composition. When fresh they form grey-coloured, generally massive, and coarse-grained rocks. Biotite i!; the most widm?spread mafic mineral but hornblende is sporadically developed and can exceed 20 per cent by volume in parts. These rocks contain up to 10 per cent disseminated pyrite in places, but this sulphide does not 'contain gold.
Five individual plutons are seen. They range in size from the small body underlying the northern poltion of the island in Doctors Bay through to the incompletely mapped large mass situated between Doctors Creek and Doctors Point (Fig. 13). The three remaining bodies form rounded to oval-shaped masses whose contacts with the country rocks are highly irregular in parts. Rounded, mafic zerloliths are seen in the largest pluton near Doctors Creek (Fig. 13) but are rare in the other four bodies. The largest pluton is also notable for i t s higher quartz content. The diorites are generally massive textured but the small body underlying the western extremity of the peninsula, south of Doctors Bay (Fig. 13). exhibits vertically inclined flow layering. This consists of subtle, diffuse concentrations of light and dark minerals with no signs of any sharp boundaries between individual layers which are mostly very regular and generally 1 to 2 centimetres wide. The plutons are surrounded by a 100 to 250-metre-wide hornfm?lsic zone marked by intense recrystallization of the country rock; in places identification of the original rock type is impossible. Close to the pluton margins the hornfels contains fine biotite and magnetite and is ,characterized try weak silicification with some disseminated fine-grained pyrite and pyrrhotite. The pyritepyrrhotite can exceed
carry gold. Two exposures of hornfelsic racks containing coarse garnet crystals were also noted. 15 per cent by volume immediately adjacent t o the plutons but these intrusion-related sulphides do not
GEOLOGICAL HISTORY OF THE DOCTORS POINT AREA
Middle Jurassic sedimentation and volcanism were followed by a period of uplift and iolding which resulted in the consistent easterly dip of the bedding and the imposition of a subvertically inclined fracture and slaty cleavage, Bedding-cleavage intersections indicate that the entire area occupies the eastern limb of a major, northwest-trending anticline. There is no evidence of structural repetition in the sequence, and the graded
and the folding is unknown; however, no fracture cleavage is seen in the diorites. The plutons, sub!;equent bedding shows tectonic inversion did not occur. The temporal relationship between the diorite plutonism
to their intrusion were cul. by narrow, mafic dykes. This event was followed by easterly directed thrust
45

movements along thin, gently dipping thrust planes. Overall movement across individual thrust surfaces, however, was very small. Subsequently, gold-silver-bearing quartz-sulphide veins were injected along some thrust planes. This was followed by two sets o f subvertically inclined faulting that trend northeast and
subhorizontal movements. southeast respectively. Slickensiding indicates the southeast-striking fault set suffered both vertical and
MINERALIZATION
The gold-silver mineralization a t Doctors Point is hosted in long, narrow, generally gently dipping (10 to 30 degrees) quartz-sulphide veins that cut both the diorites and the adjacent hornfelsic rocks. On surface these veins vary from a few centimetres to 0.75 metre wide, but drilling has reportedly intersected veins over 2 metres i n width. The veins include both clear and white vuggy quartz, the vug cavities being lined with small quartz crystals. Pyrite and arsenopyrite are the commonest sulphides; in part the veins comprise coarse, massive sulphide material in which quartz is subordinate. Surface leaching results in abundant boxwork textures in the quartz veins, and many mineralized outcrops are coated wtih green scorodite (FeAsO,.H,O),an alteration product o f the arsenopyrite. In some instances the veins contain small amounts of chalcopyrite. while rare examples of molybdenum and galena are also reported. Analyses (Ray, 1983; Table 1) show that the gold-silver mineralization a t Doctors Point is generally associated with anomalous amounts of bismuth, antimony, mercury, copper, and lead, and occasionally associated with anomalous values of zinc and tungsten.
TAR1 E 1
TRACE ELEMENT ANALYTICAL RESULTS, DOCTORS POINT, HARRISON LAKE*
. . .- - - .
27852‘ 27853’
207 51 345
13 18 72
<2 8
146 2
38 <15 206 <10
6.8% 240
<25
4 400 <2
27854’
680 40 23
2
290 <2
250
770 17
0.6%
27856<
48 44
5 7
710 580
370 55
0.36%
5.7 %
All valuer in ppm except where recorded in per cent; Hg in Ppb. “‘Grab samples of sulphide-rich quartz veins on the Rhyolite
Resources Inc. ’~ property. Doctors Point, Harrison Lake. Analysis by AA IHg by cold vapour AAI.
*For A”-Ag analyses on mineralized grab samples from the Doctors Point area see Ray 119831. Tables 1 and 2.
To date 13 mineralized veins are outlined on surface and the majority of these are located within 100 metres of the diorite-hornfels contact (Fig. 15). Surface veins are traceable over a 30-metre distance, but drilling indicates some exceed 200 metres in length. One surface vein is traceable from the diorite into the adjacent hornfels without any apparent dislocation or change in either mineralogy, vein dimension, or gold content.
original rock type is unrecognizable. These bleached zones comprise a very fine mixture of quartz, sericite, The mineralized veins are usually bounded by a ‘bleached zone’ in which the nature and texture of the
and kaolin, with some disseminated pyrite: in places it carries trace amounts of gold. The bleached zone varies from a few centimetres to 3 metres in width; generally the wider zones are associated with the thicker veins, and commonly the hangingwalls contain the widest zones of alteration. The bleached
46

alteration passes gradually out to a wider 'rotted zone' which is characterized by i ts iriable. weathwed, and rusty appearance. In this zone the feldspars are extensively kaolinized, but the tl?xtures of the original rocks are clearly visible. This alteration zone can exceed a total of 8 metres in width and generally carries weakly disseminated pyrite but no gold.
4
WEAK MINERALIZATICIN~
I I
SEDIMENlS,MLCANICSANDVOLCANlCLASTlCS(HARRISON LAKEGROUPI
@ QUARTZ-PYRITE-ARSENOPYRITE VEINStAu,A~,6i,SbH~,Cu.Pb.Mo
Figure 14. Schematic section showing mineralized quartz veins. Docton Point, Harrison Lake.
The mineralized veins appear to follow, and be controlled. by a series of pre-existing,. gently inclined thrust
they form a series of narrow, subparallel shear planes placed from 5 to 20 metres apart (Fig. 141. The plane that cut both the diorites and the hornfelses. Most of these thrusts are unmineralized and in places
unmineralized thrusts are marked by slickensiding and are rarely more than 3 centimetres wide; a t one
diorite s i l l s UD to 0.3 metre wide. Most movement along the thrusts appears to predate the quartz-riulphide locality a subparallel set of gently dipping thrusts cutting the diorite contains grey, biotite-bearin!g grano-
veins. However, the amount of movement across individual thrust planes appears to be small and one basic dyke that intrudes the diorites is offset only 7 to 10 metres across a mineralized vfin. The displacement and slickensiding suggest the thrusting involved overall easterly directed movements.
METRES
I 100 0 104 200 1
300 . . .. e.... .. 0 I I I
I I I
. DIORITE HORNFELS I VOLCANIC BRECCIA
J Figure 15. Relationship between mineralized veins (circles) and the
diorite-hornfels contact, Doctors Point, Harrison Lake.
47

~i~~~~ 16. Geology and plan of the Providence mine workings, Harrison Lake.
VEIN WllHPYRllE FAULTED QUARTZ-CARBONAlf
L I P UNMINERALIZED FAULT WITH DIP
Y I T S E l
OF FAULT PLANE.. . . . . . . . . . . . . A 50
Figure 17. Geology of the Nor. 3 and 4 adits, Providence mine, Harrison Lake.
48

Drilling reveals that some mineralized veins bifurcate and rejoin one another in acomplex manner, similar to that shown on Figure 14. Some late, subvertical normal fractures crosscut and cause minor displacement of the main veins. These later faults can also carry 1 to 3-centimetre-wide gold-bearing quartz-sulphide veins suggesting that some late remobiliration occurred.
A petrographic and scanning electron microscope (SEMI study on the Doctors Poil?t mineralization was completed by Littlejohn (19831. He noted that the native gold is associated mainlv with the pyrite and only to a lesser extent with the arsenopyrite. The gold occurs as small inclusions, nostly less than 0.01 millimetre in diameter and is generally concentrated close to the edges of the sull~hide crystals. Some pyrite and arsenopyrite crystals contain abundant, minute vesicles, which Littlejohn (19831 in1:erprets to result from boiling. The numerous microfractures cutting the sulphides are filled with calcite, Wether with small amounts of gel pyrite, clay, and various silver-bismuth minerals, the most abundant 0.: which are native bismuth and lead-bismuth sulphosalts. Argentite, associated with the bismuth minerals, is also
with and rim the arsenopyrite, present; some native bismuth contains minute specks of chalcopyrite. Traces of !galena are intcrgrown
Littlejohn (19831 concludes that the veins experienced two distinct episodes of precious metal rnineral- ization. The first involved the introduction of gold with the sulphides and quartz. folowed by a period of microbrecciation. The second resulted in injection of the silver-bismuth minerals into the rnicrofractures. A period of calcite injection postdates the early quartz-sulphide-gold .episode, but i t s precise relationship to the later silver-bismuth phase is unknown.
PROVIDENCE MINE
INTRODUCTION
Providence mine (Mineral Inventory 92HiNW-30) is situated close to the shore of Harrison Lake, on the north side of Davidson Creek, approximately 5 kilometres southeast of Doctors Point (Fig. 13). It was worked a t the turn of the century and is covered by Crown grants (Lots 1737 and 1738). To 'date. no published description of either the mine workings, the geology. or the mineralization is availatmle. The Annual Report of the Minister of Mines for 1897 described the property as corltaining 'three distinct
A 45-metre shaft was sunk over the middle lode and over 75 metres of tunnelling completed. Approxi- lodes', the middle one being vertical and the other two converging toward the middle lode wit l i depth.
smelter; these averaged $27 per t on in gold and silver. However. individual assays varied from $1 to $2,000 mately 180 tonnes of ore was stockpiled and in 1896 three car loads of this material were shipped to the
per ton. The ore was described as containing about 40 per cent f ree gold. making it partially freE milling.
GEOLOGY AND MINERALIZATION
The regional geology around the Providence mine consists primarily of massive, dalk green andesites, with lesser amounts of andesitic volcanic breccia. Adjacent to the mine area is a major. north-northeast~treAding fault which passes along Davidson Creek (Fig. 16). The mineralization at the mine is controlled b,y several fractures which are either subparallel to, or represent splays from, the Davidson Creek fault. The geology and location of the adits and shaft, as determined by chain and compass survey, are shown on Fig. 16. Despite early descriptions of 'three lodes' on the property. only two mineralized veins were found during the present survey. The third vein is probably obsured by the tailings dump lyin!g adjacent to the shaft.
Four adits were seen on the property. Two of these were driven in from the l a k e shore and follow the veins for short distances (Fig. 16). A short, 4-metre-long adit was also driven along the southern end of the eastern vein, together with a 34-metre adit which was driven from close by in a westerly direction (Fig. 16).
49

The latter adit attempted to intersect a southern extension of the western vein; however this vein must rapidly die out because it is poorly developed in the adit and contains only minor pyrite with no gold (Fig. 17). On surface this western vein was extensively and deeply trenched, while a shaft was driven down the central portion of the eastern vein (Fig. 16).
The veins are steeply dipping and have a maximum width of approximately 0.7 metre; they largely comprise a complex quartr-carbonate breccia that has sharp, often fractured contacts with the surrounding andesites. However, the wallrocks up to 3 metres from the veins carry irregular, subparallel veinlets of quartz and calcite, while the andesites immediately adjacent to the main veins contain disseminated pyrite. Sulphides are sporadically developed in the veins; in the No. 3 and No. 4 adits (Fig. 16) only weak pyrite is seen, while the trench overlying the western vein carries pyrite with weak chalcopyrite and rare bornite. On the tailings dump, however, numerous large specimens containing pyrite, galena, sphalerite, and lesser
of angular to rounded clasts of rhythmically layered, crystalline and vuggy quartz up to 8 centimetres in amounts of chalcopyrite are seen. In hand specimen the brecciated and mineralized vein material consists
diameter, embedded in a carbonate matrix. These quartz fragments tend to be matrix supported and do not appear to carry any sulphides. The carbonate cement is often rhythmically banded and associated with colliform layered, dark-coloured sphalerite, together with fine galena, chalcopyrite, and pyrite. In parts the carbonate material is also extensively brecciated and recemented, indicating the vein has suffered repeated fault movements. Trace element analyses on samples collected from the tailings dump are shown in Table 2. These show the lead-zinc-copper mineralization is associated with highly anomalous amounts of antimony, silver, and mercury; the latter reaching concentrations of up to 17 ppm (Table 21. The gold content, however, is surprisingly low (Table Z), which seemingly contradicts the early reports of high gold values in these veins (Minister of Mines, B.C.. Ann. Rept., 1897). However, the samples assayed in Table 2 were selected from the galena-sphalerite-chalcopyrite-bearing carbonate matrix, and none of the quartz breccia clasts were assayed. Thus, the gold in these veins is probably confined to the quartz clasts and is absent from the sulphide-bearing carbonate matrix.
TABLE 2 TRACE ELEMENT ANALYTICAL RESULTS,
PROVIDENCE MINE, HARRISON LAKE
28084' 28085* 280863 28087'
A" 0.7 Ag 30
<0.3 <0.3 0.7 <10
C" 86
0.1 % 115 0.55% 160 23
Pb 0.36% 255 0.7 % 590 Z" 2.04% 910 2.6 % CO 6
0.37% 16
M O <3 3 5 7
<3 Ni 6 16 10 12
4
All values (including Hgl in ppm except where recorded in per cent. '"Grab samples of galena-lphalerite-chalcopyrire-bearing mate,.
i d from the tailings dump at Providence mine. Harrison
Au-Ag by fire assay; other elements by AA IHg by cold vapout AAI.
Lake.
The complex brecciated textures in the veins suggest that the following sequence of deformation and mineralization occurred:
(1) Early northeast-trending, brittle faulting in the andesites produced subvertical, open fractures.
( 2 ) Deposition of banded, crustiform, vuggy, possibly epithermal quartz, which probably carried the gold, mercury, bismuth, and antimony.
50

(3) A second period of faulting causing brecciation of the quartz vein.
(4) The introduction of the carbonate matrix, together with the lead, zinc. silver, and copper mineral- ization.
(51 A third period of faulting causing rebrecciation of the quartz and fracturing of the carbonate mdtrix.
This overall pattern of an early generation of quartz and gold, followed by the carbonate and silver, i s similar to the sequence of mineralization in the Doctors Point area (Littlejohn. 19831. This, together with the enrichment of antimony and mercury, could indicate that mineralization in both areas is genetically and temporally related. The complex history also suggests that mineralization may lhave occurred over a relatively long time interval.
RN MINE (GEO) (Mineral Inventory 92H/SW-92)
INTRODUCTION
A very brief visit was made to the disused RN gold mine, situated approximately 4 kilometres northeast of Harrison Hot Springs. The property is being re-evaluated by Abo Oil Corporation who recently reported
ton). The gold is hosted in quartz veins cutting a diorite-quartz-diorite pluton, close to i ts intrusive contact (Huber, 1983) that a 1 100-tonne t e s t bulk sample averaged 45 grams gold per tonne (1.32 ounces gold per
with hornfelsed, deformed slaty pelitic metasedimentary rocks. The latter are believed to belong to the Chilliwack Group, The visit involved both a surface examination of the old RN adit area and collec:tion of mineralized samples from the nearby waste dump for assay (Table 3) and thin-section work.
TRACE ELEMENT ANALYTICAL TABLE 3
RESULTS, RN MINE, HARRISON LAKE
28088' 28089'
A" 1.4 4.3 Ag < l o <10 cu 690 Pb 10
240
2" 21 3
CO
16 19 31
MO Ni
<3 15
6 8
Sb <3 <3
All values in ppm. grab samples of sulphide-rich
quartz vein material from waste
Au-Ag by fire array. other elements dump. RN mine.
by AA.
GEOLOGY
The RN mine adit lies within a coarse, massive hornblende-biotite diorite close to i t s intrusive margin with Chilliwack Group metapeliter. The diorite is cut by narrow, subhorizontal thrust planes which bifurcate
gouge and finelv brecciated material. The gold is hosted in gently dipping to subhorizontally inclined white and rejoin in places. These thrust planes vary from 8 to 25 centimetres wide and generally contain fault
quartz veins. On surface near the adit portal, these have a maximum width of 0.3 metre. The veins have sharp contacts with the diorite; in some parts the margins are weakly sheared and exhibit slickensiding.
51

The veins contain both masses and disseminations of pyrrhotite with lesser amounts of pyrite. Pyrite
associated with late crystalline quartz. Rare chalcopyrite is also present, and a single flake of molybdenum locally forms coarse cubes. The pyrite distribution is patchy and appears to be a late mineral as it is
was noted in one sample. No gold was seen in any of the samples collected.
and occasionally forming thin seams that separate the veins from the diorite. Some quartz crystals in the Fine sericite is also commonly associated with the veins, mostly being concentrated toward the margins
veins also include small blebs of calcite, while the diorite contains finely disseminated pyrrhotite and pyrite some considerable distance from the vein contacts. The analytical results (Table 3) indicate that the sulphide-rich, gold-bearing quartz veins contain weakly anomalous amounts of copper and molybdenum.
either mercury or antimony. However. in contrast to the mineralization at Providence mine and Doctors Point, there is no enrichment in
GENERAL CONCLUSIONS ON THE HARRISON LAKE AREA
( 1 ) Gold mineralization along the Harrison Lake fracture system is hosted in rocks of various ages and lithologies, including basic volcanic rocks, plutonic diorites, and hornfelsed volcanic and sedimentary rocks.
(2) It is unknown whether the various occurrences are the result of a single, regionally distributed gold- mineralizing event, or whether they are of widely different ages. Age dating of both the host rocks and the sericite-bearing occurrences could resolve this question.
(3) All the gold occurrences and deposits represent vein-type mineralization. Two examples (Dandy and Providence mine1 are hosted in quartz-carbonate veins, while the remainder are in quartz-rich veins.
(4) At both Doctors Point and the RN mine the veins were controlled by pre-existing. gently inclined thrust planes. Thus, thrusting may have played an important role in both the regional tectonic history and in locally controlling some of the gold mineralization. The remainder of the occurrences are found in steeply dipping, fracture-filled veins.
(5) Gold throughout the region is always associated with varying amounts of sulphides, of which pyrite and chalcopyrite are the most widespread. Abundant galena and sphalerite are found a t the Dandy occurrence and Providence mine. Arsenopyrite is abundant a t Doctors Point but is absent from the RN and Providence mines mineralization.
(6) Mercury. antimony, and bismuth are associated with the gold a t Providence mine and Doctors Point. By contrast, no mercury and antimony are present a t the RN mine. (Bismuth analyses on samples from the R N property are not yet available.)
(71 Both the Doctors Point and Providence mine mineralization involved an early generation of gold- quartz injection followed by a later phase of carbonate-silver-lead mineralization.
(8) The vuggy, rhythmically layered quartz a t Providence mine, together with mercury and antimony enrichment, suggests it represents lower temperature, possibly epithermal-type mineralization. By contrast, the presence of abundant sericite a t Doctors Point and the RN mine suggests the mineral- ization in these two areas represents higher temperature, possibly mesothermal-type veining.
52

(9) The mineralized veins a t Doctors Point are spatially related to the intrusive margins of diorite plutons.
and mineralization were separated by a considerable time interval. However geological evidence suggests no genetic relationship exists because the plutonic intrusion
(101 Reconnaissance mapping indicates the Doctors Point area lies close to a Middle Jurassic acid volcanic centre. Similar volcanic centres could exist elsewhere in the Harrison Lake Group and these would represent good targets for gold exploration.
(11) To date, no large tonnage, low-grade epitherrnal-type gold mineralization has been discovered along the Harrison Lake fracture system. This could reflect the lack of modern geological mapping and exploration in the area. The fracture system is associated with many highly favourable geological and geochemical factors that indicate it represents an excellent, highly accessible regional exploration target for both vein-type and Carlin or Cinola.type gold mineralization.
ACKNOWLEDGMENTS
The authors wish to thank the management and staff of Rhyolite Resources Inc. for (.heiractive cooperation and assistance during this project, particularly the President, Mr. J. Stewart. Asr.istance in the field by
and P. Wilton. P. Desjardins is gratefully acknowledged as are informative discussions with W. J. McMillan, A. Panteleyev,
REFERENCES
Crickmay, C. H. (1925): The Geology and Paleontology of the Harrison Lake District. unpub. Ph.0. thesis,
Huber, D. (1983): Prosperity Looming for AB0 wi th Alberta Oil and Gold a t Harrison, British C,zlumbia.
Littlejohn, A. L. (1983): Report on Petrography and Mineralogy a t Harrison Lake Property, unpub. rept.
Monger, J.W.H. (19661: The Stratigraphy and Structure of the Type Area of the Chilliwacl.: Group,
.......... (19701: Hope Map-Area, West Half (92H WX), British Columbia, Geol. Surv., Canada, Paper 69-47.
Ray, G. E. (1983): The Nagy Gold Occurrences, Doctors Point, Harrison Lake (9:1H/12W), 6.C. Ministry
Srandford Univ., Ohio, California.
Prospector, May-June, 1983, pp. 13-15.
for Rhyolite Resources Inc., by Vancouver Petrographics Ltd.
Southwestern British Columbia, unpub. Ph.D. thesis, Univ. o f British Columbia.
75 PP.
ofEnergy, Mines& Per. Res., Geological Fieldwork, 1982, Paper 1983-1, pp. 55-61.
Surv., Canada, Mem. 335. Roddick. J. A. (19651: Vancouver North, Coquitlam, and Pi t t Lake MapAreas, British Columbia, Geol.
53

LEGEND
B Z L O D I O R I T E -POSSIBLE EXTEN- SION OF NEEDLE PEAK PLUTON
LOWER CRETACEOUS B JACKASS MOUNTAIN GROUP: CON- GLOMERATE AND WACKE
UPPER JURASSIC m? DEWDNEY CREEK GROUP: WACKES. MINOR SILTSTONE
~ L A D N E R AND DEWDNEV CREEK LOWER TO UPPER JURASSIC
GROUPS: SILTSTONES. ARGILLITES. AN0 MINOR WACKES
?LOWER TRIASSIC 1 G R E E N S T O N E : BASEMENT TO THE
LADNER GROUP
PERMIAN TO JURASSIC HOZAMEEN GROUP
STRIKE AN0 DIP OF B E D D I N G . ” 5 0 . . . . . . . . . . . .
STRIKE AND DIP OF F O L I A T I O N . . . . . . . . . . . . .’%
GOLD DEPOSIT 0
Figure 18. Geology between Coquihalla River and Siwarh Creek.
54

COQUIHALLA GOLD BELT PROJECT (92H/11, 14)
By G. E. Ray
INTRODUCTION
A third and final field season‘s mapping along the northern portion of the Coquih,da serpentine belt was completed using a two-man field crew. The work included the following:
(1) Regional geological mapping (scale 1 :15 000) comprising an 85-square-kilometre, elongate strip stretching from the vicinity of Boston Bar southward to the Spider Peak are?] (Figs. 18, 19, and 20). Mapping was concentrated in areas adjacent to both the Hozameen fault system and the Coquihalla serpentine belt.
(2) Surface examination and sampling of the gold-bearing ‘Monument’ quartz vein (Mineral Inventory 92HiNW-54; Fig. 19).
(3) Collecting grab samples from any sulphide-rich or gossanous zones encountered during the mapping. These were assayed for base and precious metals.
(4) Collecting limestone samples from the Hozameen Group for microfossil age dating
REGIONAL GEOLOGY
The regional geology adjacent to the Hozameen fault system from Coquihalla River to Boston Bar is shown on Figures 18, 19, and 20. South of Carolin mine (Fig. 181 the Coquihalla serpentine belt forms an elong- ate, steeply dipping unit that exceeds 2 kilometres in outcrop width; the eastern and western margjns of the belt are defined by two major fractures, the East and West Hozameen faults (Ray, 1983) that suffered
southwest from the Jurassic Ladner Group to the northeast (Fig. 18). The Hozameen Group comprises an recurrent vertical and transcurrent movement. The serpentine belt separates the Hozameen Group to the
ophiolitic sequence of cherts, pelites. and basaltic greenstones, while the Ladner Grl,up consists la8.gely of a
gradually thins until in the vicinity of Siwash Creek (Fig. 19) the Hozameen and Lsdner Groups itre either succession of turbiditic wackes. siltstones, and slaty argillites. Northward from Carolin mine the belt
in direct fault contact, or separated by narrow lenses of fault-bounded serpentinitt that are generally less than 100 metres in width. North of Gilt Creek (Fig. 19) serpentinites associated with the Hozameen fault disappear entirely; from this vicinity northward to the confluence of the Fraser and Anderson Rivers (Fig.
where serpentinites are t’xposed on the Trans-Canada Highway, southward to an area approximately 2 20). the Hozameen and Ladner Groups are in direct fault contact. However, near Petch Creek (Fig. 20).
kilometres northeast of Chapmans Bar, there is a prominent, continuous belt of serpentinite LIP to 500 metres in width. This belt marks the western, highly tectonized margin of the Hozameen Group and separates this oceanic, mostly suprascustal assemblage from granitic rocks lying immediately to the west. Thus the Coquihalla serpentine belt, which was regarded formerly as a single, discontinuous elongate unit
two belts have contrasting structural and stratigraphic relationships; limited data suggest they al:;o possess (Cairnes, 1929; Monger, 1970; Ray. 1983). is separable into dissimilar northern and southern belts. These
marked petrographic and geochemical differences. Consequently, the northern and southern serpentine belts are probably unrelated; their regional on-strike position is coincidentally caused by a se t of younger,
55
ldegroot
1983

N 1 1
7
Figure 19. Geology between Siwarh Creek and Gilt Creek.
56
oblique faults that pass from Spuzzum north-northeastward to the Anderson River (Figs. 19 and 20). South of Spuzzum this younger but major fault, which probably belongs to the Fraser fault system, continues along the Skeemis Creek valley; north of Gilt Creek it causes a t least 5 to 6 kilometres of right lateral displacement on the older Hozameen fault.
A broad stratigraphic succession is recognized in the Ladner Group (Ray, 1982, 19831 comprising a hetero- geneous lower unit of l i thic wackes and conglomerates passing upward into finer grained, more regularly bedded siltstones and slates. The lower clastic unit is economically important becau!;e it hosts many of the gold occurrences in the Coquihalla gold belt, including the Idaho zone orebody of Carolin Mines Ltd. The lower unit is best developed in the vicinity of this mine, where it exceeds 200 metres in thickness and unconformably overlies an older pillowed volcanic greenstone sequence of possible Early Triassic age (Ray, 1983). Further north and south, however, the fault cuts progressively to higher stratigraphic levels in the Ladner Group. Consequently, north of Spider Peak the Horameen fault cuts mostly slates and siltstones in the higher part of the Ladner Group succession, and the lower coarsely clastic unit is generally absent. The basement greenstones underlying the Ladner Group generally lie south of !;pider Peak (Fig. 18). North of Gilt Creek (Fig. 19). however, there is another 2-kilometre-long unit of presumed basement greenstone exposed which is bounded by faults and serpentinites; it could reprewnt a tectonic slice of basement greenstone offset from similar rocks in the Spider Peak area by transcurrent movement along the
transcurrent displacement took place along this portion of the Hozameen fault system. Hozameen fault. If this interpretation is correct, it indicates that at least 18 kilometres of right lateral
Approximately 5 kilometres east of Stout (Fig. 19) the folded, often gently dipping siltstones of the Ladner and Dewdney Creek Groups are intruded by a large body of massive granodiorite; i t covers at least
previously unmapped extension of the Needle Peak pluton; the Needle Peak pluton has been dated by KIAr 3 square kilometres but i t s full dimensions are unknown. This granodiorite probably represents a northern,
methods a t 39 Ma (Wanless, er a/ , , 1967). The contact of the granodiorite intrusion is marked by a meta- morphic aureole up to several hundred metres wide in the Ladner Group, together with swarms of both porphyritic and evemgrained felsic sills and dykes. At least three types of felsic dykes comprise the swarms; these are:
(2) quartz porphyries with rounded quartz crystals up to 4 millimetres in diameter, and ( 1 ) feldspar porphyries with coarse euhedral feldspar crystals up to 3 centimetres ilcross.
(31 even-grained, siliceous dacitic sills and dykes containing small amounts of biotite and pyrite.
Most sills and dykes are less than 30 metres wide but the feldspar porphyries are extremely widespread within the Ladner Group throughout the district; in places this suite i s associated with weak gold mineral- ization as, for example, a t the Spur occurrences (Mineral Inventory 92H/N\.V-55). These felsic sills predate the main movement on the Hozameen fault, since they are confined to the Ladner Group and abr,ent from both the serpentine belt and the Hozameen Group. Since geological mapping indicates that these sills are related to the Needle Creek pluton, it suggests that the major movements along the Horameen fault took place less than 39 Ma ago.
The Hozameen Group between Gilt Creek and Spider Peak (Figs. 18 and 19) comprise a highly deformed assemblage of cherts, argillites, and altered greenstones in which no stratigraphic succession is recognized. The assemblage is cut by several suites of intrusive rocks of felsic to intermediate composition t h a includes some distinctive quartz porphyries. These intrusive rocks do not occur in the adjacent serpentinites or
fault. Between Boston Ear and Gilt Creek (Figs. 19 and 20) a much wider section (of the Hozameen Group Ladner Group, which indicates that they predate the main transcurrent movemerm along the Hozameen
has been mapped. The oblique right lateral faulting north of Gilt Creek has moved this northern segment of Hozameen Group rocks, together with its westerly bounding serpentinite belt and adjacent granitic rocks, some 5 to 6 kilometres to the north-northeast. The Hozameen Group assemblage in this northern segment, like that south of Gilt Creek, has been intensely deformed and the overall structure i s s1:ill poorly
57

N I I
‘r”
Figure 20. Geology of the Anderson River-Chapmanr Bar area
58

understood, Nevertheless, a broad stratigraphic succession is recognized in the northern segment, consisting of serpentinites a t the base, overlain by a thick unit of greenstones, gabbros, and diorites, whic:h passes stratigraphically upward into a thick sequence of cherts with minor greenstones and argillites. A mixed sequence of cherts, greenstones, altered volcanogenic sedimentary rocks, and small, grey limestone lenses may represent the highest portion of the Hozameen Group stratigraphy exposed in this area, although structural interpretation makes this uncertain. This succession provides supportive evidence that the Hozameen Group represents an ophiolite suite.
The northern serpentine belt represents the deepest recognized portion of the Hozameen Group succession and also generally marks the westernmost boundary of the group (Fig. 20). The belt is fault bounded and
associated with the Hozameen fault further south; they commonly include slice!; of altered ultramafic mostly dips between 40 to 70 degrees east. The serpentinites in the northern segment differ from those
turally overlying greenstone unit also contains thin, discontinuous serpentinite slices. The sharp, easterly material in which primary igneous textures are still recognizable. Locally the strarigraphically and struc-
dipping tectonic contact between the serpentinites and the granitic rocks to the we$t is marked by faulting and shearing. In some places the granites immediately adjacent to the serpentinites show signs of mylonit-
white granodiorite, to well-foliated rocks which includes both leucogranites and highly mafic material. ization. The granitic rocks are texturally varied, ranging from massive, apparently undeformec, pink to
tectonic slices of Custer gneiss. The granitic rocks approximately 2 kilometres east-southeast of Hells Gate Minor amounts of grey, moderately foliated granitic gneiss are also seen; the latter could represent thin,
(Fig. 20) include a thin, elongate xenolith of grey marble more than 250 metres in length. The highly deformed marble contains sharply angular, matrix-supported clasts of pink leucogranite up to 20 centi- metres in diameter; these clasts probably have a tectonic origin,
The intense faulting and the sporadic development of foliated and mylonitized granites indicate that the western margin of the Hozameen Group represents a major, previously unrecognized fault. This fracture apparently cuts granitic rocks in the Hells Gate-Yale area; these granites have been (dated by K/Ar methods a t approximately 40 Ma (Wanless, er a/., 1967) which sets an older time limit for this fault movement.
ECONOMIC GEOLOGY
The area between Spider Peak and Gilt Creek (Figs. 18 and 19) has been actively prospected over the last 90 years and a number of gold occurrences have been located; these include the Roddick, Emigranl:, Marvel, Majestic, Gold Coin, Gold Cord, Spuz. and Monument, as well as the Ward deposit which was briefly worked in 1905. Apart from the Spuz and Monument occurrences, no detailed geological descriptions are available; both the nature of the mineralization and precise locations are uncertain. The remains of an old stamp mill and several collapsed adits at Siwash Forks (Fig. 18) are believed to be the old Ward mine workings (Mineral Inventory 92H/NW-15); reportedly 4 kilograms of gold were produced in 1905 (Mineral Inventory File). The geology in this vicinity comprises Ladner Group slaty argillites with minor amounts of well-bedded siltstones; they are intruded by a large number of porphyritic and massive felsic !;ills. One short exploratory adit on the north side of Siwash Forks follows the edge of a sill; i t seems likely that the gold in this vicinity was won from quartz veins cutting the felsic intrusions.
Another series of adits was reported on the Emigrant property (Minister of Mines, 6.C.. Ann. Rept., 19171 on the south fork of Siwash Creek; these were not seen during the present work. The Majestic (Mineral Inventory 92H/NW-33) is situated in the upper part of Hidden Creek (Fig. 191 where a collapsed adit is reported, This area is underlain by Ladner Group slaty argillites and siltstones that are intruded by numer- ous felsic sills. The weak gold mineralization on this property is also probably found in quartz vei , is cutting these felsic intrusions.
59

The Monument gold occurrence (Mineral Inventory 92H/NW-54). situated 3 kilometres southeast of Stout (Fig. 191. is hosted in a steeply dipping 1 to 2.5-metre-wide quartz vein that has a strike length of approxi- mately 350 metres (Cochrane and Littlejohn. 1978; Cardinal, 1982). The Monument vein is subparallel to, and 200 metres east of, the Hozameen fault; it is hosted in deformed slaty argillites of the Ladner Group. The white quartz vein contains minor amounts of fine pyrite with rare arsenopyrite and chalcopyrite; five grab samples collected by Cochrane and Littlejohn (1978) averaged 2.8 grams gold per tonne (0.084 ounce per ton) with one richer sample assaying 10.1 grams gold per tonne (0.297 ounce per ton). Cochrane and Littlejohn (1978) report that visible gold in the Monument vein occurs either as small rounded particles
shear surfaces a t the quartz vein-argillite contact. between 0.5 to 2 millimetres in diameter embedded within vuggy quartz or as small thin flakes coating
The Spuz occurrences (Mineral Inventory 92HiNW-55) comprise numerous minor gold showings that are associated with felsic sills and dykes which intrude the Ladner Group north and northwest of Siwash Forks. The very fine, erratic gold i s hosted in narrow quartz and quartz-calcite veins that fil l brittle fractures and boudin structures in the sills. These veins also carry sparse pyrite and rare arsenopyrite (Cochrane and Littlejohn, 1978; Cardinal, 1982). while the former authors also report the presence of rare scheelite mineralization.
The felsic sills associated with the granodiorite body 5 kilometres east of Stout (Fig. 19) are occasionally
alteration is seen in the thermally altered siltstones within 1 kilometre of the granodiorite margin, where related to weak pyritization in the adjacent country rocks. However, more intense, pervasive sulphide
with some weak silicification and iron carbonate alteration, This pyritization appears to be associated with dyke swarms of felsic intrusive rocks are common. The metasedimentary rocks contain disseminated pyrite
the siliceous dacitic sills and not related to the more abundant feldspar porphyry intrusions. Grab samples of sulphide-rich material were assayed for base and precious metals without significant results. However, a t
thermally altered, sulphide-rich siltstones are cut by 5 t o 8-centimetre.wide vuggy quartz veins which are one locality (620100E - 54985OON) less than 100 metres from the granodiorite margin (Fig. 19). the
folded and sheared. These veins contain pyrite. chalcopyrite, and some coarse flakes of molybdenum, but no gold. This previously unreported copper-molybdenum occurrence suggests that the Needle Peak pluton and i t s thermal aureole could represent a viable exploration target for base metals and possibly gold.
DISCUSSION
REGIONAL CONTROLS OF MINERALIZATION IN THE COQUIHALLA GOLD BELT
The Coquihalla gold belt comprises the currently operating Carolin mine and four past producers (Emanci-
These deposits and occurrences are extremely variable in their form, geochemistry. mineralogy, and host pation. Aurum, Pipestem. and Ward), as well as 19 minor gold occurrences (see Table 3. Ray, 1983).
producers are hosted in several different rock lithologies: Carolin and Pipestem in sedimentary wackes, rock lithology: this makes it diff icult to recognize common relationships and controls. For example, the
varies widely from discrete quartz veins as seen a t Emancipation mine, to more diffuse, possibly replace- Emancipation in volcanic greenstones, Aurum in talcose shears, and the Ward" in felric sills. Their form
ment.type orebodies as found at Carolin mine. The gold-bearing quartz veins at Emancipation mine and the Monument and Murphy occurrences are sulphide poor, whereas the mineralization a t Carolin mine and the McMaster zone are rich in pyrite, pyrrhotite. and arsenopyrite.
The sparse available data suggest the gold mineralization along the belt exhibits some geochemical as well as mineralogical differences. No mercury enrichment is reliably reported from any occurrence or deposit but both the Carolin deposit (Ray. 1983) and the Monument vein (Cochrane and Littlejohn, 1978) are
60
*No geological description of t h e Ward mine ex1StS. The afsumption that the mineralization WBI hosted in felsic s i l ls is based on the geology tn fhe Ward mine area.

associated with anomalous tungsten values. The identical mineralogy and geochemistry of the Carolin deposit and the McMaster zone suggest that the two are related and synchronous; they are distinc:tive in that the gold-sulphide mineralization is associated with abundant albite. No such :.odium enrichrnent is
gold occurs within the East Hozameen fault; it is closely associated with the talcose, highly sheared ser- reported elsewhere in the belt. The Aurum mineralization is unique because i t is the only example where
pentinite margin. It also appears to include a variety of sulphides. including millsrite (Cairnes, 1929).
Despite these variations some generalizations are possible. In all cases the introduction of gold was accom- panied by variable amounts of silica and a t least four forms of orebody or occurrences are recognized; these are:
Thin, highly irregular and generally discontinuous quartz veins; these host the !majority of the minor gold occurrences including the Murphy and Spuz occurrences.
More continuous, wider, and discrete quartz veins as seen a t the Emancipation mine and the Monu- ment occurrence.
Irregular orebodies hosted in highly fractured, coarse clastic sedimentary rocks which are ass'xiated with silicification, network quartz veining, albitization, and abundant sulphides as present a t the Carolin mine deposit and the McMaster zone. Recent underground mapping by Carolin mine geolo-
formal hinge zone. gists (Shearer and Niels, 19831 shows that the Idaho zone mineralization is concentrated in an anti-
Gold within talcose shears along the East Hozameen fault immediately adjacertt to serpentinites and
this type. Ladner Group metasedimentary rocks. The Aurum mineralization is the only discovered example of
When the deposits and occurrences in the belt are examined, some relationships between their host rock types. and their distance from both the East Hozameen fault and the greenstone-Ladner Group c:ontact are discernible. Figure 21a shows the five gold producers together with 13 occurrences for which reliable data is available; it plots their host rock type and relative distance from the East Hozameen faLllt and serpentinite contact. This shows the gold is found only east of the East Hozameen fault and none is report- ed from within the serpentine belt. Moreover, the majority of occurrencesare hosted in metasedimentary rocks, mostly belonging to the Ladner Group. While gold can be found up to 1 kilometre east of the serpentine belt, most occurrences and deposits are concentrated within 600 metres of the East Hozameen fault. Figure 21b clearly demonstrates moreover, that most gold production in the Ibelt was derived from deposits less than 200 metres from the serpentinite margin and East Hozameen fault.
Figure 22a reveals the close spatial relationship that exists between the greenstone-L.adner Group (contact and various deposits and occurrences for which reliable location data exist. This relationship i s further demonstrated on Figure 22b which shows that over 95 per cent of the gold production from the belt has taken place within 150 metres of this lithological contact.
Thus, the main regional controls to mineralization in the Coquihalla gold belt are:
(1) The presence of competent rocks suitable for open space fracturing. Consequently the area between the Emancipation mine and Spider Peak, where the lower coarse clastic rocks of the Ladner Group are best developed, contains most o f the sediment-hosted gold occurrences, as well as the Carolin mine deposit (Fig. 18).
(2) Close proximity to the volcanic greenstone-Ladner Group contact. In many places the unconformable contact, due to competency differences, is marked by shearing, brittle fracturing. and quartz ,veining.
61

WEST EAST ,-EAST HOZAMEEN FAULl
I FELSIC SILLS
+- J y1 m SEDIMENTARY ROCKS
GREENSTONE
0 200 400 600 800 1000
METRES
GOLD DEPOSIT.. . . . . . .a GOLD OCCURRENCE. _ . . . . . . .x
Figure 21a. Coquihalla Gold Belt -relationship between host rock lithologies and distance Of mineralization from the East Hozameen fault.
300
a
0
METRES
Figure 2 l b . Relationship between gold production from the Belt and distance from the Hozameen fault.

WEST EAST UNCONFORMITY
GREENSTONE LADNER AND DEWDNEY CREEK GROUPS
x x x EMANCIPATION
CAROLIN PIPESTEM
AURUM
I
400 200 0 200 400 600
METRES
GOLD DEPOSIT.. . . . . . , , .e GOLD OCCURRENCE.. . , . . . . .x
Figure 228. Ccquihalla Gold Belt - relationship between gold mineralization and the Ladner Group-greenstone contact.
METRES
63

(3) Close proximity (less than 200 metres) to the East Hozameen fault and serpentinite margin. However, this fault does not represent a single fracture that suffered recurrent movements, but instead com- prises several generations of oblique, intersecting faults as seen in the Emancipation mine vicinity (Fig. 18). This probably accounts for the variation in intensity of shearing and alteration along the fault system. In some parts the serpentinite contact is sharp and unaltered, whilst close to the Emancipation and Aurum deposits the fault is occupied by a wide unit of highly sheared talc. The gold mineralization may only show a spatial relationship to one particular generation of fracturing i n the East Hozameen fault system, which would explain why certain areas adjacent t o the fault, despite having favourable brittle host rocks, do not contain any gold occurrences.
SUMMARY
(1) The Coquihalla serpentine belt, which was previously regarded as a single, related unit, is separable into distinctive northern and southern belts which have entirely different tectonic relationships and are probably unrelated to each other.
(2) The northern serpentine belt generally occupies the western, highly tectonized margin of the Hoz- ameen Group; it separates these rocks from variable granitic rocks further west.
(3) The southern belt is associated with the Hozameen fault system and generally marks the eastern boundary of the Hozameen Group, separating these supracrustal rocks from the Ladner Group further east.
(4) Numerous gold occurrences and deposits are located adjacent t o the southern serpentine belt, but the northern belt is not associated with any gold mineralization. This suggests that the two belts could have fundamental geochemical differences.
(5) The Hozarneen Group contains a broad stratigraphy consisting of basal serpentinites (northern serpentinite belt) overlain by greenstones and gabbros, which pass upward into a predominantly chert assemblage. This stratigraphy suggests that the Hozameen Group represents an ophiolite sequence.
( 6 ) An upward-fining stratigraphic succession is recognized in the Lower t o Middle Jurassic Ladner Group. These metasedimentary rocks unconformably overlie a greenstone unit of possible Early Triassic age. The lowermost coarse clastic unit in the Ladner Group is economically important as it hosts the Carolin mine deposit (Idaho zone) and many other gold occurrences.
(7) The Pipestem mine mineralization is hosted in fossiliferous wackes which were formerly regarded as belonging to the middle portion of the Ladner Group stratigraphic sequence (Ray. 1983). However, Euchia fossils in these wackes are identified as Late Jurassic in age (H. Tipper: J. A. Jeletzky. personal communication) indicating that the host rocks belong t o the Dewdney Creek Group, which elsewhere disconformably overlies the Ladner Group (Coates, 1974). Thus some rocks previously assigned to the Ladner Group, including those in the vicinity of Ladner Creek, probably include Dewdney Creek Group metasedimentary rocks. The general absence of megafossils and the similar sedimentary lithologies makes i t di f f icult to distinguish these two groups in the field.
(81 Although gold mineralization throughout the Coquihalla gold belt was generally accompanied by the introduction of silica, usually as quartz veins, the mineralogies. form of occurrence, and host rock lithologies are highly variable.
64

(9) Most minor gold occurrences are associated with thin, irregular, discontinuous quartz veins, a t the
and more continuous (up to 350 metres). Emancipation mine and the Monument occurrence, however, the veins are wider (0.5 to 2.5 (metres)
(10) Most gold mineralization throughout the belt is sulphide poor. However, the mineralization a t Carolin mine and the McMaster zone contains up to 15 per cent sulphides, mainly pyrrhotite, pyrite, and arsenopyrite; it i s also associated with abundant albite.
(11) A number of regional controls to mineralization in the Coquihalla gold belt are recognized; these include (a ) the presence of brittle host rocks suitable for open space facturing, (bl proximity to the East Hozarneen fault and the eastern margin of the southern serpentine belt, and (cl proximity to the
of the total gold production from the belt has come from deposits less than 200 metres from the East Ladner Group-greenstone unconformity which is often the locus of brittle shearing. Over 95 per cent
Hozameen fault and the basal Ladner Group unconformity.
(12) Porphyritic felsic sills intruding the Ladner Group throughout the district are probably relatecl t o the Needle Peak pluton, which has been dated a t 39 Ma. The age of the mineralization a t Carolin mine
the belt is less than 39 Ma in age. and elsewhere is unknown; however, sporadic gold hosted in the felsic sills indicates that some gold in
(13) These felsic sills are only found in the Ladner Group which suggests that the major movements along the Hozameen fault system postdate 39 Ma. Geological interpretation indicates that a t least '18 kilo. metres of right lateral transcurrent movement occurred along the Hozameen fault.
(14) The discovery of pyrite-chalcopyrite-molybdenum mineralization in the faulted, thermal mstamor-
could form a viable exploration target for base and precious metals. phic aureole of what is believed to be the Needle Peak pluton, suggests that this granodiorite body
(15) The Hozameen Group. which appears to represent an oceanic ophiolite suite, could form a good regional exploration target for massive sulphide deposits containing gold andlor (cobalt.
ACKNOWLEDGMENTS
The author wishes to thank the management and staff of Carolin Mines Ltd. and Aquarius Resources Ltd. for their active cooperation, particularly D. G. Cardinal, R.J.E. Niels, and J. T. Shearer. Thanks :Ire also expressed to H. Tipper and J. A. Jeletrky of the Geological Survey of Canada for the identification of macrofossil material and to the staff of the Ministry of Energy, Mines and Petroleum Uesources' Laboratory for analytical and X-ray work. Constructive criticism by W. J. McMillan and J.W.H. Monger is also gratefully acknowledged, while the fieldwork was helped by the continued excellent performance of P. Desjardins as field assistant.
REFERENCES
Cairnes. C. E. (19291: The Serpentine Belt of Coquihalla Region, Yale District, British Columbia, Geol.
Cardinal, D. G. (1982): Report on Portions of the Spuzzum Group Properties, Aquarius Resources Ltd.,
Coates. J. A. (1974): Geoiclgy of the Manning Park Area, Geol. Surv.. Canada, Bull. 238, 177 pp. Cochrane. D. R . and Littlejohn. A. L. (1978): Spur A, 8, and G Claims, Longbzr Minerals Ltcl., B.C.
Surv.. Canada, Summ. Rept.. 1929, Pt. A, pp. 144-197.
unpub. rept.
Ministry of Energy, Mines & Pet. Res., Assessment Report 6962.
65

Monger, J.W.H. (1970): Hope Map-area, West Half (92H W W , British Columbia, Geo/. Surv., Canada,
Ray, G. E. (1982): Carolin Mine - Coquihalla Gold Belt, B.C. Ministry of Energy, Mines & Pet. Res.,
.......... (1983): Carolin Mine - Coquihalla Gold Belt Project (92Hi6. 11). B.C. Ministry of Energy, Mines
Shearer, J. T. and Niels, R.J.E. (1983): Carolin Mines: A Geological Update, Western Miner, November 1983, pp. 21-24.
Wanless, R . K.. Stevens, R . D., Lachance. G. R., and Edmonds. C. M. (1967): Age Determinations and Geological Studies, K/Ar Isotopic Ages, Geo/. Surv., Canada, Paper 66-17, Rept. No. 7, pp. 11-14.
Paper 69-47, 75 pp.
Geological Fieldwork, 1981, Paper 1982-1,pp. 87-101.
&Pet. Res., Geological Fieldwork, 1982, Paper 1983-1, pp. 62-84.
66
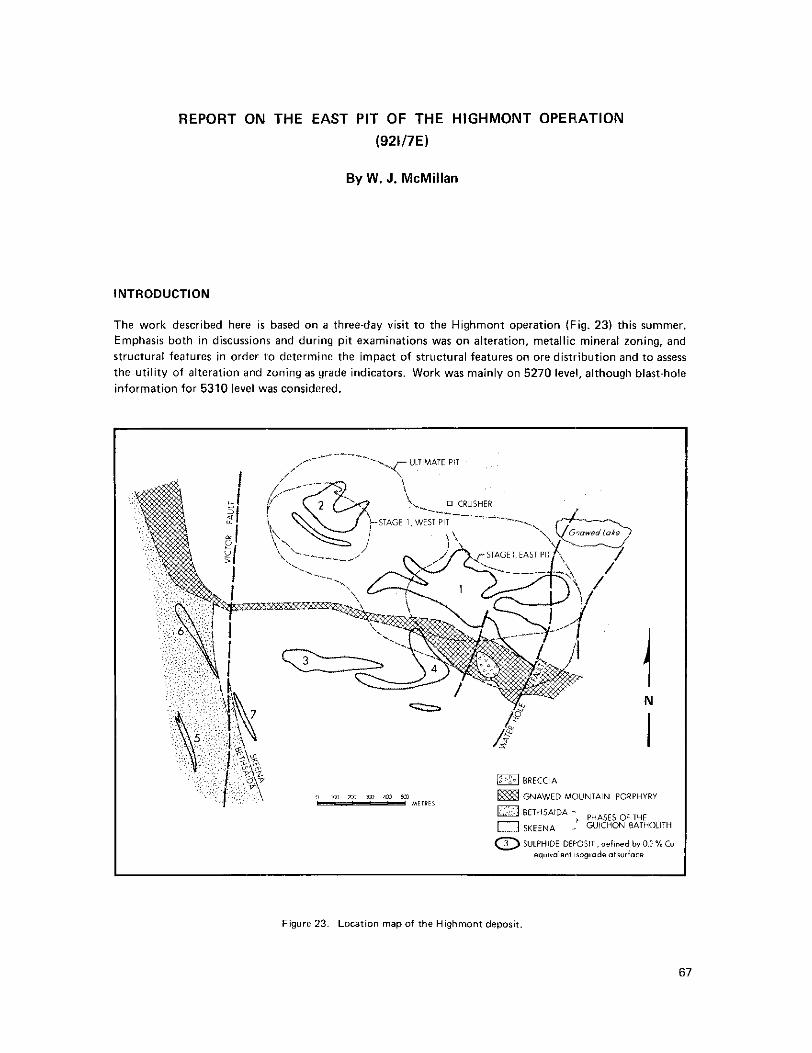
REPORT ON THE EAST PIT OF THE HIGHMONT OPER,ATlON
(921/7E)
By W. J. McMillan
INTRODUCTION
The work described here is based on a three-day visit t o the Highmont operation (Fig. 23) this summer. Emphasis both in discussions and during pit examinations was on alteration, metallic mineral zoning, and structural features in order to determine the impact of structural features on ore distlibution and to assess the utility of alteration and zoning as grade indicators. Work was mainly on 5270 level, although blant-hole information for 5310 level was considered.
, / ."""" -. y- ULTIMATE PIT
N
I 0 I r n r o r n d m y o - Mt,*ES
GNAWED MOUNTAIN PORPHYRY
-+ PHASES OF THE 0 SKEENA GUICHON BATHOLITH
0 SULPHIDE DEFOSII , delfned by 0.: % Cu ~ q ~ c ~ o l e n f ~mgrodearwrfare
Figure 23. Location map of the Highrnont deposit
67
ldegroot
1983

ALTERATION
INTRODUCTION
The degree of alteration in the rocks is highly variable and closely related to the density of mineralized fractures. Fresh-looking rocks and more altered rocks lie side-by-side; widespread pervasive alteration zones are uncommon. The amount of weak, moderate, and intense plagioclase alteration is important because it indicates the relative intensity of the hydrothermal activity; it may relate to ore grade.
The following alteration sequence is mainly after Reed and Jambor (1976):
TIMING ALTERATION MINERALOGY
Early Potassic core and propylitic fringe Biotite, K-feldspar, chlorite, epidote, albite Phyllic Quartz. flaky sericite Propy-argillie overprint Sericite, kaolinite. montmorillonite, chlorite, epidote Argillic Propylitic
Late Calcite. zeolite veins
Kaolinite Chlorite. epidote, albite
SECONDARY BIOTITE DISTRIBUTION
Secondary biotite was evidently widespread. It filled fractures, replaced primary hornblende, and formed overgrowths on primary biotite (Reed and Jambor, 1976; this study). This event was early; much of the secondary biotite developed was subsequently chloritized and/or epidotized, thus recognition in thin sec- tion often rests on textural interpretation, I n hand specimen it can be recognized with a hand 1ens;altered hornblende crystals have a distinctive felted texture and grain borders are finely ragged, not sharply defined.
distribution. It seems to be most common in the ore zone and near the Gnawed Mountain dyke. The distribution of secondary biotite should be studied further to define i t s relationship, i f any. to ore
PLAGIOCLASE ALTERATION
Plagioclase alteration should be considered from two points of view; clarity of crystals and colour. On one hand plagioclase changes from glassy t o clouded as alteration increases, in addition, colour changes reflect the alteration mineralogy. Grey colour is generally caused by clays and sericite, chalky white by kaolinite, greenish white by sericite-carbonateepidote. olive green or pink by sericite and carbonate, and emerald green by sericite.
K-FELDSPAR DISTRIBUTION
K-feldspar is relatively common both as a vein fill ing and in alteration envelopes in the East Pit. It is
sericite zones. Pervasive K-feldspar alteration of matrix and phenocrysts is rare. most abundant in alteration fringes on veins and fractures; some also occurs in quartz veins or quartz
K-feldspar is a shade of pink that is visually distinguishable, with practice, from other pink plagioclase alteration. The other alterations represent either a dusting of hematite or sericite plus carbonate alteration.
destroyed in olive-green alteration zones. Primary K-feldspar is interstitial and 10 to 15 per cent by volume. It survives most alteration but is usually


FLAKY SERlClTE DISTRIBUTION
accordance with Reed and Jambor's interpretation (1976) it is a good indicator mineral for ore-grade Flaky sericite is common in better grade copper zones and generally present in lower grade zones. In
with flaky sericite alteration more or less delineates the East Pit orebody (Reed and Jambor, 1976; this material. While it does not always itself constitute ore, mineralization in veins and fractures associated
study).
Distribution maps show that flaky sericite correlates poorly with molybdenite. unless there is coincident molybdenum and copper enrichment.
ALTERATION OF MAFIC MINERALS
Chlorite is ubiquitous but the degree of mafic alteration varies; no patterning that would act as ore guides was recognized. Locally, mafics are sericitized; usually in areas with olive-green feldspar alteration.
throughout the deposit but abundance varies; it is not known if it relates to grade distribution. Epidote Epidote occurs in veins, fractures, and as an alteration product in mafic minerals or plagioclase. It is found
and chlorite are distributed throughout the ore zone; that is, propylitic alteration characterizes the ore zone. Judging by alteration of early developed biotite, it is a retrograde overprint in the ore zone. Peri- pheral propylitic alteration, however, was an early event (Reed and Jambor, 19761.
OTHER ALTERATION MINERALS
Other alteration minerals are actinolite and tourmaline. Actinolite occurs both in fractures and as a replace- ment of primary amphibole. Tourmaline is fracture-controlled and is an important constituent in breccia zones (see Reed and Jambor, 1976).
HYPOGENE MINERAL ZONING
Although the dyke acted as a heat source, hot fluids probably dominated heat transfer and fracture density- Hypogene mineral zoning patterns are related to both the Gnawed Mountain dyke and fracture swarms.
was not likely as high as that in hydrothermal veins. Zoning patterns are subparallel to the dyke (see Reed controlled temperature gradients. The rock mass as a whole was hot but post-emplacement temperature
and Jambor, 1976). Although the bornite zone occurs mainly in and near the dyke, 'fingers' of it extend out into the pyrite zone. These coincide with zones of higher copper grade that are controlled by north- east fracture swarms, that is, zones with high permeability. Fluids moving outward in these highly per- meable zones evidently moved faster and stayed hotter than those in adjacent, less permeable zones.
The relative abundance of bornite relative to chalcopyrite is important in predicting grades and ore trends. The mineralogy and frequency of mineralized veins and fractures are also important. For example, a t HE1 1 (Fig. 24) veins with flaky sericite halos are bornite-rich and constitute ore, even though they comprise only one fracture set.
HIGHMONT STRUCTURE
COPPER DISTRIBUTION IN THE EAST PIT
25 and 26). However, several interpretations are possible for weaker trends because overlapping patterns INTRODUCTION: Copper contours show very clear trends that relate to several fracture directions (Figs.
become diffuse. Pi t mapping indicates (G. Sanford, personal communication) that dominant trends average 025 degrees, 040 to 050 degrees, and 140 to 150 degrees; lesser trends are 075 and 095 degrees.
70

71

72

COPPER, 5270 LEVEL: On 5270 level contoured blast-hole assays for copper give patterns that i~llow
dominant trends in the patterns are as follows; in degrees azimuth: more than one interpretation, although dominant elements are common. Two possible interpretations of
Interpretation I (in sequence of relative abundance based on contour patterns only): 1135.060, 120. 090.
Interpretation II (based on patterns and utilizing field information from G. Sanford, personal communi- cation): 025, 140,060,090.
Contoured blast-hole assays clearly confirm that mineralized vein and fracture orientations largely con- trol copper grade patterns. However, some anomalies remain; for example, there is a slight discrepancy in azimuth between dominant northeast and southeast trends estimated from blast-hole assays and those measured during pit mapping.
Grade trends on 5270 level confirm strong development of northeasterly oriented, better grade copper zones. From west to east these apparently fan slightly - from 040 to 060 degrees in the west t o 030 to 040 degrees centrally and in t.he east.
This northeast pattern dominates in the central area; it is weaker in the west and weaker still in the east, where southeast-trending fractures are prominent. Consistently, the southeast se t trends 115 to 125 degrees across the width of the pit. It seems likely that the northeast fracture; are younger: they apparently overprint the southeast set.
Adjacent to and in the Gnawed Mountain dyke grade patterns are elongated and parilllel to the borders of the dyke.
The relative importance of fractures trending 140 to 150 degrees is not evident from contoured blast-hole assays.
COPPER, 5310 LEVEL: Near the dyke on 5310 level east-west trends predominate. Elsewhere domi- nant trends are northeast and southeast, subparallel to those on 5270 level (described previously).
ORIENTATION OF COPPER ZONES: Copper zones dip, plunge, coalesce, split, and reorient between
trend 025 to 035 degrees range in dip from 45 degrees northwest through to subverlical. East-west zones 5310 and 5270 levels. In spite of the variations though, general trends are fairly ccnsistent. Zones that
along the Gnawed Mountain dyke have moderate north or moderate south dips; zones trending 060 degrees generally dip about 60 degrees southward. Better grade zones tend to form dipping sheets. Zones trending
trending zones; these pipes usually plunge northwestward. 120 degrees dip steeply southward and tend to form elliptical pipe-like 'shoots' a t junl:tions with northeast-
fractures on 5270 level. An example is near 760OON 115000E. I n several instances zones dominated by northeast fractures on 5310 level are dorninated by nol-thwest
SUMMARY: Higher copper grades reflect strong fracturing in a northeast direction; grade patterns indi- cate interaction of several crossing fracture sets. The fractures are not vertical (12. Stanford, F'ersonal
elliptical 'pipes'. Fracture mapping should enable ore trends and plunges to be prediaed. communication), so better grade ore zones can be expected to be in the form of dipping sheets or plunging
73

MOLYBDENITE DlSTRl8UTlON IN THE EAST PIT
INTRODUCTION: Molybdenite occurs with chalcopyrite in thick quartz veins and with chalcopyrite and lesser bornite in fractures and veins. The thick veins generally have an olive-green alteration selvedge several metres in width. As at Lornex, they apparently past-date main-stage mineralization. In the East Pit, veins of this type strike about 030 degrees or 060 to 080 degrees and dip 040 to 060 degrees, usually toward the northwest. Molybdenite is apparently not abundant in the older veins and fractures.
DISTRIBUTION PATTERNS: Molybdenite in the East Pit is more restricted in distribution than copper
zones (Figs. 27 and 281. but better grade copper zones (Figs. 25 and 261 correlate reasonably well with better grade molybdenite
low copper concentrations, Another such area is near 111250E. 76200N on both 5310 and 5270 levels. Locally, particularly along the east side of the pit on 5270 level, molybdenum is concentrated in areas with
Molybdenite values are relatively low near the Gnawed Mountain dyke.
Fracture and vein mineralogy show a t least two distinct episodes of molybdenum mineralization. The earlier accompanied chalcopyrite-bornite mineralization; the later occurs in quartz veins with chalcopyrite -some are up to one metre wide.
The thick younger veins may carry spectacular molybdenum values but could be missed if blast-hole drilling was not accompanied by mapping. For example, between sample sites M1 and M2 (Fig. 27) there is a molybdenite vein that strikes 080 degrees and dips 040 degrees northward. Contours drawn only from the blast-hole assay data would not show real grade trends - part of the vein would be designated waste! Similarly. the vein between sites M9 and M I 0 was intersected by only one blast hole and most of it would show as waste.
east side of the pit. Dominant fracture systems are apparently northeast (about 025 to 045 degrees) and On 5270 level molybdenum values are relatively low close to the Gnawed Mountain dyke, especially on the
east-northeast (090 to 095 degrees). Weaker zones are oriented southeast (1 15 degrees).
The dominant controlling fracture set for molybdenum mineralization on 5310 level trends 030 to 045 degrees. Distribution patterns of molybdenum are complicated by interaction of these and less intense fracture sets at 050 to 060 degrees, 085 to 090 degrees, and 120 to 125 degrees.
These trends correlate closely with those controlling copper mineralization on both 5310 and 5270 levels.
ORIENTATION OF MOLYBDENITE ZONES: Molybdenite zones apparently plunge and dip; they narrow slightly from 5310 to 5270 level and zones that are coherent on 5310 level may split on the lower level.
eastward. Away from the dyke four major northeast-trending zones apparently dip northwest a t about 45 Near Gnawed Mountain dyke, centered on 110600E. 75800N. ameboid zones apparently plunge 30 degrees
degrees. Associated east to southeast-trending fracture systems apparently either dip southwest or are vertical.
CONCLUSION
The Gnawed Mountain dyke acted as a heat sink that influenced the hydrothermal regime at Highmont. Alteration and hypogene mineral zoning patterns are irregular in detail but subparallel, in general, to the
74

"7 A I
. 2
0 0
0. 0
2
0
ui D 0 h . .
D UI
D ? .
75

0 a
0
76

dyke (Reed and Jambor. 1976). Near the dyke bornite is an important ore mineral; away from it chalco- pyrite becomes dominant, then there is a weak pyrite 'halo'. Ore grades occur locally in the pyrite halo and parts of the bornite zone are waste. Silicate alteration assemblages were similarly influenced but
dyke. zones of more intense alteration reflect fracture intensity, hence porosity, more than proximity 1 0 the
Fracture density during mineralization controlled permeability and ore fluid flow parhs. Fractures occur in swarms; they are not uniformly distributed. Therefore, grade and alteration patterns, which were con- trolled by the ore fluids, are irregular in outline and variable in intensity.
Fractures that control ore zones have several orientations and moderate to steep dips. Therefore, ore zones dip and zones that are controlled by intersections of fracture swarms plunge. Careful mapping, Particularly of mineralized fracture orientation, density. and mineralogy is needed to enable accurate downward Pro- jections of ore zones.
ACKNOWLEDGMENTS
The cooperation and hospitality of staff at Highmont are gratefully acknowledged, special thanks go to Mine Manager, E. R. Williams; Chief Geologist, L. Tsang; and Pit Geologist, G. Sanford. E. Sadar of the Inspection and Engineering Branch in Kamloops kindly loaned the author a vehicle 'to facilitate the work.
REFERENCE
Reed, A. J. and Jambor, J. L. (1976): Highmont: Linearly Zoned Copper-Molybdenum Porphyry Deposits and Their Significance in the Genesis of Highland Valley Ores, C.I.M.M., Spec. Vol. 15, pp. 163-181.
77

78

MINERAL EVALUATION STUDY OF THE CLUCKATA RIDGE AREA TASEKO LAKES MAP-AREA
(920/3)
By W. R. Smyth
INTRODUCTION
assessment. The entire ridge, encompassing 1 995 hectares, was proposed by the Ministry of Lands, Parks A half-day reconnaissance of the Cluckata Ridge (Fig. 29) area was made in August 1983 for land use
and Housing as an Ecological Reserve to protect subalpine and alpine range land. I f approved the area would be alienated from mineral exploration and mining. A large pyritic. limonitic capping, clearly visable from the air, occurs a t the northeast end of the ridge. For this reason the mineral reserve request has been denied to allow time for a more detailed assessment of the mineral potential.
LOCATION AND ACCESS
Cluckata Ridge in Taseko Lakes map.area of south-central British Columbia forms part o f the Chilcotin
Cluckata Ridge is bounded by U-shaped valleys occupied by Tosh Creek, Grant Creek, and Big Creek. Ranges that occur between the Coast Mountains to the southwest and the Fraser Plateau to the no,theast.
There is no road access and the nearest helicopter bases are a t Lillooet 100 kilometre; to the east-southeast and Gold Bridge over 60 kilometres to the south,
REGIONAL GEOLGY AND PREVIOUS WORK
Cluckata Ridge is part of the Tyaughton Trough, a northwest-trending belt o f Upper Jurassic to Upper Cretaceous rocks (Jeletzky and Tipper, 1967). The Taseko Lakes maparea (9201 was mapped a t 1::!50000 scale by Tipper (1978) who showed Cluckata Ridge to be dissected by a splay of th? Taseko fault. Rocks eas t of the fault were assigned to the Cretaceous Kingsvale Group and those to the west to the Pioneer
the area in 1973 and discovered a large capping a t the northeast end of Cluckata Ridge, called ths Comin Formation of the Upper Triassic Cadwallader Group. Cominco Ltd. carried out reconnaissance mapping in
Home showing. Cominco abandoned their claims in the area in 1975 and hence did not file an ass'3ssment
report with the Ministry. In 1980, the Ministry released results of a stream sedimeit survey from Taseko
arsenic, zinc, copper, and lead. Barrier Reef Resources Ltd. carried out a regional geochemical and geolog- Lakes map-area (BC RGS-31. Samples collected from Tosch Creek and Big Creek arc weakly anomalous in
Their assessment reports include a brief description of the Comin Home showing. This mineral occ:urrence ical prospecting program in the area in 1979 and staked claims a t the northeast end of Cluckata Ridge.
does not appear on the Ministry's Revised Mineral Inventory Map (9201, and i ts ex stence was not known to the Mineral Land Use Section until seen in the course of this fieldwork. Barrier Reef Resources sur- rendered their claims in 1982 and the entire study area is currently open to staking.
GEOLOGY AND MINERALIZATION
Cluckata Ridge is underlain by a sequence of gently dipping volcanic flows, tuffs, and breccias, with minor amounts of intercalated volcaniclastic rocks. No evidence was found to confirm that a splay of the Taseko fault dissects the ridge; the entire rock sequence is presumed to be part of the Kingsvale Group.
79
ldegroot
1983

Most of the volcanic flows are andesitic to basaltic in composition. They are green, grey to purple, and generally rusty on weathered surfaces. The flows vary from fine grained to feldspar porphyritic and are commonly vesicular. Locally buff to white, rhyolitic, welded ash flow tuffs are intercalated with the volcanic flows. A t the east end of Cluckata Ridge the volcanic rocks are cut by rare quartz feldspar por- phyry dykes averaging 2 metres in thickness. The dykes are leached with pale broken surfaces but rusty weathered surfaces.
The map unit of economic interest is exposed on a steep north-facing slope a t the east end of the ridge. I t consists of a large, leached capping up to 600 metres in length. The rock is deeply weathered, white, fine-grained andesite (?) that has rusty limonite-weathered surfaces; it contains up to 5 per cent pyrite as disseminations and aggregates. The rock is highly porous suggesting some leaching of sulphides. Kaolin- ization, sericitization, and minor silicification are present. Dawson (1981) reported ‘minor galena and pyrite on fracture planes and in narrow quartz stringers’. Cominco reported that material containing pyrite gave gold values up to 0.02 ounce per ton (0.69 gram per tonne) and 0.18 per cent copper; these results were confirmed by Barrier Reef Resources (Dawson, 1981).
No contacts were observed in this study between the leached capping and fresh unaltered andesite which occurs nearby to the west. The capping is similar to that associated with leached quartz feldspar porphyry dykes which cut volcanic rocks on the south side of the ridge 1 kilometre to the southwest. The mineral- ization is possibly related to subvolcanic intrusive activity which is manifested by the porphyry dykes.
RECOMMENDATION
considered to be encouraging in view of the highly leached character of the capping. It is hoped that The Ecological Reserve request has been denied. Despite the low gold and copper assays the results are
private industry wil l carry out further studies t o evaluate the potential of the mineralization a t depth.
ACKNOWLEDGMENTS
Mr. G. Harden of Cominco is thanked for making available company files on the Comin Home property.
REFERENCES
Cominco Ltd. (1973): Taseko Lakes Area, B.C.. private company report, 2 pages and map. Dawson, J. M. (1981): Geological and Geochemical Report on the Tosh Claims, Clinton and Lillooet
Mining Divisions, for Barrier Reef Resources Ltd., B.C. Ministry of Energy, Mines & Pet. Res., Assess-
Jeletzky, J. A. and Tipper, H. W. (1968): Upper Jurassic and Cretaceous Rocks of Taseko Lakes Map- ment Report 8890, 17 pp.
Area and Their Bearing on the Geological History of Southwestern British Columbia, Geo/. Surv., Canada, Paper 67-54, 218 pp.
Tipper, H. W. (1978): Taseko Lakes (920) Map-Area, Geo/. Surv., Canada, Open File 534.
80

THE TELKWA, RED ROSE, AND KLAPPAN COAL MEASURES IN NORTHWESTERN BRITISH COLUMBIA
(93L, M; 104H)
By Jahak Koo
INTRODUCTION
Potentially economic coal measures underlie the areas surrounding Telkwa River, Red Rose Creek, and Mount Klappan in northwestern British Columbia. In this report these are referred to as Telkwa, Red Rose, and Klappan coal measures. Recently. they have been attracting keen exploration interest.
The present project began with geological field investigation of the Telkwa coal measures in August of 1982. Preliminary results of the 1982 field work were reported in Geological Fieldwork, 198;' (Koo, 1983). Investigation of the Telkwa coal measures was continued, together with a geological reconn' survey of the Red Rose and Klappan coal measures, during the summer of 1983. The objectives of the
.l~ssance
investigations were to unravel the stratigraphy, structural development, deposition,aI environmen':s, ages, areal extent, and relationships to surrounding rocks of the coal measures: special attention was paid to their coal seams.
STRATIGRAPHY
TELKWA COAL MEASURES
During the intial stage of the present project. Koo (1983) applied the term Telkw; coal measure's to the coal.bearing sedimentary sequences exposed a t Telkwa River, Goathorn Creek, and Cabinet Creek 'near the town of Telkwa. The same measures, however, also occur in isolated areas a t Denys Creek, Thautil River, Chisholm Lake, and Zymoetz River (Fig. 30). Therefore, coal measures in these other areas are also re- ferred to as Telkwa coal measures in this report. Evidently. these are erosional relnnants of the original Telkwa basin which was much more extensive than now.
The Telkwa coal measures can be divided into Lower, Middle. and Upper units (Fig. 31). The Lower uni t ranges in thickness from 15 metres to 120 metres. It consists of conglomerate. coarse to fine-grained sandstones, siltstone, claystone, and coal seams. Up to seven fining-up cycles comprlse i ts vertical sections. The individual cycles. each 4 to 40 metres thick, show a lithological variation from csnglomerate or coarse- grained sandstone a t the base through medium-grained sandstone to fine-grained sandstone and mudstone a t the top. In some of the cycles the conglomerates occur near the base of the Lower unit. Most conglom- erate layers are 50 centimetres to 15 metres thick; they consist of subrounded clasts that change in size up- section from cobbles through pebbles to granules. The clasts originate mostly from subaerial volcarlic rocks of the Early to Middle Jurassic Hazelton Group which underlies the Telkwa coal measures. The coarse to fine-grained sandstones are 10 metres to 40 metres thick; they are similar t o the 'conglomerates in com- position. The mudstones have a thickness from 2 to 25 metres. The mudstone layers that are closely associated with coal seams near the top of the Lower unit are relatively thicker.
The Middle unit consists of 90 to 140 metres of medium to fine-grained sandstones and mudstones. Their
several 2 to 20-metre-thick, fining-up cycles characterize the Middle unit. They begin with medium-grained layers are relatively thick, up to 100 metres, and extend for distances greater than 1 kilometre. Locally.
81
ldegroot
1983

TELKWA AND RED ROSE COAL
COAL PROSPECT.. . . . . . . . . . . . . 0 APPROX. BOUNDARY BETWEEN
TELKWA AND RED ROSE CO@L MEASURES. . . . . . . . . . . . . . .&
INTRUSION.. . . . . . . . . . . . .
INTRUSION.. . . . . . . . . . . .m
MEASURES.. . . . . . . . . . . . . . cJ
LATE CRETACEOUS
EARLY TERTIARY
FAULT ZONE . . . . . . . . . . . . . . . - 128"
Acdified after Tipper et 01. (1974)
Figure 30. Distribution of the Telkwa and Red Rose coal measures.
a2

sandstone and end with fine-grained sandstone to mudstone. Coal fragments and thin coal seams up to a few centimetres thick occur in this unit. However, intensely bioturhated sandstone and mudstone layers with marine molluscan faunas are dominant in the Middle unit.
The Upper unit consists o f more than 330 metres of sandstones, mudstones, and coal seams. The lower part of this unit consists of up to 180 metres of medium to fine-grained sandstones, mudstones, and coal seams. Up to eight cycles make up the lower succession of this unit; each cycle show a lithological vari- ation from medium-grained sandstone a t the base through fine-grained sandstone to mudstone and coal seams. Individual cycles are 10 to 30 metres thick. The upper part of this unit is th cker than 150 metres and consists of mudstone layers with minor amounts of fine to medium-grained sandstones and marl. Several fining-up cycles and valves occur in this unit.
RED ROSE COAL MEASURES
These coal measures are named after the coal-hearing Red Rose Formation. The Red Rose Formation con- sists of L a t e Jurassic and Early Cretaceous marine and nonmarine sedimentary sequences exposed south of
lowermost member of the Red Rose Formation is a coal-bearing, nonmarine sequence that i s greater than Red Rose Creek in the Roc.her Dehoule Range near the town of Hazelton (Sutherland Brown, 1960). The
origin. 750 metres thick. It i s overlain by a shale and siltstone sequence 1 210 metres thick of probable marine
stratigraphy can be best documented there (Figs. 30 and 31). They also occur in Kispiox Valley, Bulkley The Red Rose coal measures have been most intensively explored a t the Seeley Lake coal prospect; the
Seeley Lake prospect. The sequence consists of conglomerates, coarse to fine-grained sandstones, mud- Canyon, and Skeena Crossing. A minimum 200-metre-thick sequence of coal measures occurs a t the
stones, and coal seams. Up to 25 fining upward cycles characterize vertical sections of the sequence. Individual cycles are 0.3 to 22 metres thick; they vary from conglomerate or coarse-grained sandstone
gomerates consist of suhrounded. black io grey chert or volcanic clasts which are well sorted in !size and at the base through medium-grained sandstone to fine-grained sandstone and mudslone a t the t o p Con-
grade from 1 centimetre to 2 millimetres upward in the section. Conglomeratic layers vary from 0.2 t o 3 metres in thickness; they occur most commonly in the lower parts of the sequence. The coarse-grained
grey or nearly black, and their layers range in thickness from 0.3 to 16 metres, The mudstones are dark sandstones are 0.2 to 1 metre thick and light grey in colour. The medium to fineyrained sandstones are
grey or black and 0.3 to 15 metres thick. The black mudstones or fine-grained sandstones are closely associated with coal seams.
KLAPPAN COAL MEASURES
The Klappan coal measures are well exposed a t Mount Klappan and in its neighbouring area (Fig. 32). They are greater than 350 metres thick and can be divided into Lower, Middle, and Upper units (Fig. 33).
The Lower unit consists of coarse to fine-grained sandstones, mudstones, and coal seams. Its thickness ranges from 150 metres to 200 metres; its base has not yet been clearly determined. I t differs from Telkwa and Red Rose because cycles coarsen upward; up to seven coarsening-up cycles characterize most of i t s vertical sections, and individual cycles vary in thickness from 1 metre to 30 metre;. Each cycle changes from fine-grained sandstone to mudstone and coal seams a t the base through to coarse-grained sandstone a t the top. Thinly laminated successions of fine-grained sandstone and mudstone occur in some parts of the Lower unit. They are up to 15 metres thick and contain marine molluscan faunas. The laminae are
of black fine-grained sandstone or mudstone. UP to 5 centirnetres across, are cornmon within coarse to commonly 1 millimetre to 15 centimetres thick; intense bioturbation is common, Angular rip-up clasts
fine-grained sandstones in upper parts of the cycles. The latter sandstones are #generally oxid~zed and brown in colour.
83

$' 1:;: ,.:.I:;. ,: .....
, .: ,: .:: .:. t::..,..
[.:.'.,.,
1: . :..
.....
...... .... ..... ...
Figure 31. Stratigraphic sections of the Telkwa and Red Rose coal measures
84

BEDDING ANTICLINE, PiUNGE OVERTURNED -e R
GEOLOGICAL BOUNDARY _,-
FAULTS 1HRUSl. HIbH ANGLE STRATldRAPHlC SECTION LOCATION PEAK ELEVATION . m e t e s 1 lPBd
I
SYNCLINE, PLUNGE ~ V E R T U R N E D ~+ R 0 "
Figure 32. Slmplified geology of the Mount Klappan area.
85

"
0
r
LEGEND
COAL SEAMS
M.11.. MUDSTONE
FINE-GRAINED SANDSTONE
MEDIUM-GRAINED SANDSTONE
0 COARSE-GRAINED SANDSTONE
CONGLOMERATE
0 STRATIGRAPHIC a FOSSIL FAUNA
SECTION NUMBER
@ @ I
Figure 33. Stratigraphic Section$ Of the Mount Klappan coal measures
86

The Middle unit is 320 metres thick and can be subdivided into three zones. The lower zone. 35 to 75 metres thick, consists o f coarse to fine-grained sandstones and mudstones: coal seams occur with the mud- stone layers. This zone is transitional between the Middle and the underlying Lower units. I t consists of up to 10 fining-up cycles that range in thickness from 1 metre to 20 metres.
The middle zone is 150 metres thick and consists o f several fining-up cycles. The cycles are 2 to 4'5 metres thick and vary from chert pebble conglomerate or chert-pebbly sandstones a t the base through medium- grained sandstone to mudstones at the top. Coal seams occur with the mudstones. The chert pebble conglomerates or sandstones are up to 15 metres thick.
The upper zone is 95 metres thick; it contains up to 20 fining-up cycles. The inciividual cycles range in thickness from 1 metre to 35 metres. They are made up of medium-grained sand'jtones a t the base that grades through fine-grained sandstones to mudstones a t the top. The mudstones are closely arsociated with coal seams. Scours, mud cracks, and brown oxidation bands are common in the Middle unit.
The Upper unit consists of medium to fine-grained sandstones, siltstones, claystones. coaly mudstones. and marl. The top has not been clearly defined; however, this unit appears to range in thickness from 150 metres to 200 metres. Varves are common and there are several fining-up cycles. Coal seams, up to 50 centimetres thick, occur with some coaly mudstone layers.
COAL SEAMS
Coal seams occur in the upper zone of the Lower unit and in the lower zone of thf! Upper unit within the Telkwa coal measures: these two zones are the lower and upper coal sequences (Fig. 31). Up to I'our coal seams, 1 to 15 metres apart, occur in the lower sequence. They range in individuel thickness from 1 to 6 metres and have an aggregate thickness of 2 to 12 metres. The lower coal sequence varies from 2 to 40 metres in thickness. The upper sequence comprises up to 15 coal seams: they occur In the lower part of the Upper unit. Individual coal seams are 2 to 20 metres apart; these spacings almost correspond to t ' l e thick- ness of individual fining-up cycles. The coal seams range from 1 to 5 metres in thickness with zlggregate thickness up to 26 metres. The upper coal sequence ranges from 20 to 170 metres in thickness.
The Red Rose coal measures a t the Seeley Lake prospect (Fig. 31) comprise a t If.ast six coal seams. 0.3 to 27 metres apart. Individual seams range up to 1.5 metres and aggregate zones up to 5 metres in thick-
therefore more coal seams may occur stratigraphically above and below it. ness. The coal sequence a t Seeley Lake represents only a partial section of the Rtd Rose coal measures,
The Klappan coal measures contain potentially economic seams in their Lower and Middle units (Fig. 331. The Lower unit comprises up to six coal seams, 17 to 30 metres apart. Their individual thickness ranges from 1 to 5 metres with a n aggregate thickness of up to 10 metres. The Middle unit contains 10 coal seams; its lower zone has two seams, 4 to 30 metres apart, and they are 1 to 5 metres thick with a n aggre- gate thickness of up to 7 metres. Four coal seams, 8 to 35 metres apart, occur in the middle zone of the Middle unit. They are 2 to 10 metres thick with an aggregate thickness of up to 22 metres. There are four coal seams, 10 to 90 metres apart in the upper zone of the Middle unit. They are 3 to 8 metres thick with an aggregate thickness of up to 22 metres.
Bituminous coal characterizes Telkwa coal seams. Coal in the Red Rose coal measures. howevsr. varies in rank from bituminous to anthracite. The higher rank Red Rose coal occurs in localities where there is tight folding and intrusion of Middle to Late Cretaceous granodiorite and qu.2rtz monzonitje stocks. For example, Sutherland Brown (1960) documented a thermal aureole that is up to 1.5 kilomei~res wide around the Rocher Deboule stock. Higher ranked anthracite of the Seeley Lake prospect was f)roduced by thermal metamorphism of Red Rose coal measures marginal to the Rocher Deboule stock. Anthracite also Characterizes the Klappan coal seams.
87

DEPOSITIONAL ENVIRONMENTS AND AGES
The Telkwa coal measures represent a variety of sedimentary environments. The Lower unit consists o f fluvial clastic sediments deposited on a terrane which was initially irregular but subsequently underwent multiple stages of pedimentation and peneplanation. The conglomerates and coarse-grained sandstones form lenticular layers with limited lateral extent; they represent high energy, channel-fill deposits, The medium to fine-grained sandstones and mudstones form relatively extensive layers; they represent low energy, floodplain or meandering drainage plain deposits. Coal swamps of the lower coal sequence formed during the periods of extensive floodplain development. The floodplain deposits are generally mud cracked and oxidized.
Sediments of the Middle unit represent shallow marine transgressions and regressions. The marine trans. gressions are indicated by sandstone and mudstone layers with marine molluscan faunas; the regressions are marked by thin, cyclic coal-bearing sequences that represent local fluvial deposits.
gives way upward largely to a lacustrine sequence except for local minor marine transgressive facies. Fining- The lower contact of the Upper unit marks a widespread regression. It begins with a fluvial succession that
up cycles within the fluvial succession represent meandering channel-fill and floodplain deposits. Eutropic coal swamps developed locally on the floodplains a t up to 15 sedimentary horizons.
The Red Rose coal measures are a fluvial sequence composed of channel-fill and floodplain deposits. Coal swamps also developed along with the floodplains.
age. Sutherland Brown (1960) noted that the Red Rose Formation is probably of Late Jurassic and Early Hacquebard, et a/. (1967) determined plant fossils o f the Telkwa coal measures to be of Early Cretaceous
Cretaceous age. Tipper and Richards (1976) concluded that the coal-bearing sequences at Telkwa River and
sediments were derived from an easterly source, probably during uplift of the Omineca Crystalline Belt Red Rose Creek both belong to the Early Cretaceous sedimentary sequence of the Skeena Group. The
(Eisbacher, 1981).
amounts of detrital muscovite and quartz. These support the suggestion that the Omineca Crystalline Belt Except for the lower Telkwa coal measures, both Telkwa and Red Rose coal measures contain significant
coal measures are derived from underlying Hazelton volcanic rocks. Tipper and Richards (1976) showed was a major source for detritus in most parts of the coal measures. However, sediments of the lower Telkwa
that the Howson and Telkwa Ranges were centres of Hazelton subaerial volcanism and subsequently up- lifted to form the southwest Skeena Arch during Jurassic time. During Early Cretaceous time, erosion of the Hazelton volcanic terrane in the ranges provided a local source of sediments for the lower Telkwa coal measures.
The Klappan coal measures consist of shallow marine, fluvial, and lacustrine deposits. The Lower unit was deposited in a transitional zone between marine and continental environments. The sedimentary succession
unit was deposited as a fluvial succession. The fining-up cycles containing the coal seams in the Middle unit represents progradation of alluvial fans and coal swamps over deltas during a marine regression. The Middle
represent meandering channel-fill, floodplain, and coal swamp deposits. The Upper unit is characterized by meandering channel, overbank. and ephemeral lake deposits.
series of Early Cretaceous age. Eisbacher (1974) argued that all major coal seams in the northeastern Malloch (1914) concluded that coal measures in the Groundhog coalfield should be grouped as the Skeena
ceous age and that the coal-bearing facies is overlain by Early Cretaceous Jenkin's Creek facies that consists Bowser Basin occur in the 500-metre-thick Groundhog-Gunanoot facies of Latest Jurassic to Early Creta-
o f continental fine-grained clastics and thin carbonate lenses. Richards and Gilchrist (1979) described strong similarities between the Gunanoot assemblage and the Early to Middle Cretaceous Skeena Group. The lower and middle Klappan coal measures correlate with the GroundhogGunanoot facies of the Gun- anoot assemblage; the upper Klappan coal measures correlate with the Jenkin's Creek facies.
88

Widespread conglomerates in the Telkwa, Red Rose, and Klappan coal measures suggest active pediment- ation across the Skeena Arch and west of the Omineca Crystalline Belt. The multiple cycles in the coal measures suggest periodic uplift followed by erosion of the Omineca Crystalline Belt. The occurrence of coal seams in mudstone zones near the tops of the cycles suggests that coal swamps formed largely during tectonically quiescent periods in the Omineca Crystalline Belt.
The Telkwa, Red Rose, and Klappan coal measures comprise mainly limnic and ;elmatic coal deposits. However, they may also contain some paralic coal due to local marine incursions near the top and bottom of the middle Telkwa coal measures, a t the top of the Red Rose coal measures, and in the lower Klappan coal measures.
DEFORMATION
Faults disrupt the Telkwa and Red Rose coal measures (Fig. 30). They trend predominently northwesterly; however, some trend northeasterly to easterly. They dip mostly a t high angles ranging from 70 to 90 degrees and show normal or reverse displacements of up to several kilometres. The coal measu'es com- monly occur in the grabens which occupy low-lying poorly exposed areas. This type of structurill setting
Cretaceous and Early Tertiary age; the northeasterly to easterly trending faults are of Late Teriary age is best exemplified by the Telkwa coalfield (Koo, 1983). The northwesterly trending faults are of Late
(Carter, 1981).
Gentle bedding dips are common and broad open folds are developed in the Telkwa and Red Flose coal measures where dips range from 5 to 25 degrees northeast or southwest. However, tight folds also occur
cut by the intrusions and by northwesterly trending thrust faults. Younger northwesterly trending high in localities where the coal measures are intruded by Cretaceous and Tertiary stocl(s. The tight folds are
of Middle Cretaceous age. angle faults cut the folds, the thrust faults, and the intrusions. The folds and thrwt faults are apparently
The Klappan coal measures show open to tight folds (Fig. 32) that are almost vertical or overturned to the northeast. The fold axes strike north 30 to 60 degrees west; their axial planf?s dip 25 to 8!j degrees southwest. Most of the folds are asymmetrical; many are cut by thrust faults with rlaximum displacements of 150 metres. The thrust faults strike north 20 to 40 degrees west and dip 10 t o 25 degrees southwest. These faults commonly have associated chevron, kink, or concentric style dragfolds. All fold; and the thrust faults are cut by high angle faults that trend northerly or norfhwesferly. These high angle faults are themselves cut by easterly to northeasterly trending high angle faults. Richards and Gilchrist (1979) report that major faults in the Groundhog coal area immediately south of Molrnt Klappan also trend northwesterly or easterly.
CONCLUSIONS
The Telkwa, Red Rose, and Klappan coal measures consist mainly of fluvial clastic sequences with minor shallow marine and lacustrine sedimentary successions. Economic coal seams developed mairily in the
They appear to represent mainly regressive facies with local irregular transgressive facies, fluvial sequences. The shallow marine successions comprise coastal beach, tidal flat, and lagoonal deposits.
Skeena coal measures. Tectonic upl i f t of the Omineca Crystalline Belt largely controlled Sedimentation All three coal measures are nearly isochronous and may be referred to collectively as the Early C:retaceous
of the coal measures, although locally the southwestern Skeena Arch also inflwnced deposition of the lower Telkwa coal measures.
89

The three coal measures were subjected to a minimum of four phases of deformation: open to tight folds; thrust faults; northwesterly high angle faults; and northeasterly high angle faults.
The coal measures contain economic coal seams of limnic. telmatic. and paralic origin. Their ranks range from bituminous to anthracite coal. The higher rank coal occurs in areas of tight folding and adjacent t o Middle to Late Cretaceous intrusions.
ACKNOWLEDGMENTS
of Bulkley Valley Collieries Limited; D. Plecash of D. Groot Exploration; and G. Childs. B. Flynn, and Thanks are extended to: B. Ryan, D. Handy. and S. Cameron of Crows Nest Resources Ltd.; L. Gething
C. Williams of Gulf Canada Resources Inc. for their wil1ingcooperation;and L. Rowanforhisfieldassistance.
REFERENCES
Carter, N. C. (1981): Porphyry Copper and Molybdenum Deposits. West-Central British Columbia, E.C. Ministry of €neryy, Mines & Pet. Res., Bull. 64, 150 pp.
Surv.. Canada, Paper 73-33. 13 pp. .......... (1981): Late Mesozoic-Paleogene Bowser Basin Molasse and Cordilleran Tectonics, Western Canada,
Geol. Assoc. Canada, Spec. Paper 23, pp. 125-151. Hacquebard. P. A,, Birmingham, T. H.. and Donaldson, J. R . (1967): Petrography of Canadian Coals in
Relation to Environment of the Deposition, Canada Energy, Mines & Resources, Proceedings of
Koo. J. (1983): Telkwa Coalfield, West-Central British Columbia (93L). E.C. Ministry of Energy, Mines& Symposium on the Science and Technology of Coal, Mines Branch, Ottawa, pp. 84-97,
Malloch. G. S. 11914): The Groundhog Coal Field, B.C., Geol. Surv., Canada, Summ. Rept., 1912, pp. 69- Pet. Res., Geological Fieldwork, 1982, Paper 1983-1, pp. 113.121.
101.
Eisbacher, G. H. (1974): Deltaic Sedimentation in the Northeastern Bowser Basin, British Columbia, Geol.
Richards, T. A. and Gilchrist. R. D. (1979): Groundhog Coal Area, British Columbia, Geol. Surv., Canada,
Tipper. H. W.. Campbell, R . B., Taylor. G. C., and Stott, D. F. (19741: Parsnip River, B.C., Geol. Surv., Paper 79~1B. pp. 411-414.
Canada, Map 1424A. 1 : 1 000 000 Geological Atlas Sheet 93.
Columbia, Geol. Surv., Canada, Bull. 270, 73 pp.
Energy, Mines & Pet. Res., Bull. 43, 78 pp.
Tipper, H. W. and Richards, T. A. (1976): Jurassic Stratigraphy and History of North-Central British
Sutherland Brown, A. (19601: Geology of the Rocher Deboule Range, British Columbia, B.C. Ministry of
90

AG PROSPECT (93M17W)
By T. G. Schroeter
INTRODUCTION
The AG (Mineral Inventory 93M-13) (formerly Sue, Red, Foss) prospect. consisting of 6 units, is located 60 kilometres north of Smithers. approximately 5 kilometres northwest of French Peak. Access is by heli- copter from Smithers. I n July 1983, Golden Gate Exploration Ltd. completed eight diamond-drill holes totalling approximately 610 metres.
HISTORY
geological surveys and a self-potential survey and stripped an area approximately 40 metres by 1E: metres. In 1964 Falconbridge Nickel Mines Limited staked the Red claims; during 1964 to 1965 they conducted
sampled the property; it is now owned by Golden Gate Exploration Ltd. I n 1973, Canadian Superior Exploration Limited conducted a geochemical survey. In 1980, Dous1 Whelan
GEOLOGY AND MINERALIZATION
The property is underlain by arkosic and argillaceous tuffaceous sandstones and argillites of the Hazelton Group which have been intruded by Cretaceous I ? ) sills of feldspar porphyry.
Pyrrhotite. chalcopyrite. pyrite, marcasite, arsenopyrite, tetrahedrite, sphalerite, galena, stibnite, and owyheeite IPb,Ag,Sb,S,,I occur as replacement veins (up to 1 metre in width) with quartz-carbonate + tourmaline gangue. Sphalerite appears to be late stage, as are veinlets of calcite and siderite. Two main areas of mineralization are known:
11) Hepworth Creek A strong lineament that runs up Hepworth Creek has a 1.2-metre to 1.8-metre shear zone in it striking 135 degrees with a near vertical dip. Branching veins of massive sulphide are up to 37 centimetres wide; adjacent fine sulphide disseminations may extend into the wallrock for as much as 60 centi- metres. Veins strike a t 120 degrees and are vertical.
(2) Boomer Creek A 0.3-metre quartz vein with owyheeite and tourmaline occurs approximai:ely 45 metres south of the junction of Hepworth and Boomer Creeks (Fig. 34).
Gold values in excess of 0.1 ounce per ton and silver values in excess of 40 ounces per ton have been obtained lunpub. company report. 19831.
ACKNOWLEDGMENTS
The writer would like to thank Barry Price, Consultant for Golden Gate Exploration Ltd., for providing access to the property and hospitality while on the property.
91
ldegroot
1983

Figure 34. Locatlon map for the AG prospect (93Mi7W)
92

REGIONAL GEOCHEMICAL SURVEYS HAZELTON AND MANSON RIVER MAP-AREAS
(93M, N)
By H. R. Schmitt
The British Columbia Ministry of Energy, Mines and Petroleum Resources was involved in two regional geochemical surveys in 1983, covering map-areas 93M and 93N.
The Ministry funded and supervised the geochemical survey for 93M (Hazelton) and provided supervision for the Federal Department of Energy, Mines and Resources’ funded geochemical survey of 93N (Manson River). Completion of analytical work and data compilation is expected by late May 1984. Results of the surveys, in the form of sample location maps and analytical data sheets, will be rfleased in early June. Simultaneous data release is anticipated to take place in Smithers. Vancouver. and Victoria.
To date a total of 19 map-areas has been sampled in British Columbia for a total coverage of approximately 250 000 square kilometres; average sample density ranges from one site per 12.5 square kilometres to one site per 15 square kilometres (Fig. 35).
Field sampling in 1983 was carried out in the Hazelton map-area (93M) by Bema lndllstries Limited and in
areas and relied primarily on helicopter support with limited use of truck and boat. Helicopter services by Manson River map-area (93N) by Hardy Associates (1978) Limited. Both surveys covered relatively remote
Quasar Aviation Limited were used by Bema Industries and Viking Helictopers Limited provided service for Hardy Associates. Field supervision for the Ministry and Geological Survey of Canada was by H. R. Schmitt.
Both surveys were concluded successfully within the alloted budget and schedule. NTS 93M. covering 14 000 square kilometres. was sampled in 1 040 sites for an average coverage of one sample per 13.46 square kilometres. NTS 93N. covering 14 000 square kilometres, was sampled in 1 062 s i tes for an average coverage of one sample per 13.18 square kilometres. Thirty samples collected in 93N were un:xitable for analyses and might be recollected.
Sample preparation and artalyses were contracted to commercial firms. Water samples were analysed for
copper, lead, nickel, cobalt, silver, manganese, iron, arsenic, molybdenum, tungsten, mercury, uranium, uranium, fluorine, and pH by Acme Analytical Laboratories. Stream sediments will be analysed for zinc,
and antimony by Chemex I-aboratories.
The two contiguous surveys cover diverse geological terranes, containing several significant mineralized environments. Placer and vein-type gold and silver mineralization is providing focus for intense explor- ation activity in Manson Creek area and along the Pinchi and Vital faults. Exploration in Hazelton map- area (93M) is primarily for polymetallic vein deposits, with limited exploration for copper-molybdenum porphyry deposits. Survey results are anticipated to reinforce current exploration activity and provide
mineralized and overburden-covered areas. valuable regional geochemical information for the reinterpretation of mineral potential in apparently less
93
ldegroot
1983

94

TONSTEINS AND BENTONITES IN NORTHEAST BRITISH COLUMBIA
(930. P, 1)
By W. E. Kilby
INTRODUCTION
Tonsteins are presently considered the most reliable coal seam correlation tool amilable (Stack, et ai.,
bia were examined during the 1983 field season as the preliminary phase of a study documenting ther,e time 1982). Such ancient volcanic ash bands in coal-bearing and adjacent strata of northeastern British Colum-
(19681, Duff and Gilchrist (19831, and Spears and Duff (in pressj, lines throughout the coalfield. Altered ash bands also were noted and studied by pr'evious workers; Stott
ash encountered, Tonsteins have a distinct tuffaceous texture and are confined, in this study, to the coal- I n this paper the terms tonstein and bentonite will be used to broadly group all the types of altered volcanic
bearing formations, Bentonites, on the other hand, are generally restricted to marine formations and have the greasy feel and conchoidal fracturing common to bentonite. Montmorillonite-illite and mixed- layer (smectite) group clay minerals are more prominent in the bentonites; kaolinite is the major com- ponent of both groups (see accompanying table). Generally, a particular band is consistently a tonr:tein or a bentonite throughout the studied area, but exceptions exist and are very significant, Tonsteins and bentonites examined in this study are the alteration products of volcanic ash. Controversy over the origin of these materials has continued for decades but the last 10 years has seen a general acceptance of their volcanic origin (Stack, et a / , , 1982). It will be seen that the only plausible explanation for many of the intervals studied here is that they represent volcanic ash. The depositional environment dictates the result- ing textures and possibly the mineral assemblages, which are distinctive between the two major groups. Tonsteins-bentonites have been examined in outcrops, trenches, and drill cores. Care obviously provides the best exposure but to obtain an accurate description of the ash characteristics tonsteins within coal
frustrated. In contrast, bentonites in Moosebar mudstone were readily identified in core and bands with seams must often be removed with the coal. For this reason, the search for tonsteins in old core is often
widths down to several millimetres showed up distinctly. Exploration companies active in the area have been noting these 'tuffaceous' bands for the last several years; company personnel were extremely helpful
out occurrences on their properties. during the field season allowing examination and sampling of their newly obtained core and Flointing
occurring. Examination of company trenches and fresh core in this area led to the identification of two Initially investigation was concentrated in the Pine Pass area where the majority of exploration activity was
was completed a t the Charlie Lake core facility in Fort St. John examining Gething, Moosebar, and Gates readily correlatable tonstein zones in the upper Gething Formation. The latter part of the season"s study
core from Peace River to the Alberta border along the foothills belt. Virtually all i,sh bands encolmtered were sampled and are undergoing petrographic, X-ray diffraction, and chemical analy!.es. Some prel~minary results are presented here.
Tonstein-bentonite occurrences are limited to the few sedimentary environments favourable for their preservation. Obviously, any environment with more than a minimal energy level will obliterate ajh falls. Thus, tonsteins-bentonites preferentially occur in low-energy marine and coal-swamFl settings, Astl falling
swamp environment are much more susceptible to organic and detrital contamination, The various degrees into marine settings tends to be clean, with only minor bioturbation. Tonsteins preserved in the coal-
and types of contamination provide information for determining the detailed environments at a particular location in the swamp and, potentially, the overall swamp morphology. Some thick (>5 centimetrzs) ben-
95
ldegroot
1983

tonites provide recognizable geophysical responses which can be correlated considerable distances (see Duff and Gilchrist. Fig. 7). but thin bentonites (3 millimetres to 3 centimetres) are not picked up on a normal suite of logs (detailed gamma might delineate some of these bands but they are seldom used over non-coal intervals). Detailed logs are run over coal intervals, therefore tonsteins can often be recognized. However, contamination or masking by oppositely responding strata usually result in logs that are not distinctive
count and a density reading similar to that of mudstone or siltstone. For these reasons, a t present, visual but are recognizable if tonsteins can be seen in the core. Tonsteins-bentonites usually have a high gamma
inspection is the most reliable means of detecting all the tonsteins-bentonites in a section.
Tonsteins have been grouped into coal and non-coal tonsteins by previous workers in both Europe and British Columbia (Price and Duff, 1969). A t this preliminary stage in our study this distinction has not yet been made; it will likely be used when more analytical data is available. Tonsteins, i f clean, are easily
rusty appearance (Plate Ill). In core they tend to be medium grey wi th sharp contacts. In hand sample recognized in core and outcrop. They generally weather medium to l ight grey in outcrop but may have a
tonsteins have a distinctive appearance due to platy kaolinite crystals (Plate I V ) and plant fragments often parallel bedding planes. This granular appearance has often resulted in these bands being logged as siltstone or sandstone. They are predominately non-calcareous and can be scratched with a fingernail. The speckled appearance results from development of vermicular kaolinite (Plate V). Stack, e ta / . (1982. page 161) con- tains an electron micrograph of one of these vermicular structures. Usually, devitrified glass shards or angular crystal fragments are common in these tonsteins (Plate V) confirming their volcanic origin. Mineralogically, tonsteins are kaolin rich; they often have quartz as a secondary constituent (see accom-
these rocks but detailed examination reveals the distinctive speckled appearance. Organic-rich tonsteins panying table). Contamination by organic and detrital material greatly alters the physical appearance of
(usually coal tonsteins) are greyish brown in colour: they often contain coal spar.
Plate Ill. Flrher Creek Tonstein zone exposed in trench outcrop. Arrows mark the three tonstein bands. The measure is 2 metres.
96

23 24 25 26 21 28 29 31 32 33 34 35 36 37 38 39
Plate I V . Hand sample of the lowest tonstein in the Fisher Creek sequence. Note carbonaceous fragments and freckled appearance The freckled appearance is due t o vermicular kaolinite.
Plate V. Photomicrogramh. under-crossed nicols. of tonstein from the Number 1 Seam on the willow c,,?& Property. This sample may be correlative with the Fisher Creek Tonstein zone. The large 'kaolin worm' is about a miilimetre in length. Note devitrified glass shards (SI and a rare form Of vermicLllar kaolinite [ I o .
97

SAMPLE
R82- 1 2
3 4
5 6 7
8 9
10
11 12
13
14
15
16
17 36
37
38
39 40
R83- 81
8 2
83
87 90
151
1 55 152
177 1 78
179 182 183 184 185
FORMATION
MOOSeba, MOOSeba,
MOOSebar Moorebar
Moorebar Gething MOOSebar
Gething Gething
Gething
Moarebat Gething
Gething
Gething
Gething
Gefhing
Gething Moorebar
MO0reb.X
Moorebar
Moorebar MOOSebar
Gething
Gething
Gething
Gething Gething
Moorebar
MOOS&, Moorebar
MOWebar Moasebar
Gething Moorebar
Gething Gething Gething
X-RAY DETERMINATION
QUARTZ > KAOLINITE a Fe-rich DOLOMITE KAOLINITE > QUARTZ > minor ammntr of PYRITE, illitic mixed-layer clay, Fe- rich DOLOMITE and APATITE 171 KAOLINITE > minor amWnt6 of PYRITE, QUARTZ and APATITE
CiTE and APATITE Fe-rich DOLOMITE > KAOLINITE > QUARTZ > minor amounts of PYRITE,CAL-
KAOLINITE with a very small amount of QUARTZ KAOLINITE >QUARTZ > a m a l l amount of illitic mixed-layer clay
rich DOLOMITE KAOLINITE > QUARTZ > minor amounts of PYRITE, CALCITE, APATITE f Fe-
KAOLINITE > QUARTZ > SIDERITE
of illitic mixed-layer clay KAOLINITE > QUARTZ > Fe-rich DOLOMITE 1 PLAGIOCLASE > a minor amount
KAOLINITE > Fe-rich DOLOMITE Z QUARTZ > rmallamountrof ILLITE, CHLOR-
KAOLINITE - Fe-rich DOLOMITE > trace amounts Of QUARTZ and CALCITE ITE. and Fe-rich MAGNESITE
and PLAGIOCLASE QUARTZ > illitic mixed-layer clay - DOLOMITE > minor amounts of KAOLiNlTE
MORlLLONlTE (?I and APATITE (?I ILLITE >QUARTZ > Fe-rich DOLOMITE > KAOLINITE > traceamountraf MONT-
CLASE. and APATITE (?I KAOLINITE > Fe-rich DOLOMITE 1 QUARTZ > trace amounts of ILLITE, PLAGIO-
KAOLINITE > QUARTZ Z Fe-rich MAGNESITE > illitic mixed-layer clay b PLAGIO- CLASE
layer clay KAOLINITE E QUARTZ > Fe-rich MAGNESITE > PLAGIOCLASE E illitic mixed-
KAOLINITE > ANKERITEIFe-DOLOMITE > minor QUARTZ > trace APATITE, KAOLINITE -QUARTZ > ILLITE > Fe-rich DOLOMITE
CALCITE.GORCEIXITE. ILLlTE,and CHLORITE 5 PYRITE I?)
APATITE, ILLITE, K-FELDSPAR t GORCElXlTE ( ? I KAOLINITE > QUARTZ > minor PYRITE > ANKERITEIFe-DOLOMITE > trace
ANKERITEIFe-DOLOMITE > KAOLINITE > QUARTZ >CALCITE >trace PYRITE and ILLITE * APATITE
QUARTZ b KAOLINITE Z ANKERITEIFe-DOLOMITE > PYRITE > minor ILLITE QUARTZ b KAOLINITE > ANKERITEIFe-DOLOMITE > PYRITE >trace CALCITE
>CALCITE
PLAGIOCLASE KAOLINITE > ILLITE-MONTMORMILLONITE (mixed-layer clay) > minor QUARTZ
QUARTZ 1 KAOLINITE > minor ILLITE-MONTMORILLONITE (mixed-layer clay), PLAGlOCLASEand DOLOMITE
MONTMORILLONITE KAOLINITE > QUARTZ > PLAGIOCLASE > Fe-rich DOLOMITE > trace ILLITE-
KAOLINITE > QUARTZ % trace ILLITE-MONTMORILLONITE (mixed-layer clay)
CITE >SIDERITE QUARTZ > ANKERITE > ILLITE-MONTMORILLONITE Z KAOLINITE = CAL-
MONTMORILLONITE * KAOLINITE % minor QUARTZ > trace SIDERITE f ALLO-
CALCITE > ANKERITE > SIDERITE > QUARTZ ii KAOLINITE > trace ILLITE PHANE
KAOLINITE 1 MONTMORILLONITE a QUARTZ > SIDERITE t ALLOPHANE Fe-rich DOLOMITE > KAOLINITE % trace QUARTZ and PYRITE i GORCElXlTE
APATITE Fe-rich DOLOMITE 1 KAOLINITE > minor QUARTZ, PYRITE, GORCEIXITE, f
KAOLINITE > Fe-rich DOLOMITE > QUARTZ > minor PYRITE KAOLINITE > QUARTZ > trace CHLORITE, APATITE 0 ) f DOLOMITE KAOLINITE > QUARTZ KAOLINITE >QUARTZ > Fe-DOLOMITE >trace APATITE KAOLINITE > QUARTZ > Fe-OOLOMITE > ILLITE > trace APATITE 0 1
98

Bentonites are even more readily recognized in core and outcrop than tonsteins. The material tends to be light grey to greenish grey, consists of clay size material, and has a conchoidal fracture. When weathcred at surface the band usually develops the classic 'popcorn' texture common to these swelling clays. Depending
bands as thin as 3 millimetres can be apparent on a clear outcrop surface. In hand sample this material is upon outcrop conditions the band may become completely softened. Due to swelling and light c:oIour,
greasy when wet and breaks into 'poker chip' or cuspate fragments. Although usually non-calcareous, some bands have been subjected to la te carbonate replacement. Where found in the marine Moosebar Formation the bentonites often display well-preserved bioturbation. At one location a bentonite in the glauconite portion of the 'Bluesky' is slightly glauconitic. In marine settings the bentonites are usually free of con- tamination other than that introduced by bioturbation; occasionally they are intwlaminated with the surrounding mudstones, Kaolinite predominates in the bentonites, but montmorillonite-illite clays are also important (see accompanying table).
A t present the only means of correlating various tonsteins-bentonites are their approximate stratigraphic
will be applied as analyses become available. position, thickness. and relationship with one another. Petrographic and chemical c,xrelation techniques
The 'Fisher Creek Tonstein' zone was initially recognized in exploration trenches on Crows Nest Re;ourses Ltd.'s Pine Pass property. Early correlations were based on the presence of a thin 1 to 2-centimetrl: coaly
steins in the overlying few metres of strata (Plate Ill). With familiarity, this series of tonsteins became band near the middle of a thick (20-centimetre) tonstein. Better exposures revealed several thinner ton-
recognizable in core and OutCrop. Figure 36 contains a series of sections through the hsher Creek Tonstein
45 metres below the Bluesky unit (Moosebar-Gething boundary) (Fig, 38a and b); ;at present it has only zone. Note the variations in inter-tonstein lithology and thicknesses. This zone is located approximately
been recognized in the Pine Pass area (Fig. 37) due in large part to a lack of detailed investigation ,outside this area.
The 'Number 2 Tonstein' is located about 20 metres stratigraphically below the Fisher Creek Tonstein zone
thick band (20 centimetres) or a large band and a series of thinner tonsteins all within a short stratigraphic or about 65 metres below the Bluesky (Fig. 38a and b). It is usually clean and consists either of one
interval. This tonstein is present in the middle of the Number 2 Seam on David Mineral Ltd.'s Willow Creek proDerty. So far. i t has been recognized mainly in the same sections as the Fisher Creek Tonstein zone.
From Peace River to Onion Creek bentonites were located in core in the lower portion of the Moosebar mudstone. Two prominent bentonite bands ('Twin Bentonites') were noted by Duf"and Gilchrist (1983) and tentatively correlated over much the same area as this study. These two bentonii.es are readily sieen on geophysical logs and are obvious in outcrops of the lower Moosebar. I n the Bullmoose and Mount !;picker areas they are located about 4 metres above the Bluesky; the bands, which are about 10 centimetrej thick, are 3 to 5 metres apart. In the Monkman area the Twin Bentonites are 30 metres above the Bluesky and 3 metres apart. In the Peace River area they are about 140 metres above the top of the Gething but this
addition to these two prominent bands (shown on Duff and Gilchrist, Fig. 7). a zone of several thinner interval contains the Moosebar Lower Silty Member which is not present south o f Sukunka River. In
bentonites is usually present a short distance below the Twin Bentonite bands (Fig. 3Ela and b). Correlation of these thinner bands has not yet been accomplished over any significant distance but they have helped to solve one stratigraphic anomaly and have potential for documenting the relationship between the Moosebar Mudstone Member and the Moosebar Lower Silty Member. A recent visit to the Grande Cache area of Alberta revealed a t least four thin bentonite bands in the lower Moosebar mudstones of that area.
99

> ,: 1 4 N
OI
100

Tonsteins are also present in the Gates Formation, but very little effort has been direc:ted to these strata
strata in the Grande Cache area a tonstein was found in and around the top of the: Number 4 S,Eam. yet. Crows Nest Resources drilled through a clean (5-centimetre) tonstein near Mount Secus; in equivalent
Carmichael (1983) noted bentonites in the Gates and Moosebar Formations south of the area of this study. The next phase of this study will include an investigation of the Gates strata for these time lines.
The availability of precise and recognizable time lines in the stratigraphic column enable a wide ranpe of studies to be undertaken and problems solved. During the 1983 field season tonsteins-btmtonties were used to solve several structural and stratigraphic problems and provided several hints about the paleogeography of Cretaceous coal-bearing and adjacent strata.
tinct marker horizons are lacking and lateral lithologic variations are rapid, A large trench on crows Nest Mesoscopic Structures within and around coal seams are often complex and difficult to map because dls-
Syncline. Within this trench the Fisher Creek Tonstein sequence was repeated five times, each time with Resources’ PrOPertV exposed a disturbed sequence of coal measures on the east limb of the Fisher Creek
different orientations. This fortunate exposure (Fig. 39) enabled the detailed structural Style in that locality to be understood and sedimentary variations over short distances to be examined (F.ig. 36, colrlmns 2 to 6 ) .
During investigation of the Fisher Creek Tonstein one location was encountered where two of the upper bands were found to be bentonite or bentonitic (Fig, 36, column 1). Tonsteins are believed to form under acidic or possibly laterizing conditions in or adjacent to coal swamps. Bentonites apparently result when ash falls into a more normal or alkaline environment. Figure 37 illustrates the positions of some Fisher Creek Tonstein sections, Figure 36 shows the detailed lithology surrounding these bands, and the ac:com-
stein to bentonite transition is that some major facies boundary has been crossed. The bentonites formed panying table contains a mineralogical description of some of these samples. The significance of this; ton-
outside the coal swamp facies, possibly in some abandoned channel, maybe even in a marine environment. At the very least the change marks the position of the edge of the swamp a t the lime of these ash falls.
In Duff and Gilchrist (1983, Fig. 7). drill hole Mount Spieker MS-1 contains an anomalous unil:, the Lower Silty Member, a t the bottom of the Moosebar Formation. This log was used while examining Several
was amiss because the two distinctive bentonite gamma kicks at 1,341 feet and 1,349 feet in conjunction outcrop sections of the Gething and lower Moosebar in the area of the hole. It was obvious that something
with the common GethingMoosebar pick at 1,386 feet matched outcrop sections exac1,ly. Examination of the core stored at Charlie Lake revealed that this interval contains a thrust fault which duplicates the formation contact and several of the bentonites (Fig. 40). During relocation of the core to Charlie Lake several years ago, the core was reboxed; the interval above 1,350 feet is now completely shattered in typical mudstone fashion and no trace of the upper bentonite a t 1,341 feet could be seen. Thi!; disturbed core and missing bentonite may have resulted in misinterpretation of this interval. I n this case a combination of ben- tonites and distinctive stratigraphic markers were used to solve a ‘sedimentological’ ploblem and brought this section back in line with its surroundings.
The Moosebar transgression and associated Bluesky equivalent unit in the foothills bell: may be effectively bracketted by tonsteins and bentonite horizons. A t present regional correlations have not been made but on a local scale some observations will be made about this interval in an accompanying paper (this volume) which discusses some of the features of the Sluesky unit and surrounding strata.
This project is in i ts infancy but local and regional correlations now appear attainable. On a local
these ash bands provide an unparalleled opportunity to understand the coal swamps, their lateral entent, (property) scale tonsteins-bentonites are now being used for borehole and outcrop correlations. Regionally,
vegetation distribution, and the relative accumulation rates of vegetation and sediments within their bounds.
101

The objective of this study is to document the ash bands (tonstein-bentonite) in the coal-bearing and adjacent strata of the Northeastern British Columbia Coalfield. Analyses will be undertaken to f ind out i f various tonstein-bentonite zones have unique chemical attributes which can be used to chemically finger- print particular zones and fix their positions within the section. Chemical correlations have been promising in other studies (Amajor and Lerbekmo, 1980; Glass, 1981 1 ; chemical analysis of the collected samples is presently underway.
Figure 37. Approximate locations Of Fisher Creek ton~tein sections /due to the confidentiality of much of the data only one hole isaccurately located ~ Pine Parr 75-10).
102

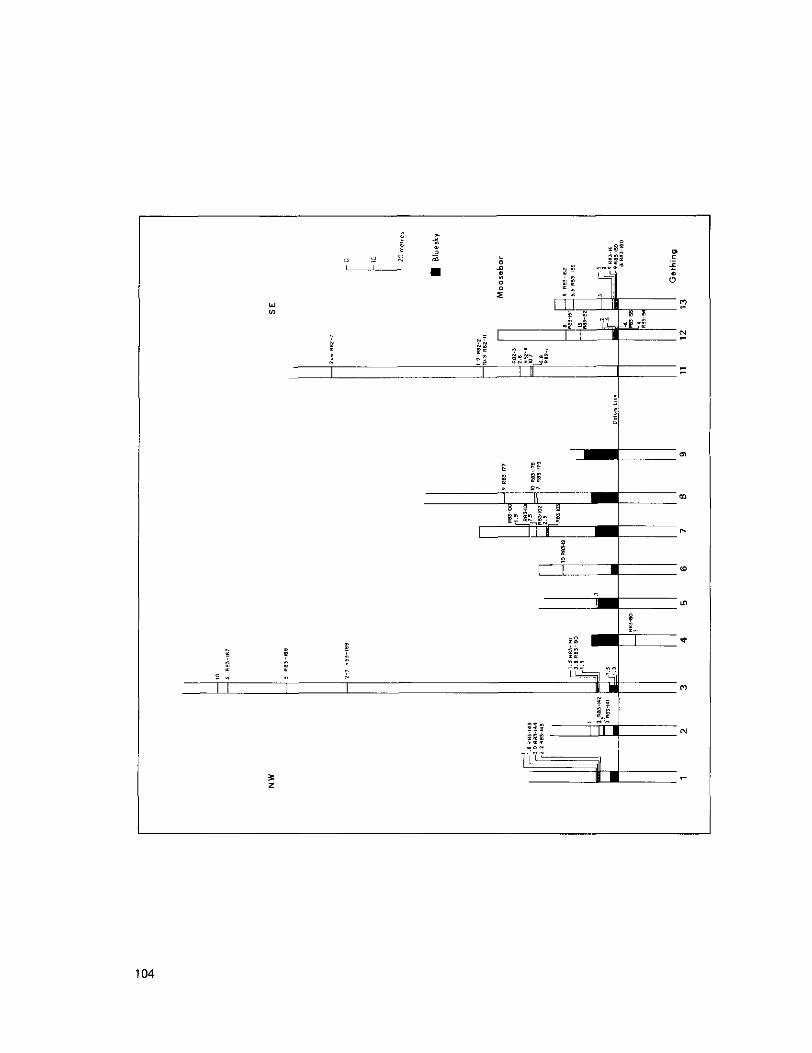
2
104

105

i
VIEW DIRECTION. . . . . . . . 325'
PROJECTION DiRECTlON . . 325"
TONSTElNS . . . . . . . /// BASE OF TWIN TONSTEINS . . . /
,..$ . . . . . .' , COALINTRENCH .o
Figure 39. Section view of trench exposure with the deformed sequence containing the Twin Tonrteinr. The numbers of the bracketted zones correspond with the detailed sections on Figure 36.
r
Figure 40. A structural explanation of a stratigraphic anomaly - fault movement resulted in 47 feet 114 metred of
occurrence of coal spar and stringers. repeated section. The Gething upper contact is also moved to the base of the Biuesky. above the first
106

REFERENCES
Amajor, L. C. and Lerbekmo, J. F. (1980): Subsurface Correlation of Bentonite Beds in the Lower Cre- taceous Viking Formation of South-Central Alberta, Cdn. Per. Geol.. Bull.. Vol. 28, No. 2. pp. 149-172.
Carrnichael, S.M.M. 11983): Sedimentology of the Lower Cretaceous Gates and Moosebar Formations, Northeast Coalfields, British Columbia, Universiry of British Columbia, unpb. Ph.D. Thesis, 285 pp.
Duff, P.McL.D. and Gilchrist. R. D. (1983): Correlation of Lower Cretaceous Coal Measures. Peace River Coalfield, British Columbia, B.C. Ministry of Energy, Mines &i Per. Res., Paioer 1981-3, 31 pp.
Glass, D. E. (1981): Subsurface Correlation of Bentonite Beds in the Lower Cretaceous Viking Formation of South-Central Alberta, by L. C. Amajor and J. F. Lerbekmo: Discussion. Cdn. Pet. Geol., Bull..
Price, N. €3. and Duff, P.McL.D. (1969): Mineralogy and Chemistry of Tonsteins from Carboniferous Vol. 29, No. 3, pp. 426-428.
Spears, D. A. and Duff, P.McL.D. (in press): Kaolinite and Mixed-Layer Illite-Smectite in Lowl?r Cre- Sequences in Great Britain. Sedimentology. Vol. 13, pp. 45.69.
Stack, E., Mackowsky. M.-Th.. Teichrnuller, M.. Taylor, G. H., Chandra, D., and Telchrnuller. R . (1982): taceous Bentonites from the Peace River Coalfield, British Columbia, Cdn. Jour. Earth Sci.. Bull.
Ston, D. F. (1968): Lower Cretaceous Bullhead and Fort St. John Groups, between Smoky and Peace Stack's Textbook of Coal Petrology, Third Ed., Gebruder Borntraeger, Berlin, 535 pp.
279 PP. Rivers, Rocky Mountain Foothills, Alberta and British Columbia, Geol. SUN.. Canada. Bull. 152,
107

Figure 41. Location map of Section6 shown on Figure 42 (locations are exact or approximate. depending on confidentiality).
108

THE CHARACTER OF THE BLUESKY FORMATION IN THE FOOTHILLS OF NORTHEASTERN BRITISH COLUMBIA
(930, P, I )
By W. E. Kilby
The Bluesky Formation has been extensively studied and mapped in the subsurface of northeasterrl British Columbia and Alberta (Alberta Study Group, 1954; Pugh. 1960; Karst, 1981; and \Yhite, 1982). There it reaches a thickness of 25 metres and is an oil and gas producer. In the adjacent foothills equivalent strata are encountered in the course of coal exploration. The unit is situated between the marine Moosrbar and the coal-bearing Gething Formations; it i s important as a marker horizon over much of the Northeastern
underlying Gething coals. Widely spaced sections show that the Bluesky varies corrsiderably in thickness British Columbia Coalfield. The unit may also be important in controlling the pyrite content in some
and lithological composition (Figs. 41 and 42). Taken in conjunction with tonsteirllbentonite 'tirne lines' it becomes apparent that the erosional base of the unit is regionally irregular. Previous work shovved that
are a t two different stratigraphic positions (Duff and Gilchrist, 1982). In this paper these two strrltigraph- what has traditionally been referred to as Bluesky equivalent strata north and south of the Sukunl<a River
ically different occurrences wil l be informally referred to as Bluesky-N and BlueskyS. Bluesky-N is found north of the Sukunka River and is stratigraphically below Bluesky-S.
major change in character between the Sukunka and Wolverine Rivers. North of this area the Gates is In beds known as Bluesky, as in the coal-bearing Gething and Gates Formations, there appears to be a
dominantly marine and lacks major coal seams; the Gething is the major coal-bearing sequence. To the south the Gates contains economically important seams; the Gething is less important. Throughout Creta- ceous time the Peace River Arch affected sedimentation patterns in this area (Sto-t, 1975; Stelk, 1975).
throughout, and may contain some sand or floating pebbles (Fig. 42, stratigraphic columns 12 to 14). Two In the Sukunka-Wolverine area what is known as the Bluesky-S is usually about 1 metre thick, is glauconitic
prominent bentonite bands (Twin Bentonites) lie 4 to 6 metres above the Bluesky-S horizon in this area. To the north rocks equivalent t o the Bluesky-N can be broken into three units: basal conglomerate, middle silty mudstone, and upper glauconitic unit (Fig. 42, stratigraphic columns 2 to 11).
The basal conglomeratic unit can vary from coarse sand to cobble-sized material; thicknesses vary from negligible to more than 10 metres. Angular chert pebbles less than 1 centimetre in diameter are common but occasionally well-rounded cobbles are up to 4 to 5 centimetres in diameter. The middle unit consists of pyritic, bioturbated, and turbiditic silty mudstone; it varies from tens of centimetres to severell metres
commonly displays a coarsening upward trace on geophysical logs. There are varying degree!; of bio- in thickness. The turbidites are thin (3 to 5 centimetres) and probably storm genelated. This middle unit
turbation, usually consisting of small (2 to 3mil l imetre) black burrows that are splierical in cross section; they may represent chondrites or a similar type of trace fossil. Pyrite is usually present in the form of
metres to several metres. With the exception of number 12, glauconite occurs in all sections examined. nodules up to 1 centimetre in length. The upper glauconitic unit can vary in thickness from several ceni-
tered grains to about 80 per cent where it forms glauconite sand. Glauconite identification referenced Number 12 is the most westerly location examined (Fig, 42). Glauconite content varies from a few scat-
units in the Bluesky-N are believed to represent a two-phase transgression. is based on hand sample examination and is not yet verified by thin section or X-ray work, These three
109
ldegroot
1983

110

Variable Bluesky-N thicknesses and thickness changes in the Gething Formation between the Fisher Creek Tonstein zone and the Bluesky-N suggest an irregular and possibly channelled erosiondl surface (Kilby, this volume, Fig. 37).
In areas where coals are present a t the top of the Gething Formation, the thickness of the Bluesky was thought to be related to the quality of the coal. When peat swamps are subjected to marine influence, they usually show an increase in pyrite content. It was thought that when the Bluesky was less than a critical thickness the sulphur content of the underlying coal seam became greater than 1 per cent (Gilchrist, 1978). Shielding of coal seams from marine influence is well known and documented in other areas (Stack, 1982 and Horne, 1978). However, in this case the Bluesky itself is marine, therefore the sulphur content o f the underlying seams should be high. Perhaps the strata between the seam and ihe Moosebar are not all marine perhaps non-marine Gething sediments were deposited over the peat swamp prior t o the marine incursion. This type of occurrence is well documented in the eastern United States (Horne, 1978). Often medium to coarse sands lie between the Bluesky and the uppermost coal. For convenience the top of the Gething has generally been positioned a t the top of the uppermost coal seam; in reality some of the over- lying sands may also be non-marine Gething. It appears that the sulphur shielding is actually depenclent on the thickness of the coal-to-Bluesky interval not on the thickness of the Bluesky. A more detailed in-
solve this problem. vestigation of stratigraphic relationships and the type and distribution of pyrite in the seams is required to
Glauconite can form in a wide variety of low-energy environments, both marine and lacustrine. It is often associated with transgressions, which is true in the case of the Bluesky; it marks the southerly transgression of the Moosebar-Clearwater Sea over the coal-bearing GethingGladstone Formations. The glauconitic portion of the Bluesky-N is in gradational contact with the lowermost part of the Noosebar Lower Silty Member: the glauconite occurs in a mudstone matrix. This setting is consistent with authigenic formation of glauconite (McRae, 1972). Glauconite formation is considered possible only in lion-turbulent waters, that is, below wave base (30 to 50 metres).
Duff and Gilchrist (1982) showed that what has traditionally been referred to as Bluesky equivalent strata over the length of the coalfield occurs in two different stratigraphic intervals. North of Sukunka Rlver the distinctive three-unit Bluesky-N lies between the Moosebar Lower Silty Member arid the Gething Form- ation. The Bluesky-S lies between the Moosebar Mudstone Member and the Gethinsl Formation; which of these units is actually correlative to the type Bluesky of the plains is unclear at present. The posi1:ions of the Twin Bentonites over both these glauconitic transgressive deposits over the length of the coalfield support the interpretation that they occur a t two stratigraphic levels. Detailed examination c'f these bentonites and several others lower in the section may help in pin-pointing the stratigraphic position of the B1ueskv.S in the Peace River area.
A staggered transgressive history for the Moosebar-Clearwater Sea is implied by the interpretation that there are two 'Bluesky Formations'. The initial transgression of this boreal sea formed the conglomerate unit of Bluesky-N. A minor regression occurred during deposition of the middle unit, witnessed by itscoarsening upward character. Then a major transgression occurred in the northern area whic'l resulted in flooding southward to the approximate position of the Peace River Arch. The resultant deep, tranquil water favoured glauconite formation a t the top of the Bluesky-N sequence. Following this inundation a slow regression was occurring, resulting in the deposition of the coarsening-up Moosebar Lower Silty Member in the north.
the lowest Lower Silty Member. Following this regression a major transgression occurred flooding virtually During this period, in the area of the Sukunka River, deltas and coal swamps were migrating northwilrd over
south of the Sukunka River; mudstone deposition continued to the north. A short while after this in- all o f the Northeastern British Columbia Coalfield and resulting in the formation of the Bluesky-S unit
cursion the Twin Bentonites were deposited. At present the bentonites can be traced about 170 kilometres in a northwest-southeast direction and provide an approximate time marker of thi,; last major Moosebar
111

transgression. Carmichael (1983) tentatively correlated these bentonites with similar rocks in the Torrens Member of the Gates Formation in the Dumb Goat Mountain area, suggesting the major regression had already started a t the time of their deposition. He also points out that what has been referred to as the Torrens Member north of the Wapiti River is actually a higher stratigraphic unit, his Sheriff Member. Obviously the history of the Moosebar-Gething contact (Bluesky) has yet to be fully understood.
REFERENCES
Alberta Study Group (1954): Lower Cretaceous of the Peace River Region. Western Canada Sedimentary
Carmichael, S.M.M. (1983): Sedimentology of the Lower Cretaceous Gates and Moosebar Formations, Basin, Symposium, Amer. ASSOC. Pet. Geol., R . L. Rutherford Memorial Vol., pp. 268.278.
Northeast Coalfields, British Columbia, University of British Columbia, Unpub. Ph.D. Thesis, 285 pp. Gilchrist, R . D. (1978): personal communication. ........_. (1979): Wolverine-Hasler MapArea (931/14; 930/8; 93Pi3, 4, 5). E.C. Ministry of Energy, Mines
&Pet. Res., Geological Fieldwork, 1979, Paper 1980-1, pp. 101, 102. Horne, J. C., Howell, D. J., Baganz, 8. P.. and Ferm, J. C. (1978): Splay Deposits as an Economic Factor
in Coal Mining, in Proceedings of the Second Symposium on the Geology of Rocky Mountain Coal -
Karst, R. H. (1981): Correlation of the Lower Cretaceous Stratigraphy of Northeastern British Columbia 1977, H. E. Hodgson, Editor, Colorado Geol. Surv., pp. 89-100.
from Foothills to Plains, B.C. Ministry of Energy, Mines & Pet. Res., Geological Fieldwork, 1980, Paper 1981-1, pp. 78-89.
Leckie. D. A. and Walker, R . G. (1982): Storm- and Tide-Dominated Shorelines in Cretaceous Moosebar-
Pet. Geol., Bull., Vol. 66, No. 2, pp. 138-157. Lower Gates Interval - Outcrop Equivalents of Deep Basin Gas Traps in Western Canada, Aka. Assoc.
Pugh. D. C. (1960): The Subsurface Gething and Bluesky Formations of Northeastern British Columbia, McRae, S. G. (1972): Glauconite, Earth-Sci. Rev., Vol. 8, pp. 397-440.
Geo/. Surv., Canada, Paper 60-1, 20 pp. Stack, E., Mackowsky, M-Th., Teichmuller, M., Taylor. G. H., Chandra, D., and Teichmulier. R. (1982):
Stack's Textbook of Coal Petrology, 3rd Ed., Grbruder Borntraeger, Berlin, 535 pp. Stott, D. F. (1975): The Cretaceous System in Northeastern British Columbia, in Caldwell, W.G.E., Editor,
The Cretaceous System in the Western Interior of North America, Geol. Assoc. Canada, Special
White, G. V. (1982): The Bluesky - A Stratigraphic Marker in Northeastern British Columbia (931, 0, P), Paper 13, pp. 441-467.
B.C. Ministry of Energy, Mines & Pet. Res., Geological Fieldwork. 1982. Paper 1983-1, pp. 85-87.
112

A USEFUL MICRO-COMPUTER PROGRAM
By W. E. Kilby
The las t few years have seen a proliferation of portable and hand-held micro-computers (electronic note- books). Recently, exploration companies have been making increased use of these machines while in the field. Unfortunately, few programs are widely available to handle geology-specific tasks on these versatile tools.
The program described here, THICK calculates the stratigraphic thickness between two points with :;imilar or differing bedding orientations. The program given here (Fig. 43) is written in Microsoft BASIC and will run with little or no modification on most of the popular micro-computers. The small memory require-
puters. Positional and orientation data for both points are entered as x, y. z coordinates and dip direction ments (3K bytes) allow the program to run on most all hand-held computers as well as inexpensive com-
and dip angles, respectively. The program contains useful routines of interest in structural geology. Charlesworth and Kilby (1880) contains a detailed explanation of the numerical techniques as well as a practical example. Busk (1929) illustrates the equivalent graphical procedures.
MEAN ORIENTATION BUSK METHOD
T mean pitch line
-VE
-VE
\
+VE I
Figure 43. Examples of the signing of the thickness results from the two calculation techniques. Points 1 and :? are the Ditch liner prolecterl onto the plane O f profile.
113
ldegroot
1983

2 REM*** 1 REMr+*c*t+xxi+c++x*c***xrrx+x THICK I C C X + + * C C I + X + * * X ~ X I I I ~ * ~ ~
3 REM++*rr*r+*r**c+*cr**~*~*********ff**~****~*******~*~****~*~* W.E.KILBY **I
100 PI=3.14159/180:PK=1.5708 109 REM ARCCOSINE I10 DEF FNAC(Q)=-ATN(Q/SQR(-Q*Q+l))+PK 119 REM ENTER POSITIONAL AND ORIENTATION DATA 120 1NPUT"ENTER X,Y,Z COORDS OF O / C l " ; X l , Y l , Z l 130 1NPUT"ENTER DIP-DIR. AND D I P OF O/C I " ; D I , P l 140 INPUT'ENTER X,Y,Z COORDS OF O/C 2";XZ,YZ,ZZ 150 1NPUT"ENTER DIP-DIR. AND D I P OF O/C 2";DZ,PZ 160 P=(90-Pl)*PI:T=(Dl+l8O~*PI 170 GOSUB 580 180 Ll=L:Ml=M:Nl=N 188 REM TEST I F ORIENTATIONS DIFFERENT, I F SfWE CALCULATE THICKNESS 189 REM BY MEAN METHOD. 190 I F (Dl=DZ)AND(Pl=PZ)THEN L3=Ll :H3=Ml:N3=Nl :GOTO 260 200 P=(90-P2)*PI:T=(D2+18O)*Pl 210 GOSUB 580 220 L2=L: MZ=M: NZ=N 229 REM CALCULATE MEAN ORIENTATION 230 L3=CDS((FNAC(Ll)+FNAC(L2))/2) 240 M3=COS((FNAC(MI)+FNAC(M2))/2) 250 N3=COS((FNAC(Nl)+FNAC(N2))/2) 260 TH=(X2-Xl)*L3+(Y2-Yi)*M3+(22-21)*N3 270 PR1NT"THICKNESS BY MEAN ORIENTATION METHOD I S = **"; 280 PRINT TH; " C * " . 279 REM CALCULATE DIRECTION COSINES
. IF (D l=DZ) AND ( P l = P 2 ) THEN 600 290 L3=Ll:M3=Ml:N3=N1:L4=L2:M4-M2:N4=N2 300 GOSUB 540 310 I F DE-0 THEN P=O:T=T+PK:GOSUB 580:LW=L:MB=M:NW=N:GOTO 330 320 LB=LL:MB=MM:NB=NN 330 NT=ATN(LB/HB):NP=ATN(N8/SQR(-N8*N8+1))
350 I F MB>O THEN NT=NT:GOTO 370 340 IF(LB<O)AND(HB<O)THEN 370
360 NT=PK*4+NT 370 T=NT+PK:P=O:GOSUB 580 380 LH=L: W=M: NH-N:T=NT: P-K-NP 390 GOSUB 580
409 REM CALCULflTE COORDINATES DF POINTS ON PROFILE 400 LV=L: MV=M: NV=N
410 X3=LH~Xl+MH*Yl+NH*Z1:Y3=LVxXl+MV*Y1+NV*Zl 420 X~=LH*XZ+MHIYZ+NH*Z~:Y~=LV*X~+MV*Y~+NV+Z~ 430 L3=Ll:M3=Ml:N3=N1:L4=LB:M4=MW:N4=NB 440 GOSUB 540 449 REM CALCULATE PITCH ANGLES 450 AN=LL*LH+MM*MH+NN+NH:Al=FNAC(AN) 460 L3=L2: M3=MZ: N3=N2: GOSUB 540 470 AN=LL*LH+MMcMH+NN*NH:AZ=FNAC(AN) 480 XS=X3-X4:YS=Y3-Y4 489 REM CALCULATE BUSK THICKNESS 490 SU=COS(Al)+SIN(AZ)-COS(~2)*SIN(Al) 500 PP=SIN(Al)c(YS*SIN(A2)-X5*COS(AZ))/SU
520 TH=SQRIPPLZ+QQn2)-SQR(~PP-X5)h2+~QQ-Y5)n2) 510 QQ=COS(Al)*(YS*SIN(A2)-X5*COS(A2))/SU
530 PR1NT"THICKNESS BY BUSK METHOD = *C " i T H ; " **":GOTO 600 539 REM CALCULATE ORIENTATION OF INTERSECTION OF TWO PLANES 540 DE=L3*M4-L4+M3:IF DE=O THEN 570 550 D=(M3rN4-M4tN3)/DE:E=(L4*N3-L3*N4)/DE 560 NN=1/SQR(DL2+E"2+l):LL=D+NN:"=EINN 570 RETURN 580 L=SIN(T)sCOS(P):M=COS(T)+COSO:N=-SIN(P):N=-SIN(P) 590 RETURN 600 END
Figure 44. A MiCROSOFT basic version of the thickness calculation program. Only lines with numbers evenly divisible by 10 need be entered: the rest are comment lines. In its present form the program can be easily adapted to take advantage of machine-specific features.
114

Two methods of thickness calculation are employed in the program: the mean orielnation, and the Busk techniques. I f identical orientations are present a t both positions this value is used in the mean orientation technique and the Busk method is neglected. When varying orientations are entered, the mean orientation between those entered is used in the mean technique while the two different orientations are used for cal- culating the Busk thickness. Results from the two techniques are given SO the user may compare the
points. In the case of the mean method a negative value indicates that the first data point entered is strati- results and explain discrepancies, if any. The results are signed, indicating relative positions between data
position entered is further from the centre of curvature of the beds than the second position (Fig, 441. In graphically lower than the second position. In the Busk method a negative value means that the first
this program the bedding orientation angles must be relative to the coordinate system used to locate the data-point positions.
The advantage of these numerical techniques over the equivalent graphic procedures a8.e obvious when only one calculation is being undertaken but truly impressive when a large series of value!; are to be calculated rapidly. A few common uses of this program are:
( 1 ) Calculating stratigraphic intervals along traverse lines (Charlesworth and Kilby, 1980) or across existing geology maps.
(2) Calculating stratigraphic thickness in a covered interval during section measuring.
(3) Predicting horizon depth in boreholes given various bedding orientations or borehole locations.
(4) Thickness calculations given bedding-to-core angles.
(51 Thickness calculations given dipmeter values.
As it stands the program calculates one problem at a time: it is easily modified to sum the stratigraphic interval for a series of data points such as outcrops or bedding-to-core angles down a borehole.
Occasionally the user would like more information from the calculations than the stratigraphic thickness. The following values are of potential interest in judging the validity of the calculation or for use in some other task:
(I) Orientation of the intersection of the two bedding planes, fold-axis orientation,
( 2 ) The coordinates of the two points projected onto the plane normal t o the fold-axis orientation.
(3) The clockwise pitch angles of the two projected orientations on the plane normal to the fold-axis orientation.
Microsoft BASIC on micro-computers runs interactively. This allows the user to stop the program a t any
by adding in the following lines to Figure 43: point and determine the value of a variable. The three sets of information described above can be obtained
331 PRINT NT,NP - where values are the trend and plunge of the fold-axis orientation in radians.
421 PRINT X3, Y3, X4, Y4 - yields the horizontal and vertical coordinates on the plane of the profile for points one and two, respectively.
475 PRINT A1,AZ - provides the angles, in radians, of the clockwise pitch of beddingfrc,m points one and two on the plane of the profile.
115
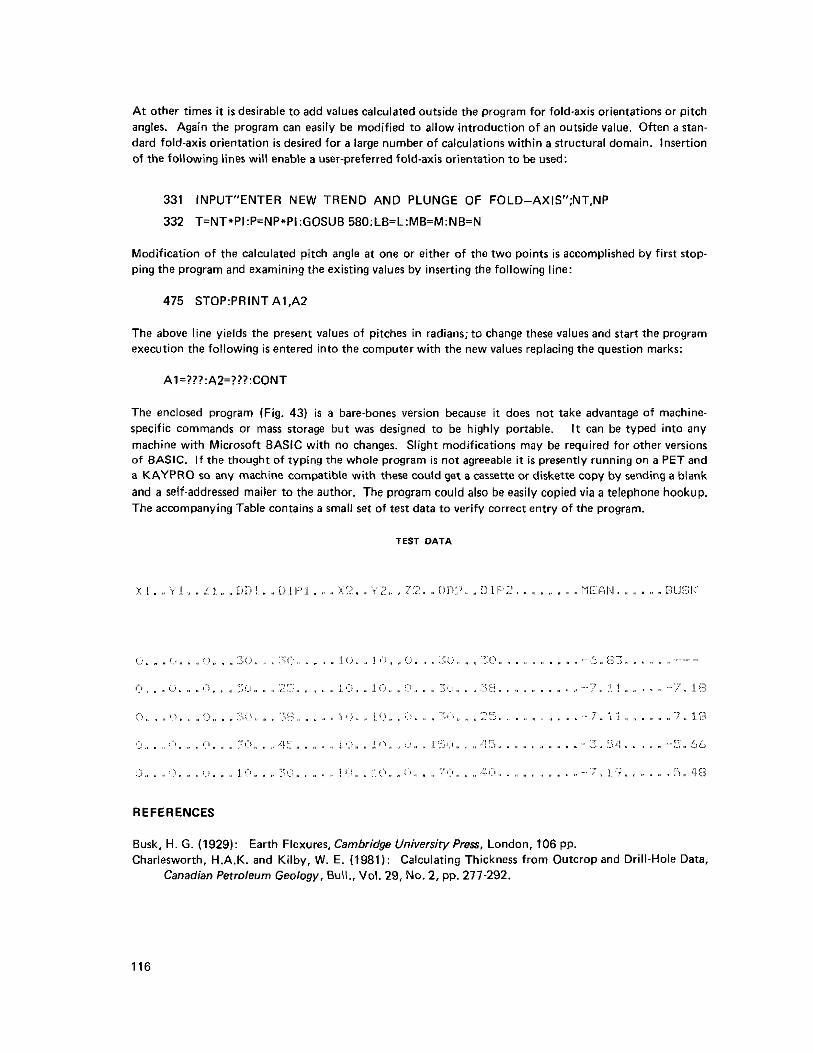
A t other times it is desirable t o add values calculated outside the program for fold-axis orientations or pitch angles. Again the program can easily be modified to allow introduction of an outside value. Often a stan- dard fold-axis orientation is desired for a large number of calculations within a structural domain. Insertion of the following lines wil l enable a user-preferred fold-axis orientation t o be used:
331 INPUYENTER NEW TREND AND PLUNGE OF FOLD-AXIS";NT,NP
332 T=NT*PI:P=NP*PI:GOSUB 580:LB=L:MB=M:NB=N
Modification of the calculated pitch angle a t one or either of the two points is accomplished by f irst stop ping the program and examining the existing values by inserting the following line:
475 STOP:PRINTAl,AZ
The above line yields the present values of pitches in radians; to change these values and start the program execution the following is entered into the computer with the new values replacing the question marks:
Al=???:AZ=???:CONT
The enclosed program (Fig. 43) is a bare-bones version because it does not take advantage of machine- specific commands or mass storage but was designed to be highly portable. It can be typed into any machine with Microsoft BASIC with no changes. Slight modifications may be required for other versions
a KAYPRO so any machine compatible wi th these could get a cassette or diskette copy by sending a blank of BASIC. I f the thought of typing the whole program i s not agreeable it is presently running on a PET and
and a self-addressed mailer to the author. The program could also be easily copied via a telephone hookup. The accompanying Table contains a small set of test data to verify correct entry of the program.
TEST DATA
REFERENCES
Charlesworth, H.A.K. and Kilby, W. E. (1981): Calculating Thickness from Outcrop and Drill-Hole Data, Busk, H. G. (1929): Earth Flexures, Cambridge University Press, London, 106 pp.
Canadian Petroleum Geology, Bull., Vol. 29, No. 2, pp. 277-292.
116

STRATIGRAPHIC AND DEPOSITIONAL RELATIONSHIPS BETWEEN THE BLUESKY MARKER UNIT, GETHING MARINE TONGUE, AND
UPPER COAL MEASURES OF THE GETHING FORMATION
(930, P)
By A. Legun
A recent correlation of Lower Cretaceous coal measures in the Peace River coalfields (Duff and CNilchrist, 1981) documented the presence of a major marine tongue in the Gething Formation south of Sukunka River (Figs. 45 and 46). This tongue divides the Gething Formation into upper ;and lower coal-bearing sequences. Prominent coals in the upper sequence include the Bird, Skeeter, and Chamberlain s e a m of BP Exploration (Canada) Limited's Sukunka property. Deposits of the marine tongue thin to the southeast
sandstones that is free of coal: they commonly contain the marine bivalve Enrolium irenense. 13eposits and thicken to the northwest. They consist of an upward coarsening sequence of intcrbedded siltstones and
'shale out' to the northwest into the Moosebar Formation, while becoming sandy and even pebbly to the southeast where they thin. To the northwest coal drill-hole data from BP's Sukurlka and Teck Corpora- tion's Burnt River East properties indicate that the Bird, Skeeter, and Chamberlain seams pinch out (in that order) and are replaced by marine sandstone and siltstone. Similarly, gamma and density logs from petroleum and gas wells show that the upward coarsening sequence of the marine tongue persis1.s to the northwest but loses coal 'density kicks' a t the top (for example, see Quasar e t al O8:tco. 6200' to 6600' in Duff and Gilchrist, 1981).
The presence or absence of coal may be used as a measure of the areal limit of the upper coal-bearing
the presence of a deltaic lobe that trends northeast and is bordered by marine deposits of the Moosebar sequence. This is illustrated on Figures 47 and 48 for the Sukunka-Gwillim Lake area. The data indicates
Formation.
Northwest o f Sukunka River the upper coal-bearing sequence is absent. Between the Pine and ljukunka
being lateral equivalents of the Gething marine tongue. A t Peace River Canyon rock:. of the 'lower' Gething Rivers 'lower' Gething rocks are overlain by silty sedimentary rocks of the Moo:.ebar Formation, these
Formation are overlain by mudstone of the Moorebar Formation.
The top of the 'lower' Gething Formation is in sharp contact with a pebbly and (Ilauconitic marker unit called the Bluesky (Pugh, 1960). The Bluesky is generally regarded as a thin lag deposit formed during initial transgression of the Moosebar Sea. However, i t varies considerably in thickness (<1 to 40 metres) and lithology in the Peace-Pine Rivers region, where i t consists variably of petlbly mudstone, pebbly arenite, or quartz arenite.
Southward the Bluesky persists as a distinct marker uni t to the area of the Sukunka River. 'There it 'merges' with and forms the base (?) of sandy and glauconitic sedimentary rocks of the Gething marine tongue (for example, in BP Sukunka diamond-drill hole C-35 and on Figs. 45 and 48 of this report). Together these rocks represent sediments deposited in shallow offshore condition!; in the Moosebar Sea: they lie near the southern limit of its transgression.
Some workers, for example, oil company Personnel and White (1983). classify the entire marinf tongue as the Bluesky. For this reason, White's isopach map shows pronounced thickening of the Bluesky in the Gwillim Lake area. Because it is pan of the marine tongue, it is clear that the Bluesky disappears as the
117
ldegroot
1983

118

80'338 ' IW (11-65 1101s )
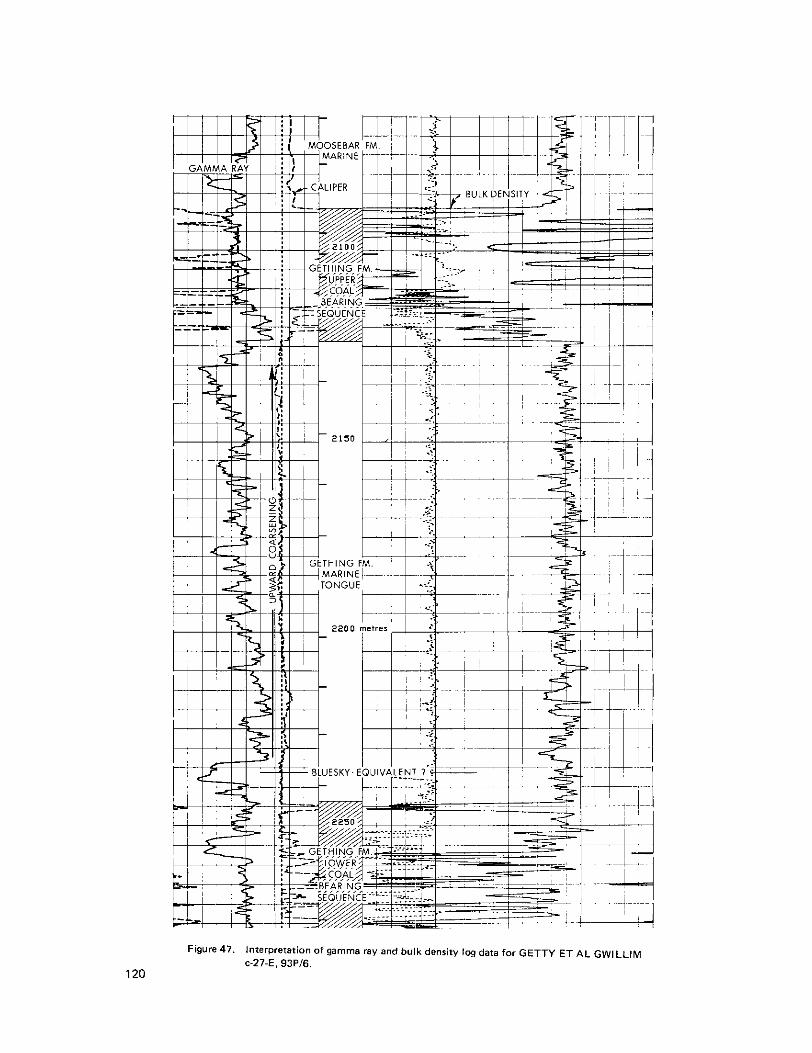

121

marine tongue pinches out. Southeast of Sukunka River the top of the 'upper' Gething is in sharp contact with another pebbly unit. This unit cannot be correlated or isopached together with the Bluesky on top of the 'lower' Gething Formation; they are deposits of separate transgressions; there is a regressive deltaic sequence stratigraphically between them.
A northeast-trending basement high called the Peace River Arch probably controlled largexale migration of the land/sea boundary, shallowing of the Moosebar Sea, and orientation of the 'upper' Gething delta lobe. Stott (1974) documented the position of the arch and i t s effect on sedimentation patterns through- out much of Early Cretaceous time.
Thickest accumulations of the Bluesky appear to coincide with the edges of basins of subsidence . In the south, this occurs where there is rapid thickening of the Gething Formation a t the edge of the Peace River Arch a t Sukunka River. To the north, substantial thicknesses (up to 40 metres) o f Bluesky arenite and conglomerate on the Moberly licenses (Gulf Canada Resources 1nc.l and Butler Ridge accumulated along the north and south edges of a major east-west trough of subsidence between the Peace and Pine Rivers (see
maximum thickness of Gething Formation was deposited.
report on Butler Ridge map-area, this volume and Stott, 1968, Fig. 10, p. 31). It is in this trough that the
Areas of maxiumum subsidence would quickly be drowned by marine waters; hinge zones on the edges of basins might be expected to be reworked with longshore drift, beach, and offshore bar development. McLean and Wall (1981) suggested that extensive estuaries formed during transgression of the Moosebar Sea in Alberta; the thickness and distribution of the Bluesky Formation may be related t o similar estuaries developed in northeastern British Columbia.
REFERENCES
Duff, P.McL.D. and Gilchrist, R . D. (1981): Correlation of Lower Cretaceous Coal Measures, Peace River
McLean, J. R . and Wall, J . H . (1981): The Early Cretaceous Moosebar Sea in Alberta, Cdn. SOC. Petrol. Coalfield, British Columbia, B.C. Ministry of Energy, Mines& Pet. Res., Paper 81-3, 31 pp.
G e d . Bull., Vol. 29, No. 3, pp. 334-377. Pugh, D. C. (1960): The Subsurface Gething and Bluesky Formations of Northeastern British Columbia,
Geo/. Surv., Canada, Paper 60-1. 20 pp. Stott. D. I. (1974): Lower Cretaceous Coal Measures of the Foothills of West-Central Alberta and North-
eastern British Columbia, C.I.M.. Bull., Vol. 67, No. 749, Sept. 1974, pp. 87-100. Stott. D. S . (1968): Lower Cretaceous Bullhead and Fort St. John Groups Between Smokey and Peace
279 pp. Rivers, Rocky Mountain Foothills, Alberta and British Columbia, Geol. Surv., Canada, Bull. 152,
White, G. V. (1983): The Bluesky - A Statigraphic Marker in Northeastern British Columbia, B.C. Ministry ofEnergy, Mines& Pet. Res., Geological Fieldwork, 1982, Paper 1983-1, pp. 85-88.
122
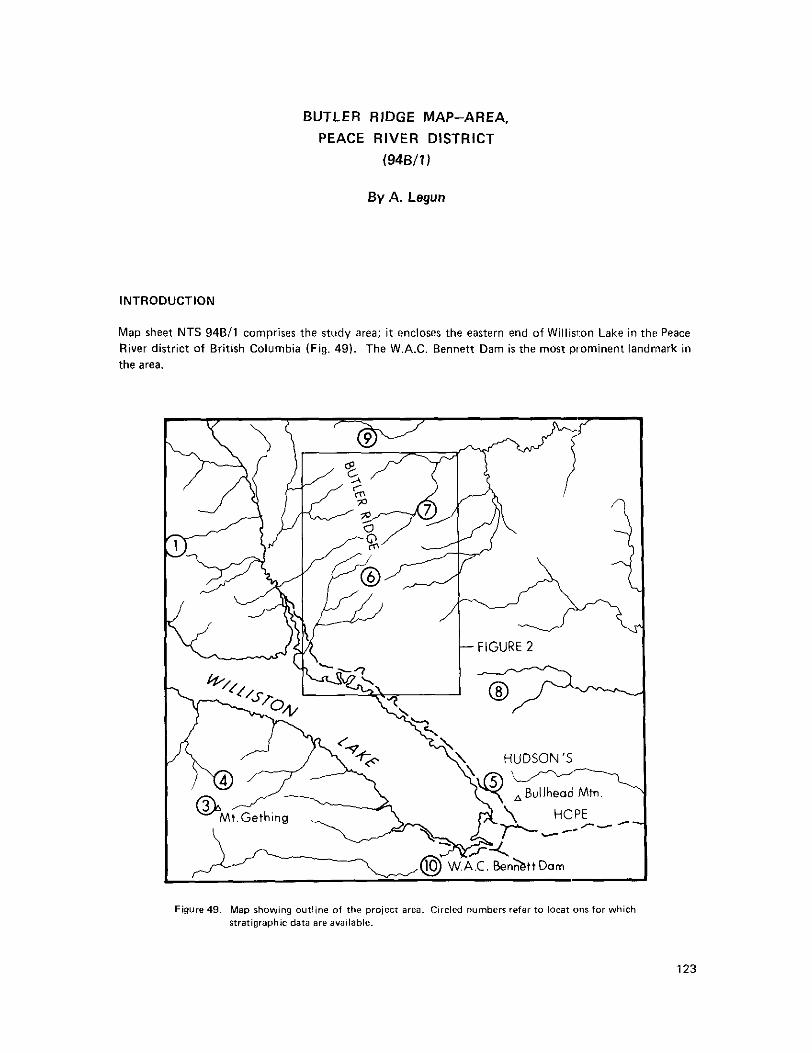
BUTLER RIDGE MAP-AREA, PEACE RIVER DISTRICT
(94B/1)
By A. Legun
INTRODUCTION
Map sheet NTS 94811 comprises the study area; it encloses the eastern end of Williston Lake in the Peace
the area. River district of British Columbia (Fig. 49). The W.A.C. Bennett Dam is the most prominent landmark in
Figure 49. Map rhowing outline of the project area. Clrcled numbers refer to locatlonr for which stratigraphic data are available.
123
ldegroot
1983

STRATIGRAPHIC LEGEND AND MAP SYMBO,
BEDDING ATTITUDE THRUST FAULT : defined ,approximole
DIRECTION OF GLACIAL STRIAE SYNCLINE.ANT1CLlNE ++ MINE SITE
Figure 50. Geology of a portion of map-sheet 94811 (mapped at scale 1 5 0 000)
124

Fieldwork in 1983 was oriented toward synthesizing the geology from previous work. Previous work includes mal property assessment work by Utah Mines Limited, Hudson's Bay Oil & Gas Company Limited, Amax of Canada Limited, and Cinnabar Peak Mines Ltd. in the areas of Mount Gething. Dunlevy
drilled in the region. Inlet, Farrell Creek, and Portage Mountain respectively. Data are also available from a number of gas wells
General stratigraphy and mapping has been done in recent times by Beach and Spivak (1944). Hughes (1964). and Stott (1963, 1966, 1969a. 1969b. 1973). but Beach and Spivak's map remains the only com- prehensive compilation of the geology of the area on a 1 :50 000 scale.
Beach and Spivak designated strata between the Cretaceous coal-bearing Gething Formation and the Jurassic marine Fernie Formation as the Dunlevy Formation. The term Dunlevy has been discarded and the section divided according to the terminology of Mathews (1946) and Stott (1980) but disputes remain (Hughes 1964).
Cadomin appears to be identifiable and Traceable in the maparea. It is marked by ia sharp and irregular In the terminology of Stott the Cadomin Formation underlies the Gething Formation. The base of the
contact of pebbly arenites with fine-grained, rippled, thimbedded quartz arenites and siltstones. 4bout
bedded interval frequently occurs at or very close t o the base of the Cadomin Formation as defined by 1 centimetre of coal occurs a t the contact; there is carbonaceous mottling (rooting ?) below. A similar
other criteria (see following). Recognizing the base of the Cadomin facilitated sortins out the stratigraphy of the underlying Minnes Group.
The stratigraphic sequence must be mapped with caution. The Cadomin Formation and the Minnes Group are both arenaceous sequences: dipslope exposures are particularly prone to incorrect designation unless a check with a nearby vertical section is made.
Mapping and air-photograph examination outlined folded and faulted strata that giw? more complex map unit patterns than that presented in previous maps of the area (Fig. 50). For example, dip-slope relnnants of the Cadomin Formation are preserved high on the backs of cross ridges to the main Butler Ridge which otherwise is underlain by the Monteith Formation. Deep in the valleys that drain ea5.t Mount Gething, the Cadomin Formation is exposed; dips of its contact with the Gething are generally about the same as the gradient o f the valley.
GENERAL STRATIGRAPHY
MONTEITH FORMATION
The Monteith Formation consists of thick units of white rippled quartz arenite interbedded with 'grey to tan rippled shales and arkosic wackes. Exposure of the Monteith Formation often ;arm scarps of quartz arenite that exceed several tens of metres in height. Consequently, the Monteith f:ormation constitutes much of the high and steep exposure on Mount Gething, south Mount Gething (immediately south of the map-area), and Butler Ridge.
Gething indicates that 603 metres of the formation are present. The writer did not observe the base but Re-examination of a section measured by Beach and Spivak (1944) on the north amphitheatre of Mount
Beach and Spivak's data suggest that the lowest 25 metres are in the transition beds to shale of the Fernie Formation. It is not always clear, especially in logs, which quartz arenite in contaci: with shale comprises the top of the Monteith Formation. As a result there are various interpretations of the stratigraphy
thickness data suggest that the formation thins eastward (accompanying table). between the Monteith and Cadomin Formations Ifor example, Hughes. 1964; Karjt, 1981). Ccmmpiled
125

COMPILATION OF STRATIGRAPHIC THICKNESS DATA (SEE FIGURE49 FOR LOCATIONS)
1. 2. 3. 4. 5. 6. 7 . 8.
10. 9.
11.
Quasar e t a1 Dunlevy a-40-L Rainbow Rocks M o u n t G e t h i n g - N o r t h Mount Gethrng - -Northeast Butler Ridge ~ South
Czar et al Butler d-59~J Butler Ridge ~ North
FPC - Rlchfl f ld. Brenot Creek No. 1 Amax Coal Ca. Inc.. diamond-drill hole BR.1 Peace River Canyon West Cdn Moberly Lake 11-36-80-25
z 0 c -
Lye z z Y Y Y O
metres 1 00 ..." ."" .""
.~."
.."~
120 34 ..."
120 .""
z r o k r w u s z Z Y 0 0
metres 505
603 .""
.""
."" "~.. 415 382 ."" ."" 282
metres merres 200
,> 120 ..." 210
"..~ -100
-50 -125 "30 -120
50 95 110
.""
."" .""
61 ..... .""
z 0
I U 0% OLE u o
metres O Y
Z F
..... "... "... .~... ."..
-260 ."..
.""
.""
..... 119
> Y
Y v)
3 A
metres m
.""
.""
..."
.""
.""
"".
"." 40
40 <1
6
BEATTIE PEAKS FORMATION
fine-grained rippled arenites. and quartz arenites. The stratigraphic interval is normally recessive but The Beattie Peaks Formation consists of dark, burrowed, and carbonaceous siltstones, ferruginous shales,
Spivaks' section on the west 'table-top' of Mount Gething. To the south, on the South Mount Gething less so in this map area than to the west. Best exposures comprise the top 125 metres of Beach and
property, Utah Mines considers that about 40 metres of this formation are present. East of Mount Gething the formation is diff icult to recognize, both on logs and in section. In the area of Bullhead Mountain it forms a thin (30-metre ?) shaly transitional interval between quartz arenites below and flaggy arenites above, but both lithologies are much interbedded. I t s upper contact is sharper on Butler Ridge t o the north. The formation thins eastward from the Carbon Creek area (where i t is X230 metres); the Butler RidgeIBullhead Mountain area is probably near the eastern limit where i t can be recognized.
MONACH FORMATION
The Monach Formation consists of massive to flaggy arenite units. Arenite units are ledge forming but these are not as prominent as scarps of the Cadomin or Monteith Formation. Platy crossbedding and general lack of both pebbles and log casts helps to differentiate these arenites from those of the Cadomin
lying a massive base (for example. northwest end of Butler Ridge). A t Rainbow Rocks lateral pinching of Formation, which they otherwise resemble. Some units fine upwards in grain size with flaggy beds over-
units is apparent.
Tentative identification of the Monach Formation on Bullhead Mountain was made last year (Legun, 1982): it is apparently confirmed by a section exposed immediately to the south of the highest knob on Butler Ridge where aPproximately 125 metres of massive and crossbedded arenite (Plate VI) underlie the
south and west sides of Bullhead Mountain, a t Rainbow Rocks, and on the northeast flank of Mount pebbly Cadomin Formation. Similar flaggy arenites directly underly the Cadomin Formation on the
Gething. Coarse-grained quartz arenite is also present and may grade into arenite without an apparent bedding contact. Gamma log data from gas wells indicate that some recessive zones between arenite units are carbonaceous.
Immediately below the Cadomin Formation on the north side of Portage Mountain near the British 'Columbia Hydro line i s an anomalous section consisting of tens of metres of massive coarse quartz arenite
126

overlain by interbedded quartz arenite, shale, and coal. Bedding dips indicate that t h i i sequence underlies pebbly Cadomin Formation exposed in a road cut leading to the W.A.C. Bennett Dam. This contrasts markedly with arenites immediately to the north on Bullhead Mountain that are apparently in the same stratigraphic position.
It is diff icult to judge the thickness variation in the Monach Formation since, together with Beattie Peaks shale, it may form a single upward coarsening sequence. Where a reasonable separation of lithology lhas or can be made (accompanying table), a thickness not exceeding 125 metres is indicated. This is not a signifi- cant change from thicknesses to the west (Mathews, 1946).
Plate VI. Outcrop of crorr-bedded Monach Formatton arenite, Butler Ridge area
CADOMIN FORMATION
The Cadomin Formation is characterized by a series of pebbly arenite units that form scarps or ledges separated by recessive interbeds. This corresponds to a large blocky gamma response on geophysical logs. On the whole units are only sparsely pebbly with pebbles concentrated in lenses near or a t the base. Log casts a t the base are also typical. Carbonaceous shales and thin coals constitute parts of the recessive intervals. The base of the Formation is distinct and it grades into the Gething 'coal measures' by thinning of arenite units and loss of pebbly aspect.
The Cadomin Formation is well distributed through the map area; a complete section may be present on Butler Ridge above the headwaters of Gravel Hill Creek. Here steep-dipping arenite units are exposed for a considerable distance along strike. They are lens-like and fine upward from congl,amerate a t the base, This and other characteristics, for example log impressions, suggest a fluvial origin for these units.
127

Clasts i n the Cadomin are up to 5 centimetres in long diameter; no pronounced change in clast s ize from west to east was noted. A maximum thickness of 260 metres is indicated in Czar e t al Butler gas well. Sections measured by Stott and mapping by the writer suggest a thickness of ZOO+ metres in the map-area.
GETHING FORMATION
The Gething Formation is a typical 'coal measure'sequence. It consists of interbedded arenites. siltstones, shales, mudstones, and coals; fossil plant material is abundant. The type section is a t Peace River Canyon, immediately below the W.A.C. Bennett Dam, on its west side. Interesting features of Peace River Canyon exposures include a preserved tree trunk with annual growth rings (Legun, 1982).
In the map area the Gething Formation is virtually free of conglomerate; on the whole it is distinguishable as a map unit from the Cadomin Formation. Thick units of Cadomin pebbly arenite pass laterally by pinch. out into coal measures of the basal Gething Formation (for example, a t old Reschke mine). Thus, positioning of the basal contact varies from place to place. On the east side of Butler Ridge a sudden decrease of prominent sandstone 'ribs' of the Cadomin Formation visible on air photographs marks the mapped contact with the Cadomin Formation. The top of the Gething section is defined by a distinct marker unit called the Bluesky (discussed later).
The thickness of the Gething Formation varies significantly within the map-area. To the northeast coal drill hole BR-1 and gas well data (Czar e t al Butler) indicate a thickness of 275 and 325 metres respectively (Bluesky excluded). In the Peace River Canyon. 28 kilometres to the south, i t is 550 metres. Just west of
deposited. This increases to over 1 000 metres to the west in the Carbon Creek area. Well t o the south of
the canyon a t Mount Gething, Utah Mines calculates that 670 metres of Gething strata were initially
the maparea toward Pine River the formation thins again, defining a basin of subsidence between the Peace and Pine Rivers extending east-west. This basin of maximum deposition was outlined by an isopach map of Stott (1968, Fig. 10, p. 31); it appears to be even more trough-like in form west of Moberly Lake.
The thickness of the Bluesky marker unit also varies significantly in the map-area. Lithologically the Unit consists of glauconitic chert pebble mudstone to pebbly arenite to well-sorted quartz arenite. Lithologic contrast is strong with the overlying Moosebar shales and underlying Gething coal measures. In the Peace
in mudstone. To the north, in the Ruddy Creek area, thickness has increased to 40 metres and it consists of River Canyon area the Bluesky is less than one metre thick and consists o f matrix-supported chert pebbles
hole BR-1). The sequence coarsens upward in 'step-like fashion'. Hughes (1972) separated the quartz 24 metres of quartz arenite overlain by 17 metres of closely packed pebble conglomerate (diamond-drill
arenite from the conglomerate and called i t the 'Ruddy Member' of the Gething Formation; however, from gamma log response and physical character (no coal) it i s apparent that the conglomerate and the arenite form the same depositional unit.
Beach and Spivak identified Discranodonta in the conglomerate a t Ruddy Creek. This pelecypod, together with upward coarsening and fair to good sorting of clasts within discrete layers, suggests that the Bluesky unit is of shallow marine origin. The source of the clasts is an enigma.
COAL GEOLOGY
Though thin coals are present in the Cadomin Formation and carbonaceous zones occur in the Minnes Group, the Gething is the only formation of economic significance. The Gething Formation in the Peace River Canyon area has a t least 20 named seams but they rarely exceed 1 to 1.5 metres in thickness. Utah Mines has correlated some with seams underlying its East Mount Gething property (Louise, Milligan. and
ward into Bri-Dowling and South Mount Gething properties hut their presence north of Williston Lake is Riverside seams). The Trojan and Superior seams of the Peace River Canyon area are correlated south-
in doubt.
128

Coal outcrops are easily accessed along the Dunlevy Creek Road, the road to W.A.C. Bennett Dam by Portage Mountain, and the road going to Carbon Lake by Mount Gething.
In general, maximum coal seam thickness increases from the Williston Lake area southward to the Pine Pass region, where occasional seams are 4 metres or more thick. The map area probably represents the northern l imi t of economic coal in the Gething Formation.
In the north half of the map-area, drilling by Amax in 1971 and 1972 did not intersect seams thicker than 1.2 metres. Hudson's Bay Oil & Gas intersected a 3.metre-thick high-ash coal seam in the middle Gething just east of Dunlevy Inlet. On the eastern slopes of Mount Gething the Riverside seam is a maximum 3 metres thick but averages half that thickness.
A coal rank study by Hacquebard (1974) of the Peace River Canyon section indicatecl that coal reflectance values ranged from 1.05 a t the top to 1.36 a t the base of the Gething Formation. This indicates that coals
area are non-coking (low FSI). in the area are medium to high-volatile bituminous in rank. Company data also indicates that coal:; in the
PRE-CADOMIN UNCONFORMITY: DISCUSSION
Stott (1969. 1973) considers that the Cadomin Formation lies on Beattie Peaks strai:a in the Butler Ridge area at Rainbow Rocks and on Bullhead Mountain and that intervening strata, the Monach and Bickford
eastward thinning; he considers the base of the Cadomin Formation to mark a major unconformity with Formations, were removed by erosion. Stott rejects the idea that intervening formations disappear by
progressive bevelling of underlying formations in a northeast direction. This has been disputed by Hughes who argued that the carbonaceous Bickford Formation, his Brenot Formation, persisted eastward from the Carbon Creek area. The writer agrees with Stott: apparently Hughes' Brenot Formation is based on in- correct identification of the top of the Monteith Formation in the French Petroleum C:ompany - Richfield, Brenot Creek No. 1 well.
Stott's unconformity probably corresponds to the distinct contact observed a t the base of the Cadomin lithologic sequence. This unconformity, however, is not as profound as suggested by Stott; the h'lonach Formation is present and loss of thickness of the Minnes Group is due in part t o stratigraphic thinning, not erosion.
STRUCTURE
As noted by Beach and Spivak (1944). the major structural features of the Peace River foothills are narrow zones of anticlinal folds, commonly broken by high.angle thrust faults, separated by Ibroad synclinal basins of gently folded strata (for example, the Dunlevy syncline). In the map-area, two major fault zones are present. On Butler Ridge Monteith quartz arenites are thrust over the Gething Formation. To the south
synclines and anticlines. These tight anticlines open into box-like forms with sharp-kinked limbs. To the this major thrust splits into a series of thrusts which have smaller displacement and are separated t8y tight
north only dipslope remnants of the Cadomin Formation are preserved high on thl? 'back' of the thrust plate; to the south, where the structures open up. Cadomin Formation forms the bulk of the exposure of the anticline and syncline pairs.
On the east flank of Mount Gething a major fault thrusts Monteith quartz arenite (over Cadomin pebbly arenites. This thrust continues on the east side of south Mount Gething. West of the thrust, s t ra ta on Mount Gething and south Mount Gething are flat lying; further west they steepen to the west over a kink fold. This suggests that the structure forming the flat peak tops of both mountains is a box fold with its
129

east limb overturned above the thrust. Beach and Spivak's map, however, shows the kink on Mount Gething to be a thrust which continues as the thrust on the east flank of south Mount Gething; mapping by the writer suggests that this is incorrect.
REFERENCES
Beach, H. H. and Spivak. J. (1944): Dunlevy - Portage Mountain Map-Area, Gee/. Geol. Surv., Canada,
Hacquebard, P. A. (1974): Rank Studies of coals in the Rocky Mountains and Inner Foothills Belt, Paper, 44-19, 13 pp.
Canada, in Carbonaceous materials as indicators of metamorphism, R . R . Dutcher, P. A. Hacquebard, L. M. Schopf, and J. A. Simon, Eds., Geol. Soc. America. Special Paper 153. pp. 75-93.
Hughes, J. E. (1964): Jurassic and Cretaceous Strata of the Bullhead Succession in the Peace and Pine RiverFoothills,B.C.Minisfryof€nergy,Mines&Pet.Res.,Bull.No.51.
Karst, R. H. (1981): Correlation of the Lower Cretaceous Stratigraphy of Northeastern British Columbia from Foothills to Plains, B.C. Ministry of Energy, Mines & Pet. Res., Geological Fieldwork, 1980.
Legun, A. (1983): Stratigraphy and Sedimentology Notes on the Bullhead Mountain-Peace River Canyon, Paper 1981-1, pp. 78-89,
Carbon Creek Area, Northeastern British Columbia, (930/15. 16: 94B/1,2), 5.C. Ministry of Energy Mines & Pet. Res., Geological Fieldwork, 1982, Paper 83-1, pp. 93-98.
Mathews, W. H. (1946): Geology and Coal Resources of the Carbon Creek-Mount Bickford Map-Area, B.C. Ministry of Energy, Mines & Pet. Res., Bull. 24, 27 pp.
Stott, D. F. (19631: Stratigraphy of the Lower Cretaceous Fort St. John Group and Gething and Cadomin Formations, Foothills of Northern Alberta and British Columbia, Geol. Surv., Canada, Paper 62-39,
Stott, D. F. (1968): Lower Cretaceous Bullhead and Fort St. John Groups, between Smoky and Peace
277 pp. Rivers, Rocky Mountain Foothills, Alberta and British Columbia, Geol. Surv., Canada. Bull. 152,
Stott, D. F. (1969): Fernie and Minnes Strata North of Peace River, Foothills of Northeastern British Columbia, Geol. Surv., Canada, Paper 67-19, Pt. E. 132 pp.
Stott, D. F. (1969): The Gething Formation a t Peace River Canyon, Geol. Surv.. Canada, Paper 68-28.
Stott, D. F. (1973): Lower Cretaceous Bullhead Group between Bullmoose Mountain and Tetsa River, Rocky Mountain Foothills, Northeastern British Columbia, Geol. Surv., Canada, Bull. 219, 228 pp.
48 PP.
30 PP.
130

BILL PROSPECT (94E/13)
By T. G. Schroeter
INTRODUCTION
The Bill prospect is located 135 kilometres southeast of Dease Lake at latitude 57 degrees 45 minute:; north and longitude 127 degrees 45 minutes west, in the Liard Mining Division (Fig. 51). P.ccess is by helicopter from either Sturdee Valley airstrip, which lies 70 kilometres to the southeast or the Hyland Post ,3irstrip which lies 30 kilometres to the southwest. The claims (Bill 1, 2, and 3) total 43 uni.ts; they are owned by Cominco Ltd. but were operated in 1982 and 1983 by DuPont o f Canada Exploration Limited. hlost of the area of the claims l ies above treeline. Surveys by Cominco in 1981 and by DuPont in 1982 outlined a large gold-arsenic soil anomaly.
The writer spent three days on the property in July 1983
PROPERTY GEOLOGY
tuf f sequence. The tuffs are overlain by a complexly intercalated sequence of carbmatized volcanic sedi- Basalt forms the base of the volcanic pile in the area of the property; it is overlain by a dominantly andesitic
was noted on the property. mentary rocks ranging in composition from andesite to rhyolite. No significant volume of intrusiwe rock
phosed to lower greenschist grade; most are now schist and phyllite. A t least two phases of folding took Intercalated sedimentary and volcanic rocks that underly the claim group have beer regionally metamor-
tuffaceous, ranging in composition from andesitic to rhyolite; in part composition depends on the per- place and boudinaginy of quartz and/or carbonate lenses is common. The volcanic rocks are mainly
centage of quartz eyes present. Locally there are flows of massive or pillowed bas&. The sedimentary rocks include weakly to moderately carbonatized siliceous siltstone: these are often intercalated with
sequence of pelite and greywacke structurally overlies the volcanic sequence. intermediate to acidic tuffs, crinoidal limestone, calcareous sandstone, and quartzite. A dis1:inctive
STRUCTURE
All the rocks on the claim group are foliated to some degree and the foliatiorl has moderate dips. Boudinaying of quartz lenses or pods is common in more mafic units. Common carl~onate i quartz knots
of boudinaged quartz knots and veins in basic tuffs indicates a t least two periods of deformation, lie parallel t o banding in well bedded crinoidal limestone. Kink bands in the sheared felsic tuffs and folding
MINERALIZATION AND ALTERATION
veinlets, and also as disseminations and stockworks in altered tuffs; arsenopyrite is the most abundant Gold with arsenopyrite occurs as late-stage fracture fillings in quartz t carbonate veins and pods. as dry
occurs in trace amounts. Carbonate veinlets carrying euhedral quartz grains and pyrite veinlets cut quartz
metallic mineral. Pyrite is ubiquitous in the altered tuffs with a t least two stages observed. Chalcopyrite
131
ldegroot
1983

132

t arsenopyrite veinlets. Quartz veins range in width from less than 1 centimetre to 1 . 5 metres. Most are steeply dipping and cut stratigraphy. Fault zones may be an important guide to mineralization. Apparently intense quartz-sericite alteration has replaced basic volcanic rocks along zones of structural weakness; gold mineralization is most abundant where quartz-sericite alteration is most intense. Ouartz veins w thin quartz-sericite altered zones are most likely to be in the cores of the altered zones. Overall. arsenopyrite abundance does not correlate well with gold values; locally, however. the two are closely correlated.
WORK DONE
During 1983, DuPont diamond drilled approximately 1 175 metres in a siphole program designed to test previous soil geochemical anomalies, to test geophysical anomalies, and to t e s t analyses from hand-blasted trenches.
ACKNOWLEDGMENTS
The writer would like to thank DuPont (especially Tom Drown and Joanne Forbes) for lproviding access to the property and their kind hospitality while on the property.
133

TOODOGGONE RIVER AREA
(94E)
By T. G. Schroeter
INTRODUCTION
The Toodoggone River area lies approximately 300 kilometres north of Smithers; it is now recognized as a significant precious metals camp. Access into the area continued to be by aircraft only, mainly from Smithers.
The writer spent two 1-week periods in the area completing regional mapping north of the Toodoggone River. The mapping was done in conjunction with Andre Panteleyev and Larry Diakow a t a scale of 1:25 000. A preliminary map of the Toodoggone area, at a scale of 1:50 000, will be available in early 1984.
WORK DONE
north of Moyez Creek were examined. Brief visits were made to the Golden Lion, JD, and A L properties and two stratigraphic sections located
Work carried out by companies in the Toodoggone River area included the following:
( 1 ) Kidd Creek Mines L td.
(a) JD (Mineral Inventory 94E-32) - 1 2 0 0 metres of surface trenching in 22 trenches on the Gumbo and Gasp zones.
(b) A L (Mineral Inventory 94E-78.79) - 2 400 metres of surface trenching in 43 trenches including the Bonanza and Ridge zones.
(2) SEREM lnc
(a) Lawyers (Mineral Inventory 94E-66) - 3 054.2 metres of diamond drilling in 17 holes (eight on Cliff Creek, seven on Duke's Ridge, and two on AGE).
(b) Lawyers - 1 800 metres of backhoe trenching on Cliff Creek and Duke's Ridge zones.
standing. Minimal work was done on a few other claims within the area in order to maintain them in good
(3) Newmont Exploration of Canada Limited
(a) Shas (Mineral Inventory 94E-50) - 674 metres of diamond drilling in nine holes and 20 blasted trenches explored the main zone and a new area, the Creek zone, with encouraging results. Gold-silver-bearing quartz vein stockworks occur within a 1 000 by 1 600-metre area of altered Toodoggone tuffs.
(b) Golden Lion (Mineral Inventory 94E-77) - 21 backhoe trenches totalling 1908 metres in length outlined an area of significant silver mineralization.
134

Regional exploration was also carried out by:
14) DuPont of Canada Exploration Limited
Pel ~ 139 metres of diamond drilling was done in two holes on an alteration zone in Toodoggone 'grey dacite'.
(5) Taiga Consultants Ltd.
Property work, including prospecting, geological mapping, and sampling, was carried out on the Mets, Belle, and Saunders claims.
16) Asitka Resource Corporation
Grace (Mineral Inventory 94E-47. 48, 49) - the company carried out approximately 500 metres of diamond drilling to t e s t copper-zinc-gold mineralization in skarn zones along marble-granodiorite contacts and gold mineralization in siliceous zones and in chloritic veins within coarse pyritic meta- siltstone.
(7) Western Horizons Resources Ltd.
Golden Stranger (Mineral Inventory 94E-76) -conducted geological mapping and prospecting on the Dave Price and Gord Davies claims.
ACKNOWLEDGMENTS
companies: DuPont of Canada Exploration Limited, Newmont of Canada Exploration Limited, Kidd Creek The writer acknowledges the hospitality and logistical support offered in the field by the following
Mines Ltd., SEREM Inc.. Central Mountain Air Services Ltd., and Airlift Corporation.
REFERENCES
Panteleyev, A. (1982): Geology between Toodoggone and Sturdee Rivers, B.C. ,Ministry of E,nergy,
Schroeter, T.G. (1982): Toodoggone River (94F). E.C. Ministry of Energy, Mines & Pet. Res., Geological Mines& Pet. Res., Geological Fieldwork, 1982. Paper 1983.1, pp. 142.148.
Fieldwork, 1981, Paper 1982-1. pp. 125.133.
135

outhwert
4TS 9 3 L
Northeast North
NTS 9 3 M NTS 9 4 D NTS 94E
Upper Triassic & Paleozoic Rocks
Figure 52. Time Stratigraphic Cross-sections of the Hazelton and enclosing Groups [modified from Tipper and Richards, 1976).
136

STRATIGRAPHIC POSITION OF ‘TOODOGGONE VOLCANICS‘ (94€/2,3,6,7, 11, 12, 13)
By A. Panteleyev
Recent geological mapping by Gabrielse (1976). Gabrielse, et a/., (1976, 1977). Panteleyev (1982, 1983). and Diakow (this volume) has delineated the extent and described the nature of the ‘Toodoggone volcanics’ of Carter (1972). The 100 by 25-kilometre belt of volcanic rocks has been the focus of much recent exploration for epithermal precious metal deposits (Schroeter. 1982, 1983). Interest in the area is expected to continue a t a high level for some time. A preliminary map a t scale 1:50 000 sumnlarizing recent litho- stratigraphic work by L. J. Diakow, A. Panteleyev, and T. G. Schroeter will be released in the spr ng of 1984.
The Toodoggone volcanics are a Jurassic, subaerial, intermediate, calc-alkaline to alkitline. predominantly pyroclastic assemblage. They unconformably overlie Upper Triassic Takla rocks. The contact was observed in three localities; in each, Takla pyroxene basalt flows are overlain by biotite-bearing crystal ash tuffs above either a gentle angular unconformity or a disconformity.
The lateral boundaries of the Toodoggone volcanic belt are well defined in most areas. South of I’inlay River (94E/2) the volcanic rocks can be traced 1 kilometre into McConnell Creek map-area (94D). There they form a thin erosional remnant on a ‘basement’ o f Takla rocks (Panteleyev, 1982). The southwestern boundary consists o f steep reverse faults that juxtapose Toodoggone rocks against Takla and older Asitka rocks (Diakow. 1983). The southeastern boundary consists o f stacked panels of Asitka and Takla rocks thrust onto Toodoggone rocks (Panteleyev, 1982). In the central part of the volcanic belt, north of IFinlay
Hazelton rocks (predominantly feldspar porphyry flows). Locally the boundary is marked by granodiorite River, Toodoggone volcanics are commonly in fault contact on the west and east with Takla and undivided
Chukachida River by clastic rocks of the Cretaceous to Tertiary Sustut Group. intrusions. The northwesterly margin of the volcanic belt and the northern boundary are overlapped near
intruding the volcanics range from 181 to 207 Ma (Carter 1972; Cann and Godwin, 1980; Gabrielse, et a/., Radiometric dates from the Toodoggone volcanic rocks range from 179 to 204 Ma; coeval granitic stocks
1980; and Panteleyev, 1983). These indicate an Early Jurassic age for Toodoggone volcanism. f;aunal evidence is scarce except for one Bajocian locality (earliest Middle Jurassic) from tlie upper part of the volcanic unit reported by Gabrielse, et a/ . (1976) and Tipper (1976); no other fossil localities have been found. No additional fossils were discovered during recent mapping although a number of sites contain plant debris.
Judging from the radiometric data and field relationships a t least the basal, Lower Jurassic part of the Toodoggone volcanics is correlative with the Telkwa Formation as defined by Tipper and Richards (1976). The rocks would constitute a northern extension into Toodoggone map-area (94E) of the Telkwa Forma- tion of the Hazelton Group. In accord with their scheme of five ’facies’, belts o f similar depositional type within the Telkwa Formation. the basal Toodoggone pyroclastic volcanics can be considered to be a sixth facies - the ’Toodoggone subaerial facies‘. The ‘facies’ relationship is illustrated cm Figure 52, :I mod- ification of Tipper and Richards’ Figure 12 (19761.
ation, like the Eajocian s i te reported by Gabrielse, ef a/. (1976). will be documented. The younger Too-
Furthermore, as mapping proceeds it is probable that other Toodoggone rocks younger than Telkwa Form-
doggone rocks most likely occur north of Toodoggone River in the Moyez Creek-Tuff Peak area where thick flows and lesser sedimentary units with interbedded siliceous tuffs and marls overlie typical Toodog- gone ash flows (see Diakow. this volume).
137
ldegroot
1983

REFERENCES
Cann, R. M. and Godwin. C. I. (1980): Geology, Rb-Sr and K-Ar Dating of the Kemess Porphyry Copper- Molybdenum Deposit, North-Central British Columbia, C.I.M., Bull., Vol. 73, pp. 94-99.
Carter, N. C. (1972): Toodoggone River Area, 6.C. Ministry of Energy, Mines & Pet. Res., Geology, Exploration and Mining in B.C.. 1971, pp. 63-70.
Diakow, L. J. (1983): A Comparison of Volcanic Stratigraphy, Structure, and Hydrothermal Alteration of the Silver Pond (Cloud Creek) and Wrich-Awesome Claim Groups, Toodoggone River (94E). 6.C. MinistryofEnergy, Mines&Pet. Res., Geological Fieldwork, 1982, Paper 1983-1, pp. 134-141.
Gabrielse, H. (1976): Toodoggone River MapArea. Ged. Surv., Canada, Open File 306 (map). Gabrielse, H., Dodds, C. J., and Mansy, J. L. (1976): Operation Finlay, Geo/. Surv., Canada, Paper 76-1A.
pp. 87-90. Gabrielse, H., Dodds, C. J.. Mansy, J. L., and Eisbacher. G. H. (1977): Geology of Toodoggone River
(94E) and Ware West Half (94F). Geol. Surv., Canada, Open File 483 (map). Gabrielse. H., Wanless, R. K., Armstrong, R. L.. and Erdrnan, L. R. (1980): Isotopic Dating of Early
Jurassic Volcanism and Plutonism in North-Central British Columbia, Geo/. Surv., Canada, Paper
Panteleyev. A. (1982): Toodoggone Volcanics South of Finlay River (94Ei2). 6.C. Ministry of Energy, 80-1A. pp. 27-32.
Mines& Pet. Res., Geological Fieldwork, 1981, Paper 1982-1. pp.135-141. .......... (1983): Geology Between Toodoggone and Sturdee Rivers (94E). 6.C. Ministry of Energy, Mines
Schroeter, T. G. (1982): Toodoggone River (94E). 6.C. Ministry of Energy, Mines & Pet. Res., Geological &Pet. Res., Geological Fieldwork, 1982, Paper 1983-1. pp. 142-148.
.......... (1983): Toodoggone River Area, 6.C. MinistryofEnergy, Mines& Pet. Res., Geological Fieldwork, Fieldwork, 1981, Paper 1982-1. pp. 122-134.
1982, Paper 1983-1, pp. 125-133. Tipper, H. W. (1976): Biostratigraphic Study of Mesozoic Rocks in Intermontane and Insular Belts of the
Tipper, H. W. and Richards, T. A. (1976): Jurassic Stratigraphy and History of North-Central British Canadian Cordillera, British Columbia, Geol. Surv., Canada, Paper 76- lA, pp. 57-61.
Columbia, Gee/. Surv.. Canada, Bull. 270, 73 pp.
138

GEOLOGY BETWEEN TOODOGGONE AND CHUKACHIDA RIVERS (94E)
By L. J. Diakow
Regional mapping in the Toodoggone River area was extended in 1983 to include areas underlain by Toodoggone volcanic rocks (Gabrielse, et a/., 1977) not previously mapped by Ministry per!;onnel (Panteleyev, 1982, 1983; Schroeter. 1981, 1982: Diakow. 1983). Approximately 300 square kilornetres
The objectives of mapping were to determine the distribution, stratigraphy, and lithologic nature of Too- between the Toodoggone and Chukachida Rivers were mapped during July and August a t scale 1:50 000.
doggone rocks and to define their contact relationship with adjacent rocks.
PHYSIOGRAPHY
The area underlain by Toodoggone volcanic rocks is characterized by rounded mountains and ridge!; up to 1 900 metres in elevation separated by broad valleys. Outcrops are confined to steeper portions of ridges
area an abrupt change in relief marks the transition from Toodoggone volcanic to 'Takla volcanic rocks. and to banks of creeks in deeply incised valley bottoms. Along the northern periphery of the surveyed
STRATIGRAPHY
Toodoggone volcanic rocks were subdivided into five lithostratigraphic units. These lnap units were estab- lished by 'grouping' volcanic members with similar mineralogy, primary texture, clast morpholo!gy, and environment of deposition. The distribution of map units and stratigraphy is shown on Figures 53 ;and 54.
pyroclastic air-fall deposits, epiclastic rocks, and lesser chemical sedimentary rocks; mainly siliceouI mark. In order of relative abundance, the volcanic assemblage is made up of ash-flow tuffs, l ava flows, interbedded
The rocks are predominantly andesitic in composition, although quartzose andesite and trachyandesite are present locally. The f i v e map units are as follows:
UNIT 1 : These rocks underlie the west half of the surveyed area. The unit can be subdivided into a lower member (unit 1A) composed primarily of bedded air-fall deposits and an upper member (unit 1B) dominated by ash-flow tuff with a less abundant air-fall component.
Unit 1A is a heterogeneous succession of mainly crystal-lithic tuffs and some ash.flc,w sheets with limited lateral extent. The tuff sections normally are crudely layered although bedding is usually not evident where randomly dispersed lithic fragments supported by a matrix of plagioclase, hornblende, and biotite crystals and lithic ash occurs. Subangular quartz phenocrysts 1 to 3 millimetres in sin! and minute euhedral apatite crystals are present in this unit. Lithic fragments generally have rounded 10 subangular outlines and range in size from lapilli to blocks. Typically, the fragments are non-vesiculared, varicoloured, and porphyritic. The contact between layered air-fall tuf f and ash-flow tuff is characterized by an increased resistance to weathering of ash-flow outcrops; possibly resulting from some wellling accompanied by post-emplacement compaction.
tuffs display little variation in composition or texture and are composed of plagioclase, hornblende, biotite, Unit 16 is characterized by a preponderance of ash-flow sheets with intercalated crystal-lithic tuffs. The
and subordinate quartz and apatite phenocrysts se t within a pink to brick-red vi.:ric matrix. Layering
139
ldegroot
1983

Figure 53. Geology between Toodoggone and Chukachida Rivers.
140

caused by aligned, flattened, aphanitic, non-vesiculated, porphyritic fragments is diagnostic of ,weakly welded zones within otherwise massive weathering ash-flow sheets.
Beds of interspersed air.fall tuff constitute a minor porpoffion of unit 18. However. immediate,y west of Dedeeya Creek, approximately 140 metres of crudely bedded crystal lapilli tu'ff and block breccia, underlie the main welded ash-flow sheet. The contact between these deposits is sharp and well defined.
t ion of ash-flow tuffs. In detail, this deposit consists a t the base of 1 metre of crossbedded crystal tuff North of Adoogacho Creek, a graded tuff section interpreted as a ground surge deposit, preceded the erup-
overlain by 75 centimetres of thinly laminated dust tuf f that grades upward through more than 50 metres of lapilli and block-sized pyroclastic flow debris.
sheets, and epiclastic and chemical sedimentary rocks. It is best exposed south of Acloogacho Creek where UNIT 2: This is a lithologically diverse assemblage consisting of interbedded air-fall tuff, thin ash-flow
and beds of conglomerate that are 70 metres thick in depressions thin to 1 metre above positive relief intraformational basal conglomerate disconformably overlies the irregular paleosurface of unit 1B. Lenses
features. The conglomerate is overlain by over 200 metres of well-layered dust tuf f , crystal ash tuff, and lesser thin ash-flow sheets. The tuffs are composed of finegrained plagioclase and biotite crystals and
marks a transition from subaerial tuffs to a distinctive succession of limestone or rnarl interbedd'sd with sparse lithic fragments in a purple, green, or brown ash matrix. The uppermost 50 metres of the section
recessive-weathering crystal ash tuff , siltstone, and fine-grained volcanic sandstone. Typical outcrops of limestone are laminated to thinly bedded; they weather to a dark to pale grey colour and contain abundant black siliceous laminations.
UNIT 3: These rocks are exposed as a flat-lying succession that overlies unit 16. The lunit consists of air-fall tuffs intercalated with volcaniclastic sedimentary rocks. The basal section of unit 3 c'mprises 10 metres of
Creek rare fossilized plant stems occur a t the interface between mudstone and sandstone. This basal section interbedded crystal dust tuff, mudstone, and finegrained sandstone. A t one locality south of Adoogacho
is overlain by more than 150 metres of crudely bedded, poorly indurated lapilli Mock tuff. Tne rock contains round, monolithic, porphyritic, volcanic fragments in a pale green, feldspathic matrix containing sparse quartz phenocrysts.
The basal unit and overlying succession a t first glance appear to record a continuous explosive cycle.
erosional break. The base of the upper volcanic cycle is recognized by the presence of a green, graded However, detailed mappin(4 suggests that the two lithologically similar tuff deposi.ts are separate(i by an
crystal dust tuff bed 2 metres thick, that forms a resistant stratigraphic marker within unit 3.
UNIT 4: Unit 4 is composed of trachyandesitic lava flows, comagmatic intrusive rocks, and local in t ra formational conglomerate. Near Tuff Peak, and south of Adoogacho Creek, unit 4 appears to be inter- digitated with either units 1B. 2, andlor 3. The flows form massive, jointed outcrc,ps with homogeneous composition containing plagioclase, augite, subordinate biotite, and apatite in an aphanitic, grey-green matrix. Quartz is absent or exceedingly rare, but sparse potassium feldspar megat:rysts up to 1.5 centi- metres in size serve to distinguish trachyandesite from the more widespread andesitic lava flows.
thick between lava X ~ N S in unit 4. From a distance conglomerate has a chaotic appearance bLlt closer East of Tuff Peak-and Dedeeya Creek volcanic conglomerate occurs as beds and I,?nses up to 80 metres
sist of rounded cobbles and boulders derived from underlying unit 4 flows. inspection reveals crude internal bedding, grading, and laminated mudstone and sand!,tone beds, Clasts con.
of massive-weathering flows with subordinate interfingered air-fall pyroclastic rocks. Quartz phenocrysts, UNIT 5: This map unit is well exposed on Metsantan Mountain where it overlies u r i t 4. The unit Consists
varying from 1 to 3 millimetres in size are chacteristic of unit 5 and distinguishes these flows from similar-
141
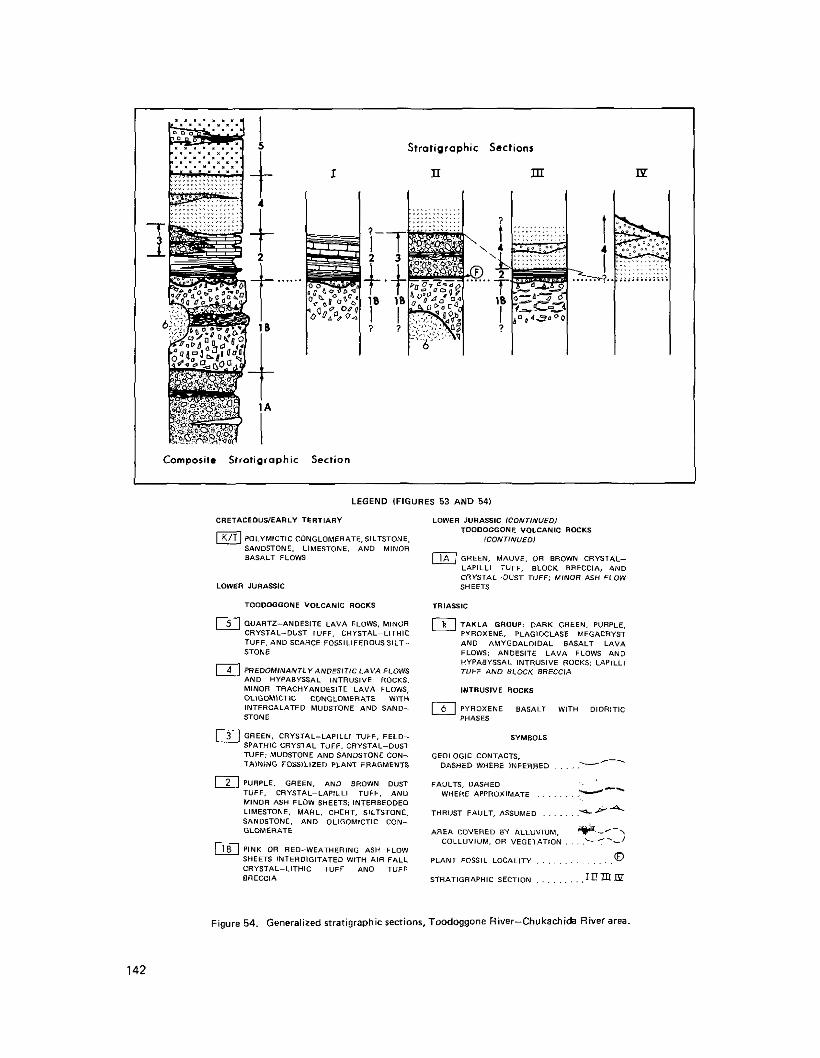
Stratigraphic Sections
I II m Ip
Composite Strotigraphic Section
LEGEND IFIGURES 53 AND 541
a POLYMlCTlC CONCLOMER/\TE.SILTSTONE, SANDSTONE. LIMESTONE. AND MINOR BASI\LT FLOWS
Figure 54. Generalized Stratigraphic sections, Toodoggone River-Chukachida River area
142

appearing flow rocks of unit 4. The air-fall pyroclastic rocks locally form well-bedded deposits of green or
subaqueous conditions existed locally as evidenced by ripple marks, scour features, and rare fossilized plant purple crystal dust tuff and lapilli tuff. Unit 5 was deposited in a predominantly subaerial setting ahhough
fragments found within thin, discontinuous mudstone and siltstone interbeds.
STRATIGRAPHIC CORRELATIONS
The five map units identified north of the Toodoggone River are only partially corrl?lative with the l i tho logic units established by Panteleyev 11983) in the immediately adjoining area south of the Toodoggone River. Panteleyev's readily identifiable 'grey dacite' ash flow that forms a widespread marker unit south of Finlay River is absent or lacks a recognized facies equivalent within this surveyed area. The trachyandesite flows of map unit 4 with their distinctive potassium feldspar megacrysts constitutl? part of Panteleyev's
of Metsantan Mountain. They are shown as a separate map unit (unit 5) in this stuliy but are incbded in 1983 map unit 5. The massive andesitic lava flows of map unit 5 overlie trachyandesite of map unit .1 north
Panteleyev's andesite-trachyandesite unit 5.
INTRUSIVE ROCKS
Intrusive rocks in the surveyed area include stocks of basaltic composition, and feldspar porphyry and andesitic dykes. One of the larger pyroxene basalt stocks intrudes unit 16 east of A'cloogacho Creek. The basalt contains fresh, subhedral pyroxene phenocrysts on average 3 millimetres in diameter along with randomly oriented plagioclase microlites in a dark green, fine-grained matrix. Diorite, comprising rnedium- grained interlocking plagioclase, hornblende, and biotite crystals, forms a shallow embayment in the northeast contact of the stock. The origin of the diorite is uncertain, but its similar mineralogy and intimate association with the basalt suggests that the rocks may be comagmatic.
Subparallel, feldspar porphyry dykes trending 110 degrees to 150 degrees azimuth intrude both Toodog-
salmon-pink-weathering outcrops. They contain plagioclase, chloritized hornblende, biotite, ancl sparse gone and Takla rocks in several places east of Moosehorn Creek. These dykes form distinctive, resistant.
quartz phenocrysts in a pink-coloured aphanitic matrix.
On Alberts Hump relatively fresh feldspar porphyry dykes dissect intensely altered tuffs and flows of map unit 5, demonstrating that the dykes postdate hydrothermal alteration. The hydrothermally altered rocks, consisting of a mixture of alunite, dickite, and quartz. have yielded a potassiumlargon date of 19W7 Ma (Schroeter, 1982). Similar dykes also intrude altered volcanic rocks in the Cloud Creek area (Diakow, 1983). South of the Toodoogone River, feldspar porphyry dykes intrude both Takla and Toodoggone volcanic rocks near Baker mine and Hazelton volcanic rocks eas t of Saunders Creek. Deep-seated f8,actures with district-wide extent are postulated to LE the principal structural controls for therie intrusions. Vertical northwest-trending, andesitic dykes crosscut feldspar porphyry dykes north and south of Toodoggone River. Characteristically, these dykes form recessive outcrops averaging 1 to 2 metres wide. They ;are dark green and have a fine-grained texture; amygdules are calcite filled.
STRUCTURE
The contact between Toodoggone and Takla volcanic rocks has an arcuate trace along the north-northeast- ern periphery of the map (see Fig. 53). In two localities along the contact, Takla rocks appear to overlie Toodoggone rocks, implying a thrust fault relationship. Further west, a network of steep northwest and
east-west-trending faults cuts this contact and juxtaposes unit 1 against Takla rocks.
143

flow tuffs indicate that all map units dip 25 degrees or less toward the south-southwest, Locally, beds are Bedding measurements derived from layered epiclastic rocks, tuff , and alignment o f flattened clasts in ash-
steeper where stratigraphy is disrupted near intrusions or block faults.
DISCUSSION
andesitic in composition and is composed of subaerial lava flows, ash-flow tuffs, and pyroclastic fall de- Five major map units have been identified north of the Toodoggone River. The succession is predominately
posits. Interruptions in volcanism during tectonism resulted in periodic erosion and reworking of volcanic members to produce conglomerate and finer grained clastic interbeds. Locally, depressions were inundated by marine waters. Short-term tectonic stability during waning volcanic activity promoted the deposition of tuffaceous carbonate rocks, fine-grained clastic rocks, and siliceous tuffs in some areas flanking the subaerial deposits.
The map units are interpreted to be successively younger through units 1 t o 5 and appear to have been erupted without major pauses in volcanic activity. I t i s probable that structurally controlled linear vent systems were connected at depth to a common magma source. Collectively the volcanic succession records a reduction in the magnitude of pyroclastic erruptions with time. Unit 1 is interpreted t o represent an early major eruptive stage in the area that produced widespread ash-flow sheets and air-fall deposits. The intermediate stage is characterized by sporadic volcanic activity and is exemplified by the well-layered
contain limestone beds in unit 2. The final stage is marked by major lava flow eruptions of units 4 and 5. succession of coarse tuffs in unit 3. These rocks are temporal and lateral equivalents to dust tuffs that
ACKNOWLEDGMENTS
occasion, provided transportation and lodging during the recent field season: DuPont of Canada Explor- The author gratefully acknowledges the courtesy and support from the following companies who, on
ation Limited, Kidd Creek Mines Ltd., Newmont Exploration of Canada Limited, and SEREM Inc. Sincere thanks are extended to those individuals who kindly liberated time to guide tours and openlydiscussed their ideas and shared geologic information with the writer. They include: J. Clarke, 8 . Downing, T. Drown, C. Kowall, J. Laird, M. Morris, J. Paxton. M. Stammers, I. Sutherland. P. Tegart. M. Vulimiri, and D. Visagie. The writer benefited from the advice and guidance offered throughout this project by Dr. A. Panteleyev and Dr. R . W. Hodder. Furthermore, progress in collecting field data was enhanced significantly by the enthusiastic and capable assistance of Geoff Goodall and Mike Fournier.
Central Mountain Air Services Limited and Air l i f t Corporation provided safe, reliable air service. Joyce Warren in Smithers fulfilled all expediting requests in a prompt, reliable manner.
REFERENCES
Diakow. L. J. (19831: A Comparison of Volcanic Stratigraphy, Structure, and Hydrothermal Alteration of the Silver Pond (Cloud Creek). and Wrich-Awesome Claim Groups, Toodoggone River, B.C. Min- istryoffnergy, Mines& Pet. Res., Geological Fieldwork, 1982, Paper 1983-1. pp. 134-141.
Gabrielse, H., Dodds, C. J., Mansy, J. L., and Eisbacher, G. H. (19771: Geology of Toodoggone River (94E) and Ware West Half (94F1, Geo/. Surv., Canada, Open File 483.
Panteleyev. A. (19821: Toodoggone Volcanics South of Finlay River, B.C. Ministry of Energy, Mines &Pet. Res., Geological Fieldwork, 1981, Paper 1982-1. pp. 135-141.
144

...,...... (1983): Geology Between Toodoggone and Sturdee Rivers, B.C. Ministry of Energy, Mines &
Schroeter, T. G. (1981): Toodoggone River, B.C. Minisfry of Energy, Mines & Pet. Res., Geological
.......... (1982): Toodoggone River, B.C. Minisfry of Energy, Mines& Per. Res., Geological Fieldwork, 1981,
Pet. Res., Geological Fieldwork, 1982, Paper 1983-1. pp, 142-148.
Fieldwork, 1980, Paper 1981.1, pp. 124-131.
Paper 1982-1, pp. 122-133.
145

YUKON..-..-.- _../ B.C. I
KWADACHA WILDERNESS
Figure 55. Location map with foot traverses shown: Wokkpath Park Proposal Area.
146

GEOLOGIC RECONNAISSANCE OF THE WOKKPASH PARK PROPOSAL AREA
(94K)
By A. Legun
A mineral potential reconnaissance of the Wokkpash Park Proposal Area was conducted. The area, which encloses the watershed of Wokkpash Creek, is located 32 kilometres due south of Mile 400 on the Alaska Highway (Fig. 55). Access is by the Racing River road, which eventually ends a t the site of the former Churchill Copper mine. A trail enters the Wokkpash Valley near the road's interse<:tion with Wokkpash Creek
Wokkpash Creek and its tributaries were examined by air and on foot. Traversed tributaries include Plug, Fusilier, Stepped, Forlorn, and several unnamed creeks. The area south of Wokkpash Lake and high ground of the drainage divide encompassing the valley were not examined on foot due to access problelns and time contraints.
Rock exposure i s very good except in the main valley which has a glacial fil l. Rocks were examined for evidence of the following types of regional mineralization:
( 1 ) Lead-zinc in breccias of Devonian limestone (Robb Lake type). ( 2 ) Disseminated copper in Proterozoic quartzites. (3) Copper veins associated with gabbroic dykes that cut Proterozoic rocks (Churchill mine type) (4) Copper in Ordovician limestones and sandstones of the Ketchika Group.
check dyke contacts or Ordovician limestones because these rocks are restricted t o m a l l areas in remote Devonian limestones and Proterozoic quartzites were examined a t several locales but it was not postiible to
and rugged locations.
The regional geologic map of Taylor and Stott (1973) was used as a stratigraphic guide. On a local scale some map unit boundaries are incorrectly positioned on the map. For example, Proterozoic quartzites underlie Plug Creek and the ProterozoicIPaleozoic contact, which is marked by a quartzite fragment rego- lith, is exposed on Fusilier Creek; only Paleozoic carbonate units are indicated on Taylor and Stott's map.
No metallic mineral showings were found. Agmatitic breccias occur in Devonian limestones in IForlorn gorge and Stepped Creek but barren calcite comprises the entire breccia matrix. Nc. galena and sphalerite were found and fluorite was noted only once. Proterozoic quartzites are often rust'{ weathering but only disseminated pyrite was noted on fresh surfaces; there was no hint of copper. Analyses of these and other rocks of interest are given in the accompanying table.
ANALYTICAL RESULTS FOR SELECTED ROCK SPECIMENS FROM THE WOKKPASH PARK PROPOSAL AREA
(94Kl
LOCATION FORMATION ROCK TYPE Au Ag Cu Pb Zn Co N i Id0 ppm ppm ppm opm ppm ppm porn w r n
U p w r Wokkpalh Creek Tmhodi quartzite ." ... 50 12 110 2 13 .<3
Plug Creek ? pyritic shale --- --- 27 11 8 3 14 -:3
Fusilier Creek Proterozoic1 quartate <0.3 <10 --- --- ... .-- --- --- Paleozoic breccia to
(regolith) contact conglomerate
Stepped Creek StanellJunedin breccia ... ." 26 5 6 <2 6 C3
147
ldegroot
1983

ence of subsequent alteration. The area does, however, display a striking interplay of geology and scenery Rocks of the proposal area are dominantly clean platformal carbonates and quartzites; there is little evid-
(Plate VII). Erosion developed hoodoos in glacial fill that line Wokkpash gorge in soldierly fashion for several kilometres. They are impressive in terms of number, size, and 'gravity defying' suspended boulders. Forlorn gorge is very narrow, only 10 to 20 metres wide a t the base, but a very deeply incised canyon in limestone; it is reminiscent of Maligne canyon in Jasper Park. The canyon is accessible for a t least half
disappears a t the thrust contact between Proterozoic quartzites and Paleozoic carbonates. Apparently i t s length because the creek gradient is surprisingly low. On the upper levels of Stepped Creek, a creek
during early summer meltwater flow reaches and fills a downstream depression or sink hole and forms a
through one or more 'swallow holes'. This drainge apparently emerges as springs in a permanent lake that shallow lake that is visible on air photographs. By late summer, lake waters have drained underground
is down valley; it has considerable outflow volume but no surface inflow.
of interest in the north half of the park proposal area. Striking hoodoos and a previously unknown dis- In conclusion, no mineral showings were found during a reconnaissance of several stratigraphic intervals
appearing lake and creek were discovered during the course of field studies.
Plate VII. Stepped Creek, Wokkparh Park Proposal Area.
148

GEOLOGIC SETTING OF THE PRECIOUS METAL DEPOSITS IN THE STEWART AREA
(104B/1)
By D. J. Alldrick
INTRODUCTION
The British Columbia Ministry of Energy, Mines and Petroleum Resources investigatec regional geology and mineral deposits of the Stewart area during 1964 and 1965 (Grove, 1971). The optming of Scottie Gold mine, recognition of an epithermal precious metals camp in similar volcanic rock!; of the Toodoggone River area, and newly discovered stratabound precious metal mineralization in the Big Missouri mine area created incentives to study the area in more detail.
The objectives of this project are:
(1) Document structural and stratigraphic relationships of the host volcanic sequence and its contact relationships with adjacent terranes.
(2) Determine the evolution and depositional environment of the volcanic system from petrolgraphic and geochemical studies of the sequence.
(3) Characterize the structural, stratigraphic, mineralogical. and trace element contents of precious metal and base metal deposits of the area.
(4) Conduct metallogenic studies and define areas of high mineral potential.
( 5 ) Sample host rocks and ore zones for fossil and radiometric dating and compare them with other volcanic terranes around the Middle Jurassic Bowser basin.
The report summarizes preliminary results of the first three objectives
HISTORY AND PREVIOUS WORK
deposits were found but mineralized float led to the discovery of gold-quartz vein deposits. Continued Prospectors began to explore the Stewart area in 1898 enroute to the Klondike. No major placer gold
the third greatest lode-gold-producing area in British Columbia. Between 1918 and 1968 Silbak F'remier prospecting located the gossan a t Silbak Premier mine in 1910. Subsequently, the Stewart camp hecame
mine production alone totalled 4.3 million tonne8 grading 13 grams gold per tonne and 298 grams silver per tonne. Tipper and Richards (1976) outlined the tectonic evolution of the region. Major geological reports of the Stewart area by Grove (1971) and the Big Missouri camp by Galley (1981) include hktorical reviews of geological studies in the area and extensive bibliographies. Barr (1980) provides a concise geological review of the Silbak Premier mining camp. A compilation of recent mapping and Ninistry work is shown on Figures 56 and 57.
REGIONAL GEOLOGY
The study area is underlain by a north-northwest-trending belt of folded volcanic rocks (shaded on f'ig. 56) which contains a thick sedimentary sequence infolded along a synclinal axis. The vl,lcanic and sediment- ary rocks are intruded by small stocks and extensive dyke swarms. The volcanic rocks are bounded on the west by composite stocks and batholiths of the Coast Plutonic Complex.
149
ldegroot
1983

L
MAJOR MINERAL DEPOSITS
1. SCOTTlE GOLD MINE
2. DAG0 HILL DEPOSIT
3. BIG MISSOURI MINE
4. CONSOLIOATED SILVER BUTTE DEPOSIT
6. SEBAKWE MINE
5. INDIAN MINE
8. SILBAK PREMIER MINE
7. B.C. SILVER MINE
9. RIVERSIDE MINE
10. DUNWELL MINE
11. SILVERADO MINE
12. PROSPERITY AND PORTER IDAHO MINES
13. EAST GOLD MINE
Figure 56. Regional geology and mineral deposits. Stewart area
150

L 1
ECENT GEOLOGIC STUDIES USE11 FOR COMPILAT100
1 WARES AND GEWAIGIS. 1982 2 GALLEY, 1981 3 KLEPAKI. 1982 4 GRElG AND KENYCIN. 1982
M U O R EXPLORATION PROGRAMS 11983)
TIDE MOUNTAIN AREA [NORTHAIR GROUP1
GRANDUC MILLSITE AREA (CANADA WIDE MINE!;)
SCOTTIE GOLD PROPERTY ISCOTTIE GOLD MINES1
BIG MISSOURI CAMP IWESTMIN RESOURCE31
CONSOLIDATED SILVER BUrTE IESSO MINERALS)
PREMIER MINE AREA IWESTMIN RESOURCES)
HIGH ORE PRDSPECTMlOODBlNE PROSPECT IESSO MINERALS)
STONER PROSPECT (EXXON MINERALS)
MINERAL HILL [GREENWICH RESOUCCESI
BAYVIEW MINE {KINGDOM RESOURCES)
PROSPERITYIPORTER IDAHO IPACIFIC CASSlARi
NEW MINERAL DISD3VERIES 11982 - 19831
A TIDE MOUNTAINVEINS INORTHAIR GROUP1
C '0' ORE LONE ISCOTTIE GOLD MINES1
D CONSOLIDATED SILVER BUTTE IESSO MINERALS]
E 'D' VEIN EXTENSIOU IPACIFIC CASSIJIRL
151

152

The volcanic and sedimentary rocks of the Stewart area have been mapped by Hanson (1935) and Grove
sidered to be correlative with the type Hazelton area 200 kilometres to the southeast. (1971, 1973, and 1983) as Hazelton Group strata of Early Jurassic to Middle Jurassic age. They are con.
The rocks correlate remarkably well with the Hazelton section described by Maclntyre (1976. pp. 11-19) in the Tahtsa Lake area to the south. Tentative correlation can also be made with the lower part of the Hazelton section as outlined by Duffell (1959) in the Terrace area.
Correlations with other sections elsewhere described as Hazelton Group by Duffell and Souther (1965), Tipper (19711, and Tipper and Richards (19761 cannot be made on a lithological and stratigraphic basis. Similarly map sections presented by Carter and Kirkham (1969) and Carter (1973) do not correlate with Stewart stratigraphy. However, Grove (1973) presents fossil evidence for correlation of the Stewart strati- graphy on the basis of age with other Lower to Middle Jurassic volcanic sections. Gr.we’s Nass Fortnation
and Richards (1976). (1983) of the upper Hazelton Group is an alternative name for the Bowser Lake Group described by Tipper
VOLCANIC STRATIGRAPHY
to steeply eastward. The volcanic pile is predominantly composed of massive, green andesitic tuffs which Volcanic map units in most of the Salmon River valley strike north-northwest and generally dip vertically
alteration zones that occur around many of the mineral deposits. This pervasive alteration tends to obscure rarely show bedding features or indications of stratigraphic top. Grove (1971) dixusses the extensive
primary bedding and textural features.
In 1982. Alldrick (1983) determined the direction of stratigraphic tops based on !graded beds in felsic
waterlain units with distinct tops indications in all major stratigraphic subdivisions except map unit 4. The pyroclastic rocks and on variations in composition of tuff breccia fragments. Mappinst during 1983 located
established by Grove (1971, 1983). Figure 58 illustrates the stratigraphic column and compares termin consistent tops direction was to the east, confirming the major stratigraphic divisions and major structures
ology used in the Stewart area by other workers.
MAP UNIT 1: Map unit 1 is composed of a thick succession of green, greyish green and greeni!;h grey andesitic tuffs. Lesser red, maroon. purple, and black tuffaceous units are intercalated with thwe beds a t irregular intervals. Textures vary from medium to coarse ash tuffs through lapilli tuffs to coarse tuf f
the most common lithology. A distinctive unit of crystal tuff containing bimodal feldspar phenocrysts breccias. Crystal and crystal-lithic tuff units containing white feldspar andlor hornblende phenocrysts are
outcrops on 49 Ridge on the west side of Mount Dillworth. In this unit the smaller (3 t o 5-millimetre) grains are subhedral to euhedral white crystals while the larger grains (1 to 3 centimetres) are buff-coloured. inclusion-rich euhedral crystals.
Thin waterlain green tuffaceous beds have been located on Mount Welker, on ’Tide Mountain‘, snd on the ridge west of the Scottie Gold mine. The beds are about 10 centimetres thick and up to four beds may occur together. Many beds show grading which indicates tops towards the syrclinal axis on Mount
during recent mapping and the entire sequence is, therefore, interpreted to be subaerial - predomlnantly Dillworth (Fig. 59). No other waterlain or submarine textures have been noted in the andesite semquence
tuffaceous units with some intercalated andesite flows.
The redharoon tuffaceous units are thin (G5 metres) feldspar crystal tuff beds ,which may represent time-stratigraphic horizons of alteration rather than stratigraphic units. They do not have regional extent
153

154

but do provide useful markers on a property scale and were an explorationlmining control a t the Silbak Premier mine (Langille, 1945). McGuigan has suggested (personal communication, 1983) that these dis- tinctive zones could represent paleosurfaces during development of epithermal systems.
possible, but a general pattern of textural zoning within the sequence has been recognized and is illLlstrated Regional correlation of individual tuff beds within the andesite sequence of map unit 1 has not been
on Figure 58. Medium to coarse ash tuffs ( l a ) are most abundant in the lower part of the sequence along with the thin waterlain tuffs (lb). Lapil l i tuffs f l c ) are uniformly distributed but crystal tuffs ( Id) and crystal-lithic tuffs are somewhat more abundant upward in the sequence. The medium tuff breccias ( l e ) and redlmaroon crystal tu f fs ( I f ) occur only in the upper half o f the sequence. Coarse tuff breccias ( l g ) and the bimodal crystal tu f fs ( lh) are known only a t the top of the sequence in the Mount Dillworth area.
The base of the andesite volcanic sequence has not been identified but the overall thickness is at least 1 500 to 2 000 metres in the Scottie Gold mine area.
MAP UNIT 2: Map unit 2 is a complex succession of interbedded tuffs and fine tc, coarse epiclastic sedi-
until it nearly wedges out between Mineral Gulch and Monitor Lake and thickens southeastward in the area mentary rocks. The sequence is 1 200 metres thick on the west slope of Mitre Mount,3in; i t thins southward
of Bear River Ridge at Mount Shorty Stevenson (Fig. 59). As a generalization, rhis map unit consists predominantly of a thick dacitic ( ? ) tuffaceous unit near the base with occasional intercalated epiclastic
thick sequence of epiclastic beds with rare dacitic tuffaceous interbeds. Local whi:e limestone bsds (29) beds that pass upward into interbedded dacitic tuffaceous and epiclastic units. These are overlain by a
dacite (?) flow (2f) crops out within the upper epiclastic beds on Bear River Ridge ear.t of Divide Lake. crop out on the west side of Mitre Mountain about midway in the sequence and a distinctive porphyritic
The depositional environment is interpreted to be predominantly subaerial although the epiclastic beds exhibit waterlain textures such as grading, crossbedding, and scouring. These show consistent stratigraphic tops towards the synclinal axis on Mount Dillworth.
The dacitic (? ) tuffs range in colour and texture from pale waxy yellow or yellowyeen crystal tuffs (212) and welded tuffs (2d) to pale green coarse ash tuffs (2b) and dust tuffs (2a). Although the tuffs are inter- bedded with waterlain epiclastic sediments, no distinct waterlain tuffaceous textllres have been noted. Crystal tuffs with medium-grained (0.5 to 1.0-centimetre) white subhedral to euhedml feldspar phenocrysts are abundant. No hornblende phenocrysts have been noted but rare fine-grained (G5-rnillimetre) quartz crystals have been identified in some samples.
Tuffs are massive but crystal tuffs commonly show a crude banding consisting of crystal-rich bands 1 centimetre to 2 centimetres apart separated by crystal-poor bands of fine-grained ash. Relatively thick units (10 metres or more) of this banded rock have been noted on Troy Ridge, Bear River Ridge, and Mount Rainey. Banding possibly developed during repeated eruptions of combined ash and crystals. with each eruption undergoing partial sorting during air fall.
metres long. Dacitic welded tuffs (2d) exhibit eutaxitic textures with flattened fiamme of variolx sizes up to 12centi-
on Mount Rainey. The rock is yellowish grey in colour and consists of interlayered 1.0 to 2.0-centimetre- An unusual, thinly banded or layered dacitic rock (2e) has been identified on Bear River Ridge and locally
thick bands of yellowish coarse ash and -0.5-centimetre-thick grey siliceous layers. The siliceous layers are undulatory and individual layers can be traced for a t least 2 metres. The texture lnight possibly form by flattening and welding of layers o f fine lapilli-sized pumice fragments that are interbedded with layers of ash.
155

A distinctive porphyritic. dacitic volcanic flow (2f l crops out on the crest and west shoulder of Bear River
dacite with 5 to 10 per cent scattered coarse white feldspar phenocrysts and phenocryst aggregates. The Ridge east o f Divide Lake. The matrix consists of massive, aphanitic, siliceous, pale grey dacite or rhyo-
diameter. All phenocrysts have been partially digested leaving irregular rounded remnants on which crystal phenocrysts are up to 1 centimetre long and some of the aggregate masses are up to 4 centimetres in
faces are rarely preserved. The resulting texture is similar t o the 'flower porphyry' and 'snowflake porphyry' rocks that occur elsewhere in British Columbia.
The matrix of these sedimentary rocks is typically brick-red to maroon to purple, although some cream, The epiclastic units have distinctive bedding, textures, and colouring that make them readily recognizable.
from red to purple, green, and grey. Exposures are common in which monolithic cobbles (2kl are identical buff, and olive-green units were noted. Rounded cobbles of volcanic rock within these beds range in colour
in colour to the matrix but striking exposures of multicoloured heterolithic boulder conglomerates (21) are widespread. Textures range from siltstones (Zh) through sandstones (2i) and grits (2 j ) up to coarse boulder conglomerates (2m). Conglomerates are characteristically matrix supported but one clast supported, coarse boulder conglomerate bed (2n) with boulders up to 0.5 metre in diameter was noted on the east face of 49 Ridge.
Bedded epiclastic units locally display graded beds, crossbedding, and scour and f i l l channels that allow tops determinations. These features consistently show tops towards the synclinal axis on Mount Dillworth. Cobbles in the epiclastic beds are composed of the andesitic and dacitic lithologies described previously;
the interbedded dacitic volcanic/epiclastic sequence of map unit 2 and have a sharp upper contact with the no clasts of rhyolitic volcanic material have been identified. The epiclastic beds predominate a t the top of
overlying felsic volcanic sequence (map unit 3).
MAP UNIT 3: Map unit 3 is a widespread relatively thin (?50-metre) succession of 20 centimetre to
edge of Mount Dillworth north to Summit Lake. The rocks appear to be highly siliceous and are probably 25-metre-thick felsic volcanic tuffaceous and pyroclastic beds. The map unit is thicker along the western
dam which are dacitic in composition. rhyolitic in composition. Galley (1981) shows whole rock analyses from felsic rocks near the Long Lake
The regional succession examined on Mitre Mountain, at Divide Lake, and on the west slope of Mount Shorty Stevenson is remarkably consistent. The lowermost bed is an aphanitic dust tuf f (3a) which is typically pale olive-grey to grey but i t grades laterally into a bright turquoise rock near Summit and Divide Lakes. This rock has been extensively altered to a bright maroon or purple colour 13b) and the alteration
corner of Summit Lake it contains fine (up to 4 millimetresl silicafilled vesicles and large euhedral pyrite can be seen lensing in and out over short distances. This rock is normally massive but near the southeast
cubes (up to 1 centimetre).
This dust tuff unit grades upward into a lapilli tuff (3c) which is variably welded (3d). The lapilli tuff locally contains fiamme but more commonly has angular pumice fragments (3cl as well as angular felsic volcanic lapilli.
The lapilli tuff, in turn, grades upward into a siliceous lapilli tuff or tuff breccia (3e). The clasts are hetero- lithic, laminated to massive, grey to white cherts and rhyolites or other pervasively silicified lithologies. This siliceous tuff breccia is the uppermost member of map unit 3 seen a t Mitre Mountain and Mount Shorty Stevenson. In both areas this unit is 20 to 25 metres thick and is in fault contact with overlying
darkened by carbon until the siliceous tuf f breccia is medium grey to charcoal coloured (3f). black siltstones and slates. In the Mount Shorty Stevenson area the upper half o f this unit is progressively
156

In the Troy Ridge, Mount Dillworth, Fetter Lake, Divide Lake, and Monitor Lake areas the uppermost lithology of map unit 3 is a chaotic rhyolitic ash flow tuff. It is highly pyritiic (39) from the south end of Mount Dillworth to the Summit Lake area and contains heterolithic rounded cobbles and large a'igular lithic fragments. This rock contains 15 to 20 per cent very fine disseminated pyrite as well as large pods and minor lenses of massive fine-grained pyrite. Outcrops form resistant domes and ridges of brilliant red-orange, yellow, and red-brown colour along the west side of Mount Dillworth. On Troy Ridge and southward from Mount Dillworth similar ash f low textures can be identified, but the unit contains no pyrite (3h). No rounded cobbles have been noted in this distal facies of the rhyolite ash f low and the angular lithic fragments are lapilli size; it extends southeastward beyond Monitor Lake ,and northward along the west side of Troy Ridge but exact limits have not been defined. A t the northeast c'xner of Divide Lake this unit is only 2 t o 3 metres in thickness and contains small lapilli size angular fragmeots.
The coarse, chaotic, pyritic, boulder and cobblerich facies (39) of this rhyolitic ash i low is interpreted to be a near-vent facies, a relationship originally proposed by Galley (19811. However, an exposed dome or volcanic vent has not been located. On Troy Ridge and near Monitor Lake the distal facies (3hl of this ash flow contains minor impure, gritty, limestone lenses (3i). Between Mount Dillworth and Fetter Lake the distal facies is variably enriched in carbon and may be charcoal in colour (3il. The ash flow is ei?her in fault contact with overlying black siltstones and slates o f map unit 5 or in sharp conformable (?) contact with charcoal t o black rocks of map unit 4, called the 'transition sequence'.
fine-grained black crystal tuffs (4b). ash-rich argillaceous sedimentary rocks (44, and minor amounts of MAP UNIT 4: The 'transition sequence' consists of mixed charcoal t o black interbedded tuffs (4a).
gr iny limestones (4d) and fossiliferous limestones (4e and 4f). This map unit is exposed intermittently due to faulting, talus cover from adjacent black siltstones and slates, or snow and ice cover on Mount Dillworth. Possibly locally i t was not deposited. It has been identified in outcrops virtually everywhere that the underlying rhyolitic ash flow tuffs (39. h, j ) cap the felsic volcanic sequence of map unit 4. Therefore, this transition sequence is thought to be derived by mixing of varying proportions of fine, water.transported detritus with air fall ash and crystals from felsic pyroclastic activity during waning volcanism. These mixed sediments were deposited in an encroaching, carbon-rich marine environment.
The predominant rock type is a distinctive black to charcoal grey crystal tuff (4b) containing fine (43- millimetre) white feldspar crystals; it is extensively exposed south and south-southeast of Monitor Lake and is visible in dri l l core left near the Lakeview workings. Other lithologies include black gritty coarse ash tuffs (4a) and black argillites and slates (4c) that are locally pyritic; they crop out along an old road running north from Fetter Lake. The black gritty coarse ash tuf f (4a) is exposed a t the southwest end of the penstock tunnel near the Long Lake Dam. Gritty, grey, weakly pyritic, fossiliferous limestone lenses and pods are exposed 100 metres north of the northern end of 49 Ridge (4e) and are also exposed a few hundred metres north of Divide Lake (4f). The upper contact o f map unit 4 is always marked by a regional thrust fault.
MAP UNIT 5: The regional thrust fault puts rocks of map units 4 and 3 and, rarely, map unit 2 into contact with black carbonaceous siltstones and slates at the base of map unit 5.
The stratigraphy of these sedimentary rocks is described in Grove (1971); it has been #examined only partly
medium-bedded siltstones (5a) and shales (5b) with minor amounts of intercalated siliceous beds (5c) and in the present study. The lower 50 to 100 metres of the sedimentary succession consists of black, thin to
greywackes (59). sandstones (5h). and intraformational conglomerates (5i l . The conglomerates consist limestones 15d) that are locally fossiliferous (5e and 5f). This sequence grades upward into medium grey
of black siltstone slabs and cobbles in a grey sandstone matrix. The limestone len!;es are regionally dis- tributed but thin. The only two that are fossiliferous correlate well with fossiliferous limestones in map
157

unit 4 on the other side of the thrust fault (Fig. 59). The slates and siltstones locally contain small amounts of disseminated pyrite. Local rounded pebbles and small cobbles occur in one exposure on Mount Dillworth. The sedimentary sequence is characterized by abundant scour and f i l l structures, grading, and crossbedding; tops are toward the axis of the Mount Dillworth syncline.
STRUCTURE
FOLDING: The major structural feature in the area is the Mount Dillworth syncline; it trends north-north- westlsouth-southeast and i s doubly plunging. The syncline deforms the stratigraphy described previously and the outcrop pattern now resembles a series of concentric rings. Vergence of minor folds that crop out north of Divide Lake and north of Daisy Lake support this structural interpretation. The hinge area of the
on the west side of the syncline are typically vertical but can range between 80 degrees west and 70 degrees major fold is exposed on Mitre Mountain and on the west slope of Mount Shorty Stevenson. Regional dips
east. The alternating thin-bedded siltstones and thicker, more massive greywackes and sandstones of map unit 5 are folded disharmonically (Grove. 1971, Plate XI ) . An idealized cross section of this structure is presented on Figure 60.
6 z L o a s .?;
MOUNT BEAR RIVER
WEST-SOUTHWEST EAST-NORTHEAST
DILLWORTH SYNCLINE
Flgure 60. Geologic crowsection through Mount Dlllworth (compare with Atldrick, 1983, Fig. 671
158

FAULTING: A minor thrust fault that encircles the Dillworth syncline separates the sedimentary sequence from volcanic rocks of map units 4 and 3 and, locally, map unit 2. Volcanic rocks adjacent t o this fault show little or no deformation but thin-bedded black slates and siltstones are chaotically deformed and cut
quartz vein that locally swells up to 50 centimetres. Clayey fault gouge fills this fault plane in exclosures by white quartz veinlets. The fault plane is characteristically marked by a 6 to 8-cenlimetre massive white
siltstone pebbles in a matrix of massive white vein quartz. This distinctive rock has been called 'chert near the east side of Summit Lake. In the Slate Mountain area it is filled with scattered, pea-sized, black
pebble congomerate'; it was interpreted to be the basal conglomerate unit of the sedimentary sequence. On the Lower Granduc road this fault places black siltstone beds on highly pyritic rhyolite ash flow tuff (39) a t the top of map unit 3. There the fault plane is 2 metres wide and filled with vlell-rounded siltstone pebbles up to 3 centimetres in diameter in a friable matrix of pyrite and black clay. Over most of the region the fault zone is not exposed.
Major and minor faults abound and present serious problems for regional and property scale exploration.
minor fault dislocations. Some major faults are illustrated on Figures 59 and 60. Induced polarization geophysical surveys have been useful in tracing mineralized zones across major and
PALEOTOPOGRAPHY: The schematic section of Figure 61 uses the base of the rhyolitic ash flow as a time line datum. It is not a paleotopographic datum line but is probably a close apprm3ximation. Apparent paleorelief on the underlying andesitic volcanic unit is extreme. I f chaotic felsic volcanic rocks in the Mount Dillworth area represent a near-vent sequence, the stratigraphy probably drapes downward to the north and south from the 'vent area'.
METAMORPHISM
claim group. Interpretation is complicated by extensive alteration associated with the many ,mineral Galley 11981) identified greenschist facies metamorphic minerals in a petrographic study of the Big klissouri
deposits in the area (Galley, 1981; Grove, 1971). Macroscopic examination of slabbed rocks suggests that the regional metamorphic grade is roughly the same intensity throughout the Salmon River area.
MINERAL DEPOSITS
and Kenyon. this voIume1, Scottie Gold mine, Big Missouri mine area, and Silbak Prenlier mine. Mo!;t other Detailed studies are underway on major mineral deposits a t the ProsperityiPorter Idaho mine (Alldrick
prospects and mineral occurrences in the Salmon River valley have also been examined. includislg new precious metal discoveries of Scottie Gold Mines Ltd., Northair Group, Canada Wide Mines Ltcl., Esso Minerals Canada Ltd., and Pacific Cassiar Limited.
This progress report briefly reviews the stratigraphic and structual setting of a few o,f the deposits, sc'lemati- cally plotted on Figure 61, and considers some of the constraints on genetic interpretation imposed by the regional geologic setting.
SCOTTIE GOLD MINE: The gold-silver ores of Scottie Gold mine occur as pa1,allel veins of lnassive pyrrhotite and pyrrhotite-pyrite. These veins have associated base metal sulphide rnineralization dissem-
mine, including the newly discovered 0 vein, lie in subparallel fault or shear zones that trend 110 degrees inated in envelopes of intense chlorite, and hematitic siliceous alteration. The three main veins in the
and dip 75 to 80 degrees north. Within these structures the ore veins plunge 65 to 70 degrees norttl-north- west. Several subparallel mineralized veins are exposed a t surface north of the mine workings (Wsres and
159

MOUNT RNNEI
r a c
2 MOUNT WELKER
I TROY RIDGE INorth End1
B E T T l CREEK
"
160

Gewargis, 1982). These surface showings were the focus of a major exploration prograln this summer. The ore structures cut host rock andesite lapil l i tuff and tuff breccia which strike 135 degrees and cip 75 degrees northeast in the mine area.
The high-grade pyrrhotite veins have been interpreted as epigenetic mesothermal ireins that may have originated from the nearby Summit Lake stock. Both Tribe and McGuigan (persolal communication) suggested that the deposits could represent original 'epithermal' veins that have been recrystallized and possibly locally remobilized during intrusion of the granodiorite stock.
BIG MISSOURI MINE AREA: The geology and mineral deposits o f the Big Missouri area are described in detail by Galley (19811 and summarized by Soregaroli and Meade (1983): Holbeck (1983) has comlpleted an ore petrography and trace metal study. The many small, precious metal-rich showings have extensive alteration haloes and are distributed over a 6-kilometres by 1-kilometre area. The deposits have been interpreted to be moderately westward dipping, stratabound. syngenetic quartz-carbonate lenses. These lenses have angular andesite fragments scattered along the footwall contact. The fine to coarsely crystal- line quartz-carbonate rock hosts disseminated to semi-massive pyrite with gold-silver values. Several un- mineralized quartz-carbonate zones and three small massive pyritelbase metal pods tor lenses (Prosperity West, Creek Zone, and TBI-3) also occur in the area. Both hangingwall and footwall consist of andesitic lapilli tuffs andlor crystal tuffs that are moderately t o intensely altered; both are cut by barren and min- eralized quartz veinlets.
The syngenetic model requires that the andesitic volcanic host rocks of map unit 1 dip gently t o moderately (10 to 40 degrees) westward throughout the Big Missouri area. No stratigraphic orientations have been
Outcrop is limited, alteration is intense and widespread, and the andesitic tuffs are generally massive. recorded within the andesitic country rocks (Dykes, personal communication, 1'383; Galley, '1981).
Alldrick (1983, Fig. 67) presented a cross section which relates the observed bedcling in the outcrops of map units 2 and 3 on 49 Ridge to postulated dips around the '49' mineral prospe8:t - if the deposit is stratabound.
The regional structural and stratigraphic picture, developed during two years of fieldwork, indicates that strata in the Big Missouri area must be vertical to steeply eastward dipping (Figs. 50 and 60). Outcrops of andesite near Silver Lake that are several hundred metres along strike from the Dago Hill mineralized zones dip 90 degrees to 80 degrees east, supporting the structural picture developed from regional studies.
While the possibility remains that the quartz-carbonate zones are stratabound lenses localized in minor fold structures, the deposits may be epigenetic and localized in structures that crosscut the stratigraphy.
SILBAK PREMIER MINE: The geology and mineral deposits of the extensive Silbak Premier mine work- ings are best described by Langille (1945); additional descriptions are by Burton (1926). White ('1939). Grove (1971 and 1973). and Barr (1980). The deposits are high grade and considered to be epithermal
These vein networks are spatially associated with the 'Premier porphyry'. precious metal veins hosted either in dense networks of reticulate quartz veinlets or in silica-flooded zones.
Phenocrysts in this porphyritic microdiorite intrusion are bimodal. It contains finer grained (GS-milli- metre) white plagioclase phenocrysts and larger (G30-millimetre) euhedral, zoned leldspar phenocrysts that appear to be potassium feldspar. In the mine workings there are several apophvses of this intrusive rock into the massive, dark green, andesitic, coarse ash tuff country rock (Langille. 1945, Fig. 2, Barr, 1980, Fig. 10). The total number, overall shape, and distribution of these intrusive bodies is not well established. nevertheless, they represent important exploration guides. The majority of the ore zones are locallized along and 'wrapped around' intrusiveicountry rock contacts. Other factors must be involved because most of the intrusive contact exposed in the mine workings is unmineralized and in these areas
161

hornfelsing extends only 2 t o 3 centimetres into the country rock. In certain areas the ’Premier porhyry’ occurs without any phenocrysts (phenocryst density ranges from 0 per cent to 50 per cent). In these areas the intrusive and country rock are almost identical and can only be tentatively separated; the intrusive rock is slightly more blocky and less foliated.
There is no documented evidence available to establish orientation of the andesitic volcanic strata in the mine area. It is generally assumed to be parallel or subparallel to the pervasive foliation in the area which strikes north and dips a t 35 to 45 degrees west.
EXPLORATION
Exploration activity in the Stewart area has been intensive during the past few years. Miningandexploration companies are investigating new mineral discoveries such as: the Consolidated Silver Butte prospect (Esso Minerals Canada), the Angelo vein and D vein extensions (Pacific Cassiar Limited), and the 0 zone (Scottie
Gold Mines Ltd.). In addition, many previously known mines and prospects are being re-evaluated: Big Missouri mine area and Silbak Premier mine area (Westmin Resources Limited). the Scottie prospect (Sconie Gold Mines Ltd.), Indian mine (Esso Minerals Canada), the East Gold mine, the Bayview mine (Kingdom Resources Ltd.), the ProsperityIPorter Idaho mine (Pacific Cassiar Limited), and others. There is also renewed exploration activity in Alaska focussed on similar mineral showings in the same strati-
graphic setting, such as: the Mineral Hill area (Greenwich Resources Inc.), the Stoner prospect (Exxon Minerals Company). and Moh’s showings (Pulsar Exploration Ltd.).
The Surveys and Mapping Branch (Maps B.C.) of the British Columbia Ministry of Environment has announced
airphoto survey was flown July 27 and 28, 1982: i t provides documentation of current glacial extent with release of a new, high-resolution, black and white series of air photographs that cover the Stewart area. The
a minimum of snow cover. The standard 1:50 000 photographs can be enlarged a t least four times ( to 1 :6250) without significant loss of resolution.
PROSPECTING: Intensive prospecting has continued to be the most successful reconnaissance exploration tool throughout the area. Locally, steep topography and cover require different approaches. Base of hill stream sediment and talus sampling led to Northair’s discovery of gold-bearing quartz-arsenopyrite-pyrite- epidote veins on the upper slopes of Tide Mountain above the East Gold mine. Boulder tracing a t the toes of glaciers and around the margins of snowfields contributed to discoveries by Scottie Gold Mines Ltd. and Skyline Explorations Ltd.
Wide variations in ore mineralogy, textures, gossans, and peripheral alteration among the various mineral deposits preclude establishing a ’short list’of key prospecting guides.
GEOPHYSICS: Both Westmin Resources and Esso Minerals have conducted extensive tests of a variety of geophysical systems over their known mineralized zones. The systems tested included horizontal and vertical-loop electromagnetic, VLF electromagnetic, induced polarization, self-potential, and magnetometer surveys. Both companies have independently concluded that time-domain induced polarization ( IP) was most effective for following the disseminated to remi-massive mineralization they were dealing with.
covered areas and to relocate mineral zones displaced by major and minor fault offsets. Induced polarization surveys have allowed both companies to trace mineralized zones through overburden-
Sconie Gold Mines searched for massive pyrrhotite veins within major fault zones with a magnetometer and a VLF electromagnetic unit.
162

CONCLUSIONS
The general stratigraphic section in the Salmon River valley consists of a thick sectlon of andesitic tuffs overlain by interbedded dacitic tuffs and epiclastic beds. This sequence is overlain by a felsic volcanic unit with a locally developed near-vent ash flow facies. The felsic unit is overlain by a thick riedimentary sequence that consists of black, carbonaceous siltstones and overlying sandstones. This regional stratigraphy is folded
thrust fault along the base of the black siltstones. into a north-northwestisouth-southeast-trending doubly plunging syncline which produced a minor r#?gional
Pyritic ash flow facies (map unit 39) and overlying transition zone sedimentary rocks of map unit 4 are potential exploration targets for syngenetic volcanogenic massive sulphide deposits. .These rocks represent the classic stratigraphic and paleotopographic I?) massive sulphide environment. Visible sulphides. the onset of submarine conditions, and reducing conditions argue that massive sulphidc deposits might have formed and been preserved. This favourable zone is exposed for a strike length of 7 kilometres; it could be evaluated rapidly by a rock sampling program along the exposures or by a helicopter-borne dectro- magnetic survey.
Maclntyre's brief comment 11976, p. 17) about similar stratabound sulphide lenses a t a similar strati- graphic horizon in the Tahtsa Lake area 300 kilometres to the southeast suggests that a regional exploration program within and immediately above this distinctive felsic volcanic strata is worth considering.
ACKNOWLEDGMENTS
debted to Scott Angus, Paul Banks, Shaun Dykes. Stu Fraser. Ken Hicks. Paul McGuigan, Norm Tribe, Logistical support during the field season was generously provided by Canada Wide Mines Ltd. I am in-
and Paul Wojdak for sharing their knowledge and insights about the geology and m neral deposits of the region. Ian Webster provided capable and cheerful assistance throughout a wet but productive field season.
REFERENCES
Alldrick. D. J. (1983): Salmon River Project. Stewart, British Columbia (104811). B.C. Ministry of Energy,
Mines& Pet. Res., Geological Fieldwork, 1982, Paper 1983-1, pp. 182-195.
Barr, D. (1980): Gold in the Canadian Cordillera, C.I.M., Bull.. Vol. 73, No. 818, pp. 59-76.
Burton, W. D. (1926): Ore Deposition a t Premier Mine, B.C.. Econ. Geo/., Vol. 21, No. 6, pp. 5B6-604.
Carter, N. C. (1973): Geology of the Northern Babine Lake Area, B.C. Ministry of Energy, Mines& Pet.
Res.. Prelim. Map No. 12.
Carter, N. C. and Kirkham, R . V. 11969): Geological Compilation Map of the Smithers. Hazelton. and
Terrace Areas, B.C. Mmistry of Energy, Mines & Pet. Res., Map 69-1.
Duffell, S. (1959): Whitesail Lake Map-Area, British Columbia, Geo/. Surv., Canada, Mem. 299.
Duffell, S . and Souther, J. G. (1964): Geology of the Terrace MapArea. British Cdumbia. Geo/. Surv.,
Canada, Mem. 329.
Galley, A. 11981): Volcanic Stratigraphy and Gold-Silver Occurrences on the Big Mlissouri Claim Group,
Stewart, British Columbia, Universityof Western Ontario, M.Sc. Thesis, 181 pp.
Grove, E. W. (1971): Geology and Mineral Deposits of the Stewart Area, B.C., B.C. Ministry of Energy,
Mines& Pet. Res., Bull. 58, 219 pp.
163

.......... (1973): Geology and Mineral Deposits of the Stewart Complex, British Columbia, McGill Univer-
sity, Ph.D. Thesis, 434 pp.
...._..... (1983): Geology of the Unuk River-Salmon River-Anyox MapArea, B.C. Ministry of Energy,
Mines & Pet. Res., miscellaneous map series (coloured maps to accompany Bull. 63, in preparation).
Holbeck. P. (1983): Ore Petrography a t the Big Missouri Deposit, Northwestern British Columbia, Univer- sity of B.C., Term Paper, 35 pp.
Klepaki, D. W. (1980): Silver Bar Property Geology, B.C. Ministry of Energy, Mines & Pet. Res., Assess-
ment Report 6900.
Langille, E. G. (1945): Some Controls of Ore Deposits a t the Premier Mine, Western Miner, June 1945, pp.
44-50. Maclntyre, D. G. (1976): Evolution of Upper Cretaceous Volcanic and Plutonic Centers and Associated
Porphyry Copper Occurrences, Tahtsa Lake Area, British Columbia, University of Western Ontario,
Ph.D. Thesis, 158 pp.
Soregaroli, A. and Meade, H. (1983): Promise of the Stewart Area, British Columbia, Western Miner,
May 1983, pp. 27-29.
Tipper, H. W. (1971): Smithers Map-Area, British Columbia, Geol. Surv., Canada, Report of Activities,
Paper 71-lA, Pt. A, pp. 34-37.
Tipper, H. W. and Richards, T. A. (1976): Jurassic Stratigraphy and History of North-Central British
Columbia, Geol. Surv., Canada, Bull. 270, 73 pp.
Wares, R . and Gewargis, W. (19821: Scottie Gold Mines Surface Geology Map Series, 8.C. Ministry of
Energy, Mines & Pet. Res., Assessment Report 10 738.
White. W. H. (1939): Geology and Ore Deposition of Silbak Premier Mine, University of British Columbia,
M.A. Sc. Thesis, 78 pp.

THE PROSPERITY/PORTER IDAHO SILVER DEPOSITS (103P/13)
By D. J. Alldrick and J. M. Kenyon
INTRODUCTION
The high-grade silver (-lead-zinc) vein deposits of the Prosperity (Mineral Inventory 103P-89) and Porter
southeast of Stewart. The mine workings are on the south face of the mountain a t an elevation of 1 550 Idaho (Mineral Inventory 103P-89) mines outcrop on the upper slopes of Mount Railiey. 4.5 kilometres
metres, overlooking the Kate Ryan Glacier and Ryan Creek (Fig. 62). Access is by lhelicopter from the Stewart airport 4 kilometres to the northwest, although a hiking trail from the north end of Stewart up Barney Gulch and over or around the Barney Glacier is in fair condition.
Figure 62. Geology of the Mount Rainey area.
165
ldegroot
1983

/
. . . . . i. :.; ]
4
\
166

The property is wholly owned by Pacific Cassiar Limited which has been conducting evaluation o f ore
was prompted by elevated silver prices, by the existence of remaining reserves, ard by potential for reserves, rehabilitation of the mine workings, and surface exploration since 1980. This rmewed explorrtion
additional ore.
HISTORY AND PREVIOUS WORK
History and production of the ProsperityiPorter Idaho mine and the nearby Silvel-ado mine (Mineral
explored many times since the initial staking of mineralization in 1904 on the Silverado ground. The Inventory 103P-881 were reviewed by Grove (1971). The silver deposits on Mount Rainey have been
Porter Idaho ground was staked in 1921, followed by the Prosperity claims in 1926. Premier Gold Mining Company Limited acquired the combined properties in 1928. When the production decision was made silver was $0.56 per ounce. When production ended after 17 months in April 1931 the silver prim? was $0.28 per ounce.
White (1946) published a detailed description of the Silverado property; however, there is no correspoliding detailed description of the Prosperity and Porter Idaho mines. Grove (1971) provides a review of both areas with plans and sections of the mine workings. A company newsletter (1983) presents a north-:;outh cross-section through Mount Rainey that correlates the workings on both sides of the mountain, reproduced here as Figure 63.
GEOLOGY
Silver deposits of Mount Rainey are contained in a complex andesitic to felsic volcanic sequence that is an extension of lithologies that host precious metal deposits in the Salmon River valley to the north (Alldrick, this volume). Lithologies and stratigraphy are similar in both areas but the structural setting for the Mount
mentary rocks or the distinctive felsic volcanic sequence exposed near Mount Shorty Stevenson, 21 kilo- Rainey area has not been resolved. Mount Rainey does not contain the thick sections of epiclastic sedi-
metres to the north. A simplified stratigraphic column is illustrated on Figure 62.
The host rocks to the mineralization in the ProsperityiPorter Idaho area are predominawly dacitic volcanic rocks varying from crystal tuffs to welded tuffs with minor units of andesitic lapilli tuff and dacitic rvater- lain tuf f . In contrast, the host rocks a t the Silverado workings are predominately andesitic coarse tuff breccias (White, 19461. Various dykes that outcrop in and around the Silverado deposits are rare in the ProsperityiPorter Idaho workings.
The Hyder granodiorite, a hornblende granodiorite to quartz monzonite, intrudes the vs31canic rocks on the west side of Mount Rainey. The intrusive rock is medium to coarse-grained; the core is unaltered but the outermost 100 to 150 metres i s cut by a network of widely spaced (50 to 100 centimetres apart) epidote veinlets.
cut by epidote and chlorite veinlets. The intruded volcanic section comprises a thick sequence of green Volcanic rocks at the intrusive contact show no obvious alteration halo, although the rocks are sheare'3 and
conglomerate which outcrops as a prominent knob on the ridge top 700 metres east of the intrusive con- andesitic coarse ash tuffs. It contains a one-hundred-metre thick section of massive purple epiclastic
tact. The volcanic sequence further eastward is a complex of andesitic lithic tuffs, including lapilli and medium to coarse tuff breccias and crystal tuffs, interbedded dacitic crystal tuffs, lapill1 tuffs, welded tuffs, and local thin waterlain tuf f units and epiclastic conglomerate beds. A thick section of massive felsic tuffs are exposed a t the head of Barney Glacier in the northeast part of the area mapped. Vckanic strata further east on Mount Magee. near the contact with sedimentary units, have not been examined, The overall strike of the volcanic units is north-south with dips moderately to steeply westward, but lar!)e local variations in the strike have been noted.
167

Figure 64. Geology of the ProsperityIPorter Idaho miner property
168
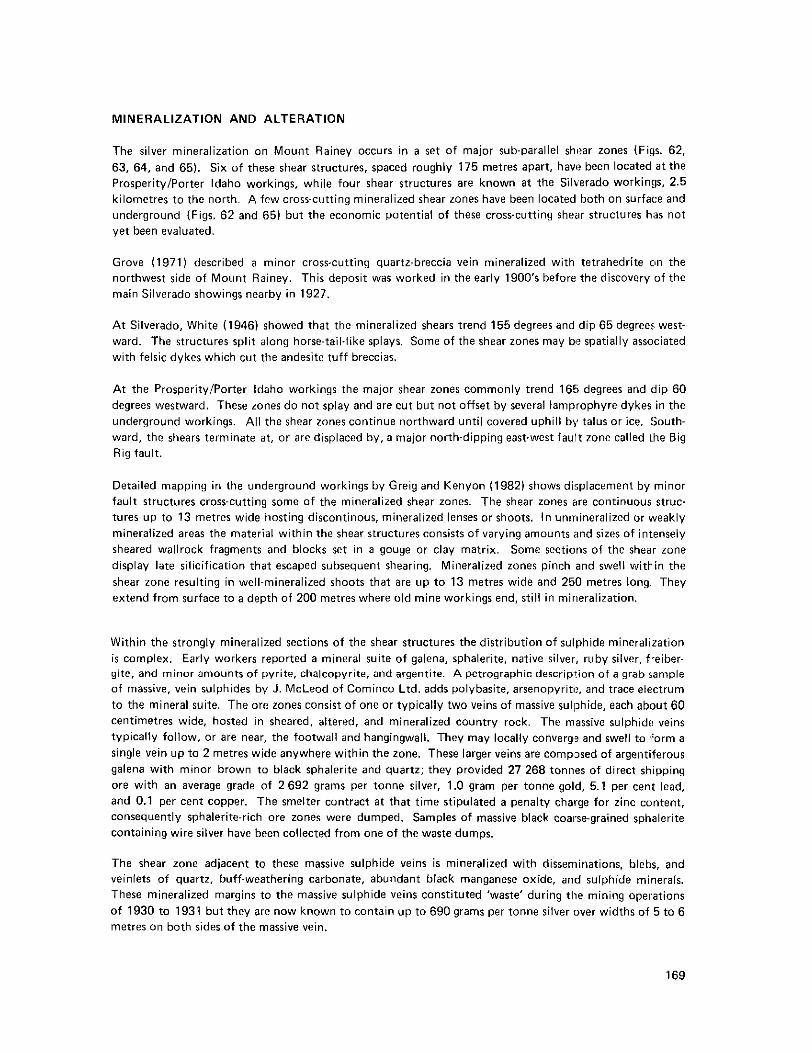
MINERALIZATION AND ALTERATION
The silver mineralization on Mount Rainey occurs in a set of major sub-parallel shl?ar zones (Figs. 62, 63, 64, and 65). Six of these shear structures, spaced roughly 175 metres apart, haw? been located a t the ProsperitylPorter Idaho workings, while four shear structures are known a t the Silverado workings. 2.5 kilometres to the north. A few cross-cutting mineralized shear zones have been located both on surface and underground (Figs. 62 and 65) but the economic potential of these cross-cutting shear structures has not yet been evaluated.
Grove (1971) described a minor croswutting quartz-breccia vein mineralized with tetrahedrite on the northwest side of Mount Rainey. This deposit was worked in the early 1900's before the discovery of the main Silverado showings nearby in 1927.
A t Silverado, White (1946) showed that the mineralized shears trend 155 degrees and dip 65 degreer, west- ward. The structures split along horse-tail-like splays. Some of the shear zones may bi? spatially associated with felsic dykes which cut the andesite tuff breccias.
degrees westward. These zones do not splay and are cut but not offset by several lamprophyre dykes in the A t the ProsperitylPorter Idaho workings the major shear zones commonly trend 165 degrees and dip 60
ward, the shears terminate at, or are displaced by. a major north-dipping east-west fault zone called the Big underground workings. All the shear zones continue northward until covered uphill by talus or ice. South-
Rig fault.
Detailed mapping in the underground workings by Greig and Kenyon (1982) shows di!;placement by minor fault structures cross-cutting some of the mineralized shear zones. The shear zones are continuous strue tures UP to 13 metres wide hosting discontinous, mineralized lenses or shoots. In unmineralized or weakly mineralized areas the material within the shear structures consists o f varying amounts and sizes of intensely sheared wallrock fragments and blocks set in a gouge or clay matrix. Some sections of the shear zone display late silicification that escaped subsequent shearing. Mineralized zones pinch and swell witbin the shear zone resulting in well-mineralized shoots that are up to 13 metres wide and 250 metres long. They extend from surface to a depth of 200 metres where old mine workings end, still in mineralization.
Within the strongly mineralized sections of the shear structures the distribution of sulphide mineralization
gite. and minor amounts of pyrite, chalcopyrite, and argentite. A petrographic description of a grab sample is complex. Early workers reported a mineral suite of galena, sphalerite, native silver, ruby silver. f,eiber-
of massive, vein sulphides by J. McLeod of Cominco Ltd. adds polybasite, arsenopyritl:, and trace electrum to the mineral suite. The ore zones consist of one or typically two veins of massive sullphide, each about 60 centimetres wide, hosted in sheared, altered, and mineralized country rock. The massive sulphide veins typically follow, or are near, the footwall and hangingwall. They may locally converq? and swell t o -form a
galena with minor brown to black sphalerite and quartz; they provided 27 268 tonnes of direct shipping single vein up to 2 metres wide anywhere within the zone. These larger veins are compxed of argentiferous
and 0.1 per cent copper. The smelter contract a t that time stipulated a penalty charge for zinc ccsntent, ore with an average grade of 2 692 grams per tonne silver, 1.0 gram per tonne gold, 5.1 per cent lead,
consequently sphalerite-rich ore zones were dumped. Samples of massive black coarse-grained sphalerite containing wire silver have been collected from one of the waste dumps.
veinlets of quartz. buff-weathering carbonate, abundant black manganese oxide, and sulphide minerals. The shear zone adjacent to these massive sulphide veins is mineralized with disseminations, blebs, and
These mineralized margins to the massive sulphide veins constituted 'waste' during the mining operations of 1930 to 1931 but they are now known to contain up to 690 grams per tonne silver over widths of 5 to 6 metres on both sides of the massive vein.
169

170

The shear zones have sharp borders against the country rock and only minor silicification of the VOlCaniC host rocks can be seen in hand sample. There is essentially no known mineralization in the country rock between the shears but one narrow 'blind' mineralized shear has been located 75 me1:res west o f D vein a t the 1 430-metre elevation.
Published probable reserves as of December 1983 were 775 800 tonnes Of 634 grams Per tonne Silver from workings which have been assessed.
EXPLORATION
The recent underground exploration program a t the ProsperitylPorter Idaho examined the known reserves remaining in the workings after shutdown in 1931; it was based on an understanding of the original high- grade mining operations and the need to assess the potential of the unexplored strike lengths of the six major shears. The original operations produced direct-shipping ore a t a cut-off grade of roughly 785 grams per tonne silver. Much of the mineralized shear zone that constituted 'waste' a t that rime now prov des a substantial tonnage of lower grade ore a t current silver prices. The waste dump a t the 1 430metre portal of D tunnel has been bulk sampled and contains reserves of 11 800 tonnes with 396 grams per tonne silver.
The exploration work from 1980.1983 consisted of an underground program to rehabilitate mine workings and systematic percussion drilling of mineralized wallrocks a t 15.24-metre (50-foot) centres along the shear zones. The percussion drilling also discovered massive sulphide veins missed by the Premier operation. The surface exploration program consisted of prospecting. detailed geological mapping, geochemical mil and
over mineralized outcrops, and to date, diamond drilling has been limited to three holes cored in 1975. The talus sampling, and bulk sampling of waste dumps. Limited geophysical tests have shown little response
most effective technique for surface exploration in this area has been intensive prospecting. The snow- fields and glaciers on Mount Rainey have retreated substantially in recent years, exposing extensions of known veins, thus reinforcing the concept that the shear structures are continous through the mountain
other areas on the mountain for prospecting. Discovery of new mineralized outcrops has increased the between the ProsperityIPorter Idaho and the Silverado workings IFig. 63). lcefield retreat has also exposed
mineralized strike length to a horizontal distance of 750 metres with a vertical relief of :335 metres.
The shear zones are recessive weathering and exposures are sparse. A typical outclop exposure of the mineralized shears in the ProsperityiPorter Idaho area is a well-sheared zone containing dull, distinctive black and orange coarsely mottled rock due to manganese and carbonate alteration. In some outcrop.. man- ganese alteration predominates, producing a massive t o sheared sooty black gossan; in other exposures the alteration i s predomiantly buff-orange weathering carbonate. Sulphide minerals are partially pre!;erved in some shear-zone outcrops and are leached from others leaving a limonitic boxwork. Shear zones exposed by recent glacial retreat show less oxidation of sulphides; galena and sphalerite are exposed a t surface and minor amounts of a bright yellow powdery mineral, greenockite, or hawleyite (?I have been located by Greig and Kenyon; other secondary zinc minerals can be expected to be present.
ACKNOWLEDGMENTS
Pacific Cassiar Limited provided accommodation and logistical support for the Ministry's field pelrty in 1982 and 1983. Their generous hospitality contributed measurably to the efficiency and productivity of the field program. Ian Webster provided tenacious and cheerful assistance in the field.
REFERENCES
B.C. Ministry of Energy, Mines & Pet Res.: MINFILE, 1982, Properties 103P-88. 1C13P-89, and 103P-90. Ilrownlee. D. J. and Fairbank, 6 . D. (19801: Geological and Geochemical Report on the Magee Property,
B.C. Ministry of Energy, Mines & Pet. Res., Assessment Report 8403, 10 pp.
171

Greig, J. and Kenyon, J. M. (1982): ProsperityIPorter Idaho Geology Map 2, Scale 1:5 000, for Pacific
Grove, E. W. (1971): Geology and Mineral Deposits of the Stewart Area, 6.C. Ministry of Energy, Mines &
Kenyon, J. M. (1983): Probable, Possible, and Geological Reserves a t the ProsperityIPorter Idaho Mine,
Pacific Casiar Limited (1982): Special Report to Shareholders, 3 pp. McLeod. J. A. (1982): Cominco Laboratory Report, Cominco Ltd., 3 pp.
Seraphim, R. M. (1975): Report and Plans, B.C. Ministry of Energy, Mines& Pet. Res., Open File. White, W. E. (1946): Big Four Silver Mines Ltd., Minister of Mines, B.C., Ann. Rept.. 1946, pp. 74-78.
Cassiar Limited, B.C. Ministry of Energy, Mines & Pet Res., Assessment Report 11 007.
Pet. Res., Bull. 58, 219 pp.
Pacific Cassiar Limited, Company Report.
172

GEOLOGY OF THE ALSEK-TATSHENSHINI RIVERS AREA
(114P)
By D. G. Maclntyre
INTRODUCTION
deposit began in 1982 (Maclntyre, 1983). An additional 10 days were spent mapping in the vicinity of Geological studies of the Falconbridge Nickel Mines Limited-Geddes Resources Limited's WindyCraggy
the deposit during the 1983 field season. A total of 86 geologic stations were established in the milp-area, which covered approximately 300 square kilometres (Fig. 66). The primary purposes of this project were to define the stratigraphic and structural setting of the Windy-Craggy deposit and to assess the mineral resource potential of the surrounding area. This report summarizes the preliminary results of thi!; work.
Figure66. Location of the Alrek-Tatrhenrhini map%rea relative to major tectonic elements ag defined by Campbell and Doddr. 1983. B.R.F. = Border Ranges fault: F.F. = Fairweather fault; H.F. = Hubbard fault; D.R.f:. = Duke River fault: D.F.S. = Denali fault system: T.F. = Totrchunda fault; W1 = Wrangellia.
173
ldegroot
1983

'1 A
J
174

The maparea is part of the Alsek Ranges of the St. Elias Mountains; i t i s characterized by jagged ridges and peaks rising to 2 200 metres above a base elevation of 800 to 1 000 metres. Ahnost all the cirques and valleys in the area are occupied by glaciers. Outcrop is limited by the extent of ice cover. Th'? steep and unstable nature of much of the outcrop in the area made mapping difficult; many areas could not be sampled for safety reasons. Marginal weather conditions also restricted access to higher elevations during the mapping project. Consequently much of the area has been mapped from a distance or via hel,copter with geologic contacts inferred rather than defined. Figure 67 summarizes the geology as it i s known to date.
GEOLOGIC SETTING
The Alsek-Tatshenshini maparea is part of the Alexander and St. Elias terrane of the Insular Tectonic Belt (Fig. 66). Recent geologic mapping by Campbell and Dodds (1983) showed this area to be underlain by complexly deformed Paleozoic clastic and carbonate rocks of relatively low metamorphic grade. Mafic volcanic units, lithologically similar to those exposed in the vicinity of the WindyCraggy deposit, were known to occur in the Early Paleozoic part of the stratigraphic succession; for this reason the deposit was believed to be Paleozoic in age. However, limy beds in the stratigraphic hangingwail of the depor.it have consistently yielded Late Triassic conodonts (Maclntyre, 1983). The age of the footwall rocks is, however, unknown.
GEOLOGY
The map-area is underlain by intermediate to mafic submarine volcanic units with variable amo.!nts of interbedded limy argillaceous sedimentary rocks. These rocks are believed to be predominantly Late Triassic or younger in age and to overlie an Early to Middle Paleozoic clastic and caroonate sequence (unit 1 ) . The stratigraphic succession described in this report is based mainly on traverses completed north of the
assumed that this section is both representative for the area as a whole and that it is not complicated by East Arm glacier where a relatively complete southwest-dipping section is exposed and accessible. It is
major faults.
STRATIGRAPHY
of the section (unit 1 ) is represented by a thick sequence of laminated carbonate, limy mudstone-siltstone, The stratigraphy (Fig. 68) has been divided into map units on a lithological basis. The oldest known part
thick sequence of limy argillaceous rocks (unit 2) . These rocks are overlain by andesitic flows with minor and massive limestone (upper part). Apparently overlying this unit, but generally in fault contdct, is a
intercalations of limy argillite and limestone (unit 31. A thin unit of felsic and mafic pillow lavas and porphyritic flows (unit 4) locally separates these rocks from overlying pillowed and non-pillowed inter- mediate to mafic flows and tuffs with interbedded limy argillite, siltstone, and minor amounts of chert and limestone (unit 5). Overlying unit 5 is a thick (>1 500 metres ?I pile of mafic pillovv lava (unit 6) that has no appreciable amount o f interbedded sedimentary rock. Fine to medium-grained dioritic sills and dykes (unit 7) occur throughout the Triassic succession and JurassiclCretaceous age pluton? (unit 8) occur on the northwest and east edges ot the map-area.
UNIT 1: Map unit 1 consists o f medium to thin-bedded, grey. cream, and orangebrown-we,athering limestone or marble with interbedded calcarenite and limy argillaceous siltstone. These rocks are well exposed in the creek valley south of the Tats showing, where highly contorted bands of marble .and cal- carenite crop out on the north.facing slope. A major fault occupies the valley bottom and separates these calcareous rocks from massive volcanic rocks and diorite north of the creek.
175

2
- 1
- -"b I
100- l000m LIMY SILTSTONE, ARGILLITE, ANDESITIC TUFF AND FLOWS
500- 1OOOm MAFIC PILLOW LAVA, AMYGDALOIDAL
ARGILLITE FLOWS; MINOR CHERT AND LIMY
100- 200m FELSIC OR ALTERED PORPHYRITIC PILLOW LAVA, FLOWS: MINOR CHERT
I CP 500- 1OOOm AMYGDALOIDAL ANDESITIC FLOWS; MINOR LIMY ARGILLITE
1000- 1500m BLACK LIMY ARGILLITE, SILTSTONE, AND LIMESTONE; MINOR TUFF
+1000rn GREY LIMESTONE, MARBLE, CALCARENITE, LIMY SILTSTONE
Figure 68. Preliminary stratigraphic column for the Alrek-Tatrhenshini maparea.
176

Grey-weathering limestone also crops out northeast of the East Arm glacier along the crest of a northwest-
underlying black limy argillites contain Late Eifelian to Early Givetian conodonts ( R . B. Campbell, personal trending ridge. Apparently this unit has yielded Devonian macrofossils (Knopf and Valle, 1981) and
communication), The lower half of the ridge is underlain by black-weathering shales which apparently dip northeastward underneath the limestone unit. It is not certain whether these rocks stratigraphically under- lie the Devonian limestone or are part of the Triassic succession (unit 2) that is in fault contact with the limestone.
ologies in map unit 2. Thin beds of tuff also occur locally within this unit, which for the most laart is UNIT 2: Black to dark grey-weathering limy argillaceous siltstone and shale are the predominarlt lith-
recessive in nature. This unit is well exposed west of the Tats glacier, northeast of the E a s t Arm g1acif.r. and on the ea$t side of the south-trending glacier that forms the eastern margin of the map-area. Tuff bands within this unit help outline northwest-verging isoclinal folds.
Stratigraphic relationships between unit 2 and units 1 and 3 are not well established. Norian (earlv Late Triassic) age conodonts have been extracted from samples of lithologically similar r'acks exposed o n the ridge west and north of the Tats glacier (C. J. Dodds, personal communicationl. but it is not certain i ~ f these
samples collected from unit 2 elsewhere in the map-area will yield diagnostic cotwdont fauna tO help limy argillaceous rocks are part of unit 2 or are a volcanic-deficient facies equivalent of unit 5b. Hollefully
resolve the relative stratigraphic position of these rocks.
UNIT 3: Map unit 3 consists mainly of massive, thick-bedded, locally amygdaloidal, grey to orangy brown-weathering, intermediate volcanic flows and tuff beds separated by thin beds )of limy siltstone and banded limestone. Microdioritic sills and dykes are also common within this unit. These rocks are well exposed north of the East Arm glacier where they dip steeply to the southwest and outcrop as a prorninent northwest-trending ridge. The general lack of pillowed flows distingttishes this unit from compositionally similar units which are believed to be higher up in the Triassic succession. This criteria may not be valid and the unit may be a non-pillowed facies equivalent of unit 5a.
the Tats glacier. The pillow lava is typically porphyritic with a dark cherty rind outlining pillows. Non- UNIT 4: A distinctive unit of felsic pillow lava crops out on the west~facing slope of the ridge (east of
crop out at the same stratigraphic position on the south-facing slope of the ridge north of the Ea:;t Arm pillowed porphyritic flows and felsic crystal and ash tuff are also included with thi!; unit. Similat~ rocks
glacier. This unit may prove to be an important marker unit within this sequence of predominantly inter- mediate to mafic volcanic rocks.
The original chemical composition of unit 4 rocks is not certain. Although the porphyritic pillow lavas are relatively siliceous and light coloured these characteristics may be due to superimposed hydrothermal
the stratigraphic sequence. alteration that may be genetically related to massive sulphide deposits that apprently occur highel- up in
UNIT 5: Map unit 5 can be subdivided into a lower unit (5al which consists of pillow lava and amygda- loidal flows with minor intercalations of limy argillite, siltstone, and chert and an upper unit (5b) which is predominantly limy siltstone and argillite interbedded with andesitic tuffs and flows. The wlcanic flows of unit 5a appear to be somewhat more basaltic and pervasively altered to a chlorite~carbonate assemblage than the predominantly unaltered to weakly altered tuffaceous rocks of unit 5b. Zones of disseminated and stringer pyrite both crosscut and parallel bedding within unit 5a. Rocks of this tlnit are believed to form the stratigraphic footwall of the Windy-Craggy deposit.
The thickness and percentaile of intercalated volcanic rocks are quite variable in uyit 5b. Immediately southwest of Windy-Craggy this unit appears to be over 1000 metres thick and is predominantly limy
177

178

siltstone; north of the East Arm glacier volcanic rocks predominate and the unit is probably less than 200 metres thick. Assuming there are no major faults that cut out or repeat parts of these sections (a dangerous assumption!), a local thickening of this unit in the vicinity of the Windy-Craggy deposit is inferred. Perhaps a structurally controlled sedimentary trough was present in Late Triassic time, with limy detritJs and rift-related flows and tuffs accumulating within the trough.
ary rock. This unit is very resistant and forms jagged ridges and neavvertical cliff facl?s in the area e a s t and UNIT 6: Map unit 6 is almost entirely massive mafic pillow lava; there is little or no intercalated sediment-
southeast o f the Windy-Craggy deposit. Here the unit appears to exceed 1 500 metres in thickness; its top has not yet been recognized. Agglomerate consisting of drawn out clasts of lava suspended in a muddy or tuffaceous matrix (unit 6a) occurs a t the base of the pillow lava sequence. These rocks are very distinctive and may prove to be a useful marker horizon for the map-area.
The great thickness of mafic pillow lava represented by unit 6 implies that a prolonged period of submarine extrusive activity followed formation of the Windy-Craggy deposit and deposition ot turbiditic sediments of unit 5b. The pillow lavas apparently occupy the core of a northwest-trending synclinorium which also coincides with the greatest thickness of unit 5b as mentioned previously. These observations are compat- ible with a depositional model in which sediments and submarine volcanic rocks accumulated within a trough centred on a submarine r i f t system located within a back arc sedimentary basin,
UNIT 7: Numerous dykes and sills of grey-weathering medium to fine-grained dior,tic rock occur within map units 2 through 5, particularly in the vicinity of the Windy-Craggy deposit. These intrusive rocks are texturally and probably compositionally identical t o flows within units 3 and 5b and they are assumed to
exposed and they may be more abundant than presently recognized. Isotopic age dating and petroyraphic be the subvolcanic equivalents of these rocks. The sills are difficult to recognize unless contacts at-e well-
and geochemical studies wil l be undertaken to help define the volcanic-plutonic relationships.
A diorite-volcanic complex (unit 7a) is exposed along the bottom half of the ridge east of the Tats glacier. This complex is characterized by very coarse-grained hornblende-rich diorite and party to total ly re'zrystal- lized mafic volcanic flows. The diorite in places appears to have formed as a result of recrystallization of the mafic volcanic rocks. Segregations of mafic-rich diorite are also present and locally crosscut the volcanic stratigraphy. Hornblenderich dykes cut rocks in the vicinity of the complex; they may be genetically related to the core of the complex. In one locality a breccia dyke was observed with clasts of volcanic rock that are partially tv totally replaced by hornblende and suspended in a finer grained hornblende diorite matrix.
Medium to coarse-grained diorite t v quartz diorite (unit 7bl crops out in the lower pwt of the creek drain-
to form the core of the diorite-volcanic complex; perhaps the complex represen;% a transitional zone ing the Tats showing and in the major creek valley southwest of the showing. This iqtrusive body ,appears
between the intrusive and overlying volcanic strata.
UNIT 8: Map unit 8 includes granitic rocks of probable JurassiciCretaceous age. These rocks are part of a series of intrusive bodies that crop out in the Alsek-Tatshenshini area. Potassium-argon isotopic agesof
biotite-hornblende pairs extracted from intrusive bodies east and southwest of the maparea (C. J. Dodds, 156t19. 136i5. and 141t8 Ma were determined by the Geological Survey of Canacla on hornblerde and
personal communication).
STRUCTURE
of the map-area. Isoclinal folds with northeast-dipping axial planes and northwest plunges occur within Major northeast and northwest-trending faults that offset steeply tilted fault blocks dominate the structure
179

180

incompetent limy argillaceous beds and in the massive sulphide zone a t the Windy-Craggy property. Else- where massive volcanic units do not appear to be significantly deformed, although irtterbeds of limy argil- laceous rocks are often sheared and tightly folded, suggesting movemeni was concentrated along these less competent beds. A broad syncline is defined by stratigraphic tops as deduced frorn pillow orientations and the areal distribution of unit 6 (Fig. 67). which is assumed to occur high in the Triassic stratigraphic succession.
MINERAL OCCURRENCES
WINDY-CRAGGY (Mineral Inventory 114P-2): Exploration work continued on the Falconbridge Nickel Mines Limited-Geddes Resurces Limited's Windy-Craggy deposit during the 1983 f i dd season. A total of 4 141 metres of drilling was completed in nine drill holes. This work confirmed the northwest extension of the massive sulphide deposit, Orill hole 83-14, which tested the ground between drill holes 82-11 and 82-12 (Maclntyre. 1983) intersected 61.23 metres averaging 1.21 per cent copper. 11 grams per tonne (0.32 ounce per ton) gold, and 11.6 grams per tonne (0.34 ounce per ton) silver (George Cross Newsletter, No. 197, October 12, 1983). This intersection included a 23.7-metre section averaging '19.9 grams per tonne
cant concentrations of gold. Final results of the 1983 drilling program have not yet been made public. (0.58 ounce per ton) gold. These results indicate that the WindyXraggy deposit may also have very signifi-
One of the primary objectives of this project was to define the stratigraphic position of the Windy-Craggy deposit. On the basis of mapping completed to date it appears that the mineralized zone occurs a t the transition between units 5a and 5b. That is, the stratigraphic footwall consists of pillow lava with minor intercalations of chert and limy argillite; the stratigraphic hangingwall consists of limy siltstone and argillite
normal faults (see cross section, Fig. 67). with interbedded andesitic tuff and flows. These stratigraphic units are offset by tigh-angle reverse and
A similar stratigraphic succession to that hosting the Windy-Craggy deposit is exposed on the north side of the East Arm glacier. Zones of pervasive chlorite and sericite alteration with disseminated and stringer pyrite mineralization do occur in this part of the volcanic sequence, typically producirq prominent g,xsans. So far no stratabound massive sulphide mineralization has been discovered. Analyses of samples from these zones (samples 4 and 5. accompanying table) indicate relatively low base and precious metal coltents. There may be an enrichment of barium in sample 4.
TATS: In addition to Windytraggy there are two other massive sulphide occurrerices in the map-area, namely the Tats and Rime (Mus). The Tats showing, which is also held by Falco'ybridge Nickel Mines Limited, is located in a south-flowing creek gully just below a small cirque glacier in the first major valley north of Tats Lake (Fig. 69). The showing occurs within a broad. north-trendin,~ pyritic zone within massive amygdaloidal flows. These rocks are tentatively assigned to map unit 3.
A thin (less than 2 metres) band of massive chalcopyrite and pyrrhotite exposed in the creek bed cornprises the Tats showing. A sample of massive sulphide from this showing contained 13.5 per cent copper, 0.12 per cent cobalt, 0.18 per cent zinc, and 29 ppm silver (sample 13, accompanying tablel. Small elongate crystals of black actinolite (X-ray diffraction identification) occur within the massive chalcopyrite along with minor amounts of chlorite, epidote, and quartz.
grained pyrrhotite and magnetite with only minor chalcopyrite. Cobalt is also enriched in this sulphide Outcrops of pyritic volcanic flows immediately above the creek bed showing contain bands of coarse-
zone with one sample averaging 0.14 per cent (sample 12, accompanying table). Zinc and silver were low, however, in contrast to the creek bed showing. Upstream, a thin dyke of feldspar porphyry cuts the pyritic zone. This dyke is also mineralired with small flecks of malachite and disseminated pyrite (samlple 11, accompanying table).
181

TATS SHOWING
L
Figure 69. General geology and sample locations, Tats showing. See Figure 67 for explanation Of map symbols.
RIME: The Rime claims straddle the East Arm glacier. The area was formerly held by Swiss Aluminium Company of Canada Ltd. (Mus claims); the main showing was known as the 'X-showing' (Knopf and Valle, 1981). The area has recently been restaked by St. Joe Canada Inc. and airborne geophysical surveys were conducted over the property during the 1983 field season. One of the main targets is a large magnetic anomaly that occurs under the East Arm glacier at the junction of the north and west branches.
The main showing on the Rime claims (X-showing) is a thin zone of banded pyrrhotite. chalcopyrite, and calcite in tightly folded limy argillites. The limy argillite occurs within a sequence of massive amygdaloidal flows that are assigned to map unit 3. Two samples from the showing were analysed for trace and precious metal content (samples 16 and 19. accompanying table) and were found to contain 84 and 54 grams per tonne gold and 42 and 18 grams per tonne silver respectively. Antimony was also slightly enriched whereas cobalt content was very low relative to the anomalous concentrations a t the Tats and WindyCraggy de-
appears to be stratiform sulphide mineralization. posits. Additional work is required to evaluate the overall significance of very high gold values in what
Thin laminae of pyrrhotite also occur in limy argillite interbeds in exposures of uni t 3 north Of the East Arm glacier. A sample of massive pyrrhotite from this occurrence (sample 2, accompanying table) con- tained only a slight enrichment in zinc.
182

HENSHI CREEK: Boulders of massive pyrrhotite with variable amounts of intergrown chalcopyrite
of these boulders is still uncertain. It is most likely that they are derived from bedrock under the glacier have been deposited a t the toe of the East Arm glacier (Henshi Creek showing, No, 3 , Fig. 67). The source
the boulders indicates an anomalous gold concentration (sample 18, accompanying table). but values are rather than from medial and lateral moraines on the ice surface. Chemical analysis o f a sample of one of
much lower than those obtained a t the X.showing.
CONCLUSIONS
Triassic andesitic to basaltic flows and limy argillaceous sedimentary rocks is preserved within a toughly Fieldwork in the Alsek-Tatshenshini Rivers area indicates that a thick (>3 000 metres ?I section ,of Late
graphic levels within the Triassic succession; broad zones of disseminated stringer sulphides both crosscut rectangular, fault-bounded area. Stratabound massive sulphide deposits occur a t several different strati-
and parallel the stratigraphy. These sulphide zones appear to be spatially associated with fine-grained dioritic sills and dykes in underlying rocks. These intrusive rocks are lithologically and probably com- positionally similar to flows within the succession. The presence of a structurally controlled trough is inferred by anomalous thickening of sedimentary and volcanic units in the vicinity of the Windy-Craggy deposit.
The modern day Guaymas Basin in the Gulf of California (for example, Scott, et a/., 19831 is favoured as the type of environment in which the mineral deposits of the area formed. That i!,, hydrothermal vents are inferred to have occurred within a r i f t trough localized on a spreading centre within a Sedimentary
detritus and injection of subvolcanic dioritic intrusions both before and after the main mineralizing events. basin. The inferred trough was the site o f rapid accumulation of submarine flows and clastic and carbonate
No ophiolite sequence has yet been observed in the area, although the diorite-volcanic complex exposed near the Tats showing may have formed in a manner analogous to that proposed for ophiolite complexes. The lack of well-developed ophiolite complexes suggests that the inferred spreading ,:entre was short lived and did not evolve past the earliest stages of crustal spreading.
One of the most significant results of work done in the Alsek-Tatshenshini Rivers area during 1983 is recognition that the deposits of the area may contain significant amounts of gold. Undoubtedly this will have a profound influence on future exploration, not only a t Windy-Craggy but also a t other prospects in the area.
ACKNOWLEDGMENTS
The author would like to thank Falconbridge Nickel Mines Limited and Geddes Resources Limited for logistical support during the mapping project. Without their assistance the project would not havs been possible. I would also like to acknowledge Dick Campbell, Chris Dodds. and Ken Dawson of the C;eolog- ical Survey of Canada for reviewing the original manuscript and for sharing the geologic data they acquired during an earlier vis i t to the area. Some of the geology shown on the geologic map accompanying this report is derived from their observations. Finally I would like to thank Joe Cadham, pilot for I’acific
very able assistance in the field. Helicopters. for excellent service under less than ideal conditions and Mike Fournier for his cheerful and
REFERENCES
Campbell, R. 8. and Dodds, C. J. (1983): Geology, Tatshenshini Map Area 1114P). Seol. Surv., Canada, Open File 926.
183

Knopf. D. and Valle, G. D. (1981): Report on detailed geological survey in the area of the Mus claims, E.C. Ministry of Energy, Mines & Pet. Res., Assessment Report 9360.
Maclntyre. D. G. (1983): A Comparison of Stratiform Massive Sulphide Deposits of the Gataga District with the Midway and WindyCraggy Deposits, Northern British Columbia, E.C. Ministry of Energy,
Scott, S. D., Lonsdale, P. F., Edmond, J. M.. and Simoneit, 8. R. (19831: Guaymas Basin, Gulf of Mines& Pet. Res., Geological Fieldwork, 1982, Paper 1983-1, pp. 149-170.
California: Example of a Ridge-crest Hydrothermal System in a Sedimentary Environment (Abstract), Gee/. Assoc. Can., Program with Abstracts, Vol. 8, Victoria, 1983.
184

BRITISH COLUMBIA GEOCHEMICAL RECONNAISSANCE SURVEY DATA SIJMMARY
By W. M. Johnson
During the British Columbia Regional Geochemical Survey (RGS) and i ts predecessor, the joint Federal/ Provincial Uranium Reconnaissance Program (URP), more than 18 000 stream sediment and stream water samples from seventeen 1 2 5 0 000 National Topographic System (NTS) map sheets in the provillce were collected and analysed. Unless the exploration company or individual prospecior wishing to use this information has access to a computer this represents an overwhelming amount of data. This report gives a compilation of data grouped according to the dominant rock type in the drainage basin for each map sheet surveyed in the program to date in easily used map and table form as an aid to interpretation.
The data was grouped into six generalized rock types for treatment, These are defined in Table 1. The average concentration and standard deviation for 10 elements were compiled for each generalized rock type
cobalt, manganese, arsenic, molybdenum, mercury, and uranium. This treatmenl is similar t o an earlier in each of the 17 map sheets. The 10 elements selected for compilation are zinc, copper, lead, nickel,
one done as part o f a metallogeny study (Sutherland Brown, 1980).
TABLE 1
GENERALIZED ROCK TYPE COMPONENT ROCK TYPES
Intrusive Alaskite, granodiorite. granite. quartz diorite, and quartz monzonite. INTR
Volcanic Agglomerate, andesite, basalt, dacite, greenstone, lnetavolcanic VOLC rocks. olivine basalt, pvroclasric and tuff .
METM Metamorphic Gneiss, phvllite, schist. and slate.
Till Till
Sedimentary Chert, argillite, siltstone. sandstone. greywacke, conglomerate, quart- IClartic) SEDM
Carbonate CARB
zite. and metasedimentarv rocks.
Dolomiteand limestone.
The rock type specified for each sample site represents the dominant rock type underlying the drainage basin of the stream from which the sediment sample was collected.
mean element concentration, standard deviation, and the number of samples for each component rock type I n the compilation process the analytical data were sorted into the six generalized rock-type groups. The
within each group were then tabulated for each map sheet. These tabulated result; were used to calculate the weighted mean and weighted standard deviation of each element concentratiort for the six generalized rock types in each map sheet.
the predominant underlying component rock type and 23 samples taken from sites having limestorle. These For example, in map sheet NTS 82K. there were 54 samples taken from si tes specified as having dolomite as
were tabulated into the generalized rock type 'carbonate'. The weighted mean elelnent concentration and
185
ldegroot
1983
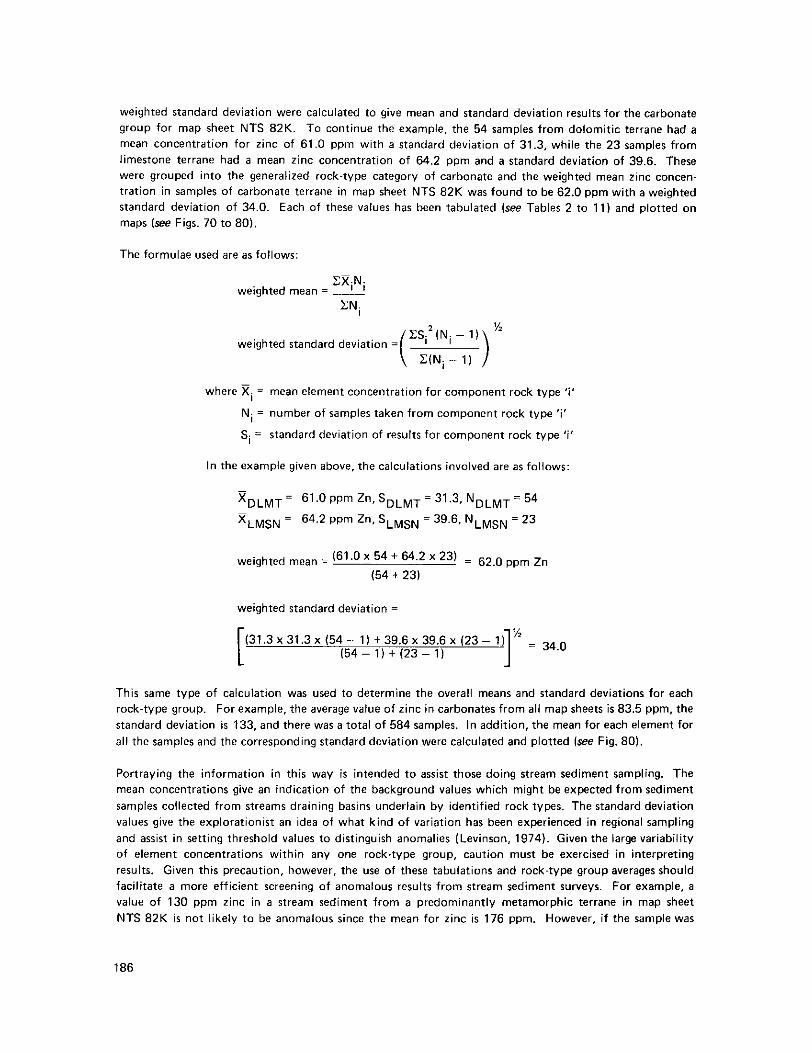
weighted standard deviation were calculated to give mean and standard deviation results for the carbonate group for map sheet NTS 82K. To continue the example, the 54 samples from dolomitic terrane had a mean concentration for zinc of 61.0 ppm with a standard deviation of 31.3, while the 23 samples from limestone terrane had a mean zinc concentration of 64.2 ppm and a standard deviation of 39.6. These were grouped into the generalized rock-type category of carbonate and the weighted mean zinc concen- tration in samples of carbonate terrane in map sheet NTS 82K was found to be 62.0 ppm with a weighted standard deviation of 34.0. Each of these values has been tabulated (see Tables 2 to 1 1 ) and plotted on maps (see Figs. 70 to 80).
The formulae used are as follows:
weighted mean = ~
CXiNi
XNi
CSiZ(Ni - 1)
( U N i - 1 ) ) 72
weighted standard deviation =
where x. = mean element concentration for component rock type 'i'
Ni = number of samples taken from component rock type 'i'
Si = standard deviation of results for component rock type 'i'
In the example given above, the calculations involved are as follows:
I
-
~
XDLMT = 61.0 ppm Zn, SDLMT = 31.3, NDLMT = 54
XLMSN = 64.2 ppm Zn, SLMSN = 39.6, NLMSN = 23
weighted mean = (61'o x 5 4 + 64.2 x 23) = 62.0 ppm Zn (54 + 23)
weighted standard deviation =
(31.3 x 31.3 x (54 - 1 ) t 39.6 x 39.6 x (23 - 1 I = 34.0 I54 - 1 ) t (23 - 1) I"
This same type of calculation was used to determine the overall means and standard deviations for each
standard deviation is 133, and there was a total of 584 samples. In addition, the mean for each element for rock-type group. For example, the average value of zinc in carbonates from all map sheets is 83.5 ppm. the
all the samples and the corresponding standard deviation were calculated and plotted (see Fig. 80).
Portraying the information in this way is intended to assist those doing stream sediment sampling. The mean concentrations give an indication of the background values which might be expected from sediment samples collected from streams draining basins underlain by identified rock types. The standard deviation
and assist in setting threshold values to distinguish anomalies (Levinson, 1974). Given the large variability values give the explorationist an idea of what kind of variation has been experienced in regional sampling
of element concentrations within any one rock-type group, caution must be exercised in interpreting results. Given this precaution, however, the use of these tabulations and rock-type group averages should facilitate a more efficient screening of anomalous results from stream sediment surveys. For example, a value of 130 ppm zinc in a stream sediment from a predominantly metamorphic terrane in map sheet NTS 82K i s not likely to be anomalous since the mean for zinc is 176 ppm. However, i f the sample was
186

from a stream draining an area underlain by intrusive rocks where the average zinc concentration is 40 ppm. it would be anomalous.
A genuine local anomaly may not appear to be anomalous when compared to a map sheet average however. and care should be taken not to overlook this possibility. The 1 :250 000 map-sheet grid is an artiiicial one and has no relationship to geological provinces. This must always be kept in mind lNhen averages based on such a grid system are used.
data listings. The grouping of rock types masks anomalies in specific rock types. Notable examples of this Inevitably. any summarizing of data in this way hides interesting observations to be made in more detailed
type are the following:
Map Mea" C0"C.
Element Sheet Sampler Rock Type ppm S.D.
Uranium 104N 56.6 56.4 Molybdenum
93 1040
Alaskite 45 Granite 6.80
Molybdenum 93A 1 04 Agglomerate 7.53 48.5 4.56
Nickel Cobalt
104N 104N
45 45
Earalt Basalt
320.00 30.9
229.00 12.8
NO. of
Comparing these examples with the more generalized data in the appropriate tables leads to the following comments. The unusually high uranium in sediments draining terranes underlain by alaskite (intrusive) in NTS 104N is somewhat masked in this compilation (mean uranium is 37.1 ppm). 1-he other intrusive rock type (granite) gives rise to sediments with only 6.91 ppm uranium. Thus, uranium exploration efforts might be more profitably oriented to alaskite rather than granitic terranes in this nap sheet. Similarly, in
compared to 12.0 ppm and 11.3 ppm respectively in the pyroclastic sediments. The 85 samples of basaltic the same map sheet, the nickel concentration of the basaltic sediments is 320 ppm and the coball: 30.9, as
sediments in NTS 93A gave only 1.09 ppm molybdenum compared to 7.53 ppm in the agglomerates. Molybdenum in sediments from quartz diorite and quartz monzonite terranes in N'TS 1040 was 21.61 ppm and 2.47 ppm respectively compared to 6.80 ppm found in samples from granitic areas.
The detailed information from which this compilation has been made can be founNj in a series 01: releases from the B.C. Ministry of Energy, Mines & Petroleum Resources and the Geological Survey of Canada. They can be ordered from the B.C. Ministry of Energy, Mines & Petroleum Resources in Victoria by re- ferring to the following release numbers:
Map RGS Open File GSC
Sheet NO. No. Map RGS Open File
GSC
Sheet NO. No.
82E 82F 82K 82L 82M 92H 921
9 2 0 92J
93A 92P
938
GSC 409 GSC 514 GSC 515 GSC 410
RGS 7 GSC 516
RGS 8 GSC 885 GSC 866
RGS 9 RGS 3
GSC 867
RGS 4 GSC 774
RGS 5 GSC 775
RGS 6 GSC 776 GSC 777
103P 1031
104N 1040 104P GSC 562
187

Results are also available in EBCDIC or ASCll format on widely compatible magnetic tape (not on cassettes or floppy disks) from the British Columbia Ministry of Energy, Mines and Petroleum Resources in Victoria. All results to date are assembled on magnetic tape.
ACKNOWLEDGMENTS
gestions on how best to present this data. I would like to thank A. Panteleyev, W . J . McMillan. G. Ray. T. H O y , and D. Maclntyre for helpful sug
REFERENCES
Sutherland Brown. A. (1980): Metallogeny by Numbers, Geoscience Canada, Vol. 7. No. 3, pp. 95-101. Levinson, A. A. (1974): Introduction to Exploration Geochemistry, Applied Publishing Ltd., Calgary.

TABLE 2
ELEMhlT Zn ( D D ~ . .
189
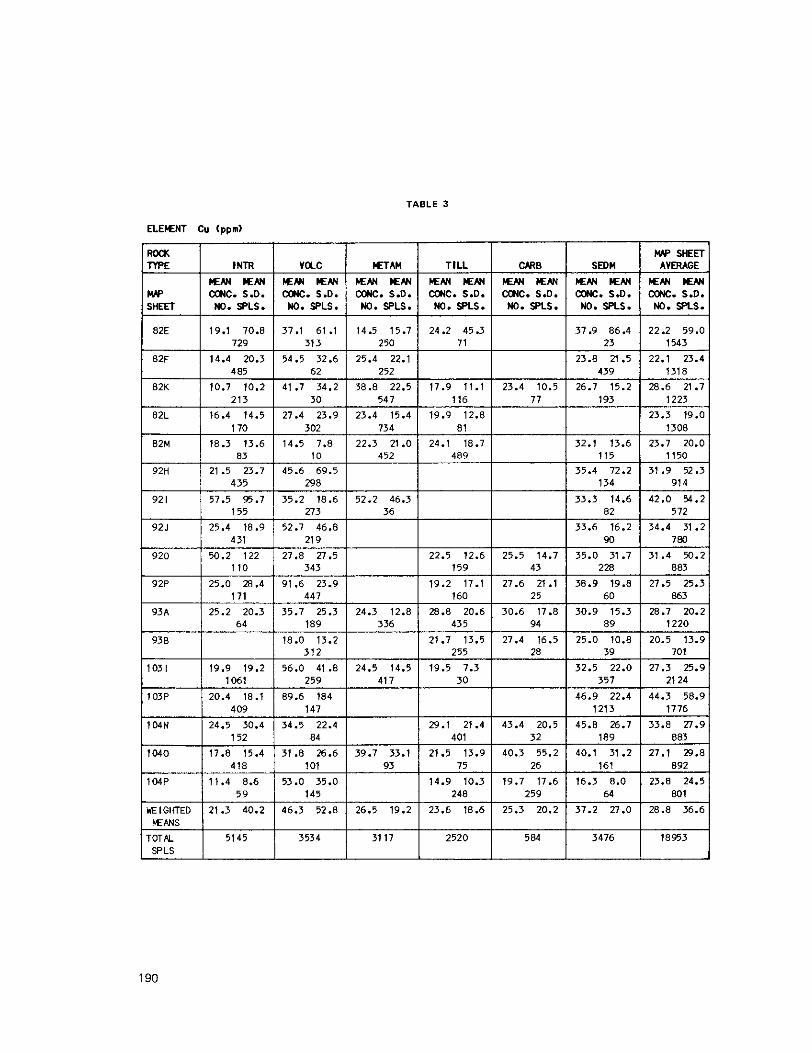
TABLE 3
WEIGHTED 21.3 40.2 46.3 52.8 26.5 19.2 23.6 18.6 25.3 20.2 E N S
T O T L 5145 3534 31 17 2520 5e4 SPLS
AVERAGE
+ 26.7 15.2 28.6 21.7
-"= 23.3 19.0
134 914
+ 35.0 31.7 31.4 50.2
38.9 19.8 27.5 25.3
30.9 15.3 28.7 20.2 + 25.0 10.8 20.5 13.9
32.5 22.0 27.3 25.9
46.9 22.4 44.3 58.9 1213 1776
45.8 26.7 33.8 n.9
40.1 31.2 27.1 29.8
16.3 8.0 23.8 24.5
37.2 n.o 28.8 36.6
18953
190

TABLE 4
ELEKNT Pb (ppn)
I I
82E 7.18 9.71 9.'73 45.2 729
82F 24.9 45.3 43.9 73.8
313
82K 10.4 8.43 12.1 9.8
4 85 62
I 213 I 82L 14.86 5.55 1 3.83 3.18
30
92H I I 435 I 298
92 I 4.65 29.2 2.67 2.78 155 71 Z
920
t7z"p SPLS
"
250 1 1:: 1 77 1 :23 154.5
245 439 131 3
547 1'33 1223
43.5 139 21.7 115 28.0 97.2
51.0 167 13.7 24.2 20.4 25.3 29.8 22.1 34.2 191 -
5.56 6.89 1 3.84 3.88 1 I 1 5.08 6.50
3.23 2.86 3.35 15.4
2.98 10.4 4.70 18.6 778
2.23 2.27 2.05 1.40 3.24 2.80 3.13 5.41
336 435
28 I
17,, n 7 a
401
6.06 7.33 1 2.40 1.94 1 8.15 10.76) 7.85
32
93 1 75 1 26 1 1; 1 ~ li9; 6.42 13.3 14.8 39.7 6.08 4.41 9.49 24.7
248 259
17.4 84.1 5.25 9.94 12.4 B1.4 10.8 42.2 9.72 57.6 -
31 09 2520 584 18950
191

TABLE 5
ELEMNT N1 I p p d
I92

TAELE 6
ELEMNT CO (ppn)
R C U TiPE
w SHEET
82E
82F
82K
82L
82M
92H
92 I
92J
920
92P
93A
938
1031
1 OJP
104N
1040
104P
WE I GHTED mANS
TOTAL SPLS
193

E SHEET I 82E
92 J
920
1 OJP
104P
WE I GHTED
I SPLS
194

TABLE 8
ELEMNT As (ppnl
r 9 z H 1 7.82 48.6 1 10.929F.0 I 435 I 1 134 I ,914 1 13.3 33.1 9.98 37.9
92 I 6.55 18.2 4.09 14.6 30.0 32.1
92J ! 6.06 16.3 1 25.1 45.0 I I I 155 273 36
i 431 I 219 1 I 1 920 7.49 11.7 6.04 14.9
110 5.54 9.58 1.62 1.48
343 1 159 1 43 - 92P 1.96 5.61 4.01 10.5
171 447 2 . ~ 6.46 ' 1.3 0.72
160 _ _ ~ ~ 93A
25
1 4.09 4.5 I 8.56 18.7 1 5.79 1 64 189 336 435 94 89 ~ 1 . d
930 I 1 2.69 6.8 I 1 4.23 9.37 ! 4.25 2.95 ! 5 .w 7.20 ~ 3.64 7.72 i 312 255
1031 1.12 2.45 2.93 5.1 0.73 0.64 3.02 2.06 1061 259 41 7 30
28
103P 5.33 13.5 21.4 23.5 357
104N 4 09 147
- - .- ~
1040
SPLS
195

TABLE 9
m MAN WAN Kffl KAN m c . S.0. m c . S.O. NO. SPLS. No. SPLS.
82E 2.01 4.11 2.05 3.81
"
1.60 1.32 2.05 2.66
82K 1.88 3.33 1.40 1.19
I 82L 11.99 2.96 1 1.66 1.59
213 1 30
1.94 1.66 1.40 0.84
92H 1.45 1.21 1 .72 1.28
1.46 1.38 1.40 0.81
435
920 1 110 343
92P 1 2.41 5.51 I 1.62 3.14
938 1.12 0.52
1.51 3.93 2.02 5.24
3.01 10.6 2.96 3.35
104N 2.56 2.79 1.60 1.11
1040 3.03 3.85 1.68 1.80 418
104P 3.01 3.19 2.03 2.64
WEIGHTED 1.91 4.56 1 .81 8.71
145
pF" SPLS
1.28 0.92 250
1.16 1.33 252
1.86 1.60
-~ ~
541
1.68 1.22
." 134
2.08 1.21 452
2.61 3.62 36
1.49 2.41 336
1.48 1.11 41 1
2.73 5.95 0 3
1.14 3.21
31 11
11 23 1543
1.50 2.26 1.61 1.79 439 1318
1.56 0.95 1.63 0.85 1.12 2.14 1 1.11 2.18 ___ _______.
116
1.51 1.05 1
t t s 1 I
4 I -t I
81
1.56 1.13 I 1.50 0.88 1.19 4.65
1308
489 ~ 115 1150
I 1.54 2.28 1 .58 1.49 "+"-"++"I-+\ 1 34 1 20 1 59 1 48
I 82 512 - ~.~ "
1.19 1.14 1.76 2.22 90 780
1.08 0.46 1.47 1.08 1.21 0.69 1.34 2.90 159 1 43 -
1.32 1.23 I 1.40 0.82 I 1.41
"" " 160 1 %: 1 1; 1 862 1 1.89 9.91 1.11 0.56 1.16 0.14 2.06 15.5 43 5 1220
1.18 0.68 1.32 0.82 1.08 0.35 1.15 0.69 ." "_
i 28 39 702
1 2.20 3.19 1 1.68 3.62 351 21 24
2.30 8.30 2.53 8.60
248 259
+ j 3416
I 18953
196

TABLE IO
ELECMT Hg (ppb)
Rw( TYPE
WP SHEET
82E
- 82F
82K
- 82L
- 82M
92H
92 I
92 J
920
92P
93A
938
1031
1 03P
104N
1040
104P
K I GHTED E M S
TOTL SPLS
Kffl Kffl INTR
CONC. S.D. No. SPLS.
28.2 37.8 484
17.0 15.4 210
14.0 11.1 15
66.6 245 ..
43.9 28.7
432
20.1 25.4
1 53
144 567
429
81.7 36.1
110
49.5 22.8 169
65
29.2 43.2 1061
34.6 27.7
29.0 22.2
409
I51
39.0 133
3688
62 252
17.5 10.5 25.2 27.7 25.6 30.0 46.7 57.9 22.9 29.1
433 - 30 547 114 7 1 193 -
I I I I I 16.2 15.2 I 15.4 13.0 I 1 13.6 8.59
- 108 236
75.6 165
84
104 321 -
297 133
57.3 60.9 38.9 37.0 -
58.4 42.2 273 36
66.2 119
82
156 802 -
219 91 107 123
- 342
82.1 14.0 445
93.4 90.1 79.5 66.5 241 556 158 43 223
72.9 34.2 56.4 20.6 109 32.9 160
64.3 40.7 41.3 23.0 10.6 168 44.3 21.2 39.0 24.2 189 336 436 94 89
- 25 - 6 3 -
53.3 43.4 309
- 58.0 35.1 58.6 32.3 57.9 34.1
254 23 39 - 31.0 49.0 20.7 15.1 37.0 25.5
- 259 417 30 351
109 177 105 53.0
38.1 31.4
- 146 I I 121 2
86.7 140 I I 43.0 X.2 I 75.0 57.9 I 119 456 -
83 400 30 189 -
71.9 115 27.7 25.6 54.1 91.0 55.5 46.0 87.9 299
CONC. S.D. NO. SPLS. "i
30.6 €,5.2 I
76.3 232 908
570
81.4 59.5 881
2 4 56.4 104
-i l 2 2 i
56.8 38.6
21 24
"1 =I 13671
197

TABLE 11
ELEFENT U (ppnl
- 92H 2.45 5.49 4.75 8.90
3 93 1.80 0.75
113 3.50 1.15
761
92 I 3.61 4.80 2.28 2.77 2.05 0.97 1.99 0.97 1.69 1.06
225
92 J 3.76 6.03 2.28 2.59
155 36 273 82
2.84 5.52 3.15 5.10
572
429 718 90 219
920 3.23 4.31 1.78 1.48 1 09 343 881 227 43 159
1.67 1.09 1.85 1.96 1.53 0.19 1.28 0.91
92P 6.31 7.14
2.59 2.10 1.92 0.87 2.27 2.66 2.41 1.53 2.65 2.53 938
4.40 3.73 5.85 2.67 4.54 1.78 2.96 1.90 6.86 5.02 2.62 1.70 4.14 5.05 93A
863 60 25 160 447 171 3.53 4.60 2.30 1.49 1.58 0.51 2.86 2.29 2.97 4.04
64 1221 89 94 436 336 189
310 39 28 257
1031 5.60 1.68 2.97 1.50 3.59 2.53 2.89 2.94
103
1061 21 24 357 30 259
3.77 6.21 1.60 2.14 3.64 3.98 10.3 9.62 103P
41 7 2.98 2.12 4.40 5.84
404 1208 1 46 1767
104N 31.1 44.3 2.85 1.68 1 52
8.17 16.0 11.4 Zl.2 4.36 14.2 2.09 0.73 83 8 83 190 32 401
1040 10.1 15.4 5.23 5.64 5.52 5.48 3.90 2.70 6.49 11.7 6.61 11.4 16.6 18.9 418 161 26 75 93 1 01
104P 21.6 30.3 3.18 2.05
892
59 3.61 6.15 5.12 11.1 6.78 9.82 3.45 6.35
145 801 64 259 248
WEIGHTED 6.50 13.6 3.54 7.09 3.54 5.45 5.14 8.28 7.19 9.34 3.09 4.73 11.1 19.6 M A N S
TOTAL 18198 3450 584 2524 31 20 3457 5095 SPLS
198

ELEMENT
~
ELEMENT
~
Figure 70. Map sheet averages for the 10 elements analysed for each rock type group (continded on page 2001.
199

r
Figure 70 Iconfinuedl: Map sheet averages for the 10 elements analysed for each rock type group.
200

'7 1
I I
Figure 71. Map sheet average for zinc for each rack type group.
201

Figure 72. Map sheet average for copper for each rock type group.
202

I -. I 1
I I
Figure 73. Map Sheet average for lead for each rock type group.
203

I - ' '+- I I 1
Figure 74. Map sheet average for nickel for each rock type group.
204

K I
I , .
"
1r
Figure 75. Map sheet average for cobalt for each rock type group.
205

I "
I I
ELEMENT
206

Figure 77. Map sheet average for arsenic for each rock type g r o w
207

208

ELEMENT
.~
209

I I
Figure 80. Map sheet average for uranium for each rock type group.
210

INDUSTRIAL ZEOLITES AND RUTILE
By 2. D. Hora and Y.T.J. Kwong
RUTILE (Titanium Minerals in Porphyry CopperIMolybdenum Tailings)
Recent studies on alternative sources and relevant occurrences of titanium minerals lfor example, IForce, 1976; Williams and Cesbron, 1977: Force, et a/., 19791 indicate that porphyry copperlmolybdenum de- posits could potentially supply a significant amount of byproduct titanium. Llewellyn and Sullivan 11980) investigated the feasibility of recovering rutile from mill tailings from the San Manu8:I copper deposit of Arizona: they contain 0.75 ~ ~ e r cent titania. In view of these studies and as part of an industrial minerals assessment in British Columbia. a systematic examination of tailings from porphyry c:opper/molybdenum mines was initiated in 1982. Fourteen mines were chosen for the study. Cursory TiO:! analyses are shown in the accompanying table. Most carry interesting amounts of titania; that is. employing an arbitrary cutoff grade of 0.50 per cent TiO,; about half of these mines are of potential interest. Close examination of a high titania sample from the lngerbelle orebody of Newmont Mines Limited revealed little variat on in titania content in various size fractions; host minerals for titanium include ilmenite, sphene, magnetit,.'. and mica. Similar detailed work is in progress for the other interesting deposits. If rutile, the most desirable titanium mineral for industrial purposes. i s identified as a major titanium-containing species in a deposit. a feasibility test of mineral recovery will also be attempted,
ACKNOWLEDGMENl
We thank the management of the mining companies listed in the accompanying table for supplying the majority of our t e s t samples. R . Hibberson, P. Ralph, and V. Vilkos of the Analytical Laboratory con^
tributed in the analysis of titania.
FROM SELECTED PORPHYRY COPPERIMOLYBDENUM DEPOSITS TiO, CONTENT OF TAILINGS
IN BRITISH COLUMBIA
NAME OF MINE
Afton Beli Bethlehem Boss Mountain Brenda
Gibraltar Equity Silver
Granby Granisle Highmont
KitsaUlt Island Capper
L0,"eX
Newmont
SAMPLES NO. OF
10 8
2 6
4 7
5 2 8 7 6 4
12 9
RANGE
0.54 - 0.68 0.34 - 0.64 0.35 - 0.43 0.14 - 0.34 0.30 - 0.43 0.81 - 0.97
0.51 -0.61 0.43 - 0.43
0.40 - 0.78 0.30 - 0.43 0.49 - 0.87 0.49 - 0.57 0.30 - 0.43 0.33 - 0.97
PER CENT TiO,
MEAN
0.62 0.49 0.39 0.23 0.38 0.84
0.56 0.43
0.56 0.31 0.57 0.56
0.67 0.35
STANDARD DEVIATION
0.05 0.08 0.06 0.07 0.0,i 0.03 0.0'1 0.03 0.1 3 0.0 5 0.1 ' 5 0.0.1 0.0'5 0.21
21 1
ldegroot
1983

ZEOLITES
PRINCETON AREA (49" 26' - 120° 33';92H/7)
A random sampling program for industrial zeolites in volcanic sedimentary rocks has been underway since
these rocks in the Allenby Formation of the Middle Eocene Princeton Group. Results o f previous sampling 1980; this year produced the first reported British Columbia locations of substantial zeolite content in
of tuffaceous deposits from the Penticton area, the vicinity of Kamloops and near Burns Lake, have been
volcanic ash beds. Clinoptilolite (approximately 25 t o 35 per cent) together with similar quantities of negative. High zeolite content in the Allenby Formation occurs in pale grey to yellow to yellowish grey
stilbite form the main component of this fine to coarse-grained devitrified ash. Three samples with high
3 approximately 5 kilometres southwest o f Princeton. zeolite content are part of the sequence of volcanic sandstones and tuffs exposed in a road cut on Highway
REFERENCES
Force, E. R. (1976): Titanium Minerals in Deposits of other Minerals, U.S. Gee/. Surv., Professional
Force, E. R., Czamanske, G. K., and Moore, W. J. (1979): Rutile from Porphyry Copper Deposits:
Llewellyn, T. 0. and Sullivan. G. V. (19801: Recovery of Rutile from Porphyry Copper Tailings, U.S.
Williams, S. A. and Cesbron, F. P. (1977): Rutile and Apatite: Useful Prospecting Guides for Porphyry
Paper 959-F, 5 pp.
Technical Program, Society of Mining Engioeers, Feb. 1980, Las Vegas, p. 21.
Bureau ofMines, Report of Investigations 8462, 18 pp.
Copper Deposits, Mineralogical Magazine, Vol. 41, pp. 288.292.
212

INDUSTRIAL MINERALS AND STRUCTURAL MATERIALS
By 2. D. Hora
The 1983 field work consisted of property visits and examinations throughout the Province. The following descriptive report highlights magnesite, barite, limestone, and building stone prospect:;.
MAGNESITE
DRIFTWOOD CREEK AREA (50'54'- 116°34';82K/151
This new occurrence is in the Upper Purcell Mount Nelson Formation of Proterozoic age (Fig. 81) . Medium t o coarse-grained crystalline magnesite of white t o yellowish white and pale grey colours forms steep
O-
n DRIFT a MEDIUM-GRAINEDWHITE TOlELLOWORTHOOUART21TE
SLATY PHYLLITE
FINE-GRAINED DARK GREY CHERTY DOLOMITE
@# MEDIUM TO COARSE~GRAINED MASSIVE MAGNESITE
MEDIUM 10 COARSE-GRAINED MAGNESITE WlTH CHERlY Uf0S AND LENSES
ZONE OF MILKYOUAIITZ STOCKWORK.. . . . . . . . . . . . . . . X x x X
TEST QUARRY A . . . . . . . . . . . . . . . . . . . . . . . . . . . . . . . . . .A0 CLAIM POST IRED BOX 3 6 d l . . . . . . . . . . . . . . . . . . . . . . . . . . . . . .O
Figure81. Driftwood Creek magnesite. 82Ki15
213

southwesterly dipping beds (85 degrees) in a zone approximately 110 metres wide. While the upper main 45 metres of exposed magnesite is a massive rock with no visible impurities, the lower 65 metres contains cherty lenses and blebs of variable proportions, reaching up to 50 per cent o f the rock. Within the lower zone there are two continuous massive magnesite beds 2.2 metres and 4.5 metres thick. In June 1983, a sample for metallurgical testing was taken a t this site from two newly opened test quarries.
The main massive magnesite bed (upper zone) extends along strike for a t last several hundreds of metres; it may continue for more than 1 kilornetre.
MgO Per Cenr Per Cenr Per Cenr Per Cent Per Cent
cao S O , ALO, Fe* 0,
Test Quarry A Test Quarry B
42.5 4.20 2.5 40.0
0.06 6.00
0.77 4.6 0.13 0.82
The showing is on the northwestern end of the rocky ridge on the northern side of Driftwood Creek. The test p i t site can be reached by Driftwood Creek logging road and is 9.6 kilometres northwest from the Bugaboo road intersection.
BARITE
PEDLEY MOUNTAIN (50" 25' - 115' 43'; 82Ji5)
Barite is exposed on steep north-facing slopes 3 kilometres northeast of Mount Pedley a t an elevation of
approximately 1800 metres (Fig. 82). The showing consists of brecciated barite in a vein with many irregular offshoots and branches; i t has a general strike of 30 degrees and dips 80 degrees southeast. The
SECTION A-Pi iFOR LOCAllON SEE ACCOMPANYING PLAN VIEW1
A
Flsure 82. Pedley Mountain barite.82J15.
214

barite is exposed in two areas separated by a vertical distance of approximately 100 metres. The barite
component. The surrounding rocks are massive. brittle dolomites of the Upper OrdovicianiLower Stlurian is white in colour and coarse grained; galena in scattered grains and aggregates i s a common accm?ssory
Beaverfoot Formation. The dolomites, which are greyish brown in colour a t this !;ite. strike east-west and dip 20 degrees to 40 degrees to the north. In 1982-83, Bar-Well Resources Ltd. of Calgary lnined several thousand tonnes of Pedley Mountain barite ore; it was processed in the Windermere plant The mining road to the site starts a t a point on the Old Settlers road, 8 kilometres north of the Palliser River logging road and 1 kilometre south of the Pedley Creek bridge.
WINDERMERE (50" 26'- 115'53'; 82J/5)
inally described in 1970 by J. W. McCammon. Mining on this property from 1981 to 1983 pro'juced Irregular patches of barite from the west-sloping sidehill 8 kilometres southeast of Windermere were orig.
more than 10 thousand tonn8s of baritic ore.
The original showing consisted o f barite lenses and offshoots developed within and near a mylonitic shear
sporadic pods, short veins, and breccia zones of barite were exposed in an area approximately 500 metres zone that strikes east-west (105 degrees) and dips 20 degrees south. In addition to the main shcswing,
to the southeast (Fig. 83). The barite occurs in massive, fine-grained, light grey Upp?r Jubilee dolomite; there is an almost complete absence of recognizable bedding. Barite in all these showings is coarse grained and milky white with occasional grains of galena and less common copper stains. Thr location and ;access were described by McCammon (1971).
I
0 JUBILEE FORMATION DOLOMITE OUTCROP AREA
[zi BARITE
TRENCH . . . . . . . . . . . . . . . .
: , ',..I :". ... j , ..: ... . .i . .
...!. i
. .
I Figure 83. Windermere barite.82Jil5.
LIMESTONE
BOWRON RIVER (53" 42'- 121" 42'; 93H/12)
In 1983 a banded grey marble of the Lower Cambrian Mural Formation was developed into a small quarry by Western Lime and Marble Inc. of Prince George. The quarry is located on the eastl:rn side of Bowron
215

The rock is medium grained and massive; it is processed on the site into agriculture grade limestone. A River, 27 kilometres south of Highway 16, and can be reached by both Giscome and Bowron logging roads.
random sample of the crushed rock provided the following analysis:
per Cent Per Cent Per Cent Per Cent Per Cent
46.8 7.60 0.34 0.08 0.1 1
cao MgO SO, A 4 0 3 Fe, 0,
BUILDING STONE
McGREGOR PASS (53'58'- 120" 14';93H/16)
Massive beds of beige-coloured orthoquartzite of the Lower Cambrian Mahto Formation are quarried in
elevation of 1 700 metres north of Wishaw Lake (Fig. 841. large blocks for building-stone applications. The quarry site is located on the continental divide a t an
MAHTO QUARTZITE OUTCROP
PINK TO BEIGE COLOURED MASSIVE QUARlZIlE
1W 6W
HfIWfS
J TEST QUARRY.. . . . . . . . . . . . . . . . . . d
Figure 84. McGregar Parr quartzite. 93H/6
The rock is a massive. fine to medium-grained, cross-bedded quartzite. The test quarry opened quartzite beds with beige to pink-coloured stripes and irregular smears. In appearance, the quartzite can compete with the best commercial marbles. In the quarry, the quartzite splits along bedding planes of 1.0 metre to 2.0 metres apart; in several cases the separating bedding plane has a very uneven deeply dotted surface
one third of the exposed 300-metre to 350-metre width of Mahto quartzite a t Wishaw Lake constitutes like wet sand after a hailstorm. The beds strike uniformly a t 70 degrees and dip 28 degrees south. About
the commercially interesting beige and pink-coloured rock.
The physical properties of this brittle, but very strong and competent rock are comparable to the best
evenly distributed high lustre by polishing. varieties of granite on the buildingstone market, but it is more difficult to achieve the same closed and
216

REFERENCES
Campbell. R. B., Mountjoy, E. W.. and Young, F. G. (1973): Geology of McBrNde Map-Area, British
Henderson, G.G.L. (1954): Geology of the Stanford Range of the Rocky Mountains, 5.C. Minktry of Columbia. Geol. Surv., Canada, Paper 72-35, 96 pp.
McCammon. J. W. (1971): Barite, Lucky (Cameron), 5.C. MinisrryofEnergy, Mines& Pet. Res., Geology, Energy, Mines & Pet. Res., Bull. 35, 84 pp.
Mclntyre, J. F. and Mclntyre, R. F. (1983): Report on Engineering. Geology and Feasibility Consider- Exploration and Mining in British Columbia, 1970, pp. 487, 488.
ations, Proposed Wishaw Lake Quartzite Quarry. Private Rept.. Canroc International Corporation, British Columbia, 129 pp.
Reeror. J. E. (1957): Lardeau, British Columbia, Geol. Surv., Canada, Map 12-1957.
217

O T H E R I N V E S T I G A T I O N S
A PRELIMINARY ASSESSMENT OF ZEBALLOS MINING CAMP
(92L)
By M. C. Hansen and A. J. Sinclair A MINDEP PROJECT
Department of Geological Sciences, University of British Columbia
INTRODUCTION
This report updates and expands a preliminary report published last year on assessing resource potential of gold quartz veins in the Zeballos camp (Sinclair and Hansen. 1983). The Zeballoi camp is located on the west coast of Vancouver Island (Fig. 85).
SCALE
OR14
f... +,.. 1 2 8 W 121w
Figure 85. Location map of the Zeballos mtning camp
This evaluation was initially oriented toward a quantitative resource assessment following the approach of Sinclair (1979) and Orr and Sinclair (1971). To this end a data file was construc:ted (see Sincleir and Hansen, 1983, Table 1) to form a basis for quantitative evaluation.
of geological features, particularly structure. This was hampered to a certain extent by a lack of field Because of the scarcity of quantitative data the study was broadened to include a qualitative assessment
observations.
219
ldegroot
1983

n W z I h
a, C C
0
cn W
. c
Y
n a CT (3
a
a
a
>
W u [r w >
100
50 i 0
-0 0
0 5 0 MAJOR PRODUCER
0 OTHER 0 MAJOR PRODUCER 0 OTHER
1 I I * , , I I I I , , I I 5 10 50 100 500
AVERAGE Ag GRADE(g/tonne)-MINED Figure 86. Plot of average gold grader (grams per tonne1 versus average silver grades (grams per tonne) for Zeballar vein
deposits.
1 0 ' ~
0
1 0 8 - 0 0
0
8 105 - 0 MAJOR
0 0 OTHER
104 - 0
lo3 - 0
0 0
102 - I
10-2 10-1 t 10
AVERAGE Cu GRADE (Kg/tonne)-MINED Figure 87. Total gold content (grams) versus average copper grader (Percentage1 for Zebalmv vein dewsit$.
220

DATA BASE
The data have been compiled (Sinclair and Hansen, 1983) from two primary sources of information: a report and map by Stevenson (1950) and the MlNFlLE computer file of mineral deposits in British Columbia maintained by the British Colu,mbia Ministry of Energy, Mines and Petroleum Resources. These tables are reproduced in updated form in an appendix. For comments on the terminology used, please refer to Sinclair and Hansen (1983).
STATISTICAL METHODS AND RESULTS
The following techniques all utilize the data as listed in Tables 1 to 5 in Sinclair and Hansen (1983:l. The small number of observations for which production data are available is a significmt drawback which limits the potential of using multivariate techniques. Nonetheless, there are some int,?resting relationships and trends apparent, as described following. Those variables which do not display an approximately normal distribution, for example, all production data, are log normal and were invariably log transformed. No other transformations were considered necessary.
LINEAR REGRESSION
Selected plots of the more significant relationships are discussed, with the associated statistical values listed in Table 1. Precious metal contents (gold and silver) when plotted versus production (Sinclair and Hansen, 19831 showed good correlation between 'mined tonnage' and both gold and silvi!r content, therefore production tonnage is an acceptable single measure of relative value of vein deposits of the Zeballo!; camp
constant. This would be of significant interest t o any future producer a t the camp. Average g o k grade (compare, Sinclair, 1979). The corollary is that average grades among the larger producers are relatively
of two clusters suggests that this may be a t least partly artificial. Nonetheless the cluster represent,ng the versus average silver grade is shown on Figure 86. Although the correlation is high (r = 0,815). the existence
larger producers is valid. It can be seen that gold grade is considerably higher than that of silver, the mean ratio is 2:3. with a standard deviation of 1 :3; for the larger producers these values are 2:3 and 0:5 respec- tively.
TABLE 1. LINEAR REGRESSION DATA
DEPENDENT INDEPENDENT NUMBER OF DEGREE OF CORRELATION RELEVANT VARIABLE VARIABLE OBSERVATIONS FREEDOM COEFFICIENT FIGURE
REGRESSION EOUATION LogMlNE = 1.23.LogTOAU - 2.46 LogMlNE LogTOAU 17 16 0.989
LogMlNE LogTOAG 15 14 0.975 REGRESSION EQUATION LogTOAG = 1.18.LogTOAG - 1.94
2.1
2.1
LogGRAU LogGRAG 15 14 REGRESSION EQUATION LagGRAU = 0.75.LogGRAG = 0.59
0.815 2.2
LogTOAU REGRESSION EQUATION LogTOAU - -1.62.LogGRCU + 3.61
LogGRCU 11 10 -0.962
REGRESSION EQUATION LogTOAU = -0.0019.DSTC + 6.38 (within stock) LogTOAU DSTCltvel 8 7 -0.637
LogTOAU DSTV(-veI 9 8 0.713 REGRESSION EQUATION LogTOAU = 0.0011.OSTC + 5.38 ( i n wallrock)
ABBREVIATIONS:
2.3
2.4
2.4
MINE = mined tonnage per deposit (tonne) TOAU. TOAG = total grams gold per deposit. total y a m s silver per deposit GRAU, GRAG, GRCU i= grade of gold in grams per tonne, grade of silvev in grams per tonne. grade 01 copper in
OSTC = distance from the Zeballor stock mntact kilograms per tonne
221

On Figure 87, total grams of gold per deposit are plotted against average grade of copper. The good negative correlation over several orders of magnitude suggests copper grade may be an indicator of deposit relative value. However, this correlation may be partly artificial, as a result of selective up-grading o f ore in the small deposits. This relationship is discussed further in the following section on multiple regression.
When a plot of deposit relative value (total grams of gold per deposit) was made against distance from the contact of the Zeballos stock (Sinclair and Hansen, 1983; Fig. 106). the graph showed a remarkably con- sistent pattern both in the stock and in the country rock. The equations describing these trends are given in Table 1. There is potential for this relationship to be used as a value estimate for any deposits remaining to be discovered. However, two assumptions are implicit in this relationship. First, the measure of distance
considered. Second, the Zeballos stock is considered to be the only Tertiary intrusive in the vicinity; from the contact is in the horizontal plane, potential influence of variation in the vertical plane is not
this may not be true.
MULTIPLE REGRESSION
The method used is called backward stepwise regression; in it, only the most significant variableis) are retained in the equation at the final step. Although the potential o f this method is severely limited by the small number of observations available, it has provided insight into which variables may reflect the mineralizing process.
Numerous runs were made using different dependent variables and combinations of all or some independent variables; in addition the numbers of observations used were varied.
content per deposit. Elevation was used as a dependent variable in an attempt t o define any zoning which Naturally the most significant dependent variables as value indicators are mined tonnage and total gold
may be present. The data are too sparse to allow any meaningful correlations.
The use of mined tonnage or total gold content as dependent variables restricts the number of observations to 18 and 17 respectively. I f complete observations are desired the restrictions are even more severe, generally less than 10 or so observations. Where observations are incomplete, mean values are substituted for missing data. The results often do not appear significantly different in such cases.
The most significant independent variables, in approximate order of decreasing significance, are: grade of copper (GRCU). grade of gold (GRAU), bearing from the northwest nose of the Zeballos stock t o the deposit (BRGN). distance to the contact (DSTC). average minimum vein width (MNVW), grade of silver (GRAG). grade o f lead (GRPB), distance to the nose of the stock (OSTN), strike of the major vein(s)
six are considered to be of geological significance. The variables DSTN and STRl were dropped primarily (STRl ) . This order varies depending on the nature of the other parameters. Of the nine variables only
because of their low rating in various statistical runs. In addition, the values for STRl are averages and would be diff icult to determine for a raw prospect.
The variable MNVW. although useful, was dropped for two reasons: i t is an empirically determined value, and it i s of no quantitative value when considering a prospect with limited vein exposure. The variables GRAG and GRPB were retained because they are quantitative production data and represent information which is relatively easy t o obtain from a prospect. The variable BRGN was retained solely because of its significance in the regression analyses. It is di f f icul t to explain geologically except insofar as i t is pre- sumably an indirect measure of other variables of significance. as discussed elsewhere (for example, position and orientation of shears).
Data resulting from the use of these six variables are presented in Table 2. The cases presented demonstrate the type of results obtained. Features of interest are: the high values for R 2 (that is, that fraction of total
222

variance explained by the relationship), the generally low standard error (around a half order o f magnitude over five to seven orders of magnitude). and the persistence of GRCU as the retained independent variable. It appears that the grade of copper is of considerable, unexpected significance in ternis of available data. This supports the conclusion in the previous section that grade of copper may well be useful as an indicator of potential value of a deposit.
CLUSTER ANALYSIS
Much of the data file consists o f attributes, that is to say, measurements recorded on a nominal scale and having discrete values. Although such data may be evaluated empirically, it was considered that more significant results might be derived using a parametric statistical technique. It was #desired to group the data from Associated Minerals using cluster analysis, after ensuring that it was valid to use such data in
not be determined empirically. The higher orders of clustering did not appear to be gedogically signi~ficant. such a manner. The lower orders of clustering were meaningful, but did not provide information that could
It was presumed, therefore, that there is no practical grouping of observations within these data, other than what can be determined empirically.
GEOLOGY AND MINERALIZATION
GENERAL
The geology of Zeballos camp, as shown on Figure 88, consists of a northwest-striking, southwest-dipping
structure represents the southwestern l imb of a northwesterly trending anticline (Hoadley, 1953). con- sequence of Mesozoic volcanic and sedimentary rocks cut by Jurassic and Tertiary intrusions. The general
siderably disrupted by faults and inrrusions. The area to the north of the Zeballos stock and to the east of the North Fork of the Zeballos River i s tightly folded. The Lower Jurassic Bonanza Group is a typical island arc sequence, largely consisting of basaltic to rhyolitic volcanic rocks. This unit i s underlain con- formably by limestone of the Quatsino Formation. These two units are now thought to be separated by the Parson Bay Formation as elsewhere on Vancouver Island; this is described in detail following. Tholeiitic basalts of the Upper Triassic Karmutsen Formation form the base of the sequence in this area. These
position. The Zeballos stock with its spatially related gold-quartz veins is a quartz diorite phase of the bedded rocks are cut by Jurassic plutons of the Island Intrusions, mainly diorite to granodiorite ir, com-
Catface intrusions of Eocene age.
223

Figure 88. General geology of the Zeballor mining camp (modified from Stevenson, 1950).
Figure 89. Fracture trace diagram from Leballos mining camp as interpreted from aerial photographs. Scale is approximate because aerial photographs were used as a base. Several geological features are included as an aid to correlating thlrfigure with F i g u r e 8 8 .
224

STRATIGRAPHY
On Figure 88 the Bonanza Group is shown to contain units o f carbonate, calc-silicate, and tuff . According to Dr. J. E. Muller (personal communication, 1982). these units almost certainly represent the Parson Bay Formation; that is, these units would represent the northwest continuation of the formation as shown on the 1:250000 map of Nootka Sound (Geol. Surv., Canada, Map 1537A. 1981). The contact between Parsons Bay Formation and Bonanza Group is known to be gradational, as it would appear to b'e here. The Bonanza Group elsewhere on Vancouver Island is not known to contain any carbonate horizons, although sedimentary units do occur. The calc-silicate rocks adjacent t o the Zeballos stock presumably represent contact metamorphosed carbonate or carbonate-rich sediment. I f indeed these units are Parson Bay Formation, the implication is o f a more complex structure than was previously .thought to exist. The two horizons of Parson Bay Formation to the west of the stock seem to be a struciural repetition. This would suggest either a tight, doubly plunging syncline or fault-controlled repetition. -:he latter explanation
of the underlying Vancouver Group, is favoured because there is no evidence of folding, in terms of the attitude of the bedding or of repetition
contains the Answer and Golden Portal deposits. This gabbro contains fragments and boulders of un- In the extreme southwest o f the map-area (Fig. 88) Stevenson (1950) has mapped a Ibody of gabbro which
the Zeballos stock and perhaps the Island Intrusions. Compositionally it is distinct from the horrlblende replaced and partially altered volcanic rocks and is cut by diorite and granodiorite dykes which also cut
diorite of the Island Intrusions in that it contains "...labradorite instead of andesine, and considerable augite with only a minor amount of primary hornblende" (Stevenson, 1950). The Ipresence of pyroxene rather than hornblende suggests the possibility that this may be a feeder dyke (that is, subsurface equiva- lent) t o the Bonanza volcanic rocks, or t o higher level Tertiary volcanic rocks which hive since been eroded.
Beano). It is generally accepted that gold-quartz vein mineralization is intimately related to Tertian, intru- It is of interest to note that there are three gold producers in the immediate vicinity (Tagore, Golden Portal,
sions (for example, Carson, 1968) on Vancouver Island, yet the Zeballos stock is 2 i:o 3 kilometre!; away. In addition, a replacement deposit such as the Beano could be expected to l ie quite near the source of mineralization. Thus it is a t least possible that this gabbro is of Tertiary age.
There appears to be a close relationship between young dykes of a particular composition and the gold- quartz veins. Dykes which are the last phase of, or younger than, the Zeballos stock intrusion are of particular significance. Feldspar porphyries are intimately associated with the vein';; a stock of fddspar
with mineralization a t the Privateer and Central Zeballos deposits. porphyry occurs within the Mount Zeballos mine area. Orthoclase-rich granodiorite dykes are associated
FAULTING
Faulting in this and surrounding areas seems to have been the major structural response to deformation (Muller, Northcote, and Carlisle, 1974). With this in mind a fracture trace diagrams, reproduced lhere as Figure 89. was compiled from 1:20000-scale black and white aerial photographs, taken in August 1980. Because of the empirical nature of such data and the limited time available, only the major or obvious lineaments have been shown. In addition, the compilation has not been corrected for distortion. Our inability to check the features on the ground is a significant drawback to our interpri5tation of lineaments. Figure 90 is a rose diagram of all lineaments whereas Figure 91 shows only those lineaments greater than approximately 600 metres in length. This division was chosen by examining a histogram of all lineaments. Lengths up to about 600 metres define a normal population; lengths greater than 600 metres are a pro- nounced 'tail' t o this 'normal' population.
The distinct concentration in both figures a t azimuths of 150 to 190 degrees is thought to represent the continuation of the pre-Tertiary Hecate Channel fault of Muller, Cameron, and Northcote (1981). This fault has been mapped on Bingo and Friend Creeks by Hoadley (1953). The lineaments continue north
225

Figure 90. Rose diagram of al l fracture tracesshown on Fiqure89,
Flqure 91. Rase diagram of fracture traces longer than 600 metres as they appear an Ftgure 89
226

from these creeks and from the east side of the lower reaches of the Zeballos River. It i s thought that
fault. These faults and the accompanying lineaments are considered pre.Tertiary a i the faults are offset Hecate Channel fault continues, offset, on the north side of the Zeballos stock as the! north Zeballc's River
across the Zeballos stock and northisouth lineaments are rare within the stock. This conclusicn is in agreement with Muller,eta/. (1981).
Some of the lineaments representing Hecate Channel fault pass between the two horizons of Parson Bay Formation. Gunning (1932) considers the north Zeballos River fault has been downthrown to the east. The same sense of movement on the fault to the southwest of the stock (that is, cor iirluation of the Hecate Channel fault) would explain the repetition of the Parson Bay Formation.
as shown on Figure 90. Part of this population probably represents second orde! faults related to the Most of the lineaments fall within a large, rather poorly defined population between 030 and 100 degrees,
within the Zeballos stock: these might be related in part a t least t o cooling of the stcck. A well-developed previously discussed north-trending faults. Numerous eastiwest trending, generally short, lineaments occur
fracture pattern in outcrop is diagnostic of the Catface intrusions (Muller, personal communication. 1982). It is possible that such fractures may correlate, in part, with the aforementioned !set o f eastiwest linea-
trace analysis could well prove a fast and accurate method of determining 'age' of particular intrusions. ments for the Zeballos stock. I f such a correlation was found to be general throughout the area Iracture
Of the remaining lineaments, many fall within relatively well-defined zones, shown as zones A to E on Figure 89. Zone A, passing through the Privateer and central Zeballos deposits, appears to represent a fault zone which has offset the north part of the Zeballos stock to the west. Zone A correspond!, with a concentration of eastiwest-striking granodiorite dykes a t central Zeballos. Lineaments in Zone A are well defined on the photographs, however there is no mention of such a fault by workers in the area. Zones B to D define four groups of lineaments striking 40 to 60 degrees and locat,?d to the west of the stock. They may offset the Hecate Channel-North Zeballos River faults. In any event lineaments o. f Zones A to E appear to all represent the same age of faulting or shearing and may all correlate with Eocene or later faulting, that is, syn- (or post-) intrusive.
VEIN ORIENTATION
The strain ellipsoid of Figure 92 is modified after Stevenson (1950). On the basis c,f two major shears at Zeballos Pacific (035 degrees) and Big Star (090 degrees), along with some supporling data, he has con- cluded that planes of major shearing are oriented 035 degrees vertical and 090 degre(?s vertical. He derives
t
Flgure 92. Strain ellipsoid for Zebalios mining cam0
227

062 degrees vertical to the plane of tension. He concludes that this latter orientation is most important with respect to vein orientation and mineralization, “fractures and consequently veins formed under tension are the most favourable for ore ...” (80 to 90 degrees) correlating well with Zones A to E of Figure
degrees is illustrated on Figure 93. This example may be related directly t o Zone A of Figure 89 and 89 (040 to 060 degrees, 80 to 100 degrees). An example of rotational strain, using a shear direction of 085
confining pressures, as is indeed the case a t the camp. In other areas, the conjugate shear is more prominent No. 1 and No. 2 veins of the Privateer deposit. Brecciation and shattering can be expected under low
(namely. Zones B to E o f Figure 89).
N
POORLY OR NON-DEVELOPED , DRN OF CONJ SHEAR
ZONE OF NON-PLASTIC DEFORMATION
Figure 93. Conceptual model for development Of veinrand related structural features. Zeballos mining camp.
NOSE OF STOCK
There is a strong correlation between the northwest nose of the Zeballos stock and mineralization. In a general way the greater the distance from the nose, the fewer the deposits and the less productive they have
providing the best pathways for ascending metal-bearing solution. Naturally there are other relationships been. This is presumed to be a result of the extensive faulting and shearing in the vicinity of the nose
which obscure the picture to a certain extent, such as that between metal content and distance to the intrusive contact. A complicating factor may be the gabbro in the southwestern part of the map-area, i f this is Tertiary in age.
VEIN WIDTH
Most productinve veins show a wide range in width (for example 1 to 100 centimetres), but the bulk of such veins usually shows considerably less variation (for example, 10 to 30 centimetres). The latter variation is described, rather arbitrarily, as typical minimum and typical maximum vein width. Typical minimum vein width is o f considerable empirical significance. In general terms, productive veins can be
variation in width. There does not seem to be a correlation between vein width and width of the enclosing expected to have a typical minimum width of around 1 to 5 centimetres along with a relatively small
shear zone.
228

HOST ROCK
Host rock to the veins includes all rock types in the area. Particular host rock type appears to have no influence on localization of veins, except insofar as the physical properties of the rock determine how it will react t o deformation. Flexures appear to be favourable sites for mineralization. particularly in what is inferred to be Parson Bay Formation (for example, a t Privateer and Mount Zeballosl. Elsewhere on Vancouver Island the Parson Bay Formation is seen to be complexly folded, presumady because it reacts in an incompetent manner to deformation. The Bonanza volcanic rocks could be expected to react in a more brittle manner to deformation, thus more readily providing pathways and sites of deposition for migrating hydrothermal solutions. The presence of sharp bends or curves in the margins of the stock are also likely loci of deposition, as are areas of shattering and brecciation.
ASSOCIATED MINERALS
The sulphide assemblage characteristic of gold-quartz vein occurrences on Vancouver Island (for example, Bancroft, 1937; Muller and Carson, 1969; Carson, 19681 is pyrite. sphalerite, galena, and chalcopyrite. Arsenopyrite may be present and pyrrhotite i s relatively uncommon. There is a strong negative correlation between chalcopyrite (GRCUI and total gold among the producers as discussed earlier. Arsenopyrite. alone, does not seem to be related to gold content, however i f present in measurable quantity alon(1 with sphalerite, galena, and chalcopyrite there generally is associated high-grade (150 to 3 000 grams per tmne) gold. Quartz is ubiquitous, calcite locally accompanies mineralization, and ankerite is rare.
EXPLORATION PARAMETERS
The following parameters are intended to be applied to known vein(s1 under investigation a t Zeballos camp. However, it would not be unreasonable t o extrapolate the use of some parameters to s i r i lar veins elsewhere on Vancouver Island. It should not be assumed that these are the only factors inlluencing economic mineralization or that the interpretation of these observations is necessarily unique.
Spatial association of gold-quartz veins with the Eocene Catface intrusions is of primary importance. The best economic potential seems to be within 500 to 1000 metres of the contact of intrusive bodies greater than 2 000 metres in diameter.
aids in establishing pathways for the hydrothermal fluids. Brecciation of the intrusive andlor host rock, along with pre-existing or contemporaneous faulting,
Close association w f th late or post-Catface intrusion dykes is a favourable feature, in particular, (quartz) feldspar porphyry dykes and stocks.
Host rock type is important insofar as its physical properties determine its response to deformaion. For example, fracturing on fold crests may, in association with other factors, provide a suitable locus of deposition.
A folded or convoluted margin to the intrusion, or apophyses, might be expected to aid in the local-
The orientation of the vein and its enclosing shear, i f present, along with intersecting shear zo~es, is ization of mineralization.
of considerable importance. A t Zeballos rotational strain apparently produced :;hears orientatEd at 035 t o 060 degrees and 080 to 090 degrees (Fig. 941. When allied with tensional cavities and gash veins. they may have provided suitable s i tes for deposition of economic mineralization (Fig. 95).
The sulphide assemblage should include pyrite, galena, chalcopyrite, and sphalerite with or without arsenopyrite.
Average copper grade may be used as an aid in predicting potential total gold present. I f substantial sample data are available a multivariate linear model relating size to copper, lead, silver, and gold grades can be applied.
229

Figure 94. Rose diagram of vein orienfations. Zeballor mining camp.
Figure 95. Rose diagram of total gold production as a function of vein orientafion. Zebalior mining camp
230
The area of Zeballos camp is roughly 5 000 hectares and it might be thought that all veins in such a re- stricted area already have been discovered and exploited. However, aside from thc possibility of a con- cealed mineralization. the !rugged topography of the area, heavy vegetation, superficial cover on bedrock and the small size of the target may have prevented discovery of veins containing potentially economic minerals. In reference to the search for the White Star veins, Bancroft (1940) say; "Half a dozen pros- pectors searched the slopes for 4 months before finding the quartz in place .... 500 or 600 feet above the bed of the creek". This w a s after having found "...rich gold quartz float with granitic rock attached ..." in Spud Creek almost directly below the veins. It would seem that even today there Exists opportunity for new vein discoveries.
Alternatively, it rnay be that past producers have not been exploited fully, or non-productive prospects rnay have the potential t o become producers: our work is somewhat negative in this regard. Finally, it is important t o mention that we have considered gold in quartz veins only. Other deposit forms (skarn, replacement) rnay have potential in the Zeballos camp.
ACKNOWLEDGMENTS
of the Department o f Geological Sciences, University of British Columbia. I t has been undertakcn with
This study, financed by the Science Council of British Columbia, is part of the MINDEP research project
the cooperation of the Geological Division, British Columbia Ministry of Energy, IMines and Petroleum Resources. We would like to thank J. E. Muller of the Geological Survey of Canada for his advice and general comments. Technical assistance has been provided by A. Bentzen. P. Willon, British Columbia Ministry of Energy, Mines and Petroleum Resources, kindly provided a set of aerial photographs for our Study.
REFERENCES
Bancroft. M. F. (1937): Gold-Bearing Deposits on the West Coast of Vancouver lslarld between Esperanza Inlet and Alberni Canal, Geol. Surv., Canada, Mem. 204.
._........ (1940): Zeballos Mining District and Vicinity, British Columbia, Geol. Surv., Canada, Paper 40-12. Carson, D.J.T. (1968): Metallogenic Study of Vancouver Island with Emphasis on the Relationships of
......_.._ 11969): Tertiary Mineral Deposits of Vancouver Island. C.I.M., Bull., Vol. 62. No. 685, PIJ. 511-
.......... (1972): The Plutonic Rocks of Vancouver Island, Geol. S u m , Canada, Paper ;'2-44. Gunning, H. C. (1932): Zeballos River Area, Vancouver Island, Geol. Surv., Canada Summ. Rept., 1932,
Hoadley, J. W. (1953): Geology and Mineral Deposits of the Zeballos-Nimpkish Area, Vancouver Island.
Muller, J. E. and Carson, D.J.T. (1969): Geology and Mineral Deposits of Alberni Map-Area (92F). British
Muller, J. E., Northcote, K. E., and Carlisle. D. (1974): Geology and Mineral Depo;its of Alert Bay-Cape
Muller, J. E., Cameron, B.E.B., and Northcote. K. E. (1981): Geology and Mineral Deposits of IUootka
Northcote, K. E. and Muller, J. E. (1972): Volcanism, Plutonism and Mineralization: Vancouver Island.
Sinclair, A. J. (1979): Preliminary Evaluation of Summary Production Statlstics and Location C,ata for
Canada. Paper 79-18, in Current Research, Pt. B. pp. 173.178. Vein Deposits, Slocan, Ainsworth and Slocan City Camps, Southern British Columbia, Geol Surv.,
Mineral Deposits to Plutonic Rocks. Unpubl. Ph.D. Thesis, Carleron University.
520.
Pt. I I .
British Columbia, Geol. Surv., Canada, Mem. 272.
Columbia, Geol. Surv.. Canada, Paper 68-50.
Scott Map-Area, Vancouver Island, British Columbia, Geol. Surv., Canada, Paper 74-78.
Sound Map-Area. Vancouver Island, British Columbia, Geol. Surv., Canada. Paper 80-16.
C.I.M., Bull., Vol. 65, No. 726. pp. 49-57.
231

Sinclair, A. J. and Hansen, M. C. (19831: Resource Assessment of Gold-Quartz Veins, Zeballos Mining Camp, Vancouver Island - A Preliminary Report, 6.C. Ministry of Energy, Mines & Pet. Res.,
Sinclair, A. J. and Orr, J.F.W. (19711: A Computer Processible File for Mineral Deposits in the Slocan Geological Fieldwork, 1982, Paper 1983-1, pp. 291-303.
Stevenson, J. S. (19381: Lode-Gold Deposits of the Zeballos Area, B.C. Ministry of Energy, Mines& Pet. and Slocan City Areas of British Columbia, Western Miner, Vol. 44, No. 4, pp. 23, 24.
......_._. (1950): Geology and Mineral Deposits of the Zeballos Mining Camp, 6.C. Minisrry of Energy, Res., Miscellaneous Report.
Mines& Pet. Res., Bull. 27.
232

A PRELIMINARY REPORT ON RESOURCE ESTIMATION USING GRIDDED GEOLOGICAL DATA
I: GUICHON CREEK BATHOLITH (921/6, 7, 10, 11)
By A. J. Sinclair and A. Bentzen Department of Geological Sciences, University of British Columbia
INTRODUCTION
Many quantitative resource-oriented studies are based on geological variables quantified with respect t o cells of a regular grid superimposed on a geological map of an area. Cell size of the grid varies with the purpose and scale of a study as well as the detail with which geological information is known. In a regional
whereas Sinclair and Woodsworth (1970) used a 2 by 2-square-mile cell size for an estimation of vein study of British Columbia copper resources Kelly and Sheriff (1969) used a 20 by 20-square-mile cell
potential in the Terrace area of northern British Columbia, and Godwin and Sinclair (1979) extended the methodology to a grid cell size of 400 by 400 square feet over the Casino porphyry copper-molybdenum deposit, Yukon Territory.
The types of variables we are concerned with in quantitative, geology-based regiclnal resource r.tudies include:
( 1 ) percentage of a cell underlain by a particular rock type,
(3) spatial density o f dykes, fractures, and other features, ('2) distance from cell centre to a specific geological feature,
(4) lengths of contacts, dykes. and fractures contained within a cell, (5) surface area of the contiguous mass of a given rock type nearest a given cell
of their principal features is the large number of zero and 100 per cent values that result for variables of Agterberg (1981) discusses the form of the probability density functions of these types of variable:;. One
the type involving 'per cent of a cell underlain by a specific rock type'.
The present study has two specific goals:
( 1 ) to develop a general, computer-based approach for the estimation of quantitative geological variables as a basis for studies of regional mineral resource potential, and
(2) to apply the foregoing computer-based methodology to the Guichon Creek Batholith, host for an important proportion of known copper resources in British Columbia.
PROCEDURE
A general procedure for a quantitative computer-based approach is given by Sinclair and Bentzen (1983). Two general stages are as follows:
(2) application of an appropriate mathematical approach to an evaluation of the quantitative data base. ( 1 ) quantification of geological variables using a computerized approach, and
233
ldegroot
1983

The former step involves digitizing and editing of map information, and application of a series of computer programs to measure geological variables relative to an arbitrary grid. The latter step depends to a con- siderable extent on subjective decisions. A general methodology for quantification of geological variables, illustrated by Sinclair and Bentzen (1983). emphasizes the digitizing and calculation phases.
The principal advantages of a computer-based procedure are its consistency, the ability to build in a variety of editing procedures to detect errors in the data base, and the ease with which new variables can be added or old variables changed. The ease with which a completely new set o f variables can be generated for a new cell size or a new grid origin of a grid is particularly noteworthy.
Once the data are available a se t of control cells must be selected: these are used to generate a mathematical
function analysis, and a variety o f probabilistic procedures have been used as a means of developing such model for value or potential in terms of the measured geological variables. Multiple regression, discriminant
within a cell represent the dependent variable and our measured geological variables (appropriately trans- models (Agterberg, 1981 ). Here we will stress a multiple regression model in which known mineral resources
formed i f necessary) are the independent variables. Once a satisfactory model has been established for the control cells, it is applied to the remainder or target cells as a means of estimating their mineral potential.
DIGITIZING GEOLOGICAL INFORMATION
Digitizing of geological information (outlines of areas underlain by rock types, linear features,etc.) proceeds as follows:
(1) In general, a contact is traced with the digitizer cursor completely around a given geological feature.
(2) Enough points are digitized so that the resulting polygon appears to be a smooth representation of the original outline when plotted a t the original scale.
(3) Each polygon is numbered and catalogued.
(4) The number of a polygon is placed in the comment field of the first point of that polygon
(5 ) I f any point along a polygonal outline represents an intersection or 'meeting' of contacts, that point is labelled as a node in the comment field.
again, and edit out the error segment.
I f a digitizing error is made by an operator it is often possible to return to the nearest node, begin digitizing
A digitizing program was written in FORTRAN IV using University o f British Columbia system subroutines to read the cursor o f the digitizer. The program corrects for displacement from the origin and for skewness (where the map has not been placed parallel with the x and y axes of the digitizer). A digitized point is
consisting of four fields as follows: read into memory where it i s stored until output as a file. Each digitized point corresponds to a record
FIELD DESCRIPTION
1 4 characterr (MOVE. DRAW, or SAME)
4 Comment field of 8 characters 2. 3 x and v coordinates written in FORTRAN FORMAT 12G15.7)
The operator can choose freely when to use the Comment field
234

EDITING OF POLYGONAL (DIGITIZED) INFORMATION
Three procedures are used for editing digitized polygonal information. Two, ADEND and EDTEiK. are programs written by one of us (A.B.), the third is the text editor supplied by the operating System (MTS). In a digitizing session a number of polygons normally would be placed in the same iile. The first part of the editing process is t o assign polygons to separate rock type files.
The editing program presents one polygon a t a time to the operator and ADEND allows the oper,ator to assign a 'flag' to separate polygons. ADEND is used on a TEKTRONIX 4010. The operator selects the number of points to be displayed on the terminal by a trial-and-error process and isolates a polygon - a flag is then added and the operator continues with the next polygon. During this phase of editing i t is possible to 'repair' errors in the digitizing process (for example, the deletion of erroneous segments). In addition, polygons must be closed for future use so it is important to verify that thl? last and first points are identical. Finally, the nature of area determination program is such that digitizing should be in an anti- clockwise direction. Consequently. a t this stage any polygons digitized in a clockwise direction must be reversed.
EDTEK is used on a TEKTRONIX 4010 and permits the display of polygons as well as a limited amount of editing. One point or several points a t a time can be moved back and forth through a polygon thus allowing repair of digitized lines. In addition, plotter directives can be changed; for example, 'NIOVE'can be changed to 'DRAW'. Another plot directive 'NOPE' (meaning NON-OP) was added which effectively eliminates a point without actually deleting the coordinates.
A t this point in the editing there should be one file for each geological variable. In the case of a rock type, the file contains as many polygons as there are separate outcrop areas. A program CIiKPL is used to verify that each polygon is constructed in a counter-clockwise manner.
A final editing stage involves the recognition of 'islands' of a second rock category within a poly!~on sur- rounding an area of a diffetent rock category. These 'islands' were coded as clockwise polygons attached to the perimeter of the surrounding polygon.
An example of edited polygons is given by Sinclair and Bentren (1983) for the border phase of the Guichon Creek Batholith.
MEASUREMENT OF GEOLOGICAL VARIABLES
All variables are to be measured relative to individual cells of an arbitrary grid superimposed on a field of geological data. The types of variables referred to earlier (see Introduction) inclusje area measurements, length of line segments, and distance to nearest expression of a geological feature, measured respectively by a series of subroutines named AREA, LCON. and DCON.
AREA is an area calculating program that utilizes a 'point counting algorithm'. Each cell of a grid super-
for each cell, the proportion of subcells that are contained inside or outside the pmAygons of a particular imposed on the area in question is represented by an array of 400 subcells (points). Theprogram determines
rock type. A subcell was assigned '0' i f it lies outside a polygon and '1 ' i f it lies within a polygon. The array of O s and 1's were stored and area calculated by simple counting. In the (early stages a listing of
shapes, the inefficiency of the AREA algorithm necessitated subdivision of a complex polygon into several the array was used as a check on the procedure and programming. In a few cases of tlighly irregular outcrop
smaller simple polygons.
DCON calculates the distance from the centre of a cell to the nearest contact of a selected rack type. Each cell in turn is checked against a current polygon.
235

8 9
10 11 12 13
24 17
25
27 26
28 46 47
48 49
64 55 56
61 57
62 63 71 72
73 74
75 77 88 89 90 94
95
VARIABLES AND TRANSFORMATION USED IN THE REGRESSION ANALYSIS TABLE 1
(Variables considered but not used are omitted from the list.)
VARIABLES
distance' t o Bx distance to 4 distance t o 4a distance to 5a
distance to 5b distance t o 5
length' of 2 length of 4
length of 5a length of 4a
length of 5 length o f 5b
area of sum of 3a. 3b. 3c. 3d. 3e area+ of rum of 2. 2a
area of sum of 4.43 area of sum of 5a. 5.5b
distance to Ex4' distance t o Ex58 distance to Ex5 length of Ex2 length of Ex4 length of Ex5a length of Ex5 sum of area of 2a. Ex2 sum of area of 38. Ex3b. 3c. Ex3d.
rum of area of Ex4.4a rum of area of Ex5s. Ex5, 5b
distance t o Lornex fault grade of capper of deposits
whole rock zinc content whole rock copper content
difference in geomagnetic field geomagnetic field strength
distance t o wallrock
Ex3e
strength
TRANSFORMATION
arith, stand' arith. stand
arith, stand arith. stand
airth. stand arith. stand
arith, stand arith, stand
arith, stand arith. stand
arith, stand arith. stand
arcsine arcsine
arcsine arcsine
arith, stand arith. stand arith,rtand arith, stand arith. stand arith. stand arith. stand
arcsine arcsine
arcsine arcsine
arith, stand
log 109
109 arith, stand
109
arith. stand
COMMENTS
Bethlehem phase granodiorite Breccia
Bethlehem phase granodiorite Skeena variety granodiorite Bethraida phase quartz monzonite to granodiorite Bethsaida phase quartz monzonite to granodiorite Border phase quartz diorite to granodiorite Bethlehem phase granodiorite
Skeena variety granodiorite Bethlehem phase granodiorite
Bethsaida phase quartz monzonite to granodiorite Bethraida phase quartz monzonite to granodiorite
Border phase quartz diorite to granodiorite Guichon variety, Chatawayvariety,and Transitional
Bethlehem phase granodiorite Skeena variety granodiorite and Bethsaida phase
Bethlehem phase granodiorite Skeena variety granodiorite Bethsaida phase quartz monzonite to granodiorite Border phase quartz diorite to granodiorite
Skeena variety granodiorite Bethlehem phase granodiorite
Bethsaida phase quartz monzonite to granodiorite Border phase quartz diorite to granodiorite Guichon and Chataway variety granodiorite, and
Bethlehem phase granodiorite Transitional granodiorite
Skeena variety granodiorite and Bethraida phase
granodiorite
quartz monzonite to granodiorite
quartz monzonite to granodiorite
"Distance' means the distance from centre of cell t o nearest contact with one of above rock types.
"Arith. stand' means arithmetic, standardized, that is. the mean vaiue of a variable is subtracted from a given value
"Area' means fraction of area of each cell underlain by each o f above rock types. "Ex' means that the Contact of this rock Unit war extensively extrapolated across under or Oveilying sedimentary and
2 , Length' means length of contact of each of above rock types within each cell.
and the result i s divided by the standard deviation.
Volcanic rocks.
236

distance between successive pairs of points in a polygon, determine which cell the points are in, and cumu. LCON measures the length of a particular rock contact within a given cell. The procedure is to meawe the
late length until a point is found outside the current cell. For a given variable each polygon is treated in succession, and within each polygon points are examined successively. For two points that stracldle the boundary of adjoining cells no attempt is made to distribute the distance betweell cells. This I S not a problem where distance between points is small compared with cell dimensions.
Verification of measured geological variables is achieved by plotter output of the measurements a t a scale that can be overlain on the base geological map.
APPLICATION TO THE GUICHON CREEK BATHOLITH
the most recent publically available geological map of the area (McMillan. 1978). Variables quantified and Geological variables for the Guichon Creek Batholith were digitized as outlined previously using as a base
found useful are listed in Table 1. All variables were examined as histograms and probability graphs and most were transformed to a closer approach to normality as indicated in Table 1.
the batholith that included the major mineral deposits. Measures of cell value were! estimated by copper A control area consisting of 32 cells was selected to include a geologically reprewltative transect across
copper content were assigned a value of 1 000 tonnes for most of our studies; a non-z'xo value was required reserves and production taken largely from Sinclair. et a/. (1982). Within the transect, cells with no known
because the value variable (tonnes of copper) was log transformed.
Backward stepwise multiple regression was conducted for the 32 control cells with tonnes o f c o p ~ ~ e r (log transformed) as the dependent variable and various groupings of geological variables (approximately trans- formed, Table 1) as independent variables. Relatively simple equations were eventually established after considerable trial and error on (1) variations in assumed copper content of 'zero' reserve cells, (2) the effects of different transformations of some independent variables, and (3) sensitivity studies on the in- clusion and omission of several independent variables. A final model for this phase of the study is listed in Table 2.
TABLE 2 MULTIPLE REGRESSION EOUATION FOR
COPPER RESOURCE ESTIMATION GUlCHON CREEK BATHOLITH
Log' ltonnen copper) = 1.2752 + 0.7623 (magnetic field relief) - 0.8231 (distance to breccia) - 1.1351 (area Chataway - Guichonl - 0.3509 (length of contact of hybrid phssel
R' ~ 0.49; Standard Error i 0.91 17; variables significant at 0.05 level
The regression model for cell value was then applied to the target cells and cell values were estimated as potential tonnes of concentrated copper. The model was used first to estimate cells underlain by known rock types. and secondly, t o estimate copper potential in cells with younger volcanic cover where we had to interpolate geological contacts. Results are summarized on Figure 96. These r'?sults are subject t o a considerable amount of uncertainty - the standard error of the model i s about on? order o f magnitude,
exists between tonnes of copper and a combination of geological variables, and that the control cells are but a major source of unknown error also exists in the basic assumptions that a continuous relai.ionship
truly representative, A t this stage we can say that the variables included in the model appear reasonable from a geological point of view and that the model reproduces most known large copper reserves reasonably well (that is, within the error limits of the regression equation).
237

rlll CHON
CPEEK
BRTHOL I TY
Figure 96. Two by 2-mile-squared grid cells superimposed on the Guichon Creek batholith.
cell refer to thousands of tonne$ of copper observed (upper) and calculated by Control cells (301 are enclosed by a heavy rectangular outline. Flsurer in each
backward Stepwise regression model (lower).
238

DISCUSSION
This study clearly outlines the copper-rich central part of the batholith but also emphasizes severa cells that appear to have high copper potential but no known reserves. One purpose of the study was to develop a methodology for recognizing areas now covered hy younger volcanic rocks that have potential, The results are a t least partially successful in this regard although unknown factors always leave an element of doubt.
The models we have developed require further testing using sensitivity tests: tests to examine the effects on the model of varying the size of the grid cell and the origin of the grid. Other mathematical models than multiple regression should also be attempted for the Guichon data base.
ACKNOWLEDGMENTS
This study is part of the MINDEP project in the Department of Geological Sciences, University of British Columbia; i t has been fundcd by the British Columbia Science Council with the continuing supporl of the British Columbia Ministry of Energy, Mines and Petroleum Resources.
REFERENCES:
Agterberg, F. P (19811: Cell Value Distribution Models in Spatial Patterns Analysis. in Future Trends
Godwin. C. I. and Sinclair. A. J. (19791: Application of Multiple Regression Analysis to Drill-Target in Geomathematics, R. G. Craig and M. L. Labovitz, Editors, Pion Ltd., London, England, pp. 5-28.
Selecting, Casino Porphyry Copper-Molybdenum Deposit, Yukon Territory, C.I.M.M., Trans., Sec. 6. pp. 893-8106.
Kelly, A. M. and Sheriff, W. J. 119691: A Statistical Examination of the Metallic Resources of British Columbia, in Proceedings of a Symposium on Decision-Making in Mineralization Explora-:ion 1 1 , A. M. Kelly and A. J. Sinclair. Editors, Extension Dept., University of British Columbia, February 6, 7, 1969, pp. 221~243.
McMillan, W. J . (1978): Geology of the Guichon Creek Batholith and Highland Valley Porphyry Copper District, British Columbia, B.C. Ministry of Energy, Mines & Pet. Res., Prelim. Map 30.
Sinclair, A. J. and Bentzen, A. B. (1983): A Computer-based Procedure for Ouantifying Geological Data for Resource Assessment, B.C. Ministry of Energy, Mines & Pet. Res., Geological Fieldwork, 1982,
Sinclair. A. J. and Woodsworth, G. J. (1970): Multiple Regression as a Method of Estimating Exploration Paper 1983-1. pp. 285~289.
Sinclair, A. J., Drummond, A. D.. Carter, N. C.. and Dawson. K. M. (1982): A Preliminary Analysis of Potential in the Area near Terrace, British Columbia, Econ. Geol.,Vol. 65, pp. 9'38-1003,
Gold and Silver Grades of Porphyry-type Deposits in Western Canada, in A, A. Levinson, Editor, Previous Metals in the Canadian Cordillera.Assoc. Enpl. Geochem.. pp. 157.172.
239

TRIANGULAR GRAPHS AS AN AID TO METALLOGENIC STUDIES OF
POLYMETALLIC VEIN DEPOSITS
By L. B. Goldsmith and A. J. Sinclair Department of Geological Sciences, University of British Columbia
INTRODUCTION
Triangular graphs are a common means of depicting relative variations of three components of multi- component systems. They are commonly used in petrology and rock classifications, for example, where the components in question generally constitute a large proportion of the system. In geochemistry they may be used to compare trace element ratios for samples from one environment to another. In this latter
tages of this form of graphical representation. One application of triangular diagrams in the field of ore application it is possible to plot variables that span several orders of magnitude, certainly one of the advan-
deposits classification concerns porphyry-type deposits (for example, Kesler. 1973; Sinclair, et a/., 1982). These authors use triangular diagrams to show variations in metal ratios involving copper, molybdenum, gold, and silver in several groupings. In order to spread plotted points over a reasonable proportion of the triangular field some of these variables had to be multiplied by a constant. For example, in constructing a copper-molybdenum-gold plot Kesler (1973) transformed all variables to the same units and then multi- plied copper by 1. molybdenum by 10, and gold by 10000. These transformed figures were then recal- culated to a pseudo 100 per cent for plotting purposes. This multiplication procedure is essential or all plotted points might be confined to a very small field (a point) or to one side of the triangular graph.
numbers has the effect of confusing our natural or automatic interpretation of the diagram. For example, Nevertheless, it is important to be aware that multiplying some of the components by different and large
represent a ratio for B:C of 1: 1. I f B has been multiplied by 1 000 and A and C have not, then the afore- in a triangular graph A8C. the line from A to the mid-point of side BC would normally be expected to
contain labelled reference lines for important ratios. mentioned line in reality represents a ratio of approximately 1 0OO:l. Obviously, such diagrams should
APPLICATION TO POLYMETALLIC VEIN CAMPS
In our studies of vein camps in southern British Columbia (for example, Sinclair and Goldsmith, 1980) we have found triangular diagrams a useful means of comparing production data from various camps. Data
ton (for gold and silver grades). Because of this, and because ratios involving precious and base metals available to us a t the time of our study were entirely in per cent (for lead and zinc grades) or ounce per
commonly used in the exploration industry are in ounces of precious metal per per cent of base metal
figures were accepted as quoted (per cent or ounce per ton) and for any three figures (for example, lead, (ounce per per cent), we adopted the procedure of plotting triangular diagrams as follows: average grade
zinc, and silver) the figures were recalculated to 100 per cent assuming they were all the same units, that is,
of 70 per cent silver. 17.5 per cent lead, and 12.5 per cent zinc. 28 ounces silver per ton, 7 per cent lead, and 5 per cent zinc would be recalculated to apparent percentages
The four vein-mining camps considered here are Ainsworth, Slocan (Sandon), Slocan City, and Trout Lake
grade data are available in existing computer files (Orr and Sinclair, 1971; Read, 1976; Goldsmith and (Fig. 97). Each contains from 43 to 204 veins that have had a t least one ton of production for which
Sinclair, 1983; and MINFILE) that have been updated and edited by the writers.
240
ldegroot
1983
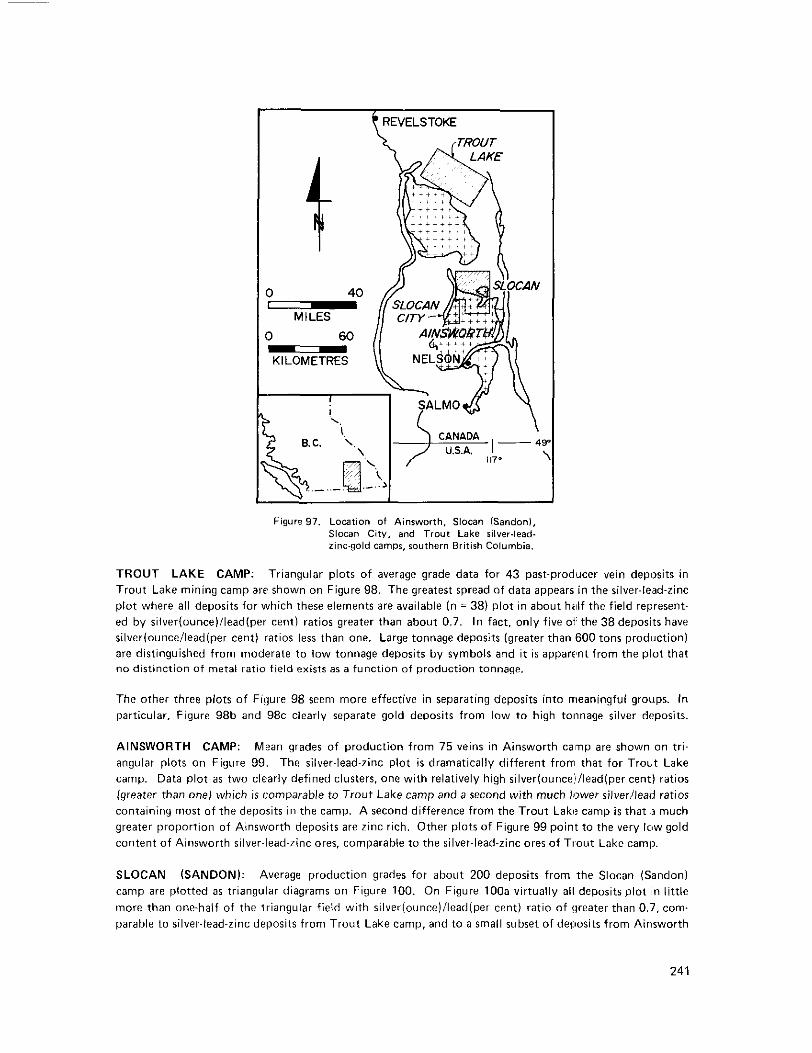
REVELSTOKE
Figure 97. Location of Aimworth, Slocan (Sandonl, Slocan City, and Trout Lake silver-lead. zinc-gold camps, southern British Columbia.
TROUT LAKE CAMP: Triangular plots of average grade data for 43 past-producer vein deposits in Trout Lake mining camp are shown on Figure 98. The greatest spread of data appears in the silver-lesd-zinc
ed by silver(ounce)/lead(per cent) ratios greater than about 0.7. In fact, only five o i the 38 deposits have plot where all deposits for which these elements are available (n = 38) plot in about h d f the field represent-
silver(ouncellead(per cent) ratios less than one. Large tonnage deposits (greater than 600 tons production) are distinguished from moderate to low tonnage deposits by symbols and i t is apparent from the plot that no distinction of metal ratio field exists as a function of production tonnage.
The other three plots of Figure 98 seem more effective in separating deposits into meaningful groups. In particular, Figure 98b and 98c clearly separate gold deposits from low to high tonnage silver deposits.
AINSWORTH CAMP: Mean grades of production from 75 veins in Ainsworth camp are shown on tri-
camp. Data plot as two clearly defined clusters, one with relatively high silver(ounce:i/lead(per cent) ratios angular plots on Figure 99. The silver-lead-zinc plot is dramatically different from that for TroLt Lake
(greater than one) which is comparable to Trout Lake camp and a second with much lower silverllead ratios containing most of the deposits in the camp. A second difference from the Trout Lakl? camp is that ,3 much greater proportion of Ainsworth deposits are zinc rich. Other plots of Figure 99 point to the very ICIW gold content o f Ainsworth silver-lead-zinc ores, comparable to the silver-lead-zinc ores of Tlout Lake camp.
SLOCAN (SANDON): Average production grades for about 200 deposits from the Slocan (Sandon) camp are plotted as triangular diagrams on Figure 100. On Figure lOOa virtually all depositsplot In little more than one-half of the triangular field with silver(ounce)ilead(per cent) ratio of {greater than 0.7, com. parable to silver-lead-zinc deposits from Trout Lake camp, and to a small subset of deposits from Aimworth
241

242

243

camp. Slocan ores differ slightly from the other two groups in that a significant group of zinc-rich deposits occurs and seems to form a separate grouping within the high silver(ounce)llead(per cent) field.
The remaining triangular plots o f Figure 100 demonstrate that, like silver-lead-zinc ores from both Ains- worth and Trout Lake camps, Slocan (Sandon) ores are low in gold. Furthermore, the presence of a high zinc population is emphasized by the presence of some plotted points near the zinc vertex of Figure 1OOc.
SLOCAN CITY: Average grade data for Slocan City polymetallic vein deposits are shown on Figure 101. The silver-lead-zinc plot is clearly comparable to the equivalent diagram for Slocan (Sandon) camp.
The remaining diagrams are based on sparce data sets but one in particular, the lead-zinc-gold plot of Figure 101d. shows that a large proportion (more than 40 per cent) of the plotted deposits are scattered throughout the triangular field rather than plotting along or very near the lead-zinc side. In this respect, Slocan City deposits differ clearly from Ainsworth and Trout Lake ores, and significantly, but to a lesser extent, from Slocan (Sandon) ores. This difference reflects the proportionately greater gold content of many Slocan City veins in comparison with veins from the other three camps considered.
DISCUSSION
Triangular graphs are a practical means of utilizing quantitative chemical information (average grades of recorded production) as a basis for comparing or contrasting polymetallic mineral deposits in vein camps. They probably have a comparable use for portraying other types of polymetallic deposits. The examples studied here involved four polymetallic vein camps with quantitative production data for silver. gold, lead, and zinc. We found advantages in preparing all four possible combinations of the three metals as triangular plots, that is, silver-lead.zinc, silver-gold-lead, silver-gold-zinc, and gold-lead-zinc. Such plots can be obtained rapidly and cheaply as computer-generated plots from computer-based mineral deposit files.
Clustering of points is evident i s some cases and differences from one camp to another become readily
cation of differences in absolute amounts. apparent. Of course, these differences represent relative proportions of various metals and give no indi-
One of the principal features that we observe is the common occurrence of a silver-rich group of deposits
plots. On this same plot Ainsworth stands out as being fundamentally different in terms of metal ratios in all four camps, as shown by the occurrence of clusters towards the silver apex on the silver-lead-zinc
because most deposits cluster in a lowsilver field towards the lead vertex.
The other major contrast that we note is that Slocan City camp differs from the others in having a much higher proportion of deposits that are relatively enriched in gold.
From a metallogenic point of view the conclusions are of some interest. Slocan (Sandon) and Slocan City camps are clearly related in origin (LeCouteur, 1972) but are surrounded by totally different country rock. Slates, finegrained quartzites, and tuffs occur in Slocan (Sandon) camp but plutonic rocks of the Nelson batholith predominate in Slocan City camp. It seems likely that country rock has exerted some control on metal content possibly due to: (I) changes in the fluid composition during transport through changing T-P conditions, or (2) local wallrock reaction at depositional sites,
The preponderance of low silver (ounce)/lead (per cent) values for Ainsworth deposits and the clear indi- cation of relatively higher zinc values accentuates their differences from the other three camps examined. The difference is particularly striking in the case of Ainsworth versus Trout Lake because both camps occur in the same lower Paleozoic sequence (Lardeau Group): albeit rocks in the Ainsworth camp have undergone
244

much higher grade regional metamorphism compared with the Trout Lake camp. G'Adsmith and Sinclair (1983) suggested that in Ainsworth camp sulphides first accumulated as seafloor exhalites and subsequently were remobilized locally to form the numerous veins now known, a suggestion suppxted by lead-isotope data (Andrew. 1982). No cleavcut genetic model has emerged for Trout Lake deposits nor for depxits in the other two camps, although deposits in all camps are clearly epigenetic veins. Differences in metal ratios may reflect fundamentally different origins of the Ainswofth deposits.
Some degree of quantitative information can be retained in triangular graphs by using different symtds for different categories of deposits. We illustrate this for Trout Lake camp {Fig. 98) whfre three categories of deposits are distinguished by symbols; large tonnage gold deposits, large tonnage silver-lead.zinc dqosits; and medium-to-small tonnage silver-lead-zinc deposits. An alternative practical apptoach might bt! t o re- present by one symbol all those deposits that exceed criteria for a minimum exploration target and to code all other deposits by a second symbol.
ACKNOWLEDGMENTS
This work utilized data files to which major contributions were made by J.F.W. Orr (deceased) and P. B. Read; A. Bentzen assisted in obtaining computer output. The study is a by-product of a more ex- tensive project on resource evaluation funded by the British Columbia Science Council in associaticsn with the MINDEP research project a t the University of British Columbia and the British Columbia Ministry of Energy, Mines and Petroleum Resources.
REFERENCES
Andrew, A. 11982): A Lead Isotope Study of Selected Precious Metal Deposits in British Colombia, Unpub. M.Sc. Thesis, Department of Geological Sciences, University of British Columbia, Vancouver, 79 pp. plus appendices.
B.C. Ministry of Energy, Mines & Pet. Res.: MINFILE, Computer-based file of mineral occurrences and deposits in British Columbia.
Goldsmith, L. B. and Sinclair, A. J. (1983): Spatial Density o f Silver-Lead-Zinc-Gold Vein Deposits in Four Mining Camps in Southeastern British Columbia, B.C. Ministry of Energy, Mines & Pet. Res..
Kesler, S. E. (1973): Copper, Molybdenum and Gold Abundances in Porphyry Colpper Deposits, Econ. Geological Fieldwork, 1982, Paper 1983-1, pp, 251.265.
Orr, J.F.W. and Sinclair. A. J. (1971): A Computer-Processible File for Mineral Depo!;its in the Slocan and Geol.. Vol. 68, pp. 106-112.
Slocan City Areas of British Columbia, Western Miner, Vol. 44, pp. 22-34. Read, P. 8. (1976): Lardeau West Half, Geol. Surv., Canada. Open File Map 462 and 13pen File Rep~t. 464. Sinclair, A. J. and Goldsmith, L. 8. (1980): Metallogeny of Silver-rich Lead.Zinc Veills, Central Kootenay
Arc, Southeastern British Columbia, Abstract, CIMM, Bull., Vol. 73, No, 821, p. 74. Sinclair. A. J., Drummond, A. D., Carter, N. C., and Dawson, K. M. (1983): A Preliminary Analysis o f
Gold and Silver Grades of Porphyry-Type Deposits in Western Canada in Pr8:cious Metals in the Northern Cordillera, Assoc. Explor. Geochem., pp. 157-172.
245

GEOLOGY OF GYP0 QUARTZ VEIN OLIVER, BRITISH COLUMBIA
(82E/4)
Department of Geological Sciences, University of British Columbia By A. J. Sinclair, D. Moore, and A. Reinsbakken
INTRODUCTION
about 43 kilometres (27 miles) south of Penticton (Fig. 102). Production of high-purity silica was con- Gypo quartz deposit is in the Okanagan Valley near the northern outskirts of Oliver, British Columbia
when the operation was closed due to caving of part of the quarry wall. During this 14-year interval from tinuous from 1955, when development was taken over by Pacific Silica Company, until August 1968
20 to 35 persons were employed annually. Yearly production ranged from a low of 2,500 tons in 1955 to a
tons. A t the close of continuous quarrying operations in 1968 more than 20,000 tons of crushed material high of 60,000 tons in 1960. From 1962 to 1966 inclusive, average annual production was about 46,000
of variable quality existed in stockpiles a t the quarry site. Small shipments have been made since 1968, both from stockpiles and limited sorting of slumped material from the quarry floor. Most concentrates produced had a purity of greater than 99 per cent silica.
Figure 102. Location of Gypo deposit
Production has been used mainly as decorative material in the building industry, especially as stucco dash. Small batches of concentrates have been used for a wide variety o f purposes, including preparation of special cements, as a flux in the mineral industry. for patio aggregate, as poultry grit, in the production of ferrosilicon and silicon carbide, and others. Although Gypo vein has been quarried principally for quartz, a small amount of by-product fluorite has also been shipped from the deposit.
246
ldegroot
1983

A number of other somewhat similar deposits occur in the general area. However, these are Considerably smaller than Gyp0 deposit and were of interest in the past because of their precious metal content>. The nearest deposits of appreciable size are the Standard and Susie veins (Fig. 103). both of which have Seen periodic reactivation in the past decade when gold prices have increased so dramatically.
Figure 103. General geology of the Gypo deposit area.
Numerous small quartz veins and veinlets containing minor amounts of pyrite are k m w n throughout the area, Morning Star and Stemwinder deposits of the Fairview camp ICockfield, 1935) are in Kobau meta sedimentary rocks several miles to the west.
GENERAL GEOLOGY
what is here called the Oliver Plutonic Complex (Table 1). This complex includes rocks mapped prev ously The area surrounding Gyp0 deposit is underlain principally by medium-grained intrwiive rocks that form
as Oliver syenite and Oliver granite (Bostock, 1940). To the south the pluton cuts Kobau metasedimentarv rocks of Carboniferous I?) age. On i t s northern margin the intrusive mass is in contact with Vaseaux Formation that probably is part of the Shuswap Terrane.
247

MESOZOIC AND EARLY TERTIARY INTRUSIVE ROCKS NEAR GYP0 DEPOSIT TABLE 1
AGE TERMINOLOGY ROCK TYPE ROCK UNIT PREVIOUS
I I I EARLY TERTIARY LAMPROPHYRE MAFIC DYKES
I MUSCOVITE ClUARTZ
MONZONITE OLIVER GRANITE
MIDDLE OLIVER
PLUTONIC PORPHYRITIC
QUARTZ BOSTOCK I19401
JURASSIC COMPLEX MONZONITE
BIOTITE-HORNBLENDE OLIVER SYENITE ClUARTZ
MONZONITE 1 BOSTO;: 119401
Recent work (Fig. 103) shows that Oliver pluton is composed almost entirely of quartz monzonite (Richards, 1969). Three distinct phases can be recognized in the field. A central core of massive medium- grained garnet-muscovite quartz monzonite is surrounded by a porphyritic quartz monzonite containing about 1 t o 5 per cent phenocrysts of K-feldspar up to 2.5 centimetres ( 1 inch) in maximum dimension. The contact between these units is commonly a narrow zone of quartz-feldspar pegmatite a few metres to 3.5 metres (10 feet) in width. However, a t Gypo mine and a t one locality along the northern margin of the core the contact is either sharp or gradational over several metres. Field examination indicates that the
to the south. predominant mafic mineral in the porphyritic quartz monzonite is hornblende north of the core and biotite
The third phase of the pluton is a hornblende-biotite quartz monzonite located to the south of the other two units and previously referred to as Oliver syenite by Bostock (1940). A transition zone of up to 60
zonite. Rocks in the transition zone are sub-porphyritic with smaller phenocrysts and a higher mafic metres (200 feet) in width separates hornblende-biotite quartz monzonite from porphyritic quartz mon-
contains numerous elongate mafic-rich inclusions that parallel a primary foliation of mafic minerals. Both mineral content than in the porphyritic quartz monzonite. The hornblende-biotite quartz monzonite
of these features are most pronounced near the contact with Kobau metasedimentary rocks and the folia- tion, in general, seems to parallel the contact.
shown on Figure 103. West of Old Fairview Road, immediately south of the powerline, dykes of garnet- Relative ages of the three units have been determined from cross-cutting relations just west of the area
muscovite quartz monzonite cut the porphyritic quartz monzonite. Similar relations are found further west. About 2.4 kilometres (1.5 miles) west of Old Fairview Road, along the general trend of the horn- blende-biotite quartz monzonite unit, a thick dyke of porphyritic quartz monzonite cuts the hornblende biotite quartz monzonite. Hence, on geological grounds relative ages of the three main phases of the Oliver pluton are: hornblendebiotite quartz monzonite (oldest), porphyritic quartz monzonite, and garnet- muscovite quartz monzonite (youngest). Modal analyses for specimens (see Table 2 ) of all phases are plotted on a feldspar-quartz triangular diagram (Fig. 104). A variety of dykes cut the pluton. Near the University o f British Columbia geology field school is a swarm of fine-medium grained quartz monzonite dykes that cut hornblende-bearing porphyritic quartz monzonite. Similar but finer grained dykes are present in the southern part of the area. Along the northern margin of the core a small fine-grained mus- covite-biotite-garnet-bearing dyke cuts both the porphyritic quartz monzonite and the garnet-muscovite quartz monzonite. Numerous dyke-like bodies occur in Kobau metasedimentary rocks along the southern margin of the pluton. Many of these are apophyses of the pluton but some are later dykes.
248
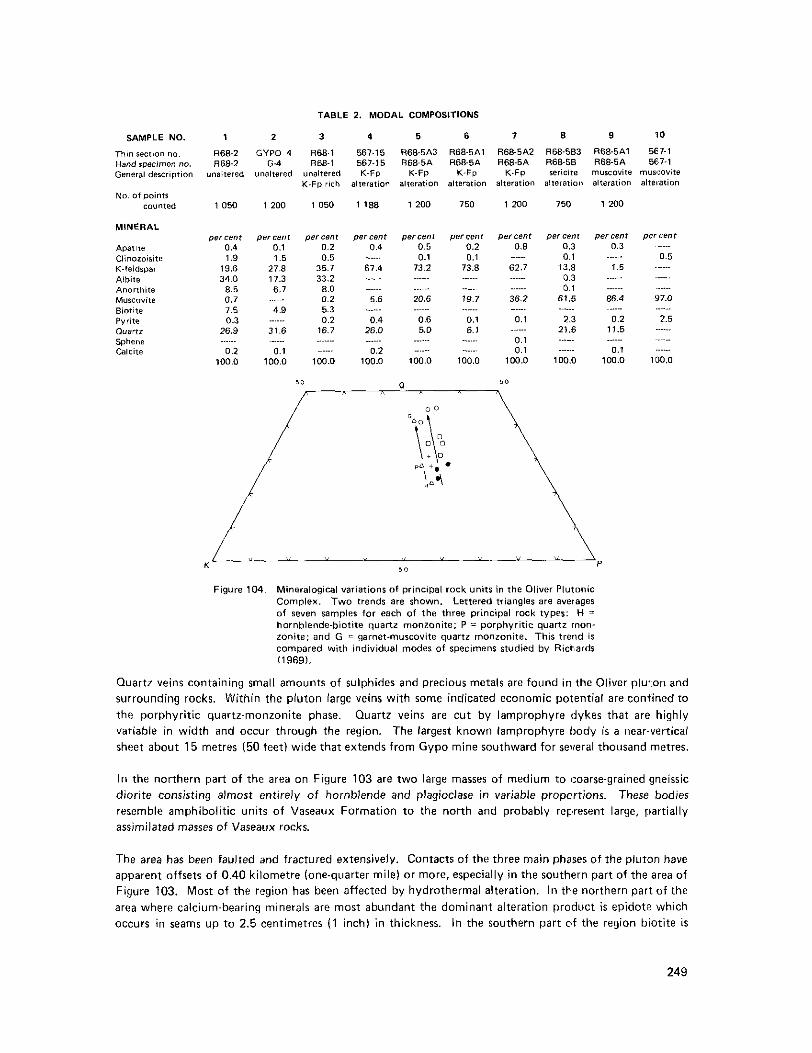
TABLE 2. MODAL COMPOSITIONS
SAMPLE NO. 1 2 3 4 5 6 7 8 9 10
Thln Iectlon no. R68-2 G Y P 0 4 R68-1 587-15 R68-5A3 R68-5A1 R68-5A2 R68-583 R68-5A1 5 0 1 Handrwclmen no. R68-2 (i-4 R68-1 567-15 R68-5A R68-5A R68-5A R68-58 R68-5A 5E7-1 General dercrrption unaltered unaltered unaltered K.Fp K-FP K-Fp K-Fp ~ericite rnUsCOYite rnYSI:OVite
K-Fp rlch alteration alteration alteration alteration alfera~iorl alteration alfelation
1 200 1050 1 188 1200 750 1 200 150 1200 No. of points
counted 1050
MINERAL Deice",
APatIte Clinoloirlte
0.4 1.9
K-feldspar Albite
19.6
Anorthite 34.0
MUICOVi te 0.7 8.5
Biotite P",lte
1.5
O"3RZ 0.3
26.9 Sphene Calcite
100.0 0.2
......
percent percenr percenr percent percent pereenr percent percenr perceof 0.1 0.2 0.4 0.5 l'r n~5 0.1 0.1
0.2 0.8 0.3 0.3 ""
0.1 ."". 0.5 """
27.8 35.1 67.4 11.3
13.2 33.2
73.8 62.1 13.8 1.5
6.1 8.0 0.2 5.6 20.6 19.7 36.2 61.5 86.4 97.0
. .. .~~
""~. .""~ .""~ """
""
0.3 0.1
""~. ..~~..
...~~. ...~.. .""~ """ ."~"
4.9 5.3 0.2 0.4 0.6
21 R 16.7 5.0 8. 1 0.1
2fi.o 0.1 2.3
21.6 0.2 2.5
11.5 ......
.."" ..~~.. ..".. """ .."" ...... ..~...
."". """ . . .. ~"." ."""
~~ ~
0.1 ~~.... """
0.2 ...."
".." 0.1 0.1 ......
".." """ ~."" 0.1
100.0 100.0 100.0 100.0 100.0 100.0 100.0 lw.o 100.0 ..""
Figure 104. Mineralogical variations of principal rock units in the Oliver Plutonic Complex. Two trends are shown. Lettered triangles are averages of seven Samples for each of the three principal rock types: H =
zonite: and G = garnet-muscovite quartz monzonite. This trend is hornblende-biotite quartz monzonite; P = porphyritic quartz mon-
compared with individual modes of specimens studied by Richrds 11969).
Quartz veins containing small amounts of sulphides and precious metals are found in the Oliver plul:on and surrounding rocks. Within the pluton large veins with some indicated economic potential are confined to the porphyritic quartz-monzonite phase. Quartz veins are cut by lamprophyre (dykes that are highly variable in width and occur through the region. The largest known lamprophyre body is a near.vertical sheet about 15 metres (50 feet) wide that extends from Gypo mine southward for several thousand metres.
In the northern part of the area on Figure 103 are two large masses of medium to 8:oarse-grained gneissic diorite consisting almost entirely of hornblende and plagioclase in variable proportions. These bodies
assimilated masses of Vaseaux rocks. resemble amphibolitic units of Vaseaux Formation to the north and probably represent large, partially
The area has been faulted and fractured extensively. Contacts of the three main phases of the pIut3n have apparent offsets of 0.40 kilometre (one-quarter mile1 or more, especially in the southern part of the area of Figure 103. Most of the region has been affected by hydrothermal alteration. In tbe northern part of the area where calcium-hearing minerals are most abundant the dominant alteration product is epidote which occurs in seams up to 2.5 centimetres ( 1 inch) in thickness. In the southern part of the region biotite is
249

Figure 105. Detailed geology of the Gyp0 quarry and adjacent area
Figure 106. Projection of near-vertical quarry face onto a vertical N-S section esentially perpendicular to the strike of the vein.
250

the abundant mafic mineral and chlorite is the most obvious result o f regional hydrothermal alteration. Whether or not the region has been subjected to more than one period of hydrothermal alteration is not known. However, some of the alteration postdated emplacement of lamprophyre dykes and the develop ment of some faults. Many fault zones appear to be later than alteration effects. ThE eastern edge of the area under consideration forms the western wall of the Okanagan Valley; it has been a'fected by extensive faulting and close-spaced fracturing. These features have not been studied in detail here but they are one of the latest tectonic events in the area and one might speculate that they are related to the development of
extent (see Little, 1961). the Okanagan Valley, which further north has been shown to be the locus of intense faulting of regional
GENERAL FEATURES OF VEIN DEPOSITS IN OLIVER PLUTONIC COMPLEX
Numerous quartz veins occur within the Oliver Plutonic Complex all of which show a nllmber of features in common. In addition, a few relatively large quartz veins are known in Kobau metasedimentary rocks. such as the Morning Star and Stemwinder deposits of Fairview Camp that were mined sevN?ral decades ago for their gold contents. The following general account applies only to those veins within the Oliver Plutonic Complex, some of which are shown on Figure 103.
exclusion of other minerals. Pyrite is, perhaps, the only other mineral common to a I veins but in many
In general, all veins within the Oliver pluton are characterized by an abundance of quartz, almost i:o the
cases can be observed only with close inspection; it forms a negligible proport ion of win material in terms of total volume. Other minerals have been recognized locally, including gold and silver tellurides, galena, sphalerite, and native gold at the Standard deposit. It is occurrences such as the Standard vein that have prompted the limited exploration conducted in the area. Recent high precious-metal prices have resulted in short-term reopening or re-investigations of the Susie and Standard mines.
Ouartz in all deposits has been subjected to varying amounts of post-mineralization fracturing, commonly
deposits show evidence that much of the quartz was deposited as fairly large crystals, generally 2.5 centi- to the extent that original textures are in large part destroyed. However, where relatively undeformed. all
show a rough cockscomb texture. All deposits contain at least some early deposited grey quartz although metres ( 1 inch) or more in cross-section and a t least several centimetres in length. In places these c,ystals
the bulk of the quartz is generally white. Wallrock alteration is not normally a pronounced feature o f most of these deposits but all veins show at least a thin zone of sericitization along their margins. Large veins are
found in both the core phase and the southern marginal phase. All quartz veins show some evidence of restricted to the porphyritic quartz monzonite although smaller veins up to a few centimetres in width are
wallrock replacement but in most cases it is clear that the depositional process has been principally one of open-space filling. Most veins are very small, about 0.3 metre (1 foot) or less in width and extend laterally for distances of a few metres up to 30 metres (100 feet) or so. The so-called large veins are variable in thickness, commonly from 0.6 metre ( 2 feet) t o 3 metres (10 feet) or more with str ke lengths of ,several hundred to a thousand feet. (300 metres) or so. Veins are mostly moderately to 'steeply dipping with variable strike direction.
that they have had a common origin that is somehow related to the pluton itself. IMany of the features In general, the similarity of features of quartz veins associated with the Oliver Plutcnic Complex mggest
area. referred to are shown by the Gypo deposit, but on a much more grand scale than is general throughout the
DETAILED GEOLOGY OF GYP0 VEIN
Gyp0 deposit is a large quartz vein in porphyritic quartz monzonite near the contact with the core phase (Fig. 103). The deposit strikes east-west with a southerly dip of 55 to 60 degrees (Fig:;. 105 and 106). It is
251

approximately 45 metres I150 feet) in true thickness a t the quarry site and has a known strike length of about 150 metres 1500 feet). A thinner extension from the main vein continues a t l eas t another 90 metres
centimetres (2 t o 3 inches) wide, occupied by gouge. A t the west end of this fault apparent offset is small (300 feet) t o the west. On the hangingwall (south) side the deposit is bounded by a thin shear zone 5 to 7
as is shown by continuity of protrusions from the vein on either side of the fault. The movement picture is not a t all clear near the quarry entrance. Character of the footwall is in sharp contrast t o that of the hangingwall zone. The footwall has been altered intensely for distances up to 30 metres (100 feet) from the vein, forming a greisen consisting predominantly of muscovite with lesser amounts of quartz. Further- more, abundant relict patches of partially greisenized wallrock occur within the vein near the footwall.
The deposit has been cut by a near-vertical lamprophyre dyke that strikes roughly north-south near the western exposures of the quartz vein. Lamprophyres are common in the general area but thls particular dyke is the largest yet found, with a width of about 15 metres I50 feet) and a strike length in excess of 700 metres (2,000 feet). The dyke contains about 45 per cent ferromagnesian minerals (olivine, augite, and biotite) in a K-feldspar matrix 135 per cent) with lesser amounts of apatite, plagioclase, and magnetite. Heat from this intrusion metamorphosed small pods of pyrite in the quartz vein, transforming them to pyrrhotite.
MINERALOGY
QUARTZ: Three stages of quartz mineralization are recognized in Gyp0 deposit. Early (Stage I) quartz is grey in colour and is confined to country rock, alteration zones, and marginal parts of the vein. It is massive in character and the colour fades gradually over a distance of a few metres from the vein wall where it gives way to white quartz (Stage 1 1 ) that makes up more than 95 per cent o f the vein material. An explanation for the colour difference between these two types of quartz has not been sought in detail at Gypo deposit. Holtby (personal communications, 1972) did a trace-element study of white and grey quartz from the nearby Susie deposit and found there that grey quartz had a much higher manganese content than did white quartz. Distributions of the two types are shown on Figure 106.
The white quartz a t Gyp0 deposit is principally in the form of giant crystals up to 0.3 metre to 0.6 metre ( 1 t o 2 feet) in diameter and 2 metres (6 feet) in length (see Matson. 1959). hence the deposit qualifies as a quartz pegmatite. These crystals are observed intact only rarely. i n part because most have been mined, but principally because the deposit has been fractured intensively with the production of numerous
commonly exhibit a rhombohedral form. We have examined this rhombohedral joint pattern in crystals closely spaced smooth joint surfaces. These joints have given rise to the local name 'cleavage quartz' and
a t the quarry and others now used as decorative pieces in gardens in Oliver. In many cases, the joints parallel rhombohedral crystal faces but this is not the case everywhere. In some crystals as many as six fracture directions are apparent and invariably some of these joints, although not necessarily the best developed, are parallel t o rhombohedral crystal faces. Some smooth joints can be traced from vein quartz
temperature polymorph. into adjacent wallrock. Etch tests with hydrofluoric acid suggest the quartz was deposited as the low
Small amounts of quartz (Stage 1 1 1 ) occur as thin delicate boxworks that cut earlier minerals, especially fluorite.
average diameter, distributed sporadically along a zone that i s o f more or less uniform distance from the FLUORITE: Apple-green fluorite occurs in a series of irregular pods up to 2 metres I6 feet) or more in
hangingwall (see Fig. 106). The fluorite is intensively fractured and even fresh-looking specimens are extremely friable.
centimetres ( 1 inch) in diameter that occur intermixed with vein quartz near the footwall but medium- MUSCOVITE: Muscovite occurs in two distinct sizes. It forms very coarse-grained books up to 2.5
grained, massive muscovite that is characteristic o f altered wallrock is much more abundant.
252

SULPHIDES: Sulphides form less than 1 per cent of the vein material. They are concentrated in small pods up to a few centimetres in diameter restricted to a thin zone in the central part of the vein ($?e Fig. 106). Pyrite is the principal sulphide hut it has been metamorphosed to pyrrhotite ;adjacent t o a lampro- phyre dyke in the western part of the vein. Small amounts of chalcopyrite and molybdenite have been observed in polished sections. Minor amounts of marcasite are present as an alteration of pyrrhotite. Sulphide pods stand out clearly because all are limonitized and contrast sharply with white quartz on the quarry face. Small cubes of pyrite are a minor but ubiquitous component of altered cwn t ry rock.
APATITE: Small amounts of apatite have been recognized in thin sections of altered rock, both greissen and feldspathized rock, in the footwall zone. The mineral has not been seen megascopically.
CALCITE: Small amounts of white to colourless calcite occur as thin veinlets and seams in quartz and locally forms small drusy cavities.
MANGANESE STAIN: Black stains, commonly with well-developed dendritic pit tern are present on some crystal faces, on joints in quartz and wallrock. and as earthy material in weathered wallrock. These minerals have not been studied in detail.
MINERAL ZONATION AND PARAGENESIS
A well-defined zonation of mineral varieties occurs within Gyp0 vein as illustrated on Figure 1D6. A relatively thin marginal grey quartz zone grades into white quartz occupying the interior of the vein.
pods of fluorite fairly close to the hangingwall and a second consisting of small sulphide pods more or less Regularly distributed within the white quartz are two separate zones, one characterized by large irregular
centrally located in the vein. Small grey quartz veins up to 0.30 metre ( 1 foot) in thickness are common around the margin of the main vein. These veins are cut by thin seams of muscovite whereas white quartz
fluorite and sulphides in the paragenetic sequence is less certain. Sulphides are centrally located ill small is not. The implied age relationship is consistent with order of deposition in the main vein. Position of
cavities that indicate they were probably one of the last effects of hypogene mineralization. Fluorite distribution pattern suggests that it was deposited for a relatively short period within the interval of white quartz deposition. The Stage Ill quartz that cuts fluorite might simply be a continuation of Stage I1 auartz.
WALLROCK ALTERATION
the footwall side (Fig. 106). The host, porphyritic quartz monzonite, has been altered almost completely FIELD ASPECTS: Wallrock alteration has been extensive about the Gyp0 quartz vt?in. particularly along
to a friable mass of muscovite with minor amounts of grey quartz and, in places, a few relict 'horses' of host. In detail, these 'horses' are also altered by feldspathization upon which has been superirnposed intensive muscovite alteration. The resulting alteration product is akin to a greisen, although some common greisen minerals such as topaz and cassiterite have not been recognized. This extensively altered zone grades rather abruptly into wallrock that is only slightly altered. It was collapse of this greisenized footwall zone in August 1968 that piled debris on the quarry floor and resulted in shutdown of mining operations.
cut locally by early grey quartz veinlets up to a few centimetres wide and with sharp contacts. In places,
Field relations indicate that 'greisenization' occurred prior to extensive quartz depoiition. The greisen is
however, such as the quarry entrance, thin replacement seams of muscovite extend through grey quartz and feldspathized zones. One of the striking features of the alteration is i t s apparent asymmetry - no extensive greisen zone occurs on the hangingwall (south) side of the vein. Further attention will be directed to this peculiarity in a later section.
253

Useful insight into the alteration processes can be had by investigation of small well-defined alteration envelopes about thin grey quartz veins adjacent to the main vein. Such an example is shown diagrammati- cally on Figure 107, a tracing of a photograph taken on the south side of the quarry entrance. Here, rela- tively flat-lying quartz veins, each a few centimetres to 0.30 metre ( 1 foot) in thickness, contain on their
alteration envelope consisting predominantly o f K-feldspar and having a thickness comparable to that of lower side a massive muscovite zone. The combined quartz and muscovite zones are surrounded by a pink
the quartz vein. This alteration zone grades fairly abruptly into relatively unaffected wallrock. In places one finds thin seams of muscovite a fraction of a centimetre thick that cut the K-feldspathized zone. These seams are products of metasomatism that extend into otherwise unaltered wallrock and apparently are
fracture-controlled. This relationship establishes relative ages of alteration types-K-feldspathization follow- ed by greisenization. A similar age relation can be seen in the large intensity greisenized footwall zone where feldspathized masses of wallrock have been replaced irregularly by greisen,
Figure 107. Details of mineralogical zoning in and around a 4 to 6-inch- wide grey quartz vein a t the margin of and in fault contact with the main vein. South ride of quarry entrance.
PETROGRAPHY: Modal analyses of unaltered wallrock and the two extreme types of alteration, based on
t ion are distinct. One is predominantly K-feldspar (at least two-thirds by volume) with much smaller approximately 1 100 points per thin section, are listed in Table 2. Mineralogically the two types of altera-
small amounts of quartz. Pyrite occurs as an accessory mineral in both types and appears somewhat more and variable amounts of muscovite and quartz. The other, greisen, is almost exclusively muscovite with
abundant in the greisen than in the K-feldspar alteration.
In general, alteration products are medium-grained and massive and, with their distinctive mineralogies are easily recognizable in the field. As mentioned earlier, typical accessory minerals in greisen such as topaz and cassiterite have not been identified although fluorite is a minor constituent, as are apatite and molyb- denite.
254

EXCHANGE OF ELEMENTS DURING ALTERATION: Wallrock alteration has been effected by extensive metasomatism involving the complete making over o f original country rock. Althobgh this probably took place principally within solid rock, there is some indication that open-space filling Fllayed a significant part in the process of greisenization. For example, on the hangingwall (south) side of the vein, m a i l seams of muscovite (identical with large massive patches of greisen) have forrred by replacement of fracture walls. Similarly, on the footwall (north) side, within the zone of intense gr~isenization veinlets of medium-grained muscovite cut relict patches of feldspathized wallrock.
The investigation of element transfer during metasomatic processes presents problems because of the un- certainty as t o what might represent a standard feature of reference that remaired unchanged during metasomatism. Various underlying assumptions have been made as a standard for calculations, induding: constant volume (Lindgren, 1918). constant cation percentages (Barth, 1952). cc,nstant oxygerl atoms (Barth, 1952). and constant silica tetrahedra (Poldervaart, 1953). Calculation of element exchange, using all the foregoing assumptions, requires chemical analyses that were not available i o us. Howev,:r, i t is
chemical compositions of constituent minerals are known fairly precisely. We had tested this approach possible to calculate chemical compositions approximately from detailed modal analyses. providing that
previously by comparing such calculated chemical compositions with actual chemical analyses fcmr speci- mens from the Copper Mountain area (Montgomery. 1967) and found surprisingly clme agreement between the two methods. Consequently, we proceeded to calculate chemical compositorls for unaltered rock, K-feldspathized samples. greisen samples, and several transitional rocks using a computer program patterned after that of Dietrich and Sheehan (1964). Calculations are based on average mineral composit ons for rocks of similar geological settings taken from Rankama and Sahama (1950).
mentioned earlier for examining exchange of major elements during metasomati:im. Qualitatively, ai l Using the calculated chemical compositions as a base, we then proceeded to investigate the four methods
one from another. For purposes of presenting the results. we use the method of Barth (1952) based on an methods showed essentially similar trends for individual elements but quantitavely they differ somewhat
assumption of constant numbers of oxygen atoms during metasomatism of silicate rocks. Results are shown on Figure 108 and are summarized briefly below.
The most pronounced chemical changes resulting from metasomatism are shown on Figure 1118a and involve obvious decreases in silicon and sodium and increases in aluminum, hydrogen, and potassiurn, all by a factor of about two or more. These chemical variations are apparent whatever method is used to estimate chemical exchange, and whether average or ideal mineral compositions are used in estimating the chemical composition from modal analyses.
Chemical variations of the less abundant elements are shown on Figure 108b. Became of low abundances, estimated amounts of these elements are more susceptible to variation depending on the particular mineral compositions used in calculations. Nonetheless, the trends shown are consistent regardless of the :.tandard
elements such as iron, magnesium, and sulphur appear to decrease in the initial stage of alteration m d then reference state chosen for metasomatism. Of this group only calcium decreases consistently. Other
increase during greisenization. Iron is of particular interest - it is present mainly ill biotite (and chlorite) in unaltered rock, is drastically reduced in the feldspathized zone which is almost dedoid of mafic minerals. and then increases drastically in the greisen zone due to i t s fixation with sulphur as pyrite. Other elements, such as phosphorus, titanium, manganese, and carbon (or C 0 2 ) show no particular change, although this could be more apparent than real because of their low abundance and the relatively 1,3w accuracy in making estimations.
On the average, unaltered wallrock contains 234 silica tetrahedra per cubic centimetre as compared with
originally distributed through 1 cubic centimetre of unaltered wallrock now must be distributed in 1.42 175 silica tetrahedra per cubic centimetre of greisen, Assuming no loss of silica tetrahedra, the tetrahedra
255

L
K - f e l d s p a r
S o m p l c NO
Figure 108a. Graph showing relative exchange of major elements during metasomatism, using Barth's standard cell of 160 oxygen atoms as a reference.
U n a l t e r e d
\
\ \ \
2 3
K - f e l d s p a r
S a m p l e N o .
G r e i s e n I S
8 9 10
Figure 108b. Graph showing probable relative exchange of some minor elements during meta- somatic wallrock alteration. using Barth's standard cell of 160 oxygen atoms as a reference.
256

cubic centimetres of altered rock, implying a volume increase of about 34 per cent. Although one cannot attach significance to the precise figure, the major conclusion to be derived from this calculation based on the assumption of constant numbers of silica tetrahedra is that a substantial increase in volume has occurred
volving an increase in volume will continue until all voids in the rock undergoing replacement are filled. as a result of metasomatic changes. Ames (19611 has suggested that replacement in a closed system in^
This process seems to provide an adequate explanation for thin greisen seams that lhave developed along joints a t Gypo deposit. In general, however, i t appears unlikely that metasomatism occurred entirely, if a t
space into which the altered rock could expand. Whatever the fundamental nature of the processes pro- all appreciably, in a closed system. The indicated volume change, for example, requires a considerable open
ducing this space (that is, fracturing or chemical dissolution) an open system i s impied. Fracturing, for example, suggests through-going channel ways, as does complete removal by chemical dissolution. The argument of an initially open system is further supported by mass balance calculat ons which show that SiO, released during alteration could account for only about 20 per cent of quartz now existing in the vein (Moore. 1970). Consequently. one must assume that the remaining 80 per cent of quartz in the vein is
solutions that would have been required preclude a closed system. truly epigenetic and was introduced in the form of dilute aqueous solutions. The tremendous quantity of
Greisen veinlets and masses commonly show sharp contacts with quartz and, in fact, Eross-cutting rdations prove that some greisen formed later than some of the grey quartz. On the other hand, greisen is inter- mixed intimately with grey quartz. No such relations exist between greisen and white quartz. I t seems probable that greisenization preceded white quartz deposition but was contemporaneous with a t least the early part of grey quartz deposition.
grained variety. precipitated from the same solutions from which quartz was depositl?d. In small flat-lying However, textural data suggest that a small proportion of the muscovite, in particular the very coarse-
veins the result is akin to that produced by crystal settling, producing an asymmetry of the muscovite zone. Such an origin might account, in part, for the asymmetry observed in the main vein.
SPACE PROBLEM
Both open-space filling and replacement processes were operative in the development of Gypo deposit. The extensive footwall greisen zone provides ample evidence of replacement, wherea,; the presence 3f giant quartz crystals whose termlnation point towards the centre of the vein suggests a dominant role of open- space filling. Both processes seem to require an open system. These conclusions lead to a problem in explaining how space was produced for the development of the vein. Mass balanc,: calculations indicate that a maximum of about one-fifth of the total vein volume could have been produced by quartz formed as a result of metasomatism of wallrock. The remainder of the volume must be account,:d for by the presence of pre-existing open spaces.
The problem has not been solved as a result of field and laboratory work and one is led to speculate on possible mechanisms. The peculiar shape of the vein in cross-section. that of a tilted ,ectangular block with
The writers suggest that a centre of intensive fracturing existed a t the site of the present vein, leading to upward extensions from each of the top two corners, suggests a plausible means 01 developing openings,
extensive alteration. Rock thus weakened, foundered with continuing tectonic acti!,ity to produce a large opening in which quartz deposition continued. This hypothesis has the advantage that it provide:; an ex- planation for the unusually great width of the vein in the area of the quarry. as well as for the tliin vein extensions both upward and to the west. However, it requires that the vein bottcmms a t some unknown depth, down dip a t the top of the foundered block(s1. This hypothesis also provides an explanation for asymmetry of the greisen zone (compare Fig. 107). that is, the 'missing' greisen zone on the hangingwall
foundered block. side (vestiges of which are present as discussed in the section on field aspects of alteration) is part of the
257

RADIOMETRIC DATING
placement a t about 160 Ma, that is, mid-Jurassic (R. L. Armstrong. personal communication, 1981). Unpublished rubidium-strontium isotopic dating of the Oliver Plutonic Complex provides an age of em-
Potassium-argon ages summarized in Table 3 are all substantially lower than the rubidium-strontium date. Muscovite potassium-argon data for the garnet-muscovite quartz monzonite and the Gypo greisen zone group at about 140 Ma suggesting either a thermal event at that time or a high heat flow from 160 Ma to 140 Ma. Biotite ages are much less, perhaps due to variable local resetting during the Tertiary thermal event represented by the biotite-augite lamprophyre dated a t 52 Ma.
TABLE 3 POTASSIUMIARGON MOOEL AGES FOR
IGNEOUS ROCKS AND WALLROCK ALTERATION NEAR OLIVER (After White. era/., 1968, with additions1
UBC NO. UNIT ROCK TYPE
W65-1 Kruger syenite Quartz monzonite (Horn Silver mine1
W65.2 W65-3 W65-4 W65-5 W65-6
W66-2 W65-7
W66-5 W67-1 W67-2
Fairview granodiorite Oliver Plutonic Complex Oliver Plutonic Complex
Oliver Plutonic Complex Oliver Plutonic Complex
Gypo. footwall greisen zone
Oliver Plutonic Complex Mafic dyke. Gyp0 deposit
Surie. wallrock alteration Standard. wallrock alteration
Granodiorite Hornblende-biotite quartz monzonite Porphyritic quartz monzonite Porphyritic quartz monzonite Garnet-muscovite quartz monzonite Muscovite-quartz alteration
Garnet-muscovite quartz monzonite Biotite-augite lamprophyre
Sericitired porphyriticquartz monzonite Sericitired porphyriticquartz monzonite
AGE (Mal*
Pyroxene- 152 i8 hornblende
Biotite 111 i5 Biotite 118*4 Biotite 8 2 3
Muscovite 139*5 Biotite 103+4
Muscovite 140*6 Biotite
Muscovite 144 i6 53+2
Sericite 11415 Sericite 117+5
'Error is laboratory reproducibility (one standard deviation).
CONCLUSIONS
Gyp0 quartz vein developed in the porphyritic quartz monzonite phase of the Oliver Plutonic Complex about 160 Ma ago, shortly after consolidation of the host. A genetic relationship almost certainly exists
wallrock replacement has been fairly extensive but the bulk of the vein quartz must have been deposited between Oliver Plutonic Complex, Gyp0 quartz veins, and other smaller nearby quartz veins. A t Gypo,
from hydrothermal solutions in an open system. Origin of the opening in which Gyp0 vein developed is uncertain but might have formed by foundering of a large fault-bounded block of partly greisenized country rock.
A t an early stage in development of the vein the adjacent country rock was extensively feldspathized, probably contemporaneously with deposition of early grey quartz. Small grey quartz veinlets in the sur- rounding rock formed a t the same time. Concurrent with continued deposition of grey quartz and some
country rock might have occurred principally a t this time or perhaps somewhat earlier to provide a large muscovite, there was a period of intensive greisenization. Foundering of a weakened central block of
open space in which white quartz was deposited. Fluorite was precipitated during a short interval within the period of white quartz deposition. Small pods of sulphide located centrally in the vein were the last hypogene mineralization. The calcite might, in pan, be the result of late-stage hypogene mineralization, but it has a regional occurrence and is probably largely due to a later superimposed regional hydrothermal alteration. This could, in part, have been related in time to a period of Early Tertiary lamprophyre dyke emplacement but is also, in pan, younger. Lamprophyre dykes metamorphosed nearby pyrite to pyrrhotite.
Fracturing affected the deposit and the area several times after vein formation. One period of fractures predates and another postdates regional hydrothermal alteration. The abundant maior faults and joint
258

systems that cut rocks in and near the vein are probably related to a Late Tertiary tectonic event that produced much of the fracturing apparent in the Okanagan Valley and caused the development of so- called ‘cleavage’ in Gypo quartz.
Later mineralizing effects include deposition of black manganese stain in and near the vein, alteration of pyrrhotite to marcasite, and the production of limonite from both pyrite and pyrrhctite.
ACKNOWLEDGMENTS
and cooperation of Mr. Ivan Hunter, former Manager of Pacific Silica Company, Oliver, British Colurnbia is R . Nethery and J.F.W. Orr assisted with the detailed plane table mapping of Gyp0 vein. The assistance
greatly appreciated. A. Bentzen provided technical assistance a t various stages through the study. This project was supported, in part, by funds from the National Science and Engineering Research Council of Canada.
REFERENCES
Ames. L. J., Jr. (19611: Volume Relationships During Replacement Reactions, Econ. Geol., Vol. 56.
Barth. T. W. 11952): Theoretical Petrology, Second Ed., John WileyandSons. New York, New York. 416
Bostock, H. (1940): Keremeos, Geol. Surv.. Canada, Map 341A. Cockfield, W. E. (1935): Lode Gold Deposits of Fairview Camp, Camp McKinney, and Vidette Lake Area
and the Dividend-Lakeview Property near Osoyoos. British Columbia, Geol. Surv., Canada. Mem.
Dietrich. R. V. and D. M. Sheehan (1964): Approximate Chemical Analyses from Modal Analyses of 179,38 pp.
Little, H. W. 11961): Kettle River (West Half), British Columbia, Geol. Surv., Canada. Map 15. 1961. Rocks, Virginia Polytech. Inst.. Virginia, Eng. Ext. Series, Circ. No. 1. 37 pp.
Matson. B. (1960): Geology of the Gyp0 Mine, Oliver, British Columbia, unpub. thesis, Department of Geology. University of British Columbia, 41 PP.
Montgomery, J. H. 11967): Petrology. Structure and Origin of the Copper Mouitain Intrusions near Princeton, British Columbia, unpub. thesis, Department of Geological Sciences, Univer!;ity of
Moore, D. P. 11970): Metasomatic Alteration near Gypo Quartz Deposit, Oliver, British Columbia. unpub. British Columbia, Vancouver.
Poldervaart, A. (1953): Petrological Calculations in Metasomatic Processes, Am. Jour. Sci , Vol. 251, thesis, Department of Geology, University of British Columbia. Vancouver, 42 pp. plus appendices.
Rankama. 0. and T. Sahama (19501: Geochemistry. University of Chicago Press. Chicago, 912 pp. pp. 481-504.
Richards, G. G. (1969): Petrology of the Oliver Quartz Monzonite, unpub. thesis. Department o f Geology, University of British Columbia, 35 pp.
Sinclair, A. J. and Gower, J. A. (1968): Guidebook for Mineralogical Association oi Canada Field Trip to the Southern Interior of British Columbia. Rept. No. 7, Department of Geology, Universiry of
White. W. H.. Harakal. J. A,. and Carter, N. C. 119681: Potassium-Argon Ages of !Some Ore Deposits in British Columbia, 9 pp.
White, W. H., Sinclair. A. J., Harakal. J. E.. and Dawson, K. M. 119701: Potassium-4rgon Ages of Topley British Columbia, CIMM, Trans., Vol. 61, pp. 1326-1334.
Intrusions near Endako, British Columbia, Cdn. Jour. Earth Sci.. Vol. 7, pp. 1172-1 178.
pp. 1438-1445.
PP.
259

PRELIMINARY REPORT ON WALLROCK ALTERATION
ERICKSON GOLD MINE, CASSIAR DISTRICT ( 104P)
By D. A. Sketchley and A. J. Sinclair Department of Geological Sciences, University of British Columbia
and
R. Somerville Erickson Gold Mines, Ltd.
INTRODUCTION
The Erickson Gold mine is 12 kilometres southeast of Cassiar, British Columbia (104P/4). Production com- menced in April 1979 and presently averages 170 tonnes per day grading approximately 17.0 grams gold per tonne and 15.0 grams silver per tonne.
Mineralization is in quartz and carbonate veins contained in intermediate to mafic volcanic rocks, chert,
tact with volcanic rocks, graphite and/or carbonate alteration envelopes generally are well developed. This argillite, ultramafic, and exhalative sedimentary rocks of the Sylvester Group. Where the veins are in con-
paper describes the megascopic characteristics of zoning and differences within the alteration envelopes.
An idealized model of the vein-alteration halo is illustrated on Figure 109. Veins commonly range up to 5 metres in thickness and associated alteration haloes extend from near 0 to 40 metres, although 1 to 15 metres i s common where volcanic material forms the host.
I
Figure 109
INTERMEDIATE TO MAFIC
-Relative Thickness: 0 - 15 m VOLCANICS
Variable Disseminated Pyrite
Sporadic Fuchsite
Cross-section of idealized alteration halo characteristic of quartz and carbonate veins. Erickron Gold mine, Cassiar.
260
ldegroot
1983

The entire alteration halo generally is divisable into several zones. The most clear-lxt change is from an outer carbonate zone (2) gradationally into an inner graphite-bearing zone (1) adjacent t o the vein. Each of these zones can be further subdivided. In the following section general description!; are presentecl of the character of unaltered wallrock and the individual alteration zones. These start witli the 'unaltered' wall- rock and continue with zones inward toward the vein. A summary of descriptive mat,?rial is provide3 in the accompanying table.
RELATE0 TO OUARTZ AND CARBONATE VEINS AT THE ERICKSON GOLD MINE DESCRIPTION OF IDEAL ALTERATION ZONING
zona
country rock intermediate
volcanic$ t o mafic
slioht carbonate
2b
moderate t o inteense
carbonate 2a
moderate slight t o
graphite l b
graphite intense
l a
w i n
Thisk- n e
metres
<1
<15
<4
<2
<5
Textures
host medium to marrive and pillowed f low. brec. dark green cia% ma61ive to layered tuffs i
crackled texture
common to tan i crackled texfure very pale green massive. aphanitic t o fine-grained
Wry tan with massive. aphanitic t o fine grained common minor t crackled teXfure
purplish grey mottling
un- tan t o light massive, aphanitic to fine-grained common and dark t crackled texture
grey
common U". black massive, soft. friable. fine-grained.
rider. occa~ional fine porosity frequently C ~ O S C C U ~ b y rlickcn-
very white to tan massive t o layered with Itylolites common i black
bands
Mineralogy
calcite. quartz. Ti oxides 5 pvri':e plagioclase. at:tinolite, chlorite. epidote.
plagioclare,Cii-Fe-Mgcarbonatei,rericite, chlorite. epidote. quartz. Ti-oxider t pyrite
Fe-Mg-Ca carbonates. rericite. fuchsite. quartz. Ti-oxides. plagioclase i pyrite
Fe-Mg-Ca car5anater. graphite. Sericite, quartz. Ti-oxides f pyrite
graphite. Fe-PAg-Ca carbonates, quar tz t pyrite
quar tz i Fe-F4g-Q carbonates. graphite. sulphide%, gold, altered wallrock frag- ments
VOLCANIC COUNTRY ROCK: Country rocks are volcanic rocks of andesitic tn basaltic composition that typically are medium to dark green and weather to a dark green to black. Mo!;t exposures consist of aphanitic to fine-grained massive rocks that commonly contain well.developed pillows. Less cornmonly
fractures may be present imparting a 'crackle' texture to the rocks. Constituent minerals of the 'unaltered' breccias and well-laminated tuffs are observed. A crosS-cutting network of dark green to black hairline
wallrock include plagioclase, actinolite, chlorite, epidote, calcite,quartz,and titanium-oxides. Disseniinated. fine to coarsegrained pyrite may be present also.
ALTERATION ZONE 28: Zone 28 marks the transition from country rock to carbonate altered rock; it is typically pale green to buff and may have a speckled or mottled texture. Most of the altered volcanic rocks are massive and aphanitic to fine grained, although in places primary textures may be visible. A 'crackled' texture, evident because of dark green to black hairline fractures. may be superimposed on the
calcium carbonates and sericite. Chlorite, epidote, quartz. titantium-oxides, and pyrite may also be present rock. Mineralogically the zone is characterized by partial alteration of plagioclaae to iron-magnesium-
wider, especially i f abundant stringer veins are present. The zone is almost invariably present adjacent to in lesser amounts. The width of the transition zone is generally less than one metre, but may be much
both quartz and carbonate veins.
ALTERATION ZONE 2A: In Zone 2A there is moderate to intense carbonate alt8:ration of the !volcanic
varying shades of purplish-grey impart a mottled texture to the rock. A crackled texture of black hairline rocks near the veins; it is most commonly buff coloured, massive, and aphanitic t o fine grained. Locally.
fractures may be present locally. Constituent minerals include varying amounts of iron-magnesium-calcium carbonates, sericite. fuchsite (chromian muscovite), quartz, titanium-oxides, and plagioclase. The fuchsite
261

occurs as sporadic blebs less than 1 centimetre in diameter. These blebs are found in that part of the zone closest to veins, but only where the zone is in contact with the vein. Coarse euhedral pyrite crystals rnay also occur in the portion of the zone closest to veins, even i f the zone is not in direct contact with the vein. Zone 2A is normally less than 15 metres wide and is commonly present; it occurs adjacent to both quartz and carbonate veins.
ALTERATION ZONE 16: Zone 1B marks the transition from carbonate to graphite-altered rock. The transition is gradational; colour changes from buff to pale or dark grey; the texture is massive and aphanitic to fine grained. Ordinarily, black hairline fractures crosscut the rock. Mineralogically the zones are charac- terized by variable amounts of graphite with iron-magnesium-calcium carbonates, sericite, quartz, and titanium-oxides. Coarse euhedral pyrite crystals may be scattered throughout the zone or concentrated closer to the veins. Zone 1B is not present in all alteration haloes but where formed it is typically less than 4 metres wide. This zone may occur without an adjacent zone of intense carbonate alteration, but such occurrences are rare.
ALTERATION ZONE 1A: Zone 1A is marked by intense graphite alteration. The rock is typically fine grained, black, massive, soft and friable. It is prominently slickensided and rnay have a fine porous texture. Mineralogically graphite dominates; there are lesser iron-magnesium-calcium carbonates and quartz. Pyrite may also occur but in smaller amounts than in previously described zones. Zone 1A is uncommon: where present it is generally less than 2 metres wide.
PYRITE: Pyrite occurs in variable amounts in al l alteration zones. Concentrations up to 5 per cent are noted adjacent to veins; pyrite decreases in size and amount away from the vein. Fine-grained pyrite predominates; the coarse-grained euhedral pyrite generally occurs within 1 metre of a vein. The euhedral pyrite crystals may attain a diameter of 5.0 millimetres.
GENERAL COMMENTS
cium carbonates. A few veins have graphite ribbons and stylolitic textures. Sulphide minerals in the veins Most veins are composed almost entirely of quartz with minor amounts of scattered iron-magnesium-cal-
carbonate altered wallrock fragments may be incorporated into veins. They also occur in localized contact are pyrite, tetrahedrite, chalcopyrite, and sphalerite; there are minor amounts of free gold. Graphite and
breccia zones. Less commonly, layered carbonate veins, with only minor amounts of quartz, are observed. In the carbonate veins only pyrite occurs; it is concentrated along layers and occurs as disseminations. Only carbonate alteration is observed in country rock adjacent t o such veins.
There are no systematic changes within alteration haloes throughout the mine; however, specific zones may
present whereas graphite alteration, particularly the more intense type, is uncommon. Generally, altera- be absent and zones vary widely in width from one vein to another. Carbonate alteration is typically
tion zones have quartz and/or carbonate veins in their cores; however, some do not. In general, alteration envelopes are relatively symmetrical but the thickness on the hangingwall side is up to twice that on the
thickness. Alteration envelopes rarely extend more than 40 metres from a vein: in most cases they extend footwall side. Both hangingwall and footwall alteration thicknesses average from two to six times the vein
less than 15 metres from the vein margin.
This report is a summary of preliminary fieldwork on megascopic characteristics of graphite-carbonate alteration zones developed in volcanic rocks a t the Erickson Gold mine. The work is directed toward
patterns within the alteration zones. investigating wallrock alteration patterns. Future work will focus on mineralogical and elemental zoning
ACKNOWLEDGMENTS
This work was supported financially by Erickson Gold Mines, Ltd. who have kindly granted permission for publication.
262

STATISTICAL EVALUATION OF DUPLICATE SAMPLES REGIONAL SEDIMENT SURVEYS,
BRITISH COLUMBIA
By P. F. Matysek and A. J. Sinclair Department o f Geological Sciences, University of British Columbia
INTRODUCTION
The ability to discriminate real trends related to geological and geochemical causes from those that result from spurious factors such as sampling and analytical errors is of paramount importance in the suI:cess of geochemical data interpretation. Since the estimate of reproducibility (precision) allows us t o quantify the amount of variation due to sampling and laboratory analysis i t is an integral part of the evaluetion of geochemical data and should be conducted prior to carrying out any detailed interpreation.
As part of our continuing study of rapid but thorough evaluation procedures for multi-element stream- sediment data (for example, Matysek. et a/., 1981) we designed a systematic computer-oriented method of evaluating the quality of geochemical survey data based on field-site duplicates. It irlcorporates a bias test, an analysis of variance technique, and the Thompson and Howarth (1976) approach to qua’ytifying precision.
This detailed procedure utilizes the type and quality of data incorporated in various regional geochemical programs undertaken by the British Columbia Ministry of Energy, Mines and Petloleum Resources (the Ministry), but can be adapted easily for other programs,
GENERAL METHODOLOGY
steps: In brief, our general approach to evaluation of the quality of geochemical data sets involves the following
( 1 ) Extraction of a t least 50 independent, field-site duplicate pairs from a geochemical data set fcmr use in subsequent data analysis.
(2) Determination of the degree of systematic bias between duplicate pairs based upon the number of cases in which the first observation is greater than the duplicate.
(3) Evaluation of the duplicated geochemical data set in terms of metal variability a t the regional, between-sample s i te and a t the local, within-sample site, sampling, and analvtical levels by a two- factor analysis of variance technique.
(4) Quantification of the within-sample site variability by estimating precision utilizing the Thsmpson and Howarth (19761 method.
DATA
Data obtained from the three most recent regional geochemical surveys undertaken Iby the Ministry (1981 I were evaluated using this method. The base data consist o f analyses of stream sediments and water samples collected a t an average density of one sample per 17.3 square kilometres over NTS map-sheet areas 92H, 921, and 92J. Silt samples were field dried and the minus 80-mesh (177 microns) fraction retained for subsequent analyses.
263
ldegroot
1983

The samples were analyzed for zinc, copper, lead, nickel, cobalt, silver, manganese, iron, molybdenum, arsenic, and antimony by the atomic absorption method. Tungsten was determined colorimetrically, uranium in the water samples was determined by a fluorometric method, and fluoride in stream waters was determined using a specific ion electrode (Garrett. 19751.
Field-site duplicates were also collected to provide information on analytical precision over a range of c o n centrations and to give some impression of sample representivity or geologic variation. Altogether, 132 pairs of duplicate field-site samples were extracted from the data set. Individual duplicate samples were recorded as 'first' of field-site duplicate and 'second' of field-site duplicate in the publically available general information guide distributed by the Ministry. Duplicates were collected a t a density of one per block of 20 samples. The location within the sample block was random so they could not be distinguished from other samples by the contracted commercial laboratory.
Sampling and analytical error associated with zinc, copper, nickel, cobalt, manganese, and iron distributions were investigated by this study. This particular suite of metals were selected for the following reasons:
(1) The majority of their reported analytical values exceeded their published detection limits (2) Their distributions exhibited a wide range of concentration values.
BIAS TEST
Two types of error contribute to the unreliability of a measurement; random errors arising from the A characteristic of numerical measurement is inconsistency in repeated measurements of the same quantity.
variations inherent to any sampling and measurement process, and non-random errors causing systematic negative or positive deviations from the true results. I f these non-random systematic errors are significantly large, precision estimates determined by an analysis of variance or by the Howarth and Thompson method may be suspect, since they are meant to detect random error only.
A bias test was utilized to assess the degree of systematic non-random error between the determined metal contents of the first sample and i t s duplicate. The test i s based upon the number of sample pairs in which
should be close to half the total number of (n) pairs and the frequency distribution of possible results concentration in the first sample is greater than that in the duplicate. I f there is no bias this number (m)
should correspond with successive terms of the binomial expansion of:
l (1/2) + (1/2) ln
The number of duplicate pairs exceeds 50, therefore, i ts frequency distribution approximates that of the normal distribution, having mean and a standard deviation of nI2 and n l J 2 respectively. The observed
result of (m) or greater can be obtained from the usual tables for the areas in the tails of the normal incidence (m) is then converted into the standardized normal deviate. The probability of obtaining a
distribution.
ANALYSIS OF VARIANCE
The second stage in our procedure is to evaluate the geochemical data set in terms of variability a t regional
variability is a t the regional level can one be confident that differences in metal concentrations between. (between-sample site) and local levels (within-sample site). Only if a significant proportion of the data
sample sites reflect a real trend related to geological and geochemical features, not merely a consequence of sampling and analytical error.
264

Significance of metal variability within-sample s i tes due to sampling and analytical e-rors versus dispersion between-sample sites can be determined by standard analysis of variance techniques. For our purposes, the significance of the various sources of variation can be determined from logarithmic values of duplicate samples using a twwfactor analysis o f variance. Theory and assumptions inherent iri this method are des- cribed by Krumbein and Graybill (1965) and Koch and Link (1971). The formal deign for the anillysisof variance is given in Table 1.
TABLE 1. ANALYSIS OF VARIANCE
SOURCE OF DEGREE OF VARIATION FREEDOM SUM OF SOUARES MEAN SQUARE F
-
X;, = r e ~ u l t for t h e i th replicate from t h e j t h site:; = 1, 7. ..... Ith result 11 is u w a l l ~ 21; j = 1, 7, ..... mth result: N = Irn = total number of results: F; = mean of ith replicate group: F. = mean of j t h si te group: a n d P = overall mean. I
The significance of metal variability between-sample sites (geochemical variation) and metal variability within-sample sites (sampling and analytical errors) is determined from the F-statlstic. The value of F. which is significant, can be obtained from standard statistical tables; i t is a function of the number of dup- licates collected, the number of duplicates collected a t each site, and the significance level selectetl for the investigation. Relative variance components have also been calculated as described by Garrett (1969. 1973) and correspond to the average percentage of variability explained by each source a t a sample site.
THOMPSON AND HOWARTH PRECISION METHOD
variation due to sampling and analytical error. This variation can be expressed in terms of precision which. The final stage in our evaluation of the quality of geochemical data sets i s to quantify the amount of
cent) confidence level: in geochemical practice, is specified as the per cent relative variation a t the two standard deviatiori (95 per
P c = 2 S c / C * 100% (1)
where (PC) is the precision in per cent a t concentration (c) and (Sc) is an estimate of the analytical standard deviation (Oc) a t that concentration.
Application of analysis of variation techniques can only determine an average precision value for a range of concentrations. In actual fact it has been shown (Thompson and Howarth. 1976) that where there i s a wide range of concentrations in a s e t of samples, both the absolute and relative errors in analytical deter- minations can vary across the range. To overcome this failing, alternative methods of estimating Iprecision using randomly selected duplicates have been considered by Thompson and Howarth (1973. 1976, 1978) and Howarth and Thompson (1976).
Briefly. their method involves dividing 50 or more duplicate samples into narrow concentration rznges and employing the medium of absolute differences between pairs o f duplicate analyses (X,, X 2 ) as an estimator
265

of the standard deviation (Oc). The group mean value of all the mean average values [ (X, t X,) / 21 is
narrow concentration ranges a set of corresponding mean concentration and standard deviation estimates used as an estimator of the average concentration. I f this procedure is repeated for a number of successive
are obtained. The relationship between them can be found by simple linear regression. From the expression:
Sc = So t Kc (2)
through substitution of (1 I above PC is given by:
PC = 200 (Soic t K) (3)
where (Sol is the standard deviation a t zero concentration and ( K l is a constant.
This linear function has been determined in many practical cases to be a satisfactory model for the expression of the variation. I n our case, where duplicates were independent samples collected in the field and analysed once each, the method will assess the overall error, which includes both sampling and labora- tory error.
The following rapid procedure is suggested for estimation of precision from a minimum of 50 pairs o f dup- licate samples (Thompson and Howarth, 1976):
( 1 ) From the duplicate analyses obtain a list of the means and absolute difference. (2) Arrange the list in increasing order o f concentration means.
(4) Repeat step (3) for each successive group of 11 results, ignoring any remainder less than 1 1 . (31 From the first 11 results obtain the mean concentration and median difference from that group.
(5 ) Calculate or obtain graphically the linear regression of the median differences on the means and multiply the intercept and coefficient by 1.048 to obtain (Sol and (k l . respectively.
In order to assess the significance of the precision parameters obtained from the linear regression, thecal. culated slope and intercept were individually evaluated by a t-test. Significance of the resulting regression was also determined by an analysis of variance.
RESULTS
Table 2 illustrates the results obtained from the bias tes t . From this table we observe:
( 1 ) Incidence of positive difference in metal content between duplicate pairs is greater than the number of negative differences for each of the metals analysed.
( 2 ) Metals nickel, cobalt, copper. and manganese exhibit appreciable, but minor, systematic bias
(3) A significant systematic bias for metals zinc and iron is indicated by the extremely low probability (<1 per cent) of obtaining such a high proportion of positive differences in metal contents between duplicate pairs.
(4) The number of duplicate pairs exhibiting identical metal concentrations averages greater than 1 in 4.
TABLE 2. TEST FOR SYSTEMATIC BIAS
PROBABILITY OF OBTAINING NO.
NO POSITIVE NEGATIVE METAL DIFFERENCES DIFFERENCES DIFFERENCES
OF POSITIVE DIFFERENCES
per cent No. /per cent/
Nickel 43 132.61 46 43 Arsenic Cobalt
44 39 42 34
copper 31 1'28.51 55 Manganese 14 110.61 64 54
46
lW" 31 (23.51 zinc
64 23 I1 7.41 68
37 41
49 137.11 56 142.41
36
22 30 19
17 <1 <1
266

These results suggest that for the majority of metals no major systematic biases are present and application of techniques such as analysis of variance and Howarth and Thompson precision procedure should provide meaningful results. Results obtained for metals zinc, and iron, however, should be icrutinized carefully in
duplicate pair is also characteristic for all metals studied and intuitively appears unrealistically high con- light of their strong systematic bias. A high incidence of identical metal concentratims for individuals o f a
sensitivity of the analytical method. sidering: (1) that it occurs across the concentration ranges of each particular met,d; and (2) the quoted
bility is decidely higher than the within-sample site dispersion for all of the metals !;tudied. This feature is Results o f the analysis of variance are presented in Table 3. As expected, the betrveen-sample site uaria-
both encouraging and desirable because the purpose of these regional surveys is t o define a regional trend related to geological and geochemical phenomena; the greater the variability in metal concentrations between-sample sites the greater the ease of defining such trends.
TABLE 3
132 DUPLICATE PAIRS OF STREAM SEDIMENTS ANALYSIS OF VARIANCE OF RESULTS FOR
GRAND MEAN SITES METAL IGEOMETRICI'
SITES BETWEEN WITHIN BETWEEN WITHIN VARIANCE COMPONENTS
F, F, SITES SITES % %
CODLW
Zinc 50 156.98' 26 115.45'
8.22' 89 1.61 ns
11 97 3
Nickel Cobalt
. . 15 8
59.51' 2.81 ns 91 40.70' 0.20 ns 99
Ma"ga"W 292 276.88' l,D" 1 .Ea 313.30'
0.26 ns 99 13.56'
9 1 1
91 9
The test depends on the following nuli hypothesis: la1 Between Sample site6 - mean metal contents are equal a t each rite. Degrees of freedom are
Ibl Within sample sites ~ mean of samples x l , io equal to mean of duplicates x 2 . Degrees of
' All values are in ppm except for iron which is in per cent.
' = 0.01 > P:' = 0.05 > P > 0.01; n% = P 0.05 Probability ranges for accepting the null hypothesis:
Im- l ,m- l l ,wherem=numberof r i te r=132 .
freedomarell, m - 1 ) .
also significant differences between the groups of the first f i e l d i t e duplicate artd the second field-site From the F, ratios given in column 3 in Table 3, it is seen that for zinc and iron distributions there are
duplicate, probably reflecting the systematic bias discussed earlier. It is important to note that where there is a significant difference between the two groups, and the within-site var~iarlce componen: is large, the data may be of little value in prospecting, irrespective of the significance of the t e s t for gec,chemical variation.
According to Bolviken and Sinding-Larsen (1970) where there is a significant difference between duplicate pairs o f samples a t individual sample sites and the withimsite variance component is relatively small no large deviation can exist for many duplicates. Two possibilities exist: (1 ) there i s a rninor deviation between duplicates a t many sample s i tes and considered not to seriously hamper prospecting potential: and (2) there is a major deviation between duplicates a t a few sample sites and considewd to be serious i f is not detected by inspection of the data. In our case the significant F ratio and relatively low withimsite variance component for metals zinc and iron is accounted for by the former possibility and, as a consequence, these metals can be used to define real geological and geochemical trends.
Comparable investigations by Bolviken and SindingLarsen (1970) and Chork (1972) using similar-type data and tests found that the variation within s i tes was about 10 to 25 per cent and thf? Variation between sites was about 75 to 90 per cent. These results are considered typical for low-density stream-sediment surveys.
267

I i
Figure 110. Absolute differences of paired data versus corresponding mean values Of Pairs, copper in stream sediments. British Columbia Regional Geochemical Survey.
I 12.0 24.0 36.0 46.0 60.0 72.0 6a.o W.0
MEAN OF DUPLICATE RESULTS
COPPER lppm)
Figure 11 1 . Lmear model of average error as a function of concentration, copper in stream sediments. Brttish Columbia Regional Geochemical Survey.
268

This is contrasted by results obtained from this study (Table 3) which exhibit surprisingly lower wi th in
anomalous results is elaborated upon in a later section. sample site variance, averaging less than 5 per cent of the total variability. The significance of these
ically for copper on Figures 110 and 111. Although the regression of the median af absolute differences Results obtained from the Thompson and Howarth method are presented in Table 4 and illustrated graph-
on the concentration means was only based on 12 points, analysis of variance proved significant a t the 99 per cent confidence interval for all metals except cobalt (Table 4, column 6). A regression plot of copper
for the relationship between the median of absolute differences and mean concentritions; thus it provides illustrated on Figure 1 1 1, shows conclusively that simple linear regression more than adequately accounts
an excellent indictor of precision over the range.
RELATIVE PRECISION ESTIMATES. THOMPSON-HOWARTH METHOD TABLE 4
BRITISH COLUMBIA REGIONAL GEOCHEMICAL DATA (92H. 921, and 92Jl
METAL DETECTION
LIMIT '
Zinc 2 Copper Nickel
2
Cobalt 2
Manganese 5 2
0.02
MAXIMUM VALUE SLOPE INTERCEPT
720 0.018' 0,945' 1300 0.012' 0.629'
96 0.029' 0.212 ns 3700
5.70 0.011' 0.051' 0.036' 2.785 ns
210 0.0273 0.892 ns
PRECISION ESTIMATES AT SELECTED PERCENTILES
% % %
7.0 6.8 6.5 6.7
55.442 4.0 5.9 3.2
5.1
3.14' 8.0 7 A 2.5 6.7
40.72' 2.57'
7.8 7.7 5.0
7.6 4.7 4.1
REGRESSION F-VALUE 90th 95th 99th
7.1g4 16.60'
' All values are in ppm except iron which i s in per cent. Probability ranges for accepting t- tests on the slope and intercept and F-test on the regrewor: ~ = 0 . 0 1 ~ P ; 3 = 0 . 0 5 > P > 0 . 0 1 ; ' = 0 . 1 0 > P > 0 . 0 5 : n s = P > 0 . 1 0
Estimates of the slope also proved significantly different from zero a t the 99 pel cent confidence level (Table 4, column 4) for all metals except cobalt. However, only copper and nickel intercepts were found to be significantly different than zero (Table 4, column 5). This implies first, that the slope is major influence on the precision estimate of a given metal and second, that the magnitude of the slope reflects the relative precision. Examination of Table 4, column 4 reveals that nickel possesses the relatively lowest slope (0.012) whereas magnanese is the highest (0.036). The intercept for most of the metals is not significantly different from zero and the magnitude of the slopes i s extremely small, therefore, the pre- cision is incredibly low.
against means of duplicate pairs with the concentration range divided into equal frequency intervals; and For example, Figures 110 and 111 illustrate for the metal copper: (1) the plot ,of absolute differences
determine the precision as an absolute value obtain graphically the median absolute difference correspond- (2) a plot of the regression of the median absolute difference against mean concentration of copper. To
ing to a selected concentration value on the regression line and multiply by 2. Thus, for copper a t the:
50th percentile (26 ppm) absolute precision = 2.8 ppm 95th percentile (59 ppm) absolute precision = 3.9 ppm 99th percentile (80 ppm) absolute precision = 4.7 ppm
DISCUSSION OF RESULTS
laboratory analysis, and data handling. Taking the existence of sampling errors into account, a precision of In general, all data collected in stream sediment surveys contain errors that are acqklired through sampling,
269

variability in most exploration programs (Fletcher. 1981). Studies tailored to the evaluation of error in 10 to 15 per cent a t the 95 per cent confidence level is generally regarded as acceptable for laboratory
drainage surveys. such as Plant 11971). Howarth and Larsen (1971). Bolviken and Sinding-Larsen 119731, Plant, etal. (1975). and Chork (1977) generally concluded:
(1) Variable bias and variable precision introduced by secondary environment effects obscure the primary regional geochemical variation. The factors involved are complex and related to several variables in the primary and secondary environments investigated.
( 2 ) Metal dispersion within-sample sites depends on such factors as : (a ) concentration of the inetal under investigation; (b) concentration of other metals (for example, iron); IC) homogeneity of sediment composition; (d l catchment size a t sample site.
(3) The combined variability due to local variation and sampling error ranged from 10 to 25 per cent.
(4) Sampling errors tended to exceed analytical errors when precise analytical techniques such as atomic absorption spectrometry are used.
REFERENCES
Bolviken, B. and Sinding-Larsen, R. (1973): Total Error in the Interpretation of Stream Sediment Data in
B.C. Ministry of Energy, Mines & Pet. Res. (1981): Regional Stream Sediment and Water Geochemical
Chork. C. Y. (1977): Seasonal, Sampling and Analytical Variations in Stream Sediment Surveys, Jour. Reconnaissance Data, Map Sheets 92H. 921, and 92J. B.C. Regional Geochemical Surveys 7, 8, and 9.
Fletcher, W. K. (1981): Analytical Methods in Exploration Geochemistry in G. S. Govett. Editor, Hand- Geochem. Explor.. Vol. 7, pp. 31-47.
Garrett, R . G. (1969): The Determination of Sampling and Analytical Errors in Exploration Geochemis- book of Exploration Geochemistry, Elsevier Sci. Pub. Co., Vol. 1. New York, New York, 255 pp.
..... (1973): The Determination of Sampling and Analytical Errors in Exploration Geochemistry - A try, €con. Geol., Vol. 64, pp. 568, 569.
...... (1979): Sampling Considerations for Regional Geochemical Surveys, Geo/. Surv., Canada, Paper Reply. Econ. Geol.. Vol. 68. pp. 282. 283.
Garrett, R. G. and Goss, T. I. (1980): Statistical Appra'isal of Survey Effectiveness in Regional Geochemi- 79%1A, pp. 197.205.
Howarth. R . J. and Lowenstein. P. L. (1971): Sampling Variability of Stream Sediments in Broad-Scale cal Surveys, Int. Asroc. Math. Geol.. Bull., Vol. 12, No. 5, pp. 443-458.
Regional Geochemical Reconnaissance, lnst. Min. Metal.. Trans., Vol. 80, pp. 8363-8372.
York, New York, Vol. 1. 375 pp; Vol. 2. 417 pp. Krumbein, W. C. and Graybill, F. A. (1965): An Introduction of Statistical Models in Geology, McGraw-
H i / / , New York, New York, 413 pp. Matysek. P. F.. Fletcher, W. K.. Sinclair. A. J.. and Bentzen, A. (1981): A Preliminary Evaluation of
Categorical Field Observations for Regional Stream Sediment Samples (82F. K), B.C. Ministry of
Miesch. A. T. (1967): Theory of Error in Geochemical Data, U.S. Geol. Surv., Prof. Paper 574-A, 17 pp. Energy, Mines& Pet. Res., Geological Fieldwork, 1980. Paper 1981-1. pp. 149.158.
...... (1976): Geochemical Survey of Missouri % Methods of Sampling, Laboratory Analysis and Statistical
M. J. Jones. Editor, Geochemical Exploration 1972, lnst. Min. Metall., London, pp. 285-293.
Koch, G. S. and Link, R . F. (1971): Statistical Analysis of Geological Data, John WileyandSons, New
Plant. J. (19711: Orientation Studies on Stream Sediment Sampling for a Regional Geochemical Survey in Reduction of Data, U.S. Geol Surv.. Prof. Paper 954-A. 39 pp.
Northern Scotland, lnst. Min. Metali, Trans., Vol. 80, pp. 8324.8345,
270

Plant, J., Jeffery, K., Gill, E., and Fage, C . (19751: The Systematic Determination of Accuracy and Pre- cision in Geochemical Exploration Data, Jour. Geochern. Explor., Vol. 4. p~". 467-486; Determin-
Thompson, M. and Howarth, R . J. (1976): Duplicate Analysis in Geochemical Practice ( 2 parts),Analyst. ations, Analyst, Vol. 98. pp. 153.166.
Vol. 101, pp. 690-709. ..... (1978): A New Approach to the Estimation of Analytical Precision, Jour. Geochern. Explor., Vol. 9,
pp. 23-30.
M50-367
27 t