
Geologic and Geotechnical Conditions Adjacent to … and Geotechnical Conditions Adjacent to the...
50
Geologic and Geotechnical Conditions Adjacent to the Turnagain Heights landslide, Anchorage, Alaska U.S. GEOLOGICAL SURVEY BULLETIN 1817 A cooperative research project between the U.S. Geological Survey and the State of Alaska Division of Geological and Geophysical Surveys
Transcript of Geologic and Geotechnical Conditions Adjacent to … and Geotechnical Conditions Adjacent to the...

Geologic and Geotechnical Conditions Adjacent to the Turnagain Heights landslide, Anchorage, Alaska
U.S. GEOLOGICAL SURVEY BULLETIN 1817
A cooperative research project between the U.S. Geological Survey and the State of Alaska Division of Geological and Geophysical Surveys


Geologic and Geotechnical Conditions Adjacent to the Turnagain Heights Landslide, Anchorage, Alaska
By RANDALL G. UPDIKE, HAROLD W. OLSEN, HENRY R. SCHMOLL, YOUSIF K. KHARAKA, and KENNETH H. STOKOE, II
A cooperative research project between the U.S. Geological Survey and the State of Alaska Division of Geological and Geophysical Surveys
New geologic and geotechnical data are used to differentiate the facies in the Bootlegger Cove Formation, and to examine the roles of the facies in the 1964 earthquake-induced landslide at Turnagain Heights
U.S. GEOLOGICAL SURVEY BULLETIN 1817

DEPARTMENT OF THE INTERIOR
DONALD PAUL HODEL, Secretary
U. S. GEOLOGICAL SURVEY
Dallas L. Peck, Director
UNITED STATES GOVERNMENT PRINTING OFFICE: 1988
For sale by the Books and Open-File Reports Section U.S. Geological Survey Federal Center Box 25425 Denver, CO 80225
Library of Congress Cataloging-in-Publication Data
Geologic and geotechnical conditions adjacent to the Turnagain Heights landslide, Anchorage, Alaska.
(U.S. Geological Survey bulletin ; 1817) "A cooperative research project between the U.S. Geological Survey and the
State of Alaska, Division of Geological and Geophysical Surveys." Bibliography: p. Supt. of Docs. no.: I 19.3:1817 1. Geology-Alaska-Anchorage. 2. Engineering geology-Alaska-Anchorage.
I. Updike, Randall G. II. Geological Survey (U.S.) Ill. Alaska. Division of Geological and Geophysical Surveys. IV. Title: Turnagain Heights landslide, Anchorage, Alaska. V. Series.
QE75.B9 no. 1817 [QE84.A4]
557.3 s [557.98' 3] 87-600389
Any use of trade names is for descriptive purposes only and does not imply endorsement by the U.S. Geological Survey.

CONTENTS Abstract 1 Introduction 1
Regional setting 2 Lynn Ary Park site 2 Acknowledgments 3
Previous investigations 4 Geology 4 Present investigation 6
Drilling and sampling 6 Laboratory analysis 7 In-place seismic measurements 8 Inclinometer survey 9 Electric cone-penetrometer tests 12 Scanning electron microscopy 15
Interpretation 20 Stratigraphy 20 Geologic history 21 In-place pore pressure and effective stress 21 Strength, consolidation state, and sensitivity 21
Discussion 23 The 1967 model 24 Comparison of new data with the 1967 model 25
Concluding comments 27 References cited 28 Appendix of tabulated data 30
PLATES
[Plates are in pocket]
1. Geotechnical borehole log: USGS-B-5, Lynn Ary Park, Anchorage, Alaska.
2. Geotechnical borehole log: USGS-B-3. 3. Cone-penetrometer tests at locations LA-C-1, LA-C-2, and LA-C-3. 4. Undrained shear-strength profiles, Lynn Ary Park, Anchorage,
Alaska. 5. Geologic cross section.
FIGURES
1-3. Maps showing: 1. The Anchorage area including selected physiographic divisions of
the Cook Inlet basin 2 2. Geologic-physiographic units of the Anchorage lowland and adja
cent areas 3 3. Location of geotechnical boreholes and cone-penetrometer sound
ings in the vicinity of Lynn Ary Park 3 4. Photograph of Shelby-tube sampler recovered from borehole B-5 6
Contents Ill

5. Example of X-ray photographs of core samples in Shelby-tube samplers 7
6. Photograph of core samples obtained with Shelby-tube samplers 7 7. Photograph of the high-humidity room where detailed logging and
index-property testing were performed 8 8. Sketch of downhole configuration used to determine shear-wave
velocities 11 9. Photograph of velocity-transducer array used to determine shear-wave
velocities in downhole and crosshole configurations 12 10. Sketch of crosshole configuration used to determine shear-wave
velocities 12 11. Diagram of shear-wave velocities and facies in the Bootlegger Cove For
mation from boreholes B-3 and B-5 13 12. Slope-indicator casing profiles for borehole B-3 13 13. Slope-indicator casing profiles for borehole B-5 14
14-16. Photographs showing: 14. Truck-mounted cone-penetrometer test (CPT) system 14 15. Cone assembly prior to test 14 16. Cone assembly with cone and friction sleeve removed to show in
strumentation 15 17. Sketch cross section of electric-cone assembly shown in figures 15 and
16 15 18. Graph of friction ratio versus cone resistance from cone-penetrometer
test data showing soil-behavior domains for the Bootlegger Cove For-mation 16 ·
19-25. Scanning electron micrographs: 19. Parallel to bedding planes of facies F.III from undisturbed core
sample at 14.37-m depth 17 20. Parallel to bedding planes showing open-flocculated fabric typical
of high-sensitivity F.III facies 17 21. Parallel to horizontal bedding planes showing flocculated ''card-
house" fabric typical of very high sensitivity F.III facies 18 22. Facies F.III normal to bedding planes 18 23. Medium-sensitivity facies F .III parallel to bedding planes 19 24. Facies F.III showing clay-size particle contacts including edge-to
edge, face-to-edge, and face-to-face arrangements 19 25. Parallel to bedding planes of a low-to-medium sensitivity zone in
facies F.III 20 26-28. Graphs showing:
26. Piezometric head versus depth for piezometers installed in the vicinity of Lynn Ary Park after the 1964 earthquake 22
27. Total and effective-stress profiles at Lynn Ary Park 22 28. Ranges of undrained shear strength at various depths at Lynn Ary
Park 23 29-32. Profiles of:
IV Contents
29. Pore-fluid cation and total dissolved solids concentrations at Lynn Ary Park 24
30. Pore-fluid anion concentrations at Lynn Ary Park 25 31. Pore-fluid organic carbon concentration at Lynn Ary Park 26 32. Conductivity and the ratio of monovalent to divalent cations at
Lynn Ary Park 27

TABLES
1. Chemical composition of pore water extracted from samples of the Bootlegger Cove Formation 9
2. Geotechnical index-property data for core from borehole B-5 10 3. Geotechnical index-property data for core from borehole B-3 11 4. Tabulated data for CPT site LA-C-1 31 5. Tabulated data for CPT site LA-C-2 35 6. Tabulated data for CPT site LA-C-3 38
Contents V

Geologic and Geotechnical Conditions Adjacent to the Turnagain Heights Landslide, Anchorage, Alaska
By Randall G. Updike, Harold W. Olsen, Henry R. Schmoll, Yousif K. Kharaka, and Kenneth H. Stokoe, Ill
Abstract
New data are presented concerning the geologic and geotechnical conditions adjacent to the Turnagain Heights landslide, Anchorage, Alaska. These data were obtained from investigations in Lynn Ary Park whose scope included drilling of two adjacent boreholes and undisturbed sampling therefrom. These investigations also included inclinometer surveys of the boreholes, downhole and cross-hole seismic measurements within and between the boreholes, and cone-penetrometer soundings at three locations in the vicinity of the boreholes. The undisturbed samples were logged in detail and analyzed for their geotechnical index properties and pore-fluid chemistry. Finally, the fabric of selected samples was examined with scanning electron microscopy.
The new data are compared with the 1967 geotechnical model that Seed and Wilson (1967) interpreted from data obtained during the post-1964 earthquake investigations, the model by which they showed that the sands near the middle of the Bootlegger Cove Formation should have liquefied before the sensitive clay could undergo significant strength loss. In that model, the materials in the formation were presumed to consist of liquefiable, discontinuous, and generally thin strata of silt and sand distributed within a marine deposit of clayey silt and silty clay. The strength of the materials decreased with depth to a minimum in the vicinity of sea level and increased with depth thereunder. The sensitivity of the clayey silt and silty clay was presumed to arise from leaching, to vary inversely with the strength of the material, and to vary from low to very high. It is noted that the 1967 model did not include materials of extremely high sensitivity, apparently because their abundance and distribution in the data obtained during the post-1964 investigations were not believed to be significant.
The new data show that the formation consists of three distinct zones. The upper zone contains abundant thin and discontinuous strata of silt and sand interbedded with relatively strong clayey silt and silty clay. The middle zone contains massive, discontinuous, and relatively dense strata of sand intercalated with a very soft deposit of clayey silt and silty clay whose sensitivity varies over a wide range. This deposit includes
1 University of Texas, Austin, TX 78712.
extremely sensitive material in thin strata with considerable lateral continuity, whose sensitivity appears to have been caused by geochemical reactions rather than by leaching of a marine deposit. The lower zone is comparable in strength to the upper zone but differs therefrom in that sands, pebbles, and cobbles are randomly distributed within a matrix of stiff clayey silt and silty clay.
The new findings in this study indicate that the failure plane of the Turnagain Heights landslide, in the middle zone of the formation, was associated both with (1) sands that are denser, and hence less susceptible to liquefaction, than was recognized in the 1967 model and with (2) extremely sensitive clays that appear to be more abundant and to have a wider distribution than was indicated in the earlier post-1964 earthquake investigations. The significance of these findings is that the sensitive clays now appear to be as critical as, and probably more critical than, the sands in governing ground failures that may occur in the Bootlegger Cove Formation during future large earthquakes.
INTRODUCTION
Anchorage lies at the head of Cook Inlet, a long and relatively narrow estuary in south-central Alaska, and is the focal point of a major urban corridor that includes more than half the population of the State (fig. 1). This entire region is prone to continual earthquake activity (Espinosa and Michael, 1984), in part because it is above the Benioff zone that descends landward from the Aleutian megathrust. This megathrust lies off the south coast of Alaska and marks the currently active boundary between the North American and the Pacific plates (Plafker and others, 1982; Stephens and others, 1984). Although Anchorage is about 300 km (185 mi) inland from this boundary and about 130 km (80 mi) west of the epicenter of the 1964 Alaska earthquake (surface wave magnitude, Ms=8.5, and moment magnitude, Mw=9.2), a unique combination of geology and topography resulted in a concentration of major landslides that occurred in and
Introduction
Gulf of Alaska
0 100 KILOMETERS
100 MILES ' <·
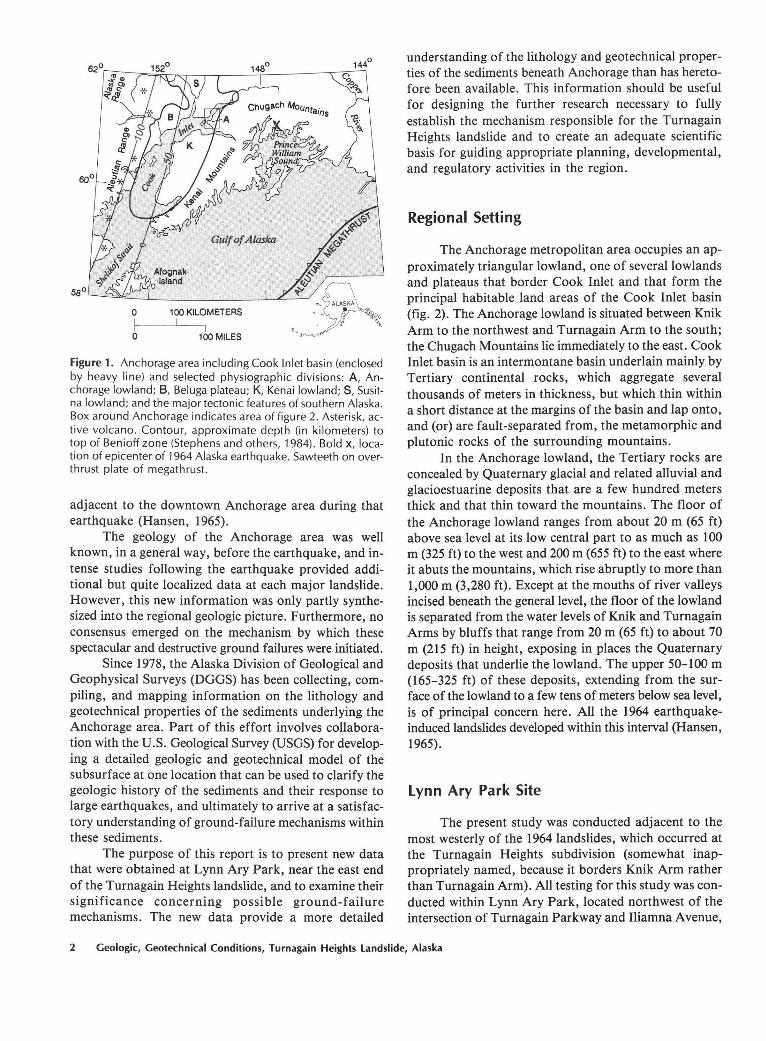
Figure 1. Anchorage area including Cook Inlet basin (enclosed by heavy li ne) and selected physiograph ic d ivisions: A, Anchorage lowland; 8 , Beluga plateau; K, Kena i lowland; S, Susitna lowland; and the major tectonic features of southern Alaska. Box around Anchorage ind icates area of figure 2. Asterisk, active volcano. Contour, approx imate depth (in kilometers) to top of Benioff zone (Stephens and others, 1984). Bold x, location of epicenter of 1964 Alaska earthq uake. Sawteeth on overthrust plate of megathrust.
adjacent to the downtown Anchorage area during that earthquake (Hansen, 1965).
The geology of the Anchorage area was well known, in a general way, before the earthquake, and intense studies following the earthquake provided additional but quite localized data at each major landslide. However, this new information was only partly synthesized into the regional geologic picture. Furthermore, no consensus emerged on the mechanism by which these spectacular and destructive ground failures were initiated.
Since 1978, the Alaska Division of Geological and Geophysical Surveys (DOGS) has been collecting, compiling, and mapping information on the lithology and geotechnical properties of the sediments underlying the Anchorage area. Part of this effort involves collaboration with the U.S. Geological Survey (USGS) for developing a detailed geologic and geotechnical model of the subsurface at one location that can be used to clarify the geologic history of the sediments and their response to large earthquakes, and ultimately to arrive at a satisfactory understanding of ground-failure mechanisms within these sediments.
The purpose of this report is to present new data that were obtained at Lynn Ary Park, near the east end of the Turnagain Heights landslide, and to examine their significance concerning possible ground-failure mechanisms. The new data provide a more detailed
understanding of the lithology and geotechnical properties of the sediments beneath Anchorage than has heretofore been available. This information should be useful for designing the further research necessary to fully establish the mechanism responsible for the Turnagain Heights landslide and to create an adequate scientific basis for guiding appropriate planning, developmental, and regulatory activities in the region.
Regional Setting
The Anchorage metropolitan area occupies an approximately triangular lowland, one of several lowlands and plateaus that border Cook Inlet and that form the principal habitable land areas of the Cook Inlet basin (fig. 2). The Anchorage lowland is situated between Knik Arm to the northwest and Turnagain Arm to the south; the Chugach Mountains lie immediately to the east. Cook Inlet basin is an intermontane basin underlain mainly by Tertiary continental rocks, which aggregate several thousands of meters in thickness, but which thin within a short distance at the margins of the basin and lap onto, and (or) are fault-separated from, the metamorphic and plutonic rocks of the surrounding mountains.
In the Anchorage lowland, the Tertiary rocks are concealed by Quaternary glacial and related alluvial and glacioestuarine deposits that are a few hundred meters thick and that thin toward the mountains. The floor of the Anchorage lowland ranges from about 20m (65 ft) above sea level at its low central part to as much as 100 m (325ft) to the west and 200m (655ft) to the east where it abuts the mountains, which rise abruptly to more than 1,000 m (3,280 ft). Except at the mouths of river valleys incised beneath the general level, the floor of the lowland is separated from the water levels of Knik and Turnagain Arms by bluffs that range from 20m (65 ft) to about 70 m (215 ft) in height, exposing in places the Quaternary deposits that underlie the lowland. The upper 50- 100m (165-325 ft) of these deposits, extending from the surface of the lowland to a few tens of meters below sea level, is of principal concern here. All the 1964 earthquakeinduced landslides developed within this interval (Hansen, 1965).
Lynn Ary Park Site
The present study was conducted adjacent to the most westerly of the 1964 landslides, which occurred at the Turnagain Heights subdivision (somewhat inappropriately named, because it borders Knik Arm rather than Turnagain Arm). All testing for this study was conducted within Lynn Ary Park, located northwest of the intersection of Turnagain Parkway and Iliamna Avenue,
2 Geologic, Geotechnical Conditions, Turnagain Heights landslide, Alaska

10 '
Deltaic
Elmendorf Moraine
61() os· L-----~--------------~------~~----~
0 5 KILOMETERS
0 5 MILES
Fi:gure 2. Geologic-physiograph ic units of the Anchorage lowland and adjacent areas. Bold hachured line indicates eastern boundary of Anchorage lowland; bold solid lines show approximate boundaries between units. Light-shaded area indicates cohesive fac ies of the Bootlegger Cove Formation, boundaries approximate except for northern extent, which is poorl y known. Princ ipal 1964 earthquake-induced landslides shown in dark shade. Map also shows location of Lynn Ary Park (approximately the area of fig. 3) and of other cu ltural features mentioned in text.
in sec. 23, T. 13 N., R. 4 W., Anchorage A-8 NW quadrangle (fig. 3). All activities were conducted behind (south of) the head scarp of the 1964 landslide on the generally undisturbed lowland surface. However, surface ground fissures parallel to the bluff line occurred throughout this area as far southward as Northern Lights Boulevard, about 700 m (2,300 ft) from the head scarp of the landslide (Hansen, 1965).
The information reported and used herein was obta.ined from several independent but coordinated investigations during a period of nearly 5 years by various combinations of the authors of this report: (l) In the fall of 1978, two adjacent boreholes (designated as B-3 and B-5, fig. 3) were drilled, and nearly continuous core samples were taken from them (Olsen and Updike); in these same two boreholes, in-place shear-wave velocity measurements were made (Stokoe), and inclinometer casings were installed (Olsen). (2) Examination and lithologic
0
0
TURNAGAIN HEIGHTS
LANDSLIDE
Lynn Ary Park
.C-18
LA-C-1.,_ ~~~~:?. Jr~-~~ _ , ___ ___ 6:3, ___ _ __ _
Iliamna Avenue
~ c: co iii ., 0 ,_ ~
"0 .. l .. '<:
50 METERS EXPlANATION
• CPT sounding 200 FEET • Geotechnical borehole
ANCHORAGE
N
Figure 3. Location of geotechnical boreholes and conepenetrometer test (CPT) soundings, v icinity of Lynn Ary Park. Boreholes B-3 and B-5 were made as part of this study; C-4, C-1 B, and C-108 were made shortly after the 1964 earthquake (Shannon and Wilson, 1964). Dashed line, position of cross section, plate 5. Landslide scarp (hachured line) is shown in approximately its original configuration.
logging of the core (Schmoll and Updike), geotechnical (Olsen) and geochemical (Kharaka) analyses on the undisturbed samples, and processing of the seismic data (Stokoe) followed during 1979-80. (3) Slope inclinometer measurements were made in October 1979 · and were repeated about 15 months later (Updike). (4) Electric CPT (cone-penetrometer test) soundings (designated as LA- C- 1, LA- C-2, and LA-C-3, fig. 3) were made at three locations near the 1978 boreholes (Updike). (5) Fabric analyses of selected samples of the 1978 core were done in 1983 using scanning electron microscopy (Updike).
Acknowledgments
We wish to thank numerous individuals who assisted us in the investigations. Principal among these are Terry Barber, DOWL Engineers, who logged the
Introduction 3

boreholes; Richard Hoar and Louis Long, University of Texas, who conducted the shear-wave velocity measurements; Gail March, DGGS, who assisted in the inclinometer survey; Bruce Douglas, George Edmond, and Brenda Meyer, Earth Technology Corporation, who conducted the CPT data acquisition and interpretation; Robert Oscarson and Bill Schwab, USGS, who assisted in the scanning electron microscopy study; Catherine Ulery and Mike Pritchard, DGGS, who prepared most of the figures and plates; and Cynthia Gardner, USGS, who assisted in compilation of the original large-scale and, later, more generalized lithologic logs. We also are grateful for the willing cooperation of the Municipality of Anchorage, who granted permission to work and to maintain facilities on park land under their jurisdiction. The cone-penetrometer testing and scanning electron micrograph study were supported by funds from a USGSADGGS cooperative agreement (C14-08-0001-A-0026) as part of the USGS Earthquake Hazard Reduction Program.
PREVIOUS INVESTIGATIONS
Previous geologic work of a general nature in the Anchorage lowland was dominated by a regional study of the Quaternary deposits of the upper Cook Inlet basin by Karlstrom (1964). In earlier but more detailed work in the Anchorage metropolitan area, Miller and Dobrovolny (1959) mapped the geology, defined the Bootlegger Cove Clay as a major stratigraphic unit underlying the downtown and some adjacent areas, and astutely predicted the possibility that earthquake-related strong ground motion might produce massive ground failure where that stratigraphic unit is exposed in bluffs. Cederstrom and others (1964) emphasized the groundwater aspects of the geology, and Trainer and Waller (1965) summarized knowledge of the subsurface stratigraphy.
Immediately following the 1964 earthquake, many of the landslides that occurred were intensively studied. The Turnagain Heights landslide, in particular, prompted considerable research into the cause and mechanics of these failures. Two causes were proposed in the resultant literature: liquefaction of sands (Shannon and Wilson, 1964; Seed and Wilson, 1967; Seed, 1968, 1976) and failure of sensitive silty clays (Kerr and Drew, 1965, 1968; Hansen, 1965; Long and George, 1966). The Turnagain Heights landslide has become a type case for both failure mechanisms. To 1987, no definitive agreement had been reached about which cause was primarily responsible for the landslides, or about whether sands or clays should be of predominant concern for future failure potential. However, recent studies by Idriss and Moriwaki (1982) and Updike ( 1984) strongly suggested that the sensitive
silty clays have the greater potential for failure and deserve further study. Updike (1983a) has examined the present condition of several inclinometer casings that were installed in and adjacent to the major Anchorage landslides immediately after the 1964 earthquake and has found no subsequent movement.
Other work that followed the 1964 earthquake resulted in interpretive geologic maps by Schmoll and Dobrovolny (1972) and in new dating of the Bootlegger Cove Clay by Schmoll and others (1972). More recently, as a result of studies north of downtown Anchorage at Government Hill (Updike, 1986; Updike and Carpenter, 1986), the name Bootlegger Cove Formation was formally adopted in preference to the previously used ''Bootlegger Cove Clay" in recognition of the unit's widespread textural variation (Updike and others, 1982). Detailed mapping of southwest Anchorage utilizing subsurface geotechnical data has been completed (Updike and Ulery, 1986; Ulery and Updike, 1983), and Schmoll and Barnwell (1984) have begun compilation of subsurface data intended to provide a broader and deeper, albeit less detailed, view of the subsurface deposits beneath the Anchorage lowland. Modifications to the understanding of the regional Quaternary geology resulting from these and related investigations have been made (for example, Reger and Updike, 1983a, 1983b; Schmoll and Yehle, 1983, 1985; Schmoll and others, 1984), and others are in progress.
GEOLOGY
The Anchorage lowland may be divided physiographically into four units whose land-surface characteristics are closely related to the geology of the underlying Quaternary deposits (fig. 2). The resulting geologic-physiographic units may be called (1) the central alluvia-estuarine, (2) the northern Elmendorf Moraine, (3) the eastern lateral moraine, and (4) the western glacio-deltaic units, respectively; each is described briefly as follows. (1) The central and lowest lying unit extends from downtown Anchorage both southward to Turnagain Arm and northeastward nearly to the Eagle River. The southerly-trending western part is the locus of the mainly fine grained Bootlegger Cove Formation (Pleistocene) deposited in ancestral Cook Inlet or glacial Lake Cook or both, whereas the northeastward extension comprises an alluvial plain consisting of gravel and sand that, in part, overlies the Bootlegger Cove Formation. (2) The northern unit is underlain by till and glaciofluvial deposits of the Elmendorf Moraine, formed about 13,000 years B.P. at the terminal position of the last glacier to enter the area. These deposits also partly overlap the Bootlegger Cove Formation. (3) The eastern unit includes lateral moraines older than the Elmendorf
4 Geologic, Geotechnical Conditions, Turnagain Heights Landslide, Alaska

Moraine that extend along the mountain front, as well as deposits of glacial, alluvial, and deltaic origin bordering and in part gradational to the Bootlegger Cove Formation. (4) The western unit consists of glaciodeltaic and glaciofluvial deposits that border the west side of the Bootlegger Cove Formation. The eastern, northern, and central geologic-physiographic units are transected by streams that emanate from the mountains and that have cut valleys across the lowland; the valleys generally become wider and more deeply incised as they approach the coast.
All but the central geologic-physiographic unit are characterized by hilly to hummocky terrain with intervening channels and depressions, and the geologic materials are dominantly either gravel and sand or diamicton (ranging in size from boulders to silt). They are relatively stable even where exposed in the sea bluffs. The central unit, however, has the notably smooth terrain typical of alluvial and estuarine deposits. The northeastern part of this plain, with a gentle gradient to the southwest, consists of gravel and sand that have provided both good foundation and good construction materials for much of the early phases of urban development.
The nearly level western part of the central geologicphysiographic unit is the domain of the Bootlegger Cove Formation. Beneath peat accumulations of variable thickness at the surface, a thin veneer mainly of sand overlies the finer grained deposits of the Bootlegger Cove Formation. These deposits, especially where they are intersected by the bluffs bordering the lowland, are of most concern because of their uniquely unstable response to the long-term seismic activity that can be inferred from the tectonic framework of the Cook Inlet basin. Significantly, the critical locale of the sea bluff-Bootlegger Cove Formation interface is in a zone that extends from the port area south of the Elmendorf Moraine across downtown Anchorage to just beyond the series of residential subdivisions to the southwest. All of the major landslides of the 1964 earthquake occurred within this zone, as did numerous older landslides of similar character that, by analogy to the events of 1964, most likely resulted from previous large-magnitude earthquakes. This zone has the greatest potential for future landslide activity (Dobrovolny and Schmoll, 1974).
In the vicinity of the Turnagain Heights landslide, the Bootlegger Cove is the predominant formation. It is overlain by about 5-6 m (15-20 ft) of sand of alluvial origin and is underlain by more than 100m (330ft) of various materials of probable glacial, estuarine, and alluvial origin that are not known in any detail (H.R. Schmoll and W.W. Barnwell, written commun., 1984). The Bootlegger Cove Formation, with a known thickness of at least 30m (100 ft), consists of a sequence of silty clays and clayey silts with interbedded silt, silty fine sand, and fine to medium sand, and with scattered pebbles and
cobbles in widely varying concentrations. The deposit was thought by Miller and Dobrovolny (1959) to be probably glaciolacustrine in origin, although a horizon containing mollusks of brackish marine habitat (eventually determined to be stratigraphically in place) indicated that it was at least partly marine (Karlstrom, 1964) or, more likely, estuarine, by analogy to modern Cook Inlet. Further work by Schmidt (1963) and Smith (1964) indicated on the basis of microfossils that much of the deposit could be ascribed to a marine (or estuarine) origin. Recent evidence suggests that some horizons may be of freshwater origin (E.M. Brouwers and R.M. Forester, written commun., 1983), a finding compatible with the estuarine environment.
Updike and Ulery (1986) concluded that the Bootlegger Cove Formation was deposited in a basin at least partly surrounded by glaciers to the north, west, and northeast. The glacier closest to the site was probably to the west, from which a fan delta was deposited, with materials grading from gravel and sand in the west to the finer materials at the Lynn Ary Park site. Such gradational relationships are thought to be typical of this formation, resulting in the accumulation of a variety of distinct sedimentary facies, each having an associated geotechnical signature. These facies, identified by F plus Roman numeral, were defined mainly from studies north of downtown Anchorage (Updike, 1982, 1986; Updike and Carpenter, 1986). This classification, based on both lithologic and engineering criteria, has been applied to the strata in southwest Anchorage (Updike and Ulery, 1986; Ulery and Updike, 1983) and is used also in this report. These Bootlegger Cove facies include:
F.I Clay, with very minor silt and sand F.II Silty clay and (or) clayey silt F.III Silty clay and (or) clayey silt, sensitive F.IV Silty clay and (or) clayey silt with thin silt
and sand lenses F.V Silty clay and (or) clayey silt with random
pebbles, cobbles, and boulders F. VI Silty fine sand with silt and clay lenses F. VII Fine to medium sand with traces of silt
and gravel The configuration of the base of the Bootlegger
Cove Formation cannot unequivocally be determined from data in the vicinity of this site. From regional considerations {Trainer and Waller, 1965; Ulery and Updike, 1983), the formation appears to have a highly irregular lower contact. The underlying deposits are mainly ( 1) a diamicton that may equate with the till of Knik age exposed on the northwest side of Knik Arm opposite Anchorage (Karlstrom, 1964, pl. 6, section X) and (2) the sand and gravel that form the principal aquifer underlying parts of the Anchorage lowland (Barnwell and others, 1972). These deposits represent, respectively, a time when glacier ice covered the area and then withdrew,
Geology 5
leaving the area exposed to subaerial conditions. Consequently, the irregular contact represents a period of erosion between the withdrawal of the glacier and the advance of the Bootlegger Cove waters into a local basin that was not covered by glacier ice. The position of the base of the Quaternary deposits, the thickness of the underlying Tertiary deposits, and the depth to the presumed metamorphic or plutonic basement rocks are not known at this site.
The sand overlying the Bootlegger Cove Formation is the distal portion of the Mountain View alluvial fan deposits (Schmoll and Barnwell, 1984) that extend southwestward from near the Eagle River (Zenone and others, 1974) to just west of this site (Schmoll and Dobrovolny, 1972, map unit an). This alluvium was deposited after the Bootlegger Cove waters had drained from their basin and during the later part of the time that glacier ice occupied the position of the Elmendorf Moraine. Thin layers (1-5 em (0.5-2 in.)) of tan silt (probably of eolian origin) and peat commonly overlie the alluvium, and, in places, the accumulation of this material exceeds 1 m (3 ft).
In the time following drainage of the Bootlegger Cove water, perhaps during and just after deposition of the alluvial fan, when glacier ice was still advanced into the Cook Inlet basin and the climate was still relatively cool (the period from about 13,000 to 10,000 years B.P.), the upper part of the Bootlegger Cove Formation was subjected to permafrost conditions. We found no direct evidence for this at the Lynn Ary Park site, but relict permafrost has been recorded at scattered localities within the Anchorage lowland (Lee, 1977) and could have been present here as well. During and after this time, for approximately the 10,000-yr duration of the Holocene, the stratigraphic sequ~nce has undergone isostatic rebound coupled with episodic tectonic uplift (Brown and others, 1977) that, when combined with fluctuations in sea level, has caused bluff topography to form along Knik Arm and elsewhere around the basin. The effect of tidal inlet erosion, enhanced by slope instability of the Bootlegger Cove Formation, has been gradual bluff retreat. Seismic events in the region have further hastened this retreat by causing massive landslides, of which the Turnagain Heights landslide of 1964 is only the most recent example.
PRESENT INVESTIGATION
Drilling and Sampling
Drilling was accomplished with hollow-stem augers using a truck-mounted Mobil B-50 rotary drill rig. Nearly continuous, undisturbed samples were taken ahead of the auger with Shelby tubes. Downhole and crosshole seismicvelocity measurements were obtained within and between
the drill holes at intervals during the progress of drilling and sampling. Upon completion of these procedures, aluminum inclinometer casings were installed in each hole. (See fig. 3 for location of the boreholes B-3 and B-5.)
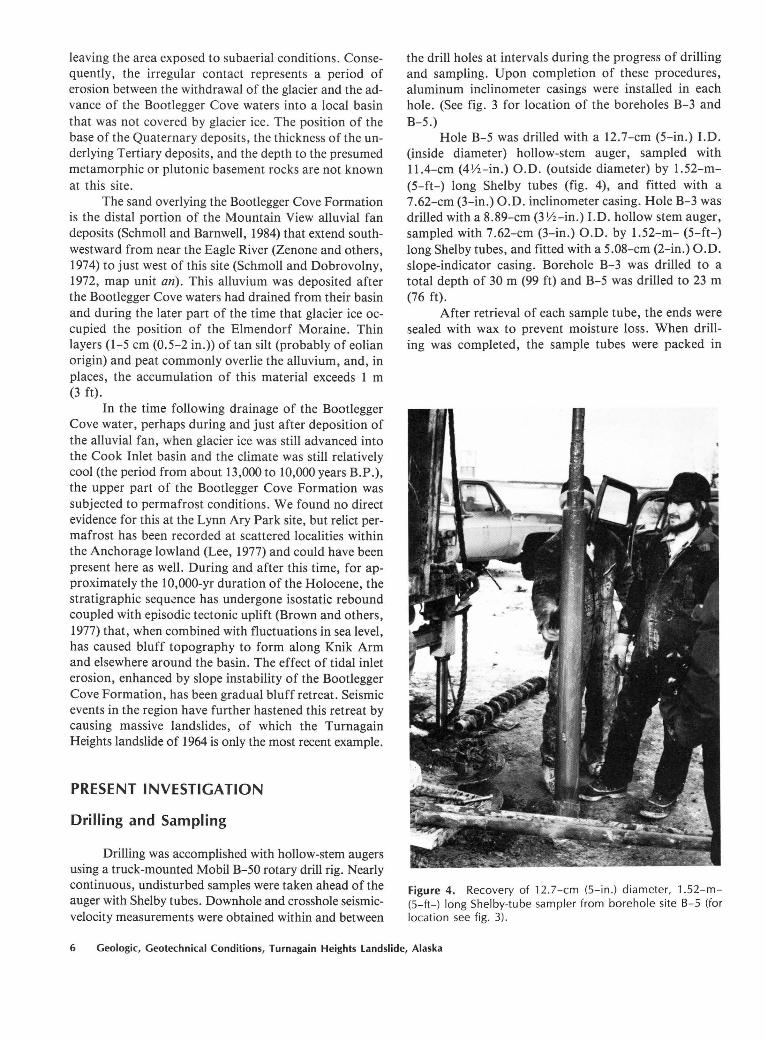
Hole B-5 was drilled with a 12.7-cm (5-in.) I.D. (inside diameter) hollow-stem auger, sampled with 11.4-cm (4\11-in.) O.D. (outside diameter) by 1.52-m(5-ft-) long Shelby tubes (fig. 4), and fitted with a 7.62-cm (3-in.) O.D. inclinometer casing. Hole B-3 was drilled with a 8.89-cm (3 Y2-in.) I. D. hollow stem auger, sampled with 7.62-cm (3-in.) O.D. by 1.52-m- (5-ft-) long Shelby tubes, and fitted with a 5.08-cm (2-in.) O.D. slope-indicator casing. Borehole B-3 was drilled to a total depth of 30 m (99 ft) and B-5 was drilled to 23 m (76 ft).
After retrieval of each sample tube, the ends were sealed with wax to prevent moisture loss . When drilling was completed, the sample tubes were packed in
Figure 4. Recovery of 12.7-cm (5-in.) diameter, 1.52-m{5-ft-) long Shelby-tube sampler from borehole site B-5 (for location see fig. 3).
6 Geologic, Geotechnical Conditions, Turnagain Heights Landslide, Alaska

Figure 5. X-ray photographs of core samples in Shelby-tube samplers. Area A indicates disturbed sample. B is an irregu lar sand pocket within facies F.IV. C is a transition from clayey si lt (above) to si lty clay (below) of fac ies F.IV. Dashed line was drawn on original X-ray photograph as guideline for cutt ing the Shelby tube; hand-written alpha-numeric symbols are original sample mark ings.
styrofoam and air-freighted to the USGS laboratory, Denver, Colo.
During drilling and sampling, field logs for B-3 and B-5 were maintained to record the performance of the drilling and sampling equipment, the cuttings brought to the surface by the hollow-stem auger, and the material at the ends of the tube samples. These logs were used, together with data from previous nearby drill holes (Shannon and Wilson, I964), to guide the progress of drilling, sampling, and in-place shear-wave velocity measurements . Information from these logs concerning sample recovery and resistance of sampler penetration is included on plates I and 2. The primary cause of sample loss was separation along sand layers during withdrawal of the Shelby tube from the borehole, causing the sample to drop out of the Shelby tube.
Laboratory Analysis
The sample tubes were initially X-rayed (fig. 5) at the Aerospace Division Laboratories of Martin Marietta Corporation, Denver, Colo. This information was used as a guide to subdivide the I.52- m (5-ft) sample tubes into two or three sections to facilitate extrusion and logging. The extrusion and logging were carried out in a high-humidity room to minimize desiccation.
The steps involved in logging each core section included (figs. 6 and 7) the following: 1. Extruding the core hydraulically 2. Determining average density from the weight of the
tube plus the sample prior to extrusion and from the weight and internal volume of the tube following extrusion
3. Trimming the sample surface to expose its texture and structure
4. Photographing the trimmed surface 5. Logging the visual lithology of the sample on a I : 1
scale
Figure 6. Photograph of 12.7-cm- (5-in .-) diameter core from the Bootlegger Cove Formation. Su rface has been tr immed to revea l texture and structures.
Present Investigation 7

Figure 7. High-humidity room, USGS, Denver, Colo., where detailed log and index-property tests were performed.
6. Conducting torvane and pocket-penetrometer measurements at intervals along the trimmed surface
7. Collecting specimens for moisture-content determinations
8. Resealing each core section with cheesecloth and microcrystalline wax.
After each core section was logged, it was subsampled at selected locations for geotechnical indexproperty measurements and for chemical analysis of the interstitial fluids.
Most of the information obtained from the above procedures is presented on plates I and 2, together with selected sampling information and with facies designations interpreted from the visual description of the materials. More detailed information concerning the pore-water chemistry and the geotechnical index properties is presented in tables I, 2, and 3.
In-place Seismic Measurements
Both downhole and crosshole methods were used to obtain information on the in-place shear-wave velocity
of the subsurface materials. The approaches used were based on theory and procedures developed during the last decade (Schwarz and Musser, I972; Stokoe and Woods, I972; Ballard and McLean, I975; Stokoe and Abdelrazzak, I975; Auld, I977; Stokoe and Hoar, I978; Wilson and others, I978; and Woods, I978). Details concerning the techniques used and the results obtained are documented elsewhere (Hoar and Stokoe, I980). The material that follows summarizes pertinent information in that report.
Most of the data were obtained by generating and measuring shear waves in a downhole configuration. Among the four downhole configurations used, the one illustrated in figure 8 was the most useful. This configuration included two receiver units mounted on a rod whose length could be varied from I to 3 m (3 to IO ft) (fig. 9). The upper receiver was positioned within the hollowstem auger. The lower receiver was in the space beneath the auger from which material had been extracted with a Shelby-tube sampler. The seismic energy was generated by driving a 4.55-kg (IO-lb) sledge hammer against steel anvils mounted in concrete blocks embedded in the soil at ground level near the drill holes.
8 Geologic, Geotechnical Conditions, Turnagain Heights landslide, Alaska

Table 1. Chemical composition and pH of pore water extracted from samples of the Bootlegger Cove Formation acquired from boreholes B-3 and B-5 [Values in milligrams per liter; see plates 1 and 2 for sample localities]
Sample Elevation Facies
Ca (m) F-Na K
B-5-2D 12.28 IV 287 34 120 B-5-4A 10.14 II 387 33 73 B-5-5C 8.84 II 506 18 32 B-5-7A 7.31 III 580 17 18
B-5-7B 6.84 III 582 19 15 B-5-8B 6.08 III 506 12 14 B-5-8C 5.63 III 508 13 12 B-5-8D 5.32 III 517 13 10
B-5-2BA 2.04 III 557 15 14 B-5-5EA -1.21 III 683 16 15 B-5-7GA -5.82 v 770 22 16 B-5-91C -9.82 v 736 20 16
1TDS, calculated total dissolved solids.
The crosshole data were obtained with the configuration illustrated in figure 10, which differs from that in figure 8 only in that the seismic-energy source was a split-spoon sampler located in the adjacent drill hole. The energy was generated by striking a hammer on the drill rod connected to the split-spoon sampler.
The results obtained from the seismic tests are summarized in figure 11. They show, for successive depth intervals, the range in velocities interpreted from all the data obtained with the downhole method. Also shown are two crosshole measurements at an elevation of about 2 m (6.5 ft), which are consistent with the downhole measurements at that elevation. For comparison, figure 11 shows the facies in the profile in accordance with those shown on plates 1 and 2.
The depth intervals used for downhole seismic measurements do not accurately coincide with the facies boundaries drawn from the borehole logs. This problem reflects the difficulty of selecting appropriate depth intervals for downhole seismic measurements from the field log maintained during drilling and sampling.
One consequence of this problem appears to be reflected in the direct association of higher shear-wave velocities with soft silty-clay strata (F.II and F.III) and of lower shear-wave velocities with sand strata (F. VI and F.VII). This correlation appears questionable because soft clays generally exhibit lower shear-wave velocities than do sands.
A more reasonable correlation requires the assumption that the higher values of shear-wave velocity are associated with the sand strata (F. VI and F. VII) and that the adjacent lower values of shear-wave velocity are associated with the silty-clay strata (F.II and F.III) above,
Cl 504 HC03
c pH TDS1 Mg
organic
134 88 980 410 8 8.02 2061 42 23 440 760 120 8.24 1878 27 21 220 1100 110 8.11 2034 26 15 120 1400 70 8.17 2246
23 12 140 1400 40 8.21 2231 18 6 480 710 0 8.18 1746 15 14 630 660 0 8.16 1852 16 25 480 760 20 8.19 1841
18 18 260 1100 55 8.25 2037 16 14 560 1200 50 7.91 2554 23 20 60 2000 70 8.11 2981 24 23 240 1700 35 7.99 2794
between, and below the sand strata. This assumption further associates the lowest shear-wave velocity with the extremely weak material in the undisturbed core at an elevation of about 7 m (25ft), as indicated by the pocketpenetrometer data on plate 1. Further, this assumption is consistent with the data from the crosshole where the seismic source and receiver were known to be positioned in a soft clay stratum. Finally, this assumption is consistent with the detailed interpretation of the seismic data documented elsewhere (Hoar and Stokoe, 1980).
Another consequence of the mismatch between facies boundaries and those for the depth intervals involved in the downhole seismic measurements is that the shear-wave velocity values reflect the combined effects of materials from adjacent facies. Thus, the quantitative significance of the shear-wave velocity values, and their use for other purposes, is limited. Nevertheless, the data are of particular interest in that they show marked differences in shear-wave velocity for strata in the middle zone of the Bootlegger Cove Formation, where the largest values are in the sand strata and the value for the sensitive clay between the sand strata is low, compared with that for the sensitive clay beneath the lower sand stratum.
Inclinometer Survey
Upon completion of the drilling, sampling, and shear-wave velocity studies, we placed aluminum inclinometer casings in each hole (not grouted); the casing sections were riveted together and caps installed on the bottom and top of each casing.
Present Investigation 9

Table 2. Geotechnical index-property data for core from borehole B-5 [kN/m2
, kilometers per square meter; leaders (--), no data; activity, liquidity index, sensitivity expressed as ratios]
Plastic Liquid Plasticity Elevation Depth Sand Silt Clay limit limit index
(meters) (percent)
14.48 5.94 22 50 28 16 23 7 14.29 6.13 3 65 32 18 30 12 14.22 6.20 7 67 26 17 24 7 14.14 6.28 0 64 36 17 29 12 14.10 6.32 16 72 12
14.06 6.36 22 69 9 13.89 6.53 3 52 45 17 24 7 13.82 6.60 0 62 38 20 38 18 13.45 6.97 2 71 27 16 24 8 12.32 8.10 1 54 45 20 34 14
12.24 8.18 0 68 32 15 27 12 12.15 8.27 0 62 38 17 31 14 12.05 8.37 4 70 26 10.73 9.69 7 73 20 16 20 4 10.62 9.80 2 83 15
10.54 9.88 0 72 28 18 24 6 10.17 10.25 8.86 11.56 1 53 46 20 40 20 8.80 11.62 0 55 45 21 33 12 7.42 13.00 3 49 48 21 32 11
6.79 13.63 6.74 13.68 6.44 13.98 6.36 14.06 6.17 14.25
5.92 14.50 5.65 14.77 5.34 15.08 3.44 16.98 3.09 17.33
3.03 17.40 68 28 4 3.00 17.42 1 53 46 18 28 10 2.95 17.47 2.58 17.84 -.08 20.50
-.45 20.87 -.81 21.23
-1.06 21.48 -1.10 21.53
The initial measurements of casing profiles were conducted on October 15, 1979, approximately 1 year after installation. A Sinco Digitilt Inclinometer, model 50306 (Instrument No. SIN C370), was used for the survey. This instrument has a sensitivity of one part in 10,000, or about 10 seconds of arc at 0° inclination. The
U nd istu rbed Remolded Water Liquidity vane vane
Activity content index strength strength Sensitivity (pet.) kN/m 2 kN/m2
0.25 19 0.43 59 11 5.4 .38 16 .17 .27 19 .29 110 46 2.4 .33 25 .67 102 42 2.4
20
11 .21 22 .71 115 51 2.3 .47 .30 19 .38 85 22 3.9 .31 26 .43 81 8 1.0
.38 24 .75 42 15 2.8
.37 23 .43 72 34 2.1 16
.20 17 .25 73 18 167 50 3.3
.21 20 .33 138 52 2.7 160 58 2.8
.43
.27 25 .33 144 62 2.3
.23 25 .36 40 11 3.6
32 61 26 2.3 34 58 22 2.6 27 18 7 2.6 27 18 6 3.0 33 6 .9 6.7
33 6.8 2.8 2.8 28 24 10 2.4 35 18 8 2.3 31 5.6 2.2 2.5 26 13 2.2 5.9
.22 36 1.80 30 10 166 53 3.1 33 42 20 2.1
34 58 21 2.8 30 40 15 2.7 29 40 14 2.9 31 42 15 2.8
specification error of measurement in a 30-m- (100-ft-) deep hole should be less than ±0.5 em (±0.2 in.).
The sensor, containing two servo-accelerometers mounted with their sensitive axes 90 ° apart, was inserted into the casing, riding down the casing on spring-loaded wheels that follow grooves inside the casing. The sensor
10 Geologic, Geotechnical Conditions, Turnagain Heights Landslide, Alaska

Table 3. Geotechnical index-property data for core from borehole B-3 [kN/m2
, kilometers per square meter; leaders (--), no data; activity, liquidity index, sensitivity expressed as ratios]
Plastic Liquid Plasticity Elevation Depth Sand Silt Clay limit limit index
(meters) (percent)
4.65 15.77 9 52 39 19 27 8 4.52 15.90 86 8 6 3.27 17.15 77 15 8 3.12 17.30 3 43 54 21 34 14
1.04 19.38 3 63 34 18 24 6 -1.12 21.54 0 58 42 23 32 9 -1.28 21.70 0 53 47 21 37 16 -4.21 24.63 14 23 63 23 36 13
-4.38 24.80 9 51 40 20 30 10 -5.41 25.83 9 50 41 23 26 13 -5.56 25.98 8 56 36 20 30 10 -6.00 26.42 6 48 46 23 35 12
-6.89 27.31 2 41 57 23 36 13 -7.11 27.53 7 46 47 21 27 6 -7.53 27.95 5 52 43 21 29 8 -8.46 28.88 3 42 55 23 39 16 -8.65 29.07 14 48 38 16 25 9
Borehole B-5
Assumed paths of body waves
}
Uncased borehole created by sampling
3-D velocity transducer
Figure 8. Downhole configuration used to determine shearwave velocities shown in figure 11 (modified from Hoar and Stokoe, 1980).
Undisturbed Remolded Water Liquidity vane vane
Activity content index strength strength Sensitivity (pet.) kN/m 2 kN/m2
0.21 32 1.63 12 5 2.4 23 19
.26 28 .54 32 13
.18 21 .50 69 21 3.3
.21 28 .56 44 14 3.1
.34 46 1.56 42 12 3.5
.29 25 .15 34 14 2.4
.25 25 .50 58 18 3.2
.32 24 .08 94 25 3.8
.28 28 .80 12 5 2.4
.26 25 .17 25 4 6.3
.23 21 -.15 80 25 3.2
.13 23 .33 74 20 3.7
.19 22 .13 91 25 3.6
.29 22 -.06 121 34 3.6
.24 25 1.0 18 7 2.6
was oriented to follow the casing grooves nearest to the north-south plane. The sensor was lowered to the base of the hole by the electrical cable connecting it to the surface digital indicator instrument. After 10 minutes-to reach temperature equilibration-the sensor was raised from the base of the hole by 0.6-m (2-ft) intervals. At each interval, readings were recorded for both the northsouth and east-west axes. When the sensor reached the top of the casing, it was removed, rotated 180°, and reinserted to the bottom of the hole; then a second series of measurements was recorded.
During this initial 1979 inclinometer survey, it was noted that a Bootlegger Cove-type clay-silt slurry had filled both casings to similar depths below the ground surface, B-3 to a depth of 15.7 m (51.5 ft) and B-5 to a depth of 16.4 m (53.8 ft). Below these depths, the buoyancy effect of the slurry would not allow sensor penetration. Thus, B-3 was filled with a column of 13.6 m (44.6 ft) of slurry and B-5 with 6.3 m (20. 7 ft) of slurry in a 13-month period. The water column above these slurry zones was relatively clear to a static level of about 3.6 m (11.8 ft) below the ground surface.
On January 20, 1981, the two casings were reentered. A drill-stem rod with a rotary bit was lowered down the larger diameter casing (B-5) and the slurry was jetted out of the casing by hydraulic pressure through the bit. The elevation of the upper surface of the slurry was nearly identical to that on October 15, 1979. The jetting
Present Investigation 11

IIIJ
--
·-
Figure 9. Velocity-transducer array used to determine shearwave velocities in both dow nhole and crosshole configurations.
equipment could not be used in the small diameter casing (B-3), although the slurry surface elevation was also the same as in 1979. After the jetting operation, hole B-5 was again surveyed using the same equipment and techniques as those used in the initial survey.
The slurry in the casings, containing clayey silt, was probably created by disturbance of the sensitive clay adjacent to the hollow-stem auger during drilling. The slurry could have leaked into the casings through casing joints and rivet holes. The inclinometer surveys indicated no cracks or breaks in the casings that could also have provided paths for the slurry to enter the casings.
The inclinometer-casing profiles derived by plotting cumulative deflection from the base of the hole to the top are given, for B-3 and B-5, in figures 12 and 13, respectively. The basic data are documented elsewhere (Updike, 1983b). The smooth, curved profiles of the inclinometer casings show no abrupt deflections or breaks.
Borehole B-5
auger
Uncased { borehole
created by sampling
Borehole B-3
auger
Figure 10. Crosshole configuration used to determine shear-wave velocities in figure 11 (from Hoar and Stokoe, 1980).
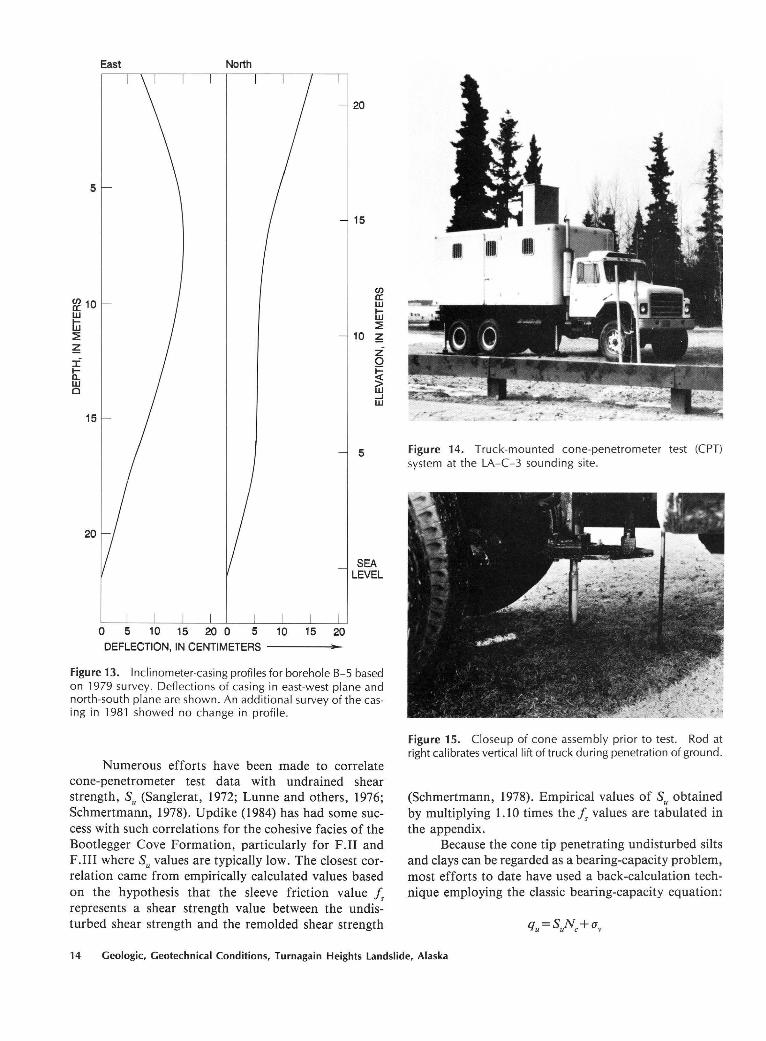
The east-west profile for B-5 probably reflects a slight bowing of the casing in the original auger hole during installation. Identical profiles from the 1979 and 1981 surveys for borehole B-5, figure 13, indicate that no movement occurred within that time interval.
Electric Cone-Penetrometer Tests
Three cone-penetrometer tests (CPT) were performed at Lynn Ary Park (see fig . 3) on April 5 and 7, 1982; they ranged in total depth from 30 to 45 m (100 to 150 ft) . The resultant soundings are shown on plate 3, including the friction resistance, cone resistance, and friction ratio . Two soundings (LA-C-1 and LA-C-3) penetrated to the base of the Bootlegger Cove Formation, where a substantially more resistant material, possibly a diamicton, was met.
The CPT consists of pushing an instrumented conetipped probe into the soil and continuously recording the resistance of the soil to that penetration. The conepenetrometer tests were conducted at Lynn Ary Park in general accordance with the specifications of the American Society for Testing and Materials (1975) for an electric cone penetrometer. The test equipment consisted of a cone assembly, a series of hollow sounding rods, a hydraulic frame to push the cone and rods into
12 Geologic, Geotechnical Conditions, Turnagain Heights landslide, Alaska

(f) 0:: w t-w :::?i ~ z 0 i=
~ .J w
20 .--------------------------------r-.
15
10
5
SEA LEVEL
-5
-10
-15
-20
100
en Q)
~ -
~ ....-------,-------------- IV
,----1-----,..---l- - -- ----------
________ I • I ==== II
8--------------o---~ 0
-------- ---~
--,--------------
'---------------
EXPLANATION
Depth {I . Mean value intenal ~osshole measurements
'---y--) Range of downhole
measurements
150 200 250 300 SHEAR-WAVE VELOCITY, IN METERS PER SECOND
350
III
-
v
-
Figure 11. Shear-wave velocities and dominant facies as generalized from boreholes B-3 and B-5 in the Bootlegger Cove Formation (modified from Hoar and Stokoe, 1980).
the soil, an analog strip-chart recorder, and a truck to transport the test equipment and to provide the needed 13,182-kg (20-ton) thrust (reaction) capacity (fig. 14). The cone penetrometer (figs. 15 and 16) consists of a conical tip with a 60 ° apex angle and a cylindrical friction sleeve above the tip. The cone assembly used on this project has a cross-sectional area of 15 cm2 (2.3 in. 2) and a sleeve-surface area of 200 cm2 (31 in. 2). The interior of the device (fig. 17) is instrumented with strain gauges, allowing simultaneous measurement of cone and sleeve resistance during penetration. Continuous electric signals from the strain gauges are transmitted by a cable in the sounding rods to the recorder at the ground surface.
The reduction of field CPT data requires the digitization of the field strip-chart recordings and subsequent computer processing. Both were accomplished at the data-processing center of the Earth Technology Corporation (ERTEC), Long Beach, Calif. In addition to field data reduction, subroutines were used to evaluate CPT soil-behavior types, equivalent Standard Penetration Test (SPT) blow counts, estimated clay shear strengths versus depth, and cone resistance versus friction ratio for selected depth intervals. Interpretation of
5
(f) 0:: ~ 10 w :::2 ~ :i' t-a.. w Cl 15
20
East North ,------,------,---,-------,------,--.------,-----,r---r-.------r-.---r-,., 21.3
0 5 1 0 15 20 25 30 35 40 0 5 1 0 15 20
DEFLECTION, IN CENTIMETERS---~-
20
15
(f) 0:: w t-w :::?i
10 ~ z 0 i= ~ w .J w
5
SEA LEVEL
Figure 12. Inclinometer-casing profiles for borehole B-3 based on 1979 survey. Deflections of casing in east-west plane and north-south plane are shown.
the field data (CPT and adjacent borehole logs) for input into the computer routines was accomplished at the ERTEC facilities in Long Beach, Calif.
The CPT soil-behavior type predictions are tabulated in the appendix to this report. Soil types were estimated with the ER TEC computer program by tracking the cone-end bearing and average-friction ratio at each requested depth through the guidelines of a classification chart (fig. 18) that has been calibrated to the equipment used in this project (Douglas and Olsen, 1981) and to Anchorage soils (Updike, 1984). As noted by Updike (1984), this predictive method has some inherent shortcomings. The continuous penetration-resistance profile (pl. 3) is the primary data for stratigraphic characterization, and the soil-type tabulations should be considered as supplemental. Furthermore, the tabulated data in the appendix are defined on the basis of the response of a layer of soil to the large shear deformations imposed during penetration. These data are not necessarily predictions of grain-size distribution. In general, however, the soilbehavior types defined by the CPT correlate well with the Unified Soil Classification System indices (Douglas and Olsen, 1981).
Present Investigation 13
5
~ 10 w ti:i ~
~ ::f 1-a. w 0
15
East North
20
15
en a: w 1-w ~
10 ~ z 0 i=
~ _J w
5 Figure 14. Truck-mounted cone-penetrometer test (CPT) system at the LA-C-3 sounding site.
20
0 5 10 15 20 0 5 10 15 20 DEFLECTION, IN CENTIMETERS ___ ___,_
SEA LEVEL
Figure 13. Inclinometer-casing profiles for borehole B-5 based on 1979 survey. Deflections of casing in east-west plane and north-south plane are shown. An additional survey of the casing in 1981 showed no change in profi le.
Numerous efforts have been made to correlate cone-penetrometer test data with undrained shear strength, Su (Sanglerat, 1972; Lunne and others, 1976; Schmertmann, 1978). Updike (1984) has had some success with such correlations for the cohesive facies of the Bootlegger Cove Formation, particularly for F.II and F .III where Su values are typically low. The closest correlation came from empirically calculated values based on the hypothesis that the sleeve friction value is represents a shear strength value between the undisturbed shear strength and the remolded shear strength
Figure 15. Closeup of cone assembly prior to test. Rod at right calibrates vertical lift of truck during penetration of ground .
(Schmertmann, 1978). Empirical values of Su obtained by multiplying 1.10 times the is values are tabulated in the appendix.
Because the cone tip penetrating undisturbed silts and clays can be regarded as a bearing-capacity problem, most efforts to date have used a back-calculation technique employing the classic bearing-capacity equation:
14 Geologic, Geotechnical Conditions, Turnagain Heights Landslide, Alaska
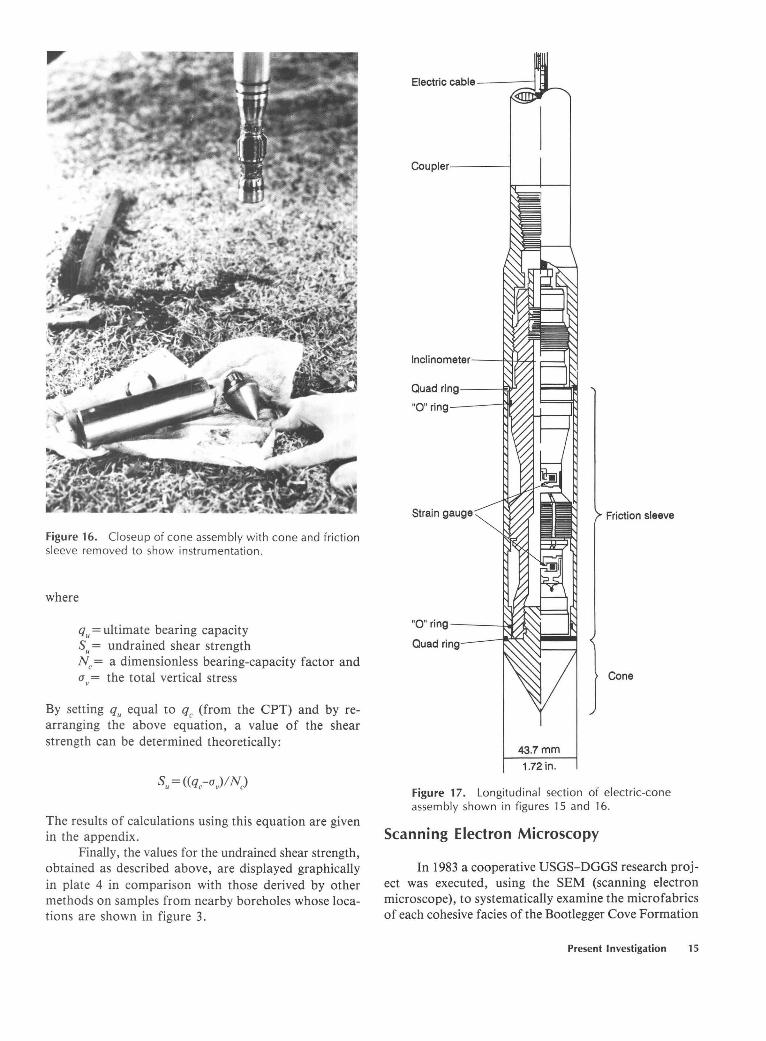
Figure 16. Closeup of cone assembly with cone and friction sleeve removed to show instrumentation .
where
q u =ultimate bearing capacity Su = undrained shear strength N c = a dimensionless bearing-capacity factor and a v = the total vertical stress
By setting qu equal to qc (from the CPT) and by rearranging the above equation, a value of the shear strength can be determined theoretically:
The results of calculations using this equation are given in the appendix.
Finally, the values for the undrained shear strength, obtained as described above, are displayed graphically in plate 4 in comparison with those derived by other methods on samples from nearby boreholes whose locations are shown in figure 3.
Coupler-----!
Friction sleeve
Cone
43.7 mm
1.72 in.
Figure 17. Longitudinal section of electric-cone assembly shown in figures 15 and 16.
Scanning Electron Microscopy
In 1983 a cooperative USGS-DGGS research project was executed, using the SEM (scanning electron microscope), to systematically examine the microfabrics of each cohesive facies of the Bootlegger Cove Formation
Present Investigation 15

1000 800 80,000
600 60,000 a: w
400 40,000 ti:i 1- :::'!: 0 w 0 a: u. 200 20,000 :3 w a: a ~ (/J :::>
10,000 ffi a 100 (/J 80 8000 a.. a: 6000~ w 60 a.. 0 (/J
40 4000 ~ z 0 1- z ?; 0 u.i 20 2000 :::::!
::.:: () ?; z ~
10 1000 u.i tii 800~ en 8 w 6 600 ~ a: (/J w en z 4 400 ~ 0 () w z
2 200 8
100
2 3 4 5 FRICTION RATIO, IN PERCENT
Figure 18. Graph of friction ratio versus cone resistance from cone-penetrometer test (CPT) data showing soi !-behavior domains (shaded areas) for the Bootlegger Cove Formation at Lynn Ary Park. Boundaries of each facies polygon are theoretically interpolated from existing soil-behavior data obtained from previous laboratory and field geotechnical testing correlated with the CPT values.
(Updike and Oscarson, 1987). Three core sections from boreholes B-3 and B-4 at the Lynn Ary Park site were included in the suites of specimens examined.
The Lynn Ary Park core sections were carefully packed and shipped express mail from Denver to Menlo Park. The original wax seals were cut open, the previous descriptions verified, and 15 subsamples were taken from the centers of the core sections using a wire saw. The original orientation was noted. Each sample, an approximately 1.5-cm cube, was wrapped in lens tissue and submerged in distilled water to maintain a saturated condition.
For examination with a scanning electron microscope, the samples were required to be 100 percent free of pore fluid moisture. A recently developed technique, critical-point drying, was used to best preserve the original fabric of the samples (that is, to prevent shrinkage and structure collapse). Details of the theory and method are given elsewhere (Bennett and others, 1977; M.E. Torresan, unpub. data, 1983). The pore water was gradually replaced using intermediate fluids, ultimately reaching sample saturation with monochlorotrifluoromethane (Freon 13). Each sample was inserted into a pressuretemperature bomb. At a critical point of elevated temperature and pressure, the Freon 13 flashed to the gaseous
state. Draining the gaseous Freon 13 from the pressure chamber left the samples 100 percent dry with minimal resultant fabric disturbance. From the dried samples, fresh surfaces were prepared for the Cambridge Stereoscan 180 SEM using standard methods of mounting and gold-palladium coating.
The research by Updike and Oscarson (1987) documented the variation in fabric for each of the facies of the Bootlegger Cove Formation. The Lynn Ary Park samples from all three core sections revealed fabrics that were, to varying degrees, typical of the open-flocculated structure seen in other sensitive or low-strength cohesive soils (F.III). Representative images of the fabrics observed in those samples are shown in figures 19 through 25. Specifically, the sensitive facies, F.III, which was distinguished on the basis of geotechnical properties, consisted predominantly of clay-size particles with silt grains usually randomly dispersed throughout (fig. 19). The open-flocculated fabric (figs. 20 and 21) agreed closely with the ''card-house'' structure predicted by Goldshmidt (1926) and Casagrande (1932), and summarized by Collins and McGown (1974). Whereas, in views normal to bedding planes the metastable arrangement of grains was not obvious (fig. 22), in views parallel to the bedding planes an apparently fragile framework of individual clay platelets was evident in edge-to-edge and edge-to-face arrangements (figs. 23 and 24). In samples from core sections of lower sensitivity, the clay structure was partially collapsed, and silt grains were more abundant (fig. 25).
These observations are significant because the predicted, but long-debated ''card-house'' fabric does exist within the sensitive-clay zone of the Bootlegger Cove Formation. The high void ratio and the fragile intricacy of the framework are remarkable for soils more than 14,000 years old, currently existing under more than 25 m (83 ft) of overburden. Not surprisingly, under severe seismic loading conditions this framework would tend to collapse. The widespread collapse of this fabric within a distinct soil horizon could result in physically observable ground failure. Thus, it is remarkable that, although the soil sequence has been subjected to several great earthquakes during the past 10,000 years, much of what is believed to be the original Pleistocene fabric is still intact today.
Two factors may help to account for the apparent discrepancy between the current fabric and the probable stress history. First, observations from samples collected elsewhere in Anchorage have revealed that in some cases the open-flocculated structure occurs as "islands" surrounded by collapsed (face-to-face) clays. This suggests that previous strain occurred along distinct failure surfaces and that the intervening metastable fabric has ''ridden" on the submicroscopic failure surfaces.
Second, as will be discussed more fully later, porewater leaching or geochemical reactions or both may play
16 Geologic, Geotechnical Conditions, Turnagain Heights Landslide, Alaska
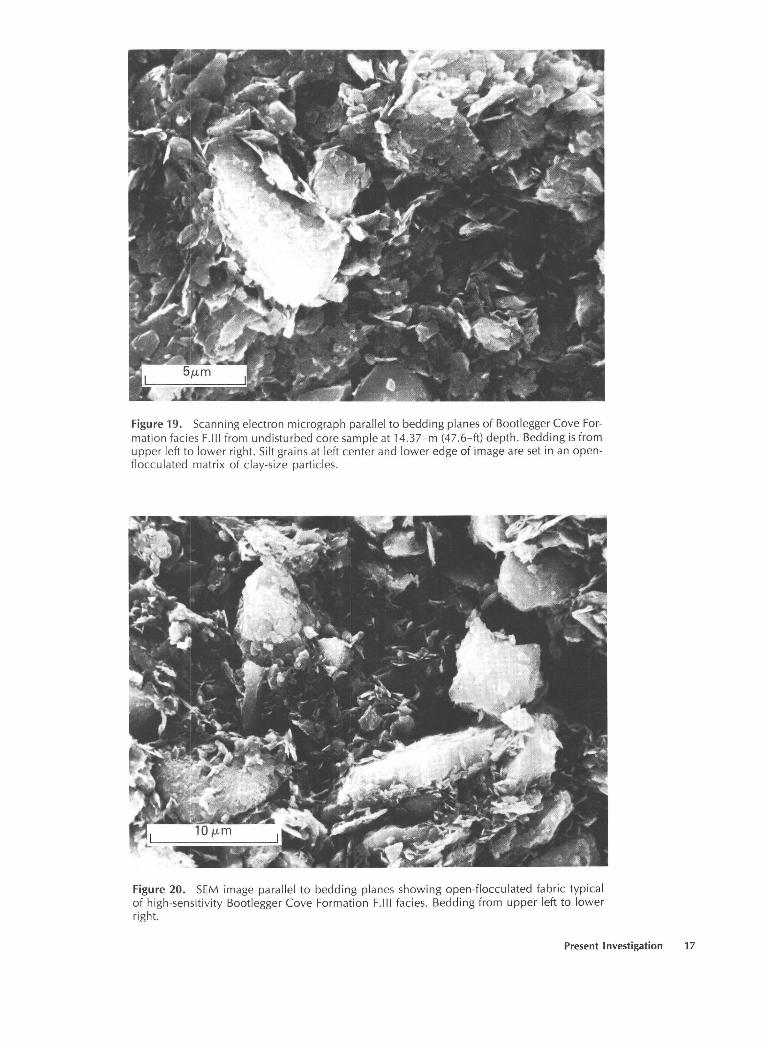
Figure 19. Scanning electron micrograph parallel to bedding planes of Bootlegger Cove Formation facies F.lll from undisturbed core sample at 14.37 -m (47.6-ft) depth . Bedding is from upper left to lower right. Silt grains at left center and lower edge of image are set in an openflocculated matrix of clay-size particles.
Figure 20. SEM image parallel to bedding planes showing open-flocculated fabric typical of high-sensitivity Bootlegger Cove Formation F.lll facies. Bedding from upper left to lower right.
Present Investigation 17

Figure 21. SEM image parallel to horizontal bedding planes showing flocculated "cardhouse" fabr ic typical of Bootlegger Cove Formation facies F.lll. The sample would yield a high vo id ratio and have a sensitivity above 20. Clay grains adjacent to silt grai ns show little evidence of compression.
Figure 22. SEM image of Bootlegger Cove Formation facies F.lll normal to bedding planes. Particle sizes range from fine silt to very fine c lay. Note that nearly al l particles are aligned in the plane of the image, although interparticle voids extend through the plane.
18 Geologic, Geotechnical Conditions, Turnagain Heights Landslide, Alaska

Figure 23. SEM image of medium-sensitivity Bootlegger Cove Formation facies F.lll parallel to bedding planes. Bedding is from upper right to lower left. Although open-flocculated fabric is evident, assemblage at center is more compact than that in figure 21 . More than 90 percent of the clay grains in this and the other images are platelets of inactive minerals including quartz, feldspar, amphibole, and chlorite.
Figure 24. SEM image of Bootlegger Cove Formation facies F.lll showing clay-size particle contacts including edge-to-edge, face-to-edge, and face-to-face arrangements. Single clay grains form the " card-house" fabric. Bright area at right center is a " charging" contact between two grains that may indicate cementation or a colloidal aggregate bond.
Present Investigation 19

Figure 25. SEM image parallel to bedding planes of a low-to-medium sensitivity zone in Bootlegger Cove Formation facies F.lll. Compare this image with those in figures 19 and 20. The clay grains are here much more compressed and the silt grains are in better defined laminae parallel to bedding. Bedding is from upper left to lower right.
an ongoing role in increasing the instability of the fabric by gradually removing minute amounts of chemical precipitates that help to bond together the "card houses" (for example, see Torrance, I983). Though the images shown here do not indicate the supposed precipitates between clay grains, the limitations of sample preparation and of SEM magnification may obscure the binding agents that could exist in place.
INTERPRETATION
Stratigraphy
The stratigraphic sequence beneath Lynn Ary Park is summarized on plate 5. It includes the facies of the Bootlegger Cove Formation and the pre- and postBootlegger Cove Formation sediments. The Bootlegger Cove Formation can be divided into three principal lithologic zones by grouping the facies shown on plates I and 2. Each zone is dominated by one facies, although thinner units of other facies are also present.
The post-Bootlegger Cove sediments consist of about 6 m (20 ft) of stratified sand and gravel with a thin surface cover of peat and loose sand and silt, including thin beds of volcanic ash. The sand and gravel
are generally firm and dense, as inferred from the high cone-penetration resistance values shown on plate 3.
The upper lithologic zone of the Bootlegger Cove Formation, about 7-IO m (25-35 ft) thick and extending from elevations as high as I5 m (50ft) to as low as 4 m (I3 ft), consists mainly of interbedded sand, silt, and clay (F.IV) bounded above and below by thicker sand beds (F.VI and F.VII). The cohesive materials in this zone are variable but generally stiff, as reflected in the pocketpenetrometer values of shear strength (pl. I; tables 2 and 3). The variability of the materials in this part of the formation is further reflected by the cone-penetrometer data (pl. 3); the variability in the friction-resistance and coneresistance values is pronounced at the LA-C-2 and LAC-3 sites, but is relatively subdued at the LA-C-I site.
The middle lithologic zone of the Bootlegger Cove Formation, about I2-I5 m (40-50 ft) thick and extending from elevations as high as 7.5 m (25 ft) to as low as -9 m (-30ft), consists of sensitive silty clay (F.III) intercalated with sand beds as thick as I m (3 ft). The F.III material is relatively uniform and substantially weaker than the clayey materials in the overlying upper zone. The intercalated sand beds vary in thickness and density within short distances, as can be inferred from the variations in friction and cone-resistance values both within and between the three cone-penetrometer sites (pl. 3).
20 Geologic, Geotechnical Conditions, Turnagain Heights Landslide, Alaska

The lower lithologic zone of the Bootlegger Cove Formation, about 10-15 m (35-50 ft) thick and extending from elevations about as high as -5 m (-16ft) to about as low as -24 m ( -80 ft), consists predominantly of silty clay and clayey silt with random stones (F. V) (pl. 2), although the lowest part, less well known, may be more varied. Both the pocket-penetrometer and conepenetrometer data indicate generally increasing strength of these materials with depth.
Various materials, including sand, gravel, sandy silt, stony silt, and clay, underlie the Bootlegger Cove Formation at depths greater than about 40 m (130ft) (elev -20m (-65 ft)). Most of these materials were too dense to be penetrated more than a few centimeters by the CPT at sites LA-C-1 and LA-C-3 (pl. 3).
Geologic History
The available evidence indicates that the area was glaciated at some time preceding deposition of the Bootlegger Cove Formation. Thereafter, the lower lithologic zone of the Bootlegger Cove Formation indicates that the area was then occupied by a body of water, probably not unlike the present Cook Inlet. However, glacier ice was present around at least part of the inlet; the glaciers fronted or perhaps in part floated in water. Resultant icebergs provided the scattered distribution of coarse material to the bottom of the inlet where, otherwise, only silt and clay were accumulating. By the time of deposition of the middle zone, the glaciers had apparently withdrawn far enough from the water's edge that only a few coarse fragments were reaching the middle of the basin. At least one major and a few minor fluctuations in energy level within the water body are indicated by the beds of sand. During the subsequent time of deposition of the upper zone, however, such fluctuations became the rule rather than the exception, and they characterize the zone. The fluctuations of water level, the shifting of currents, and the variable encroachment of deltaic environments from the sides of the inlet are the main causes of the variable sedimentation. By the end of Bootlegger Cove time, open water was withdrawing from the basin. The capping sands represent shore or shallow-water conditions which remained until the water had withdrawn totally, probably to areas more nearly coincident with the level of modern Cook Inlet.
The alluvial sand overlying the Bootlegger Cove Formation had, as its source, a readvance of glacier ice from the north to a position several kilometers northeast of the Lynn Ary Park site, forming the Elmendorf Moraine (fig. 2). At this time, inlet water levels did not become high enough to permit estuarine water to occupy the Lynn Ary Park site again.
There followed the onset of nonglacial, mainly subaerial conditions that have persisted to the present. Peat accumulated, especially on the lower parts of the gently undulating former estuarine and alluvial surface, and minor eolian deposits are sporadically preserved. During this postglacial time, downcutting in the Cook Inlet basin as a result of isostatic and tectonic uplift established the bluff lines that are now in the process of erosional retreat. This uplift, in combination with the instability of the Bootlegger Cove Formation with its sensitive clay, makes the bluffs the focus of modern slope failures.
In-place Pore Pressure and Effective Stress
The available evidence concerning the subsurface distribution of pore pressure and effective stress at Lynn Ary Park is summarized in figure 26. Included are the piezometric data obtained in this study and in the post -1964 earthquake investigations in the vicinity of Lynn Ary Park. The water table shown is that measured in October 1979, in the inclinometer casings installed in boreholes B-3 and B-5. For the piezometers installed in 1964, the equilibrium piezometric head values reported by Shannon and Wilson (1964) are plotted versus the elevation of the piezometer tip relative to sea level.
The piezometric data suggest that the pore-waterpressure distribution above sea level is approximately hydrostatic relative to the water table at a depth of about 4 m (15 ft) below the ground-water surface. However, below sea level the pore pressures are substantially lower and appear to be controlled by artesian conditions at depth, rather than by the ground-water table elevation.
The existing piezometric data are consistent with the possibility that the sand beds intercalated in the sensitive clay facies are providing a conduit for lateral seepage of ground water to the ocean. Ground water reaching the sand beds percolates both downward from the water table and upward from underlying artesian aquifers. Such a leaching process could be a cause of the sensitivity in the F.III silty clays above and below the sand strata.
The piezometric data were also used to evaluate the effective-stress profiles in the sediments beneath Lynn Ary Park; these are shown together with the total stress profile in figure 27. These profiles were calculated from the density data presented on plates 1 and 2 and from the pore-pressure data shown in figure 26.
Strength, Consolidation State, and Sensitivity
Figure 28 shows the ranges of undrained-strength values obtained from index tests on the cores from boreholes B-3 and B-5 and those derived from the cone-penetration
Interpretation 21

en a: w t1i ~
~
20
15
10
c: 5 i= ()
a: 1- SEA ~LEVEL
a 0::: LL -5 0 z 0
~ -10
~ w
-15
-20
Ground level"'
Piezometric head (8/64) ------:r·/' between elevation 6 .
/ and 13meters T-r+---
Water table// : (10/79) / I •
/ ~ / I
/ I / I
/ I / ~ /
/ + / .I /
V'/
•
0 5 10 15 20 PIEZOMETRIC HEAD, IN METERS
Soli column
Post-BCF sediments
F.IV
-F.II -
t.vu F.III
F.Vf c - 0 :; E
F.IU .f Q) > 8 -Cii C) C) Q)
:g ~
F.V
Pre-BCF
sediments
Figure 26. Piezometric head versus depth for piezometers installed in various boreholes behind scarp and in vicinity of Lynn Ary Park after the 1964 earthquake (Shannon and Wilson, 1964). Roman numerals indicate facies of the Bootlegger Cove Formation (BCF) for boreholes B-3 and B-5.
tests at sites LA-C-1, LA-C-2, and LA-C-3. These ranges of values were derived from data (pl. 4) for depth intervals associated with the strata summarized on plate 5, including the post-Bootlegger Cove Formation sediments and the dominant facies in the Bootlegger Cove in the vicinity of boreholes B-3 and B-5.
Figure 28 also shows hypothetical undrained-shearstrength profiles for normally consolidated inorganic silty clays of low to extremely high sensitivity. These profiles are based on data for Norwegian marine clays, which show the variation of the normalized undrained shear strength, [Sui a: 1nc' with sensitivity (Houston and Mitchell, 1969). The profiles were calculated for [Sui a: 1nc values of 0.25, 0.20, 0.15, and 0.10, which represent normally consolidated materials of low, moderate, high, and extremely high sensitivity, respectively. The hypothetical strength profiles were further based on the in-place effective-stress profile in figure 27,
en a: w
20
15
10
t1i 5 ~
Z SEA Q LEVEL 1-
~ -' w -5
-10
-15
Effective stress for piezometric head at elevation 17.5 m
Effective stress for piezometric head at elevation 7 m
___....- Total stress
c 0
~ E & Q)
8
-20+-----,-----,~~-------+----~----~
0 200 400 600 800 1 000 IN-PLACE STRESSES,
IN KILONEWTONS PER SQUARE METER
Figure 27. Total and effective-stress profiles at Lynn Ary Park, based on density data given on plates 1 and 2 and on porepressure data given in figure 26.
assuming the piezometric head to be at elevation 17.5 m (57 ft).
In the post-Bootlegger Cove sediments and in the upper part of the Bootlegger Cove Formation (F.II, F.IV, and F. VII), the measured strengths significantly exceed the hypothetical values for normally consolidated materials, which indicates that these strata are substantially overconsolidated.
In contrast to those of the upper part, the measured shear-strength values in the intermediate and lower parts of the Bootlegger Cove Formation are, in general, notably lower than the hypothetical values for the F.III soils. These F.III soils do not appear to be underconsolidated, because the pore-pressure data (fig. 26) do not show any indication of undissipated excess pore pressures within the sediments. Rather, the materials appear to be somewhat overconsolidated, because the maximum measured strength values exceed the hypothetical strengths for materials of low-tomoderate sensitivity, and the in-place strengths are undoubtedly higher because of disturbance effects on the measured values.
22 Geologic, Geotechnical Conditions, Turnagain Heights Landslide, Alaska

en 0: w jlj
20
15
10
5
:::?! SEA ~LEVEL
z 0
~ (ij -5 ..J w
-10
-15
UNDRAINED SHEAR STRENGTH, IN KILONEWTONS PER SQUARE METER
20 25 50 75 100 125
[Su/O"v'lnc = Sensitivity= 1000 30 10
Pre-BCF sediments
Figure 28. Ranges of undrained shear strength (pattern) at various depths at Lynn Ary Park, based on strength data of plates 1 and 2, and on strengths derived from cone penetration data of plate 3. Roman numerals indicate facies of the Bootlegger Cove Formation (BCF).
In view of these comments, the minimum-strength values in the intermediate and lower parts of the Bootlegger Cove Formation probably do not reflect very low inplace strengths of the materials, but rather reflect the effects of disturbance on the measured values. In this regard, the upper half of the intermediate zone (elev 2.0-7.5 m (7-25 ft)) is of particular interest. Plate 4 shows near-zero-strength values that were obtained in this interval from the cores from boreholes B-3 and B-5. However, the data from nearby cone-penetrometer tests do not confirm the presence of materials with negligible strength in this interval. Moreover, plate 4 shows that the profile with the highest minimum strength is that designated as C-4, which is a bucket-auger hole in which the strength data were obtained in place on the borehole wall (Shannon and Wilson, 1964).
Because the effects of disturbance should increase with sensitivity, the minimum-strength values probably
reflect not only the effects of disturbance on the measured values, but also the sensitivity of the materials in place. Thus, the interval with near-zero strength in the B-3 and B-5 cores appears to contain the most highly sensitive materials in the profile. This interpretation is consistent with the 1964 data from the nearby boreholes C-4 and C-108, where the most sensitive materials were found in an interval a few meters thick just above sea level.
Finally, figures 29 through 32 show that the zerostrength zone is associated with anomalies (reversal of trend with depth) in the pore-fluid chemistry. Substantial anomalies are present in the concentrations of organic carbon and of the anion species, whereas only minor anomalies appear in the concentrations of cation species and in the total dissolved solids (TDS). Moreover, the anomalies occur within an interval of the F.III material, and not at an interface between material types.
These findings are consistent with the possibility that the chemical composition of the pore water may be responsible for the high sensitivity of the materials in the zero-strength zone. Evidence reported by Bjerrum (1954) for Norwegian clays shows that sensitivity increases exponentially with decreasing pore-water salinity for the range of TDS values reported in this study. Consistent with this evidence is the location of the lowest TDS values in the middle of the zero-strength interval in the core from borehole B-5, at an elevation of about 6 m (20ft) above sea level (table 1). More importantly, the concentrations of Ca and Mg, which correlate more closely with clay sensitivity (Mitchell, 1976), also are the lowest in this zerostrength interval.
The chemical and isotopic compositions of the pore waters of this study indicate that they are concentrated meteoric (nonmarine) waters (table 1). The geochemical reactions responsible for concentrating the original pore water, which may have been either marine or estuarine, to different salinities and chemical compositions are beyond the scope of this paper. It suffices to mention here that the low salinity in the zero-strength interval is not consistent with the leaching of that zone by percolating meteoric water of low salinity. Leaching would result in lower pore-water salinities at the boundaries of the F.III strata that are in contact with permeable sand units and in gradually increasing salinities away from the boundaries into the F.III strata (fig. 29).
DISCUSSION
Herein, the new data presented are compared with data from the geotechnical model of the Bootlegger Cove Formation near the east end of the Turnagain Heights landslide, the model used by Seed and Wilson (1967) to analyze the possible mechanisms by which the Turnagain Heights landslide was initiated. This model, hereinafter
Discussion 23

en a: w ljj ::!: ~ z 0
10
5
~ SEA {ij LEVEL ...J w
-5
F.IV
F.II
F. VII
F.III
F.VI
F.III
F.V
- 10 ~--" LE-· X ...... P_L\._N_A_TI_.ON
J:J. Magnesium Sodium
a TDS • Calcium
-15~----------~~~~W-----W----L~~~-L~L-w_--.-L--L-~----w_w_ __ w_~--W---~~
10 2
CONCENTRATION, IN PARTS PER MILLION
Figure 29. Profiles of pore-fluid cation and total dissolved solids (TDS) concentrations, in relation to the facies (Roman numerals) found in the B-3 and B-5 cores, Lynn Ary Park.
referred to as the 1967 model, was developed from the information obtained by Shannon and Wilson (1964) during their investigations of soil conditions in the Anchorage area shortly after the 1964 Alaskan earthquake. The purpose of this comparison is to identify the findings in this study that are new, relative to the 1967 model, with emphasis on the distribution and properties of the sands and sensitive clays that govern the stability of the Bootlegger Cove Formation during large earthquakes.
The 1967 Model
The characteristics of the 1967 model were summarized by Seed and Wilson (1967) in their classic paper on the Turnagain Heights landslide. Pertinent excerpts therefrom are the following (p. 330-332):
In general, the Turnagain area (surface elevation=70 ft) is covered by a surface layer of sand and gravel which varies in thickness from 15 ft to 20 ft at the east end of the slide area to about 5 ft to 10ft at the west end. The sand and gravel is underlaid by a deep bed of Bootlegger
Cove clay, about 100ft to 150ft in thickness. This soil is a sensitive marine deposit of silty clay with a shear strength decreasing from about 1 ton per sq ft at its surface (EI. 50 [ft] approx.) to about 0.45 ton per sq ft at El. 0 [ft], and then increasing again to about 0.6 ton per sq ft at El. -30 [ft]; its sensitivity varies between about 5 and 30* **the zone of maximum sensitivity generally coincides with the zone of lowest strength for this deposit. In general the sensitivity of the clay appears to decrease with increasing distance behind the original coastline** *the extremely sensitive clay was not found in borings made about 2000 ft behind the original bluff line.
The clay deposit contains numerous thin strata and seams of silt and fine sand which are apparently not continuous throughout the deposit. At some points the sand strata are up to 3 ft in thickness but, more typically, they vary from a fraction of an inch to several inches in depth. At the east end of the slide areas, frequent thin seams of fine sand were found between El. 30 [ft] and El. 37 [ft], a sand layer several feet thick was encountered near El. 20 [ft], and a number of thinner lenses were found below this, their thickness and frequency diminishing with depth; below El. 10 [ft], sand lenses were thin and were only found at occasional intervals.
24 Geologic, Geotechnical Conditions, Turnagain Heights Landslide, Alaska

~ w tu ::E
20
15 · Facies
F.IV
10 •·· F.II
F.VII c 0 :; F.III E
.f F.VI 5
G) >
! 8 ~ SEA
~LEVEL ,,
Q; 0) 0) G) F.III 15 ~
~ _J w
tB
-5
F.V
t-- 10 EXPLANATION • Chloride
, o Bicarbonate
_15 ~~~lfate __
102
CONCENTRATION, IN PARTS PER MILLION
Figure 30. Profiles of pore-fluid anion concentrations, in relation to the facies (Roman numerals) found in the B-3 and B-5 cores, Lynn Ary Park.
Comparison of New Data with the 1967 Model
The new data from this study depart from the 1967 model in several respects. First, they show more clearly that the upper, middle, and lower zones of the formation are distinctly different in the character and distribution of silts, sands, and coarser materials within the clayey silts and silty clays. In the upper zone, where the clayey silts and silty clays are relatively strong and overconsolidated, silts and sands are distributed among abundant thin strata and seams that are characteristic of the material designated as F.IV. In the middle zone, where the clayey silts and silty clays are designated as F .III to characterize their soft and sensitive nature, sands are distributed primarily in massive and laterally discontinuous strata within the F.III material. In the lower zone, where the strength of the clayey silts and silty clays is comparable to that in the upper zone, coarse sands, pebbles, and cobbles are randomly distributed and provide the basis for the F.V designation of this material. Thus, it now appears that the sands closest to the failure surface of the Turnagain Heights landslide were the massive sand
strata associated with the F.III material in the middle zone, rather than the thin strata and seams of fine sand emphasized in the 1967 model.
Second, the massive sand strata in the middle zone appear to be dense, compared with Shannon and Wilson's observation that "the response of sand lenses to vibrations on a shaking table would indicate they occur naturally in a loose condition'' and also compared with the simulated natural sedimentation condition that was used to prepare sand specimens for dynamic laboratory testing (Shannon and Wilson, 1964). The new conepenetration data in this study are very similar to other recent cone-penetration data from several locations in the Anchorage area that show massive sand strata in the middle zone that are generally too dense to liquefy during large-magnitude earthquakes (Idriss and Moriwaki, 1982; Updike, 1984; Updike and Carpenter, 1986).
Third, the middle zone appears to contain a more widespread distribution of very highly sensitive materials than was recognized in the 1967 model. This conclusion is drawn from the several low values of shear strength that were obtained in this study compared with the
Interpretation 25

20
Facies
- F.IV
10 ,_ F.II
F.VII c en
a: w tu
7 --------------------------------------------~·--
0 :; F.III
~ 5~,----------------------------------L
~ z 0 ~ ~ SEA ~LEVEL w
-10 ~
E
.f F.VI CD
~ ()
a; C) C) F.III CD
l5 ~
F.V
-15 1.0 10 100 200
CONCENTRATION OF ORGANIC CARBON, IN PARTS PER MILLION
Figure 31. Profile of pore-fluid organic carbon concentration, in relation to the facies (Roman numerals) found in the B-3 and B-5 cores, Lynn Ary Park.
minimum strength values in the 1967 model. In this regard, the interval of quasi-fluid material in the undisturbed cores from boreholes B-3 and B-5 is of particular interest. The extremely low strength of this material appears to reflect extremely high sensitivity of the in-place material to disturbance, because the associated cone-penetrometer data do not confirm the presence of material with negligible strength at this depth. Rather, the cone-penetrometer data indicate that the quasi-fluid material in the cores was taken from a stratum of relatively weak material that has considerable lateral continuity.
This use of strength data as an indicator of sensitivity follows from the known effects of disturbance on undrained shear strength, which were clearly recognized in Shannon and Wilson's investigations. Their data include numerous low-strength values that were used to help identify the location of the failure surface of the Turnagain Heights landslide and that were eliminated from consideration in developing the 1967 model as follows (Seed and Wilson, 1967, p. 335):
Strength values varied considerably in some borings and numerous zones of extremely low strength were encountered. These zones were attributed to sample disturbance during sliding***. It may be seen that just behind the slide area shear strengths rarely drop below 0.3 kg per sq em, while in borings made in the slide area there are many values less than 0.25 kg per sq em and some as low as 0.03 kg per sq em** *the zones of low shear strength agree well with the locations of badly disturbed samples in the soil profile.
Because the relatively low values of strength data obtained in this study cannot be attributed to recent landslide deformations, they appear to reflect a more widespread distribution of extremely sensitive material than was recognized in the 1967 model.
Finally, the new geochemical data indicate that the cause of high sensitivity in the F. III material could be geochemical reactions rather than leaching of a marine deposit, as implied in the 1967 model. The evidence supporting this view includes (1) the chemistry of the sediment pore fluids is more typical for meteoric than for
26 Geologic, Geotechnical Conditions, Turnagain Heights Landslide, Alaska
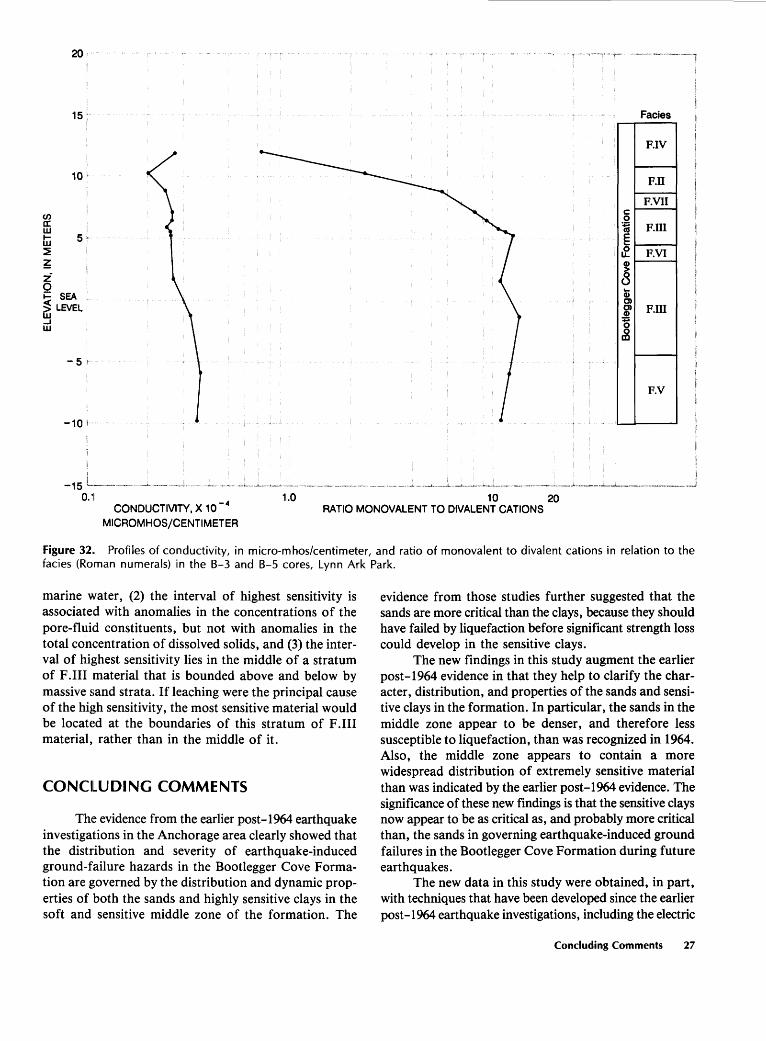
(/) a: w
20
10.
tu 5• ~
~ z 0 i= SEA .. ~LEVEL, ....I w
-51
-10 t
-15 '---···-~·· -~- .. -·---.. ....... 0.11 1.0
Facies
F.IV
F.II
F.VII c: 0 :; F.III E af F.VI Q)
8 Gi C) C) F.III Q)
15 ~
F.V
10 20 CONDUCTIVITY, X 10- 4
MICROMHOS/CENTIMETER RATIO MONOVALENT TO DIVALENT CATIONS
Figure 32.. Profiles of conductivity, in micro-mhos/centimeter, and ratio of monovalent to divalent cations in relation to the facies (Roman numerals) in the B-3 and B-5 cores, Lynn Ark Park.
marine water, (2) the interval of highest sensitivity is associated with anomalies in the concentrations of the pore-fluid constituents, but not with anomalies in the total concentration of dissolved solids, and (3) the interval of highest sensitivity lies in the middle of a stratum of F.III material that is bounded above and below by massive sand strata. If leaching were the principal cause of the high sensitivity, the most sensitive material would be locatt:d at the boundaries of this stratum of F .III material, rather than in the middle of it.
CONCILUDING COMMENTS
Th1e evidence from the earlier post-1964 earthquake investigations in the Anchorage area clearly showed that the distribution and severity of earthquake-induced ground-failure hazards in the Bootlegger Cove Formation are governed by the distribution and dynamic properties of both the sands and highly sensitive clays in the soft and sensitive middle zone of the formation. The
evidence from those studies further suggested that the sands are more critical than the clays, because they should have failed by liquefaction before significant strength loss could develop in the sensitive clays.
The new findings in this study augment the earlier post-1964 evidence in that they help to clarify the character, distribution, and properties of the sands and sensitive clays in the formation. In particular, the sands in the middle zone appear to be denser, and therefore less susceptible to liquefaction, than was recognized in 1964. Also, the middle zone appears to contain a more widespread distribution of extremely sensitive material than was indicated by the earlier post-1964 evidence. The significance of these new findings is that the sensitive clays now appear to be as critical as, and probably more critical than, the sands in governing earthquake-induced ground failures in the Bootlegger Cove Formation during future earthquakes.
The new data in this study were obtained, in part, with techniques that have been developed since the earlier post-1964 earthquake investigations, including the electric
Concluding Comments 27

cone-penetration test, scanning electron microscopy, and downhole shear-wave velocity measurements; furthermore, since 1964, substantial progress has been made in developing methodology for evaluating the potential for earthquake-induced ground failures due to liquefaction of sands, whereas the potential for such ground failures due to strength loss in sensitive clays has received very little attention. This study and other recent commercial and research investigations in the Anchorage area clearly show that similar developments for sensitive clays are needed.
Notably, although an extensive catalog of static test data exists for the clays in the Bootlegger Cove Formation, very little information has been obtained about their dynamic behavior because of the lack of an economical and suitable methodology for evaluating the dynamic properties of sensitive deposits. Appropriate in-place methods have not yet been developed. Existing dynamic laboratory test methods are expensive, and the significance of the results is limited by disturbance effects arising from acquiring and transporting samples to the laboratory.
Information is needed to clarify the distribution and severity of ground-failure hazards that may occur in the Bootlegger Cove Formation during future large earthquakes. This information should accurately define the regional distribution, geologic origin, and in-place dynamic properties of both the sand strata and the intervals of extremely sensitive clay within the middle zone of the formation. For the clay, more specific information is needed concerning (1) the in-place magnitudes and variability of the undrained shear strength and sensitivity of the F .Ill material, (2) the effects of disturbance on the F.III material including consideration not only of cyclic loading anticipated during future earthquakes, but also of the processes involved in conducting in-place and laboratory geotechnical measurements, (3) the hydrologic or geochemical processes, or both, responsible for the sensitivity of the F.III material, (4) whether these processes are continuing to change the sensitivity and strength of the material with time, and (5) whether a scientific basis can be found for reducing the sensitivity or increasing the strength of the F .III material in place.
The need for such studies, including the development of appropriate methodology for investigating sensitive clays, is reinforced not only by the new data reported here, but also by other independent commercial and research investigations recently conducted in Anchorage. Recent cone-penetration investigations have found F. VI and F. VII strata within the soft and sensitive middle zone of the formation at several locations in Anchorage. The results of these studies show that these sand strata are generally too dense to liquefy during largemagnitude earthquakes (ldriss and Moriwaki, 1982; Updike, 1983b, 1984; Updike and Carpenter, 1986).
Moreover, highly sensitive clays have been identified throughout much of the western half of the city (Updike and Ulery, 1986; Updike, 1986). This finding was not anticipated in the 1967 model wherein it was proposed that ''the sensitivity of the clay appears to decrease with increasing distance behind the original coastline***and the extremely sensitive clay was not found in borings made about 2000-ft behind the original bluff line'' (Seed and Wilson, 1967, p. 331-332).
Finally, efforts to understand the distribution and dynamic properties of the sensitive clays in the Bootlegger Cove Formation not only will clarify the risk of earthquake-induced ground failure in Anchorage, but also may contribute substantially to an understanding of the earthquake hazards associated with sensitive soils in other regions of the world.
REFERENCES CITED
American Society for Testing and Materials, 1975, Tentative method for deep, quasi-static, cone and friction-cone penetration tests of soil: American Society for Testing and Materials, Philadelphia, Pa., D-334-754T, p. 435-442.
Auld, Bruce, 1977, Crosshole and downhole vs by mechanical impulse: American Society of Civil Engineers Journal of the Geotechnical Engineering Division, v. 103, no. GT 12, p. 1381-1398.
Ballard, R.F., and McLean, F.G., 1975, Seismic field methods for in situ moduli: Proceedings of the American Society of Civil Engineers Geotechnical Engineering Division Specialty Conference on In Situ Measurement of Soil Properties, Raleigh, N.C., v. 1, p. 121-150.
Barnwell, VlW., George, R.S., Dearborn, L.L., Weeks, J.B., and Zenone, Chester, 1972, Water for Anchorage, an atlas of the water resources of the Anchorage area, Alaska: City of Anchorage and the Greater Anchorage Area Borough, 77 p.
Bennett, R.H., Bryant, W.R., and Keller, G. H., 1977, Clay fabric and geotechnical properties of selected submarine sediment cores from the Mississippi Delta: National Oceanographic and Atmospheric Administration Professional Paper No. 9, U.S. Department of Commerce NOAA-ERC Publication, 86 p.
Bjerrum, Laurits, 1954, Geotechnical properties of Norwegian marine clays: Geotechnique, v. 4, p. 49-69.
Brown, L.D., Reilinger, R.E., Holdahl, S.R., and Balzaks, E.I., 1977, Post-seismic crustal uplift near Anchorage, Alaska: Journal of Geophysical Research, v. 82, p. 3369-3378.
Casagrande, Arthur, 1932, The structure of clay and its importance in foundation engineering: Journal of the Boston Society of Civil Engineers, v. 19, p. 168-208.
Cederstrom, D.J., Trainer. EW., and Waller, R.M., 1964, Geology and ground-water resources of the Anchorage area, Alaska: U.S. Geological Survey Water Supply Paper 1773, 108 p.
Collins, K., and McGown, A., 1974, The form and function of micro fabric features in a variety of natural soils: Geotechnique, v. 24, no. 2, p. 223-254.
28 Geologic, Geotechnical Conditions, Turnagain Heights Landslide, Alaska

Dobrovolny, Ernest, and Schmoll, H.R., 1974, Slope-stability map of Anchorage and vicinity, Alaska: U.S. Geological Survey Miscellaneous Investigations Map 1-787-E, scale 1:24,000.
Douglas, B.J., and Olsen, R.S., 1981, Soil classification using electri<: cone penetrometer: Cone penetration testing and experi~~nce, Proceedings of a session sponsored by the Geotechnical Engineering Division at the American Society of Civil Engineers National Convention, St. Louis, Mo., Oct. 26- 30, 1981, p. 209-227.
Espinosa, A.F., and Michael, J.A., 1984, Seismicity of the Arctic and adjoining regions: U.S. Geological Survey OpenFile R1eport 84-376, 2 pl.
Goldshmidt, V.M., 1926, Underskolelser over lersedimenter: Nordisk Jordbrugsforskning, nos. 4-7, p. 434-445.
Hansen, w·.R., 1965, Effects of the earthquake of March 27, 1964, at Anchorage, Alaska: U.S. Geological Survey Professional Paper 542-A, p. A1-A68.
Hoar, R.J., and Stokoe, K.H., II, 1980, In situ shear wave velocity measurements, Lynn Ary Park, Anchorage, Alaska: University of Texas Geotechnical Engineering Report GRS0-3, 114 p.
Houston, ,W.N., and Mitchell, J.K., 1969, Property interrelationships in sensitive clay: American Society of Civil Engineers Journal of the Soil Mechanics and Foundations Division, ASCE, v. 95, no. SM4, p. 1037-1062.
ldriss, I.M., and Moriwaki, Yoshiharu, 1982, Anchorage Office Complex geotechnical investigation, Anchorage, Alaska, volume 1, Seismic hazards evaluation: San Francisco, Calif., Woodward-Clyde Consultants, p. 6-1 to 6-3.
Karlstrom, T.N.V., 1964, Quaternary geology of the Kenai Lowland and glacial history of the Cook Inlet region, Alaska: U.S. Geological Survey Professional Paper 443, 69 p.
Kerr, P.F., and Drew, I.M., 1965, Quick clay movements, Anchorage, Alaska: Springfield, Va., National Technical Information Service, Document AD630-111, 133 p.
___ 1968, Quick-clay slides in the U.S.A.: Engineering Geology-International Journal, v. 2, p. 215-238.
Lee, H.R., 1977, Permafrost in Anchorage, in Proceedings, Internatilonal Symposium on Cold Regions Engineering, Fairbanks, 1976: University of Alaska Department of Civil Engineering, p. 283-289.
Long, Erwin, and George, Warren, 1966, Buttress design earthquake-induced slides: Proceedings of the Soil Mechanics and Foundations Division Specialty Conference on Stability and Performance of Slopes and Embankments, Berkeley, Calif., p. 657-671.
Lunne, T .. , Eide, 0., and de Ruiter, J., 1976, Correlations between cone resistance and vane shear strength in some Scandinavian soft to medium stiff clays: Canadian Geotechnical Journal, no. 13, p. 430-441.
Miller, R.D., and Dobrovolny, Ernest, 1959, Surficial geology of Anchorage and vicinity, Alaska: U.S. Geological Survey Bulletin 1093, 128 p.
Mitchell, J .K., 1976, Fundamentals of soil behavior: New York, John Wiley, 422 p.
Plafker, George, Bruns, T.R., Winkler, G.R., and Tysdal, R.G., 1982, Cross section of the eastern Aleutian arc, from
Mount Spurr to the Aleutian trench near Middleton Island, Alaska: Geological Society of America, Map and Chart Series, MC-28P, scale 1:1,000,000.
Reger, R.D., and Updike, R.G., 1983a, Upper Cook Inlet area and the Matanuska Valley, in Pewe, T.L., and Reger, R.D., eds., Richardson and Glenn Highways, Alaska, Guidebook to permafrost and Quaternary geology: Alaska Division of Geological and Geophysical Surveys Guidebook 1, p. 185-263.
___ 1983b, A working model for late Pleistocene glaciation of the Anchorage lowland, upper Cook Inlet, Alaska, in Thorson, R.M., and Hamilton, T.D., eds., Glaciation in Alaska-Extended abstracts from a workshop: University of Alaska Museum Occasional Paper No. 2, p. 71-74.
Sanglerat, Guy, 1972, The penetrometer and soil exploration: New York, Elsevier, 488 p.
Schmertmann, J .J., 1978, Guidelines for cone penetration test, performance, and design: U.S. Department of Transportation, Federal Highway Administration Report FHWA-TS-78-209, 145 p.
Schmidt, R.A.M., 1963, Pleistocene marine microfauna in the Bootlegger Cove clay, Anchorage, Alaska: Science, v. 141, no. 3578, p. 350-351.
Schmoll, H.R., and Barnwell, W.W., 1984, East-west geologic cross section along the DeBarr line, Anchorage, Alaska: U.S. Geological Survey Open-File Report 84-791, 11 p., 1 pl.
Schmoll, H.R., and Dobrovolny, Ernest, 1972, Generalized geologic map of Anchorage and vicinity, Alaska: U.S. Geological Survey Miscellaneous Investigations Map, 1-787-A.
Schmoll, H.R., Szabo, B.J., Rubin, Meyer, and Dobrovolny, Ernest, 1972, Radiometric dating of marine shells from the Bootlegger Cove Clay, Anchorage area, Alaska: Geological Society of America Bulletin, v. 83, no. 4, p. 1107-1114.
Schmoll, H.R., and Yehle, L.A., 1983, Glaciation in upper Cook Inlet-A preliminary re-examination based on geologic mapping in progress, in Thorson, R.M., and Hamilton, T.D., eds., Glaciation in Alaska-Extended abstracts from a workshop: University of Alaska Museum Occasional Paper No. 2, p. 75-81.
___ 1986, Pleistocene glaciation of the upper Cook Inlet basin, in Hamilton, T.D., Reed, K.M., and Thorson, R.M., eds., Glaciation in Alaska-The geologic record: Anchorage, Alaska Geological Society, p. 193-218.
Schmoll, H.R., Yehle, L.A., Gardner, C.A., and Odum, J.K., 1984, Guide to surficial geology and glacial stratigraphy in the upper Cook Inlet basin [prepared for the 80th annual meeting of the Cordilleran Section, Geological Society of America, Anchorage, Alaska]: Anchorage, Alaska Geological Society, 89 p.
Schwarz, S.D., and Musser, J.M., Jr., 1972, Various techniques for making in situ shear wave velocity measurements: Proceedings of the International Conference on Microzonation for Safer Construction, Research and Application, v. 11, p. 592-608.
Seed, H.B., 1968, Landslides during earthquakes due to soil liquefaction: American Society of Civil Engineers Journal of the Soil Mechanics and Foundations Division, v. 94, no. SM 5, p. 1055-1122.
References Cited 29

___ 1976, Evaluation of soil liquefaction effects on level ground during earthquakes: Liquefaction Problems in Geotechnical Engineering, Proceedings of a session sponsored by the Geotechnical Engineering Division at the American Society of Civil Engineers National Convention, Philadelphia, Pa., Sept. 27-0ct. 1, 1976, Preprint No. 2752, p. 1-104.
Seed, H.B., and Wilson, S.D., 1967, The Turnagain Heights landslide, Anchorage, Alaska: American Society of Civil Engineers Journal of The Soil Mechanics and Foundations Division, ASCE, v. 93, p. 325-353.
Shannon and Wilson, Inc., 1964, Report on Anchorage area soil studies, Alaska: Seattle, Wash., Shannon and Wilson, Inc., 109 p.
Smith, P.J., 1964, Foraminifera from the Bootlegger Cove clay, Anchorage, Alaska, in Report on Anchorage area soil studies, Alaska: Seattle, Wash., Shannon and Wilson, Inc., Appendix J, p. Jl-J5.
Stephens, C.D., Fogleman, K.A., Lahr, J.C., and Page, R.A., 1984, Wrangell Benioff zone, southern Alaska: Geology, v. 12, no. 6, p. 373-376.
Stokoe, K.H., II, and Abdel-razzak, K.G., 1975, Shear moduli of two compacted fills: Proceedings of the American Society of Civil Engineers Geotechnical Engineering Division Specialty Conference on In Situ Measurements of Soil Properties, Raleigh, N.C., v. 1, p. 442-449.
Stokoe, K.H., II, and Hoar, R.J., 1978, Variables affecting in situ seismic measurements: Proceedings of the American Society of Civil Engineers Geotechnical Engineering Division Specialty Conference on Earthquake Engineering and Soil Dynamics, Pasadena, Calif., v. 2, p. 919-939.
Stokoe, K.H., II, and Woods, R.D., 1972, In situ shear wave velocity by cross-hole method: Journal of the Soil Mechanics and Foundations Division, American Society of Civil Engineers, v. 98, no. SM 5, p. 443-460.
Torrance, J.K., 1983, Towards a general model of quick clay development: Sedimentology, v. 30, p. 547-555.
Trainer, F.W., and Waller, R.M., 1965, Subsurface stratigraphy of glacial drift at Anchorage, Alaska, in Geological Survey Research 1965: U.S. Geological Survey Professional Paper 525-D, p. D167-D174.
Ulery, C.A., and Updike, R.G., 1983, Subsurface structure of the cohesive facies of the Bootlegger Cove Formation in southwest Anchorage, Alaska: Alaska Division of Geological and Geophysical Surveys Professional Report 84, 5 p., 3 pl.
Updike, R.G., 1982, Engineering geologic facies of the Bootlegger Cove Formation, Anchorage, Alaska: Geological Society of America Abstracts with Programs, v. 14, no. 7, p. 636.
___ 1983a, Inclinometer strain analyses of Anchorage landslides, 1965-1980: Alaska Division of Geological and Geophysical Surveys Professional Report 80, 141 p.
___ 1983b, Seismic liquefaction potential in the Anchorage area, south-central Alaska: Geological Society of America Abstracts with Programs, v. 15, no. 5, p. 374.
___ 1984, The Turnagain Heights landslide-an assessment using the electric cone penetration test: Alaska Division of Geological and Geophysical Surveys, Report of Investigations 84-13, 48 p.
___ 1986, Engineering geologic maps, Government Hill area, Anchorage, Alaska: U.S. Geological Survey Miscellaneous Investigations Map I-1610, 1 sheet, scale 1:4,800.
Updike, R.G., and Carpenter, B.A., 1986, Engineering geology of the Government Hill area, Anchorage, Alaska: U.S. Geological Survey Bulletin 1588, 32 p.
Updike, R.G., Cole, S.A., and Ulery, C.A., 1982, Shear moduli and damping ratios for the Bootlegger Cove Formation as determined by resonant-column testing: Alaska Division of Geological and Geophysical Surveys Geologic Report 73, p. 7-12.
Updike, R.G., and Oscarson, Robert, 1987, An atlas of facies micro fabrics of the Bootlegger Cove Formation using the scanning electron microscope: U.S. Geological Survey Open-File Report 87-60, 115 p.
Updike, R.G., and Ulery, C.A., 1986, Engineering geology of southwest Anchorage, Alaska: Alaska Division of Geological and Geophysical Surveys Professional Report 89, 1 sheet, scale 1:15,840.
Wilson, S.D., Brown, F.R., Jr., and Schwarz, S.D., 1978, In situ determination of dynamic soil properties: Dynamic Geotechnical Testing, American Society for Testing and Materials Special Technical Publication 654, p. 295-317.
Woods, R.D., 1978, Measurement of dynamic soil properties: Proceedings of the American Society of Civil Engineers Geotechnical Engineering Division Specialty Conference on Earthquake Engineering and Soil Dynamics, Pasadena, Calif., v. 1, p. 91-178.
Zenone, Chester, Schmoll, H.R., and Dobrovolny, Ernest, 1974, Geology and ground water for land-use planning in the Eagle River-Chugiak area, Alaska: U.S. Geological Survey Open-File Report 74-57, 25 p.
APPENDIX OF TABULATED DATA
Tabulated data for electric cone-penetration tests at sites LA-C-1, LA-C-2, and LA-C-3, Lynn Ary Park, Anchorage, Alaska. Cone-resistance and sleeve-friction values, in tons per sq ft (TSF), are derived from field data, and friction ratio is calculated from these values (denoted "CONE", "FRICTION", and "RATIO" respectively on the following tables). Soil-behavior types are predicted from the above values in correlation with adjacent borehole logs. Shear-strength values are calculated from empirical equations discussed in the text. The abbreviations used in the tables of the appendix are:
FT feet TSF tons per square foot SA sand Sl silt SENS. sensitive SU shear strength FS sleeve friction resistance PSF pounds per square foot C cone tip resistance T total vertical stress NC dimensionless bearing-capacity factor
30 Geologic, Geotechnical Conditions, Turnagain Heights Landslide, Alaska

Table 4. Tabulated data for CPT site LA-C-1
DEPTH CONE FRICTION RATIO SOIL BEHAVIOR TYPES SPT su~Fs*t. to SU=<C-T)/NC FT TSF TSF <PSF) <PSF)
1. 0 282. 10 6. 56 2. 18 SILTY SA TO CLAYEY SAND 2.0 318. 79 6.80 1.91 SAND TO SILTY SAND 3. 0 b3. 03 0. 51 1. 00 SAND TO SILTY SAND 4.0 30. 16 0. 97 3.68 SILT'( CLAY 2134. 3746. 5. 0 1 13. 4 4 1. 56 1. 28 SAND TO SILTY SAND 6. 0 121. 77 2. 34 1.83 SILTY SAND TO SANDY SILT 7. 0 160. 79 2. 12 1. 34 SAND TO SILTY SAND 8. 0 227. 53 2. 65 1. 20 SAND TO SILTY SAND 9.0 249. 72 2. 33 0. 91 SAND TO SILTY SAND
10.0 60. 47 1. 47 2.03 SILTY SAND TO SANDY SILT 11.0 200. 49 1. 68 0. 81 SAND TO SILTY SAND 12.0 250. 10 1. 18 0. 52 GRAVELLY SAND TO SAND 13. 0 209. 69 1. 06 0. 54 GRAVELLY SAND TO SAND 14.0 169. 97 1. 00 0. 53 GRAVELLY SAND TO SAND 1~.0 193. 98 0. 73 0.40 GRAVELLY SAND TO SAND 16.0 244.9~ 0. 71 0.34 GRAVELLY S.~ND TO SAND 17.0 243. 57 0. 99 0.46 GRAVELLY SAND TO SAND 18.0 263. 86 1. 23 0. 4'1 GRAVELLY SAND TO SAND 19. 0 272. 90 1. '16 0.46 GRAVELLY SAND TO SAND 20.0 257. 19 1. 07 0.42 GRAVELLY SAND TO SAND 21. 0 327. 60 1. 16 0. 41 GRAVELLY SAND TO SAND 22 0 333. 49 1. 17 0.41 GRAVELLY SAND TO SAND 23.0 2S4. 1 q 1. 56 0.49 GRAVELLY SAND TO SAND 24. 0 284.82 3. 51 1. 56 SAND TO SILTY SAND 25.0 47. 94 2.94 4.65 SILTY CLAY TO CLAY 6464. 5838. 26.0 41. 46 1. 72 4. 53 SILTY CLAY TO CLAY 3794. !5022. 27.0 44. 50 2. 19 4.92 SILTY CLAY TO CLAY 4822. 5395. 28.0 28. 18 1. 16 4.87 SILTY CLAY TO CLAY 25!51. 3349. 29.0 28. 44 1. 02 3. 57 SILTY CLAY 2240. 3375. 30. 0 28. 63 1. 07 3. 70 SILTY CLAY TO CLAY 2351. 3393. 31.0 46. !38 2. 28 4. 78 SILTY CLAY TO CLAY ~013. 5630. 32.0 26. 54 0.95 4.03 SILTY CLAY TO CLAY 2088. 3119. 33.0 15.08 0.40 3. 19 SILTY CLAY TO CLAY 876. 1680. 34.0 16. 11 0.39 2. 57 SENS. CLAYEY SI-SI CLAY 864. 1803. 35.0 12.38 0.38 2.81 SENS. CLAYEY SI-SI CLAY 841. 1330. 36.0 13. 14 0.36 2.86 SENS. CLAYEY SI-SI CLAY 792. 1420. 37.0 15.96 0.38 2.49 SENS. CLAYEY SI-SI CLAY 833. 1766. 38.0 16. 84 0. 50 3. 17 SILTY CLAY TO CLAY 1108. 1869. 39.0 14. 76 0. 47 3.00 SILTY CLAY TO CLAY 1024. 1603.

C'l Table 4. Tabulated data for CPT site LA-C-1-Continued ~ 0
OQ
8' C'l ~ ~ =r ;::, ;:;· ~ n 0 ;::,
~ o· ;::, !!'
DEPTH FT
40.0 41.0 42.0 43.0 44.0 45.0 46.0 47.0 48. 0 49.0 50. 0 51. 0 52.0 53.0 54.0 55.0 56.0 ~7.0 58.0 5'?. 0 60. 0 61.0 6~.0 63.0 64. 0 6~.0 66.0 67.0 68.0 69.0 70.0 71. 0 72. 0 73.0 74.0 7!i. 0 76. 0 77.0 78. 0 79.0
CONE TSF
11. 85 15.36 16.45 13.63 14.08 14.90 21.37 20.06 17.93 21. 18 16.02 15.26 10.37 11. 24 12. 54 10.32 10.01
8. 66 7. 10 8.22 8. 43 7.86 8. 36
16. 82 11. 90 10. 16 11.87 11. 81 12. 58 12.23 J 4. 11 12.40 12.64 13.05 13. 16 12.60 13.20 16. 51 14. 70 14. 91
FRICTION RATIO TSF
0.38 3. 14 0.49 3. 14 0. 59 3. 19 0. 41 2. 77 0.32 2.33 0. 41 2. 77 0. 57 3.05 0.35 1. 75 0.36 1. 78 0.37 1. 77 0.29 1. 76 0.27 1. 68 0.21 1. 94 0.20 1. 81 0.20 1. 86 0. 19 1. 81 0. 18 1.75 0. 14 1. :!)6 0. 11 1. 61 0. 14 1. 73 0. 15 2.02 0.32 4.46 0.32 4. 10 0. 76 4. 51 0. 47 3.67 0. 16 1. 73 0.24 2.07 0. 27 2.35 0. 31 2. 40 0.36 2.9:5 0.67 3.95 0.31 2.66 0.30 2.35 0.26 2.09 0.30 2.20 0.30 2.37 0.37 3.21 0.26 1. 60 0.27 1. 90 0.31 2.22
SOIL BEHAVIOR TYPES SPT SU=FS*l. 10 SU=CC-T)/NC CPSF) CPSF>
SILTY CLAY TO CLAY 838. 1~33. SILTY CLAY TO CLAY 1086. 1728. SILTY CLAY TO CLAY 1300. 1795. SENS. CLAYEY SI-SI CLAY 895. 1437. SENS. CLAYEY SI-SI CLAY 709. 1486. SENS. CLAYEY SI-SI CLAY 906. 1583. SILTY CLAY TO CLAY 1249. 2385. SANOY SI TO CLAYEY SILT SENS. CLAYEY SI-SI CLAY 784. 1942. SANDY SI TO CLAYEY SILT SENS. CLAYEY SI-SI CLAY 643. 1691. SENS. CLAYEY SI-SI CLAY 593. 1590. SENS. CLAYEY SI-SI CLAY 451. 973. SENS. CLAYEY SI-SI CLAY 445. 1075. SENS. CLAYEY SI-SI CLAY 430. 1231. SENS. CLAYEY SI-SI CLAY 413. 948. SENS. CLAYEY SI-S! CLAY 391. 903. SENS. CLAYEY SI-SI CLAY 300. 728. SENS. CLAYEY SI-SI CLAY 240. 527. SENS. CLAYEY SI-SI CLAY 306. 660. SENS. CLAYEY SI-SI CLAY 340. 680. SILTY CLAY TO CLAY 710. 603. SILTY CLAY TO CLAY 702. 659. SILTY CLAY TO CLAY 1669. 1711. SILTY CLAY TO CLAY 1035. 1089. SENS. CLAYEY SI-SI CLAY 360. 865. SENS. CLAYEY SI-SI CLAY 532. 1073. SENS. CLAYEY SI-SI CLAY 599. 1059. SENS. CLAYEY SI-SI CLAY 685. 1149. SILTY CLAY TO CLAY 794. 1100. SILTY CLAY TO CLAY 1471. 1327. SENS. CLAYEY SI-S! CLAY 681. 1108. SENS. CLAYEY SI-SI CLAY 658. 1132. SENS. CLAYEY SI-SI CLAY 574. 1177. SENS. CLAYEY SI-SI CLAY 663. 1184. SENS. CLAYEY SI-SI CLAY 657. 1132. SILTY CLAY TO CLAY 805. 1176. SANDY SI TO CLAYEY SILT SENS. CLAYEY SI-SI CLAY ~9~. 1351. SENS. CLAYEY SI-SI CLAY 675. 1372.

DEPTH CONE FRICTION RATIO SOIL BEHAVIOR TYPES SF'T SU=FS*l. 10 SU=(C-T)/NC Fl TSF TSF <PSF> <PSF) so. 0 16. 15 0.39 2. !55 SENS. CLAYEY SI-SI CLAY 869. 1520. 81.0 13. 72 0.36 2. ~9 SENS. CLAYEY SI-SI CLAY 783. 1211. 82.0 14. 62 0.38 2. 70 SENS. CLAYEY SI-SI CLAY 836. 1317. 83.0 24. 87 1. 02 3.67 SILTY CLAY 2236. 2592. 84.0 14.75 0.37 2. 56 SENS. CLAYEY SI-SI CLAY 823. 1320. 85. 0 15. 4 !j 0.37 2. 55 SENS. CLAYEY SI-SI CLAY 813. 1402. 86.0 16. 90 0.39 2.80 SENS. CLAYEY SI-SI CLAY 862. 1576. 87. 0 15. 65 0. 43 2. 72 SENS. CLAYEY SI-SI CLAY 953. 1414. 88.0 16. 41 0. 42 2. 60 SENS. CLAYEY SI-SI CLAY 923. 1503. 89.0 15.58 0.33 2. 11 SENS. CLAYEY SI-SI CLAY 732. 1393. 90.0 15.69 0.26 1. 72 SENS. CLAYEY SI-SI CLAY 571. 1401. 91. 0 16. 44 0.31 1. 84 SENS. CLAYEY SI-SI CLAY 680. 1488. 92. 0 18. 19 0.34 1. 91 SENS. CLAYEY SI-SI CLAY 742. 1701. 93.0 18. 30 0.34 1. 80 SENS. CLAYEY SI-SI CLAY 748. 1708. 94.0 17.09 0.35 2. 03 SENS. CLAYEY SI-SI CLAY 763. 1550. 95. 0 17. 86 0.39 2. 17 SENS. CLAYEY SI-SI CLAY 862. 164·1. 96. 0 18 . .q 4 0.39 2.20 SENS. CLAYEY SI-SI CLAY 868. 1707. 97. 0 18. 75 0. 41 2. 1~ SENS. CLAYEY SI-SI CLAY 896. 1739. 98. 0 18. 79 0.42 2.2:? SENS. CLA't'EY SI-SI CLAY 929. 1738. 99.0 18. 38 0.42 2.30 SENS. CLAYEY SI-SI CLAY 926. 1680.
100. 0 20.87 o.· s1 2.39 SENS. CLAYEY SI-SI CLAY 1127. 1986. 101. 0 20. OS 0. 50 2. 47 SENS. CLAYEY SI-SI CLAY 1091. 1877. 102.0 20. !j6 0. 51 2.43 SENS. CLAYEY SI-St CLAY 1113. 1934. 103.0 20. 14 0.45 2.26 SENS. CLAYEY SI-SI CLAY 989. 1876. 104. 0 18. 69 0.45 2.45 SENS. CLAYEY SI-SI CLAY 997. 1688. 105.0 18. 88 0. 47 2. 47 SENS. CLAYEY SI-SI CLAY 1040. 1706. 106. 0 19. 63 0.45 2.33 SENS. CLAYEY SI-SI CLAY 993. 1793. 107. 0 21. 37 0. 54 2. 55 SENS. CLAYEY SI-SI CLAY 1198. 2005. 108.0 19.82 0. 55 2.84 SENS. CLAYEY SI-SI CLAY 1216. 1804·. 109.0 18.84 0.62 3.31 SILTY CLAY TO CLAY 1365. 1676. 110.0 2.0. 69 0. 53 2.64 SENS. CLAYEY SI-SI CLAY 1162. 1900. 111. 0 20.25 0. 49 2. 44 SENS. CLAYEY SI-SI CLAY 1076. 1839. 112.0 20. 69 0. 50 2.45 SENS. CLAYEY SI-SI CLAY 1110. 1888. 113.0 20.94 0. 51 2. 4tl SENS. CLAYEY SI-SI CLAY 1123. 1912. 114. 0 21. 96 0. 57 2. 59 SILTY CLAY 1248. 2034. 115. 0 20. 96 0. 51 2.41 SENS. CLAYEY SI-SI CLAY 1116. 1902. 116.0 20. 88 0.46 2. 19 SENS. CLAYEY SI-SI CLAY 1011. 1887. 117.0 21. 50 0. 47 2.22 SILTY CLAY 1035. 1958. 118.0 22. 56 0. 49 2. 19 SILTY CLAY 1076. 2084. 119. 0 22. 96 0. ~2 2.26 SILTY CLAY 1153. 2128.

C"l ~ i .r;· ~ Table 4. Tabulated data for CPT site LA-C-1-Continued
~ :::r = [ ~ 0 = §: o· = ~
DEPTH Fl
120.0 121. 0 122. 0 1.23.0 124. 0 125.0 126.0 127.0 128.0 129.0 130.0 131. 0 132.0 133.0 13q. 0 135.0 136. 0 137.0 138.0 139.0 140. 0 141. 0 142.0 143.0 144.0 145.0 146.0 147.0 148.0
CONE TSF
23. 13 22.31 22. 13 22.02 22.23 :'2. 72 23. 11 ~2.99 22.96 ;?4. 14 24. 24 25.35 25. 34 26. 12 24. 71 25. 83 27. 73 29.82 30.25 29. 15 ?8. 97
140.03 114.27 140.04
53. 68 202. 19 ;?61. 10 207. 78 215.46
FRICTION RATIO TSF
0. 49 2. 15 0. 48 2.29 0. !54 2.45 0. ~2 ;z,40 0. 53 2. 42 0. 56 2. 50 0. 55 2.39 0.61 2. 56 0. 59 2. 53 0.60 2. 51 0.62 2.59 0.62 2.71 0.65 2. !59 0.66 2. 52 0.61 2.43 0. 71 2.74 0. 76 2.81 1. 62 4.83 0.81 3. 12 0.79 2. 78 0.84 2.81 3.25 4.47 3.60 3. 55 5.86 4.40 3.06 4. 16 7. 11 3.08 4. 51 3. 90 9.28 4.04 6.00 3.27
SOIL BEHAVIOR TYPES SPT SU=FS*l. 10 SU=CC-T)/NC <PSF) <PSF)
SILTY CLAY 1074. 2143. SILTY CLAY 1056. 2035. SILTY CLAY 1195. 2006. SILTY CLAY 11~3. 198~. SILTY CLAY 1162. 2005. SILTY CLAY 1239. ;2060. SILTY CLAY 1202. 2103. SILTY CLAY 1337. 2081. SILTY CLAY 129!5. 2072. SILTY CLAY 1325. 2213. SILTY CLAY 1362. 2219. SILTY CLAY 1359. 2352. SILTY CLAY 1435. 2344. SILTY CLAY 1462. 2435. SILTY CLAY 1337. 2253. SILTY CLAY 1565. 2387. SILTY CLAY 1668. 2618. SILTY CLAY TO CLAY 3564. 2872. SILTY CLAY 1790. 2920. SILTY CLAY 1749. 2776. SILTY CLAY 1849. 2747. SANDY CLAY TO SILTY CLAY 7155. 13299. SANDY CLAY TO SILTY CLAY 7911. 10718. SANDY CLAY TO SILTY CLAY 12887. 13290. SANDY CLAY TO SILTY CLAY 6724. 4649. CLAYEY SA TO SANDY CLAY CLAYEY SA TO SANDY CLAY SANDY CLAY TO SILTY CLAY 20412. 20045. CLAYEY SA TO SANDY CLAY

Table 5. Tabulated data for CPT site LA-C-2
DEPTH CONE FRICTION RATIO SOIL BEHAVIOR TYPES SPT SU=FS*1. 10 SU=CC-T>INC Fl TSF TSF <PSF) <PSF)
1. 0 411.72 2. 15 0.69 GRAVELLY SAND TO SAND 2.0 387.05 3.62 0.79 GRAVELLY SAND TO SAND 3 0 161.71 0. 43 0.28 GRAVELLY SAND TO SAND 4. 0 116.23 1. 12 0.92 SAND TO SILTY SAND 5. 0 128.05 1. 11 0.95 SAND TO SILTY SAND 6. 0 125. 79 0. 55 0. 45 SAND TO SILTY SAND 7. 0 161. 09 0. 53 0.31 GRAVELLY SAND TO SAND 8.0 2~1. 48 0.66 0.28 GRAVELLY SAND TO SAND 9. 0 232. 24 0. 76 0. 34 GRAVELLY SAND TO SAND
10.0 1 70. 4 9 1.38 0.83 SAND TO SILTY SAND 11. 0 260.31 0. 86 0. 38 GRAVELLY SAND TO SAND 12. 0 324. 62 1. 39 0.42 GRAVELLY SAND TO SAND 13.0 378. 11 1. 89 0. 49 GRAVELLY SAND TO SAND 14.0 387.90 1. 21 0.31 GRAVELLY SAND TO SAND 15.0 353. 48 0. 50 0. 14 GRAVELLY SAND TO SAND 16. 0 334. 68 0. 73 0.20 GRAVELLY SAND TO SAND 17.0 319. 37 0.68 0.21 GRAVELLY SAND TO SAND 18.0 343. 1 s 3.22 0.82 GRAVELLY SAND TO SAND 19.0 48. 89 1. 11 2.21 SANDY 51 TO CLAYEY SILT 20.0 28. 94 1. 28 4.62 SILTY CLAY TO CLAY 2813. 3494. 21. 0 30. 92 0.95 3. 16 SILTY CLAY 2095. 3735. 22.0 25.35 0. 76 3.00 SILTY CLAY 1683. 3032. 23.0 20. 48 0.64 3.22 SILTY CLAY TO CLAY 1404. 2418. 24.0 19.22 0. 57 3. 11 SILTY CLAY TO CLAY 1258. 2254. 25. 0 18. 61 0. 47 3. 15 SILTY CLAY TO CLAY 1031. 2172. 26. 0 23. 68 0.33 1. 40 SANDY SI TO CLAYEY SILT 27.0 22. 14 0.40 1. 80 SANDY SI TO CLAYEY SILT 28. 0 14. 67 0.39 2. 60 SENS. CLAYEY SI-SI CLAY 868. 1660. 29.0 15. 25 0.42 2.63 SENS. CLAYEY SI-SI CLAY 917. 1727. 30.0 30. 54 1. 01 2.31 SANDY 51 TO CLAYEY SILT 31. 0 102. 04 2.83 2.99 CLAYEY SA TO SANDY CLAY 32.0 45. 06 0. 78 2. 17 SANDY SI TO CLAYEY SILT 33.0 26.68 0.62 2.89 SILTY CLAY 1363. 3130. 34. 0 ~4.26 0.61 2.40 SILTY CLAY 1332. 2821. 35.0 13.67 0. 47 3.48 SILTY CLAY TO CLAY 1044. 1492. 36. 0 1~.99 0. 46 2. 72 SENS. CLAYEY SI-SI CLAY 1014. 1776. 37. 0 48. 63 2. 11 3.43 SANDY CLAY TO SILTY CLAY 4633. 4679. 38.0 ~0.99 0.45 2. 18 SENS. CLAYEY SI-81 CLAY 992. 2388. 39.0 133. 50 0.93 1. 01 SAND TO SILTY SAND

C1 Table 5. Tabulated data for CPT site LA-C-2-Continued ~ 0
OQ
F C1 ~ ~ =::I ;:;· ~ ("'' Q ::I
~ s· ~ -l
~ ::I Clol
OQ Clol :;-::::t: ~
QCj"
~ I"'" Clol ::I
~ c.: .!D > j;" <IJ ~ Clol
DEPTH Fl
40. 0 41. 0 42.0 43. 0 44. 0 45.0 46.0 47.0 48. 0 4'9.0 50. 0 51. 0 52. 0 53. 0 54. 0 55.0 56.0 ~7. 0 58. 0 59. 0 60. 0 61. 0 6.2. 0 63. 0 64.0 65. 0 66.0 67 0 68. 0 69.0 70.0 71. 0 72. 0 73. 0 74.0 75. 0 76.0 77. 0 78. 0 79. 0
CONE TSF
18.32 17. 58 14.84 12. 53 10. 47
8. 46 8. 40 8. 14 7. 14 9. 18 8. 97 8. 90 8. 87
10.69 39. 60 15.90 12.97
9. 66 10. 12 10.69 10. 94 12.70 11. 76 11. 58 12. 78 13. 10 12.31 12.09 12.30 15. 29 12.60 13.25 14.26 12. 95 14. 16 14. 10 14.25 14. 72 19.34 14.05
FRICTION RATIO TSF
0. 35 1. 48 0. 29 1. 66 0.31 2. 10 0.35 2.69 0.32 2. 83 0.30 3. 50 0.28 3.33 0. 28 3. 4·1 0.27 3.86 0.28 3.02 0.26 2. 96 0. 28 3.09 0.28 3.20 0. 22 1. 83 0.69 1. 75 0.39 2. 55 0.32 2. 58 0.31 3.08 0.36 3.04 0.30 2.83 0.29 2. 68 0.32 2.63 0.32 2. 72 0.29 2.49 0.32 2.43 0. 29 2.33 o. ,28 2.28 0.26 2.21 0.31 2. 52 0.42 2.64 0.37 2.97 0.38 2.85 0. 47 3. 01 0.35 2. 70 0.42 2.99 0.39 2. 76 0.38 2. 61 0.37 2. 54 0.35 2.0!5 0.29 1. 99
SOIL BEHAVIOR TYPES SPT SU=FS*l. 10 SU=<C-T)/NC <PSF> <PSF>
SANDY SI TO CLAYEY SILT SANDY SI TO CLAYEY SILT SENS. CLAYEY SI-SI CLAY 680. 1594·. SENS. CLAYEY SI-SI CLAY 770. 1299. SENS. CLAYEY SI-SI CLAY 696. 1035. SILTY CLAY TO CLAY 657. 778. SILTY CLAY TO CLAY 620. 764. SILTY CLAY TO CLAY 609. 725. SILTY CLAY TO CLAY 604. 594. SILTY CLAY TO CLAY 616. 843. SILTY CLAY TO CLAY 580. 810. SILTY CLAY TO CLAY 607. 795. SILTY CLAY TO CLAY 627. 785. SENS. CLAYEY SI-SI CLAY 487. 1006. SANDY SI TO CLAYEY SILT SENS. CLAYEY SI-SI CLAY 866. 1646. SENS. CLAYEY SI-SI CLAY 695. 1273. SILTY CLAY TO CLAY 676. 853 . SILTY CLAY TO CLAY 794. 904. SENS. CLAYEY SI-SI CLAY 663. 969. SENS. CLAYEY SI-SI CLAY 642. 994. SENS. CLAYEY SI-SI CLAY 705. 1208. SENS. CLAYEY SI-SI CLAY 711. 1084. SENS. CLAYEY SI-SI CLAY 643. 1055. SENS. CLAYEY SI-SI CLAY 707. 1199. SENS. CLAYEY SI-SI CLAY 639. 1233. SENS. CLAYEY SI-SI CLAY 626. 1128. SENS. CLAYEY SI-SI CLAY 571. 1094·. SENS. CLAYEY SI-SI CLAY 673. 1114. SENS. CLAYEY SI-SI CLAY 931. 148~. SILTY CLAY TO CLAY 817. 1139. SENS. CLAYEY SI-SI CLAY 840. 1214. SILTY CLAY TO CLAY 1026. 1334. SENS. CLAYEY SI-SI CLAY 770. 1165. SILTY CLAY TO CLAY 924. 1309. SENS. CLAYEY SI-SI CLAY 867. 1295. SENS. CLAYEY SI-SI CLAY 834. 1308. SENS. CLAYEY SI-SI CLAY 809. 1361. SENS. CLAYEY SI-SI CLAY 776. 1931. SENS. CLAYEY SI-SI CLAY 628. 1263.
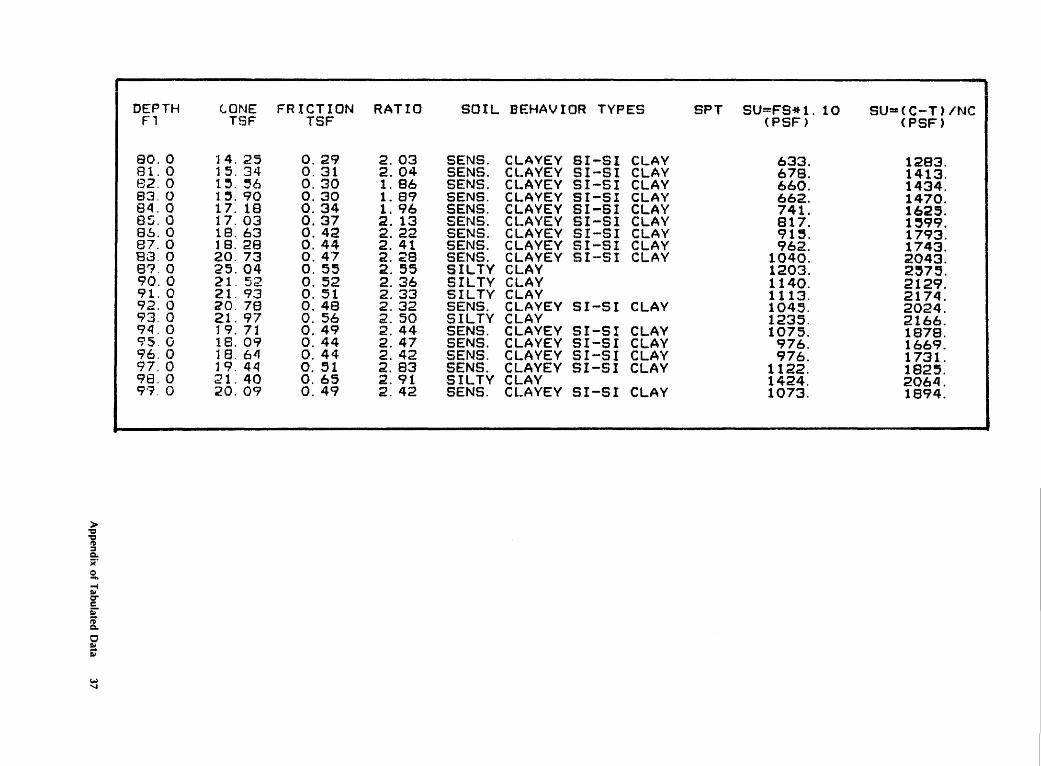
DEPTH CONE FRICTION RATIO SOIL BEHAVIOR TYPES SPT SU='!FS*1. 10 SU=CC-T)/NC F1 TSF TSF CPSF) CPSF)
80.0 14.25 0.29 2.03 SENS. CLAYEY SI-SI CLAY 633. 1283. 81. 0 15.34 0.31 2.04 SENS. CLAYEY Sl-SI CLAY 678. 1413. 82. 0 1~. ~6 0. 30 1. 86 SENS. CLAYEY Sl-SI CLAY 660. 1434. 83. 0 1~.90 0.30 1. 89 SENS. CLAYEY SI-SI CLAY 662. 1470. 84.0 17. 18 0.34 1.96 SENS. CLAYEY SI-SI CLAY 741. 1625. 85.0 17.03 0.37 2. 13 SENS. CL .. AVEY SI-SI CLAY 817. 1~99. 86.0 18. 63 0.42 2.22 SENS. CLAYEY SI-SI CLAY 915. 1793. 87.0 18.28 0. 44 2. 41 SENS. CLAYEY SI-SI CLAY 962. 1743. 88. 0 20. 73 0.47 2.28 SENS. CLAYEY SI-SI CLAY 1040. 2043. 8'?.0 25.04 0. 55 2. 55 SILTY CLAY 1203. 2~75. 90.0 2'1. 52 0. 52 2.36 SILTY CLAY 1140. 2129. 91. 0 21. 93 0. 51 2.33 SILTY CLAY 1113. 2174. 92. 0 20. 78 0.48 2.32 SENS. CLAYEY SI-SI CLAY 1045. 2024. 93. 0 21. 97 0. 56 2. 50 SILTY CLAY 1235. 2166. 94. 0 19. 71 0.49 2.44 SENS. CLAYEY SI-SI CLAY 1075. 1878. 95.0 18. 09 0. 44 2.47 SENS. CLAYEY SI-SI CLAY 976. 1669. 96.0 18. 6'1 0. 44 2. 42 SENS. CLAYEY SI-SI CLAY 976. 1731. 97.0 19. 44 0. 51 2.83 SENS. CLAYEY SI-SI CLAY 1122. 1825. 98.0 21. 40 0. 65 2.91 SILTY CLAY 1424. 2064. 9'1. 0 20. 09 0.49 2.42 SENS. CLAYEY SI-SI CLAY 1073. 1894.

w = Table 6. Tabulated data for CPT site LA-C-3
DEPTH CONE FRICTION FT TSF TSF
1. 0 327. 81 3.81 2. 0 258.96 1. 78 3. 0 94. 79 0. 56 4. 0 11. 69 0. 19 5.0 9. 41 0.20 6.0 108.82 0.·56 7. 0 193. 12 0. 92 8. 0 216.09 1. 74 9.0 210. 86 1. 97
10.0 177.75 1. 90 11. 0 249. 68 1. 64 12. 0 209. 43 1. 74 13.0 249.38 1. 35 14 0 340.06 1. 91 15.0 331. 25 1. 34 16.0 310. 39 1. 10 17.0 271. 69 1.42 18. 0 241. 77 2.63 19. 0 58. 46 2. 21 20.0 55. 79 1. 86 21.0 b4. 79 1. 83 22. 0 39. 59 1. 92 23.0 40.92 1. 59 24.0 20.03 1. 10 25.0 16. 82 0.82 26.0 63. 17 1. 84 27.0 16. 91 0. 48 28. 0 86. 66 1. 20 29 0 23.97 0. 76 30 0 13. 05 0. 48 31. 0 14. 82 0. 47 32.0 15. 66 0. ~7 33. 0 29. 43 1. 07 34.0 24. 45 0. 60 35. 0 16. 72 0. 19 36.0 36. 14 1. :52 37. 0 60. 76 2. 70 38. 0 14. 88 0.4~ 3?.0 16. 16 0. ~4
RATIO
1. 24 0.89 0. 75 1. 58 1. 89 0. 51 0. 52 0.80 0.88 1. 04 0. 71 0.84 0. 51 0. 49 0.37 0. 36 0. 55 1. 03 3.21 2.69 2. 78 4. 56 3.91 4.91 4.75 4.47 3.27 2.89 2. 71 3.71 3. ~9 3.82 3. 46 2. 15 1. 13 ~.48 4.69 3. 11 3.25
SOIL BEHAVIOR TYPES SPT SU=FS*l. 10 SUa(C-T)/NC < PSF.) CPSF>
SAND TO SILTY SAND SAND TO SILTY SAND SAND TO SILTY SAND SENS. CLAYEY SI-SI CLAY 427. 1437. SENS. CLAYEY SI-SI CLAY 438. 1147. SAND TO SILTY SAND GRAVELLY SAND TO SAND SAND TO SILTY SAND SAND TO SILTY SAND SAND TO SILTY SAND GRAVELLY SAND TO SAND SAND TO SILTY SAND GRAVELLY SAND TO SAND GRAVELLY SAND TO SAND GRAVELLY SAND TO SAND GRAVELLY SAND TO SAND GRAVELLY SAND TO SAND SAND TO SILTY SAND SANDY CLAY TO SILTY CLAY 4866. 5752. SANDY SI TO CLAYEY SILT SANDY CLAY TO SILTY CLAY 4031. 6375. SILTY CLAY TO CLAY 4224. 4813. SANDY CLAY TO SILTY CLAY 3501. 3978. SILTY CLAY TO CLAY 2413. 2355. SILTY CLAY TO CLAY 1799. 1948. SANDY CLAY TO SILTY CLAY 4057. 6188. SILTY CLAY TO CLAY 1059. 1947. CLAYEY SA TO SANDY CLAY SILTY CLAY 1671. 2817. SILTY CLAY TO CLAY 1063. 1446. SILTY CLAY TO CLAY 1044. 1660. SILTY CLAY TO C~AY 126~. 1759. SILTY CLAY 2348. 3474. SANDY SI TO CLAYEY SILT SANDY SI TO CLAYEY SILT SILTY CLAY TO CLAY 33~1. 4295. SILTY CLAY TO CLAY !5937. 7365. SILTY CLAY TO CLAY 989. 1624. SILTY CLAY TO CLAY 1184. 1777.

DEPTH CONE FRICTION RATIO SOIL BEHAVIOR TYPES SPT SU=FS*1. 10 SU=<C-T)/NC Fl TSF TSF <PSF) <PSF)
40.0 13. 19 0.36 2.65 SENS. CLAYEY SI-SI CLAY 793. 1401. 41. 0 11. 58 0. 28 2. 42 SENS. CLAYEY SI-SI CLAY 618. 1193. 42. 0 11. 21 0.33 2.85 SENS. CLAYEY SI-SI CLAY 737. 1140. 43.0 10. 28 0.26 2.48 SENS. CLAYEY SI-SI CLAY 572. 1018. 44. 0 10.09 0.22 2. 17 SENS. CLAYEY SI-SI CLAY 475. 988. 45.0 9.88 0.20 2. 19 SENS. CLAYEY SI-SI CLI'.Y 439. 955. 46.0 8.93 0.23 2.66 SENS. CLAYEY SI-SI CLAY 510. 830. 47.0 9.30 0.22 2.41 SENS. CLAYEY SI-SI CLAY 494. 870. 4S.O 10. 98 0.21 2.01 SENS. CLAYEY SI-SI CLAY 471. 1074. 49.0 10. 47 0.28 2.07 SENS. CLAYEY SI-SI CLAY 616. 1004. 50.0 13. 95 0.21 1. 81 SENS. CLAYEY SI-SI CLAY 470. 1433. 51.0 11.05 0. 25 2. 11 SENS. CLAYEY SI-SI CLAY 552. 1064. 52.0 13. 16 0.27 2.09 SENS. CLAYEY SI-SI CLAY 586. 1321. 53.0 12. 87 0. 49 3. 76 SILTY CLAY TO CLAY 1070. 1279. 54. 0 127. 50 2. 13 2. 33 SILTY SA TO CLAYEY SAND 55.0 217.65 3.66 1. 91 SAND TO SILTY SAND 56. 0 70. 73 2. 60 3. 53 SANDY CLAY TO SILTY CLAY ~721. 6794. 57.0 173.20 2. 43 1. 62 SAND TO SILTY SAND 58. 0 1 72. 91 2.09 1. 34 SAND TO SILTY SAND sq. o 13. 95 0. 16 1. 98 SENS. CLAYEY SI-SI CLAY 363. 1376. 60.0 21. 58 1. 32 6.08 CLAY 2908. 2324·. 61. 0 27. 25 2. 18 6. 97 CLAY 4802. 3027. 6'2.0 13.47 0.63 4.81 SILTY CLAY TO CLAY 1381. 1298. 63. 0 11. 42 0. 1:.7 5.89 CLAY 1472. 1036. 64.0 11. 85 0. 74 5.28 CLAY 1626. 1082. 65. 0 11. 97 0. 64 ~.01 SILTY CLAY TO CLAY 1416. 1092. 66. 0 11. 93 0. 51 4. 17 SILTY CLAY TO CLAY 1121. 1080. 67.0 12.68 0.43 3.45 SILTY CLAY TO CLAY 954. 1168. 68. 0 1.2. 92 0. 53 4.20 SILTY CLAY TO CLAY 1166. 1191. 69. 0 15. 84 0.82 4.98 SILTY CLAY TO CLAY 1803. 1551. 70.0 14.28 0.28 2. 14 SENS. CLAYEY SI-81 CLAY 624. 1349. 71. 0 13. 73 0.29 2.08 SENS. CLAYEY SI-SI CLAY 639. 1274. 72.0 14. 91 0.26 1. 78 SENS. CLAYEY SI-SI CLAY 564. 1416. 73.0 13. 63 0.28 2.02 SENS. CLAYEY SI-SI CLAY 606. 1249. 74.0 20. 63 0. 54 2.91 SILTY CLAY TO CLAY 1198. 2117. 75.0 14. 03 0.28 2.03 SENS. CLAYEY SI-SI CLAY 626. 1287. 76.0 14.77 0.:28 1. 99 SENS. CLAYEY SI-SI CLAY 617. 1373. 77.0 16. 19 0.25 1.61 SENS. Cl.AYEY SI-SI CLAY 545. 1544. 78. 0 30. 70 1.01 2.72 SILTY CLAY 2217. 3351. 79.0 19.28 0.46 2. 92 SENS. CLAYEY SI-SI CLAY 1019. 1918.

c ~ en =
Gl 0 Table 6. Tabulated data for CPT site LA-C-3-Continued < m C1 Jl z 1'1)
:s:: 0 m 0 z (JQ --1 f,' -u
DEPTH CONE FRICTION RATIO SOIL BEHAVIOR TYPES SPT SU=FS*1. 10 SUa:CC-T)/NC Fl TSF TSF <PSF) <PSF)
Jl C1 z
--1 1'1)
z 0 Gl ;-0 1"1
~ 01 :I 01 () ;:;· rn e!. u; ("') OJ 0 OJ :I
~ ~ -..J w s· 6 :I .j>. -..J ~ 00
-1 "' 0 ~ 1\) .j>. :I Jl Col m (JQ
Gl Col
6 ;· z :I: z 1'1) 9 ciQ'
;:?; "'
80.0 16.36 0. 53 3. 18 SILTY CLAY TO CLAY 1162. 1546. 81. 0 1~. 08 0.3~ 2. 41 SENS. CLAYEY SI-SI CLAY 781. 1380. 82.0 15. 73 0. 29 1. 80 SENS. CLAYEY SI-SI CLAY 644. 1455. 83.0 15. 95 0. 26 1. 58 SENS. CLAYEY SI-SI CLAY 573. 1477. 84.0 17.08 0.31 1. 90 SENS. CLAYEY SI-SI CLAY 681. 1611. 65.0 17. 40 0. 32 1. 87 SENS. CLAYEY SI-SI CLAY 708. 1645. 86. 0 16. 18 0.29 1. 84 SENS. CLAYEY SI-51 CLAY 645. 1487. 87.0 16. 51 0. 31 1. 88 SENS. CLAYEY SI-SI CLAY 675. 1522. 88.0 16. 48 0.29 1. 71 SENS. CLAYEY SI-SI CLAY 639. 1:511. 8"t.O 18. 58 0. 43 2. 18 SENS. CLAYEY SI-SI CLAY 946. 1768. 90.0 17.39 0.34 1. 94 SENS. CLAYEY SI-SI CLAY 752. 1613. 91. 0 19.83 0. 46 2.33 SENS . CLAYEY SI-SI CLAY 1022. 1911. 92.0 ~1.38 0. 57 2.68 SILTY CLAY 1260. 2100. 93.0 21.?0 0.63 2.88 SILTY CLAY 1385. 2158. 94.0 22. 20 0.68 2.97 SILTY CLAY 1491. 2188. 95.0 22.66 0.68 2.95 SILTY CLAY 1494. 2241. 96.0 22.32 0.62 2.80 SILTY CLAY 1355. 2192. ,....
Col :I
~ 0.: !D > ~ '1fJ(:'" Col
97.0 22. 59 0.69 3.02 SILTY CLAY 1526. 2219. 98.0 23. 01 0.67 2.97 SILTY CLAY 1481. 2266. 99. 0 24.27 0.67 2.92 SILTY CLAY 1477. 2417.
100. 0 26. 74 0.81 3. 02 SILTY CLAY 1778. 2720. 101. 0 28. 19 0.94 3.24 SILTY CLAY 2062. 2894. 102.0 28. 02 0.84 3. 10 SILTY CLAY 1853. 2867. 103.0 28. 30 0.88 3. 14 SILTY CLAY 1938. 2895. 104.0 27.32 0. 82 2.96 SILTY CLAY 1798. 2767. 105. 0 27.87 0. 85 2.99 SILTY CLAY 1861. 2829. 106.0 27. 19 0. 75 2.89 SILTY CLAY 1641. 2737. 107.0 32.81 1. 27 3.63 SILTY CLAY 2801. 3434. 108.0 26.23 0. 68 2. 78 SILTY CLAY 1501. 2606. 109. 0 21. 68 0. 52 2.68 SILTY CLAY 1153. 2030. 110.0 2.1. 85 0. 56 2.66 SILTY CLAY 1240. 2046. 111.0 20. 50 0.48 2.42 SENS. CLAYEY SI-SI CLAY 1057. 1870. 112.0 22. 46 0.61 2.67 SILTY CLAY 1332. 2109. 113.0 19.08 0.43 2.27 SENS. CLAYEY SI-SI CLAY 955. 1681. 11~.0 18.87 0.42 2.24 SENS. CLAYEY SI-SI CLAY 919. 1648. 115.0 18.92 0.37 1. 94 SENS·. CLAYEY SI-SI CLAY 808. 1648. 116.0 36.32 1. 48 3.89 SILTY CLAY TO CLAY 3257. 3817. 117.0 27.93 0. 75 2. 58 SILTY CLAY 1653. 2762. 118.0 (:.9.65 2.65 3.99 SANDY CLAY TO SILTY CLAY 5838. 6377. 11?.0 52. 82 2 .. 59 4. 40 SANDY CLAY TO SILTY CLAY 5'703. 4688. 120.0 86.36 3.05 4.04 SANDY CLAY TO SILTY CLAY 6704. 8037. 121. 0 191. 67 8.32 4. 86 SANDY CLAY TO SILTY CLAY 18304. 18563. 122.0 291.68 9. 76 3.43 CLAYEY SA TO SANDY CLAY


