Geographical Structuring of Genetic Diversity Across the ...
12
Geographical Structuring of Genetic Diversity Across the Whole Distribution Range of Narcissus longispathus, a Habitat-specialist, Mediterranean Narrow Endemic MO ´ NICA MEDRANO* and CARLOS M. HERRERA Estacio ´n Biolo ´gica de Don ˜ana, Consejo Superior de Investigaciones Cientı ´ficas (CSIC), Avenida de Marı ´a Luisa s/n, E-41013, Sevilla, Spain Received: 13 March 2008 Returned for revision: 21 April 2008 Accepted: 9 May 2008 Published electronically: 13 June 2008 † Background and Aims High mountain ranges of the Mediterranean Basin harbour a large number of narrowly endemic plants. In this study an investigation is made of the levels and partitioning of genetic diversity in Narcissus longispathus, a narrow endemic of south-eastern Spanish mountains characterized by a naturally fragmen- ted distribution due to extreme specialization on a rare habitat type. By using dense sampling of populations across the species’ whole geographical range, genetic structuring at different geographical scales is also examined. † Methods Using horizontal starch-gel electrophoresis, allozyme variability was screened at 19 loci for a total of 858 individuals from 27 populations. The datawere analysed by means of standard statistical approaches in order to esti- mate gene diversity and the genetic structure of the populations. † Key Results Narcissus longispathus displayed high levels of genetic diversity and extensive diversification among populations. At the species level, the percentage of polymorphic loci was 68 %, with average values of 2 . 1, 0 . 11 and 0 . 14 for the number of alleles per locus, observed heterozygosity and expected heterozygosity, respectively. Southern and more isolated populations tended to have less genetic variability than northern and less-isolated popu- lations. A strong spatial patterning of genetic diversity was found at the various spatial scales. Gene flow/drift equi- librium occurred over distances ,4 km. Beyond that distance divergence was relatively more influenced by drift. The populations studied seem to derive from three panmictic units or ‘gene pools’, with levels of admixture being greatest in the central and south-eastern portions of the species’ range. † Conclusions In addition to documenting a case of high genetic diversity in a narrow endemic plant with naturally fragmented populations, the results emphasize the need for dense population sampling and examination of different geographical scales for understanding population genetic structure in habitat specialists restricted to ecological islands. Key words: Allozymes, genetic diversity, geographical scale, habitat isolation, Narcissus longispathus, Mediterranean endemism, mountain range, natural fragmented distribution. INTRODUCTION In the Betic mountain ranges of the southern Iberian Peninsula, one of the most prominent plant diversity hotspots in the Mediterranean Basin, endemic taxa often represent a substantial proportion of regional floras (Sainz Ollero and Moreno Saiz, 2002; Melendo et al., 2003; Thompson, 2005). Many of these endemics are restricted and uniquely adapted to uncommon, highly fragmented habitat types, such as patches of sandy dolomitic soils, wet overhanging cliffs, or permanently water-logged meadows associated with springs. Species restricted to these ‘ecological islands’ have naturally fragmented distributions, which may often lead to long-term genetic isolation among populations. Steep topographic and climatic gradients, characteristic of mountain habitats, may also make migration and genetic exchange among these ‘islands’ extremely difficult. These conditions, in combination with life-history features such as growth form, mating system and seed dispersal mechanism, may eventually shape the spatial distribution of genetic vari- ation (Hamrick and Godt, 1989, 1996). In species with fragmented distributions, population size and the level of geographical separation between populations may strongly influence the spatial structure of genetic vari- ation (reviewed in Young et al., 1996; Leimu et al., 2006). As a result of random drift and limited gene flow, small iso- lated populations are expected to show lower allelic diversity and heterozygosity within populations, and higher genetic differentiation among populations, than large adjoining populations (Wright, 1951; Lande, 1988; Barrett and Kohn, 1991; Ellstrand and Elam, 1993). In addition, long-term iso- lated populations would be expected to be significantly dif- ferentiated with no discernible pattern of genetic structure, the overall distribution of genetic diversity should be hapha- zard, and species-level genetic diversity should be consider- ably higher than mean population values (Gonzales and Hamrick, 2005). On the other hand, for organisms like plants in which dispersal ability is restricted, theory predicts that at gene-flow-drift equilibrium a significant association between genetic and geographical distances should exist; but also, based on the stepping-stone model of population genetic structure (Kimura and Weiss, 1964), the relative influence of gene flow and drift should change as populations become more geographically separated (Hutchison and Templeton, 1999; Herrera and Bazaga, 2008). The wild daffodil Narcissus longispathus is an example of a Mediterranean narrow endemic with naturally * For correspondence. E-mail [email protected] # The Author 2008. Published by Oxford University Press on behalf of the Annals of Botany Company. All rights reserved. For Permissions, please email: [email protected] Annals of Botany 102: 183–194, 2008 doi:10.1093/aob/mcn086, available online at www.aob.oxfordjournals.org
Transcript of Geographical Structuring of Genetic Diversity Across the ...

Geographical Structuring of Genetic Diversity Across the Whole DistributionRange of Narcissus longispathus, a Habitat-specialist, Mediterranean
Narrow Endemic
MONICA MEDRANO* and CARLOS M. HERRERA
Estacion Biologica de Donana, Consejo Superior de Investigaciones Cientıficas (CSIC), Avenida de Marıa Luisa s/n,E-41013, Sevilla, Spain
Received: 13 March 2008 Returned for revision: 21 April 2008 Accepted: 9 May 2008 Published electronically: 13 June 2008
† Background and Aims High mountain ranges of the Mediterranean Basin harbour a large number of narrowlyendemic plants. In this study an investigation is made of the levels and partitioning of genetic diversity inNarcissus longispathus, a narrow endemic of south-eastern Spanish mountains characterized by a naturally fragmen-ted distribution due to extreme specialization on a rare habitat type. By using dense sampling of populations acrossthe species’ whole geographical range, genetic structuring at different geographical scales is also examined.† Methods Using horizontal starch-gel electrophoresis, allozyme variability was screened at 19 loci for a total of 858individuals from 27 populations. The data were analysed by means of standard statistical approaches in order to esti-mate gene diversity and the genetic structure of the populations.† Key Results Narcissus longispathus displayed high levels of genetic diversity and extensive diversification amongpopulations. At the species level, the percentage of polymorphic loci was 68 %, with average values of 2.1, 0.11 and0.14 for the number of alleles per locus, observed heterozygosity and expected heterozygosity, respectively.Southern and more isolated populations tended to have less genetic variability than northern and less-isolated popu-lations. A strong spatial patterning of genetic diversity was found at the various spatial scales. Gene flow/drift equi-librium occurred over distances ,4 km. Beyond that distance divergence was relatively more influenced by drift.The populations studied seem to derive from three panmictic units or ‘gene pools’, with levels of admixturebeing greatest in the central and south-eastern portions of the species’ range.† Conclusions In addition to documenting a case of high genetic diversity in a narrow endemic plant with naturallyfragmented populations, the results emphasize the need for dense population sampling and examination of differentgeographical scales for understanding population genetic structure in habitat specialists restricted to ecologicalislands.
Key words: Allozymes, genetic diversity, geographical scale, habitat isolation, Narcissus longispathus, Mediterraneanendemism, mountain range, natural fragmented distribution.
INTRODUCTION
In the Betic mountain ranges of the southern IberianPeninsula, one of the most prominent plant diversity hotspotsin the Mediterranean Basin, endemic taxa often represent asubstantial proportion of regional floras (Sainz Ollero andMoreno Saiz, 2002; Melendo et al., 2003; Thompson,2005). Many of these endemics are restricted and uniquelyadapted to uncommon, highly fragmented habitat types,such as patches of sandy dolomitic soils, wet overhangingcliffs, or permanently water-logged meadows associatedwith springs. Species restricted to these ‘ecological islands’have naturally fragmented distributions, which may oftenlead to long-term genetic isolation among populations.Steep topographic and climatic gradients, characteristic ofmountain habitats, may also make migration and geneticexchange among these ‘islands’ extremely difficult. Theseconditions, in combination with life-history features such asgrowth form, mating system and seed dispersal mechanism,may eventually shape the spatial distribution of genetic vari-ation (Hamrick and Godt, 1989, 1996).
In species with fragmented distributions, population sizeand the level of geographical separation between populations
may strongly influence the spatial structure of genetic vari-ation (reviewed in Young et al., 1996; Leimu et al., 2006).As a result of random drift and limited gene flow, small iso-lated populations are expected to show lower allelic diversityand heterozygosity within populations, and higher geneticdifferentiation among populations, than large adjoiningpopulations (Wright, 1951; Lande, 1988; Barrett and Kohn,1991; Ellstrand and Elam, 1993). In addition, long-term iso-lated populations would be expected to be significantly dif-ferentiated with no discernible pattern of genetic structure,the overall distribution of genetic diversity should be hapha-zard, and species-level genetic diversity should be consider-ably higher than mean population values (Gonzales andHamrick, 2005). On the other hand, for organisms likeplants in which dispersal ability is restricted, theory predictsthat at gene-flow-drift equilibrium a significant associationbetween genetic and geographical distances should exist;but also, based on the stepping-stone model of populationgenetic structure (Kimura and Weiss, 1964), the relativeinfluence of gene flow and drift should change as populationsbecome more geographically separated (Hutchison andTempleton, 1999; Herrera and Bazaga, 2008).
The wild daffodil Narcissus longispathus is an exampleof a Mediterranean narrow endemic with naturally* For correspondence. E-mail [email protected]
# The Author 2008. Published by Oxford University Press on behalf of the Annals of Botany Company. All rights reserved.
For Permissions, please email: [email protected]
Annals of Botany 102: 183–194, 2008
doi:10.1093/aob/mcn086, available online at www.aob.oxfordjournals.org

fragmented distribution. The species is a strict habitatspecialist occupying poorly drained, deep soils aroundsprings and permanent stream banks, and is restricted to afew contiguous mountain ranges in south-eastern Spain(Herrera et al., 1999). Throughout its small geographicalrange, N. longispathus occurs as discrete, small populationsvarying in size from dozens to a few thousand plants.Estimates of within-population genetic diversity and differ-entiation among N. longispathus populations reported pre-viously by Barrett et al. (2004) support some of theexpectations derived from consideration of the species’specialization on an uncommon, patchy habitat type.However, that earlier investigation considered only a fewpopulations from a restricted area. In this study we investi-gate the structuring of genetic diversity in N. longispathus bysampling most known locations for the species, distributedacross its whole geographical range. Specifically, the
following questions are addressed. (1) How much geneticdiversity does a habitat-specialist, narrow endemic likeN. longispathus maintain at both the species’ and local popu-lation levels? (2) How is genetic diversity spatially structuredacross the entire range of the species? (3) Are smaller, geo-graphically more-isolated or peripheral populations geneti-cally less variable and/or more differentiated than larger,less-isolated or central populations?
MATERIALS AND METHODS
Study species
Narcissus longispathus Pugsley (Amaryllidaceae) is a peren-nial herb with a narrow distribution range (Fig. 1). Aspects ofits floral biology, pollination ecology and mating system havebeen described by Herrera (1995), Barrett et al. (2004) and
<1000 m
1000–1500 m
>1500 m
Elevation:
##
#
#
#
#
####
#
38º35'N
37º55'N
2º17'W2º37'W2º57'W
38º15'N
10 km
N
GMA
RAJPES
OSO
NASTEJ
NCA
JOR
VTP
CAR
CENCPECTR
CBEVAL
CLAREI
CAB
CAN
MCAGTN
VTFHOR
NSPTGA
PER
VCU
200 km
FI G. 1. Distribution range of the narrow endemic Narcissus longispathus in the Iberian Peninsula (shaded area), and all known locations of the species(as of January 2007, main map). In the detailed map, which encompasses the mountain range running from Sierra del Pozo in the southwest to Sierra deAlcaraz in the northeast, the white dots indicate the 27 locations sampled for the present study and black dots represent the 12 unsampled locations. See
Appendix for additional information on the sampled populations.
Medrano and Herrera — Structuring of Genetic Diversity in Narcissus184

Medrano et al. (2005). This large-flowered daffodil (corollalength around 50 mm) almost invariably produces a singlehermaphrodite flower per inflorescence (contra Blanchard,1990; p. 148). Flowers possess wide, greenish floral tubesand large, funnel-like yellow coronas. Flowering takesplace from late February to late April, a period characterizedby cool, rainy weather that frequently limits the activity of thespecies’ main pollinator (Andrena bicolor, Andrenidae).Despite infrequent pollinator visitation, seed production isonly weakly pollen-limited. Narcissus longispathus is self-compatible, but in the absence of pollinators flowers hardlyever set seed. The species has a mixed mating system, produ-cing both outcrossed and selfed seeds, although few selfedoffspring survive to maturity because of high inbreedingdepression (Barrett et al., 2004). Fruit maturation and seedshedding take place in late May/early June. The seeds arethick-coated and buoyant; thus although most seeds falldirectly on the ground beneath parent plants, it is possiblethat some seeds can occasionally be dispersed by waterbeyond the limits of local populations. Occasional long-distance endozoochorous seed dispersal may also occur fol-lowing the ingestion of ripe fruit by large mammals. Plantsoften spread clonally via fision of bulbs, sometimes givingrise to dense clumps of genetically identical individuals.
The taxonomical distinctiveness of N. longispathus hasbeen long agreed upon by botanists, who have also generallyagreed that the species’ distribution range is restricted tothe contiguous Sierras de Cazorla, Las Villas, Segura andAlcaraz in the south-eastern Iberian Peninsula (Webb,1980; Blanchard, 1990; Mathew, 2002). Occasional reportsfrom other southern Iberian mountain ranges stem fromconfusion with the morphologically similar Narcissus bugei(M. Medrano and C. M. Herrera, pers. obs.). Rıos et al.(1999) described three species (Narcissus segurensis,Narcissus yepesii and Narcissus alcaracensis) from a fewclose localities in the north-eastern range of N. longispathus,based on tenuous morphological differences. In the absenceof a rigorous validation of these taxa, in this paper we havefollowed Webb’s (1980) and Blanchard’s (1990) ‘classical’treatment, and considered all the populations sampledfor our study as belonging to Narcissus longispathus.Irrespective of nomenclatural issues, however, molecularevidence demonstrates that all the populations consideredhere belong to the same monophyletic entity (J. Fuertes,Real Jardın Botanico de Madrid, CSIC, Spain, pers. comm.).
Sampling procedure
During the flowering seasons of 2003–2006, a total of858 N. longispathus plants were sampled from 27 differentgeographical locations distributed along a latitudinal gradientspanning approximately 120 km and encompassing theentire range of the species (Fig. 1, Appendix). Nearlytwo-thirds of all known locations for the species weresampled. The unequal geographical distribution of samplinglocations mainly reflects the decline in the frequency of thespecies from south to north (Fig. 1). Each sampling sitecorresponded to a discrete ecological population formedby a group of plants confined to a well-delimited patch ofpermanently damp meadow or river bank, separated from
other such groups by some hundred meters or, usually, afew kilometres of unsuitable habitat that will presumablyrestrict gene flow. Since gene flow will be considerablygreater within rather than among ecological populations,there is justification in assuming that ecological and geneticpopulations will be largely coincident.
Between 20–38 plants were randomly selected at eachsampling location (Appendix). To avoid sampling onegenetic individual more than once, the selected plantswere as widely spaced as the spatial extent of the populationallowed. One recently open flower was collected fromeach plant, kept refrigerated in a portable cooler, and sub-sequently stored at –80 8C until protein extraction. Thetotal number of flowering ramets at each sampling sitewas estimated visually, and each population assigned toone of the following three size categories: small, ,200flowering ramets (eight populations); medium, 200–1000flowering ramets (ten populations); and large, .1000 flow-ering ramets (nine populations).
Particularly among organisms whose dispersal ability isrestricted, the degree of isolation of a population can beinfluenced not only by the average distance that separatesit from all other conspecific populations, but also by thedistance to the nearest population (Eckstein et al., 2006;Honnay et al., 2007). The level of geographical isolationof each sampled population was thus estimated using twodifferent distance measures: (1) the straight-line distancefrom each population to the nearest sampled population(range: 0.1–13.0 km; Appendix); and (2) the averagestraight-line distance from each population to the other 26sampled populations (range: 25.7–77.2 km; Appendix).These two distance measurements were uncorrelated inthe sample of populations studied (r ¼ 0.16, n ¼ 27,P ¼ 0.41). Other measures descriptive of the level of iso-lation or marginality of each population were also estimated(e.g. distance to nearest known population, distance to thecentroid of the species range), but were closely correlatedwith the other two measures and were therefore notincluded in the analyses.
Allozyme electrophoresis
Starch-gel electrophoresis was used to determine allozymediversity. Homogenization, electrophoresis and enzymeassay procedures followed the general methods of Soltiset al. (1983) and Wendel and Weeden (1989). In the labora-tory, small pieces of chilled flower tissue were ground withfour drops of 0.02 M Na2HPO4 extraction buffer (pH ¼ 7.4)containing 1 mg mL– 1 DL-dithiothreitol. The crude extractwas immediately absorbed onto chromatography paperwicks (Whatman 3MM or 17MM), and kept at –80 8C untilelectrophoresis was performed on 11–12 % starch gels.Based on previous work (Barrett et al., 2004), elevenenzyme systems were resolved using two electrophoreticbuffer systems. A continuous histidine-citrate buffer(pH ¼ 6.5) was used to resolve aconitase (ACO, E.C.4.2.1.3), acid phosphatase (ACP, E.C. 3.1.3.2), isocitratedehydrogenase (IDH, E.C. 1.1.1.42), glucose-6-phosphateisomerase (PGI, E.C. 5.3.1.9), malate dehydrogenase(MDH, E.C. 1.1.1.37) and phosphoglucomutase (PGM,
Medrano and Herrera — Structuring of Genetic Diversity in Narcissus 185

E.C. 5.4.2.2). A discontinuous lithium-borate buffer (pH ¼8.3) was used to resolve alcohol dehydrogenase (ADH,E.C. 1.1.1.1), aspartate amino transaminase (AAT, E.C.2.6.1.1), diaphorase (DIA, E.C. 1.6.4.3), formate dehydro-genase (FDH, E.C. 1.2.1.2) and leucyl aminopeptidase(LAP, E.C. 3.4.11.1). Although they appeared highly vari-able, other enzyme systems such as 6-phosphogluconatedehydrogenase (6PGD, E.C., 1.1.1.44) and shikimate dehy-drogenase (SKDH, E.C., 1.1.1.25) could not be consistentlyresolved and were excluded from the analyses. A total of 19loci with consistent, clearly interpretable banding patternswere scored: MDH, five loci; AAT, ACO, PGI and LAP,two loci each; and all other enzyme systems, a single scorablelocus. For each enzyme, gene loci and alleles were inferredand labelled following numerical and alphabetical sequence,respectively.
Statistical analyses
Estimates of genetic diversity at the species’ (combiningall the populations into a single sample) and populationlevels were obtained using the following standard geneticparameters: percentage of polymorphic loci (P99, 0.99 cri-terion), average number of alleles per locus (A), observedheterozygosity (Ho), and gene diversity or Nei’s unbiasedexpected heterozygosity under Hardy–Weinberg equili-brium (He ¼ 1 – Sf i
2). These parameters were calculatedusing GDA 1.1 (Lewis and Zaykin, 2001). In addition, amultilocus fixation index (FIS), a measure of inbreedingwithin populations, was calculated for each populationusing FSTAT, version 2.9.3 (Goudet, 2001). The signifi-cance of the FIS values calculated over all loci for eachpopulation was tested by randomization tests (randomizingalleles among individuals). Total genetic diversity was par-titioned into within- and among-population componentsusing Nei’s (1973, 1987) genetic diversity statistics. Foreach polymorphic locus, total gene diversity (HT) was par-titioned into diversity within populations (HS) and diversityamong populations (DST), as HT ¼ HS þ DST. A measure ofgenetic differentiation among populations relative to thetotal genetic diversity (GST) was calculated at each poly-morphic locus (GST ¼ DST/HT) and then averaged overall loci. Theoretically, GST ranges from zero (all geneticvariation maintained within populations) to 1 (all geneticvariation maintained among populations).
The expectation of reduced genetic diversity in small,marginal or isolated populations was tested by regressingeach measurement of within-population genetic variation(dependent variables: P99, A, Ho and He) on the distanceto the nearest population, the average distance to all otherpopulations, and population size (coded as an ordinal vari-able) using multiple regression. To account for possibleclinal patterns, latitude was also included in all these ana-lyses as a continuous independent variable.
Spatial structuring of genetic variation was investigatedby combining two different approaches, based on geneticparameters of pre-defined populations (sampling locations)and on individual multilocus genotypes, respectively. Forthe first approach, pairwise FST values between all pairsof populations were estimated according to Weir and
Cockerham (1984), and statistical significance of differen-tiation between populations was tested with a permutationtest using FSTAT. The relative importance of gene flowand drift in determining genetic structure, as well as depar-tures from equilibrium, were tested by plotting populationpairwise FST values against geographical distances(Hutchison and Templeton, 1999; see also Slatkin, 1993;Rousset, 1997). Untransformed FST and distance valueswere used in the analyses to allow direct comparison ofour results with Hutchison and Templeton’s (1999) theor-etical scenarios. The strength and significance of therelationships were evaluated using regression analysis anda Mantel test (10 000 permutations) as implemented inFSTAT. The results suggested that the shape of the relation-ship between FST and geographical distances varied withdistance. This possibility was examined by means of piece-wise regression, a form of regression that allows multiplelinear models to be fitted to the data for different rangesof the independent variable (x). The ‘breakpoint’, or thevalue of x where the slope of the regression changes, wasestimated using Ryan and Porth’s (2007) method, which isbased on simultaneously solving independent regressionsby means of non-linear least-squares fitting.
Two methods based on individual multilocus genotypesand not requiring a pre-defined delimitation of geneticpopulations were used to study spatial genetic structuringat the whole-species range. The assignment of individualsinto genetic groups was examined with the programSTRUCTURE version 2.2 (Pritchard et al., 2000; Falushet al., 2007). This program probabilistically assigns geno-typed individuals into genetic groups in order to minimizedepartures from Hardy–Weinberg equilibrium and linkageequilibrium. The number of genetic groups (I) was exploredby performing five replicates of each simulation from K ¼ 1to K ¼ 28, with a burn-in of 50 000, and MCMC of100 000, assuming admixture and correlated allele frequen-cies as recommended by Pritchard et al. (2000). We appliedEvanno et al.’s (2005) modal DK parameter as the choicecriterion to detect the true number of genetic groups inthe set of n ¼ 858 individuals assayed. In addition to esti-mating the number of genetic groups, STRUCTUREestimates Q, the proportion of membership of each indivi-dual into a given genetic cluster. When genetic variationis hierarchically organized, the algorithm underlyingSTRUCTURE detects only the uppermost level of popu-lation structure (Evanno et al., 2005), thus the results ofthis analysis can provide a view of genetic structuring atthe higher spatial scale corresponding to the whole distri-bution of the species. In order to investigate spatial structur-ing of genetic variation at smaller spatial scales, we usedspatial autocorrelation analysis of multi-allele, multilocusgenetic similarity of individual plants, using the Smouseand Peakall (1999) method as implemented in GenAlExversion 6 (Peakall and Smouse, 2006). This methoddiffers from classical spatial autocorrelation analysis inthat it employs a multivariate approach to simultaneouslyassess the spatial signal generated by multiple loci andalleles. The starting point for the analysis, in which then ¼ 858 individuals were treated as a single population,was a pair of 858 � 858 matrices of geographical and
Medrano and Herrera — Structuring of Genetic Diversity in Narcissus186

genetic distances between individuals. Geographical dis-tances between individuals from the same populationswere set to zero. The number and width of distanceclasses were chosen so as to obtain a greater spatial resol-ution at the shortest distances without compromising thenumber of data points per interval. This resulted in thechoice of 15 distance classes that increased in width withincreasing distance. Standard errors of estimates of auto-correlation coefficients were obtained by bootstrapping.
RESULTS
Genetic diversity
The 19 loci scored gave a total of 40 alleles in the 27 popu-lations of N. longispathus studied. Five loci (26.3 %) weremonomorphic in all populations (Pgi-1, Aco-1, Mdh-2,Mdh-3 and Mdh-4), and the remaining 14 (73.7 %) werepolymorphic in more than one population except Idh-1,which showed variation only in CBE. Polymorphic locihad two to three alleles, with the exception of Pgi-2 thathad four alleles. Four private alleles (i.e. alleles restrictedexclusively to one population) were found: Idh-1a to CBE,Lap-1c to NAS, Pgi-2b to CTR and Pgm-1c to GMA. Acomplete table of the allele frequencies is available onlineas Supplementary Information, and estimates of overallgenetic diversity at the species level are shown in theAppendix. The proportion of loci polymorphic accordingto the 0.99 criterion (P99) was 68.4 %, and the meannumber of alleles per locus (A) was 2.1. Observed hetero-zygosity for the species as a whole (Ho ¼ 0.110) was slightlylower than expected heterozygosity (He ¼ 0.139), whichsuggests a slight heterozygote deficiency.
Population-level estimates of genetic diversity variedwidely among populations (Fig. 2). Values of P99 rangedbetween 21.1–52.6 %, Ho between 0.049–0.202, andHe between 0.046–0.184. The mean number of allelesper locus (A) was less variable among populations(range ¼ 1.21–1.58). The mean inbreeding coefficient(FIS) for the set of 27 populations was 0.051 (seeAppendix), which suggests a negligible level of inbreedingfor the species as a whole. Broad among-population
variation becomes apparent, however, when population-level estimates are considered, with FIS values rangingbetween –0.135 and 0.468 (Fig. 2, Appendix).
Nei’s genetic diversity statistics are shown in Table 1separately for all polymorphic loci. Average total hetero-zygosity (HT) and intra-population genetic diversity (HS)were 0.140 and 0.117, respectively. The coefficient ofgenic differentiation among populations (GST) rangedbetween 0.013 (Idh-1) and 0.314 (Aat-2), with an overallmean of 0.163. These results indicate that approx. 16 %of total genetic variation in N. longispathus was due to vari-ation among populations, and that most genetic variability(approx. 84 %) occurred within populations.
Multiple-regressions testing for the effects on geneticdiversity estimates of population size, latitude, distance tothe nearest population and mean distance to the rest of
020 30
P99 (%) Ho He FIS
40 50 0·04 0·08 0·12 0·16 0·20 0·04 0·08 0·12 0·16 0·20 –0·2 –0·1 0·0 0·1 0·2 0·3 0·4 0·5
2
4
6
8
10
12
Freq
uenc
y
FI G. 2. Frequency distributions of population-level estimates of genetic diversity (P99, Ho, He) and inbreeding coefficient (FIS) for the set of populationsof Narcissus longispathus sampled (n ¼ 27). In each graph the means are indicated by black triangles. See Appendix for population-level data and
additional information on the populations sampled.
TABLE 1. Gene diversity statistics for the 14 polymorphicloci considered in this study that were identified in
N. longispathus
Nei’s genetic diversity indices
Locus HT HS DST GST
Pgm-1 0.038 0.034 0.004 0.111Idh-1 0.002 0.002 0.000 0.013Pgi-2 0.388 0.307 0.081 0.208Acph-1 0.101 0.088 0.013 0.128Dia-1 0.429 0.324 0.105 0.244Lap-1 0.030 0.029 0.001 0.042Lap-2 0.459 0.404 0.054 0.118Aat-2 0.100 0.068 0.031 0.314Aat-3 0.082 0.062 0.020 0.245Mdh-1 0.075 0.057 0.018 0.235Mdh-5 0.464 0.437 0.027 0.059Adh-1 0.026 0.023 0.003 0.099Fdh-1 0.343 0.273 0.069 0.202Aco-2 0.116 0.111 0.006 0.049Overall 0.140 0.117 0.023 0.163
HT ¼ total genetic diversity for the species; HS ¼ meanwithin-population genetic diversity; DST ¼ mean genetic diversity amongpopulations; GST ¼ proportion of total genetic diversity amongpopulations.
Medrano and Herrera — Structuring of Genetic Diversity in Narcissus 187

populations provided contrasting results depending on theparameter used as the dependent variable. Statisticallysignificant regressions were found for the proportion ofpolymorphic loci (P99; R2 ¼ 0.345) and mean number ofalleles per loci (A; R2 ¼ 0.272), but not for observed (Ho)or expected (He) heterozygosity (Table 2). In the formertwo cases, only geographical latitude and distance to thenearest population had significant effects on both P99
(b ¼ 0.747 and –0.498, respectively) and A (b ¼ 0.666and –0.369, respectively; Table 1). As denoted by thesigns of the respective regression coefficients, the greaterthe latitude of a population and the smaller its distance tothe nearest population, the greater its genetic diversity asmeasured with these two parameters. Northern populationsand those with closer neighbours thus tended to have greaterpolymorphism and allelic richness than southern or moreisolated populations.
Geographical structuring of genetic variation
The analysis of the relationships between populationsusing STRUCTURE showed a distinct modal maximumof DK at K ¼ 3 genetic groups. Membership assignmentsto the three inferred genetic groups exhibited a distinct geo-graphical pattern. The highest proportions of membership togroups 1, 2 and 3 occurred at populations located at thenorth-eastern, north-western and south-western extremesof the species distribution, respectively (Fig. 3). Withonly minor exceptions, populations located at the centraland south-eastern portions of the range were consistentlycharacterized by high admixture levels and intermediatemean group memberships (Fig. 3).
Genetic distance among populations, as measured by pair-wise FST, correlated positively with geographical distanceacross the geographical range of the species (r ¼ 0.421,P , 0.0001, Mantel’s test with 10 000 permutations;Fig. 4A), with approx. 18 % of the variation in genetic differ-entiation between populations being explained by geogra-phical separation. The scatter of points around the regressionincreased with geographical distance, as revealed by thesignificant positive correlation between residuals andgeographical distance (r ¼ 0.907, P , 0.0001, Mantel’s testwith 10 000 permutations). The graph also suggests that therelationship between genetic and geographical distance isdistance-dependent. This possibility was confirmed by fittinga piecewise, non-linear regression to the data (Fig. 4A),
which reveals an abrupt discontinuity in the slope of therelationship between genetic and geographical distancetaking place at 3.9 km (95 % confidence interval estimatedby bootstraping ¼ 3.3–6.1 km). Up to that distance, there isa close and steep genetic–geographical distance relationship,which becomes looser and considerably more shallowbeyond that distance. Although no formal test is availablefor comparing the goodness of fit of conventional and non-linear piecewise regressions, the model squared error of thepiecewise regression (0.00699) is one order of magnitudesmaller than the corresponding value for the conventionallinear regression (0.08443), which reveals a considerablybetter fit of the relationship between genetic and geographicaldistance.
TABLE 2. Results of multiple regression analyses relating four within-population genetic diversity estimates to population size(treated as an ordinal variable), geographical latitude, distance to the nearest population (Dist1), and mean distance to the
rest of the populations (Dist2), for the set of 27 Narcissus longispathus populations studied
Dependent variable
Standardized partial regression coefficients Significance of regression
Population size Latitude Dist1 Dist2 R2 F4,22 P-value
P99 0.019 0.747** –0.498*** –0.260 0.345 4.42 0.009A 0.096 0.666* –0.369* –0.138 0.272 3.43 0.025Ho 0.059 0.247 –0.247 0.174 0.047 1.32 0.29He –0.036 0.393 –0.335 0.128 0.185 2.47 0.074
*0.05 , P , 0.07; **P , 0.05; ***P , 0.01. Significant coefficients are shown in bold type.
Group 1
Group 2
Group 3
10 km
N
FI G. 3. Population structure of Narcissus longispathus inferred using themodel-based clustering method implemented in STRUCTURE. The indi-vidual pie charts indicate the mean proportion of membership of each
local population for the inferred number of K ¼ 3 genetic groups.
Medrano and Herrera — Structuring of Genetic Diversity in Narcissus188

The spatial autocorrelation analysis provides additionalevidence of strong small-scale patterning of genetic variationacross the distribution range of N. longispathus (Fig. 4B).Genetic correlations between individuals are high and signifi-cantly greater than zero at the three shorter, narrowest distanceclasses (0–1, 1–2 and 2–3 km), declining steadily down tozero at the 3–4 km distance class. Beyond that distance, auto-correlations are either zero or negative. The first x-intercept,which provides an estimate of the extent of non-random (posi-tive) genetic structure, occurs at 3.91 km; thus remarkablyclose to the 3.93 km break-point obtained from the piecewiseregression of pairwise genetic and geographical distancesbetween populations.
DISCUSSION
Genetic diversity
This study confirms for the whole distribution range of thespecies earlier results showing that, despite its small geo-graphical range, N. longispathus is characterized by high
genetic diversity at both the species’ and local populationlevels (Barrett et al., 2004). The results also indicate thatmost of the total genetic variation was present within popu-lations, a pattern that has often been described for mountainplants (Wesche et al., 2006, and references therein). Contraryto expectations, there were no significant effects of eitherpopulation size or degree of marginality in relation to the dis-tribution area of the species on any of the within-populationgenetic diversity measures considered. Genetic diversity, asmeasured by allelic richness and percent polymorphism,was inversely related to the distance to the nearest populationand positively related to geographical latitude. We discussbelow possible interpretations of these results.
In order to determine if rare species exhibit lower diversitythan common ones, congeneric comparisons where phylo-genetic effects can be controlled are recommended (e.g.Karron, 1987; Gitzendanner and Soltis, 2000). This kind ofcomparison is not possible for N. longispathus becausegenetic diversity studies of congeneric species with broaddistributions using allozymes are not available. Comparisonsare possible, however, with other plant species sharingsimilar geographical ranges and life histories. Values for P,A and He are higher for N. longispathus than for otherendemic (P99 ¼ 40.0 and 26.3; A ¼ 1.80 and 1.39; He ¼0.096 and 0.063, respectively, for species and populationlevels) or narrowly distributed plant taxa (P99 ¼ 45.1 and30.6; A ¼ 1.83 and 1.45; He ¼ 0.137 and 0.105, respectively,for species and population levels; Hamrick and Godt, 1989,1996). Although the generalized assumption of low levels ofgenetic variability in rare species (Stebbins, 1980) is confirmedfor many taxa by most compilations of plant allozyme data(Hamrick and Godt, 1989, 1996; Gitzendanner and Soltis,2000), this generalization does not always hold (see forexample Neel and Ellstrand, 2001; Kang et al., 2005; Elliset al., 2006, and references therein), and the Mediterraneanflora provides many exceptions. In the Iberian Peninsula,examples of high levels of genetic diversity in ecologicallyspecialized species with narrow distributions includeAntirrhinum microphyllum (Torres et al., 2003), Rosmarinustomentosus (Martın and Hernandez Bermejo, 2000),Petrocoptis montsicciana and P. pardoi (Lopez-Pujol et al.,2001), Echinospartum algibicum (Aparicio et al., 2002) andDelphinium pentagynum subsp. formenteranum (Lopez-Pujolet al., 2003). These examples support Rabinowitz’s (1981)suggestion that the genetic consequences of the differentforms of rarity existing in nature may also be very diverse.
Although N. longispathus has a narrow geographicalrange and high habitat specificity it has a relatively largenumber of populations, most of which consist of a relativelylarge number of individuals, and one possible explanationfor the high levels of genetic variation often exhibited byrare species is that they consist of relatively large popu-lations (Ellstrand and Elam, 1993). Two findings of ourstudy support this hypothesis. On the one hand, the highproportion of polymorphic loci and mean number ofalleles per locus occurring within populations suggestthat these have not experienced severe or long-lasting popu-lation bottlenecks causing loss of genetic diversity. On theother hand, the predominantly low levels of inbreedinglikewise suggest large historical populations and/or a
0
0·3
0·2
0·1
0·0
–0·1
0·6A
B
0·5
0·4
0·3
0·1
0·0
0·2
20 40 60Geographical distance (km)
80 100 120
rF
ST
FI G. 4. (A) Relationship between pairwise genetic (FST) and geographicaldistances for the 27 Narcissus longispathus populations included in thisstudy. Shown are the conventional linear regression (dashed line) and thenon-linear piecewise regression (solid line) fitted to the data. (B)Correlogram showing the multilocus, multiallelic genetic correlation (r)between individual Narcissus longispathus plants across the full range ofdistances occurring over the distribution area of the species (error barsare +2 s.e., as estimated by bootstrapping). Unequal distance classeswere used to improve resolution at shorter distances (upper limits of dis-
tance classes: 1, 2, 3, 4, 5, 6, 8, 10, 15, 20, 40, 60, 80, 100, 120 km).
Medrano and Herrera — Structuring of Genetic Diversity in Narcissus 189

predominantly outcrossing mating system (Barrett et al.,2004), any of which could also contribute to maintain thehigh levels of genetic variation observed. Other ecologicaland demographical characteristics of the species, such ashigh habitat stability, low population turnover (Barrettet al., 2004) or extended persistence of individual geno-types through clonal reproduction are all likely to favourthe maintenance of high levels of genetic variation.
Although numerous studies have reported a positiverelationship between population size and within-populationgenetic diversity (van Rossum et al., 2004; Prentice et al.,2006; Honnay et al., 2006, and references therein), failuresto detect such relationships are not uncommon (Leimu andMutikainen, 2005; Honnay et al., 2007). In long-lived per-ennials such as N. longispathus, present-day populationsizes may not be predictive of the genetic composition ofpopulations (Gonzales and Hamrick, 2005). Fluctuationsbetween years in the number of flowering plants are fre-quent in N. longispathus populations, and thus a possibleexplanation for the lack of a population size effect is thatour instantaneous estimates of population size do not ade-quately reflect the long-term average for effective popu-lation size (Young et al., 1993; Hurtrez-Bousses, 1996).Likewise, although in our analysis the effect of populationsize on genetic diversity was controlled for isolationlevel, it can not be ruled out that population characteristicsnot considered here (e.g. density of individuals, level ofclonality) or interactions at the landscape level (e.g. con-nectivity among populations, altitudinal or topographicalbarriers) may counteract the population size effect.
As indicated by the significant positive slopes of P99 andA on latitude, genetic diversity increased steadily towardsthe northern distribution edge of N. longispathus. Thisresult seems contrary to most empirical evidence to date,as genetic diversity has generally been found to declinetowards the periphery of species’ ranges (see for exampleDurka, 1999; Griffin and Barrett, 2004; Arnaud-Haondet al., 2006; and references therein). It has been suggestedthat increased genetic diversity in peripheral populationscould occur if distinct genotypes are favoured comparedto core populations because of suboptimal or more stressfulconditions that presumably occur on distribution edges(Safriel et al., 1994; Lesica and Allendorf, 1995), butalternative explanations can also apply (e.g. demographicprocesses leading to variable effective population sizes).The first scenario could apply in N. longispathus, sincethe ecological conditions faced by the northern (lower alti-tudes, flat meadows with permanently damp soils, ormargins of semi-permanent lagoons) and southern popu-lations (higher altitudes and slopes, and soils flooded byrunning water from springs) may be considerably different.The fact that two out of the three different ‘gene pools’revealed by STRUCTURE are more predominant in popu-lations located at the northern limit of the distributionrange seem to support this hypothesis.
Geographical structuring of genetic variation
Two contrasting patterns of genetic variation seem to beoperating at different spatial scales over the distribution
area of N. longispathus. Although genetic differentiationamong populations tends to increase with increasing geo-graphical distance across the whole geographical range ofthe species, the fact that this relationship explains onlyapprox. 18 % of the genetic differentiation among popu-lations points to a more complex scenario. A detailed analy-sis of this relationship reveals that at small spatial scales(,4 km) there exists a gene-flow-genetic drift equilibrium,and genetic differentiation is closely related to geographicaldistance. However, at greater distances drift prevails overgene flow, suggesting that isolation by distance does notapply at these greater spatial scales. It is remarkable that,despite the contrasting approaches, piecewise regressionand spatial autocorrelation analyses provided closelycoincident views of geographical genetic structuring inN. longispathus.
Different features of species’ reproductive biologycan explain these findings. The main pollinators ofN. longispathus are small, solitary bees, which generallyhave restricted movement capacities (see Fenster, 1991).In addition, the species lacks specialized seed dispersalmechanisms and most seeds are dispersed by gravity at aclose distance from the maternal plant. Nevertheless,occasional long-distance endozoochorous dispersal bylarge mammals and secondary seed movement into adjacentareas by water cannot be ruled out, as plants frequentlygrow on river margins. Therefore, it might be expectedthat pollen and propagule movements of N. longispathusshould be relatively frequent among nearest populations,but exceptional among populations that are beyonda certain distance threshold. As a consequence of itsspecialized habitat, N. longispathus populations are separ-ated by broad expanses of inhospitable landscape. Thisscenario would further act to constrain and disrupt pollina-tion and seed dispersal processes, rendering genetic driftmore influential as distance between populations increases.
In other plant species in which isolation by distance isdetected across broad geographical scales, the relationshipbetween geographical and genetic distances have alsorevealed different patterns of gene flow operating at dif-ferent spatial scales (e.g. Wolf et al., 2000; Gonzales andHamrick, 2005). In Hymenocallis coronaria, Markwithand Scanlon (2007) explicitly compared genetic structureat different geographical scales; significant isolation bydistance occured only at distances ,16 km, whereasnon-equilibrium conditions were suggested to prevail at dis-tances .56 km. Narcissus longispathus and H. coronariawould thus fit into the ‘Case IV’ scenario of Hutchisonand Templeton (1999), in which migration/drift equilibriumoccurs over small distances, whereas divergence betweenmore-distantly separated populations is relatively moreinfluenced by drift. According to these authors, this scen-ario would be expected in a recently invaded region, notyet at equilibrium, in which dispersal is just localizedbetween neighbouring populations. Given sufficient timeand conditions of stability, isolation-by-distance equili-brium between gene flow and genetic drift would beachieved across the whole region. In N. longispathus,other possible scenarios that would produce this patterncan not be ruled out. The observed pattern could be a
Medrano and Herrera — Structuring of Genetic Diversity in Narcissus190

consequence of the natural discontinuity of permanentlyhumid habitats in Mediterranean mountains, and thusstable over time. Alternatively, recent human-mediated dis-turbances of humid habitats commonly occurring in thestudy region (draining, over-pumping of ground water,flow alteration, reforestation, grazing) may have enhancedfragmentation and the loss of potential habitats, leading tothe disequilibrium between migration and drift observedat greater distances. It is not possible to discriminateamong these possibilities with the data currently available.
Our STRUCTURE results also suggest the existence ofgenetic structuring at a spatial scale that is commesuratewith the whole distribution range of the species. Theresults illustrate the capacity of the Bayesian approachimplemented in STRUCTURE to draw inferences aboutthe uppermost hierarchical level of genetic structure(Evanno et al., 2005) even with low mutation markerssuch as allozymes. Our results must be interpreted cau-tiously, however, because of the small power of thesemarkers to correctly estimate the true number of popu-lations (Waples and Gaggiotti, 2006). The results ofSTRUCTURE can be sensitive to the sampling schemewhen there is clinal variation in allele frequencies(Pritchard et al., 2000). It is unlikely, however, that ourresults reflect an artifact of this type, as we have sampledabout two-thirds of all known populations of the speciesand sampling encompasses the whole distribution range.For this reason, we are confident that the STRUCTUREresults actually reflect the broad-scale organization ofgenetic diversity throughout the distribution range ofN. longispathus. At this broad geographical scale, it waspossible to estimate that in N. longispathus the number ofpanmictic units or ‘gene pools’ (K) from which thestudied populations seem to derive is three. The findingsalso suggest that in the central and south-eastern portionsof its range, admixture is more frequent and consequentlypopulations should be less differentiated; whereas at theperiphery of the distribution range more differentiatedpopulations appear, which derive predominantly from justone of the different ‘gene pools’ recognized bySTRUCTURE (RAJ, PES, OSO and HOR). Based on ourcurrent knowledge, it is difficult to suggest which historicalfactors may have produced this pattern of geographicalstructuring of genetic variation but the results do suggestthat, at least within the last few generations, differentpatterns of gene flow have been operating at differentspatial scales throughout the whole distribution range ofthe species.
In conclusion, despite being a narrow endemic with asmall distribution, very restrictive habitat requirements andfragmented, relatively isolated populations, N. longispathusexhibits high levels of genetic diversity at both the popu-lation and species levels. Genetic diversity is geographi-cally structured, but with isolation-by-distance occurringonly over very short ranges, and drift playing the predomi-nant role at distances beyond 4 km. Superimposed on this,there is a broad-scale genetic pattern characterized by theexistence of three distinct gene pools at peripheral locationsof the distribution and extensive admixture in the centralparts of the distribution range. The results illustrate the
importance of sampling populations over a broad range ofspatial scales so that the risks of generalizing spuriouspatterns over an entire species or environment can beminimized.
SUPPLEMENTARY INFORMATION
Supplementary information is available online at http://aob.oxfordjournals.org/ and gives allele frequencies for 14polymorphic loci for the 27 populations of N. longispathussurveyed in this study.
ACKNOWLEDGEMENTS
We are grateful to Alfredo Benavente, Juan Pedro Martınand Amelia Garrido for their invaluable help in locatingthe Narcissus longispathus populations; Rocıo Requereyand Marina Garcıa for conducting most of the laboratorywork; Joaquın Munoz, Bill Cole and Rafael Albaladejofor advice on electrophoresis and assistance in the interpret-ation of some results; Javier Fuertes for unpublished infor-mation on Narcissus phylogeny; two anonymous refereesfor comments on the manuscript; and Consejerıas deMedio Ambiente, Junta de Andalucıa and Junta deCastilla-La Mancha for authorizing this work and providinginvaluable facilities in Sierras de Cazorla, Las Villas,Segura and Alcaraz regions. Support for this work was pro-vided by grants RNM-156 and P06-RNM-01627 from theConsejerıa de Innovacion, Ciencia y Empresa, Junta deAndalucıa, and CGL2006–01355 from the SpanishMinisterio de Educacion y Ciencia. MM was supportedby a postdoctoral contract from the Consejerıa deInnovacion, Ciencia y Empresa, Junta de Andalucıa.
LITERATURE CITED
Aparicio A, Albaladejo RG, Ceballos CL. 2002. Genetic differentiationin silicicolous Echinospartum (Leguminosae) indicated by allozymevariability. Plant Systematics and Evolution 230: 189–201.
Arnaud-Haond S, Teixeira S, Massa SI, Billot C, Saenger P, CouplandG, Duarte CM, Serrao EA. 2006. Genetic structure at range edge:low diversity and high inbreeding in Southeast Asian mangrove(Avicennia marina) populations. Molecular Ecology 15: 3515–3525.
Barrett SCH, Kohn JR. 1991. Genetic and evolutionary consequences ofsmall population size. In: Falk DA, Holsinger KE, eds. Genetics andconservation of rare plants. New York: Oxford University Press,3–30.
Barrett SCH, Cole WW, Herrera CM. 2004. Mating patterns and geneticdiversity in the wild daffodil Narcissus longispathus(Amaryllidaceae). Heredity 92: 459–465.
Blanchard JW. 1990. Narcissus: a guide to wild daffodils. Pershore,Worcestershire, UK: Alpine Garden Society.
Durka W. 1999. Genetic diversity in peripheral and subcentral populationsof Corrigiola litoralis L. (Illecebraceae). Heredity 83: 476–484.
Eckstein RL, O’Neill RA, Danihelka J, Otte A, Kohler W. 2006.Genetic structure among and within peripheral and central populationsof three endangered floodplain violets. Molecular Ecology 15:2367–2379.
Ellis JR, Pashley CH, Burke JM, McCauley DE. 2006. High geneticdiversity in a rare and endangered sunflower as compared to acommon congener. Molecular Ecology 15: 2345–2355.
Ellstrand NC, Elam DR. 1993. Population genetic consequences of smallpopulation size: implications for plant conservation. Annual Review ofEcology and Systematics 24: 217–242.
Medrano and Herrera — Structuring of Genetic Diversity in Narcissus 191

Evanno G, Regnaut S, Goudet J. 2005. Detecting the number of clustersof individuals using the software STRUCTURE: a simulation study.Molecular Ecology 14: 2611–2620.
Falush D, Stephens M, Pritchard JK. 2007. Inference of populationstructure using multilocus genotype data: dominant markers andnull alleles. Molecular Ecology Notes 7: 574–578.
Fenster CB. 1991. Gene flow in Chamaecrista fasciculata (Leguminosae)I. Gene dispersal. Evolution 45: 398–405.
Gitzendanner MA, Soltis PS. 2000. Patterns of genetic variation in rareand widespread plant congeners. American Journal of Botany 87:783–792.
Gonzales E, Hamrick JL. 2005. Distribution of genetic diversity amongdisjunct populations of the rare forest understory herb, Trillium reli-quum. Heredity 95: 306–314.
Goudet J. 2001. FSTAT, a program to estimate and test gene diversitiesand fixation indices, version 2.9.3. http://www2.unil.ch/popgen/softwares/fstat.htm
Griffin SR, Barrett SCH. 2004. Genetic variation in Trillium erectum(Melanthiaceae), a widespread forest herb in eastern North America.Canadian Journal of Botany 82: 316–321.
Hamrick JL, Godt MJW. 1989. Allozyme diversity in plant species. In:Brown AHD, Clegg MT, Kahler AL, Weir BS, eds. Plant populationgenetics, breeding and genetic resources. Sunderland, MA: SinauerAssociates Inc., 43–63.
Hamrick JL, Godt MJW. 1996. Effects of life history traits on geneticdiversity in plant species. Philosophical Transactions of the RoyalSociety of London Series B, Biological Sciences 351: 1291–1298.
Herrera CM. 1995. Floral biology, microclimate, and pollination by ecto-thermic bees in an early-blooming herb. Ecology 76: 218–228.
Herrera CM, Bazaga P. 2008. Adding a third dimension to the edge ofa species’ range: altitude and genetic structuring in mountainouslandscapes. Heredity 100: 275–285.
Herrera CM, Hernandez-Bermejo E, Luque P, Benavente A. 1999.Narcissus longispathus Pugsley. In: Blanca G, Cabezudo B,Hernandez-Bermejo E, Herrera CM, Molero Mesa J, Munoz J,Valdes B, eds. Libro rojo de la flora silvestre amenazada deAndalucıa. I. Especies en peligro de extincion. Sevilla: Consejerıade Medio Ambiente, Junta de Andalucıa, 191–194.
Honnay O, Coart E, Butaye J, Adriaens D, Van Glabeke S,Roldan-Ruiz I. 2006. Low impact of present and historical landscapeconfiguration on the genetics of fragmented Anthyllis vulnerariapopulations. Biological Conservation 127: 411–419.
Honnay O, Adriaens D, Coart E, Jacquemyn H, Roldan-Ruiz I. 2007.Genetic diversity within and between remnant populations of theendangered calcareous grassland plant Globularia bisnagarica L.Conservation genetics 8: 293–303.
Hurtrez-Bousses S. 1996. Genetic differentiation among natural popu-lations of the rare endemic Brassica insularis Moris: implicationsfor conservation guidelines. Biological Conservation 76: 25–30.
Hutchison DW, Templeton AR. 1999. Correlation of pairwise genetic andgeographic distance measures: inferring the relative influences of geneflow and drift on the distribution of genetic variability. Evolution 53:1898–1914.
Kang M, Jiang M, Huang H. 2005. Genetic diversity in fragmented popu-lations of Berchemiella wilsonii var. pubipetiolata (Rhamnaceae).Annals of Botany 95: 1145–1151.
Karron JD. 1987. A comparison of levels of genetic polymorphism andself-compatibility in geographically restricted and widespread plantcongeners. Evolutionary Ecology 1: 47–58.
Kimura M, Weiss GH. 1964. The stepping stone model of populationstructure and the decrease of genetic correlation with distance.Genetics 49: 561–576.
Lande R. 1988. Genetics and demography in biological conservation.Science 241: 1455–1460.
Leimu R., Mutikainen P. 2005. Population history, mating system, andfitness variation in a perennial herb with a fragmented distribution.Conservation Biology 19: 349–356.
Leimu R, Mutikainen P, Koricheva J, Fischer M. 2006. How general arepositive relationships between plant population size, fitness andgenetic variation? Journal of Ecology 94: 942–952.
Lesica P, Allendorf FW. 1995. When are peripheral populations valuablefor conservation? Conservation Biology 9: 753–760.
Lewis PO, Zaykin D. 2001. Genetic data analysis: computer program forthe analysis of allelic data, version 1.1. Free program distributed bythe authors over the internet at http://hydrodictyon.eeb.uconn.edu/people/plewis/software.php
Lopez-Pujol J, Bosch M, Simon J, Blanche C. 2001. Allozyme diversityof the two endemic Petrocoptis: P. montsicciana and its close relatedP. pardoi (Caryophyllaceae). Canadian Journal of Botany 79:1379–1389.
Lopez-Pujol J, Bosch M, Simon J, Blanche C. 2003. Population geneticsand conservation priorities for the critically endangered islandendemic Delphinium pentagynum subsp. formenteranum(Ranunculaceae). Biodiversity and Conservation 12: 1937–1951.
Markwith SH, Scanlon MJ. 2007. Multiscale analysis of Hymenocalliscoronaria (Amaryllidaceae) genetic diversity, genetic structure, andgene movement under the influence of unidirectional stream flow.American Journal of Botany 94: 151–160.
Martın JP, Hernandez Bermejo JE. 2000. Genetic variation in theendemic and endangered Rosmarinus tomentosus Huber-Morath &Maire (Labiatae) using RAPD markers. Heredity 85: 434–443.
Mathew B. 2002. Classification of the genus Narcissus. In: Hanks GR, ed.Narcissus and daffodil: the genus Narcissus. New York: Taylor andFrancis, 30–52.
Medrano M, Herrera CM, Barrett SCH. 2005. Herkogamy and matingpatterns in the self-compatible daffodil Narcissus longispathus.Annals of Botany 95: 1105–1111.
Melendo M, Gimenez E, Cano E, Gomez-Mercado F, Valle F. 2003.The endemic flora in the south of the Iberian Peninsula: taxonomiccomposition, biological spectrum, pollination, reproductive modeand dispersal. Flora 198: 260–276.
Neel MC, Ellstrand NC. 2001. Patterns of allozyme diversity in the threa-tened plant Erigeron parishii (Asteraceae). American Journal ofBotany 88: 810–818.
Nei M. 1973. Analysis of gene diversity in subdivided populations.Proceedings of the National Academy of Sciences of the USA 70:3321–3323.
Nei M. 1978. Estimation of average heterozygosity and genetic distancefrom a small number of individuals. Genetics 89: 583–590.
Nei M. 1987. Molecular evolutionary genetics. NewYork: ColumbiaUniversity Press.
Peakall R, Smouse PE. 2006. GENALEX 6: genetic analysis in Excel.Population genetic software for teaching and research. MolecularEcology Notes 6: 288–295.
Prentice HC, Lonn M, Rosquist G, Ihse M, Kindstrom M. 2006. Genediversity in a fragmented population of Briza media: grassland conti-nuity in a landscape context. Journal of Ecology 94: 87–97.
Pritchard JK, Stephens M, Donnelly P. 2000. Inference of populationstructure using multilocus genotype data. Genetics 155: 945–959.
Rabinowitz D. 1981. Seven forms of rarity. In: Synge H ed. The biologicalaspects of rare plant conservation. London: Wiley and Sons,207–217.
Rıos S, Rivera D, Alcaraz F, Obon de Castro C. 1999. Three new speciesof Narcissus L. subgenus Ajax Spach (Amaryllidaceae), restricted tothe meadows and forests of south-eastern Spain. Botanical Journalof the Linnean Society 131: 153–165.
van Rossum F, Campos de Sousa S, Triest L. 2004. Geneticconsequences of habitat fragmentation in an agricultural landscapeon the common Primula veris and comparison with its rare congener,P. vulgaris. Conservation Genetics 5: 231–245.
Rousset F. 1997. Genetic differentiation and estimation of gene flow fromF-statistics under isolation by distance. Genetics 145: 1219–1228.
Ryan SE, Porth LS. 2007. A tutorial on the piecewise regressionapproach applied to bedload transport data. General TechnicalReport RMRS-GTR-189. Fort Collins, CO: Department ofAgriculture, Forest Service, Rocky Mountain Research Station.
Safriel UN, Volis S, Kark S. 1994. Core and peripheral populations, andglobal climate change. Israel Journal of Plant Sciences 42: 331–345.
Sainz Ollero H, Moreno Saiz JC. 2002. Flora vascular endemica espa-nola. In: Pineda FD, de Miguel JM, Casado MA, eds. La diversidadbiologica de Espana. Madrid: Pearson Educacion, 175–195.
Slatkin M. 1993. Isolation by distance in equilibrium and non-equilibriumpopulations. Evolution 47: 264–279.
Medrano and Herrera — Structuring of Genetic Diversity in Narcissus192
Smouse PE, Peakall R. 1999. Spatial autocorrelation analysis of individ-ual multiallele and multilocus genetic structure. Heredity 82:561–573.
Soltis DE, Haufler CH, Darrow DC, Gastony GJ. 1983. Starch gel elec-trophoresis of ferns: a compilation of grinding buffers, gel and elec-trode buffers, and staining schedules. American Fern Journal 73:9–27.
Stebbins GL. 1980. Rarity of plant species: a synthetic viewpoint.Rhodora 82: 77–86.
Thompson JD. 2005. Plant evolution in the Mediterranean. Oxford:Oxford University Press.
Torres E, Iriondo JM, Perez C. 2003. Genetic structure of an endangeredplant, Antirrhinum microphyllum (Scrophulariaceae): allozyme andRAPD analysis. American Journal of Botany 90: 85–92.
Waples RS, Gaggiotti O. 2006. What is a population? An empirical evalu-ation of some genetic methods for identifying the number of gene poolsand their degree of connectivity. Molecular Ecology 15: 1419–1439.
Webb DA. 1980. Amaryllidaceae. In: Tutin TG, Heywood VH, Burges NA,eds. Flora Europaea, vol. 5. Cambridge: Cambridge University Press,75–84.
Weir BS, Cockerham CC. 1984. Estimating F-statistics for the analysis ofpopulation structure. Evolution 38: 1358–1370.
Wendel JF, Weeden NF. 1989. Visualization and interpretation of plantisozymes. In: Soltis DE, Soltis PS, eds. Isozymes in plant biology.Portland, OR: Dioscorides Press, 5–45.
Wesche K, Hensen I, Undrakh R. 2006. Genetic structure of Galitzkyamacrocarpa and G. potaninii, two closely related endemics ofCentral Asian mountain ranges. Annals of Botany 98: 1025–1034.
Wolf AT, Howe RW, Hamrick JL. 2000. Genetic diversity andpopulation structure of the serpentine endemic Calystegia collina(Convolvulaceae) in Northern California. American Journal ofBotany 87: 1138–1146.
Wright S. 1951. The genetical structure of populations. Annals ofEugenics 15: 323–354.
Young A, Boyle T, Brown T. 1996. The population genetic consequencesof habitat fragmentation. Trends in Ecology and Evolution 11:413–418.
Young AG, Merriam HG, Warwick SI. 1993. The effects of forestfragmentation on genetic variation in Acer saccharum Marsh (sugarmaple) populations. Heredity 71: 277–289.
APPENDIX
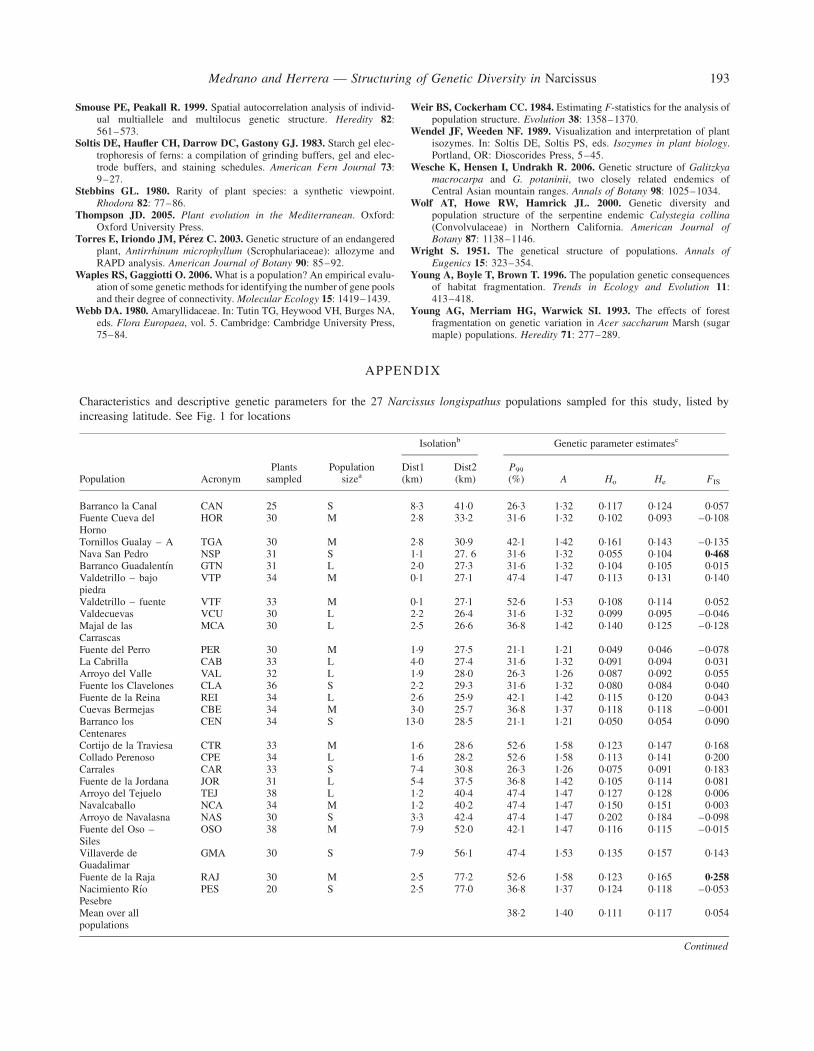
Characteristics and descriptive genetic parameters for the 27 Narcissus longispathus populations sampled for this study, listed by
increasing latitude. See Fig. 1 for locations
Population AcronymPlants
sampledPopulation
sizea
Isolationb Genetic parameter estimatesc
Dist1(km)
Dist2(km)
P99
(%) A Ho He FIS
Barranco la Canal CAN 25 S 8.3 41.0 26.3 1.32 0.117 0.124 0.057Fuente Cueva delHorno
HOR 30 M 2.8 33.2 31.6 1.32 0.102 0.093 –0.108
Tornillos Gualay – A TGA 30 M 2.8 30.9 42.1 1.42 0.161 0.143 –0.135Nava San Pedro NSP 31 S 1.1 27. 6 31.6 1.32 0.055 0.104 0.468Barranco Guadalentın GTN 31 L 2.0 27.3 31.6 1.32 0.104 0.105 0.015Valdetrillo – bajopiedra
VTP 34 M 0.1 27.1 47.4 1.47 0.113 0.131 0.140
Valdetrillo – fuente VTF 33 M 0.1 27.1 52.6 1.53 0.108 0.114 0.052Valdecuevas VCU 30 L 2.2 26.4 31.6 1.32 0.099 0.095 –0.046Majal de lasCarrascas
MCA 30 L 2.5 26.6 36.8 1.42 0.140 0.125 –0.128
Fuente del Perro PER 30 M 1.9 27.5 21.1 1.21 0.049 0.046 –0.078La Cabrilla CAB 33 L 4.0 27.4 31.6 1.32 0.091 0.094 0.031Arroyo del Valle VAL 32 L 1.9 28.0 26.3 1.26 0.087 0.092 0.055Fuente los Clavelones CLA 36 S 2.2 29.3 31.6 1.32 0.080 0.084 0.040Fuente de la Reina REI 34 L 2.6 25.9 42.1 1.42 0.115 0.120 0.043Cuevas Bermejas CBE 34 M 3.0 25.7 36.8 1.37 0.118 0.118 –0.001Barranco losCentenares
CEN 34 S 13.0 28.5 21.1 1.21 0.050 0.054 0.090
Cortijo de la Traviesa CTR 33 M 1.6 28.6 52.6 1.58 0.123 0.147 0.168Collado Perenoso CPE 34 L 1.6 28.2 52.6 1.58 0.113 0.141 0.200Carrales CAR 33 S 7.4 30.8 26.3 1.26 0.075 0.091 0.183Fuente de la Jordana JOR 31 L 5.4 37.5 36.8 1.42 0.105 0.114 0.081Arroyo del Tejuelo TEJ 38 L 1.2 40.4 47.4 1.47 0.127 0.128 0.006Navalcaballo NCA 34 M 1.2 40.2 47.4 1.47 0.150 0.151 0.003Arroyo de Navalasna NAS 30 S 3.3 42.4 47.4 1.47 0.202 0.184 –0.098Fuente del Oso –Siles
OSO 38 M 7.9 52.0 42.1 1.47 0.116 0.115 –0.015
Villaverde deGuadalimar
GMA 30 S 7.9 56.1 47.4 1.53 0.135 0.157 0.143
Fuente de la Raja RAJ 30 M 2.5 77.2 52.6 1.58 0.123 0.165 0.258Nacimiento RıoPesebre
PES 20 S 2.5 77.0 36.8 1.37 0.124 0.118 –0.053
Mean over allpopulations
38.2 1.40 0.111 0.117 0.054
Continued
Medrano and Herrera — Structuring of Genetic Diversity in Narcissus 193

APPENDIX. Continued
Population AcronymPlants
sampledPopulation
sizea
Isolationb Genetic parameter estimatesc
Dist1(km)
Dist2(km)
P99
(%) A Ho He FIS
Species level d 68.4 2.10 0.110 0.139 –
aPopulation size classes: S, ,200 flowering ramets; M, 200–1000 flowering ramets; L .1000 flowering ramets.bDegree of geographical isolation of the population as estimated with Dist1, distance to nearest population (km) and Dist2, mean distance to the
rest of the populations (km).cP99, percentage of polymorphic loci (0.99 criterion); A, mean number of alleles per locus; Ho, mean observed heterozygosity; He, gene diversity or
expected heterozygosity (unbiased estimate; Nei, 1978); and FIS ¼ Wright’s inbreeding coefficient. Statistically significant multilocus inbreedingcoefficients (P , 0.05) are in bold type.
dComputed by combining the data for all individuals (n ¼ 858) into a single sample.
Medrano and Herrera — Structuring of Genetic Diversity in Narcissus194