Geographical Information Based Evaluation System for...
4
American Journal of Biological and Environmental Statistics 2017; 3(4):49-53 http://www.sciencepublishinggroup.com/j/ajbes doi: 10.11648/j.ajbes.20170304.12 ISSN: 2471-9765 (Print); ISSN: 2471-979X (Online) Geographical Information Based Evaluation System for Drought Dilip Kumar 1 , Sushil Kr. Himanshu 2 1 Department of Civil Engg., G B Pant Engg Collge, Pauri, Uttarakhand, India 2 Department of Water Resource Management, IIT Roorkee, Uttarakhand, India Email address: [email protected] (D. Kumar) To cite this article: Dilip Kumar, Sushil Kr. Himanshu. Geographical Information Based Evaluation System for Drought. American Journal of Biological and Environmental Statistics. Vol. 3, No. 4, 2017, pp. 49-53. doi: 10.11648/j.ajbes.20170304.12 Received: December 9, 2016; Accepted: February 23, 2017; Published: December 14, 2017 Abstract: Drought is one of the major natural hazards affecting the environment and economy of countries worldwide. As a natural hazard, drought is best characterized by multiple climatological and hydrological parameters. An understanding of the relationships between these two sets of parameters is necessary to develop measures for mitigating the impacts of droughts. Droughts are recognized as an environmental disaster and have attracted the attention of environmentalists, ecologists, hydrologists, meteorologists, geologists, and agricultural scientists.. Low rainfall has mainly caused droughts and subsequent reduction in agricultural production. Droughts have been a recurring feature of the Indian climate, therefore, study of historical droughts may help in the delineation of major areas facing drought risk and thereby, management plans can be formulated by the government authorities to cope with the disastrous effects of this hazard. In recent years, Geographic Information System (GIS) and Remote Sensing (RS) have played a key role in studying different types of hazards, either natural or man-made. This paper emphasizes upon the application of RS and GIS in the field of drought risk evaluation. The study area taken is a part of the Jamnagar district of Gujarat between latitude 22°19′46′′N to 22°46′01′′N and longitude 70°20′56′′E to 70°47′34′′E. The study was conducted with satellite images of year 1977, 1990 and 1999. Data has been acquired mainly from two sources, firstly Normalized Difference Vegetation Index (NDVI) obtained from satellite sources and secondly rainfall obtained from ground rainfall stations record. In the present paper, an effort has been made to derive drought risk areas facing agricultural as well as meteorological drought by use of Normalized Difference Vegetation Index (NDVI) from Landsat images. NDVI values reflect the different geographical conditions quite well. The NDVI and rainfall was found to be highly correlated. It is therefore concluded that temporal variations of NDVI are closely linked with precipitation. Keywords: Drought, GIS, RS, NDVI 1. Introduction There is increasing pressure on water resources as a result of global population growth, economic development and the adverse effects of land use and climate change. Any deficit or limitation in water supply will be most critical in drought periods, due to competing water needs. Drought is considered by many to be the most complex but least understood of all natural hazards, affecting more people than any other hazard [1]. Drought affects virtually all climatic regions and more than one half of the earth is susceptible to drought each year [2, 3] Therefore, in order to design and manage water resource schemes, it is essential to monitor the spatial and temporal variability of droughts. Traditional methods of drought monitoring rely on rainfall data, which are limited to the network of stations and incomplete climate data, often inaccurate caused a human error or crash equipment and most importantly, difficult to obtain data in near real time either spatially or temporally. In this way, remote sensing technology has greatly enhanced our ability to monitor and manage the natural resources, especially in the areas of water resources. The satellite or remote sensing techniques can be used to monitor the current situation- before, during or after disaster. They can be used to provide baseline data against which future changes can be compared while the GIS techniques provide a suitable framework for integrating and analyzing the many types of
Transcript of Geographical Information Based Evaluation System for...

American Journal of Biological and Environmental Statistics 2017; 3(4):49-53
http://www.sciencepublishinggroup.com/j/ajbes
doi: 10.11648/j.ajbes.20170304.12
ISSN: 2471-9765 (Print); ISSN: 2471-979X (Online)
Geographical Information Based Evaluation System for Drought
Dilip Kumar1
, Sushil Kr. Himanshu2
1Department of Civil Engg., G B Pant Engg Collge, Pauri, Uttarakhand, India 2Department of Water Resource Management, IIT Roorkee, Uttarakhand, India
Email address:
[email protected] (D. Kumar)
To cite this article: Dilip Kumar, Sushil Kr. Himanshu. Geographical Information Based Evaluation System for Drought. American Journal of Biological and
Environmental Statistics. Vol. 3, No. 4, 2017, pp. 49-53. doi: 10.11648/j.ajbes.20170304.12
Received: December 9, 2016; Accepted: February 23, 2017; Published: December 14, 2017
Abstract: Drought is one of the major natural hazards affecting the environment and economy of countries worldwide. As a
natural hazard, drought is best characterized by multiple climatological and hydrological parameters. An understanding of the
relationships between these two sets of parameters is necessary to develop measures for mitigating the impacts of droughts.
Droughts are recognized as an environmental disaster and have attracted the attention of environmentalists, ecologists,
hydrologists, meteorologists, geologists, and agricultural scientists.. Low rainfall has mainly caused droughts and subsequent
reduction in agricultural production. Droughts have been a recurring feature of the Indian climate, therefore, study of historical
droughts may help in the delineation of major areas facing drought risk and thereby, management plans can be formulated by
the government authorities to cope with the disastrous effects of this hazard. In recent years, Geographic Information System
(GIS) and Remote Sensing (RS) have played a key role in studying different types of hazards, either natural or man-made. This
paper emphasizes upon the application of RS and GIS in the field of drought risk evaluation. The study area taken is a part of
the Jamnagar district of Gujarat between latitude 22°19′46′′N to 22°46′01′′N and longitude 70°20′56′′E to 70°47′34′′E. The
study was conducted with satellite images of year 1977, 1990 and 1999. Data has been acquired mainly from two sources,
firstly Normalized Difference Vegetation Index (NDVI) obtained from satellite sources and secondly rainfall obtained from
ground rainfall stations record. In the present paper, an effort has been made to derive drought risk areas facing agricultural as
well as meteorological drought by use of Normalized Difference Vegetation Index (NDVI) from Landsat images. NDVI values
reflect the different geographical conditions quite well. The NDVI and rainfall was found to be highly correlated. It is therefore
concluded that temporal variations of NDVI are closely linked with precipitation.
Keywords: Drought, GIS, RS, NDVI
1. Introduction
There is increasing pressure on water resources as a result
of global population growth, economic development and the
adverse effects of land use and climate change. Any deficit or
limitation in water supply will be most critical in drought
periods, due to competing water needs. Drought is considered
by many to be the most complex but least understood of all
natural hazards, affecting more people than any other hazard
[1]. Drought affects virtually all climatic regions and more
than one half of the earth is susceptible to drought each year
[2, 3] Therefore, in order to design and manage water
resource schemes, it is essential to monitor the spatial and
temporal variability of droughts.
Traditional methods of drought monitoring rely on rainfall
data, which are limited to the network of stations and
incomplete climate data, often inaccurate caused a human
error or crash equipment and most importantly, difficult to
obtain data in near real time either spatially or temporally. In
this way, remote sensing technology has greatly enhanced
our ability to monitor and manage the natural resources,
especially in the areas of water resources. The satellite or
remote sensing techniques can be used to monitor the current
situation- before, during or after disaster. They can be used to
provide baseline data against which future changes can be
compared while the GIS techniques provide a suitable
framework for integrating and analyzing the many types of

50 Dilip Kumar and Sushil Kr. Himanshu: Geographical Information Based Evaluation System for Drought
data sources required for disaster monitoring.
A drought index assimilates thousands of data on rainfall,
snow pack, stream flow and other water-supply indicators into a
comprehensible picture. There are several indices that measure
how much precipitation for a given period of time has deviated
from historically established norms. Among various drought
indices, the Palmer Drought Severity Index (PDSI) [4], Crop
Moisture Index (CMI) [5], Standardized Precipitation Index
(SPI) [6], and Surface Water Supply Index (SWSI) [7] are used
extensively for water resources management.
NDVI has been extensively used for vegetation
monitoring, crop yield assessment, and drought detection [8,
9]. NDVI is defined as (NIR-RED) / (NIR+RED). Where,
NIR and RED are the reflectance in the near infrared and red
bands. NDVI is a good indicator of green biomass, leaf area
index, and patterns of production[9,10]. The output of NDVI
is a new image file/layer. Values of NDVI range from -1.0 to
+1.0. Higher values of NDVI signify a larger difference
between the red and near infrared radiation recorded by the
sensor - a condition associated with high photo synthetically
active vegetation. Low NDVI values mean there is little
difference between the red and NIR signals. The relationship
between NDVI and rainfall is known to vary spatially,
notably due to the effects of variation in properties such as
vegetation type and soil [11].
2. Methodology
Study area
The study area taken is a part of the Jamnagar district of-
Gujarat between latitude 22019′46′′N to 22
046′01′′N and
longitude 70020′56′′E to 70
047′34′′E. The area of study area
is found to be 2341 km2. The region of Jamnagar experiences
a tropical climate, much similar to the rest of Gujarat.
Figure 1. Map Showing Study area.
Flow chart of image processing and NDVI calculation
Acquisition (download) of satellite images from archives
of Landsat [Source – GLCF]
↓
Processing of Landsat images
↓
Verifying Geo-referencing of image by Google earth
↓
Layers stacked in ERDAS Imagine
↓
Cropping of interested part of the image considering AOI
↓
Calculation of vegetation index i.e, NDVI
↓
Classifying different land cover representing different
drought pattern
(Acqui. Date: 17/10/1977, Dataset: MSS)
Figure 2. Satellite Image of Study Area.
(Acqui. Date: 02/11/1990, Dataset: TM+)
Figure 3. Satellite Image of Study Area.
American Journal of Biological and Environmental Statistics 2017; 3(4): 49-53 51
(Acqui. Date: 18/10/1999, Dataset:ETM+)
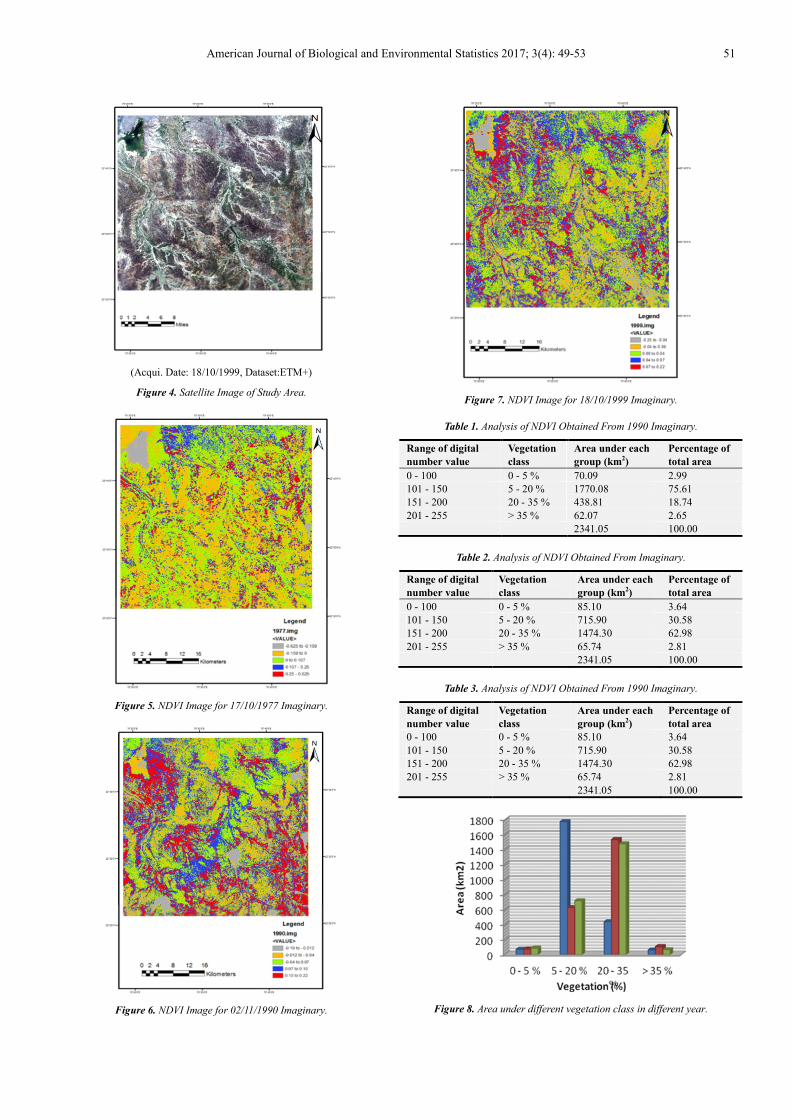
Figure 4. Satellite Image of Study Area.
Figure 5. NDVI Image for 17/10/1977 Imaginary.
Figure 6. NDVI Image for 02/11/1990 Imaginary.
Figure 7. NDVI Image for 18/10/1999 Imaginary.
Table 1. Analysis of NDVI Obtained From 1990 Imaginary.
Range of digital
number value
Vegetation
class
Area under each
group (km2)
Percentage of
total area
0 - 100 0 - 5 % 70.09 2.99
101 - 150 5 - 20 % 1770.08 75.61
151 - 200 20 - 35 % 438.81 18.74
201 - 255 > 35 % 62.07 2.65
2341.05 100.00
Table 2. Analysis of NDVI Obtained From Imaginary.
Range of digital
number value
Vegetation
class
Area under each
group (km2)
Percentage of
total area
0 - 100 0 - 5 % 85.10 3.64
101 - 150 5 - 20 % 715.90 30.58
151 - 200 20 - 35 % 1474.30 62.98
201 - 255 > 35 % 65.74 2.81
2341.05 100.00
Table 3. Analysis of NDVI Obtained From 1990 Imaginary.
Range of digital
number value
Vegetation
class
Area under each
group (km2)
Percentage of
total area
0 - 100 0 - 5 % 85.10 3.64
101 - 150 5 - 20 % 715.90 30.58
151 - 200 20 - 35 % 1474.30 62.98
201 - 255 > 35 % 65.74 2.81
2341.05 100.00
Figure 8. Area under different vegetation class in different year.

52 Dilip Kumar and Sushil Kr. Himanshu: Geographical Information Based Evaluation System for Drought
3. Discussions
Satellite images of 1977, 1990 and 1999 were downloaded
and cropped according to area of interest as shown in Figure
2, 3 and 4 respectively. The satellite image of 1977 is of
database MSS having resolution of 57 m, image of 1990 is of
database TM (Thematic Mapper) having resolution of 28.5 m
and 1999 having database ETM + (Enhanced Thematic
Mapper +) having resolution of 15 m. All the three images
were taken during post monsoon period.
NDVI images generated from satellite images of year
1977, 1990 and 1999 respectively using ERDAS-Imagine as
shown in Figure 5, 6 and 7 respectively. On the basis of
range of digital number, NDVI was classified into four
groups. Table 1, 2 and 3 showing area covered by different
vegetation class resulting from images of year 1977, 1990
and 1999 respectively. Figure 8 showing the comparative
analysis of NDVI images results obtained. It can be observed
that in year 1990, there was more area having higher
percentage of vegetation. From comparison of annual rainfall
of different years it was found that it was more in 1990
among three. It was therefore concluded that temporal
variations of NDVI are closely linked with precipitation. The
NDVI increases with increase in precipitation.
4. Conclusions
The ground meteorological data and remote sensing as
well GIS technologies significantly contributes in the
vegetation drought analysis.
The main objective of the paper was to identify the
relationship between rainfall and NDVI and to see how
appropriately drought risk areas can be delineated by
integration of satellite, meteorological and other ancillary
data. It was concluded from the study that the temporal
variations of NDVI are closely linked with precipitation and
there is strong linear relationship between NDVI and
precipitation.
Unavailability of data at regular interval of time in public
domain was found one major problem during the study. The
resolution of data available is also coarse. The analysis will
be better if data is available at regular interval of time and is
of high resolution and there is no mixed pixels.
During present study it was tried to correlate the NDVI
with precipitation. If this analysis is performed for a large
number of images for continuous years, it is convenient to
find the recurrence of drought. On the basis of which the
delineation of major areas facing drought risk and thereby
management plans can be formulated by the government
authorities to cope with the disastrous effects of this hazard.
The further research can be use of the Vegetation Condition
Index (VCI) to further separate regional NDVI variation from
geographical contributions in order to assess regional drought
impacts. Finally, all drought-prone nations should develop
national drought policies and preparedness plans that place
emphasis on risk management rather than following the
traditional approach of crisis management, where the
emphasis is on reactive, emergency response measures.
References
[1] Hagman G., “Prevention Better than cure: Report on Human and Natural Disasters in the Third World”, Swedish Red Cross, Stockholm (1984).
[2] Wilhite, D. A., “Drought: A Global Assessment, Hazards and Disasters”, A series of Definitive Major Works, vol. 2. Routledge Publishers, London. (2000).
[3] Kogan, F. N., “Global drought watch from space.” Bull. Am. Meteorol. Soc. 78, 621–636, (1997).
[4] Palmer, W. C., “Meteorological drought.” Research Paper 45, U. S. Department of Commerce, Weather Bureau, Washington, DC. (1965).
[5] Palmer, W. C., “Keeping track of crop moisture conditions, nationwide: the new crop moisture index.” Weather wise, 21 (4), 156–161, (1968).
[6] McKee, T. B., Doesken, N. J., Kleist, J., “The relationship of drought frequency and duration to time scales.” Proceedings of the 8th Conference on Applied Climatology, American Meteorological Society, Anaheim, CA, Boston, MA, 17–22 January, pp. 179–184. (1993).
[7] Shafer, B. A., Dezman, L. E., “Development of surface water supply index (SWSI) to assess the severity of drought conditions in snow pack runoff areas.” Proceedings of the 50thWestern Snow Conference, Colorado State University Press, Reno, NV/Fort Collins, CO, pp. 164–175, (1982).
[8] Tucker, C. J., H. E. Dregne, and W. W. Newcomb, “Expansion and contraction of the Sahara Desert from 1980 to 1990.” Science, 253:299-301, (1991).
[9] Thenkabail, P. S., M. S. D. N. Gamage, “The Use of Remote Sensing data for drought assessment and monitoring in south west Asia.” Colombo, Srilanka, International Water Management Institute: pp.1-23. (2004).
[10] Z. Wang, P. Wang, "Using MODIS Land Surface Temperature and Normalized Difference Vegetation Index products for Monitoring Drought in the Southern Great Plains, USA." International Journal of Remote Sensing Vol.25 (No.1): pp. 61-72. (2004).
[11] Farrar, T. J., S. E. Nicholson, et al. "The influence of soil type on the relationships between NDVI, rainfall and soil moisture in semiarid Botswana:II. NDVI response to soil."ote Sensing of Environment Vol.50: pp. 121-133. (1994).