GEOGRAPHIC INFORMATION SYSTEM INDEX FOR THE STATE OF TENNESSEE
31
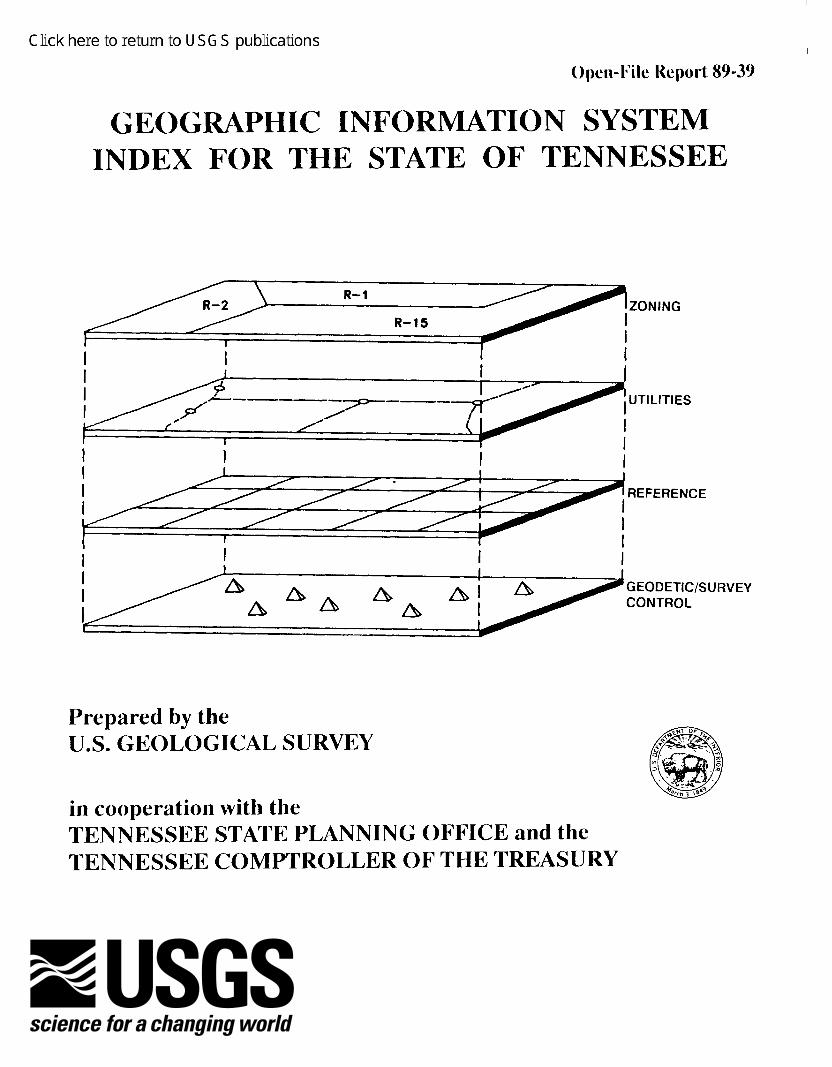
Open-l’ilc Kcport W-39 GEOGRAPHIC INFORMATION SYSTEM INDEX FOR THE STATE OF TENNESSEE R-l ZONING R-15 I i REFERENCE GEODETIC/SUlWEY A %h AA A CONTROL Prepared by the U.S. GEOLOGICAL SURVEY in cooperation with the TENNESSEE STATE PLANNING OFFICE and the TENNESSEE COMPTROLLER OF THE TREASURY
Transcript of GEOGRAPHIC INFORMATION SYSTEM INDEX FOR THE STATE OF TENNESSEE
Open-l’ilc Kcport W-39
GEOGRAPHIC INFORMATION SYSTEM INDEX FOR THE STATE OF TENNESSEE
R-l ZONING
R-15
I i REFERENCE
GEODETIC/SUlWEY
A %h AA A CONTROL
Prepared by the U.S. GEOLOGICAL SURVEY
in cooperation with the TENNESSEE STATE PLANNING OFFICE and the TENNESSEE COMPTROLLER OF THE TREASURY
njestes
Click here to return to USGS publications

GEOGRAPHIC INFORMATION SYSTEM INDEX FOR THE STATE OF TENNESSEE
By William R. Barron, Jr., and Pamela G. Norris
U.S. GEOLOGICAL SURVEY Open-File Report 89-39
Prepared in cooperation with the TENNESSEE STATE PLANNING OFFICE and the TENNESSEE COMPTROLLER OF THE TREASURY
Nashville, Tennessee 1989

DEPARTMENT OF THE INTERIOR DONALD PAUL HODEL, Secretary
U.S. GEOLOGICAL SURVEY Dallas L. Peck, Director
For additional information write to: Copies of this report can be purchased from:
District Chief U.S. Geological Survey A-4 13 Federal Building U.S. Courthouse Nashville, Tennessee 37203
U.S. Geological Survey Books and Open-File Reports Federal Center, Building 810 Box 25425 Denver, Colorado 80225

PREFACE
This publication is a reference manual for public Geographic Information Systems within Ten- nessee. As a result, it is written for use by people with various levels of expertise in different jfelds. The introduction is written for a reader who has no knowledge of GIS. As such it is generalized and non- tech- nical. Other parts of the report such as the data communication section are intended for a reader with some knowledge of computer hardware. Other parts are addressed to experienced GIS users, and still other parts are for use by planners. It is hoped that each reader will find sufficient information to get started in the GIS area of his interest.
. . . Ill
CONTENTS
Preface iii Abstract 1 Introduction 2
Purpose and scope 3 What is a Geographic Information System? 4 Why use a Geographic Information System? 5
Description of the survey and the resulting data base 6 Address datafile 7 Map datafile 7 Equipment datafile 8 GIS-system datafile 9 Project datafile 9 Coverage datafile 9 Location-specific data base datafile 10 Uncomputerized information datafile 11 GIS potential datafile 11 Conversion software datafile 12 Improvements to the survey and data base 12 Summary of GIS survey results 13
Standards 16 United States national map accuracy standards 17 Guidelines for acceptance of digital cartographic base data into the national digital cartographic data base 18
Data communication techniques 25 Map coverage retrievals from the GIS index data base 26 Observed trends and needs of GIS systems in Tennessee
Trends 27 Needs 29
Summary 30 Selected references 32 Appendix A: GIS survey forms 33 Appendix B: Acquisition of paper maps and digital data Appendix C: Guidelines for initiating a GIS 47
27
45
V
ILLUSTRATIONS
Figure 1-8. GIS survey form for: 1. Collecting address information 34 2. Collecting map information 35 3. Equipment inventory 36 4. Gathering GIS system data 37 5. Assigning project numbers for coverages 39 6. Coverages or layer information 40 7. Identifying location-specific data bases 41 8. Collecting information about uncomputerized data bases 42
9. Form used for evaluating potential GIS development 43 10. GIS form for conversion software survey 44 11. GIS system design model 50
* Use of brand names in this report is for identification purposes only and does not constitute endorsement by the USGS.
Vi

GEOGRAPHICINFORMATIONSYSTEMINDEXFORTHE STATEOFTENNESSEE
by William R. Barron, Jr., and Pamela G. Norris
ABSTRACT
Recently the use of Geographic Information Systems (GIS) has increased in Tennessee. As a result of this increase the US. Geological Survey, the Tennessee State Planning Office, and the Tennessee Comptroller of the Treasury entered into an agreement to conduct a survey of GIS users within the state. The objectives of the project were as follows:
1. To conduct and document a survey and subsequently develop a GIS index data base of existing map coverages, location-specific data bases, available transformation software, and transfer techniques that exist at various state, federal, county, and municipal agencies
2. To develop suggested standards for digitized data
3. To promote sharing of data by describing, in general terms, communications techniques that can be used to transfer data from one system to another
4. To create a map coverage of Tennessee and the 7.5minute quadrangle maps within the State that would allow identifi&ztion of existing map coverages for these units through a retrieval from the GIS index data base.
Two hundred and sixty-three agencies were contacted Two hundred and sixteen used maps and kept maps on hand One hundred and thirty-nine agencies maintained one or more computer system, including personal computers. Forty-eight had minicomputers or mainframe computers. Twenty-five agencies used GIS software. The number of coverages or layers that existed at the time of the survey as computerized digital data for Tennessee was 4,741. One hundred and twenty location-specific data bases were available.
The U.S. Geological Survey, National Mapping Division map accuracy standards and digital car- tographic data standards were included as minimum guidelines for GIS users. Stricter standards could be used depending upon need
1
General data sharing techniques were described The most common one was the use of magnetic tapes. Asynchronous, synchronous, and network communications were also described
A data base containing the survey data was built for inquiries. A 7.5-minute quadrangle coverage of Tennessee was created to allow for identifcaiton on a quadrangle basis of existing coverages contained in the GIS index data base.
INTRODUCTION
In the summer of 1987, a Geographic Information System (GIS) user group met at Tennessee Wildlife Resources Agency. The attendees discussed the various mapping products that they were generating from computerized data. It became apparent that considerable work was being done and had already been done using GIS. As a result of that meeting, a committee was established to discuss joint GIS needs. The committee’s first action was to seek a way to provide for the indexing of public GIS users within the State.
Several types of information to be contained within the index were discussed. First, the map images (coverages or layers) that various governmental agencies had already produced and the availability of those images would be included. Map data must originally be digitized into a com- puter format acceptable to the appropriate GIS software. This is the most costly, time consuming part of any GIS development, so all would benefit if existing data could be shared or sold at a reasonable cost. In addition, because location-specific data (data associated with a location such as latitude/longitude, State Plane coordinate, census tract number, panel-id, and so forth) can be mapped, overlaid, and analyzed using a GIS, the index would describe data bases available at each site.
Different map coordinate systems and projection systems are used for various purposes and for various presentation reasons. Because of this, the capability of an agency to transform an image from one set of coordinates to another (for example, State Plane to latitude/longitude) or from one type of projection to another (for example, Albers Equal Area to Universal Transverse Mercator) should be included in the index.
Indexing the type of computer equipment each agency had was also deemed important, most- ly for the sharing of data and for the availability of communications links to retrieve location-specific data. This information would be of a technical nature and would be aimed at the computer person who would be responsible for making a computer to computer transfer.
Since GIS software packages-differ in the way the data structure is designed, the types of sys- tem transformation software available at any site was selected for inclusion. For example, it would be valuable to know if a site had software available to transform Intergraph data into Arc/Info data.
In order to identify potential GIS users, the index would include information about the types of maps used by the various agencies and the availability of those maps. For agencies that did not
2
already have a GIS, another section of the index would rate the potential for GIS development based upon map usage, existing computer equipment, and location-specific data bases maintained by the agency.
The committee also decided that a data base would be built to store the data obtained from the survey and retrieval programs would be written. To provide a demonstration of the capabilities of GIS, a digital map of the 7.5 minute quadrangle maps which cover Tennessee would be created so that existing map coverages for a particular quadrangle could be retrieved from the GIS index data base.
As a by-product of that committee, the Tennessee State Planning Office, the Tennessee Comp- troller of the Treasury, and the USGS, Water Resources Division (WRD) entered into a coopera- tive funding agreement to perform the following objectives:
1. To conduct and document a survey and subsequently develop a GIS index data base of ex- isting mapping coverages, location-specific data bases, available transformation software, and transfer techniques that exist at various state, federal, county, and municipal agencies
2. To develop suggested standards for digitized data
3. To promote sharing of data by describing, in general terms, communications techniques that can be used to transfer data from one system to another
4. To create a map coverage of Tennessee and the 7.5minute quadrangle maps within the State that would allow identification of existing map coverages for these units through a retrieval from the GIS index data base.
Purpose and Scope
The purpose of this report is to summarize the information obtained from the GIS survey of public agencies in Tennessee and to document the method used to obtain the data. By making this information available in a published form, experienced and beginning GIS users will be aware that a GIS index data base exists that will enable them to (1) contact other users about existing coverages, resulting in less duplication of work, (2) ascertain if another agency has any location-specific data that would be helpfbi for mapping or decision-making, (3) determine which agencies have trans- formation software or system transformation software that would be useful, (4) evaluate the ac- curacy of published maps or digital data based upon a set of minimum standards, (5) contact a knowledgeable person about transferring.data from one agency to another, and (6) retrieve infor- mation on the number and type of coverages available for an area contained within a particular 7.5- minute quadrangle map or a county boundary.
3
What Is a Geographic Information System?
A GIS is a means of using data stored on a computer to produce graphic images (primarily maps). The data are stored as either X and Y coordinates (sometimes with a Z coordinate) or as values associated with grid cells having a known reference point and a specific height and width. Most of the graphic images are two-dimensional (width and length). The depth or height (Z coor- dinate) of a given point can be used by many GIS software products to produce three-dimensional figures.
The data stored as X, Y, and sometimes Z coordinates are used to produce lines, points, and areas (polygons). Lines generally represent such features as railroads, highways, and political boun- daries. Points represent such features as benchmarks, houses, wells, and so forth. An area (polygon) might be a geologic formation, a lake, or a drainage basin.
The data stored by grid cells is used to produce images similar to a patched, fill-in-the-square drawing. Each grid cell or patch has a data value associated with it which is used to determine the color of the area within the cell. In most cases, the grid cell values may be derived from a multi- spectral scanner mounted in Earth Resources Observation Systems (EROS) satellites. This type of data collection is useful for keeping track of changing earth conditions such as land use or vegeta- tion.
In addition to producing GIS graphic images, GIS is also used to access information stored in data bases. This is one of the functions that distinguishes a GIS from a computer aided design (CAD) system. Both can be used to produce graphic images, but only the GIS provides a means of retriev- ing information from data bases, of manipulating and analyzing that information to create new in- formation, and of displaying the result.
Another major difference between a GIS and CAD system is the manner in which the graphics data is managed. A CAD system stores the image as X and Y coordinates only. A GIS system stores the image not only with X and Y coordinates, but also with data indicating the relation of a point, line, or area with other points, lines, or areas adjacent to it. A GIS stores the spatial data associated with the image: the boundaries, the perimeter, the area identifier, the area identifiers adjacent to it, and so forth.
The basic equipment needed for a GIS consists of a computer processing unit (CPU) for run- ning the programs, a disk for storage of the data, a digitizing tablet for data input, a graphic ter- minal for rapid display, and a plotting device for producing a paper copy. Depending upon the sophistication and complexity of a particular GIS, the equipment cost could range from $15,000 to several million dollars.
The staff needed to operate a GIS also depends upon the sophistication and complexity of the system. One well-trained person could easily handle a personal computer (PC) based system, but with a large system serving numerous users, substantially more staff would be needed. A large sys- tem might require a GIS director, a GIS data base administrator, several programmers and tech- nicians, and a staff for computer operations.
4

In summary, the function of GIS is to produce graphic images from computerized data and to access information from data bases to display with those images. To be able to do this, appropriate equipment and knowledgeable personnel must be available.
Why Use a Geographic Information System?
A GIS provides cost savings and results in improved efficiency in several ways. An increase in productivity in map drafting and maintenance becomes evident. Less manpower is needed for drafting. A study by Knox County estimated that drafting productivity could be improved by a fac- tor of 3:l to 8: 1, particularly in the updating and maintenance of maps (Kevany and others, 1985). As a road or subdivision is added, a map can be updated within a short time by using a digitizer. In addition, any information about the feature being updated can be entered into a data base for fu- ture use.
In addition, the time necessary for compiling information is reduced. Rather than having to look through numerous files or at numerous maps to compile a variety of information, the graphic images and the information associated with them are all stored on the computer and are quickly and easily retrieved.
Redundancy of mapping activities can be reduced by consolidating the efforts of various of- fices. Instead of the water department, the electric utility, and the property tax office each drafting a new subdivision on different maps and usually at different scales, the subdivision can be entered once, scaled to any size desired, and used by each organization as the background reference for the features each needs for their agency’s purposes. In addition, data on the subdivision are entered into the data base, and this information is then available to all who have a need for it, not only for accounting or maintenance purposes but also for planning purposes. This results in the elimination of the time lag associated with updating maps. Since one map image may be overlaid with other map images, when one is updated the entire series is instantly updated.
Furthermore, the flexibility of using maps and data are enhanced, and a cost reduction is real- ized in the production of maps for special purposes. For example, a city planner wants a map of potential sites for ground-water supply. The criteria for selection is that the site has to be in a par- ticular geologic formation, in an agriculturally zoned area, and within one mile of existing water lines. .To manually create such a map would be time intensive, but with a GIS it would be relative- ly quick and easy to specify a combination of such features at any desirable scale.
The accuracy of the information is also improved. An incorrect latitude/longitude for a well or a wrong location for a transformer will quickly show up when mapped. Also, due to the data base capabilities, values that are outside of acceptable ranges rapidly become apparent.
Most GIS packages also provide a means for performing calculations upon the data stored with a map and for manipulating that data. Maximums, minimums, and averages are some of the more basic calculations that can be performed quickly.
5
Satellite imagery also results in a more efficient manner of monitoring changing conditions on the earth. Avegetation map is more rapidly produced by using satellite data than by conducting a field survey, compiling the data, and manually drawing a map.
Also, less document storage is necessary. In an organization that uses maps extensively, the cost per square foot of storage can be considerable. Much of this storage space can be eliminated by storing the computerized digital maps on magnetic media such as disks or magnetic tapes.
In the long term, GIS provides cost savings and improves efficiency. Initially, however, be- cause of investments in equipment, training of personnel, and conversion of maps to digital data, a GIS will cost more than manual mapping. The payback period is directly related to the sophistica- tion and complexity of the GIS being developed. For a small, personal computer- based system it might be less than a year, but for large systems it might range from four to six years. As a result, funding for conversion to a GIS needs to be firmly committed for a sufficient length of time to allow it to realize its true potential.
DESCRIPTION OF THE SURVEY AND THE RESULTING DATA BASE
A list of the state agencies was received from the Tennessee State Planning Office (TSPO). The USGS worked closely with the TSPO for additional contacts at state agencies. In addition, all principal state and federal agencies listed in the telephone directory for Nashville were contacted. As the survey progressed, any other federal agencies that were suspected of having a GIS were con- tacted. The Directory of Tennessee County Officials (1987) was used to contact appropriate per- sonnel in each of the counties. From the 1980 census report, the mayor or city planner of each city that had a population greater than 15,000 was contacted.
Each agency was initially contacted by telephone and mail. After phone contact, each agen- cy was mailed a survey packet. The packet contained a letter drafted to give a brief description of the survey’s purpose, a letter from the governor urging cooperation from the state agencies, and 10 survey forms designed to collect specific information. If the agency was found to have a large quan- tity of information, a personal interview was arranged,
The information obtained from the survey was entered into a data base called the GIS Index Data Base. For ease of data entry, a separate datafile was built directly from each survey form, that is, each item in the datafile matched an item on the survey form. Each datafile was built contain- ing an AGENCY-ID which is a unique identifier for that agency. This item allows the records to be sorted and related. Also in each datafile, space for comments and extra space for future expan- sion of the data base were allocated. The datafile items are discussed in the following sections, organized according to the survey form in which they appear.
6
Address Dataflle
The address form (Appendix A, fig. 1) was developed to collect agency location information. The computer datafile items, width, and type built from the form are: AGENCY-ID 5C; COUNTY 31; AGENCY-NAME 64C; ADDRESS1 24C; ADDRESS2 24C; CITY 15C; STATE 2C; ZIP- CODE 91; CONTACT 24C; AREA-CODE 31; PHONE-NO 71; COMMENT 36C; and DATE 8D. The number and letter after each data item indicate the length in bytes and the data type: C for character, I for integer, and D for date.
The AGENCY-ID is a unique identification assigned to each agency. The first character of the AGENCY-ID specifies the agency as S (state), F (federal), C (county), or M (municipal). For all agencies except county agencies, the next three characters are a sequential number starting at 001. For county agencies, the middle three characters are the Federal Information Processing Stand- ards (FIPS) code for that county. The last character for the AGENCY-ID is a letter of the alphabet which identifies an agency suboffice or division. This may be left blank if there are no divisions within the agency or if all of the agency’s information comes from one division. The second item is COUNTY. This item stores the FIPS code of the county where the agency is located. The DATE indicates the date that the agency’s information was entered into the data base. The rest of the form is composed of the agency name, address, contact person, and phone number.
Map Datafile
Because maps are the base for a GIS, the map form (Appendix A, fig. 2) was an essential part of the survey. This form was used to collect all the specific information about the agency’s paper and polyester maps. The datafile items are: AGENCY-ID 5C; TYPE 64C; USE 64C; SOURCE 64C; MEDIUM 8C; SCALE 16C; EXTENT 15C; FEATURES 20C; QUALITY 21; NAME1 - NAME4 24C; COMMENT1 - COMMENT2 24C each.
The type of map used, the purpose of the map, and source of the map is the basic information stored in TYPE, USE, and SOURCE, respecti+ely. A separate survey map form was used for each map type to accomodate the different maps used. Several map forms per agency were frequently used. With this information an inventory of maps is stored in the data base. This information will be helpful in locating specific map types across Tennessee.
The item MEDIUM stores the type of product the map is created on: paper, polyester, or photography. Knowing the type of medium allows a user to evaluate the map’s preciseness. A polyester map may or may not be cartographically accurate, but it is precise. On the contrary, a paper map’s precision may change due to stretching or shrinking of the paper. This information is important to an agency concerned with digitizing from a map because coverages will not match if the map stretches with use, or shrinks because of atmospheric conditions.
The more specific map information is stored in datafile items SCALE, EXTENT, and FEA- TURES. The scale of each map is stored as a ratio of one inch to a quantity of inches, feet, or miles. If not specified, the scale is stored in inches. The item EXTENT is used to store the area covered
7
by the map or maps of that type and scale. The item FEATURES gives a brief description of the map’s major features.
The maps are rated on a scale from one to ten, stored in the datafile item QUALITY. The rating is based on complexity of features, whether the map uses a standard coordinate system, and whether the map has a magnetic north. If a map has topographical features or features of similar complexity and is cartographically correct then a rating of ten may be assigned. A hand-drawn map is rated one and other maps are rated somewhere between one and ten.
The items NAME1 through NAME4 are for administrative contacts who use the maps most frequently. These would be the appropriate individuals to answer questions about the maps.
Equipment Datafile
The equipment form (Appendix A, fig. 3) collects information on each agency’s computer equipment and data transfer techniques. The datafile items are: AGENCY-ID SC; MAKE 24C; MODEL 6C; CONTACT 24C; TAPE-DRIVE 1OC; TAPE-DENSITY1 - TAPE-DENSITY3 51 each; TAPE-PROTl - TAPE-PROT3 6C each; TAPE-CASSETTE 1OC; DISK-MB 61; COM- CAPABILITY 12C; BAUD-RATE 15C; COM-PROTl - COM-PROT3 12C each; DIGITIZER 12C; and PLOTTER 12C.
MAKE and MODEL store the names of the computer make and model. This information is important when considering the transfer of information. A contact person is listed who has thorough technical knowledge of the equipment.
Further detailed information is stored in TAPE-DRIVE, TAPE-DENSITY, TAPE- PROT, and TAPE-CASSETTE. TAPE-DRIVE refers to the type of device such as 9 track or 7 track. The three TAPE-DENSITY items store the density in bits per inch which the tape drive is able to write. Other items important for transferring data are TAPE-PROTl through TAPE-PROT3. These items store the type of tape protocol translations available, such as ASCII, EBCDIC, or BCD. The item TAPE-CASSETTE stores the brand name of the system’s tape cassette, if one exists.
DISK-MB records the actual amount of on-line storage that is available. Also important to machine connections are the items COM-CAPABILITY and BAUD-RATE. COM-CAPABILITY stores the type of communication transmission the site has available: asychronous, synchronous, both, or none. BAUD-RATE and COM-PROTl - COM-PROT3 record, respectively, the trans- mission speed and any communications protocols used for interactive communication between a personal computer and a mainframe, micro, or minicomputer.
Information on the agency’s plotter and digitizer is stored in the datafile items PLOTTER and DIGITIZER, respectively. Each contain the equipment’s brand name and model number. An agency which does not have a GIS but has a plotter and digitizer has higher potential for a GIS be- cause the agency would already have some of the equipment and data that a GIS requires.
GIS-System Datafile
The GIS-system form (Appendix A, fig. 4) inventories system types and available digital trans- formations. The datafile items are: AGENCY-ID 5C; CONSIDERING 1C; WHEN-IN- STALLED 7C; SYSTEM-TYPE 20C; WHOSE-SYSTEM 32C; SYSTEM-CONNECT 32C; PRODUCT1 - PRODUCT6 20C each; COMPANY-NAME 24C; COMPANY-ADDRESS1 - COMPANY-ADDRESS2 24C each; COMPANY-CITY 15C; COMPANY-STATE 2C; COM- PANY-ZIP-CODE 91; COMPANY-AREACODE 31; COMPANY-PHONE 71; COORDINATES 32C; SY STEM-TRANS 1 - SY STEM-TRANS3 20C each; COORD-TRANS l- COORD-TRANS 10 32C each; PROJECT-TRANSl - PROJECT-TRANSlO 32C each; and COMMENT1 - COMM- MENT3 24C each.
For agencies that do not have a GIS but are considering getting one, the item CONSIDER- ING records this information. The item WHEN-INSTALLED stores an approximate date for such installation. For agencies that already use a GIS, the item SYSTEM-TYPE stores the brand name of the system. If it is not owned in-house the item WHOSE-SYSTEM contains the system owner’s name. If an agency is connected to any other GIS, the item SYSTEM-CONNECT stores the name, of the agency to whose system it is connected. PRODUCT1 - PRODUCT6 stores the different types of software on the GIS system. The vendor’s name, address, and phone are also stored in the event that any questions of the system’s capabilities arise.
The type of coordinate system which is most often used for digital data is stored in the item COORDINATES. SYSTEM-TRANSl through SYSTEM-TRANS3 store the type of GIS system transformations available. Other transformations covered by the survey are coordinate and projec- tion information stored in COORD-TRANS and PROJECT-TRANS.
Project Datafile
The project form (Appendix A, fig. 5) is used primarily to aid in the recording of digital layer or coverage information. This form breaks the coverages into the various projects for which they were digitized. The datafile items are: AGENCY-ID 24C; PROJECT# 41; PROJECT-NAME 24C; AREAL-EXTENT 24C; TILE-COMPl - TILECOMP4 72C each; CONTACT 24C; and COMMENT1 - COMMENT2 24C each.
PROJECT# is an arbitrary number used to distinguish amongst the coverages. PROJECT- NAME stores the name of the project. The actual area covered by the project is stored in AREAL- EXTENT. TILE-COMP stores the quadrangle numbers or map-units covered by this project. An item for a contact person involved with the project is also included.
Coverage Datafile
The coverage form (Appendix A, fig. 6) inventories all digital data layers or coverages. The datafile items are: AGENCY-ID SC; PROJECT# 41; NAME 24C; TYPE 12C; EXTENT 24C;
9
FEATURES 48C; ATTRIBUTES 24C; DATE 41; ORIGIN 32C; QUAD 6C; COUNTY 31; CITY 15C; STATE 4C; HUC 81; OTHER 12C; SCALE 16C; GRIDSIZE 16C; COORDINATES 32C; PROJECTION 32C; and COMMENT1 - COMMENT3 24C each.
NAME, TYPE, EXTENT and FEATURES store most of the basic information of the coverage. TYPE stores information about the coverage such as whether it is point, line, polygon, vector, grid cell, and so forth. Although the EXTENT is contained on the PROJECT form, it is recorded again in case the data layer only covers part of the project area. FEATURES briefly describes the information the coverage contains.
ATTRIBUTES stores information associated with the map features such as statistical infor- mation, road names, or street names. The DATE that the digital layer or coverage was created is very important because it gives some indication of the accuracy of the data. ORIGIN stores the name of the agency which created the coverage.
This form also indicates how the data layer is geographically related. Information on the quad, county, city, state and hydrologic unit code (HUC) is collected and stored in the respective datafile items. The item OTHER is available to store any other geographical region or division name uni- que to the site.
The SCALE or GRIDSIZE of the coverage is specified depending on which the agency uses. The coordinate and projection system used to create the coverage are stored in the items that have the same name. Most systems can convert to any standard coordinate system or projection.
Location-specific Data Base Datafile
The location-specific data base form (Appendix A, fig. 7) gathers information on the com- puterized data bases that contain data associated with specific geographical locations. This infor- mation is included in the survey because it has a high potential for being used with a digital coverage. The datafile items are: AGENCY-ID 5C; DB-NAME 24C; PURPOSE1 - PURPOSE2 24C; LOCATED-BY1 - LOCATED-BY2 24C each; DB-SOFT 12C; RETRIEVALCAP 1C; SORT- CAP 1C; RESELECT-CAP 1C; STATISTIC-CAP 1C; GRAPHICS-CAP 1C; DATA-SOURCES 32C; UPDATED 1C; VERIFIED 1C; COORDINATES 32C; EXTENT 20C; RECORD-NO 15C; and COMMENT1 - COMMENT3 24C each.
DB-NAME stores the name of the data base. Also included is a brief description of the pur- pose of the data base. LOCATED-BY stores how the data base is geographically related by
10

describing the manner in which the information is located (street address, State Plane coordinate, county, latitude/longitude, city, and so forth). .
A portion of this form is also used to store information pertaining to the software used with the data base. DB-SOFT is used for the brand name of the software. The form permits the documentation of as many as five software capabilities. The responses are noted by a ‘Y’ or ‘N’ for the availability or nonavailability of each capability. The items RETRIEVAL-CAP and SORT- CAP are basic capabilities which allow a user to call up the information and sort it in a specific order. RESELECT-CAP notes the ability to retrieve information given certain criteria, for example, data for a specific county or data for a geologic formation. STATISTIC-CAP stores whether a method is provided for calculating percentages, means, and general statistical characteristics. GRAPHICS- CAP indicates whether the software can produce graphs, charts, and plots from the data base.
This form also covers the origin or source of the data and information specifying whether or not the data is updated and verified. The coordinate system used and the extent of the coverage provide additional information to agencies interested in converting to digital data. RECORD-NO indicates the size of the data base. If the data base was too large to determine the record length then no entry was made.
Uncomputerized Information Datafile
If the agency has any uncomputerized information that references a geographical location, it is recorded on the UNCOMPUTERIZED FILE form (Appendix A, fig. 8). This information has some potential for being used with a digital coverage. The datafile items are: AGENCY-ID 5C; NAME 24C; STORED 24C; QUANTITY 20C; PURPOSE1 - PURPOSE2 24C; DATA-SOURCE 32C; UPDATED and VERIFIED 1C each; and COMMENT1 - COMMENT3 24C each.
This form covers the same type of information as the location-specific data base form. The name of the data base, how the data is stored, quantity of information, and purpose of the data are the basic fields. DATA-SOURCE indicates where the data originated. Additional information regarding the accuracy of the data is included in VERIFIED and UPDATED.
GIS Potential Datafile
Each agency surveyed that did not have a GIS was rated for its potential for using a GIS (Ap- pendix A, fig. 9). Each agency was rated in three categories: (1) extensiveness of the agency’s map usage; (2) computer equipment available; and (3) existing computerized location-specific data
11
bases. Each category was rated on a scale from 1 to 10, with 10 corresponding to a high potential. The datafile items are: AGENCY-ID 5C; MAP-USE 21; EQUIPMENT 21; and DATABASE 21.
Conversion Software Datafile
A section of the GIS data base records various types of GIS system-to-system conversion software as they were encountered. These were recorded on the conversion software form (Appen- dix A, fig. 10). Listings from several sources are included in the datafiles CONVERSIONS and CONV-DESCRIPTION. The CONVERSIONS datafile items are: ID 31; NCIC-ID# 6C; ITEM- NAME 72C; PRODUCER-NAME 36C; ADDRESS1 36C; ADDRESS2 36C; CITY 15C; STATE 2C; ZIP-CODE 9C; AREA- CODE 31; PHONE 71; USES 72C.
The datafile item ID is an arbitrary number unique to each record. The item NCIC-ID# was added to correspond to the list of conversion software from the National Cartographic Information Center (NCIC). Only the software which is on the NCIC list has an NCIC-ID#. Inquiries to NCIC on this software will need this number to identify which software is being referenced. The remain- ing items in the datafile CONVERSIONS contains the company’s name, address, telephone num- ber, and a brief explanation of the software’s uses.
The datafile CONV-DESCRIPTION contains desciptions of the conversion software. The datafile items are ID 31 and DESCRIPl - DESCRIP22 72C. ID corresponds to the item in the CONVERSIONS datafile. This allows the identification of the software being discussed. Twenty- two lines of 72 characters each were reserved for a description of the software’s capabilities, hardware requirements, and examples of uses.
Improvements to the Survey and Data Base
After conducting the GIS survey and entering the data, a few things were noticed that could be changed to improve the survey and the data base. Anyone having any additional suggestions for changes, please contact the authors at:
U.S. Geological Survey, WRD A-4 13 Federal Building Nashville, TN 37203
Since the survey was to be conducted on a person-to-person basis, the survey forms were designed for ease of use by the person conducting the survey rather than for the person being ques- tioned. For responses via mail rather than personal interview, the survey could be improved by clarifying some of the questions. Many of the items are self-explanatory and require no further com- ment; others, especially those that deal with technical subjects, need further explanation.
12
Because of the diversity of systems discovered, additional space is needed for comments in each data file. Additional space is also needed in the location-specific data base file and uncom- puterized file for PURPOSE and SOURCES.
Many sites had far too many specific features per coverage to be entered in the limited amount of space allotted for that item. For instance, the features on one coverage might be interstates, four- lane state highways, two-lane state highways, four-lane county roads, two-lane county roads, unimproved state roads, unimproved county roads, bicycle paths, walking paths, and trails. Because of the amount of computer space required to store this quantity of information, these features were generalized into one feature called transportation. This appeared to be a better method than trying to record each individual feature.
The date that the coverages were digitized was entered into the data base. Along with this the date of the map or aerial photograph from which those coverages were digitized should be entered also. The date it was digitized could be 1988, implying that the information was current, but the date of the map from which it was digitized might be 1948. One of the reserved spaces in the data base could be used for that information.
Summary of GIS Survey Results
Of 263 agencies contacted, 216 used and maintained maps. One hundred and thirty-nine agen- cies maintained a computer system. One hundred and thirty-eight agencies had one or more per- sonal computers. Forty-eight agencies had minicomputers or mainframes. GIS systems were being used at 25 agencies; two were considering purchasing a GIS. The number of digital coverages that existed for Tennessee at the time of the survey was 4,741. The USGS, NMD had 2,153 of these digi- tal coverages. One hundred and twenty location data bases were available.
The size of computer equipment ranged from small personal computers to large mainframes. In many agencies the only computing power available was a personal computer; in others there was a multitude of computing resources. One hundred and thirty-nine agencies had computer systems. There were forty-one minicomputer systems and seven mainframe systems. One hundred and thirty-eight agencies had one or more personal computers. Some of these agencies had only one personal computer and others had several available with most being used for word processing. In many instances the only computer available was the National Cash Register (NCR) personal com- puter provided by the State Comptroller of the Treasury for property appraisal.
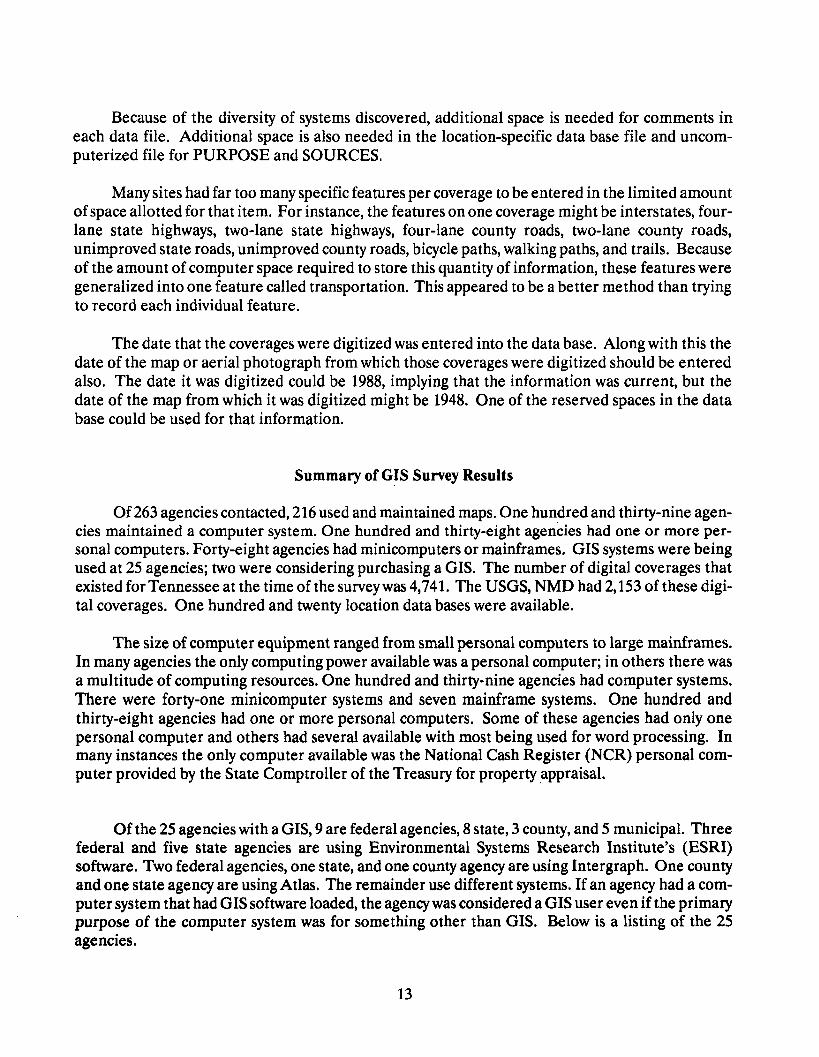
Of the 25 agencies with a GIS, 9 are federal agencies, 8 state, 3 county, and 5 municipal. Three federal and five state agencies are using Environmental Systems Research Institute’s (ESRI) software. Two federal agencies, one state, and one county agency are using Intergraph. One county and one state agency are using Atlas. The remainder use different systems. If an agency had a com- puter system that had GIS software loaded, the agency was considered a GIS user even if the primary purpose of the computer system was for something other than GIS. Below is a listing of the 25 agencies.
13
Agencies using a GIS system
AGENCY-ID AGENCY-NAME SYSTEM-TYPE
C093A Cl49
Cl 57A FOOl FO02 FO03 FO04
F005A FOO5B FOO6B FOO7B FOO7C MOO1 MOO2 MOO3 MOO4 MO21 so01 so02
S003A so05 SO06 SO08
SO1 2A SO1 28
Knox County Government Rutherford County Planning Commission * Memphis and Shelby Co. Plan. & Develop. U.S. Geological Survey U.S. Corps of Engineers ** Tennessee Valley Authority Environmental Protection Agency Oak Ridge National Laboratory Oak Ridge National Laboratory U.S. Department of Agriculture Great Smokey Mt. National Park Great Smokey Mt. National Park Memphis Light, Gas and Water City of Chattanooga Nashville Metro Water Services GIS Johnson City Transit Headquarters City of Dyersburg Tennessee Wildlife Resources Agency Tennessee Technological University Tennessee Department of Conservation Tennessee Department of Transportation Middle Tennessee State University University of Tennessee, Knoxville Memphis State Univ., Dept. of Civil Eng Memphis State Univ., Dept. of Geography
intergraph Atlas/AGIS,remote-sensing Geographic Data Mngmt. System ESRI Intergraph Intergraph ESRI ESRI, ERDAS Oak Ridge Geographic STSC ERDAS ERDAS GFIS McDonnell Douglas Synercom Autometric AutoGlS AutoCAD ESRI, ERDAS ESRI Autocad/CPSPC Intergraph Atlas/AGIS, remoting sensing ESRI ESRI ESRI, ERDAS
* Uses Middle Tennessee State University system .** Used for computer aided design (CAD)
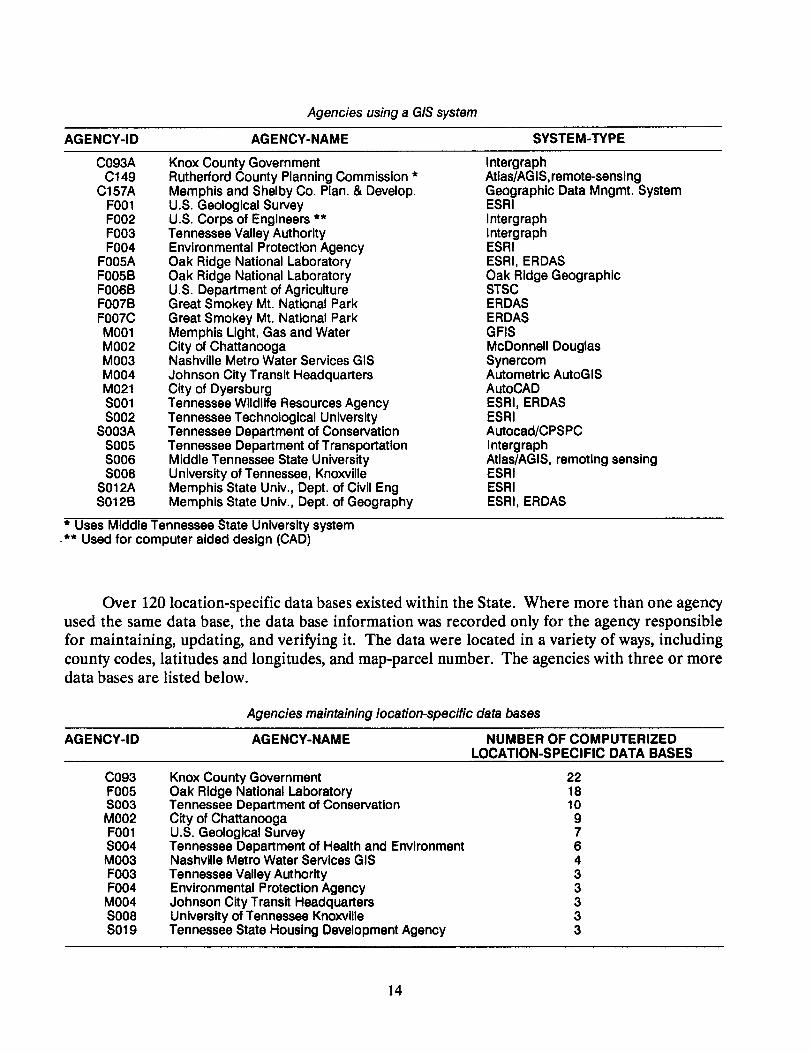
Over 120 location-specific data bases existed within the State. Where more than one agency used the same data base, the data base information was recorded only for the agency responsible for maintaining, updating, and verifying it. The data were located in a variety of ways, including county codes, latitudes and longitudes, and map-parcel number. The agencies with three or more data bases are listed below.
Agencies maintaining location-specific data bases
AGENCY-ID AGENCY-NAME NUMBER OF COMPUTERIZED LOCATION-SPECIFIC DATA BASES
co93 FO05 so03 MOO2 FOOl so04 MOO3 FO03 FO04 MOO4 SO08 so19
Knox County Government Oak Ridge National Laboratory Tennessee Department of Conservation City of Chattanooga U.S. Geological Survey Tennessee Department of Health and Environment Nashville Metro Water Services GIS Tennessee Valley Authority Environmental Protection Agency Johnson City Transit Headquarters University of Tennessee Knoxville Tennessee State Housing Development Agency
22 18 10 9
i
3
:
i
14
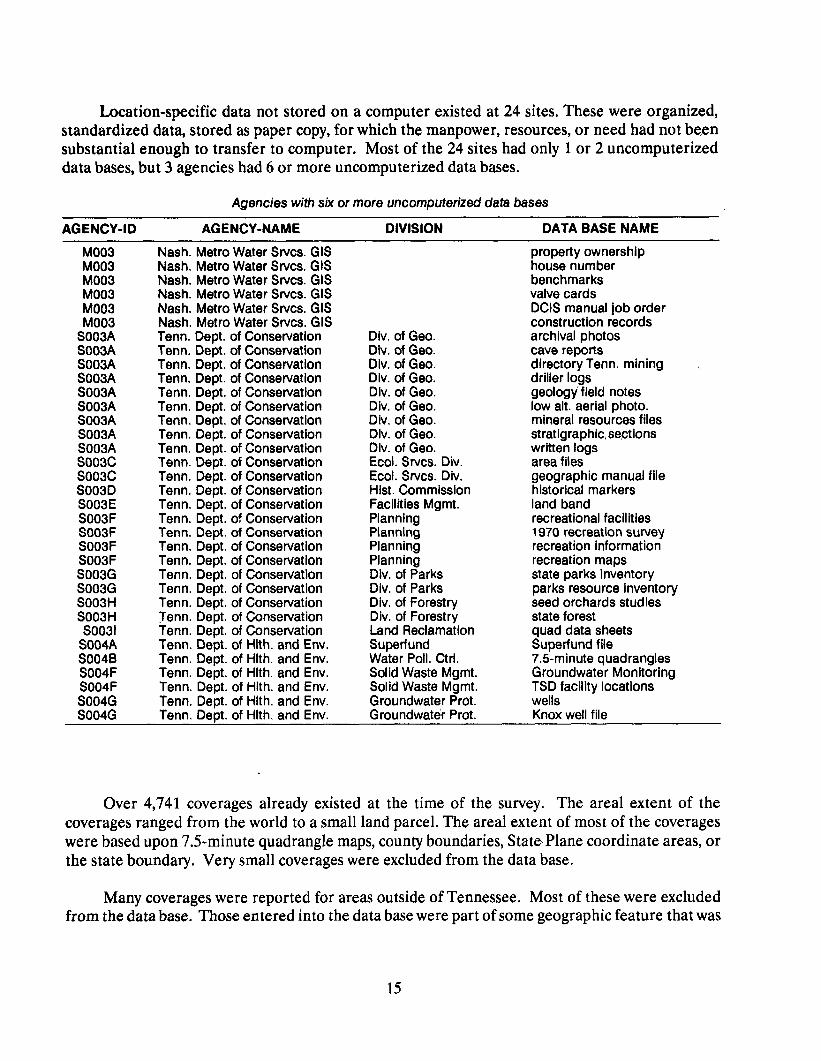
Location-specific data not stored on a computer existed at 24 sites. These were organized, standardized data, stored as paper copy, for which the manpower, resources, or need had not been substantial enough to transfer to computer. Most of the 24 sites had only 1 or 2 uncomputerized data bases, but 3 agencies had 6 or more uncomputerized data bases.
Agencies with six or more uncomputerized data bases
AGENCY-ID AGENCY-NAME DIVISION DATA BASE NAME
MO03 MO03 MOO3 MOO3 MOO3 MOO3
S003A S003A SOO3A S003A S003A S003A S003A S003A S003A soo3c soo3c SOO3D S003E SOO3F SOO3F SOO3F SOO3F S003G S003G S003H S003H so031
S004A SO048 SOO4F SOO4F SO04G SO04G Tenn. Dept. of Hlth. and Env.
Nash. Metro Water Swcs. GIS Nash. Metro Water Swcs. GIS Nash. Metro Water Swcs. GIS Nash. Metro Water Swcs. GIS Nash. Metro Water Swcs. GIS Nash. Metro Water Swcs. GIS Tenn. Dept. of Conservation Tenn. Dept. of Conservation Tenn. Dept. of Conservation Tenn. Dept. of Conservation Tenn. Dept. of Consewation Tenn. Dept. of Conservation Tenn. Dept. of Consewation Tenn. Dept. of Conservation Tenn. Dept. of Conservation Tenn. Dept. of Conservation Tenn. Dept. of Conservation Tenn. Dept. of Conservation Tenn. Dept. of Conservation Tenn. Dept. of Conservation Tenn. Dept. of Conservation Tenn. Dept. of Conservation Tenn. Dept. of Conservation Tenn. Dept. of Conservation Tenn. Dept. of Conservation Tenn. Dept. of Conservation Tenn. Dept. of Conservation Tenn. Dept. of Conservation Tenn. Dept. of Hlth. and Env. Tenn. Dept. of Hlth. and Env. Tenn. Dept. of Hlth. and Env. Tenn. Dept. of Hlth. and Env. Tenn. Dept. of Hlth. and Env.
Div. of Geo. Div. of Geo. Div. of Geo. Div. of Geo. Div. of Geo. Div. of Geo. Div. of Geo. Div. of Geo. Div. of Geo. Ecol. Swcs. Div. Ecol. Swcs. Div. Hist. Commission Facilities Mgmt. Planning Planning Planning Planning Div. of Parks Div. of Parks Div. of Forestry Div. of Forestry Land Reclamation Superfund Water Poll. Ctrf. Solid Waste Mgmt. Solid Waste Mgmt. Groundwater Prot. Groundwater Prot.
property ownership house number benchmarks valve cards DCIS manual job order construction records archival photos cave reports directory Tenn. mining \ driller logs geology field notes low alt. aerial photo. mineral resources files stratigraphicsections written logs area files geographic manual file historical markers land band recreational facilities 1970 recreation survey recreation information recreation maps state parks inventory parks resource inventory seed orchards studies state forest quad data sheets Superfund file ‘I.&minute quadrangles Groundwater Monitoring TSD facility locations wells Knox well file
Over 4,741 coverages already existed at the time of the survey. The area1 extent of the coverages ranged from the world to a small land parcel. The area1 extent of most of the coverages were based upon 7.5-minute quadrangle maps, county boundaries, State\Plane coordinate areas, or the state boundary. Very small coverages were excluded from the data base.
Many coverages were reported for areas outside of Tennessee. Most of these were excluded from the data base. Those entered into the data base were part of some geographic feature that was
15

contiguous with the same feature in Tennessee, such as the Kentucky portion of the Cumberland River basin.
The number of coverages at each site is listed below. Many more coverages probably exist now. The number of coverages is not necessarily indicative of the quantity of work done. For in- stance, Memphis Light, Gas and Water has only one coverage listed, but this is a “seamless” map of Shelby County which has numerous features on it with many attributes per feature. The number of coverages is directly related to the area1 extent that each site determines as its smallest base unit. Some municipal governments use very small base units and would thus have a large number of coverages.
Number of coverages available at each G/S site
AGENCY-ID AGENCY-NAME NUMBER OF DIGITAL COVERAGES
C093A Cl49
Cl 57A FOOl FO02 FO03 FO04
F005A FOO5B FOO7C
FOO8 MOO1 MOO4 so01 so02 so05 SO06 SO08
Knox County Government Rutherford County Planning Commission * Memphis and Shelby Planning and Development U.S. Geological Survey, WRD, Tennessee District US. Corps of Engineers a Tennessee Valley Authority Environmental Protection Agency Oak Ridge National Laboratory Oak Ridge National Laboratory, Computing/Telecom. Div. Great Smokey Mt. National Park U.S. Geological Survey, National Mapping Center Memphis Light, Gas, and Water Johnson City Transit Headquarters Tennessee Wildlife Resources Agency Tennessee Technological University Tennessee Department of Transportation Middle Tennessee State University University of Tennessee, Knoxville
30 204
6 31 69
269 89
1: 38
2,153 1
72 1,389
59 258
16 36
* Coverages are located on Middle Tennessee State University computer system.
STANDARDS
Various accuracy standards are already in place among the surveyed GIS users. To suggest that one is “better” than another would be unreasonable. Generally, municipal and county govern- ments set very strict accuracy standards on their data because the data are used for utility engineer- ing. The stricter the accuracy standard, the more difficult it is to update and maintain the data base. The USGS, NMD has specified a set of technical standards for its own maps and for maps input into NMD from other sources. The NMD standards can, therefore, be used as a set of minimum stand- ards to which various maps could conform. Information concerning these standards follows.
16

United States National Map Accuracy Standards
cfrom U.S. Bureau of the Budget, Issued June 10,1941, Revised April 26,1943, Revised June 171947)
With a view to the utmost economy and expedition in producing maps which fulfill not only the broad needs for standard or principal maps, but also the reasonable particular needs of individual agencies, standards of accuracy for published maps are defined as follows:
1.
2.
3.
4.
5.
6.
Horizontal accuracy. For maps on publication scales larger than 1:20,000, not more than 10 percent of the points tested shall be in error by more than l/30 inch, measured on the publica- tion scale; for maps on publication scales of 1:20,000 or smaller, l/50 inch. These limits of ac- curacy shall apply in all cases to positions of well-defined points only. Well-defined points are those that are easily visible or recoverable on the ground, such as the following: monuments or markers, such as bench marks, property boundary monuments; intersections of roads, rail- roads, and so forth.; corners of large buildings or structures (or center points of small build- ings); and so forth. In general what is well-defined will also be determined by what is plottable on the scale of the map within l/100 inch. Thus while the intersection of two road or property lines meeting at right angles would come with a sensible interpretation, identification of the intersection of such lines meeting at an acute angle would obviously not be practicable within l/100 inch. Similarly, features not identifiable upon the ground within close limits are not to be considered as test points within the limits quoted, even though their positions may be scaled closely upon the map. In this class would come timber lines, soil boundaries, and so forth.
Vertical accuracy, as applied to contour maps on all publication scales, shall be such that not more than 10 percent of the elevations tested shall be in error more than one-half the contour interval. In checking elevations taken from the map, the apparent vertical error may be decreased by assuming a horizontal displacement within the permissible horizontal error for a map of that scale.
The accuracy of any map may be tested by comparing the positions of points whose locations or elevations are shown upon it with corresponding positions as determined by surveys of a higher accuracy. Tests shall be made by the producing agency, which shall also determine which of its maps are to be tested, and the extent of such testing.
Published maps meeting these accuracy requirements shall note this fact on their legends, as follows: ‘This map complies with National Map Accuracy Standards.”
Published maps whose errors exceed those aforestated shall omit from their legends all men- tion of standard accuracy.
When a published map is a considerable enlargement of a map drawing (manuscript) or of a published map, that fact shall be stated in the legend. For example, ‘This map is an enlarge- ment of a 1:20,000-scale map drawing,” or ‘This map is an enlargement of a 1:24,000-scale published map.”
17

7. To facilitate ready interchange and use of basic information for map construction among all Federal mapmaking agencies, manuscript maps, wherever economically feasible and consistent with the uses to which the map is to be put, shall conform to latitude and longitude boundaries, being 15 minutes of latitude and longitude, or 7.5 minutes, or 3-3/4 minutes in size.
Guidelines for Acceptance of Digital Cartographic Base Data into the National Digital Cartographic Data Base
(5126187, Revised 8124187)
I. Introduction
On April 4,1983, the Office of Management and Budget established the Federal Interagen- cy Coordinating Committee on Digital Cartography (FICCDC) to coordinate digital car- tographic activities of the Federal agencies. Two important duties of the committee are to: 1) develop and adopt common standards of content, format, and accuracy for digital cartographic base data; and 2) determine category content of the National Digital Car- tographic Data Base (NDCDB), assist in establishing and publishing standards and specifications for the data, and assist in establishing priorities for digital cartographic data production.
The U.S. Geological Survey’s National Mapping Program is providing Federal, State, and private organizations with base data at large, intermediate and small scales for the United States. The principal data source for the National Mapping Program in the future, includ- ing the maintenance of the major map series, preparation of derivative products, and sup- port of geographic information systems, will be the NDCDB. The U.S. Geological Survey’s National Mapping Division (NMD) is attempting to populate and maintain the NDCDB with high quality data in response to FICCDC directives and similar legislative mandates.
Currently, the NDCDB contains base categories of digital cartographic data which include: geographic and other coordinate reference systems, hydrography, hypsography, transpor- tation, boundaries, miscellaneous culture, geodetic control, and vegetative and non-vegeta- tive cover. In addition, geographic names and the land use/land cover and associated mapped categories of census tracts, political boundaries, hydrologic units, and Federal and State land ownership are included in the NDCDB.
The primary digital products collected from NMD source graphics and supported in the NDCDB are digital line graph (DIG) data at 1:24,000; l:lOO,OOO; and 1:2,000,000 scales; digital elevation models (DEM) at 1:24,000 and 1:250,000 scales; and land use/land cover at l:lOO,OOO and 1:250,000 scales. In the future the NDCDB may include additional categories of a thematic nature or data collected from non-NMD source graphics. In those instances where non-NMD source graphics are involved, special procedures will have to be implemented. The scope of this paper, however, focuses only on base category digital car- tographic data collected from NMD source graphics.
18
Current requirements from Federal and State governments, and private industry for DLG and DEM data exceed current production capacity. One strategy to help satisfy agencies’ requirements and accomplish mission goals for populating the data base is to include in the NDCDB base category data collected by other Federal, State, or private sources. The pur- pose of these guidelines is to: 1) encourage arrangements with other organizations for the production of base category data for input into the NDCDB, and 2) to establish technical and programmatic guideline related to the acceptance of data.
This document describes acceptance criteria for base category digital cartographic data col- lected by other organizations from NMD source graphics. For example, levels of accuracy, data content, format, and lineage of data are considered. Other items presented include procedures for determining the value of data to be accepted, procedures for furnishing ap- propriate software and training, and relevant Bureau and Department policies for enter- ing into agreements with Federal, State, and private organizations.
II. U.S. Geological Survey Data Standards
The National Mapping Division currently produces digital cartographic data for entry into the NDCDB in accordance with its published standards as described in the following series of technical publications. Portions of these documents prescribe the positional accuracy of the digitized map features or elevations, the procedures for preparation of materials, the assignment of attribute codes to map features, and the format and content level of the data files, The planimetric data described in these published standards are referred to as DLG- 3 data, and the elevation data as DEM level 1,2, or 3. A list of applicable publications is given below.
l Standards for Digital Elevation Models, U.S. Geological Survey Open-file report 86-004.
l Standards for Digital Line Graphs .
--Part 1 General (draft) --Part 2 Specifications (draft) --Part 3 Attribute Coding (published) --Part 4 Data Collection (draft) --Part 5 Quality control and Verification (draft) --Part 6 Revision (draft)
*Note: Parts 1,2,4, and 5 should be available in published form by October 1987. Part 6 should be available by January 1988.
. Data Users Guide Series replacing US. Geological Survey Data Standards Circular 895 B through F.
19
1. Digital Line Graphs from 1:24,00OScale Maps 2. Digital Line Graphs from 1: 100,000~Scale Maps 3. Digital Line Graphs from 1:2,000,000-Scale Maps 4. Land Use and Land Cover Digital Data from 1:250,000- and 1: 100,000~Scale Maps. 5. Digital Elevation Models (at printers) ’ 6. Geographic Names Information System 7. Alaska Interim Land Cover Mapping Program
. Pre-Scan Edit Procedures for Scitex Processing (draft).
. DEM Editing System Procedure Manual.
Technical publications (unless in draft) are available from:
User Services Branch National Cartographic Information Center U.S. Geological Survey I- 507 National Center Reston, VA 22092 (703) 860-6045 FI’S 959-6045
For publications listed as “draft” or for technical questions contact:
Branch of Technical Management (RSTM) U.S. Geological Survey 5 10 National Center Reston, VA 22092
III. Criteria for Acceptance
A. Data Acceptability Criteria
While data that fully meet the published or draft standards are most desirable, data will be considered for acceptance into the NDCDB if they meet the minimum standard described in this document. This minimum level is based on data characteristics, presented below, which will permit further processing by NMD to reach the level prescribed by the published or draft standards. If data do not meet these minimum ac- ceptance criteria they would be more costly or more labor-intensive for NMD to bring them up to standards than it would for NMD to collect the data directly. The accep- tance criteria state the required levels of accuracy, content, format, and lineage.
20

1. Accuracy
DLG: Accuracy must meet a minimum standard level with regard to position and attribute coding. For positional accuracy of planimetric data, 90 percent of a mini- mum of 20 tested points must be within plus or minus 0.005 inch from the true (cor- rect) position of the map feature as indicated on a stable base copy of the U.S. Geological Survey source graphic.
Attribute coding of digital planimetric data must be consistent with the Attribute Coding Standards cited in Section II. This means that any attribute codes used must conform to the usage prescribed in the Technical Instructions. If the full set of at- tribute codes for a category are not included in the data file, the attribute coding must be internally consistent so that NMD may determine the level of effort neces- sary to complete the coding. For example, if the data file contains only codes on first class roads, then all first class roads, as defined in the attribute coding standard, must be identified with the specified code and no other roads be identified with that same code.
DEM: The desired vertical accuracy of digital elevation data is 7-meter root mean square error (RMSE). However, under some circumstances 15-meter RMSE may be accepted when the scale of the source photography is smaller than 1:80,000-scale. This evaluation should be based on a minimum of 20 well distributed test points of known elevation in the model. Grid points must be no further than 30 meters apart. The data must meet the level 1 or level 2 DEM requirements as stated in the Stand- ards for Digital Elevation Models for photographic source or contour source respec- tively.
2. Content
Data must be in separate files according to the base category of data as DLG: defined in the NMD. attribute coding scheme. All of one category and only one category should be included in each file.
Also, if all of the features in a category are not digitized the files must be internal- ly consistent as to the features that are collected. For example, if the only feature of interest to the collector of the data are the perennial streams in a given hydrologic unit but the source graphic spans several hydrologic units, all of the perennial streams on the source graphic must be digitized whether in the hydrologic unit of interest to the collector of the data or not. Without this internal consistency it will require too much analysis to determine what has been collected for the data to be of any use to the NMD. It also should be noted that this type of data is of a lower level of acceptability to the NMD than complete categories because of the amount of labor necessary to complete the category.
m: DEM data must cover a complete U.S. Geological Survey source graphic.
21
3. Format
The data must be delivered in a format that can be input directly (or easily DLG: converted) into the NMD data processing systems. Since formats are often system- specific, each case will have to be considered separately.
Formats will be supplied upon request to potential data collectors for evaluation. Data from a raster based scanning system may require pre-scan edit procedures such as those used by the NMD to facilitate identification of the map features for addi- tion of attribute codes at a later step of processing.
DEM data must be in the format specified in the Standards for Digital Eleva- DEM: tion Models.
4. Lineage
Data lineage is necessary for source suitability evaluation by NMD and other users. Lineage includes the name of the source graphic, the scale, the compilation and revision dates of the source graphics, the category of data, the corner coordinates of the source and corresponding corner coordinates of the data file. If the file does not contain all of the features in a category or attributes on all features digitized, a com- plete description of what is included in the file is necessary.
B. Mode of Operation Criteria
To establish a common understanding between U.S. Geological Survey and other data producing organizations, a formal agreement may be necessary. This agreement would include: a set of data specifications; a description of the deliverable data files; criteria for acceptance and rejection of the data; a description of any NMD furnished materials; training, or processing facilities; terms for cost-share and work-share; and provisions for termination of the agreement by both organizations.
An inspection of the production facilities, personnel qualifications, and sample data sets may be required to evaluate any proposed agreement. A benchmark or demonstration project may be a prerequisite for establishing a cooperative arrangement.
C. Validation Criteria
The NMD is currently developing procedures for use invalidating data collected by non- NMD agencies or offices. For agreements reached before these procedures are avail- able, data will be validated using current NMD DLG and DEM processing systems.

IV. Valuation of Non-NMD Data
The overall objective of the guidelines is to encourage work share or similar agreements to help the National Mapping Program reach its goal. Thus, there must be a clear benefit to the National Mapping Program in terms of satisfying requirements and mission goals of other agencies as well as U.S. Geological Survey. Factors used to determine value of benefits derived from interagency agreements will include resources required to add data to the NDCDB as well as possible intangible factors.
To determine value of data digitized by other organizations, the NMD and the cooperat- ing organization will assess the cost of converting non-NMD data for inclusion in the NDCDB compared to the costs and production capacity to produce the data within NMD. A sample data set provided to NMD for this purpose should include information on source materials, digitizing equipment, data format, and the. producer’s data specifications and coding. Again, dollar, personnel, and equipment resources will not be the only factors con- sidered. Intangible benefits may be identified which would also have a value to either or- ganization.
V. Hardware/Software/Training
In instances where clear benefits to the government have been identified, NMD may fur- nish copies of non-proprietary software.
Training (for digitizing, coding and quality control procedures) may be conducted at non- NMD data producing sites or at U.S. Geological Survey regional centers. Agreements may require appropriate training on the equipment to be used by the potential supplier. Agree- ments may provide access to NMD computing facilities or to NMD digitizing equipment.
VI. Relevant Denartment/Bureau Policies
Three chapters of the Survey Manual provide guidance for the establishment of working agreements with Federal, State, and private organizations.
500.1-- Policy of U.S. Geological Survey in Cooperative Work with States, Counties, Municipalities, and Other Related Political Subdivisions.
500.3-- Policy on Work for Other Federal Agencies.
500.20-- Contributions from and Collaborative Projects with Private Sources.
These three chapters are very specific in how U.S. Geological Survey/NMD can do busi- ness outside the Bureau. The relevant policy for developing agreements for exchanging data with other Federal agencies is very flexible. There is also considerable flexibility in dealing with States. Working with private sources is feasible but more restrictive.
23

VII. Summary
This document provides guidelines for establishing data exchange agreements with other Federal, State, or private organizations, Flexibility in dealing with technical and program- matic issues is stressed; however, established standards are not sacrificed for expediency. The NMD produces digital cartographic data according to published standards. Data from outside the NMD must meet a minimum level of acceptability based on accuracy, content,
’ format, and lineage. The NMD programmatic guidelines related to valuation of data and options for supplying hardware, software, and training are meant to encourage agreements by having a flexible acceptance policy that allows other producers of digital data to input base category data into the NDCDB. By establishing data exchange agreements to benefit both parties, the National Mapping Program stands to gain a great deal, including an in- creased rate for populating the NDCDB.
In addition to accuracy standards, two types of base maps have already become standards: (1) the USGS, NMD products and (2) the property tax maps. The USGS maps are used primarily by resource agencies interested in large areas. Typical scales for these products are 1”:24,000”, 1”:100,000”, and 1”:250,000”. The property tax maps are used primarily by-municipal and county governments. Typical scales for these maps are 1”:50’, l”:lOO’, 1”:200’, and 1”:400’. One standard scale base map for the entire state would be convenient, but impractical.
The State Plane coordinate system has already immerged as a standard. By far, most of the map coverages used within Tennessee have been digitized from a State Plane coordinate map or have been converted into that coordinate system. Most of the GIS software packages contain coor- dinate transformation software so that converting from one coordinate system to another is rela- tively easy. However, to facilitate interchange of coverages and information, the State Plane coordinate system appears to work best. Other coordinate systems are also in use including latitude and longitude, Universal Transverse Mercator (UTM), and Albers Equal Area. For coverages that cross state lines, one of these coordinates systems might be a better choice.
Within the State government aconvention for naming features should follow the USGS, NMD standardized set of names as closely as possible. For example, all agencies would call a “man-made facility maintained for the use of aircraft” an “airport” (the NMD standard name) rather than an “airfield” and or a “landing strip.” In many cases, names for several features are not included in the NMD standardized set of names. In such a case the State should establish a standard set of feature- naming conventions so that one agency does not call an unimproved, county-maintained road “UCMR” and another agency call the same feature “CNTYR”.
Names for geographic features such as streams, lakes, airports, and so forth, should conform to the Geographic Names Information System (GNIS) of the USGS. This system was designed to establish uniform geographic names, provide an index of names on maps, and to provide for the standardization of data elements and their coded presentation for use within the information processing community. By following these standards, a feature is referenced by one name throughout its extent (for example: Browns Creek, rather than Browns Creek in one county, Gray Creek in another, and Smith Creek in another).
24

A standard naming convention for coverages should also be adopted within the State govern- ment. Because of differences in the number and type of characters required by the computer sys- tems involved, the managers of each system need to reach an agreement concerning this. This should also be a consideration as more state agencies acquire GIS systems. At present, a coverage for Lake County roads might be called LKRDS on one system, HWY095 on another, and RO01.880426 on another.
A standard organizational scheme also should be developed. For instance, each State GIS site should organize its coverages using the same method (for example, by county or quadrangle or State Plane coordinate area). This would enhance the transfer of a coverage from one system to another.
DATACOMMUNICATIONSTECHNIQUES
Data from one computer can be transferred to another by a variety of techniques. The most common technique for mainframe or minicomputers is magnetic tape. Magnetic tapes can general- ly be written to various technical specifications, and can also generally be read if certain criteria are known. The basic criteria are:
1. bits per inch (bpi) - usually 800,1600, or 6250
For data transfer the tape drive at the source machine must be capable of writing a tape at the same bpi required for the receiving machine.
2. tape protocol - usually ASCII, EBCDIC, or BCD
For data transfer the source machine must have the appropriate software for writing a tape in a protocol that can be read by the receiving machine.
3. logical record length - a fixed or variable number
The logical record length depends upon the record length of the data. The data can either have a fixed length or avariable length. Fixed- length data is generally much easier to trans- fer.
4. block size - varies
The block size is an indication of the number of logical records grouped together. If 10 logical records that are 80 characters long are put together as a block of data, then the block size is 80x 10 = 800. Many systems require a blocking factor which is the block size divided by the logical record length, in the example above 800 / 80 = 10. The sender must let the receiving user know either the block size or the blocking factor.
25