Geochemical Evidence of Groundwater Flow Paths and the ...
100
U.S. Department of the Interior U.S. Geological Survey Scientific Investigations Report 2013–5098 Prepared in cooperation with the U.S. Army Corps of Engineers Geochemical Evidence of Groundwater Flow Paths and the Fate and Transport of Constituents of Concern in the Alluvial Aquifer at Fort Wingate Depot Activity, New Mexico, 2009
Transcript of Geochemical Evidence of Groundwater Flow Paths and the ...

U.S. Department of the InteriorU.S. Geological Survey
Scientific Investigations Report 2013–5098
Prepared in cooperation with the U.S. Army Corps of Engineers
Geochemical Evidence of Groundwater Flow Paths and the Fate and Transport of Constituents of Concern in the Alluvial Aquifer at Fort Wingate Depot Activity, New Mexico, 2009

Cover:Top, Looking north over igloo blocks A and B at Fort Wingate Depot Activity, New Mexico (photograph by Erika N. Curry-Elrod, U.S. Geological Survey). Bottom, Road sign at Fort Wingate Depot Activity, New Mexico (photograph by Erika N. Curry-Elrod, U.S. Geological Survey).

Geochemical Evidence of Groundwater Flow Paths and the Fate and Transport of Constituents of Concern in the Alluvial Aquifer at Fort Wingate Depot Activity, New Mexico, 2009
By Andrew J. Robertson, U.S. Geological Survey; David W. Henry, U.S. Army Corps of Engineers; and Jeffery B. Langman, U.S. Geological Survey
Prepared in cooperation with the U.S. Army Corps of Engineers
Scientific Investigations Report 2013–5098
U.S. Department of the InteriorU.S. Geological Survey

U.S. Department of the InteriorSALLY JEWELL, Secretary
U.S. Geological SurveySuzette M. Kimball, Acting Director
U.S. Geological Survey, Reston, Virginia: 2013
Suggested citation:Robertson, A.J., Henry, D.W., and Langman, J.B., 2013, Geochemical evidence of groundwater flow paths and the fate and transport of constituents of concern in the alluvial aquifer at Fort Wingate Depot Activity, New Mexico, 2009: U.S. Geological Survey Scientific Investigations Report 2013–5098, 89 p., http://pubs.usgs.gov/sir/2013/5098/.
For more information on the USGS—the Federal source for science about the Earth, its natural and living resources, natural hazards, and the environment, visit http://www.usgs.gov or call 1–888–ASK–USGS.
For an overview of USGS information products, including maps, imagery, and publications, visit http://www.usgs.gov/pubprod
To order this and other USGS information products, visit http://store.usgs.gov
Any use of trade, firm, or product names is for descriptive purposes only and does not imply endorsement by the U.S. Government.
Although this information product, for the most part, is in the public domain, it also may contain copyrighted materials as noted in the text. Permission to reproduce copyrighted items must be secured from the copyright owner.

iii
Acknowledgments
The cooperation of many individuals and organizations was essential for completion of this study. The authors acknowledge the support and help of Mark Patterson of the U.S. Army Base Realignment and Closure Commission, who helped guide this study and provided useful insight for completion of study goals. Field data were gathered with the help of Fredrick Gebhardt of the U.S. Geological Survey (USGS) New Mexico Water Science Center (NMWSC), and Matt Masten of the U.S. Army Corps of Engineers Albuquerque District. The data were assembled and archived by USGS student interns Lauren Sherson, Rachel Powell, Nicole Thomas, and Sarah Schaefer. The base maps and figures were generated by Roger Durall of the NMWSC.


v
ContentsAcknowledgments .......................................................................................................................................iiiAbstract ..........................................................................................................................................................1Introduction ....................................................................................................................................................1
Purpose and Scope .............................................................................................................................5Description of the Study Area ...........................................................................................................5
Regional Geology ........................................................................................................................5Climate and Vegetation ..............................................................................................................6Surface Hydrology ......................................................................................................................7Groundwater Hydrology ............................................................................................................7
Previous Studies ..................................................................................................................................7Study Methods .....................................................................................................................................7
Methods ........................................................................................................................................7Quality-Assurance Plan ..........................................................................................................11
Geochemical Evidence for Groundwater Flow Paths in the Alluvial Aquifer at Fort Wingate Depot Activity ................................................................................................................11
Hydrogeologic and Geochemical Framework ..............................................................................11Hydrogeology .............................................................................................................................11Geochemistry .............................................................................................................................14
Clay Mineralogy ...............................................................................................................14Secondary Minerals ........................................................................................................15
Geochemical Evidence of Groundwater Recharge Sources .....................................................18Geochemical Evidence for Delineation of Groundwater Flow Paths ........................................20
Geochemical Evidence for the Fate and Transport of Constituents of Concern ..............................25Constituent Source and Transport ..................................................................................................25
Explosives ...................................................................................................................................25Nitrate .........................................................................................................................................27Other Constituents ....................................................................................................................29
Perchlorate .......................................................................................................................29Organics ............................................................................................................................29
Attenuation of Constituents of Concern .........................................................................................29Summary .......................................................................................................................................................31References ...................................................................................................................................................32Appendix 1. Groundwater Analytical Results ......................................................................................37
Figures 1. Map showing location of Fort Wingate Depot Activity, New Mexico ................................2 2. Map showing study area and location of alluvial wells sampled in October 2009
at Fort Wingate Depot Activity, New Mexico ..........................................................................3 3. Map showing regional surface geology at Fort Wingate Depot Activity (FWDA),
New Mexico .................................................................................................................................4 4. Diagram showing generalized stratigraphy of the Chinle Group for west-central
New Mexico .................................................................................................................................6

vi
5. Map showing potentiometric surface of the alluvial aquifer at Fort Wingate Depot Activity, New Mexico, 2009 ..........................................................................................13
6. Graph showing turbidity and specific-conductance values for groundwater samples collected in October 2009 at Fort Wingate Depot Activity ..................................15
7. Piper diagram showing major ion relations in Fort Wingate Depot Activity groundwater, October 2009 ......................................................................................................16
8. Graph showing water isotopes for groundwater samples collected at Fort Wingate Depot Activity, October 2009 ....................................................................................19
9. Graph showing dissolved-cation distribution in the Fort Wingate Depot Activity alluvial groundwater, October 2009 ........................................................................................21
10. Graph showing sodium and chloride relations in the Fort Wingate Depot Activity alluvial aquifer, October 2009 ....................................................................................23
11. Graph showing the molar relations of sulfate to bicarbonate with sodium in the Fort Wingate Depot Activity alluvial aquifer, October 2009 ................................................26
12. Map showing nitrate concentrations in October 2009 in the alluvial aquifer .................28 13. Graph showing dissolved oxygen concentrations and pH values for groundwater
samples collected in October 2009 .........................................................................................30
Tables 1. Fort Wingate Depot Activity monitoring-well information ....................................................8 2. Sample analytes and laboratory analysis methods for groundwater samples
collected from Fort Wingate Depot Activity monitoring wells in October 2009 ................9 3. Anion concentrations in two soil profiles collected from Fort Wingate Depot
Activity .........................................................................................................................................17 4. Calculated fractional contributions of local recharge and San Andres-Glorieta
aquifer water to groundwater found in monitoring wells influenced by water from the leaking cistern at Fort Wingate Depot Activity .....................................................20
5. Saturation indices for common minerals and partial pressures of dissolved gasses in the alluvial groundwater from Fort Wingate Depot Activity monitoring wells .............................................................................................................................................22
6. Reduction-Oxidation Species in the alluvial groundwater from Fort Wingate Depot Activity monitoring wells ..............................................................................................24
vii
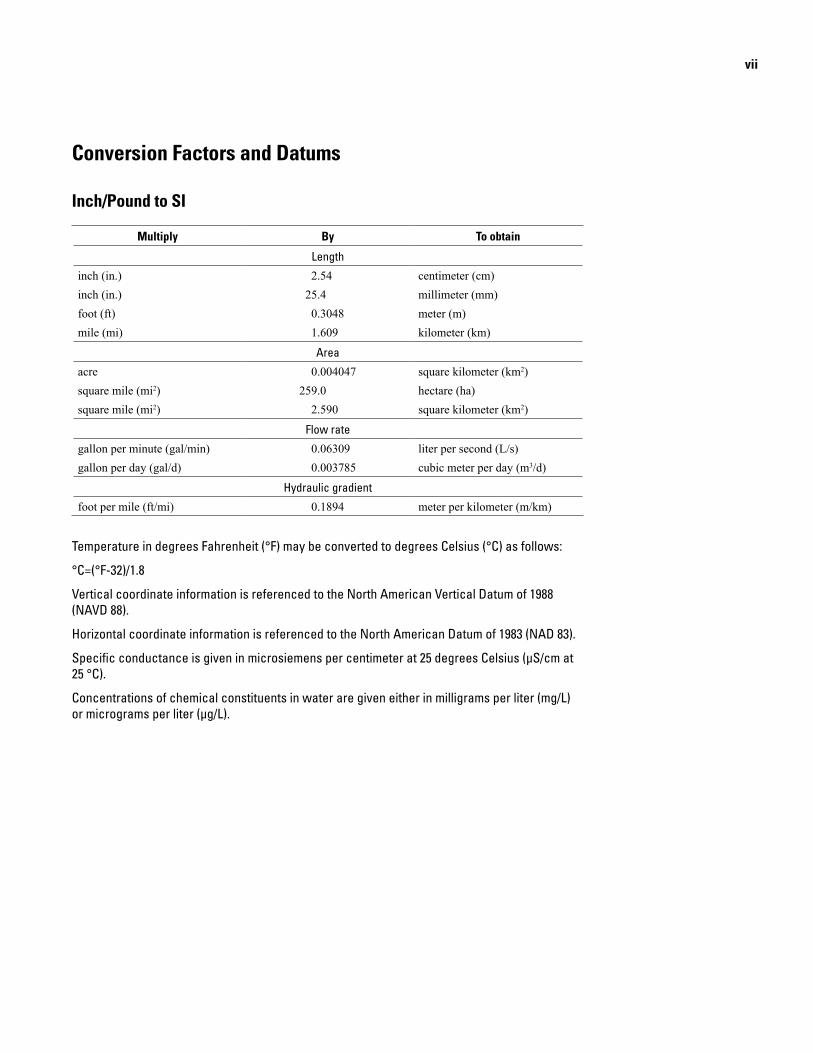
Conversion Factors and Datums
Inch/Pound to SI
Multiply By To obtain
Length
inch (in.) 2.54 centimeter (cm)inch (in.) 25.4 millimeter (mm)foot (ft) 0.3048 meter (m)mile (mi) 1.609 kilometer (km)
Area
acre 0.004047 square kilometer (km2)square mile (mi2) 259.0 hectare (ha)square mile (mi2) 2.590 square kilometer (km2)
Flow rate
gallon per minute (gal/min) 0.06309 liter per second (L/s)gallon per day (gal/d) 0.003785 cubic meter per day (m3/d)
Hydraulic gradient
foot per mile (ft/mi) 0.1894 meter per kilometer (m/km)
Temperature in degrees Fahrenheit (°F) may be converted to degrees Celsius (°C) as follows:
°C=(°F-32)/1.8
Vertical coordinate information is referenced to the North American Vertical Datum of 1988 (NAVD 88).
Horizontal coordinate information is referenced to the North American Datum of 1983 (NAD 83).
Specific conductance is given in microsiemens per centimeter at 25 degrees Celsius (µS/cm at 25 °C).
Concentrations of chemical constituents in water are given either in milligrams per liter (mg/L) or micrograms per liter (µg/L).

Geochemical Evidence of Groundwater Flow Paths and the Fate and Transport of Constituents of Concern in the Alluvial Aquifer at Fort Wingate Depot Activity, New Mexico, 2009
By Andrew J. Robertson, U.S. Geological Survey; David W. Henry, U.S. Army Corps of Engineers; and Jeff B. Langman, U.S. Geological Survey
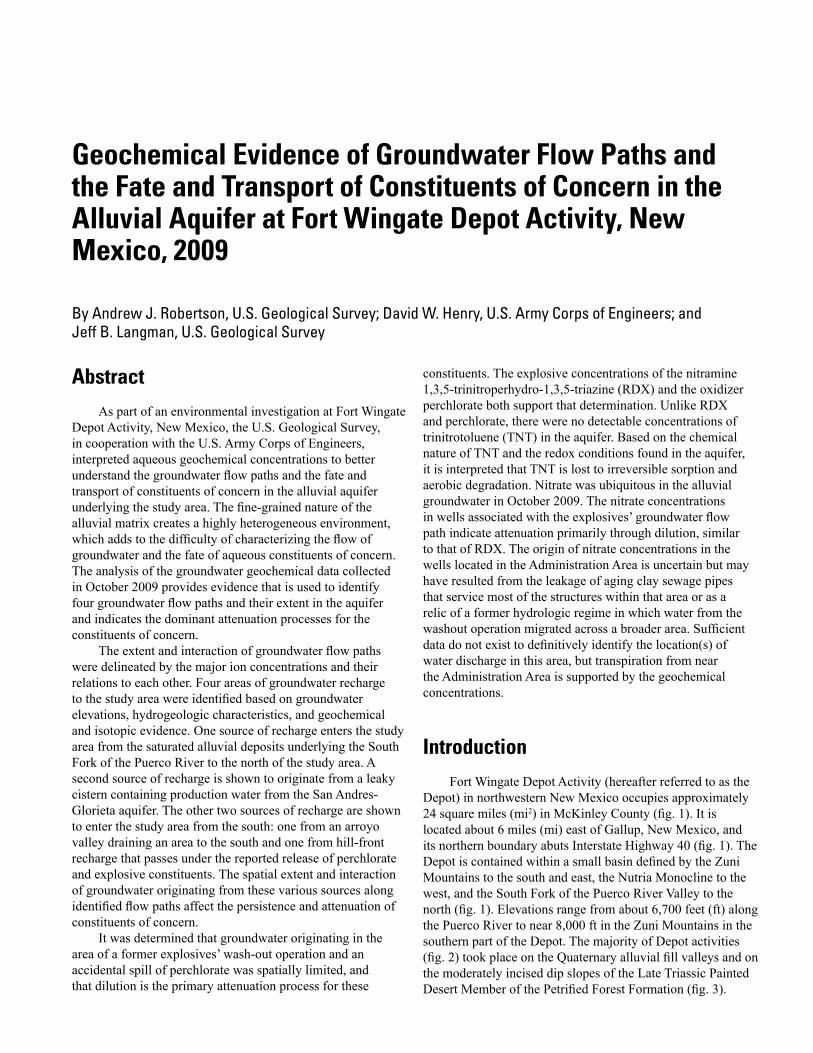
AbstractAs part of an environmental investigation at Fort Wingate
Depot Activity, New Mexico, the U.S. Geological Survey, in cooperation with the U.S. Army Corps of Engineers, interpreted aqueous geochemical concentrations to better understand the groundwater flow paths and the fate and transport of constituents of concern in the alluvial aquifer underlying the study area. The fine-grained nature of the alluvial matrix creates a highly heterogeneous environment, which adds to the difficulty of characterizing the flow of groundwater and the fate of aqueous constituents of concern. The analysis of the groundwater geochemical data collected in October 2009 provides evidence that is used to identify four groundwater flow paths and their extent in the aquifer and indicates the dominant attenuation processes for the constituents of concern.
The extent and interaction of groundwater flow paths were delineated by the major ion concentrations and their relations to each other. Four areas of groundwater recharge to the study area were identified based on groundwater elevations, hydrogeologic characteristics, and geochemical and isotopic evidence. One source of recharge enters the study area from the saturated alluvial deposits underlying the South Fork of the Puerco River to the north of the study area. A second source of recharge is shown to originate from a leaky cistern containing production water from the San Andres-Glorieta aquifer. The other two sources of recharge are shown to enter the study area from the south: one from an arroyo valley draining an area to the south and one from hill-front recharge that passes under the reported release of perchlorate and explosive constituents. The spatial extent and interaction of groundwater originating from these various sources along identified flow paths affect the persistence and attenuation of constituents of concern.
It was determined that groundwater originating in the area of a former explosives’ wash-out operation and an accidental spill of perchlorate was spatially limited, and that dilution is the primary attenuation process for these
constituents. The explosive concentrations of the nitramine 1,3,5-trinitroperhydro-1,3,5-triazine (RDX) and the oxidizer perchlorate both support that determination. Unlike RDX and perchlorate, there were no detectable concentrations of trinitrotoluene (TNT) in the aquifer. Based on the chemical nature of TNT and the redox conditions found in the aquifer, it is interpreted that TNT is lost to irreversible sorption and aerobic degradation. Nitrate was ubiquitous in the alluvial groundwater in October 2009. The nitrate concentrations in wells associated with the explosives’ groundwater flow path indicate attenuation primarily through dilution, similar to that of RDX. The origin of nitrate concentrations in the wells located in the Administration Area is uncertain but may have resulted from the leakage of aging clay sewage pipes that service most of the structures within that area or as a relic of a former hydrologic regime in which water from the washout operation migrated across a broader area. Sufficient data do not exist to definitively identify the location(s) of water discharge in this area, but transpiration from near the Administration Area is supported by the geochemical concentrations.
IntroductionFort Wingate Depot Activity (hereafter referred to as the
Depot) in northwestern New Mexico occupies approximately 24 square miles (mi2) in McKinley County (fig. 1). It is located about 6 miles (mi) east of Gallup, New Mexico, and its northern boundary abuts Interstate Highway 40 (fig. 1). The Depot is contained within a small basin defined by the Zuni Mountains to the south and east, the Nutria Monocline to the west, and the South Fork of the Puerco River Valley to the north (fig. 1). Elevations range from about 6,700 feet (ft) along the Puerco River to near 8,000 ft in the Zuni Mountains in the southern part of the Depot. The majority of Depot activities (fig. 2) took place on the Quaternary alluvial fill valleys and on the moderately incised dip slopes of the Late Triassic Painted Desert Member of the Petrified Forest Formation (fig. 3).

2 Geochemical Evidence of Groundwater Flow Paths and the Fate and Transport of Constituents of Concern
Figure 1. Location of Fort Wingate Depot Activity, New Mexico.
Zuni Mountains / Zuni uplift
Fort Wingate depot activity
Puerco River
Puerco River
South Fork
Rio Nutria
Fort Wingate
0 5 10 MILES
0 5 10 KILOMETERS
108°40' 30' 108°20'
Native American reservation and trust landsFederal landUrban areasState landFault
Base from U.S. Geological Survey digital data, 1:24,000 and 1:100,000Universal Transverse Mercator 12° NorthNorth American Vertical Datum of 1988 (NAVD 88)
35°40'
30'
35°20'
40
491 566
602
400
Navajo
Navajo
Navajo
Zuni
Zuni
Gallup
Yah-ta-hey
Twin Lakes
Church Rock
Nutria Monocline
Map location
New Mexico
Zuni Mountains / Zuni uplift
Study area(fig. 2)
Open burn/Open detonation (OB/OD) area
Open burn/Open detonation (OB/OD) area
McGaffey
Gallup sagGallup sag
Chaco slopeChaco slope
EXPLANATION
McKinley County
§̈¦4 0
Introduction 3
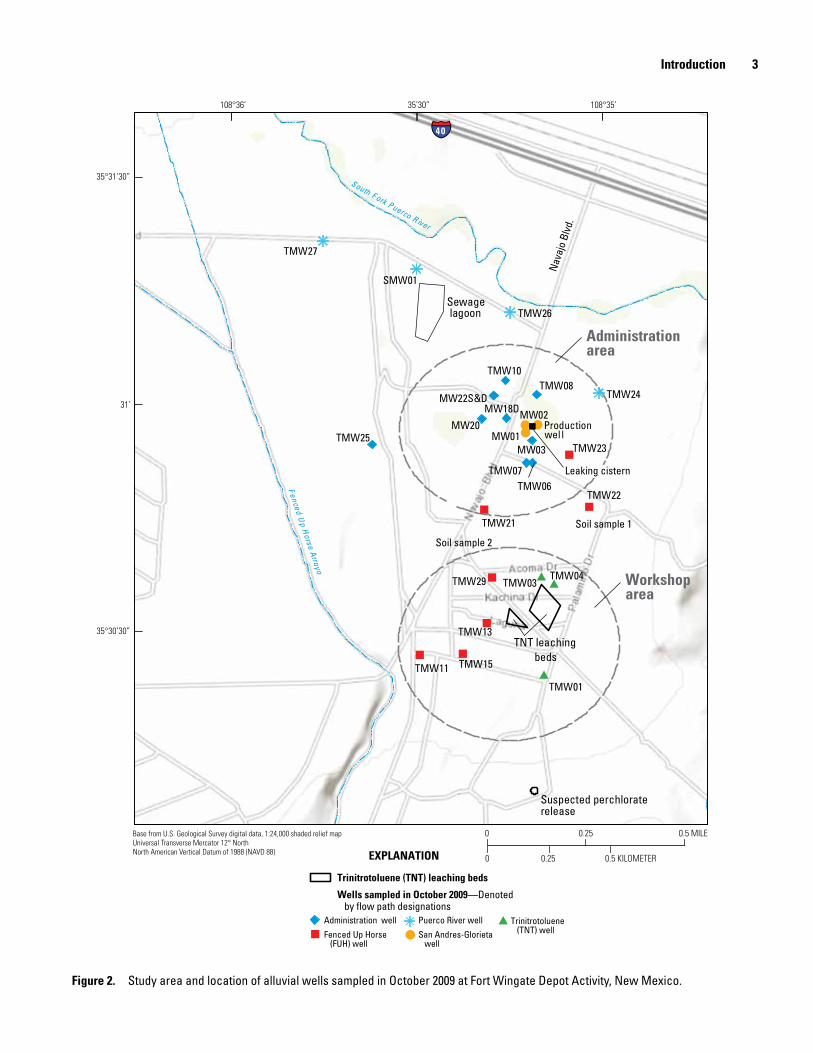
Figure 2. Study area and location of alluvial wells sampled in October 2009 at Fort Wingate Depot Activity, New Mexico.
§̈¦4 0
Nav
ajo
Blvd
.
!!
l
#
#
##
"
"
"
"
" "
"
l
l
l
"
!
!
South F ork P uerco R iver
Fenced Up H
orse Arroyo
TMW23MW01
MW02MW18D
Production wel l
MW03
MW20
MW22S&D
SMW01
TMW01
TMW03TMW04
TMW06TMW07
TMW08TMW10
TMW11
TMW13
TMW15
TMW21
TMW22
Soil sample 1
Soil sample 2
TMW24
TMW25
TMW26
TMW27
TMW29
Sewagelagoon
TNT leachingbeds
Suspected perchloraterelease
108°36’
35°31’30”
35°30’30”
31’
35’30” 108°35’
EXPLANATION
l
0 0.25
0.25
0.5 MILE
0.5 KILOMETER0
Trinitrotoluene (TNT) leaching beds
Wells sampled in October 2009—Denoted by flow path designations
Base from U.S. Geological Survey digital data, 1:24,000 shaded relief mapUniversal Transverse Mercator 12° NorthNorth American Vertical Datum of 1988 (NAVD 88)
Administration area
Workshoparea
Administration well
Fenced Up Horse (FUH) well
Trinitrotoluene (TNT) well
Puerco River well
San Andres-Glorieta well
Leaking cistern

4 Geochemical Evidence of Groundwater Flow Paths and the Fate and Transport of Constituents of Concern
Figure 3. Regional surface geology at Fort Wingate Depot Activity (FWDA), New Mexico.
Studyarea
Base from U.S. Geological Survey digital data, 1:24,000 and 1:100,000Universal Transverse Mercator 12° NorthNorth American Vertical Datum of 1988 (NAVD 88)
"
"
"
"
"
«
0 1 2 KILOMETERS
0 1 2 MILES
Fort Wingate
Perea
ChurchRock
Sundance
Rehoboth
Two resolutions are presented for the geologic divisions (1:24,000 and 1:500,000).Geologic divisions are listed by formation or group with the formation composition where undivided in the 1:500,000.
Geologic divisions are listed by formation or formation and member where available in the 1:24,000.
¬
Jm
Jz
Kcc
Kd
Kg
Km
Trb
TrblTrbmTrbu
Tro
Trpb
TrppTrps
J
Jsr
Kdm
Ku
QQg
Je
Trc
PgPsaPy
Trm
Pa
a Quaternary AlluviumQuaternary Gravels Upper Cretaceous rocks, undividedCrevasse Canyon FormationGallup SandstoneMancos Shale and Dakota Sandstone, undividedMancos ShaleDakota SandstoneUpper and Middle Jurassic rocks, undividedMorrison FormationSan Rafael GroupEntrada SandstoneZuni SandstoneChinle FormationOwl Rock FormationPetrified Forest Formation - Painted Desert Member Petrified Forest Formation - Sonsela MemberPetrified Forest Formation - Blue Mesa MemberBluewater Creek FormationBluewater Creek Formation - Upper MemberBluewater Creek Formation - McGaffey MemberBluewater Creek Formation - Lower MemberShinarump and Moenkopi Formations, undividedGlorieta SandstoneSan Andres LimestoneYeso FormationAbo Formation
EXPLANATIONGeology
FaultFWDA property boundary
«004
¦§̈
¬566
35°32’
30’
28’
26’
35°24’
108°38’ 36’ 34’ 108°32’

Introduction 5
Fort Wingate was first established in 1860 as a cavalry outpost and has since intermittently occupied three locations in the immediate area under several names (Argonne National Laboratory, 1990; Heckert and others, 2003). The U.S. Army Ordnance Department took command of Fort Wingate in 1918, and, by 1920, the Depot was the largest munitions storage facility in the world (Heckert and others, 2003). The primary mission of the Depot from this time forward was munitions storage, including the maintenance and disposal of aging or outdated munitions and the refurbishment of small arms ammunition. The Depot also has been the site of rocket testing, including Pershing-1 missiles. The Missile Defense Agency still leases part of the property for ongoing testing. In the late 1980s, the Depot was scheduled to close under the Base Realignment and Closure (BRAC) process, and the munitions stored at the Depot were removed to other storage facilities or disposed of onsite in the Open Burn/Open Detonation (OB/OD) area (fig. 1). The Depot was deactivated, and the installation closed in January 1993.
Activities associated with the Depot’s former mission have impacted the alluvial aquifer underlying the Administration and Workshop Areas (fig. 2). Constituents of concern include various industrial and military-related compounds including organic carbon products, nitrate, explosive compounds, and perchlorate. Evaluation and remediation of these constituents is presently (2012) occurring under the guidelines of a Resource Conservation and Recovery Act (RCRA) permit. Groundwater chemical monitoring to meet regulatory requirements began in 1997 and continued intermittently until 2008. A semiannual groundwater sampling program conducted by the U.S. Army Corps of Engineers (USACE), Albuquerque District, New Mexico, began in 2008 (U.S. Army Corps of Engineers, 2009, 2010, 2011c). Groundwater samples and analyses used in this report were collected in conjunction with the regulatory sampling event that took place in October 2009.
As part of the environmental investigation, the U.S. Geological Survey, in cooperation with the U.S. Army Corps of Engineers, delineated groundwater flow paths and provided an interpretation of aqueous constituent fate and transport in the alluvial aquifer underlying the Depot on the basis of an analysis of the hydrogeologic setting and groundwater geochemical and isotopic data collected in October 2009. These data and interpretation will be useful in determining appropriate actions needed to address constituents of concern found in this shallow aquifer.
Purpose and Scope
The purpose of this report is to present the geochemical evidence for groundwater flow paths and the fate and transport of constituents of concern in the alluvial aquifer at the Fort Wingate Depot Activity. This geochemical investigation aids in understanding the aquifer properties and flow paths that influence the potential pathways, sources, and sinks of constituents of concern that have been detected at the Depot.
The aqueous geochemistry is characterized through a review of the geologic structure and composition at the Depot and surrounding areas and by a chemical analysis of groundwater data collected in October 2009.
Description of the Study Area
The study area is located in the north-central part of the Depot and was the location of many of the service-support activities (fig. 1). The study area is defined as the Quaternary alluvium underlying the Administration and Workshop Areas (figs. 2 and 3). Because of the low groundwater productivity of many of the alluvial monitoring wells (many wells are purged dry prior to sampling), the alluvium would likely not meet the formal definition of an “aquifer” as a water-bearing geologic unit that will yield water in a usable quantity to a well or spring (Heath, 1989). For the purposes of this report, however, the term “alluvial aquifer” is used to identify the saturated alluvial deposits at the Depot.
The Administration Area occupies approximately 800 acres in the northernmost part of the Depot and contains various housing and office facilities, equipment maintenance and warehousing facilities, as well as utility-support features. Most of the structures and utilities were built in the 1940s. The Workshop Area is approximately 700 acres and is located south of the Administration Area (fig. 2). The Workshop Area is occupied by various industrial facilities used for ammunition maintenance and renovation. The Workshop Area is the site of reported releases of explosive compounds to the groundwater from a munitions washout process that was in operation from 1941 to 1967 (PMC Environmental, 2001). Trinitrotoluene (TNT), 1,3,5-trinitroperhydro-1,3,5-triazine (RDX), and tritonal (a mixture of TNT and aluminum powder) were washed out of munitions with hot water and the solution was then dried, flaked, and packaged for reuse. Excess solution that overflowed settling tanks was diverted into unlined lagoons, known as the TNT leaching beds (fig. 2). It was reported that in late 1949 approximately 2,400 gallons per day (gal/d) of solution were disposed of in the leaching beds (Argonne National Laboratory, 1990). After the operation was shut down, the bottom sediments of the leaching bed were removed and disposed onsite in the OB/OD area (fig. 1).
Regional GeologyThe Depot is located in the Navajo Section of the
Colorado Plateau physiographic region (Fenneman and Johnson, 1946) within the Gallup sag and at the northwestern edge of the Zuni Mountains (Zuni uplift) (fig. 1) (Cather, 2003, 2004). The Zuni uplift is a northwest-striking, asymmetric uplift (Lorenz and Cooper, 2001). The uplift gently tilted the bedrock underlying the majority of the Depot to the northwest at an angle of approximately 5 degrees from horizontal (Lorenz and Cooper, 2001); subsequent erosion has exhumed the various Triassic sedimentary layers that are visible across the surface of the Depot (fig. 3).

6 Geochemical Evidence of Groundwater Flow Paths and the Fate and Transport of Constituents of Concern
The dominant topographic and structural feature at the Depot is the Nutria monocline, known locally as “The Hogback” (fig. 1). The Nutria monocline is a north-northwest to south-southeast trending monocline that dips steeply to the south-southwest and defines the west and southwest margin of the Zuni uplift. The northern boundary of the Depot terminates in the strike valley (a valley that is eroded parallel to the strike of the underlying rock formations) of the South Fork of the Puerco River. This valley represents the transition between the Zuni uplift to the south and the Chaco slope to the north.
Granites and smaller amounts of schist and gneiss of Precambrian age compose the underlying basement formation of the region and are exposed in the Zuni Mountains to the southeast (Gordon, 1961). The preservation of sedimentary deposits now visible at the surface on the Depot began in the Late Pennsylvanian epoch; the depositional environment changed from marine to continental and restricted marine by the Early Permian period (Baars, 1962). The Petrified Forest Formation of the Chinle Group is the dominant formation exposed at the Depot (fig. 3), and can be up to 800 ft thick (Anderson and others, 2003). The Petrified Forest Formation
is composed of the Blue Mesa, Sonsela, and Painted Desert members (fig. 4). The Chinle Group was elevated from formation to group status by Lucas (1993) but this change has not been fully accepted (Dubiel, 1994; Woody, 2006). The Chinle Group designation is used for purposes of this report.
Climate and VegetationThe climate of the region is arid to semiarid; precipitation
has averaged 11.9 inches at the Depot (1940 to 1966), 11.3 inches at Gallup, N. Mex. (1921 to 2005), and 18.7 inches at McGaffey, N. Mex. (1923 to 2005), in the Zuni Mountains (Western Regional Climate Center, 2010). The majority of the precipitation at the Depot occurs during the monsoon season (midsummer and early fall); however, the slow release of spring snowmelt provides for a higher percentage of infiltration as compared to the precipitation from the intense monsoon thunderstorms (Anderson and others, 2003). The regional climate supports Ponderosa Pine and mixed fir forests above 7,500 ft and predominantly piñon and juniper forests from 6,800 to 7,500 ft; shrubs and grasses dominate below 6,800 ft (Anderson and others, 2003).
Entrada Sandstone
Wingate Formation
Owl RockFormation
PaintedDesertMember
SonselaMember
Blue MesaMember
BluewaterCreekFormation
ShinarumpFormationMoenkopiFormation
Chin
le G
roup
Petri
fied
Fore
st F
orm
atio
n
Conglomerate
Sandstone, ripples
Sandstone
Limestone
Mudstone with siltstones
Mudstone with calcrete nodulesPedoturbated unit
Sandstone with cross bedding
McG
affe
yM
embe
r
Pere
aBe
d
San AndresLimestone
EXPLANATION
Figure 4. Generalized stratigraphy of the Chinle Group for west-central New Mexico. Modified from Heckert and others (2003).

Introduction 7
Surface HydrologyThe Depot is located approximately 15 mi west of the
Continental Divide. While no perennial streams are located within the Depot’s boundaries, the surface water that collects in drainages flows northward to the South Fork of the Puerco River. The South Fork of the Puerco River joins the Puerco River just east of Gallup and is part of the larger Puerco River and Little Colorado River watersheds. The Depot contains multiple unnamed drainages that are high-gradient (100 ft/mi or greater) ephemeral streams and are typically fed by spring snowmelt or monsoon season thunderstorms (Anderson and others, 2003).
Groundwater HydrologyThere are several water-bearing units underlying the
Depot (Shomaker, 1971). These include the San Andres-Glorieta Formations, the Shinarump Formation, and the Sonsela Member and several thin sandstone beds within the Painted Desert Member of the Petrified Forest Formation, as well as the Quaternary alluvium (fig. 3). In the Administration Area, the Quaternary alluvium contains interbedded layers of sediments with variable moisture content in the vertical profile (Michael Powers, U.S. Geological Survey, written commun., 2010). Groundwater in the region has been produced from the Shinarump Formation and the Sonsela Member of the Petrified Forest Formation (Errol L. Montgomery & Associates, Inc., 2003). Yields reported from these aquifers range from 5 to 50 gallons per minute (gal/min).
The San Andres-Glorieta aquifer is the principal aquifer in the region. At the Depot, the top of the San Andres-Glorieta aquifer is about 1,100 ft below land surface and has a thickness of about 200 ft (Shomaker, 1971). The San Andres-Glorieta aquifer is composed of the San Andres Limestone and the Glorieta Sandstone. The two units are considered a single aquifer because no impermeable bed separates them (Callahan and Cushman, 1954) and extensive interfingering makes determination of the contact difficult (Baldwin and Anderholm, 1992). Groundwater from the San Andres-Glorieta aquifer has been the sole source of the water used at the Depot and is produced from a single well located in the Administration Area. Water from the production well (fig. 2) is pumped to a large cistern located near the well. Until recently water was diverted into potable and nonpotable systems; the potable system has been abandoned (Argonne National Laboratory, 1990).
Previous Studies
The alluvial aquifer underlying the Depot has not been studied for the purpose of interpreting its hydrologic characteristics and their effects on the fate and transport of constituents of concern in groundwater. There are a number of private company and USACE reports (many available at
http://www.ftwingate.org/) that communicate findings of the groundwater resources and contamination at the Depot as part of regulatory investigations. Shomaker (1971) summarizes the groundwater resources around the Depot area and describes the alluvium in the South Fork Puerco River Valley as being composed of several irregular subbasins and having limited storage. Additionally, there is a substantial amount of geologic work produced by the New Mexico Bureau of Geology and Mineral Resources, including a report on the geology of the Fort Wingate quadrangle (Anderson and others, 2003). A recent geophysical investigation of the study area attempted to identify possible permeable pathways within the Quaternary alluvium and the underlying Petrified Forest Formation (Michael Powers, U.S. Geological Survey, written commun., 2010). The results of this investigation included surface resistivity and seismic interpretations. Surface-resistivity data were interpreted to identify possible flow paths through thin and variable sand stringers within the shallower, drier part of the alluvium, but this technique could not identify similar structures deeper in the alluvium. Interpretation of surface-tomography data suggested that the alluvium is not fully saturated at any consistent depth with the exception of a thin layer above the bedrock contact, and seismic-reflection data were interpreted to identify the Painted Desert Member claystone, bedrock surface, and the deeper Sonsela Member of the Petrified Forest Formation. Additionally, borehole-geophysical results were used to identify deeper permeable layers in the alluvium, but data from this technique could not be used to identify connecting pathways across the extent of the aquifer.
Study Methods
The characterization of the groundwater flow paths and the fate and transport of constituents of concern in the alluvial aquifer at the Depot were completed through a review of geologic literature, drilling logs, and geophysical investigations, and from water-level and geochemical data collected by the USACE and the USGS in October 2009. Water levels were measured in 27 wells, and groundwater samples were collected from 26 of the 27 wells screened in the alluvium (fig. 2, and table 1). These monitoring wells were installed between 1996 and 2002, and many contain dedicated pumps (PMC Environmental, 2001; U.S. Army Corps of Engineers, 2011a, b, c). Water levels were obtained with graduated electric tapes measured from a surveyed mark on the top of the well casing.
MethodsUnfiltered groundwater samples were tested in the
field for water temperature, pH, specific conductance, and dissolved oxygen (DO), and analyzed at a laboratory for total (unfiltered) concentrations of major elements: bicarbonate (HCO3) from acid neutralizing capacity (ANC), bromide

8 Geochemical Evidence of Groundwater Flow Paths and the Fate and Transport of Constituents of Concern
Table 1. Fort Wingate Depot Activity monitoring-well information.
[USGS, U.S. Geological Survey; ft, feet; NAVD 88, North American Vertical Datum of 1988; ls, land surface; TOS, top of screen; PVC, polyvinyl chloride; NA, not available]
Site designation
(fig. 2)
USGS site identification
number
Land-surface elevation
(ft above NAVD 88)
Well depth (ft below ls)
Casing material
Depth to TOS
(ft)
TOS elevation (ft above NAVD 88)
Screen length
(ft)
Production well1 353056108351201 6,683.2 1,350 Steel NA NA NA
MW01 353055108351401 6,686.0 54 PVC 33.6 6,652.4 20
MW02 353056108351401 6,683.2 47 PVC 37.4 6,645.8 10
MW03 353054108351301 6,687.1 53 PVC 43 6,644.1 10
MW18D2 353057108351702 6,684.4 57 PVC 47 6,637.4 10
MW20 353057108352101 6,685.6 59 PVC 46.8 6,638.8 10
MW22S 353100108351901 6,682.7 41 PVC 31 6,651.7 10
MW22D 353100108351902 6,682.6 57 PVC 47 6,635.6 10
SMW01 353117108353101 6,667.7 50 PVC 29.9 6,637.8 20
TMW1 353023108351201 6,709.6 60 PVC 44.1 6,665.5 15
TMW3 353036108351201 6,700.2 70 PVC 49.9 6,650.3 20
TMW4 353035108351001 6,698.9 71 PVC 50.1 6,648.8 20
TMW6 353051108351301 6,688.6 55 PVC 45 6,643.6 10
TMW7 353051108351401 6,688.7 75 PVC 65 6,623.7 10
TMW8 353100108351201 6,678.3 60 PVC 30 6,648.3 30
TMW10 353102108351701 6,678.0 58 PVC 28 6,650.0 30
TMW11 353026108353201 6,716.3 80 PVC 55 6,661.3 25
TMW13 353030108352101 6,705.5 71 PVC 60.7 6,644.8 10
TMW15 353026108352501 6,711.4 71 PVC 54.6 6,656.8 15
TMW21 353045108352101 6,693.6 58 PVC 48 6,645.6 10
TMW22 353045108350401 6,690.6 62 PVC 52 6,638.6 10
TMW23 353052108350701 6,686.3 56 PVC 46 6,640.3 10
TMW24 353100108350201 6,679.1 54 PVC 44 6,635.1 10
TMW252 353036108353801 6,671.4 53 PVC 42.5 6,628.9 10
TMW26 353111108351601 6,675.6 55 PVC 45 6,630.6 10
TMW27 353121108354601 6,666.3 70 PVC 60 6,606.3 10
TMW283 353116108344401 6,687.8 47 PVC 37 6,650.8 10
TMW29 353036108352001 6,701.3 59 PVC 49 6,652.3 101Only deuterium as δ2H and oxygen-18 as δ18O data are available for the production well. The production well is completed in the San Andres-Glorieta aquifer
rather than the alluvial aquifer.2No field (pH, specific conductivity, turbidity, and dissolved oxygen) data available.3No isotope, anion, total dissolved solids, or alkalinity data available.

Introduction 9
(Br), calcium (Ca), chloride (Cl), fluoride (F), nitrate (NO3), magnesium (Mg), sodium (Na), potassium (K), and sulfate (SO4); trace elements: aluminum (Al), antimony (Sb), arsenic (As), barium (Ba), beryllium (Be), cadmium (Cd), chromium (Cr), cobalt (Co), copper (Cu), iron (Fe), lead (Pb), manganese (Mn), nickel (Ni), selenium (Se), silver (Ag), titanium (Ti), vanadium (V), and zinc (Zn); dissolved solids (DS); energetics, organics, and the stable isotopes of water, deuterium and oxygen-18 (δ2H and δ18O relative to Vienna Standard Mean Ocean Water [VSMOW]) (table 2). Stable isotopes of water also were collected from the Depot’s production well completed in the San Andres-Glorieta aquifer. In addition, dissolved concentrations were determined for the major cations (Ca, Mg, Na, and K) and trace elements from filtered (0.45-micron filter size) samples. Appendix 1 contains the analytical results by constituent class and analytical method for samples collected in October 2009 (tables 1–1 to 1–11 in appendix 1). The dissolved major cation concentrations (Ca, Mg, Na, K) were used for the majority of the geochemical analysis because the analytical extraction
process for cations includes an acid digestion that may release bound species from solid-state particles in unfiltered samples and may not reflect the aqueous groundwater composition.
The hydrogeology of the alluvial aquifer at Fort Wingate Depot Activity was initially characterized using available information about the bedrock structure and the geologic origin of the unconsolidated deposits. Given geologic constraints, the probable areas of recharge to the study area and the constraints to the subsequent flow paths were identified on the basis of topography and groundwater elevations. Groundwater elevations also were used to construct a potentiometric surface and indicate the general directions of groundwater flow. Upon establishing the likely areas of recharge and possible directions of flow, the geochemical and isotopic signature of the groundwater was used to more precisely delineate the flow paths taken by groundwater originating at each recharge source. The mineralogy of the unconsolidated deposits was examined to determine the likely geochemical reactions.
Table 2. Sample analytes and laboratory analysis methods for groundwater samples collected from Fort Wingate Depot Activity monitoring wells in October 2009.
[ºC, degrees Celsius; µS/cm, microsiemens per centimeter at 25 degrees Celsius; NTU, Nephelometric Turbidity Unit; MCAWW, Methods for Chemical Analy-sis of Waters and Wastes; mg/L, milligrams per liter; USACE, U.S. Army Corps of Engineers; µg/L, micrograms per liter; USGS, U.S. Geological Survey; ‰, per mil; δxX (‰) = (Ratiosample/Ratiostandard − 1) x 1,000 of specified isotope ratio]
Constituent DescriptionMethod/
laboratory codeLaboratory
Analytical precision
Field values Water temperature, pH, specific conduc-tance, turbidity
Measured with field instru-ments
Field collection 0.1ºC, 0.02 pH, 0.5 percent µS/cm, 0.1 NTU
Dissolved solids Filterable residue MCAWW 160.11 TestAmerica Labs 5 mg/L
Acid neutraliz-ing capacity
Acid neutralizing capacity as calcium carbonate
MCAWW 310.11 TestAmerica Labs 1.1 mg/L
Major anions Bromide, chloride, flouride, sulfate, nitrate
SW846 9056A1 TestAmerica Labs 0.06 to 1.2 mg/L
Major anions Nitrate MCAWW 300.11 USACE contract lab 0.001 to 10 mg/L
Major cations Calcium, magnesium, sodium, potassium SW846 6010B1 USACE contract lab 0.034 to 1.1 mg/L
Trace elements Aluminum, antimony, arsenic, barium, beryllium, cadmium, chromium, cobalt, copper, iron, lead, manganese, nickel, selenium, silver, titanium, vanadium, and zinc
SW846 6010B, 60201 USACE contract lab 0.01 to 2 µg/L
Energetics Explosives SW846 8330B1 USACE contract lab 0.01 to 10 mg/L
Energetics Perchlorate SW846 68601 USACE contract lab 0.001 to 0.1 mg/L
Organics Volatile organic compounds SW846 8260C1 USACE contract lab 0.001 to 0.1 ug/L
Water isotopes 2H/1H, 18O/16O USGS 11422 USGS Reston Stable Isotope Laboratory
2‰ as δ2H and 0.2‰ δ18O
1U.S. Environmental Protection Agency, 2009a.2Epstein and Mayeda, 1953; Revesz and Coplen, 1991.

10 Geochemical Evidence of Groundwater Flow Paths and the Fate and Transport of Constituents of Concern
The mineralogy discussion in this report includes the analytical results of a soil-profile investigation. Soil samples were obtained through the use of direct-push methods. Samples were collected from two locations (fig. 2,); sample site 1 was topographically flat with no evidence of surface-water features, while the second site (sample 2) was located in a small depression in a ditch designed to collect and divert water. Samples were collected at 1-ft intervals from land surface to a depth of 40 ft below land surface (bls), then at 2-ft intervals until soil saturation. Soil samples were sent to the USGS contract laboratory, TestAmerica, Arvada, Colorado, for gravimetric percent moisture analysis by American Society for Testing and Materials (ASTM) method D2216-90 and water-soluble anions leached from these samples were analyzed by U.S. Environmental Protection Agency (EPA) method SW846 9056.
Stable isotope ratios of water, hydrogen (2H/1H, deuterium as δ2H) and oxygen (18O/16O, oxygen-18 as δ18O) were used to examine the influences of different source waters and seasonal variations of recharge sources between wells. The water isotope data were used to calculate the possible volumetric contributions of San Andres-Glorieta water into the alluvial aquifer because of a leaking cistern near the production well (fig. 2) in the Administration Area. End-members for the mixing calculations were the isotope values for the sample collected from the Depot production well completed in the San Andres-Glorieta aquifer and the median isotope values for alluvial aquifer wells not influenced by leakage from the cistern or the South Fork of the Puerco River (based on hydraulic gradients and a graphical review of the δ2H and δ18O values). The isotope data were used to estimate fractional contributions of source waters by inserting the data into a binary, isotope-mixing equation for each well:
( )1M A A B AR R f R f= + − (1)
or, by rearranging,
M BA
A B
R RfR R
−=
− (2)
where
Af is the compositional fraction of source water A in the mixture of source waters A and B (dimensionless),
MR is the isotopic ratio in the mixture of source waters A and B (per mil),
BR is the isotopic ratio in source water B (per mil), and
AR is the isotopic ratio in source water A (per mil).
The values of δ2H and δ18O were used independently in the calculations as a quality-assurance check and to evaluate any possible influences on either element’s isotope ratios from matrix or other effects.
The major-element concentrations were analyzed to examine the geochemical relations of groundwater between wells that could indicate a common source of water and the isolation or mixing of flow paths within the alluvial aquifer at the Depot. The ion exchange pool at any location along a flow path reflects water-rock interactions, atmospheric inputs, clay mineralogy, water pH, and water chemistry (Bullen and Kendall, 1998). Water-rock interactions that produce mineral dissolution or adsorption can result in nonconservative solute behavior that changes the composition of groundwater as it moves through the aquifer (Langmuir, 1997). The duration of water-rock interactions can increase solute concentrations (or possibly decrease concentrations through mineral precipitation) in response to dissolution reactions with formation minerals (Bullen and Kendall, 1998). In order to determine the equilibrium state of the major precipitates, saturation indices (log of the ratio of the ion activity product and the solubility product) were computed for groundwater from all of the wells by entering all available solute concentrations into the geochemical software PHREEQC (Parkhurst and Appelo, 1999) using the PHREEQCi interface (version 2.17.0). While nonconservative species can indicate a well’s position along the flow path, conservative species may indicate flow-path mixing or recharge. Conservative species are those generally not released into groundwater from the aquifer minerals and those not likely to interact with these minerals.
In addition to anthropogenic inputs, reduction-oxidation (redox) conditions can substantially affect the chemical composition of groundwater. Along with dissolved oxygen and nitrate, the presence of the trace elements iron and manganese in solution was used to determine groundwater redox conditions based on the solubility of the element under varying redox conditions (McMahon and Chapelle, 2008).
Regression analysis and correlation statistical methods were used to characterize geochemical relations between concentrations of individual constituents and total dissolved solids. A linear regression analysis was performed on the data and evaluated for predictability with the coefficient of determination (r2) (Helsel and Hirsch, 2002). For this report, a correlation was considered statistically significant if the p-value was less than 0.001 and r2 was greater than 0.8.
Some analytical results are reported as estimated (E) concentrations. Concentrations reported as estimated indicate the constituent is present, but there is some type of quantitative uncertainty. It is generally the case that reported concentrations are smaller than a minimum concentration that can be reliably reported by a given analytical method but generally larger than the long-term method detection limit (Childress and others, 1999). Results reported as estimated also may result from quality concerns such as matrix effects or instrument calibrations that may affect the accuracy of the value. In addition, some analytical results are reported as undetected (U) concentrations. The undetected results are concentrations that are below the analytical detection limit.

Geochemical Evidence for Groundwater Flow Paths in the Alluvial Aquifer at Fort Wingate Depot Activity 11
Quality-Assurance Plan The geochemical and water-level data presented in this
report were collected by the USACE with assistance from the USGS. Groundwater-data collection was performed according to USGS quality-control (QC) and quality-assurance (QA) standards described in the USGS National Field Manual for the Collection of Water-Quality Data (U.S. Geological Survey, variously dated). Samples collected from each well were analyzed for major cations and trace elements at the USACE contract laboratory (ARS Laboratory, Albuquerque, N. Mex.); for DS, major anions (Br, Cl, F, and SO4), and ANC (for determining HCO3) at the USGS contract laboratory (TestAmerica, Arvada, Colo.); and for stable isotopes of water at the USGS Stable Isotope Laboratory, Reston, Va. The USACE uses the Automated Data Review Software developed by Laboratory Data Consultants, Inc. for its QA review of aqueous chemical data and a private contractor for analytical data validation. The USGS reviewed the geochemical data for comparison of QC samples. Sequential QC replicate samples were collected at randomly selected sites to evaluate sampling and laboratory variability and precision. All QC replicate sample results were within 10 percent of the environmental sample results. Groundwater samples were obtained from wells with dedicated or disposable equipment and, thus, no rinsate blanks were collected. Thirty-eight trip blanks were collected and analyzed for volatile organic compounds (VOCs). Several constituents were detected in trip blanks resulting in six methylene-chloride and carbon-disulfide results to be qualified as nondetect (U). Both laboratories analyzed laboratory blank samples, which produced nondetections for all blank samples. As further evaluation of the quality of the data, unfiltered major cations and major anions data were converted to milliequivalents per liter and examined for electrical balance. Nine of the 26 samples did not balance within 5 relative percent difference and all but 3 were within 10 relative percent difference. There were five negative and four positive excesses.
Geochemical Evidence for Groundwater Flow Paths in the Alluvial Aquifer at Fort Wingate Depot Activity
The hydrogeologic and geochemical framework that controls the movement and geochemistry of groundwater within the study area is described herein. The source and spatial influence of groundwater flow paths are interpreted from the isotopic ratios of water and the geochemical concentrations of major ions. These interpretations are constrained by hydraulic gradients and from predictable trends of conservative and nonconservative chemical behavior based on the mineralogy of alluvial deposits.
Hydrogeologic and Geochemical Framework
Analysis of the hydrogeologic and geochemical framework at the Depot is dependent upon the composition and alteration of the exhumed Chinle Group and the redeposition of Chinle-derived sediments as Quaternary alluvium. This description of the geologic environment establishes the major controls on groundwater movement within the subsurface. The mineral composition of the alluvial aquifer is important in determining the conservative and nonconservative behavior of chemical species involved in groundwater-rock interactions.
Hydrogeology Overlying the regional basement granitic rocks are the
sedimentary Permian Abo and Yeso Formations, Glorieta Sandstone, and San Andres Limestone. Overlying the Permian strata are the Triassic nonmarine, red-bed siliciclastics including the Moenkopi Formation (Middle Triassic) and the younger Chinle Group. The Chinle Group is the dominant geologic unit exposed at the Depot (figs. 3 and 4). It can be over of 1,000 ft thick in the area and is composed primarily of mudstone and siltstone with some minor sandstone and limestone components (Stone and others, 1983; Lucas and others, 2003). Deposition of the Chinle Group occurred during the Late Triassic Period in the Chinle Basin, a retro-arc basin on the western edge of the North American craton (Tanner, 2003a). The various siliciclastic sediments of the Chinle Group (fig. 4) originated from surrounding highlands such as the Mogollon Highlands in Arizona, the Uncompaghre Highlands in New Mexico and Colorado, and various upland areas in Texas such as the Amarillo-Wichita and Ouachita-Marathon uplifts. Sediments were transported from these areas by tributaries of a major fluvial system flowing northwest across an alluvial plain, where the sediments were deposited unconformably atop older Triassic deposits (Tanner, 2003b). Initial deposition occurred in paleovalleys where incision into older formations (Moenkopi and others) occurred (Stewart and others, 1972).
During the Late Cretaceous, the Laramide orogeny deformed the landscape and produced the current structural features of the Depot area (Baldwin and Anderholm, 1992). While the Zuni uplift likely has a compound tectonic history, its present configuration is thought to have been created by indentation-extrusion tectonics during the Laramide orogeny that took place approximately 75 to 35 million years ago (Chamberlin and Anderson, 1989). Erosion of the Zuni uplift has exhumed older formations at higher elevations in the Zuni Mountains (fig. 1) and progressively younger formations at lower elevations (fig. 3). Because of this erosion, the various formations of the Chinle Group—Shinarump, Bluewater Creek, Petrified Forest, and Owl Rock—are exposed at discrete locations across the Depot (fig. 3). For example, the

12 Geochemical Evidence of Groundwater Flow Paths and the Fate and Transport of Constituents of Concern
Sonsela Member of the Petrified Forest Formation is exposed at land surface in a band to the south and southeast of the study area (fig. 3). Southeast of the exposure, the Sonsela Member has been removed by erosion, and northwest of the exposure, the Sonsela Member is overlain by younger sediments and alluvium. Erosion of these rock layers occurs more rapidly on the softer clay and mudstones than on the more resistant interbedded sandstones. The different erosional rates have generated a series of alternating erosion-resistant cuestas (ridges with gentle slopes on one side and steep slopes on the other), and less erosion-resistant valleys in a stairstep configuration. This stairstep structure of older to younger cuestas, and the presence of relatively hydrologically impermeable geologic units (such as the mudstones of the Painted Desert Member of the Petrified Forest Formation), commonly creates aquifers that exhibit artesian conditions.
Artesian conditions have been recorded in the Sonsela Member and thin Painted Desert Member sandstone units underlying the Depot’s alluvial aquifer (Callahan and Cushman, 1954; U.S. Army Corps of Engineers, 2009, 2010, 2011c). The artesian conditions found in these underlying units inherently prevent the downward migration of groundwater or constituents. In addition, no hydrologic or geologic connection was found between the alluvial deposits and the Sonsela Member or sandstones of the Painted Desert Member in the geophysical investigation performed in 2008 and 2009 (Michael Powers, U.S. Geological Survey, written commun., 2010). The small potential for cross-formational groundwater flow constrains the possible sources and sinks of alluvial groundwater, groundwater flow, and aqueous chemical species to the alluvium and the surface.
The alluvial deposits in the valleys around the Depot are composed of the detrital material from formations outcropping in the area (Leopold and Snyder, 1951). The rock outcrops of the Painted Desert Member in and around the study area provide evidence of previous erosion and the identity of the source formation from which the alluvium in the study area was derived. The Painted Desert Member can be up to 500 ft thick in the region and is composed of smectitic mudstones and thin, interbedded sandstones (Lucas and others, 1997; Tanner, 2003a). Given the predominance of mudstones in the Painted Desert Member, erosion of this member would be expected to provide abundant fine-grained material to the Depot alluvium. Drill cuttings and core descriptions from lithologic logs compiled during various investigations at the Depot describe the fine-grained nature of eroded siltstones and mudstones in the alluvial deposits (Michael Powers, U.S. Geological Survey, written commun., 2010; PMC Environmental, 2001; U.S. Army Corps of Engineers, 2011a, b). These unconsolidated deposits in the study area represent relatively low-energy alluvial deposition with interbedded sands and clays. The alluvium generally is low in hydraulic conductivity because of the large clay content, and groundwater velocities overall are low despite the presence of some sand layers because those layers are discontinuous. Therefore, it should be considered that not all
wells penetrating the alluvial aquifer tap into well-connected flow paths, and that saturated deposits in which they are screened may represent somewhat isolated groundwater. This conclusion is supported by slightly dissimilar water levels in some adjacent wells (U.S. Army Corps of Engineers, 2009, 2010, 2011c). Thicknesses of the alluvial deposits in the northern part of the Depot near the Administration and Workshop Areas vary from zero to just over 100 ft (Michael Powers, U.S. Geological Survey, written commun., 2010).
The October 2009 groundwater levels measured in wells screened in the alluvial aquifer beneath the Administration and Workshop Areas indicate that the potentiometric surface generally follows the surface topography (fig. 5). In the southern part of the study area, groundwater generally flows northward; in the northern part of the study area, near the South Fork of the Puerco River, groundwater generally flows to the southwest (fig. 5). The center of the study area appears to be an area where multiple flow paths converge, and flow directions are highly variable (fig. 5). The source of groundwater levels is from the USACE semiannual groundwater report (U.S. Army Corps of Engineers, 2011c) and the potentiometric-surface contours in figure 5 were hand drawn.
Probable areas of recharge and likely groundwater flow paths were initially identified based on topography and groundwater elevations as described in the “Study Methods” section. Three possible flow paths originating at the aquifer margins were identified, and a fourth recharge source resulting in hydrologic and chemical effects that could be observed over a spatially limited area was identified near the cistern for collecting water from the Depot production well. The leaking cistern likely provides an artificial recharge source to the alluvial aquifer and creates a groundwater mound with the high centered near MW02 (fig. 5). For the purposes of discussion in this report, the aquifer has been divided spatially into four general areas, each with groundwater that appears to have originated primarily at one of these four main recharge sources. These areas are referred to as “flow paths,” and they have been defined as follows:1. A flow path originating near the southeastern boundary
of the study area near well TMW01 (fig. 5). Based on the topography and geology, recharge is considered to occur as focused hill-front recharge. This proposed recharge is considered to be analogous to mountain-front recharge but at a smaller scale. The hydraulic gradient indicates that water in this area is moving northward under the TNT leaching beds. This flow path is thus referred to as the “TNT” flow path;
2. A flow path originating at the southwestern boundary of the study area near the Fenced Up Horse (FUH) arroyo (fig. 5). This flow path may receive focused recharge from topographic depressions and the ephemeral and flashy FUH arroyo and is thus referred to as the “FUH” flow path. The hydraulic gradient indicates groundwater in this area is moving north to northeast;

Geochemical Evidence for Groundwater Flow Paths in the Alluvial Aquifer at Fort Wingate Depot Activity 13
Figure 5. Potentiometric surface of the alluvial aquifer at Fort Wingate Depot Activity, New Mexico, 2009.
§̈¦40
Nav
ajo
Blv
d.
South Fork Puerco River
South Fork Puerco River
!!
#
##
"
"
"
" "
"
"
664
South Fork Puerco River
6,645
6,655
6,660
6,6706,675
6,650
6,665
6,640
6,645
6,650
6,650
TMW286,670.5
6,655
6,6606,665
6,670
Fenced Up H
orse Arroyo
MW016,644.2
Cistern
6,630
, 5646
TMW016,676.1
TMW116,651.7 TMW15
6,649.6
TMW136,647.6
TMW046,644.6
TMW256,633.6
TMW296,645.8
TMW036,645.6
TMW216,644.7 TMW22
6,643.0
TMW076,642.9
TMW066,643.9
TMW236,642.1
MW036,643.8
MW026,646.6
MW206,642.9
MW18D6,643.7
MW22D6,643.1
MW22S6,643.4
TMW086,644.1
TMW246,641.1
TMW106,643.2
TMW266,651.1
SMW016,641.1TMW27
6,639.8
T6,6
108°36’
35°31’30”
35°30’30”
31’
35’30” 108°35’
FUH flow path
TNT flow path
Puerco flow path
SA-G flow path
FUH flow path
EXPLANATION
0 0.25
0.25
0.5 MILE
0.5 KILOMETER0
Base from U.S. Geological Survey digital data, 1:24,000 shaded relief mapUniversal Transverse Mercator 12° NorthNorth American Vertical Datum of 1988 (NAVD 88)
6,645
Potentiometric contour—shows elevation at which water level would have stood in tightly cased wells, October 2009. Dashed where approximately located. Contour interval 5 feet. Datum is NAVD 88
Inferred groundwater flow direction and flow path designation
Inferred bedrock subcrop
6,650
"
#
!
MW2444.1
Well identifier and water-level elevation—In feet above NAVD 88
Well flow path designation
§̈¦4 0
Administration wellFenced Up Horse (FUH) well
Trinitrotoluene (TNT) well
Puerco River wellSan Andres-Glorieta well

14 Geochemical Evidence of Groundwater Flow Paths and the Fate and Transport of Constituents of Concern
3. A flow path originating from the saturated alluvial deposits underlying the South Fork of the Puerco River to the north of the study area (fig. 5) and moving southwestward is herein referred to as the “Puerco” flow path and;
4. A fourth source, suspected of originating from a leaking cistern used to store San Andres-Glorieta (SA-G) aquifer water, generates a groundwater mound near MW02 (fig. 5) and flows radially outward, and is thus referred to as the “SA-G” flow path. The hydraulic gradients suggest that the flow paths
may converge in the Administration Area. The area of groundwater discharge cannot be definitively determined, but the topography, underlying geology, and groundwater elevations limit the number of possibilities. In October 2009, TMW25, located west of the Administration area, had the lowest groundwater elevation, indicating that groundwater might move in that direction. However, a south to north-trending bedrock subcrop with an elevation above the local water table has been identified at several discrete locations through a well drilling log (drill logs on file at USACE, Albuquerque, N. Mex.), surface geophysics (Michael Powers, U.S. Geological Survey, written commun., 2010), and direct-push drilling investigations (Fred Gebhardt, U.S. Geological Survey, oral commun., 2010). While the consistency of this subcrop is unknown, the spatial expanse of the evidence from borings and seismic data where it has been identified as well as the presence of a surface lineament of quaternary gravels suggest that it extends through much of the study area.
GeochemistryThe fine-grained material composing the alluvial aquifer
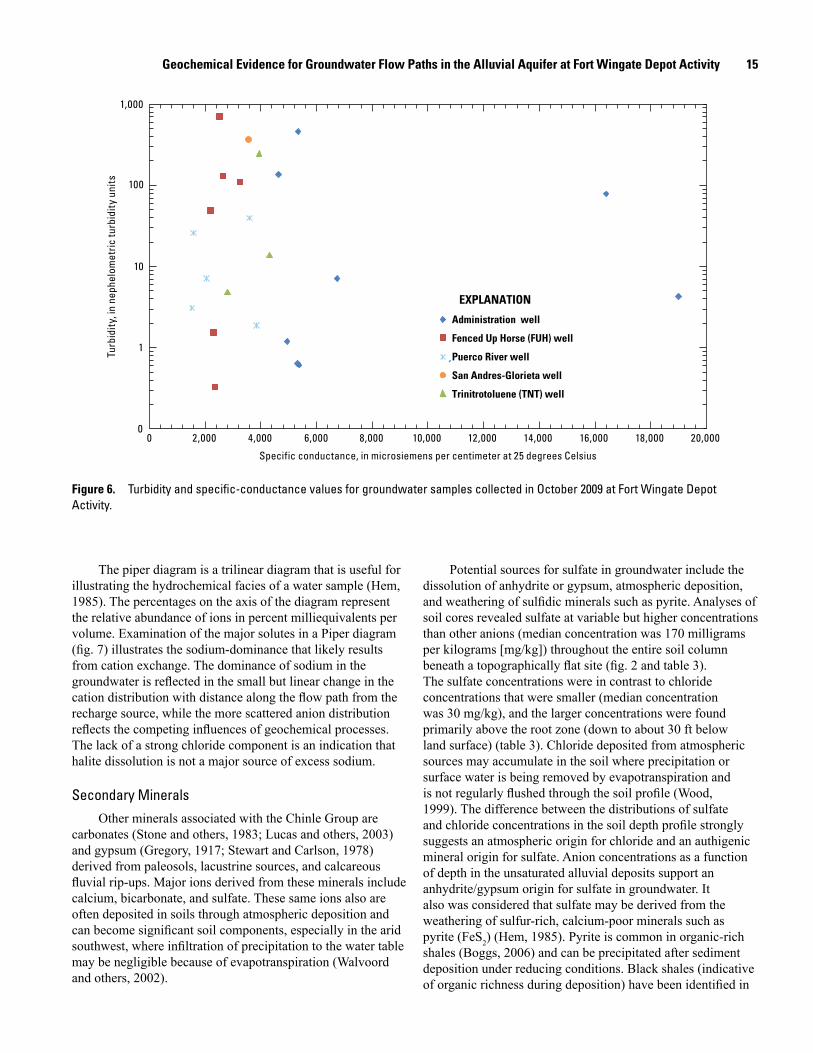
was reflected in the substantial suspended sediment (as inferred by the turbidity values) in the groundwater samples collected in October 2009. The groundwater samples also had dissolved-solids concentrations (as interpreted from specific-conductance values; Hem, 1985)) that varied between some wells by more than an order of magnitude (fig. 6).
The wide range of turbidity values in alluvial groundwater at the Depot reflects the heterogeneous distribution of clays in the aquifer matrices. The silt- and clay-sized grains pass easily through gravel packs and well screens, and increased hydraulic gradients with pumping likely increase sediment suspension and transport. It is common for wells at the Depot to be pumped dry during well purging prior to sample collection, which would substantially alter the local hydraulic gradients. This slow recovery of groundwater levels to pumping stresses in the monitoring wells provides direct evidence of the presence of the fine, low conductivity material composing the aquifer matrix. In addition to occurring as suspended sediment, clay minerals often occur as colloids in natural waters (Brownlow, 1979). This tendency to form colloids is thought to influence the chemical analyses, even
of the filtered samples. Colloids and fine-suspended solids that can pass through a 0.45-micrometer filter and can interfere with the dissolved analytical results by releasing solid-phase species in analytical methods that include an acid preparation (such as for metals) or an acid titration (such as for alkalinity), thereby potentially resulting in laboratory reported concentrations that are higher than actual dissolved concentrations of groundwater in the aquifer.
Clay Mineralogy The siliciclastic clay and mudstones of the Painted
Desert Member, from which the alluvium in the Depot area is derived, are mainly montmorillonitic (Schultz, 1963). Montmorillonite clays have negatively charged aluminosilicate layers that are separated by cations (Jury and others, 1991). This composition and structure of the solid matrix imparts two important chemical interactions, nonconservative and conservative, between the dissolved species in the alluvial groundwater and the aquifer minerals at the Depot. The first interaction involves the nonconservative behavior of cations. Under certain circumstances, the mineral cations can be replaced by aqueous cations in a reaction known as cation exchange. The less complex, single-layer theory of clay chemistry is sufficient to describe the cation exchange in the groundwater system. In the aluminosilicate clays, monovalent cations are preferentially exchanged for divalent cations, and large atomic radii are preferentially exchanged for smaller atomic radii (Berkowitz and others, 2008). Cation exchange also obeys stoichiometry requirements, such that if one divalent cation (for example, Ca2+) was to be adsorbed, two monovalent cations (for example, Na+) would go into solution (Berkowitz and others, 2008). Ion exchange reactions are virtually instantaneous; on the aquifer level, however, the rate-limiting steps include the tortuous path the ion travels between aquifer solids, the dissolution of secondary minerals that contribute to the aqueous cation exchange pool, and the number of mineral binding sites with available cations for exchange. Ion exchange reactions may also influence other reactions within the aquifer. For example, the dissolution of gypsum is driven to the aqueous phase as the calcium ion is exchanged with sodium and becomes bound in the clay layers. This mineral behavior explains the high aqueous sodium concentrations in the alluvial aquifer, as well as the high sulfate associated with gypsum dissolution and high ANC associated with calcite dissolution (tables 1–2 to 1–5 in appendix 1).
The second interaction between groundwater and the clay matrix involves the conservative behavior of anions. The net negative charge on the aluminosilicate layers of clays occurs regardless of pH, but these layers tend to have slightly higher negative charges at neutral and alkaline pHs (Jury and others, 1991). Therefore, the adsorption of negatively charged anions such as sulfate, nitrate, and chloride is usually negligible at the pHs found in the alluvial groundwater (6.9 to 8.0 standard units).
Geochemical Evidence for Groundwater Flow Paths in the Alluvial Aquifer at Fort Wingate Depot Activity 15
The piper diagram is a trilinear diagram that is useful for illustrating the hydrochemical facies of a water sample (Hem, 1985). The percentages on the axis of the diagram represent the relative abundance of ions in percent milliequivalents per volume. Examination of the major solutes in a Piper diagram (fig. 7) illustrates the sodium-dominance that likely results from cation exchange. The dominance of sodium in the groundwater is reflected in the small but linear change in the cation distribution with distance along the flow path from the recharge source, while the more scattered anion distribution reflects the competing influences of geochemical processes. The lack of a strong chloride component is an indication that halite dissolution is not a major source of excess sodium.
Secondary MineralsOther minerals associated with the Chinle Group are
carbonates (Stone and others, 1983; Lucas and others, 2003) and gypsum (Gregory, 1917; Stewart and Carlson, 1978) derived from paleosols, lacustrine sources, and calcareous fluvial rip-ups. Major ions derived from these minerals include calcium, bicarbonate, and sulfate. These same ions also are often deposited in soils through atmospheric deposition and can become significant soil components, especially in the arid southwest, where infiltration of precipitation to the water table may be negligible because of evapotranspiration (Walvoord and others, 2002).
Potential sources for sulfate in groundwater include the dissolution of anhydrite or gypsum, atmospheric deposition, and weathering of sulfidic minerals such as pyrite. Analyses of soil cores revealed sulfate at variable but higher concentrations than other anions (median concentration was 170 milligrams per kilograms [mg/kg]) throughout the entire soil column beneath a topographically flat site (fig. 2 and table 3). The sulfate concentrations were in contrast to chloride concentrations that were smaller (median concentration was 30 mg/kg), and the larger concentrations were found primarily above the root zone (down to about 30 ft below land surface) (table 3). Chloride deposited from atmospheric sources may accumulate in the soil where precipitation or surface water is being removed by evapotranspiration and is not regularly flushed through the soil profile (Wood, 1999). The difference between the distributions of sulfate and chloride concentrations in the soil depth profile strongly suggests an atmospheric origin for chloride and an authigenic mineral origin for sulfate. Anion concentrations as a function of depth in the unsaturated alluvial deposits support an anhydrite/gypsum origin for sulfate in groundwater. It also was considered that sulfate may be derived from the weathering of sulfur-rich, calcium-poor minerals such as pyrite (FeS2) (Hem, 1985). Pyrite is common in organic-rich shales (Boggs, 2006) and can be precipitated after sediment deposition under reducing conditions. Black shales (indicative of organic richness during deposition) have been identified in
0
1
10
100
1,000
0 2,000 4,000 6,000 8,000 10,000 12,000 14,000 16,000 18,000 20,000
Turb
idity
, in
neph
elom
etric
turb
idity
uni
ts
Specific conductance, in microsiemens per centimeter at 25 degrees Celsius
EXPLANATION
Administration well
Fenced Up Horse (FUH) well
Puerco River well
San Andres-Glorieta well
Trinitrotoluene (TNT) well
Figure 6. Turbidity and specific-conductance values for groundwater samples collected in October 2009 at Fort Wingate Depot Activity.

16 Geochemical Evidence of Groundwater Flow Paths and the Fate and Transport of Constituents of Concern
the Bluewater Creek Formation but not in the Petrified Forest Formation (Heckert and Lucas, 2003).
The capacity to neutralize an acid solution may be derived from multiple ionic species and sources. In nearly all natural waters, however, the ANC results from the activity of the carbonate and HCO3 ions (Hem, 1985). In aquifers with neutral or slightly alkaline pH, as is the case with the alluvial aquifer in the study area, the dominant species is bicarbonate. Bicarbonate is primarily added to the groundwater through atmospheric and soil gas inputs (carbon dioxide), although increases in ANC can indicate the weathering of carbonate-rich minerals such as calcite (CaCO3). According to Hem (1985), ANC in most groundwater is somewhat higher than 200 mg/L, and concentrations above 1,000 mg/L may occur in waters that are low in calcium and magnesium. The high ANC
of the alluvial groundwater (400 to 1,600 mg/L as CaCO3; table 1–5 in appendix 1) suggests not only a mineral origin but also reflects the cation exchange of the alluvial clays. The presence of calcite is supported by the consistent presence of effervescent reactions to hydrochloric acid throughout the soil column (Michael Powers, U.S. Geological Survey, written commun., 2010).
The common evaporite halite (NaCl) is not reported to occur in the continental deposits found in and around the Depot. Thus, the natural occurrence of chloride in groundwater at the Depot is considered to be primarily derived from atmospheric deposition. The distribution of the chloride concentrations in the anion soil investigation (table 3) supports that hypothesis. Chloride often is described as a conservative species in many groundwater systems, meaning that
Percent of total ions, in milliequivalents per liter
Calcium
100
80
60
40
20
0
0
20
40
60
80
100
Mag
nesiu
m
0
20
40
60
80
100
Sodium plus potassium
Chloride, fluoride, nitrite plus nitrate
0
20
40
60
80
100
100 80
60 40
20
0
Carb
onat
e plus
Bica
rbon
ate
100
80
60
40
20
0
Sulfate
0
20
40
60
80
100
Sulfa
te pl
us ch
loride
0 20
40 60
80 100
Calcium plus magnesium
100
8
0 6
0 4
0 2
0
0
100 80
60 40
20 0
EXPLANATION
Administration well
Fenced Up Horse (FUH) well
Puerco River well
San Andres-Glorieta well
Trinitrotoluene (TNT) well
Figure 7. Piper diagram showing major ion relations in Fort Wingate Depot Activity groundwater, October 2009.

Geochemical Evidence for Groundwater Flow Paths in the Alluvial Aquifer at Fort Wingate Depot Activity 17
Table 3. Anion concentrations in two soil profiles collected from Fort Wingate Depot Activity.
[ft bls, feet below land surface; mg/kg, milligrams per kilogram; U, undetected]
Depth (ft bls)
Moisture (percent)
Chloride (mg/kg)
Fluoride (mg/kg)
Nitrate (mg/kg)
Sulfate (mg/kg)
Sample 1 taken from site that is well drained and topographically flat
3 8.3 30 3.3 1.0 39
4 3.5 69 3.4 1.4 70
6 4.8 26 2.3 4.3 9.1
7 6.1 21 3.4 7.7 9.1
8 9.8 100 5.4 11 120
10 9.5 130 4.7 6.0 310
11 4.0 72 2.1 2.1 260
12 4.7 180 1.9 3.0 200
14 5.5 240 2.2 5.0 210
15 4.5 170 1.5 6.5 110
16 3.2 92 1.1 7.4 69
18 3.8 66 1.1 9.6 170
19 4.1 56 1.1 9.8 190
20 7.6 100 1.5 19 550
22 5.8 57 1.6 10 270
23 5.8 59 2.0 9.8 170
24 3.6 30 1.2 4.4 110
25 4.0 37 2.3 4.2 160
26 3.5 25 1.5 3.3 92
27 2.6 28 1.3 3.3 77
28 2.2 16 1.3 2.0 54
30 5.8 20 2.8 2.9 120
31 8.5 24 5.2 3.6 240
32 10 31 6.2 4.4 300
33 7.6 18 4.3 2.7 220
34 8.8 18 4.6 2.7 310
35 12 25 4.4 3.8 360
36 5.7 16 2.9 2.1 320
37 5.3 12 2.9 1.4 170
38 3.1 7.5 2.1 0.55 110
39 4.8 14 3.3 0.68 200
42 7.5 26 2.0 3.1 110
44 10 31 3.2 1.2 270
46 8.2 28 5.0 1.3 410
48 14 34 5.6 3.6 690
50 14 22 4.5 5.6 220
52 12 19 4.0 4.8 170
Depth (ft bls)
Moisture (percent)
Chloride (mg/kg)
Fluoride (mg/kg)
Nitrate (mg/kg)
Sulfate (mg/kg)
Sample 2 taken from surface depression that is located along water collection ditch
2 16 3.1 U 19 8.7
3 11 U U U U
4 6.5 U U U U
6 14 U 2.3 U 3.3
7 14 U 2.2 U 11
8 15 U 2.1 0.65 9.8
10 5.2 U U 0.40 1.9
11 10 U 1.5 U 2.2
12 12 U 1.6 U 2.7
13 17 U 2.7 U 14
14 16 U 1.7 U 15
15 3.7 U 1.1 U 4.7
16 5.4 U 1.3 U 6.3
17 7.0 U 1.5 U 5.4
18 6.0 U 0.97 U 3.8
19 7.0 U U U U
20 12 U 1.1 U 4.1
22 7.0 U 1.4 U 11
23 4.1 U U U 7.2
24 3.2 U U U 3.4
25 3.0 U U U 4.4
26 5.3 U 1.2 0.37 12
27 7.9 20 1.8 1.5 21
28 12 4.5 2.5 U 19
29 15 7.8 3.0 0.63 110
30 3.6 4.7 1.2 U 28
31 10 3.4 5.4 0.39 83
32 7.6 2.1 4.1 0.34 140
33 10 U 4.6 U 350
34 5.0 13 3.0 U 230
35 13 2.4 5.2 U 470
36 13 6.6 6.0 U 510
38 5.2 5.4 4.8 U 360
40 12 7.1 4.7 U 600
42 10 8.3 4.1 U 550
44 7.2 7.7 3.1 U 320
46 21 31 5.3 0.66 800
48 17 31 4.2 0.55 370

18 Geochemical Evidence of Groundwater Flow Paths and the Fate and Transport of Constituents of Concern
aqueous chloride typically is not added to or removed from groundwater through water-rock interactions. The high clay content of the alluvial aquifer and the conservative behavior of anions to the clays support this assumption. Because of the atmospheric origin of chloride and its conservative nature, aqueous chloride in groundwater that is isolated from any recharge, flow path mixing, or evapotranspiration is expected to remain at a constant concentration as it moves along a flow path.
Geochemical Evidence of Groundwater Recharge Sources
While the mechanisms of groundwater recharge at the Depot are beyond the scope of this report, the likely origins of groundwater flow to the study area for use as geochemical end-members were initially identified by analyzing groundwater elevations in the context of surficial and topographic features. Groundwater in wells with higher groundwater elevations flows to the downgradient wells (fig. 5) given the geologic constraints of bedrock outcrops (fig. 3). Based on the groundwater elevations and the surrounding outcrops that may allow for hill-front recharge, TMW01 appears to be located near the source of water entering the alluvium and moving north along the TNT flow path, TMW11 appears to be located near the source of water entering the study area and moving northeast along the FUH flow path, and MW02 appears to be located near the source of water entering the alluvium and moving radially outward along the SA-G flow path. Because wells TMW01, TMW11, and MW02 appear to be nearest to the origins of their respective flow paths, groundwater chemical data from these wells were used as flow-path end members for the chemical composition of groundwater. While TMW28 appears to be located nearest to the primary source of recharge for the Puerco flow path, limited chemical data prohibit examination of this well as an end member.
The isotopic composition (δ2H and δ18O) of groundwater collected from the alluvial aquifer was analyzed to spatially and temporally constrain likely sources of groundwater recharge across the Depot. The variation in isotopic composition of precipitation may allow discrimination of recharge sources because of the mass-dependent fractionation of the isotopes that result from temperature changes during the formation of precipitation and during evaporation prior to infiltration into the aquifer (Genereux and Hooper, 1998; Ingraham, 1998). This mass-dependent fractionation results because the various isotopic forms of water have different vapor pressures and freezing points. Thus, precipitation associated with warmer temperatures contains a greater amount of heavier isotopes than precipitation associated with cooler temperatures. Groundwater δ2H and δ18O values at the Depot generally plot below (to the right of) the global meteoric water line (GMWL) (Craig, 1961) (fig. 8). The overall isotopic trend has a reduced slope compared to the
GMWL, typical of the arid and semi-arid Southwestern United States climate where there is a large evaporation component to the water budget (Friedman and others, 1992; Kendall, 2001).
Deuterium values in the alluvial aquifer ranged from (-107 to -74.1 ‰) and oxygen-18 ranged from (-14.4 to -9.6 ‰) (table 1–11 in appendix 1). The wide range of δ2H and δ18O values in the alluvial groundwater (fig. 8) indicates substantial differences in the isotopic composition of recharge water entering the alluvial aquifer. Groundwater sampled from the production well (completed in the San Andres-Glorieta aquifer) was isotopically the lightest of the groundwater samples (fig. 8) and is used for end-member contribution calculations. The lighter isotopic composition of the production well water may reflect recharge during a paleoclimate that was cooler thousands of years ago or be attributed to precipitation that recharged the San Andres-Glorieta aquifer in the higher elevations of the Zuni Mountains where these formations are exposed (figs. 1 and 3). Storms moving across the region are pushed upward by Zuni Mountain orographic effects, which causes cooling and increases the lighter isotopic fraction in precipitation (Coplen and others, 2000).
Based on the lighter isotopic values compared to other groundwater samples, leakage from the cistern containing water from the San Andres-Glorieta aquifer (SA-G flow path) appears to be influencing wells MW01, MW02, MW03, MW22D, and TMW10 (fig. 8). The groundwater mound formed around the leaking cistern may allow San Andres-Glorieta water to mix radially outward with the alluvial aquifer water at locations having a lower groundwater elevation. As indicated by the potentiometric surface (fig. 5), the influence of water leaking from the cistern could extend southward to TMW07, eastward to TMW24, northward to TMW10, and westward to MW20 (wells that are in and around the main buildings of the Administration Area). Groundwater from wells with δ2H and δ18O values greater than -85‰ and -11‰, respectively, are not considered to be influenced by water from the leaking cistern as the location of wells such as TMW13 and TMW29 near these values are not hydraulically within the SA-G flow path.
The contribution of San Andres-Glorieta water to the groundwater in wells that appear to be influenced by this isotopically light water (wells MW01, MW02, MW03, MW22D, and TMW10) was estimated by inserting the isotope composition in the mixing equation 2 (table 4). Median isotope values were determined for groundwater from wells considered not to be influenced by water from the leaking cistern or from the South Fork of the Puerco River alluvial basin. The range of values considered (graphically most wells between TMW01 and TMW21 on fig. 8) represents the TNT and FUH flow paths along with any local recharge in the Administration Area. The median isotope values for δ2H and δ18O in wells MW18D, MW22S, TMW01, TMW03, TMW04, TMW06, TMW07, TMW08, TMW11, TMW13, TMW15, TMW21, TMW22, TMW23, TMW25, TMW29 were calculated to be -81.95‰ and -10.64‰, respectively.
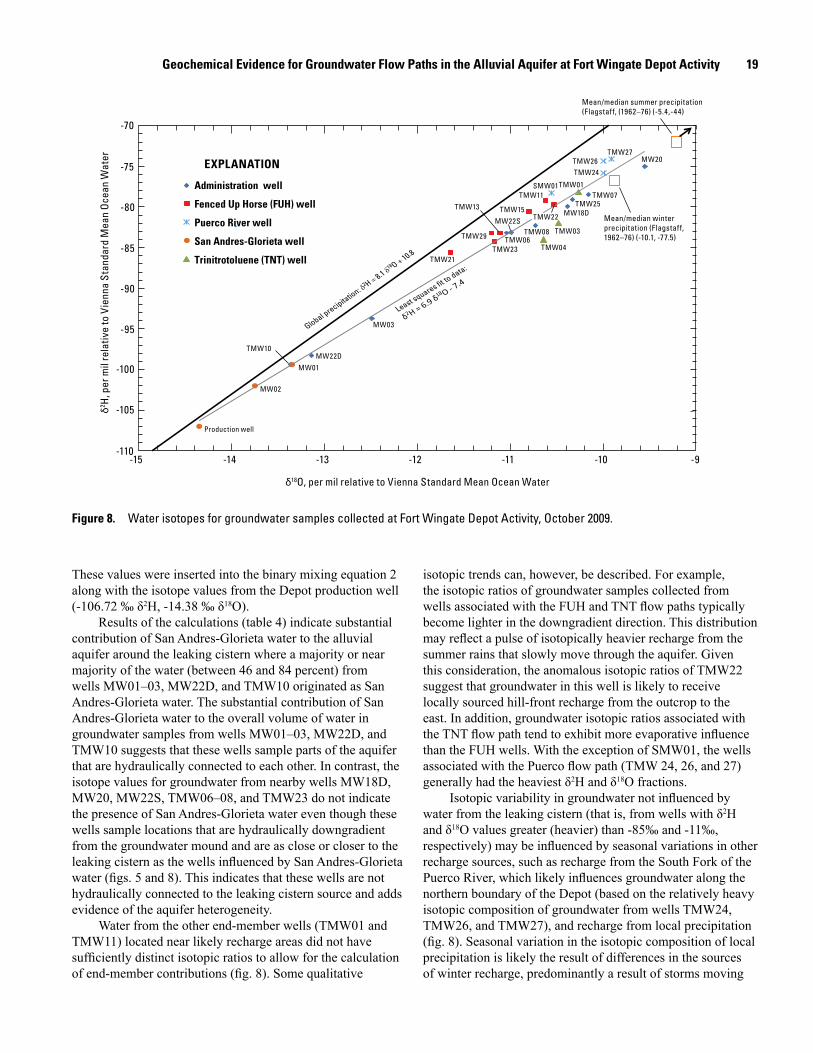
Geochemical Evidence for Groundwater Flow Paths in the Alluvial Aquifer at Fort Wingate Depot Activity 19
These values were inserted into the binary mixing equation 2 along with the isotope values from the Depot production well (-106.72 ‰ δ2H, -14.38 ‰ δ18O).
Results of the calculations (table 4) indicate substantial contribution of San Andres-Glorieta water to the alluvial aquifer around the leaking cistern where a majority or near majority of the water (between 46 and 84 percent) from wells MW01–03, MW22D, and TMW10 originated as San Andres-Glorieta water. The substantial contribution of San Andres-Glorieta water to the overall volume of water in groundwater samples from wells MW01–03, MW22D, and TMW10 suggests that these wells sample parts of the aquifer that are hydraulically connected to each other. In contrast, the isotope values for groundwater from nearby wells MW18D, MW20, MW22S, TMW06–08, and TMW23 do not indicate the presence of San Andres-Glorieta water even though these wells sample locations that are hydraulically downgradient from the groundwater mound and are as close or closer to the leaking cistern as the wells influenced by San Andres-Glorieta water (figs. 5 and 8). This indicates that these wells are not hydraulically connected to the leaking cistern source and adds evidence of the aquifer heterogeneity.
Water from the other end-member wells (TMW01 and TMW11) located near likely recharge areas did not have sufficiently distinct isotopic ratios to allow for the calculation of end-member contributions (fig. 8). Some qualitative
isotopic trends can, however, be described. For example, the isotopic ratios of groundwater samples collected from wells associated with the FUH and TNT flow paths typically become lighter in the downgradient direction. This distribution may reflect a pulse of isotopically heavier recharge from the summer rains that slowly move through the aquifer. Given this consideration, the anomalous isotopic ratios of TMW22 suggest that groundwater in this well is likely to receive locally sourced hill-front recharge from the outcrop to the east. In addition, groundwater isotopic ratios associated with the TNT flow path tend to exhibit more evaporative influence than the FUH wells. With the exception of SMW01, the wells associated with the Puerco flow path (TMW 24, 26, and 27) generally had the heaviest δ2H and δ18O fractions.
Isotopic variability in groundwater not influenced by water from the leaking cistern (that is, from wells with δ2H and δ18O values greater (heavier) than -85‰ and -11‰, respectively) may be influenced by seasonal variations in other recharge sources, such as recharge from the South Fork of the Puerco River, which likely influences groundwater along the northern boundary of the Depot (based on the relatively heavy isotopic composition of groundwater from wells TMW24, TMW26, and TMW27), and recharge from local precipitation (fig. 8). Seasonal variation in the isotopic composition of local precipitation is likely the result of differences in the sources of winter recharge, predominantly a result of storms moving
TMW10MW22D
MW03
MW22STMW08
TMW25
MW20
MW18D
TMW06
TMW07
TMW22
TMW21
TMW13
TMW29
TMW15
TMW11
TMW23 TMW04
TMW01
TMW03
TMW24
TMW27TMW26
SMW01
MW02
MW01
Production well
-110
-105
-100
-95
-90
-85
-80
-75
-70
-15 -14 -13 -12 -11 -10 -9
δ2 H, p
er m
il re
lativ
e to
Vie
nna
Stan
dard
Mea
n O
cean
Wat
er
δ18O, per mil relative to Vienna Standard Mean Ocean Water
EXPLANATION
Mean/median winter precipitation (Flagstaff, 1962–76) (-10.1, -77.5)
Mean/median summer precipitation(Flagstaff, (1962–76) (-5.4,-44)
Administration well
Fenced Up Horse (FUH) well
Puerco River well
San Andres-Glorieta well
Trinitrotoluene (TNT) well
Figure 8. Water isotopes for groundwater samples collected at Fort Wingate Depot Activity, October 2009.

20 Geochemical Evidence of Groundwater Flow Paths and the Fate and Transport of Constituents of Concern
into the area from the Pacific Coast, and summer recharge, a result of thunderstorms predominately from moisture driven northward from the Gulf of California and the Gulf of Mexico (Southwest Climate Change Network, 2010). Oceans differ in their isotopic composition by latitude. Precipitation derived from ocean water originating closer to the poles is isotopically lighter than precipitation derived from the ocean water originating at lower elevations such as the Gulf of Mexico (Schmidt and others, 1999; Coplen and others, 2000; Hoefs, 2009).
A weather station site in Flagstaff, Arizona (about 170 mi west of the Depot), has a precipitation isotopic composition data set from 1962 to 1976 that illustrates seasonality in the isotopic composition of precipitation falling in the region. For this report, the Flagstaff precipitation data were divided between precipitation occurring in winter (November through April) and precipitation occurring in summer (May through October). Each subset of data contained
a large range of values, but the mean (-77.4 and -9.9 for winter and -43.9 and -5.2 for summer of δ2H and δ18O values, respectively) and median (-77.5 and -10.3 for winter and -44.0 and -5.5 for summer of δ2H and δ18O values, respectively) within each data subset were nearly identical, indicating normally distributed data. The mean seasonal precipitation isotopic values for the Flagstaff data are distinct from each other, although the Flagstaff data are substantially heavier in isotopic composition than the Depot’s groundwater data (fig. 8). This difference in isotopic composition between the Flagstaff precipitation and the Depot groundwater may be because of the size and dates of samples or a real physical effect such as the rainout effect (Rayleigh distillation fractionation), where precipitation from the Pacific Ocean becomes isotopically lighter with rainout from a storm system (Clark and Fritz, 1997; Kendall, 2001). The presence of a seasonal isotopic signal in the Flagstaff precipitation data helps to illustrate one likely cause of the variability in isotopic ratios in alluvial groundwater believed to result from local recharge that is unaffected by mixing with water leaking from the production-well cistern or infiltrating from the South Fork of the Puerco River.
Geochemical Evidence for Delineation of Groundwater Flow Paths
Groundwater flow paths at the Depot were initially delineated on the basis of groundwater elevations and on likely groundwater recharge and discharge areas. Groundwater flow paths are further delineated through interpretation of the conservative and nonconservative behavior of major elements (major ions consisting of the cations of calcium and sodium, and the anions of bicarbonate, sulfate, and chloride).
Sodium was the dominant cation in the alluvial groundwater in October 2009 (fig. 9). Sodium concentrations trend linearly with DS concentrations (linear r2 equals 0.90, p less than 0.0001) between wells and consistently comprise about 30 percent of the DS concentrations.
As suggested by the clay mineralogy, sodium may be used as a nonconservative indicator of the relative position of a well along a flow path. Samples with large sodium concentrations indicate longer time in contact with aquifer minerals and a position farther along the flow path. Conversely, samples with low sodium concentrations may be considered to be closer to the groundwater recharge source, having less time in contact with the solid matrices. Given the preferential divalent cation binding with the clays, a decrease in sodium concentrations along a flow path indicates mixing with a groundwater or recharge source with lower sodium concentrations. Saturation indices (table 5) show that halite is undersaturated in the alluvial groundwater, and thus, loss of sodium (and chloride) to precipitation reactions is unlikely. There are no other minerals that are thought to remove a substantial mass of sodium from solution as a precipitate.
Table 4. Calculated fractional contributions of local recharge and San Andres-Glorieta aquifer water to groundwater found in monitoring wells influenced by water from the leaking cistern at Fort Wingate Depot Activity.
[Median isotope values (δ2H of -81.95‰ and δ18O of -10.64‰) of local recharge (wells MW18D, MW22S, TMW01, TMW03, TMW04, TMW06, TMW07, TMW08, TMW11, TMW13, TMW15, TMW21, TMW22, TMW23, TMW25, TMW29) and individual isotope values (δ2H of -107.0‰ and δ18O of -14.35‰) from the Depot production well (San Andres-Glorieta aquifer) were used as end-members to determine fractional contributions of the resulting mixture that is water influenced by the leaking cistern in the Administration Area]
Well and modeled
constituent
Local recharge signal fractional
contribution
San Andres-Glorieta signal fractional
contributionWell MW01
δ2H of water 0.31 0.69
δ18O of water 0.27 0.73
Well MW02
δ2H of water 0.20 0.80
δ18O of water 0.16 0.84
Well MW03
δ2H of water 0.54 0.46
δ18O of water 0.51 0.49
Well MW22D
δ2H of water 0.35 0.65
δ18O of water 0.33 0.67
Well TMW10
δ2H of water 0.31 0.69
δ18O of water 0.27 0.73

Geochemical Evidence for Groundwater Flow Paths in the Alluvial Aquifer at Fort Wingate Depot Activity 21
The atmospheric deposition model for the origin of chloride and the conservative behavior of chloride in groundwater, described in the “Geochemistry” section, predicts relatively constant chloride concentrations along a flow path that is isolated from recharge or other flow-path mixing. When compared with DS concentrations (table 1–1 in appendix 1), which tend to increase with distance away from a potentiometric high, there is a poor linear relation (linear r2 equals 0.30) between chloride and DS concentrations. The linear correlation is stronger between major ions and dissolved solids when the groundwater samples from three wells (MW18D, TMW08, and MW20) with DS concentrations of greater than 5,000 mg/L are included, but their inclusion biases the data set with high leverage (Helsel and Hirsch, 2002). This lack of a linear relation indicates that increases in DS concentrations along a flow path, which result from rock-water interactions, do not have a substantial effect on chloride concentrations. Changes in chloride concentrations along a hydraulic gradient might be considered an indication of mixing with groundwater or recharge that has substantially different chloride concentrations.
As shown in figure 10, atmospheric deposition weight ratios from surrounding monitoring stations (National Atmospheric Deposition Program, 2009; U.S. Environmental Protection Agency, 2009) show a nearly 1:1 ratio between Na:Cl concentrations. However, sodium concentrations in the alluvial groundwater are consistently higher than chloride
concentrations, offering strong support for the origin of the two ions and their relation in the groundwater.
Hydraulic gradients and end-member wells were compared with sodium and chloride concentrations to identify the wells that were associated with each general flow path defined in the “Hydrogeology” section of this report (fig. 10). The October 2009 sodium and chloride concentrations generally followed expected patterns based on geochemical processes previously discussed, with sodium increasing in the downgradient direction as a likely result of cation exchange, while chloride remained relatively constant. Wells in the southern part of the study area were identified as belonging to the FUH or the TNT flow path based upon isotopic and chemical composition. The sodium and chloride concentrations suggest that the majority of the wells south of the Administration Area belong to the FUH flow path. The FUH influence extends north to well TMW21 (near the structures of the Administration Area) and northeast to well TMW23. The sodium and chloride concentrations in well TMW23 indicate the mixing of groundwater associated with the TNT and FUH flow paths. As suggested by the isotopic ratios of groundwater from well TMW22, the sodium and chloride ratios also indicate that some hill-front recharge probably occurs at the outcrop along the eastern margin of the study area. A necessary requirement for the flow paths in the south to establish themselves as described is that a substantially larger volume of water has to enter
0
MW
01M
W02
MW
03
MW
20M
W22
DM
W22
SSM
W01
TMW
01TM
W03
TMW
04TM
W06
TMW
07TM
W08
TMW
10TM
W11
TMW
13TM
W15
TMW
21TM
W22
TMW
23TM
W24
TMW
25TM
W26
TMW
27TM
W28
TMW
29
MW
18D
1,000
2,000
3,000
4,000
5,000
6,000Co
ncen
trat
ion,
in m
illig
ram
s pe
r lite
r (m
g/L)
Well identifier
Sodium
Calcium
Magnesium
Potassium
Total dissolved solids (TDS)
EXPLANATIONTDS in MW20 = 14,000 (mg/L) TDS in MW08 = 12,000 (mg/L)
Figure 9. Dissolved-cation distribution in the Fort Wingate Depot Activity alluvial groundwater, October 2009.

22 Geochemical Evidence of Groundwater Flow Paths and the Fate and Transport of Constituents of Concern
the groundwater system from the FUH recharge area than from the TNT recharge area. This requirement is considered reasonable given that the TNT flow path receives local hill-front recharge from a small area (approximately 165 acres, based on a polygon constructed in a geospatial software package to delineate the watershed), and the FUH flow path has a similar area for focused recharge but includes an arroyo draining approximately 7,360 acres and contains several small diversion ditches.
Groundwater from many of the wells in and around the main buildings in the Administration Area do not appear to
have identifiable chemical or isotopic trends with any one of the four general flow paths (and corresponding recharge areas) defined in the “Hydrogeology” section. The Administration (Admin) wells had the highest sodium concentrations, and many had the highest chloride concentrations (fig. 10). While the isotopic signatures of five wells (MW01, MW02, MW03, MW22D, and TMW10) (table 4) in the vicinity of the production well demonstrated a large SA-G component, the major ion concentrations in only the two wells closest to the cistern (MW01 and MW02) were easily distinguished as having been substantially influenced by the SA-G source
Table 5. Saturation indices for common minerals and partial pressures of dissolved gasses in the alluvial groundwater from Fort Wingate Depot Activity monitoring wells.
[Saturation indices reported as the log of the ratio of the ion activity product and the solubility product; and calculated log of partial pressure of carbon dioxide (pCO2) and oxygen (pO2) in atmospheres (atm). Species listed with name and chemical formula, negative values (undersaturated) denoted by bold, parenthesis; --, no dissolved oxygen data available]
Site designation
Anhydrite (CaSO4)
Gypsum (CaSO4:2H2O)
Calcite (CaCO3)
Dolomite CaMg(CO3)2
Halite (NaCl)
log pO2 (atm)
log pCO2 (atm)
MW01 (1.67) (1.43) 0.16 0.00 (6.10) (1.22) (1.69)
MW02 (0.86) (0.62) 0.37 0.27 (7.04) (1.17) (1.18)
MW03 (1.13) (0.88) 0.19 (0.12) (5.40) (1.51) (1.35)
MW18D (1.22) (1.00) 0.13 0.07 (4.65) -- (0.79)
MW20 (0.23) 0.02 0.43 0.42 (3.59) (1.61) (0.90)
MW22D (1.15) (0.90) 0.22 (0.07) (5.21) (1.74) (1.46)
MW22S (1.05) (0.81) 0.60 0.78 (5.11) (0.93) (1.45)
SMW01 (2.06) (1.80) 0.10 (0.11) (5.85) (1.61) (1.99)
TMW01 (1.12) (0.87) 0.45 0.41 (5.63) (1.22) (2.07)
TMW03 (1.45) (1.20) 0.26 0.14 (5.45) (1.34) (2.17)
TMW04 (1.59) (1.34) 0.16 (0.16) (5.50) (1.29) (2.37)
TMW06 (1.39) (1.14) 0.35 0.35 (5.43) (1.47) (1.51)
TMW07 (1.16) (0.91) 0.49 0.50 (5.28) (1.11) (2.00)
TMW08 (0.44) (0.20) 0.48 0.65 (3.93) (1.56) (1.56)
TMW10 (1.44) (1.19) 0.23 0.19 (4.97) (2.91) (1.86)
TMW11 (2.36) (2.12) 0.40 0.37 (6.15) (1.25) (2.00)
TMW13 (1.97) (1.72) 0.11 (0.31) (6.03) (1.48) (1.61)
TMW15 (2.31) (2.06) 0.01 (0.43) (6.12) (1.44) (1.68)
TMW21 (1.70) (1.45) 0.33 0.28 (6.18) (1.78) (1.85)
TMW22 (1.16) (0.91) 0.86 1.36 (5.58) (2.33) (1.90)
TMW23 (1.55) (1.30) 0.50 0.53 (5.79) (2.10) (1.93)
TMW24 (1.89) (1.65) 0.52 0.80 (5.17) (1.32) (1.84)
TMW25 (1.39) (1.17) (0.05) (0.42) (5.40) -- (1.04)
TMW26 (2.01) (1.76) 0.28 0.39 (5.31) (1.69) (2.07)
TMW27 (2.33) (2.08) 0.23 0.09 (6.00) (1.66) (2.04)
TMW29 (1.50) (1.24) 0.73 1.08 (6.01) (1.06) (2.03)

Geochemical Evidence for Groundwater Flow Paths in the Alluvial Aquifer at Fort Wingate Depot Activity 23
(fig. 10). This is likely because of the large differences in DS concentrations between the Admin wells and the SA-G groundwater. Two Admin wells (MW20 and TMW08) are classified as saline, with DS concentrations greater than 10,000 mg/L (Freeze and Cherry, 1979), and the rest of the Admin wells (except TMW25) are considered brackish, with DS concentrations between 3,000 and 10,000 mg/L (fig. 9). Based on the regional use of the San Andres-Glorieta aquifer as a drinking-water supply and the DS concentration of MW02 (a well with substantial influence by the SA-G source) (1,800 mg/L), it is reasonable to assume that the San Andres-Glorieta water would be classified as fresh with DS concentrations under 1,000 mg/L. A possible explanation for the high ion concentrations in the Admin wells is that groundwater was discharged near this area through transpiration. Transpiration by phreatophytes would remove groundwater while leaving most of the solutes in the aquifer. This discharge mechanism does not affect the fractionation of stable isotopes thus preserving their predischarge ratios. While the administration area is not heavily vegetated, there are some large trees for landscaping, and riparian phreatophytes are present just north toward the South Fork of the Puerco River. The depths to water in many of the Admin wells are around 40 ft and decrease to the north near the South Fork of the Puerco River. For example, groundwater in MW18D was 40.98 ft bls,
TMW10 was 34.91 ft bls, and TMW26 was 24.02 ft bls in October 2009. These depths make the resource available to both upland vegetation and riparian phreatophytes.
The sodium and chloride concentrations from wells considered to be in the Puerco flow path, as identified by the hydrogeology and isotopes, suggest that TMW24 and TMW26 also may have a major ion transpiration signal as suggested for the Admin wells above. It does not appear that the wells west of the Admin wells (TMW27 and SMW01) have the same magnitude of influence.
Sulfate and bicarbonate were the dominant anions in the alluvial groundwater in October 2009 (fig. 7). Sulfate concentrations trend linearly (linear r2 equals 0.87, p less than 0.0001) with DS concentrations between wells and as such, aqueous sulfate concentrations may, along with sodium, reflect the relative position of a well along a groundwater flow path. Decreases in sulfate concentrations along a flow path are considered to result from dilution through mixing with groundwater having lower sulfate concentrations. Other mechanisms for decreases in sulfate concentrations were considered, such as the loss of sulfate through precipitation reactions or reduction to hydrogen sulfide (H2S). However, the minerals anhydrite and gypsum were calculated to be undersaturated in all but one well (MW20) (table 5), indicating that sulfate is unlikely to be lost from solution through mineral
MW03
MW22D
MW22S
TMW10
MW18D
TMW25
TMW06
TMW07
TMW08 (4,090 mg/L, 1,700 mg/L)MW20 (4,240 mg/L, 3,600 mg/L)
TMW11
TMW13TMW15
TMW21
TMW22
TMW23TMW29
SMW01
TMW24
TMW26
TMW27
TMW01TMW03TMW04
MW02MW01
0
100
200
300
400
500
600
700
0 500 1,000 1,500 2,000
Chlo
ride
conc
entr
atio
n, in
mill
igra
ms
per l
iter (
mg/
L)
Sodium concentration, in milligrams per liter (mg/L)
EXPLANATION
Atm deposition, Atmospheric Deposition - the percent weight ratio per unit wet and dry deposition from the Clean Air Status and Trends Network (CASTNET) and the National Atmospheric Deposition Program (NADP) network stations: Grand Canyon National Park-Hopi Point, Arizona; Canyonlands National Park, Utah; Petrified Forest National Park, Arizona; and Mesa Verde National Park, Colorado.
Line
repr
esen
ting
1:1 ra
tio
of c
hlor
ide
to so
dium
Administration well
Atm deposition
Fenced Up Horse (FUH) well
Puerco River well
San Andres-Glorieta well
Trinitrotoluene (TNT) well
MW20 and TMW08 do not fall in the plotted area, the actual point is off in the direction of the arrow.
Figure 10. Sodium and chloride relations in the Fort Wingate Depot Activity alluvial aquifer, October 2009.
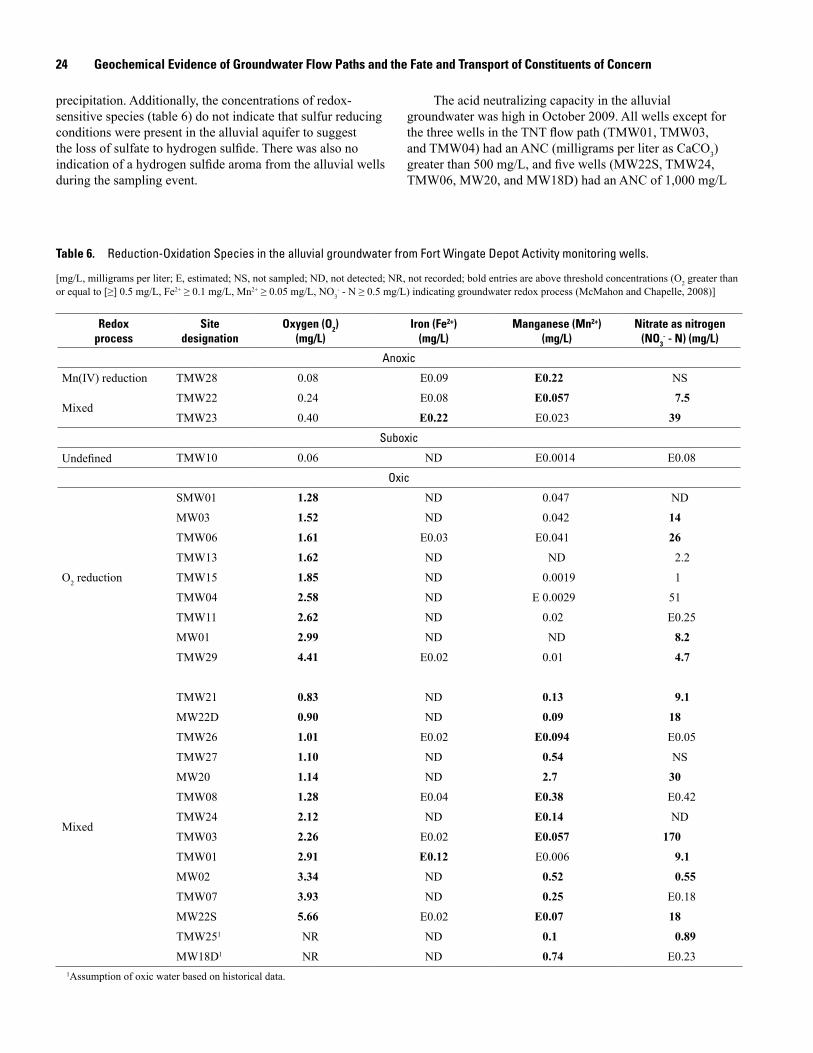
24 Geochemical Evidence of Groundwater Flow Paths and the Fate and Transport of Constituents of Concern
precipitation. Additionally, the concentrations of redox-sensitive species (table 6) do not indicate that sulfur reducing conditions were present in the alluvial aquifer to suggest the loss of sulfate to hydrogen sulfide. There was also no indication of a hydrogen sulfide aroma from the alluvial wells during the sampling event.
The acid neutralizing capacity in the alluvial groundwater was high in October 2009. All wells except for the three wells in the TNT flow path (TMW01, TMW03, and TMW04) had an ANC (milligrams per liter as CaCO3) greater than 500 mg/L, and five wells (MW22S, TMW24, TMW06, MW20, and MW18D) had an ANC of 1,000 mg/L
Table 6. Reduction-Oxidation Species in the alluvial groundwater from Fort Wingate Depot Activity monitoring wells.
[mg/L, milligrams per liter; E, estimated; NS, not sampled; ND, not detected; NR, not recorded; bold entries are above threshold concentrations (O2 greater than or equal to [≥] 0.5 mg/L, Fe2+ ≥ 0.1 mg/L, Mn2+ ≥ 0.05 mg/L, NO3
- - N ≥ 0.5 mg/L) indicating groundwater redox process (McMahon and Chapelle, 2008)]
Redox process
Site designation
Oxygen (O2) (mg/L)
Iron (Fe2+) (mg/L)
Manganese (Mn2+) (mg/L)
Nitrate as nitrogen (NO3
- - N) (mg/L)
Anoxic
Mn(IV) reduction TMW28 0.08 E0.09 E0.22 NS
MixedTMW22 0.24 E0.08 E0.057 7.5
TMW23 0.40 E0.22 E0.023 39
Suboxic
Undefined TMW10 0.06 ND E0.0014 E0.08
Oxic
O2 reduction
SMW01 1.28 ND 0.047 ND
MW03 1.52 ND 0.042 14
TMW06 1.61 E0.03 E0.041 26
TMW13 1.62 ND ND 2.2
TMW15 1.85 ND 0.0019 1
TMW04 2.58 ND E 0.0029 51
TMW11 2.62 ND 0.02 E0.25
MW01 2.99 ND ND 8.2
TMW29 4.41 E0.02 0.01 4.7
Mixed
TMW21 0.83 ND 0.13 9.1
MW22D 0.90 ND 0.09 18
TMW26 1.01 E0.02 E0.094 E0.05
TMW27 1.10 ND 0.54 NS
MW20 1.14 ND 2.7 30
TMW08 1.28 E0.04 E0.38 E0.42
TMW24 2.12 ND E0.14 ND
TMW03 2.26 E0.02 E0.057 170
TMW01 2.91 E0.12 E0.006 9.1
MW02 3.34 ND 0.52 0.55
TMW07 3.93 ND 0.25 E0.18
MW22S 5.66 E0.02 E0.07 18
TMW251 NR ND 0.1 0.89
MW18D1 NR ND 0.74 E0.231Assumption of oxic water based on historical data.

Geochemical Evidence for the Fate and Transport of Constituents of Concern 25
or greater (table 1–5 in appendix 1). One consequence of cation exchange is a decrease in possible bicarbonate losses to mineral precipitation through the “common ion effect” (Langmuir, 1997). Because cation exchange binds the aqueous calcium that is produced from carbonate dissolution to the clay minerals, calcium is not available to bind with bicarbonate and precipitate out of solution, thus preserving high alkalinity. Over all, the ANC varied relatively little from well to well (17 out of 26 wells were between 700 and 1,000 mg/L), especially within designated flow paths. Unlike chloride, the relatively constant ANC along flow paths appears to be the result of the equilibrium condition between calcite and the aqueous species. According to the saturation indices (table 5), groundwater from all the wells is near equilibrium or slightly oversaturated with respect to calcite.
While bicarbonate was the most prevalent anion (as moles per liter) in most of the wells in October 2009, sulfate was responsible for the majority of negative charge balance in the groundwater samples (as milliequivalents per liter). A linear trend is evident between the molar ratio of sulfate to the ANC (as moles of HCO3) and the moles of sodium (fig. 11). In general, this trend is observed because of increasing sulfate (from gypsum dissolution) and sodium concentrations (from cation exchange) along the flow path and relatively stable ANC values. Water from several wells that deviated from this trend typically had anomalous ANC values compared to most of the groundwater sampled in the study area. MW18D had the highest ANC among the groundwater samples, followed closely by MW20 (fig. 11). MW18D and MW20 are located near the former gas station and maintenance buildings in the Administration Area, and these wells regularly have organic compounds detected in groundwater samples. This source of carbon may be responsible for the particularly high ANC values. (The final product of the biodegradation of many organic materials is carbon dioxide and methane.) Groundwater from wells with high molar SO4:HCO3 ratios include TMW07 and the three TNT wells (TMW01, TMW03, and TMW04). TMW07 typically displays anomalous chemical behavior, and the hydraulic head fluctuates more between quarterly measurements than in nearby wells and, thus, no conclusions are drawn from the observed ion concentrations. The three TNT flow-path wells (TMW01, TMW03, and TMW04) have low ANC relative to the other wells screened in the alluvium. One possible influence is the evaporative effect suggested by the isotopic data, where bicarbonate may be lost preferentially to calcite precipitation as water is evaporated. MW02, which has a high molar SO4:HCO3 ratio relative to the sodium concentration, is located near the production well, and groundwater from this well likely has relatively small sodium concentrations as a result of a large calcium input from San Andres-Glorieta water.
The groundwater major ion compositions and relations support and further delineate the flow-path designations. They also suggest areas where flow paths mix and converge as well as highlight the heterogeneity of the alluvial matrix. The Admin wells, those in and around the main buildings of
the Administration Area, have chemical signatures that are difficult to associate with any one flow path defined in the “Hydrogeology” section. The hydraulic gradients and high DS concentrations in groundwater samples from the Admin wells suggest that the flow paths may converge in that area, and there is likely a partial withdrawal of water through transpiration.
An important consideration regarding the observed distribution of chemical constituents in groundwater of the Depot area is that the 2009 potentiometric surface does not reflect the influence of recharge from the explosive washout operations described in “Description of the Study Area.” It is likely that some of the TNT leachate recharged the aquifer, affecting local hydraulic gradients and extending the hydrologic influence of the TNT flow path far beyond the area of influence implied by recent observations. As such, some of the constituents in the October 2009 groundwater samples may be relicts of this earlier flow regime, and the potentiometric surface may still be adjusting to the loss of this temporary TNT leachate recharge.
Geochemical Evidence for the Fate and Transport of Constituents of Concern
The fate and transport of the constituents of concern found in groundwater in the alluvial aquifer are dependent on the nature and properties of the constituent, the location of the source of the constituent with respect to the groundwater flow paths, the mixing of groundwater along these flow paths, and the pH and redox conditions present. This section introduces the nature and properties of the constituents and the locations of their suspected source(s) with respect to flow paths and then describes the conditions in the aquifer that may or may not support degradation.
Constituent Source and Transport
ExplosivesExplosive compounds, primarily RDX and TNT, are
reported to have been released to the environment from the washout operations at the TNT leaching beds (fig. 2) (PMC Environmental, 2001). These explosive compounds and their degradation products have been detected primarily in the wells associated with the TNT flow path and closest to the TNT leaching beds, but the concentrations and spatial distribution of the species vary because of differences in their chemical nature.
TNT was not detected in any of the alluvial wells sampled in October 2009 (table 1–6 in appendix 1). Historically, TNT has only been detected in TNT flow-path wells TMW03 and TMW04 and in the downgradient FUH
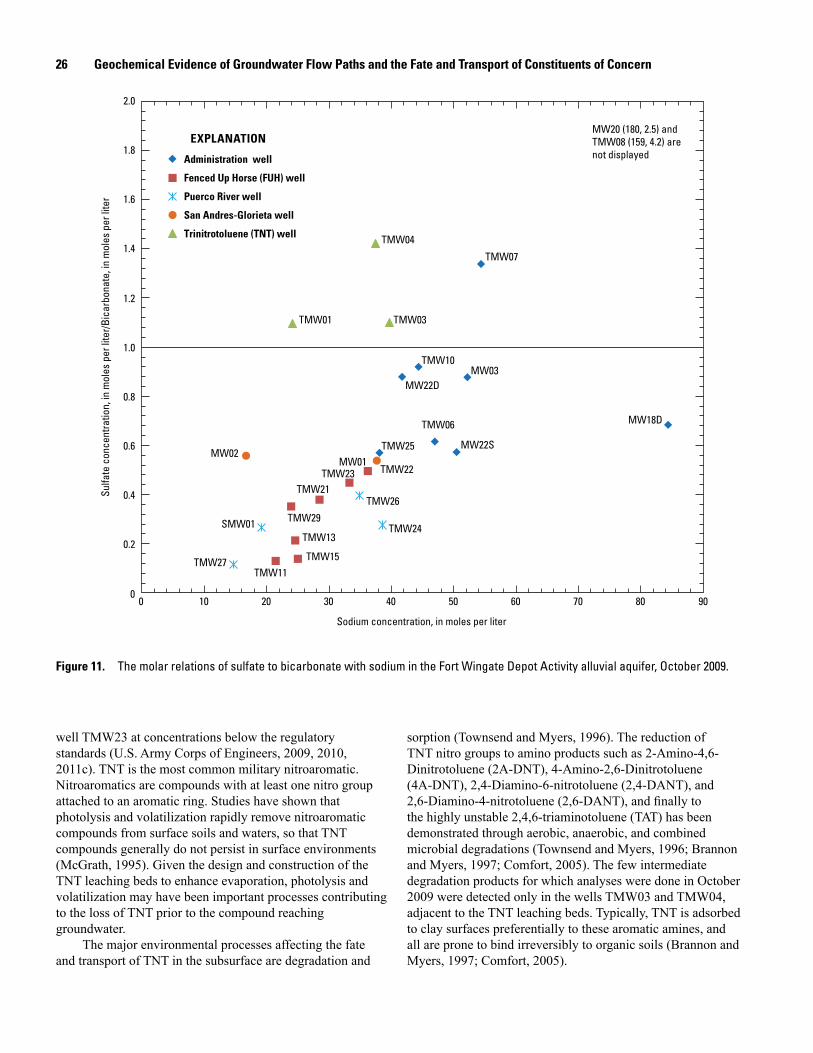
26 Geochemical Evidence of Groundwater Flow Paths and the Fate and Transport of Constituents of Concern
well TMW23 at concentrations below the regulatory standards (U.S. Army Corps of Engineers, 2009, 2010, 2011c). TNT is the most common military nitroaromatic. Nitroaromatics are compounds with at least one nitro group attached to an aromatic ring. Studies have shown that photolysis and volatilization rapidly remove nitroaromatic compounds from surface soils and waters, so that TNT compounds generally do not persist in surface environments (McGrath, 1995). Given the design and construction of the TNT leaching beds to enhance evaporation, photolysis and volatilization may have been important processes contributing to the loss of TNT prior to the compound reaching groundwater.
The major environmental processes affecting the fate and transport of TNT in the subsurface are degradation and
sorption (Townsend and Myers, 1996). The reduction of TNT nitro groups to amino products such as 2-Amino-4,6-Dinitrotoluene (2A-DNT), 4-Amino-2,6-Dinitrotoluene (4A-DNT), 2,4-Diamino-6-nitrotoluene (2,4-DANT), and 2,6-Diamino-4-nitrotoluene (2,6-DANT), and finally to the highly unstable 2,4,6-triaminotoluene (TAT) has been demonstrated through aerobic, anaerobic, and combined microbial degradations (Townsend and Myers, 1996; Brannon and Myers, 1997; Comfort, 2005). The few intermediate degradation products for which analyses were done in October 2009 were detected only in the wells TMW03 and TMW04, adjacent to the TNT leaching beds. Typically, TNT is adsorbed to clay surfaces preferentially to these aromatic amines, and all are prone to bind irreversibly to organic soils (Brannon and Myers, 1997; Comfort, 2005).
TMW11
TMW29
TMW13
TMW15
TMW21TMW23 TMW22
TMW01
TMW04
TMW03
TMW27
SMW01
TMW26
TMW24
MW02MW01
MW22D
TMW10
MW22S
MW03
MW18D TMW06
TMW07
TMW25
0.2
0.4
0.6
0.8
1.0
1.2
1.4
1.6
1.8
2.0
00
10 20 30 40 50 60 70 80 90
Sulfa
te c
once
ntra
tion,
in m
oles
per
lite
r/Bic
arbo
nate
, in
mol
es p
er li
ter
Sodium concentration, in moles per liter
MW20 (180, 2.5) and TMW08 (159, 4.2) are not displayedAdministration well
Fenced Up Horse (FUH) well
Puerco River well
San Andres-Glorieta well
Trinitrotoluene (TNT) well
EXPLANATION
Figure 11. The molar relations of sulfate to bicarbonate with sodium in the Fort Wingate Depot Activity alluvial aquifer, October 2009.

Geochemical Evidence for the Fate and Transport of Constituents of Concern 27
RDX has been a widely used military explosive since its large-scale production began in the 1940s. In October 2009, RDX was the most prevalent explosive compound detected in groundwater samples collected from the alluvial aquifer (table 1–6 in appendix 1). RDX was detected above the laboratory reporting level in groundwater from the monitoring wells TMW03, TMW04, and TMW23; historically, RDX has been found consistently in these three wells (U.S. Army Corps of Engineers, 2009, 2010, 2011c). In October 2009, RDX concentrations in groundwater from well TMW03 were larger (370 μg/L) than in groundwater from wells TMW04 and TMW23 (2.3 μg/L and 12 μg/L, respectively). This high concentration is consistent with previous sampling data and suggests that RDX has limited mobility (because of slow groundwater flow) or is being attenuated downgradient from well TMW03 (U.S. Army Corps of Engineers, 2009, 2010, 2011c). No explosives were detected in the well TMW22 in October 2009, which is located both spatially and hydrologically between TMW03 and TMW23. The lack of detectable concentrations of explosive compounds in TMW22, along with the interpretations made from the isotope and major ion concentrations, suggests that it may receive a significant portion of hill-front recharge from the outcrop along the eastern margin of the study area that is diluting those concentrations. This recharge may also be influencing concentrations in well TMW23.
RDX is a highly energetic cyclic nitramine (an anime having a nitro group instead of a hydrogen atom). The nitramines (primarily RDX and octahydro-1,3,5,7-tetranitro-1,3,5,7-tetrazocine [HMX]) are less soluble than nitroaromatic compounds, but generally considered more mobile because they are less sorptive to soils (Douglas and others, 2009). Degradation of RDX typically produces nitroso rather than amino products in groundwater and primarily occurs by anaerobic biodegradation (Crocker, 2006). Proposed biodegradation mechanisms, as summarized by Crocker (2006), may include: two-electron reduction, single electron reduction/denitration, and direct enzymatic cleavage of bonds. The intermediate degrative products (for example, hexahydro-1-nitroso-3,5-dinitro-1,3,5-triazine [MNX], hexahydro-1,3-dinitroso-5-nitro-1,3,5-triazine [DMX], and hexahydro-1,3,5-trinitroso-1,3,5-triazine [TMX]) generally are considered unstable and spontaneously degrade to nitrate and small carbon alkanes and alcohols (Crocker, 2006). Chemical similarities of RDX and HMX result in similar biodegradation mechanisms. Electron donors and acceptors that support RDX biodegradation also support the biodegradation of HMX, and several microorganisms have been shown to cometabolize both compounds (Crocker, 2006). Samples from the October 2009 sampling event were not analyzed for RDX derivatives, but previous samples historically have yielded low concentrations (less than 10 μg/L).
The chemical characteristics and environmental behavior of the two explosive groups have resulted in RDX being more widespread and persistent than TNT in groundwater
at the Depot and at many other sites where both compounds have been released (Comfort, 2005; Langman and others, 2008). The spatial extent of explosives in the alluvial aquifer is consistent with the extent of the TNT flow path delineated in the previous sections. The presence of explosive concentrations in the downgradient FUH well TMW23 indicates that groundwater is mixing with the TNT flow path, as suggested by the major ion and isotopic data. One important consequence of the influence of FUH flow-path water in well TMW23 is the limited effect constituents associated with the TNT flow path currently have on water quality in the rest of the aquifer. During the period of active TNT processing, recharging TNT leachate may have had a more extensive effect on the aquifer water quality.
NitrateNitrate was prevalent in the alluvial aquifer in October
2009, with 9 of 29 monitoring wells having groundwater with nitrate concentrations above the regulatory standard of 10 mg/L (nitrate as nitrogen) (U.S. Environmental Protection Agency, 2009b). Only two wells had no detectable concentrations. Nitrate concentrations ranged from below the laboratory reporting level of 0.5 mg/L (the lowest estimated concentration was 0.02 mg/L) to 170 mg/L (table 1–7 in appendix 1) (fig. 12).
Given the relatively high concentrations of nitrate (39 to 165 mg/L; fig. 12) in wells with correspondingly high RDX concentrations, it is likely that some of the nitrate being detected in groundwater was derived from the degradation of explosive compounds. Nitrate is considered very mobile in an oxygenated, aqueous environment because of its high solubility and low sorption to soils (Hem, 1985). For this reason, it has been considered that Admin wells (MW20, MW22S, and MW22D) with high nitrate concentrations (greater than 10 mg/L) may also be associated with the TNT leaching operations. However, this flow model would require that the TNT flow path make an abrupt turn to the west without a strong hydraulic potential (fig. 5). In addition, there is not a well with a nitrate concentration equal to or greater than 10 mg/L between the two well groupings depicted in figure 12. A second source of nitrate in the Administration Area would honor the geochemical flow-path interpretations and would explain the nitrate distribution. One possible source of nitrate to the groundwater in the Administration Area is the aging sewer lines. Utility maps of the Depot show most buildings are serviced with 6- to 8-inch vitrified clay sewer pipes. The sewage effluent is routed from the buildings to the sewage lagoon located in the northwestern part of the Depot adjacent to SMW01 (fig. 2). One additional possibility is that the nitrate concentrations found outside the recent influence of the TNT flow path may be a relic of former hydrologic conditions that, through artificial recharge from the TNT leaching beds, increased the spatial influence of the TNT flow path.

28 Geochemical Evidence of Groundwater Flow Paths and the Fate and Transport of Constituents of Concern
!
! !
!
!
!
! !
! !
!!!
!!!
! !
!! ! !
!
!
!!
!TMW27
NSSMW01
ND
TMW260.05
TMW28NS
TMW24ND
TMW227.46
TMW0626
TMW2339
MW020.55
TMW070.18
MW0314.3
MW018.17
TMW080.42
TMW100.08
MW18D0.23
MW22S31.9MW22D
18.1
MW2029.8TMW25
0.89
TMW219.11
TMW294.68
TMW132.2
TMW151.00
TMW110.25
TNT leaching beds
TMW019.05
Suspected perchlorate release
TMW03170 TMW04
50.6
Sewagelagoon
Greater than10 milligrams per liter
Greater than10 milligrams per liter
108°36’
35°31’30”
35°30’30”
31’
35’30” 108°35’
EXPLANATION
0 0.25
0.25
0.5 MILE
0.5 KILOMETER0
Base from U.S. Geological Survey digital data, 1:24,000 shaded relief mapUniversal Transverse Mercator 12° NorthNorth American Vertical Datum of 1988 (NAVD 88)
Trinitrotoluene (TNT) leaching beds
Well identifier and nitrate concentration—In milligrams per liter. ND, not detected. NS, not sampled
TMW112.2
!
South Fork Puerco River
Fenced Up H
orse Arroyo
§̈¦4 0
Figure 12. Nitrate concentrations in October 2009 in the alluvial aquifer.

Geochemical Evidence for the Fate and Transport of Constituents of Concern 29
In addition to anthropogenic inputs (such as fertilizers and sewage effluent), natural sources can introduce nitrate to groundwater. In particular, soils may contain nitrate deposited during geologic times that can mobilize when water percolates through the soils (Jury and others, 1991). Nitrate concentrations, up to 5 mg/L or more in areas unlikely to be substantially affected by anthropogenic sources (outside the Admin and TNT flow paths), could reasonably be of natural origin based on conclusions drawn by Plummer and others (2004) in the study of the Middle Rio Grande Basin of central New Mexico. Hem (1985) reported high nitrate levels (68 mg/L) in a well located in an undeveloped part of the Sonoran Desert and speculated that the source may have been nitrogen-fixing desert legumes or accumulation from atmospheric deposition. Later work by Walvoord and others (2003) estimated that nitrate has been accumulating in desert soils throughout the Holocene Epoch.
Other Constituents
PerchloratePerchlorate is a strong oxidizer used in a variety of
products, including fireworks, ordnance, and flares (Brown and Gu, 2006). Perchlorate is thought to have been introduced to the groundwater through the accidental release of photoflash (a pyrotechnic material containing potassium perchlorate) following base closure (U.S. Army Corps of Engineers, 2011b). The release reportedly occurred around 1997 south of the study area (figs. 2 and 12, south of TMW01). Based on the topography, if the contents of the photoflash release were to dissolve and be entrained in overland flow, the chemical components could enter the alluvial groundwater system in the area of recharge to the TNT flow path near TMW01. Perchlorate concentrations in the alluvial aquifer were highest in groundwater from TMW01 (260 μg/L), supporting that hypothesis. Only two other alluvial wells (TMW03 and TMW04) located near the TNT leaching beds (figs. 2 and 12) produced groundwater with perchlorate concentrations detected above the laboratory reporting level (1.0 and 0.85 μg/L, respectively) (table 1–8 in appendix 1).
Perchlorate is highly soluble in water (maximum concentration of 185 µg/L) and generally will not adsorb to soil material (Urbansky and Brown, 2003). Therefore, perchlorate is considered very mobile and persistent in oxic groundwater, as is primarily found in the alluvial aquifer at the Depot. However, many anaerobic bacteria in aqueous environments can use perchlorate as a reducing compound to oxidize other compounds, leading to its degradation (Van Ginkel and others, 1996; Coates, 2004; Sturchio, 2007). The limited distribution of perchlorate in the alluvial aquifer supports the limited extent of influence of the TNT flow path. In addition, despite its high solubility and mobility, perchlorate concentrations immediately downgradient from TMW01 are low, suggesting that the TNT flow path likely has slow groundwater velocities.
OrganicsSeveral VOCs, thought to be associated with past fueling
and maintenance activities, were detected above the laboratory reporting level in groundwater from wells located near the former gas station and maintenance buildings. In October 2009, VOCs were detected in wells MW01, MW02 MW18D, MW20, and MW22S (table 1–9 in appendix 1). The only concentrations exceeding regulatory limits were found in MW18D and MW20 (U.S. Environmental Protection Agency, 2009b). In addition to the individual organic compounds, gasoline range organics (GRO) and diesel range organics (DRO) also were detected in MW18D and MW20, and DRO was detected in MW22S and MW22D. The presence of VOCs in the listed wells suggests that there may be another source of groundwater recharge local to the Administration Area. This source could be responsible for the anomalous chemistry of some of these wells (particularly for wells MW18D and MW20, which have the largest concentrations of organic contaminants). Each of these wells is an Admin well and located in the part of the aquifer that has undifferentiated groundwater flow paths. As discussed above, the discharge point of groundwater in this area is not definitely determined and, as such, the movement of these constituents is not certain.
Attenuation of Constituents of Concern
Attenuation of chemical species in groundwater can occur as the result of many processes, including dilution, dispersion, sorption, and degradation. Dilution and dispersion are a function of recharge, groundwater flow, and flow-path interaction (mixing); sorption is a function of the nature of the alluvial matrix and the chemical species; and degradation (including biodegradation) is a function of the aqueous environment and the aqueous species.
The pH of most natural groundwater ranges from 6.0 to 8.5 (Hem, 1985). The pH of the groundwater in the alluvial aquifer in October 2009 generally was between 7.0 and 8.0 standard units (fig. 13; table 1–10 in appendix 1). The narrow range of pH values suggests a highly buffered system that has resulted from the high ANC in the alluvial wells. The effect of pH on the fate of anthropogenic constituents is considered minimal, given the narrow range of values.
Many of the constituents of concern identified in the alluvial aquifer are sensitive to redox conditions. Redox reactions are microbial-mediated processes that preferentially pair the most efficient electron donors to the most efficient electron acceptors (McMahon and Chapelle, 2008). With the exception of the nitroaromatics and organic compounds, which may degrade in a wide range of redox potentials, most of the constituents of concern degraded in anoxic conditions, such as the reductions of the nitro groups to nitroso groups in nitramines.
Organic carbon is the most common electron donor in groundwater systems. While no total or dissolved organic carbon data are available, the number of oxic wells (dissolved

30 Geochemical Evidence of Groundwater Flow Paths and the Fate and Transport of Constituents of Concern
oxygen concentration greater than 0.5 mg/L; fig. 13 and table 6) in the study area suggests the presence of only limited carbon sources that can be utilized in microbial processes. Known anthropogenic sources of organic carbon within the alluvial aquifer include the degrative products from the nitroaromatic and nitramine explosive compounds released from TNT washout operations and petroleum and organic carbon products from maintenance buildings and a former fuel station in the Administration Area. An additional source may be waste products from aging clay sewage pipes servicing many of the structures in the Administration Area.
Dissolved oxygen (DO) is commonly available and is the most energetically favorable electron acceptor. However, when groundwater is isolated from the atmosphere, DO may be consumed and unavailable further from the point of recharge (Freeze and Cherry, 1979). In the absence of oxygen, other electron-accepting species may be used in an ecological succession of decreasingly favorable species. This succession often is referred to as the redox ladder. The next most energetically favorable electron acceptor after oxygen is nitrate, followed by manganese (Mn [IV]), ferric iron (Fe [III]), sulfate, and carbon dioxide. Concentrations of these electron accepting species (or their reduced form) can help determine the position on the redox ladder of water from a well in the groundwater system (McMahon and Chapelle, 2008; Chapelle and others, 2009) The concentrations that are used to determine the primary electron-accepting species are subject to certain limitations, such as the type of microbial
species that are present and the type and availability of electron donors (McMahon and Chapelle, 2008).
Groundwater from 16 of the 27 wells sampled was classified as being mixed with respect to redox processes (that is, criteria for more than one redox process were met) (table 6), and all but four wells (TMW10, TMW22, TMW23, and TMW28) produced at least some fraction of groundwater that was oxic, based on dissolved-oxygen measurements taken in the field.
A review of historical dissolved-oxygen measurements shows that between sampling events a few wells produce groundwater that alternates between oxic and anoxic conditions, as determined by dissolved-oxygen measurements made in the field (U.S. Army Corps of Engineers, 2009, 2010, 2011c). These disparate conditions suggest that most of the aquifer lacks a consistent source of electrons, in the form of dissolved carbon, to sustain reducing conditions.
The presence of relatively high concentrations of iron and manganese (above threshold concentrations used for redox classification) in several dissolved samples may be derived from solid-phase sediments and colloids that passed through the filter used for sample collection. At neutral to slightly alkaline pH and in the presence of dissolved oxygen above 0.5 mg/L, as found in the majority of alluvial wells, aqueous iron and manganese concentrations typically are low. The high concentrations may not represent the dissolved concentrations of these elements but may instead represent the release of iron and manganese to solution as a result of acid preservation
TMW10
MW22D
MW20 TMW08
MW03TMW06
TMW07
MW22S
TMW21
TMW13 TMW15
TMW11
TMW29
TMW22TMW23
TMW03TMW04
TMW01
TMW26TMW27SMW01
TMW28
TMW24
MW01
MW02
0
1
2
3
4
5
6
7
6 7 8 9
Diss
olve
d-ox
ygen
con
cent
ratio
n, in
mill
igra
ms
per l
iter
pH, in standard units
Anoxic threshold
EXPLANATION
Administration well
Fenced Up Horse (FUH) well
Puerco River well
San Andres-Glorieta well
Trinitrotoluene (TNT) well
Figure 13. Dissolved oxygen concentrations and pH values for groundwater samples collected in October 2009.

Summary 31
of the sample or during the analytical metals extraction method, which could leach these cations out of sediments and colloids. If the laboratory results for iron and manganese do not represent true concentrations for groundwater in the aquifer, then groundwater from nearly all sampled wells would be classified with respect to redox as solely oxic (rather than mixed), suggesting that little organic carbon is available in the aquifer for utilization in microbial processes.
The anoxic conditions present in groundwater from wells TMW22 and TMW23 in October 2009 may be enhancing the degradation of explosives and nitrate; however, these conditions appear to be spatially and temporally limited. Dissolved-oxygen concentrations indicate that oxic groundwater is widespread in the alluvial aquifer of the Depot; therefore, nitramines, nitrate, and perchlorate likely are not prone to degradation across large areas. Given the apparent lack of widespread reducing conditions, the distribution and concentrations of explosives and nitrate and the flow-path interpretations, the dominant process for decreasing the concentrations of these constituents is likely to be dispersion and dilution by local hill-front recharge and flow-path mixing.
SummaryThe alluvial aquifer underlying the Administration
and Workshop Areas of the Fort Wingate Depot Activity (Depot) receives multiple sources of groundwater recharge that influence flow paths across the area. The fine-grained nature of the alluvial matrix creates a highly heterogeneous environment that adds to the difficulty of precisely determining the flow directions of groundwater and aqueous constituents based solely on the potentiometric surface. This geochemical investigation adds evidence for defining the fine-scale groundwater and constituent flow paths and adds support for determining the dominant attenuation processes for constituents of concern.
The hydrogeologic framework provides important constraints on the geochemical interpretations. The clay and mudstones of the Painted Desert Member of the Petrified Forest Formation that compose the underlying bedrock restrict cross-formational groundwater exchange between the lower confined units and the alluvial aquifer. The barriers to cross-formational flow limit the sources of recharge to the alluvial aquifer, influence the direction of groundwater flow, and affect the fate of groundwater and dissolved constituents. In addition, the erosion and subsequent deposition of these fine-grained materials in the alluvial basin create low hydraulic conductivities and groundwater velocities in the aquifer.
The October 2009 potentiometric surface of the alluvial aquifer beneath the Depot’s Administration and Workshop Areas indicates that groundwater generally follows the surface topography. In the southern part of the Depot, the general flow direction is northward, although the influence of the South Fork of the Puerco River groundwater basin causes groundwater to flow southwestward in the northernmost
part of the study area. The center of the Administration Area appears to be an area where multiple flow paths merge, and flow directions are highly variable. Three possible flow paths originating at the aquifer margins were identified as (1) the TNT flow path, which originates near the southeastern boundary and moves northward under the TNT leaching beds; (2) the FUH flow path, which originates at the southwestern boundary of the study area near the Fenced Up Horse (FUH) arroyo; and (3) the Puerco flow path, which flows southwest from the alluvial deposits underlying the South Fork of the Puerco River. A fourth recharge source with a spatially-limited area of apparent influence, referred to as the SA-G flow path, is identified near the cistern used for collecting water produced from the Depot’s production well screened in the San Andres-Glorieta (SA-G) aquifer.
The mineralogy of the Painted Desert clays and resulting erosional deposits of the alluvium includes aluminosilicate montmorillonite clays, anhydrite and gypsum, and calcite. The montmorillonite clays have a strong cation exchange potential that preferentially bind divalent cations such as calcium over monovalent cations such as sodium, resulting in sodium-dominated groundwater in the alluvial aquifer. This cation exchange allows for further dissolution of calcium carbonates and sulfate minerals while limiting calcium availability for mineral precipitation and reducing the “common ion effect.” The large clay component of the aquifer matrix results in the nonconservative behavior of sodium, whereas, chloride behavior is conservative; concentrations of both constituents aid in interpreting flow paths and groundwater mixing.
The deuterium and oxygen-18 (δ2H and δ18O relative to Vienna Standard Mean Ocean Water [VSMOW]) isotopic ratios of sampled groundwater provide evidence for the contribution of San Andres-Glorieta water to the alluvial aquifer in areas near the cistern containing water from the Depot’s production well. Mixing ratios calculated from isotopic end-members (the production well and the median composition of groundwater in the Administration Area believed to be unaffected by cistern leakage) suggests a substantial contribution (between 46 and 84 percent) of San Andres-Glorieta water to the alluvial system in a localized area, while highlighting the heterogeneity of the alluvium by not being apparent in all downgradient wells at similar distances from the cistern source. Wells located near other sources of groundwater recharge did not have sufficiently different isotopic compositions to allow for similar end-member contribution calculations. However, qualitative observations of the isotopic compositions support flow-path designations and further geochemical interpretations. Slight variations in the isotopic compositions among wells of a given flow path are thought to result primarily from the seasonal fractionation of precipitation.
Given the geologic, potentiometric, and mineral constraints, flow paths were further delineated by major ion concentrations and their relations to each other. As groundwater moves through the alluvial aquifer, calcium from the dissolution of gypsum and calcite is removed from solution

32 Geochemical Evidence of Groundwater Flow Paths and the Fate and Transport of Constituents of Concern
and replaced by sodium through cation exchange. Based on the October 2009 sampling event, sodium concentrations increase linearly with dissolved solids along groundwater flow paths. Sulfate concentrations also increase along flow paths, suggesting that both ions reflect the extent of mineral weathering (though as the result of different geochemical processes). Therefore, the two species offer evidence of a well’s relative position along a flow path. Chloride is shown to be derived from precipitation and to behave conservatively in the aqueous environment. As such, changes in the chloride concentrations along a flow path indicate the mixing of flow paths or the addition of local groundwater recharge. The high ion concentrations in the Admin wells suggest that a mechanism of discharge from the study area is through transpiration. Transpiration would not affect the fractionation of stable isotopes and is therefore supported by the isotope ratios.
Water levels in wells TMW22 and TMW23 indicate that they are downgradient from all wells in the TNT and FUH flow paths. In addition, groundwater from TMW23 historically has had explosive and explosive degradate concentrations that suggests a connection with wells in the TNT flow path. However, the lower sodium (and chloride) concentrations in TMW22 and TMW23 than the upgradient TNT flow path wells (TMW03 and TMW04) require that these concentrations are being substantially diluted by an alternate recharge source along the TNT flow path or that these wells belong to a separate flow path. The ion concentrations in these wells therefore indicate the extent of the TNT flow paths.
The acid neutralizing capacity (ANC) in the alluvial aquifer, like chloride, generally did not increase in downgradient wells. For groundwater from most wells, concentrations of bicarbonate (the major component of alkalinity) were found to be controlled partly by equilibrium with the mineral calcite and the aqueous species. Overall, the ANC concentrations were fairly similar across the aquifer and deviations from the expected values helped to associate individual wells with certain flow paths.
Explosives, consisting primarily of 1,3,5-trinitroperhydro-1,3,5-triazine (RDX) and a few degrative products, released from the TNT leaching beds, are found primarily along the TNT flow path. In October 2009, RDX was detected in the wells closest to the leaching beds (TMW03 and TMW04) and in the downgradient well (TMW23) of the FUH flow path. Given the limited influence of the TNT flow path and the lack of explosives in nearby wells, TMW23 reflects the most downgradient location of detection of explosives during October 2009. Dissolved concentrations of the nitroaromatics are presumed to decrease through the combination of irreversible sorption and degradation, while concentrations of nitramines are thought to primarily decrease through dilution with groundwater from the FUH flow path. The downgradient mixing of the TNT and FUH flow paths around TMW23 is supported with other geochemical data. One important consequence of the designated flow paths is the limited effect that constituents associated with the TNT flow path have
on water quality in the rest of the aquifer. This appears to be the case with the nitroaromatic and nitramine explosives released from the TNT leaching beds and would apply to perchlorate suspected of being released at the far southeastern margins of the aquifer. In October 2009, the only perchlorate concentrations in the alluvium above the laboratory reporting level were found in wells associated with the TNT flow path.
Nitrate was ubiquitous in the alluvial groundwater in October 2009. Given the geochemical evidence for the alluvial flow regime and distribution of nitrate concentrations, there is evidence to suggest two anthropogenic sources for the nitrate. Nitrate in wells associated with the TNT flow path is thought to be the degrative product of explosive compounds. The decrease in nitrate concentrations in wells downgradient from the TNT flow path suggests attenuation primarily through dilution, similar to that of RDX. The wide range and inconsistent distribution of nitrate concentrations in groundwater from wells located among the structures of the Administration Area (Admin wells) likely reflect the heterogeneity of the alluvial aquifer and the mixing of several flow paths. The cause of elevated nitrate concentrations in the Admin wells is uncertain but may have resulted from leakage from aging clay sewage pipes that service most of the structures within the Administration Area or reflect relics of a former hydrologic regime in which groundwater of the TNT flow path (from washout operations) migrated across a broader area.
The lack of data to identify a discharge point for the groundwater in this area also implies that the fate and transport of nitrate and the petroleum and organic products associated with these wells is also unknown. The majority of the alluvial aquifer was oxic and therefore does not support the degradation of most of the constituents of concern.
References
Anderson, O.J., Maxwell, C.H., and Lucas, S.G., 2003, Geology of Fort Wingate Quadrangle, McKinley County, New Mexico: New Mexico Bureau of Geology and Mineral Resources Open-File Report 473, 14 p.
Argonne National Laboratory, 1990, Master Environmental Plan—Fort Wingate Depot Activity, Gallup, New Mexico: Document No. 90-10, Argonne National Laboratory, 137 p., accessed May 29, 2008, at http://www.osti.gov/bridge/servlets/purl/6231102-ht9QB5/6231102.pdf.
Baars, D.L., 1962, Permian system of the Colorado Plateau: American Association of Petroleum Geologists Bulletin, v. 46, no. 2, p. 149–218.
Baldwin, J.A., and Anderholm, S.K., 1992, Hydrogeology and ground-water chemistry of the San Andres-Glorieta aquifer in the Acoma embayment and eastern Zuni uplift, west-central New Mexico: U.S. Geological Survey Water Resources Investigations Report 91–4033, 304 p.

References 33
Berkowitz, B., Dror, I., and Yaron, B., 2008, Contaminant geochemistry—Interactions and transport in the subsurface environment: Berlin, Springer, 412 p.
Boggs, S., 2006, Principles of sedimentology and stratigraphy: Upper Saddle River, N.J., Prentice Hall, 662 p.
Brannon, J.M., and Myers, T.E., 1997, Review of fate and transport processes of explosives: Vicksburg, Miss., U.S. Army Engineer Waterways Experiment Station, Technical Report IRRP-97-2, 24 p.
Brown, G.M., and Gu, B., 2006, The chemistry of perchlorate in the environment, in Brown, G.M., and Gu, B., eds., Perchlorate: New York, N.Y., Springer, p. 17.
Brownlow, A.H., 1979, Geochemistry: Englewood Cliffs, N.J., Prentice-Hall, Inc., 498 p.
Bullen, T.D., and Kendall, C., 1998, Tracing of weathering reactions and water flowpaths, a multi-isotope approach, in Kendall, C., and McDonnell, J.J., eds., Isotope tracers in catchment hydrology: Amsterdam, Elsevier Science B.V., p. 611–643.
Callahan, J.T., and Cushman, R.L., 1954, Geology and groundwater supplies of the Fort Wingate Indian School Area, McKinley County, New Mexico: U.S. Geological Survey Open-File Report MK–20, 28 p.
Cather, S.M., 2003, The Laramide Defiance Uplift, in Lucas, S.G., Semken, S.C., Berglof, W.R., and Ulmer-Scholle, D.S., eds., Geology of the Zuni Plateau: New Mexico Geological Society, Fifty-Fourth Annual Field Conference, September 24–27, 2003, p. 6–7.
Cather, S.M., 2004, Laramide Orogeny in central and northern New Mexico and southern Colorado, in Mack, G.H., and Giles, K.A., eds., The geology of New Mexico—A geologic history: New Mexico Geological Society Special Publication 11, p. 203–248.
Chamberlin, R.M., and Anderson, O.J., 1989, The Laramide Zuni Uplift, southeastern Colorado Plateau—A microcosm of Eurasian-style indentation-extrusion tectonics?, in Anderson, O.J., Lucas, S.G., Love, D.W., and Cather, S.M., eds., Southeastern Colorado Plateau: New Mexico Geological Society, Fortieth Annual Field Conference, September 28–October 1, 1989, p. 81–90.
Chapelle, F.H., Bradley, P.M., Thomas, M.A., and McMahon, P.B., 2009, Distinguishing iron-reducing from sulfate-reducing conditions: Ground water, v. 47, no. 2, p. 300–305.
Childress, C.J.O., Foreman, W.T., Conner, B.F., and Maloney, T.J., 1999, New reporting procedures based on long-term method detection levels and some considerations for interpretations of water-quality data provided by the U.S. Geological Survey National Water Quality Laboratory: U.S. Geological Survey Open-File Report 99-193, 19 p. Available at http://water.usgs.gov/owq/OFR_99-193/index.html.
Clark, I.D., and Fritz, P., 1997, Environmental isotopes in hydrogeology: Boca Raton, Fla., CRC Press/Lewis Publishers, 328 p.
Coates, J., 2004, Microbial perchlorate reduction—Rocket-fuelled metabolism: Nature reviews, Microbiology, v. 2, no. 7, p. 569.
Comfort, S., 2005, Remediating RDX and HMX contaminated soil and water, in Fingerman, M., and Nagabhushanam, R., eds., Bioremediation of aquatic and terrestrial ecosystem: Science Publishers, p. 263–310.
Coplen, T.B., Herezeg, A.L., and Barnes, C., 2000, Isotope engineering—Using stable isotopes of the water molecule to solve practical problems, in Cook, P.G., and Herezeg, A.L., eds., Environmental tracers in subsurface hydrology: Boston, Kluwer Academic Publishers, p. 79–110.
Craig, H., 1961, Isotopic variations in meteoric waters: Science, New Series, v. 133, no. 3465, p. 1702.
Crocker, F.H., 2006, Biodegradation of the cyclic nitramine explosives RDX, HMX, and CL-20: Applied Microbiology and Biotechnology, v. 73, no. 2, p. 274–290.
Douglas, T.A., Walsh, M.E., McGrath, C.J., and Weiss, C.A., 2009, Investigating the fate of nitroaromatic (TNT) and nitramine (RDX and HMX) explosives in fractured and pristine soils: Journal of Environmental Quality, v. 38, no. 6, p. 2285–2294.
Epstein, S., and Mayeda, T., 1953, Variation of O18 content of waters from natural sources: Geochemica et Cosmochemica Acta, v. 4, no. 5, p. 213–224.
Errol L. Montgomery & Associates, Inc., 2003, Phase I evaluation of hydrogeologic conditions in the vicinity of NZ properties Navajo and Apache Counties, AZ: 19 p., accessed November 17, 2010, at http://www.nzlegacy.com/Reports/waterreport.pdf.
Fenneman, N.M., and Johnson, D.W., 1946, Physical divisions of the United States: United States Geological Survey Map, scale 1:7,000,000.
Freeze, R.A., and Cherry, J.A., 1979, Groundwater: Englewood Cliffs, N.J., Prentice-Hall, Inc., 618 p.
Friedman, I., Smith, G.I., Gleason, J.D., Warden, A., and Harris, J.M., 1992, Stable isotope composition of waters in southeastern California—Modern precipitation: Journal of Geophysical Research, v. 97, no. d5, p. 5795–5812.
Genereux, D.P., and Hooper, R.P., 1998, Oxygen and hydrogen isotopes in rainfall-runoff studies, in Kendall, C., and McDonnell, J.J., eds., Isotope tracers in catchment hydrology: Amsterdam, Elsevier Science B.V., p. 319–346.

34 Geochemical Evidence of Groundwater Flow Paths and the Fate and Transport of Constituents of Concern
Gordon, E.D., 1961, Geology and ground-water resources of the Grants-Bluewater area, Valencia County, New Mexico: New Mexico State Engineer Technical Report 20, p. 109.
Gregory, H.E., 1917, Geology of the Navajo country, a reconnaissance of parts of Arizona, New Mexico, and Utah: U.S. Geological Survey Professional Paper 93, 161 p.
Heath, R.C., 1989, Basic ground-water hydrology: U.S. Geological Survey Water-Supply Paper 2220, 84 p.
Heckert, A.B., Kues, B.S., and Semken, S.C., 2003, From Bear Springs to Fort Wingate, in Lucas, S.G., Semken, S.C., Berglof, W.R., and Ulmer-Scholle, D.S., eds., Geology of the Zuni Plateau: New Mexico Geological Society, Fifty-Fourth Annual Field Conference, September 24–27, 2003, p. 37–40.
Heckert, A.B., and Lucas, S.G., 2003, Triassic stratigraphy in the Zuni Mountains, west-central New Mexico, in Lucas, S.G., Semken, S.C., Berglof, W.R., and Ulmer-Scholle, D.S., eds., Geology of the Zuni Plateau: New Mexico Geological Society, Fifty-Fourth Annual Field Conference, September 24–27, 2003, p. 245–262.
Helsel, D.R., and Hirsch, R.M., 2002, Statistical methods in water resources: U.S. Geological Survey Techniques of Water-Resources Investigations, book 4, chap. A3, 522 p.
Hem, J.D., 1985, Study and interpretation of the chemical characteristics of natural waters (3d ed.): U.S. Geological Survey Water-Supply Paper 2254, 263 p.
Hoefs, J., 2009, Stable isotope geochemistry (6h ed.): Berlin, Springer-Verlag, 196 p.
Ingraham, N.L., 1998, Isotopic variations in precipitation, in Kendall, C., and McDonnell, J.J., eds., Isotope tracers in catchment hydrology: Amsterdam, Elsevier Science B.V., p. 87–118.
Jury, W.A., Gardner, W.R., and Gardner, W.H., 1991, Soil physics (5h ed.): John Wiley & Sons, Inc., 552 p.
Kendall, C., 2001, Distribution of oxygen-18 and deuterium in river waters across the United States: Hydrological Processes, v. 15, no. 7, p. 1,363.
Langman, J.B., Robertson, A.J., Bynum, J., and Gebhardt, F.E., 2008, Geochemical trends and natural attenuation of RDX, nitrate, and perchlorate in the hazardous test area fractured-granite aquifer, White Sands Missile Range, New Mexico, 1996–2006: U.S. Geological Survey Scientific Investigations Report 2008–5157, p. 44.
Langmuir, D., 1997, Aqueous environmental geochemistry: Upper Saddle River, N.J., Prentice-Hall, Inc., 600 p.
Leopold, L.B., and Snyder, C.T., 1951, Alluvial fills near Gallup, New Mexico: U.S. Geological Survey Water-Supply Paper 1110–A, 19 p.
Lorenz, J.C., and Cooper, S.P., 2001, Tectonic setting and characteristics of natural fractures in Mesaverde and Dakota reservoirs of the San Juan Basin, New Mexico and Colorado: New Mexico Geology, 77 p.
Lucas, S.G., Heckert, A.B., Berglof, W.R., Kues, B.S., Crumpler, L.S., Aubele, J.C., McLemore, V.T., Owen, D.E., and Semken, S.C., 2003, Second-day road log, from Gallup to Fort Wingate, Sixmile Canyon, Ciniza, Red Rock Park, Church Rock, White Mesa, Thoreau and Grants, in Lucas, S.G., Semken, S.C., Berglof, W.R., and Ulmer-Scholle, D.S., eds., Geology of the Zuni Plateau: New Mexico Geological Society, Fifty-Fourth Annual Field Conference, September 24–27, 2003, p. 35–37.
Lucas, S.G., Heckert, A.B., Estep, J.W., and Anderson, O.J., 1997, Stratigraphy, biostratigraphy, and sequence stratigraphy of the Upper Triassic Chinle Group, Four Corners region: New Mexico Geological Society Guidebook, v. 48, p. 81–107.
McGrath, C.J., 1995, Review of formulations for processes affecting the subsurface transport of explosives: U.S. Army Corps of Engineers Waterways Experiment Station Technical Report IRRP-95-2, 262 p.
McMahon, P.B., and Chapelle, F.H., 2008, Redox processes and water quality of selected principal aquifer systems: Ground Water, v. 46, no. 2, p. 259.
National Atmospheric Deposition Program, 2009, National Trends Network: accessed December 12, 2011, at http://nadp.sws.uiuc.edu/NTN/.
Parkhurst, D.L., and Appelo, C.A.J., 1999, User’s guide to PHREEQC (version 2)—A computer program for speciation, batch-reaction, one-dimensional transport and inverse geochemical calculations: U.S. Geological Survey Water-Resources Investigations Report 99-4259, 310 p.
Plummer, L.N., Bexfield, L.M., Anderholm, S.K., Sanford, W.E., and Busenberg, E., 2004, Geochemical characterization of ground-water flow in the Santa Fe Group aquifer system, Middle Rio Grande Basin, New Mexico: U. S. Geological Survey Water-Resources Investigations Report 03–4131, p. 395.
PMC Environmental, 2001, Final RCRA facility investigation report—TNT leaching beds area: Prepared for the U.S. Army Corps of Engineers Fort Worth District, 189 p., on file at the U.S. Army Corps of Engineers Albuquerque District.

References 35
Revesz, K., and Coplen, T.B., 1991, Caution on the use of Viton or FETFE O-rings in carbon dioxide sample containers for δ18O analysis: Chemical Geology (Isotope Geoscience Section): v. 86, p. 259–261.
Schmidt, G.A., Bigg, G.R., and Rohling, E.J., 1999, Global seawater oxygen-18 database (version 1.21): accessed November 12, 2011, at http://data.giss.nasa.gov/o18data/.
Schultz, L.G., 1963, Clay minerals in triassic rocks of the Colorado Plateau: U.S. Geological Survey Bulletin 1147-C, 71 p.
Shomaker, J.W., 1971, Water resources of Fort Wingate Army Depot and adjacent areas, McKinley County, New Mexico: U.S. Geological Survey Open-File Report, 230 p.
Southwest Climate Change Network, 2010, Climate-seasonal precipitation: Institute of the Environment and Climate Assessment for the Southwest at the University of Arizona, accessed October 2, 2010, at http://www.southwestclimatechange.org/climate/southwest/seasonal-precipitation.
Stewart, J.H., and Carlson, J.E., 1978, Geologic map of Nevada: U.S. Geological Survey and Nevada Bureau of Mines and Geology, 1:500,000 [not part of any formal series, printed and distributed by the U.S. Geological Survey, G75163, reprinted, 1981, G81386].
Stewart, J.H., Poole, F.G., and Wilson, R.F., 1972, Stratigraphy and origin of the Chinle Formation and related Upper Triassic strata in the Colorado Plateau region: U.S. Geological Survey Professional Paper 690, 336 p.
Stone, W.J., Lyford, F.P., Frenzel, P.F., Mizell, N.H., and Padgett, E.T., 1983, Hydrogeology and water resources of San Juan Basin, New Mexico: Bureau of Mines and Mineral Resources Hydrologic Report 6, 70 p.
Sturchio, N., 2007, Oxygen and chlorine isotopic fractionation during perchlorate biodegradation—Laboratory results and implications for forensics and natural attenuation studies: Environmental Science & Technology, v. 41, no. 8, p. 2,796.
Tanner, L.H., 2003a, Pedogenic features of the Chinle Group, Four Corners region—Evidence of Late Triassic aridification, in Lucas, S.G., Semken, S.C., Berglof, W.R., and Ulmer-Scholle, D.S., eds., Geology of the Zuni Plateau: New Mexico Geological Society, Fifty-Fourth Annual Field Conference, September 24–27, 2003, p. 269–280.
Tanner, L.H., 2003b, Possible tectonic controls on Late Triassic sedimentation in the Chinle Basin, Colorado Plateau, in Lucas, S.G., Semken, S.C., Berglof, W.R., and Ulmer-Scholle, D.S., eds., Geology of the Zuni Plateau: New Mexico Geological Society, Fifty-Fourth Annual Field Conference, September 24–27, 2003, p. 263–267.
Townsend, D.M., and Myers, T.E., 1996, Recent developments in formulating model descriptors for subsurface transformation and sorption of TNT, RDX, and HMX: U.S. Army Corps of Engineer Waterways Experiment Station Technical Report IRRP-96-1, 22 p.
U.S. Army Corps of Engineers, 2009, Fort Wingate Depot Activity facility-wide ground water periodic monitoring report from October 2008 to January 2009: U.S. Army Corps of Engineers, Albuquerque District, 83 p., accessed March 30, 2011, at http://www.ftwingate.org/docs_area.html.
U.S. Army Corps of Engineers, 2010, Fort Wingate Depot Activity facility-wide ground water periodic monitoring report from April 2009 to July 2009: U.S. Army Corps of Engineers, Albuquerque District, 62 p., accessed March 30, 2011, at http://www.ftwingate.org/docs_area.html.
U.S. Army Corps of Engineers, 2011a, Final RCRA facility investigation report, Parcel 11, Fort Wingate Depot Activity: U.S. Army Corps of Engineers, Fort Worth District, 1,239 p., accessed October 2, 2011, at http://www.ftwingate.org/docs_area.html.
U.S. Army Corps of Engineers, 2011b, Final RCRA facility investigation report, Parcel 22, Fort Wingate Depot Activity: U.S. Army Corps of Engineers, Fort Worth District, 626 p., accessed December 10, 2011, at http://www.ftwingate.org/docs_area.html.
U.S. Army Corps of Engineers, 2011c, Fort Wingate Depot Activity facility-wide ground water periodic monitoring report from October 2009 to January 2010: U.S. Army Corps of Engineers, Albuquerque District, 80 p., accessed March 30, 2011, at http://www.ftwingate.org/docs_area.html.
U.S. Environmental Protection Agency, 2009a, The Clean Air Status and Trends Network (CASTNET): accessed December 11, 2011, at http://epa.gov/castnet/javaweb/index.html.
U.S. Environmental Protection Agency, 2009b, Drinking Water Contaminants: accessed August 10, 2011, at http://water.epa.gov/drink/contaminants/index.cfm.
U.S. Geological Survey, variously dated, National field manual for the collection of water-quality data: U.S. Geological Survey Techniques of Water-Resources Investigations, book 9, chaps. A1–A9. Available at http://water.usgs.gov/owq/FieldManual/.
Urbansky, E.T., and Brown, S.K., 2003, Perchlorate retention and mobility in soils: Journal of Environmental Monitoring, v. 5, no. 3, p. 455.

36 Geochemical Evidence of Groundwater Flow Paths and the Fate and Transport of Constituents of Concern
Van Ginkel, C.G., Rikken, G.B., Kroon, A.G.M., and Kengen, S.W.M., 1996, Purification and characterization of chlorite dismutase—A novel oxygen-generating enzyme: Archives of Microbiology, v. 166, no. 5, p. 321.
Walvoord, M.A., Phillips, F.M., Stonestrom, D.A., Evans, R.D., Hartsough, P.C., Newman, B.D., and Striegl, R.G., 2003, A reservoir of nitrate beneath desert soils: Science, v. 302, no. 5647, p. 1,021.
Walvoord, M.A., Plummer, M.A., Phillips, F.M., and Wolfsberg, A.V., 2002, Deep arid system hydrodynamics— 1. Equilibrium states and response times in thick desert vadose zones: Water Resources Research, v. 38, no. 12.
Western Regional Climate Center, 2010, New Mexico climate summaries for cooperative stations: Western Regional Climate Center, accessed March 16, 2010, at http://weather.nmsu.edu/nmcccooperator/.
Wood, W., 1999, Use and misuse of the chloride-mass balance method in estimating ground water recharge: Ground Water, v. 37, no. 1, p. 2.

Appendix 1—Groundwater Analytical Results


Table 1–1 39
Table 1–1. Dissolved solids analyzed according to the U.S. Environmental Protection Agency’s Methods for Chemical Analysis of Water and Wastes (MCAWW), EPA Method 160.1.
[mg/L, milligrams per liter]
Site designation
Collection date
AnalyteResult (mg/L)
Laboratory reporting level
(mg/L)
Laboratory detection limit
(mg/L)
MW01 10/22/2009 Dissolved solids 2,700 40 19
MW02 10/22/2009 Dissolved solids 1,800 40 19
MW03 10/23/2009 Dissolved solids 3,500 20 9.4
MW18D 10/23/2009 Dissolved solids 5,500 20 9.4
MW20 10/23/2009 Dissolved solids 14,000 40 19
MW22D 10/21/2009 Dissolved solids 3,400 20 9.4
MW22S 10/23/2009 Dissolved solids 3,500 20 9.4
SMW01 10/24/2009 Dissolved solids 1,300 10 4.7
TMW01 10/14/2009 Dissolved solids 1,900 10 4.7
TMW03 10/14/2009 Dissolved solids 3,000 20 9.4
TMW04 10/14/2009 Dissolved solids 2,700 20 9.4
TMW06 10/17/2009 Dissolved solids 3,400 20 9.4
TMW07 10/20/2009 Dissolved solids 3,700 20 9.4
TMW08 10/17/2009 Dissolved solids 12,000 40 19
TMW10 10/19/2009 Dissolved solids 3,100 20 9.4
TMW11 10/20/2009 Dissolved solids 1,300 10 4.7
TMW13 10/22/2009 Dissolved solids 1,500 10 4.7
TMW15 10/26/2009 Dissolved solids 1,400 10 4.7
TMW21 10/24/2009 Dissolved solids 1,600 10 4.7
TMW22 10/19/2009 Dissolved solids 2,500 20 9.4
TMW23 10/19/2009 Dissolved solids 2,300 40 19
TMW24 10/19/2009 Dissolved solids 2,300 20 9.4
TMW25 10/22/2009 Dissolved solids 2,600 20 9.4
TMW26 10/17/2009 Dissolved solids 2,100 20 9.4
TMW27 10/24/2009 Dissolved solids 920 10 4.7
TMW29 10/20/2009 Dissolved solids 1,700 40 19
Table 1–1

40 Geochemical Evidence of Groundwater Flow Paths and the Fate and Transport of Constituents of Concern
Table 1–2. Dissolved cations and mercury analyzed according to the U.S. Environmental Protection Agency’s methods SW846 6010B/6020 and SW846 7471, respectively.—Continued
[CAS, Chemical Abstract Services; mg/L, milligrams per liter; U, undetected; ―, unqualified result; E, estimated concentration]
Site designation
Collection date
Analyte CAS number1 Result (mg/L)
QualifierLaboratory
reporting level (mg/L)
Laboratory detection limit
(mg/L)
MW01 10/22/2009 Aluminum 7429-90-5 0.016 U 0.050 0.016MW01 10/22/2009 Antimony 7440-36-0 0.0034 U 0.0060 0.0034MW01 10/22/2009 Arsenic 7440-38-2 0.0044 U 0.0050 0.0044MW01 10/22/2009 Barium 7440-39-3 0.014 ― 0.0030 0.00024MW01 10/22/2009 Beryllium 7440-41-7 0.00005 U 0.0010 0.00005MW01 10/22/2009 Cadmium 7440-43-9 0.00043 U 0.0050 0.00043MW01 10/22/2009 Calcium 7440-70-2 26 ― 5.0 0.090MW01 10/22/2009 Chromium 7440-47-3 0.00050 U 0.0020 0.00050MW01 10/22/2009 Cobalt 7440-48-4 0.00025 U 0.0050 0.00025MW01 10/22/2009 Copper 7440-50-8 0.0027 E 0.020 0.0021MW01 10/22/2009 Iron 7439-89-6 0.0097 U 0.30 0.0097MW01 10/22/2009 Lead 7439-92-1 0.0018 U 0.0050 0.0018MW01 10/22/2009 Magnesium 7439-95-4 6.7 ― 0.50 0.0085MW01 10/22/2009 Manganese 7439-96-5 0.00034 U 0.0010 0.00034MW01 10/22/2009 Mercury 7439-97-6 0.000050 U 0.00020 0.000050MW01 10/22/2009 Nickel 7440-02-0 0.00071 U 0.0020 0.00071MW01 10/22/2009 Potassium 7440-09-7 0.28 E 0.50 0.056MW01 10/22/2009 Selenium 7782-49-2 0.021 ― 0.010 0.0056MW01 10/22/2009 Silver 7440-22-4 0.00072 U 0.0050 0.00072MW01 10/22/2009 Sodium 7440-23-5 870 ― 50 6.2MW01 10/22/2009 Thallium 7440-28-0 0.0026 U 0.0050 0.0026MW01 10/22/2009 Vanadium 7440-62-2 0.0078 ― 0.0050 0.0011MW01 10/22/2009 Zinc 7440-66-6 0.022 ― 0.010 0.0012MW02 10/22/2009 Aluminum 7429-90-5 0.016 U 0.050 0.016MW02 10/22/2009 Antimony 7440-36-0 0.0034 U 0.0060 0.0034MW02 10/22/2009 Arsenic 7440-38-2 0.0044 U 0.0050 0.0044MW02 10/22/2009 Barium 7440-39-3 0.025 ― 0.0030 0.00024MW02 10/22/2009 Beryllium 7440-41-7 0.00005 U 0.0010 0.00005MW02 10/22/2009 Cadmium 7440-43-9 0.00043 U 0.0050 0.00043MW02 10/22/2009 Calcium 7440-70-2 170 ― 50 0.90MW02 10/22/2009 Chromium 7440-47-3 0.0016 E 0.0020 0.00050MW02 10/22/2009 Cobalt 7440-48-4 0.00025 U 0.0050 0.00025MW02 10/22/2009 Copper 7440-50-8 0.0021 U 0.020 0.0021MW02 10/22/2009 Iron 7439-89-6 0.0097 U 0.30 0.0097MW02 10/22/2009 Lead 7439-92-1 0.0018 U 0.0050 0.0018MW02 10/22/2009 Magnesium 7439-95-4 41 ― 5.0 0.085MW02 10/22/2009 Manganese 7439-96-5 0.52 ― 0.010 0.0034MW02 10/22/2009 Mercury 7439-97-6 0.000050 U 0.00020 0.000050MW02 10/22/2009 Nickel 7440-02-0 0.0033 ― 0.0020 0.00071MW02 10/22/2009 Potassium 7440-09-7 0.41 E 0.50 0.056MW02 10/22/2009 Selenium 7782-49-2 0.0056 U 0.010 0.0056MW02 10/22/2009 Silver 7440-22-4 0.00072 U 0.0050 0.00072
Table 1–2. Dissolved cations and mercury analyzed according to the U.S. Environmental Protection Agency’s methods SW846 6010B/6020 and SW846 7471, respectively.
[CAS, Chemical Abstract Services; mg/L, milligrams per liter; U, undetected; ―, unqualified result; E, estimated concentration]
Table 1–2

Table 1–2 41
Table 1–2. Dissolved cations and mercury analyzed according to the U.S. Environmental Protection Agency’s methods SW846 6010B/6020 and SW846 7471, respectively.—Continued
[CAS, Chemical Abstract Services; mg/L, milligrams per liter; U, undetected; ―, unqualified result; E, estimated concentration]
Site designation
Collection date
Analyte CAS number1 Result (mg/L)
QualifierLaboratory
reporting level (mg/L)
Laboratory detection limit
(mg/L)
MW02 10/22/2009 Sodium 7440-23-5 380 ― 50 6.2MW02 10/22/2009 Thallium 7440-28-0 0.0026 U 0.0050 0.0026MW02 10/22/2009 Vanadium 7440-62-2 0.0085 ― 0.0050 0.0011MW02 10/22/2009 Zinc 7440-66-6 0.12 ― 0.010 0.0012MW03 10/23/2009 Aluminum 7429-90-5 0.016 U 0.050 0.016MW03 10/23/2009 Antimony 7440-36-0 0.0044 E 0.0060 0.0034MW03 10/23/2009 Arsenic 7440-38-2 0.0044 U 0.0050 0.0044MW03 10/23/2009 Barium 7440-39-3 0.0092 ― 0.0030 0.00024MW03 10/23/2009 Beryllium 7440-41-7 0.00005 U 0.0010 0.00005MW03 10/23/2009 Cadmium 7440-43-9 0.00043 U 0.0050 0.00043MW03 10/23/2009 Calcium 7440-70-2 77 ― 5.0 0.090MW03 10/23/2009 Chromium 7440-47-3 0.00050 U 0.0020 0.00050MW03 10/23/2009 Cobalt 7440-48-4 0.00025 U 0.0050 0.00025MW03 10/23/2009 Copper 7440-50-8 0.0021 U 0.020 0.0021MW03 10/23/2009 Iron 7439-89-6 0.0097 U 0.30 0.0097MW03 10/23/2009 Lead 7439-92-1 0.0018 U 0.0050 0.0018MW03 10/23/2009 Magnesium 7439-95-4 16 E 5.0 0.085MW03 10/23/2009 Manganese 7439-96-5 0.042 ― 0.0010 0.00034MW03 10/23/2009 Mercury 7439-97-6 0.000050 U 0.00020 0.000050MW03 10/23/2009 Nickel 7440-02-0 0.00071 U 0.0020 0.00071MW03 10/23/2009 Potassium 7440-09-7 0.51 ― 0.50 0.056MW03 10/23/2009 Selenium 7782-49-2 0.0094 E 0.010 0.0056MW03 10/23/2009 Silver 7440-22-4 0.00072 U 0.0050 0.00072MW03 10/23/2009 Sodium 7440-23-5 1,200 ― 500 62MW03 10/23/2009 Thallium 7440-28-0 0.0026 U 0.0050 0.0026MW03 10/23/2009 Vanadium 7440-62-2 0.0098 ― 0.0050 0.0011MW03 10/23/2009 Zinc 7440-66-6 0.029 ― 0.010 0.0012MW18D 10/23/2009 Aluminum 7429-90-5 0.016 U 0.050 0.016MW18D 10/23/2009 Antimony 7440-36-0 0.0034 U 0.0060 0.0034MW18D 10/23/2009 Arsenic 7440-38-2 0.0044 U 0.0050 0.0044MW18D 10/23/2009 Barium 7440-39-3 0.017 ― 0.0030 0.00024MW18D 10/23/2009 Beryllium 7440-41-7 0.00005 U 0.0010 0.00005MW18D 10/23/2009 Cadmium 7440-43-9 0.00043 U 0.0050 0.00043MW18D 10/23/2009 Calcium 7440-70-2 74 ― 5.0 0.090MW18D 10/23/2009 Chromium 7440-47-3 0.002 ― 0.0020 0.00050MW18D 10/23/2009 Cobalt 7440-48-4 0.00025 U 0.0050 0.00025MW18D 10/23/2009 Copper 7440-50-8 0.0021 U 0.020 0.0021MW18D 10/23/2009 Iron 7439-89-6 0.0097 U 0.30 0.0097MW18D 10/23/2009 Lead 7439-92-1 0.0018 U 0.0050 0.0018MW18D 10/23/2009 Magnesium 7439-95-4 20 E 5.0 0.085MW18D 10/23/2009 Manganese 7439-96-5 0.74 ― 0.010 0.0034MW18D 10/23/2009 Mercury 7439-97-6 0.000050 U 0.00020 0.000050

42 Geochemical Evidence of Groundwater Flow Paths and the Fate and Transport of Constituents of Concern
Table 1–2. Dissolved cations and mercury analyzed according to the U.S. Environmental Protection Agency’s methods SW846 6010B/6020 and SW846 7471, respectively.—Continued
[CAS, Chemical Abstract Services; mg/L, milligrams per liter; U, undetected; ―, unqualified result; E, estimated concentration]
Site designation
Collection date
Analyte CAS number1 Result (mg/L)
QualifierLaboratory
reporting level (mg/L)
Laboratory detection limit
(mg/L)
MW18D 10/23/2009 Nickel 7440-02-0 0.0053 ― 0.0020 0.00071MW18D 10/23/2009 Potassium 7440-09-7 0.93 ― 0.50 0.056MW18D 10/23/2009 Selenium 7782-49-2 0.0056 U 0.010 0.0056MW18D 10/23/2009 Silver 7440-22-4 0.00087 E 0.0050 0.00072MW18D 10/23/2009 Sodium 7440-23-5 1,900 ― 500 62MW18D 10/23/2009 Thallium 7440-28-0 0.0026 U 0.0050 0.0026MW18D 10/23/2009 Vanadium 7440-62-2 0.012 ― 0.0050 0.0011MW18D 10/23/2009 Zinc 7440-66-6 0.0059 E 0.010 0.0012MW20 10/23/2009 Aluminum 7429-90-5 0.016 U 0.050 0.016MW20 10/23/2009 Antimony 7440-36-0 0.0051 E 0.0060 0.0034MW20 10/23/2009 Arsenic 7440-38-2 0.0044 U 0.0050 0.0044MW20 10/23/2009 Barium 7440-39-3 0.014 ― 0.0030 0.00024MW20 10/23/2009 Beryllium 7440-41-7 0.00005 U 0.0010 0.00005MW20 10/23/2009 Cadmium 7440-43-9 0.00043 U 0.0050 0.00043MW20 10/23/2009 Calcium 7440-70-2 480 ― 50 0.90MW20 10/23/2009 Chromium 7440-47-3 0.0015 E 0.0020 0.00050MW20 10/23/2009 Cobalt 7440-48-4 0.00025 U 0.0050 0.00025MW20 10/23/2009 Copper 7440-50-8 0.0031 E 0.020 0.0021MW20 10/23/2009 Iron 7439-89-6 0.0097 U 0.30 0.0097MW20 10/23/2009 Lead 7439-92-1 0.0091 ― 0.0050 0.0018MW20 10/23/2009 Magnesium 7439-95-4 110 E 50 0.85MW20 10/23/2009 Manganese 7439-96-5 2.7 ― 0.10 0.034MW20 10/23/2009 Mercury 7439-97-6 0.000050 U 0.00020 0.000050MW20 10/23/2009 Nickel 7440-02-0 0.0071 ― 0.0020 0.00071MW20 10/23/2009 Potassium 7440-09-7 2.6 ― 0.50 0.056MW20 10/23/2009 Selenium 7782-49-2 0.28 ― 0.10 0.056MW20 10/23/2009 Silver 7440-22-4 0.00072 U 0.0050 0.00072MW20 10/23/2009 Sodium 7440-23-5 4,100 ― 500 62MW20 10/23/2009 Thallium 7440-28-0 0.0026 U 0.0050 0.0026MW20 10/23/2009 Vanadium 7440-62-2 0.0011 U 0.0050 0.0011MW20 10/23/2009 Zinc 7440-66-6 0.32 ― 0.10 0.012MW22D 10/21/2009 Aluminum 7429-90-5 0.016 U 0.050 0.016MW22D 10/21/2009 Antimony 7440-36-0 0.0042 E 0.0060 0.0034MW22D 10/21/2009 Arsenic 7440-38-2 0.0048 E 0.0050 0.0044MW22D 10/21/2009 Barium 7440-39-3 0.008 ― 0.0030 0.00024MW22D 10/21/2009 Beryllium 7440-41-7 0.00005 U 0.0010 0.00005MW22D 10/21/2009 Cadmium 7440-43-9 0.00043 U 0.0050 0.00043MW22D 10/21/2009 Calcium 7440-70-2 69 ― 5.0 0.090MW22D 10/21/2009 Chromium 7440-47-3 0.00050 U 0.0020 0.00050MW22D 10/21/2009 Cobalt 7440-48-4 0.00025 U 0.0050 0.00025MW22D 10/21/2009 Copper 7440-50-8 0.0021 U 0.020 0.0021MW22D 10/21/2009 Iron 7439-89-6 0.0097 U 0.30 0.0097

Table 1–2 43
Table 1–2. Dissolved cations and mercury analyzed according to the U.S. Environmental Protection Agency’s methods SW846 6010B/6020 and SW846 7471, respectively.—Continued
[CAS, Chemical Abstract Services; mg/L, milligrams per liter; U, undetected; ―, unqualified result; E, estimated concentration]
Site designation
Collection date
Analyte CAS number1 Result (mg/L)
QualifierLaboratory
reporting level (mg/L)
Laboratory detection limit
(mg/L)
MW22D 10/21/2009 Lead 7439-92-1 0.0018 U 0.0050 0.0018MW22D 10/21/2009 Magnesium 7439-95-4 15 ― 5.0 0.085MW22D 10/21/2009 Manganese 7439-96-5 0.09 ― 0.0010 0.00034MW22D 10/21/2009 Mercury 7439-97-6 0.000050 U 0.00020 0.000050MW22D 10/21/2009 Nickel 7440-02-0 0.0022 ― 0.0020 0.00071MW22D 10/21/2009 Potassium 7440-09-7 0.61 ― 0.50 0.056MW22D 10/21/2009 Selenium 7782-49-2 0.05 ― 0.010 0.0056MW22D 10/21/2009 Silver 7440-22-4 0.00096 E 0.0050 0.00072MW22D 10/21/2009 Sodium 7440-23-5 1,200 ― 500 62MW22D 10/21/2009 Thallium 7440-28-0 0.0026 U 0.0050 0.0026MW22D 10/21/2009 Vanadium 7440-62-2 0.0091 ― 0.0050 0.0011MW22D 10/21/2009 Zinc 7440-66-6 0.049 ― 0.010 0.0012MW22S 10/20/2009 Aluminum 7429-90-5 0.054 ― 0.050 0.016MW22S 10/20/2009 Antimony 7440-36-0 0.0034 U 0.0060 0.0034MW22S 10/20/2009 Arsenic 7440-38-2 0.0044 U 0.0050 0.0044MW22S 10/20/2009 Barium 7440-39-3 0.019 ― 0.0030 0.00024MW22S 10/20/2009 Beryllium 7440-41-7 0.00005 U 0.0010 0.00005MW22S 10/20/2009 Cadmium 7440-43-9 0.00043 U 0.0050 0.00043MW22S 10/20/2009 Calcium 7440-70-2 77 ― 5.0 0.090MW22S 10/20/2009 Chromium 7440-47-3 0.0025 ― 0.0020 0.00050MW22S 10/20/2009 Cobalt 7440-48-4 0.00025 U 0.0050 0.00025MW22S 10/20/2009 Copper 7440-50-8 0.0021 U 0.020 0.0021MW22S 10/20/2009 Iron 7439-89-6 0.021 E 0.30 0.0097MW22S 10/20/2009 Lead 7439-92-1 0.0018 U 0.0050 0.0018MW22S 10/20/2009 Magnesium 7439-95-4 24 ― 5.0 0.085MW22S 10/20/2009 Manganese 7439-96-5 0.070 E 0.0010 0.00034MW22S 10/20/2009 Mercury 7439-97-6 0.000050 U 0.00020 0.000050MW22S 10/20/2009 Nickel 7440-02-0 0.0031 ― 0.0020 0.00071MW22S 10/20/2009 Potassium 7440-09-7 0.52 ― 0.50 0.056MW22S 10/20/2009 Selenium 7782-49-2 0.057 ― 0.010 0.0056MW22S 10/20/2009 Silver 7440-22-4 0.00072 U 0.0050 0.00072MW22S 10/20/2009 Sodium 7440-23-5 960 ― 50 6.2MW22S 10/20/2009 Thallium 7440-28-0 0.0026 U 0.0050 0.0026MW22S 10/20/2009 Vanadium 7440-62-2 0.010 ― 0.0050 0.0011MW22S 10/20/2009 Zinc 7440-66-6 0.0057 E 0.010 0.0012SMW01 10/24/2009 Aluminum 7429-90-5 0.016 U 0.050 0.016SMW01 10/24/2009 Antimony 7440-36-0 0.0034 U 0.0060 0.0034SMW01 10/24/2009 Arsenic 7440-38-2 0.0044 U 0.0050 0.0044SMW01 10/24/2009 Barium 7440-39-3 0.015 ― 0.0030 0.00024SMW01 10/24/2009 Beryllium 7440-41-7 0.00005 U 0.0010 0.00005SMW01 10/24/2009 Cadmium 7440-43-9 0.00081 E 0.0050 0.00043SMW01 10/24/2009 Calcium 7440-70-2 23 ― 5.0 0.090

44 Geochemical Evidence of Groundwater Flow Paths and the Fate and Transport of Constituents of Concern
Table 1–2. Dissolved cations and mercury analyzed according to the U.S. Environmental Protection Agency’s methods SW846 6010B/6020 and SW846 7471, respectively.—Continued
[CAS, Chemical Abstract Services; mg/L, milligrams per liter; U, undetected; ―, unqualified result; E, estimated concentration]
Site designation
Collection date
Analyte CAS number1 Result (mg/L)
QualifierLaboratory
reporting level (mg/L)
Laboratory detection limit
(mg/L)
SMW01 10/24/2009 Chromium 7440-47-3 0.00050 U 0.0020 0.00050SMW01 10/24/2009 Cobalt 7440-48-4 0.00025 U 0.0050 0.00025SMW01 10/24/2009 Copper 7440-50-8 0.0021 U 0.020 0.0021SMW01 10/24/2009 Iron 7439-89-6 0.0097 U 0.30 0.0097SMW01 10/24/2009 Lead 7439-92-1 0.0018 U 0.0050 0.0018SMW01 10/24/2009 Magnesium 7439-95-4 7.2 E 0.50 0.0085SMW01 10/24/2009 Manganese 7439-96-5 0.047 ― 0.0010 0.00034SMW01 10/24/2009 Mercury 7439-97-6 0.000050 U 0.00020 0.000050SMW01 10/24/2009 Nickel 7440-02-0 0.00071 U 0.0020 0.00071SMW01 10/24/2009 Potassium 7440-09-7 0.078 E 0.50 0.056SMW01 10/24/2009 Selenium 7782-49-2 0.0056 U 0.010 0.0056SMW01 10/24/2009 Silver 7440-22-4 0.00072 U 0.0050 0.00072SMW01 10/24/2009 Sodium 7440-23-5 440 ― 50 6.2SMW01 10/24/2009 Thallium 7440-28-0 0.0026 U 0.0050 0.0026SMW01 10/24/2009 Vanadium 7440-62-2 0.0074 ― 0.0050 0.0011SMW01 10/24/2009 Zinc 7440-66-6 0.0038 E 0.010 0.0012TMW01 10/14/2009 Aluminum 7429-90-5 0.016 E 0.050 0.016TMW01 10/14/2009 Antimony 7440-36-0 0.0034 U 0.0060 0.0034TMW01 10/14/2009 Arsenic 7440-38-2 0.012 ― 0.0050 0.0044TMW01 10/14/2009 Barium 7440-39-3 0.011 ― 0.0030 0.00024TMW01 10/14/2009 Beryllium 7440-41-7 0.00005 U 0.0010 0.00005TMW01 10/14/2009 Cadmium 7440-43-9 0.00043 U 0.0050 0.00043TMW01 10/14/2009 Calcium 7440-70-2 98 ― 50 0.90TMW01 10/14/2009 Chromium 7440-47-3 0.00076 E 0.0020 0.00050TMW01 10/14/2009 Cobalt 7440-48-4 0.00025 U 0.0050 0.00025TMW01 10/14/2009 Copper 7440-50-8 0.01 E 0.020 0.0021TMW01 10/14/2009 Iron 7439-89-6 0.12 E 0.30 0.0097TMW01 10/14/2009 Lead 7439-92-1 0.0018 U 0.0050 0.0018TMW01 10/14/2009 Magnesium 7439-95-4 19 ― 5.0 0.085TMW01 10/14/2009 Manganese 7439-96-5 0.0064 E 0.0010 0.00034TMW01 10/14/2009 Mercury 7439-97-6 0.000050 U 0.00020 0.000050TMW01 10/14/2009 Nickel 7440-02-0 0.0089 ― 0.0020 0.00071TMW01 10/14/2009 Potassium 7440-09-7 0.47 E 0.50 0.056TMW01 10/14/2009 Selenium 7782-49-2 0.0088 E 0.010 0.0056TMW01 10/14/2009 Silver 7440-22-4 0.00072 U 0.0050 0.00072TMW01 10/14/2009 Sodium 7440-23-5 560 ― 50 6.2TMW01 10/14/2009 Thallium 7440-28-0 0.0026 U 0.0050 0.0026TMW01 10/14/2009 Vanadium 7440-62-2 0.02 ― 0.0050 0.0011TMW01 10/14/2009 Zinc 7440-66-6 0.0044 E 0.010 0.0012TMW03 10/14/2009 Aluminum 7429-90-5 0.016 U 0.050 0.016TMW03 10/14/2009 Antimony 7440-36-0 0.0034 U 0.0060 0.0034TMW03 10/14/2009 Arsenic 7440-38-2 0.0083 ― 0.0050 0.0044

Table 1–2 45
Table 1–2. Dissolved cations and mercury analyzed according to the U.S. Environmental Protection Agency’s methods SW846 6010B/6020 and SW846 7471, respectively.—Continued
[CAS, Chemical Abstract Services; mg/L, milligrams per liter; U, undetected; ―, unqualified result; E, estimated concentration]
Site designation
Collection date
Analyte CAS number1 Result (mg/L)
QualifierLaboratory
reporting level (mg/L)
Laboratory detection limit
(mg/L)
TMW03 10/14/2009 Barium 7440-39-3 0.014 ― 0.0030 0.00024TMW03 10/14/2009 Beryllium 7440-41-7 0.00005 U 0.0010 0.00005TMW03 10/14/2009 Cadmium 7440-43-9 0.00043 U 0.0050 0.00043TMW03 10/14/2009 Calcium 7440-70-2 45 ― 5.0 0.090TMW03 10/14/2009 Chromium 7440-47-3 0.00050 U 0.0020 0.00050TMW03 10/14/2009 Cobalt 7440-48-4 0.00025 U 0.0050 0.00025TMW03 10/14/2009 Copper 7440-50-8 0.0021 U 0.020 0.0021TMW03 10/14/2009 Iron 7439-89-6 0.016 E 0.30 0.0097TMW03 10/14/2009 Lead 7439-92-1 0.0018 U 0.0050 0.0018TMW03 10/14/2009 Magnesium 7439-95-4 11 ― 5.0 0.085TMW03 10/14/2009 Manganese 7439-96-5 0.057 E 0.0010 0.00034TMW03 10/14/2009 Mercury 7439-97-6 0.000050 U 0.00020 0.000050TMW03 10/14/2009 Nickel 7440-02-0 0.00071 U 0.0020 0.00071TMW03 10/14/2009 Potassium 7440-09-7 0.53 ― 0.50 0.056TMW03 10/14/2009 Selenium 7782-49-2 0.073 ― 0.010 0.0056TMW03 10/14/2009 Silver 7440-22-4 0.00072 U 0.0050 0.00072TMW03 10/14/2009 Sodium 7440-23-5 910 ― 50 6.2TMW03 10/14/2009 Thallium 7440-28-0 0.0034 E 0.0050 0.0026TMW03 10/14/2009 Vanadium 7440-62-2 0.0086 ― 0.0050 0.0011TMW03 10/14/2009 Zinc 7440-66-6 0.036 ― 0.010 0.0012TMW04 10/14/2009 Aluminum 7429-90-5 0.018 E 0.050 0.016TMW04 10/14/2009 Antimony 7440-36-0 0.0034 U 0.0060 0.0034TMW04 10/14/2009 Arsenic 7440-38-2 0.0087 ― 0.0050 0.0044TMW04 10/14/2009 Barium 7440-39-3 0.0067 ― 0.0030 0.00024TMW04 10/14/2009 Beryllium 7440-41-7 0.00005 U 0.0010 0.00005TMW04 10/14/2009 Cadmium 7440-43-9 0.00043 U 0.0050 0.00043TMW04 10/14/2009 Calcium 7440-70-2 27 ― 5.0 0.090TMW04 10/14/2009 Chromium 7440-47-3 0.00071 E 0.0020 0.00050TMW04 10/14/2009 Cobalt 7440-48-4 0.00025 U 0.0050 0.00025TMW04 10/14/2009 Copper 7440-50-8 0.0021 U 0.020 0.0021TMW04 10/14/2009 Iron 7439-89-6 0.0097 U 0.30 0.0097TMW04 10/14/2009 Lead 7439-92-1 0.0018 U 0.0050 0.0018TMW04 10/14/2009 Magnesium 7439-95-4 6 ― 0.50 0.0085TMW04 10/14/2009 Manganese 7439-96-5 0.0029 E 0.0010 0.00034TMW04 10/14/2009 Mercury 7439-97-6 0.000050 U 0.00020 0.000050TMW04 10/14/2009 Nickel 7440-02-0 0.00071 U 0.0020 0.00071TMW04 10/14/2009 Potassium 7440-09-7 0.85 ― 0.50 0.056TMW04 10/14/2009 Selenium 7782-49-2 0.1 ― 0.010 0.0056TMW04 10/14/2009 Silver 7440-22-4 0.00072 U 0.0050 0.00072TMW04 10/14/2009 Sodium 7440-23-5 860 ― 50 6.2TMW04 10/14/2009 Thallium 7440-28-0 0.0026 U 0.0050 0.0026TMW04 10/14/2009 Vanadium 7440-62-2 0.021 ― 0.0050 0.0011

46 Geochemical Evidence of Groundwater Flow Paths and the Fate and Transport of Constituents of Concern
Table 1–2. Dissolved cations and mercury analyzed according to the U.S. Environmental Protection Agency’s methods SW846 6010B/6020 and SW846 7471, respectively.—Continued
[CAS, Chemical Abstract Services; mg/L, milligrams per liter; U, undetected; ―, unqualified result; E, estimated concentration]
Site designation
Collection date
Analyte CAS number1 Result (mg/L)
QualifierLaboratory
reporting level (mg/L)
Laboratory detection limit
(mg/L)
TMW04 10/14/2009 Zinc 7440-66-6 0.0062 E 0.010 0.0012TMW06 10/17/2009 Aluminum 7429-90-5 0.016 U 0.050 0.016TMW06 10/17/2009 Antimony 7440-36-0 0.0034 U 0.0060 0.0034TMW06 10/17/2009 Arsenic 7440-38-2 0.0044 U 0.0050 0.0044TMW06 10/17/2009 Barium 7440-39-3 0.02 ― 0.0030 0.00024TMW06 10/17/2009 Beryllium 7440-41-7 0.00005 U 0.0010 0.00005TMW06 10/17/2009 Cadmium 7440-43-9 0.00043 U 0.0050 0.00043TMW06 10/17/2009 Calcium 7440-70-2 52 ― 5.0 0.090TMW06 10/17/2009 Chromium 7440-47-3 0.00050 U 0.0020 0.00050TMW06 10/17/2009 Cobalt 7440-48-4 0.00025 U 0.0050 0.00025TMW06 10/17/2009 Copper 7440-50-8 0.013 E 0.020 0.0021TMW06 10/17/2009 Iron 7439-89-6 0.034 E 0.30 0.0097TMW06 10/17/2009 Lead 7439-92-1 0.0018 U 0.0050 0.0018TMW06 10/17/2009 Magnesium 7439-95-4 14 ― 5.0 0.085TMW06 10/17/2009 Manganese 7439-96-5 0.041 E 0.0010 0.00034TMW06 10/17/2009 Mercury 7439-97-6 0.000050 U 0.00020 0.000050TMW06 10/17/2009 Nickel 7440-02-0 0.0039 ― 0.0020 0.00071TMW06 10/17/2009 Potassium 7440-09-7 0.51 ― 0.50 0.056TMW06 10/17/2009 Selenium 7782-49-2 0.015 ― 0.010 0.0056TMW06 10/17/2009 Silver 7440-22-4 0.00072 U 0.0050 0.00072TMW06 10/17/2009 Sodium 7440-23-5 1,100 ― 500 62TMW06 10/17/2009 Thallium 7440-28-0 0.0026 U 0.0050 0.0026TMW06 10/17/2009 Vanadium 7440-62-2 0.01 ― 0.0050 0.0011TMW06 10/17/2009 Zinc 7440-66-6 0.0041 E 0.010 0.0012TMW07 10/20/2009 Aluminum 7429-90-5 0.018 E 0.050 0.016TMW07 10/20/2009 Antimony 7440-36-0 0.0034 U 0.0060 0.0034TMW07 10/20/2009 Arsenic 7440-38-2 0.0082 ― 0.0050 0.0044TMW07 10/20/2009 Barium 7440-39-3 0.014 ― 0.0030 0.00024TMW07 10/20/2009 Beryllium 7440-41-7 0.00005 U 0.0010 0.00005TMW07 10/20/2009 Cadmium 7440-43-9 0.00084 E 0.0050 0.00043TMW07 10/20/2009 Calcium 7440-70-2 55 ― 5.0 0.090TMW07 10/20/2009 Chromium 7440-47-3 0.0006 E 0.0020 0.00050TMW07 10/20/2009 Cobalt 7440-48-4 0.00025 U 0.0050 0.00025TMW07 10/20/2009 Copper 7440-50-8 0.0028 E 0.020 0.0021TMW07 10/20/2009 Iron 7439-89-6 0.0097 U 0.30 0.0097TMW07 10/20/2009 Lead 7439-92-1 0.0018 U 0.0050 0.0018TMW07 10/20/2009 Magnesium 7439-95-4 11 ― 0.50 0.0085TMW07 10/20/2009 Manganese 7439-96-5 0.25 ― 0.0010 0.00034TMW07 10/20/2009 Mercury 7439-97-6 0.000050 U 0.00020 0.000050TMW07 10/20/2009 Nickel 7440-02-0 0.0026 ― 0.0020 0.00071TMW07 10/20/2009 Potassium 7440-09-7 3 ― 0.50 0.056TMW07 10/20/2009 Selenium 7782-49-2 0.0056 U 0.010 0.0056

Table 1–2 47
Table 1–2. Dissolved cations and mercury analyzed according to the U.S. Environmental Protection Agency’s methods SW846 6010B/6020 and SW846 7471, respectively.—Continued
[CAS, Chemical Abstract Services; mg/L, milligrams per liter; U, undetected; ―, unqualified result; E, estimated concentration]
Site designation
Collection date
Analyte CAS number1 Result (mg/L)
QualifierLaboratory
reporting level (mg/L)
Laboratory detection limit
(mg/L)
TMW07 10/20/2009 Silver 7440-22-4 0.00072 U 0.0050 0.00072TMW07 10/20/2009 Sodium 7440-23-5 1,300 ― 500 62TMW07 10/20/2009 Thallium 7440-28-0 0.0026 U 0.0050 0.0026TMW07 10/20/2009 Vanadium 7440-62-2 0.012 ― 0.0050 0.0011TMW07 10/20/2009 Zinc 7440-66-6 0.0053 E 0.010 0.0012TMW08 10/17/2009 Aluminum 7429-90-5 0.016 U 0.050 0.016TMW08 10/17/2009 Antimony 7440-36-0 0.0034 U 0.0060 0.0034TMW08 10/17/2009 Arsenic 7440-38-2 0.0044 U 0.0050 0.0044TMW08 10/17/2009 Barium 7440-39-3 0.0077 ― 0.0030 0.00024TMW08 10/17/2009 Beryllium 7440-41-7 0.00005 U 0.0010 0.00005TMW08 10/17/2009 Cadmium 7440-43-9 0.00043 U 0.0050 0.00043TMW08 10/17/2009 Calcium 7440-70-2 280 ― 50 0.90TMW08 10/17/2009 Chromium 7440-47-3 0.0013 E 0.0020 0.00050TMW08 10/17/2009 Cobalt 7440-48-4 0.00025 U 0.0050 0.00025TMW08 10/17/2009 Copper 7440-50-8 0.0021 U 0.020 0.0021TMW08 10/17/2009 Iron 7439-89-6 0.038 E 0.30 0.0097TMW08 10/17/2009 Lead 7439-92-1 0.0044 E 0.0050 0.0018TMW08 10/17/2009 Magnesium 7439-95-4 85 ― 5.0 0.085TMW08 10/17/2009 Manganese 7439-96-5 0.38 E 0.010 0.0034TMW08 10/17/2009 Mercury 7439-97-6 0.000050 U 0.00020 0.000050TMW08 10/17/2009 Nickel 7440-02-0 0.0038 ― 0.0020 0.00071TMW08 10/17/2009 Potassium 7440-09-7 3.5 ― 0.50 0.056TMW08 10/17/2009 Selenium 7782-49-2 0.028 ― 0.010 0.0056TMW08 10/17/2009 Silver 7440-22-4 0.00072 U 0.0050 0.00072TMW08 10/17/2009 Sodium 7440-23-5 3,700 ― 500 62TMW08 10/17/2009 Thallium 7440-28-0 0.0026 U 0.0050 0.0026TMW08 10/17/2009 Vanadium 7440-62-2 0.0011 U 0.0050 0.0011TMW08 10/17/2009 Zinc 7440-66-6 0.013 ― 0.010 0.0012TMW10 10/19/2009 Aluminum 7429-90-5 0.016 E 0.050 0.016TMW10 10/19/2009 Antimony 7440-36-0 0.0034 U 0.0060 0.0034TMW10 10/19/2009 Arsenic 7440-38-2 0.0044 U 0.0050 0.0044TMW10 10/19/2009 Barium 7440-39-3 0.013 ― 0.0030 0.00024TMW10 10/19/2009 Beryllium 7440-41-7 0.00005 U 0.0010 0.00005TMW10 10/19/2009 Cadmium 7440-43-9 0.00043 U 0.0050 0.00043TMW10 10/19/2009 Calcium 7440-70-2 46 ― 5.0 0.090TMW10 10/19/2009 Chromium 7440-47-3 0.00056 E 0.0020 0.00050TMW10 10/19/2009 Cobalt 7440-48-4 0.00025 U 0.0050 0.00025TMW10 10/19/2009 Copper 7440-50-8 0.015 E 0.020 0.0021TMW10 10/19/2009 Iron 7439-89-6 0.0097 U 0.30 0.0097TMW10 10/19/2009 Lead 7439-92-1 0.0018 U 0.0050 0.0018TMW10 10/19/2009 Magnesium 7439-95-4 14 ― 5.0 0.085TMW10 10/19/2009 Manganese 7439-96-5 0.0014 E 0.0010 0.00034

48 Geochemical Evidence of Groundwater Flow Paths and the Fate and Transport of Constituents of Concern
Table 1–2. Dissolved cations and mercury analyzed according to the U.S. Environmental Protection Agency’s methods SW846 6010B/6020 and SW846 7471, respectively.—Continued
[CAS, Chemical Abstract Services; mg/L, milligrams per liter; U, undetected; ―, unqualified result; E, estimated concentration]
Site designation
Collection date
Analyte CAS number1 Result (mg/L)
QualifierLaboratory
reporting level (mg/L)
Laboratory detection limit
(mg/L)
TMW10 10/19/2009 Mercury 7439-97-6 0.000050 U 0.00020 0.000050TMW10 10/19/2009 Nickel 7440-02-0 0.00071 U 0.0020 0.00071TMW10 10/19/2009 Potassium 7440-09-7 0.56 ― 0.50 0.056TMW10 10/19/2009 Selenium 7782-49-2 0.0093 E 0.010 0.0056TMW10 10/19/2009 Silver 7440-22-4 0.00072 U 0.0050 0.00072TMW10 10/19/2009 Sodium 7440-23-5 1,000 ― 500 62TMW10 10/19/2009 Thallium 7440-28-0 0.0026 U 0.0050 0.0026TMW10 10/19/2009 Vanadium 7440-62-2 0.0089 ― 0.0050 0.0011TMW10 10/19/2009 Zinc 7440-66-6 0.0028 E 0.010 0.0012TMW11 10/20/2009 Aluminum 7429-90-5 0.016 U 0.050 0.016TMW11 10/20/2009 Antimony 7440-36-0 0.0034 U 0.0060 0.0034TMW11 10/20/2009 Arsenic 7440-38-2 0.0044 U 0.0050 0.0044TMW11 10/20/2009 Barium 7440-39-3 0.016 ― 0.0030 0.00024TMW11 10/20/2009 Beryllium 7440-41-7 0.00005 U 0.0010 0.00005TMW11 10/20/2009 Cadmium 7440-43-9 0.00043 U 0.0050 0.00043TMW11 10/20/2009 Calcium 7440-70-2 15 ― 5.0 0.090TMW11 10/20/2009 Chromium 7440-47-3 0.00050 U 0.0020 0.00050TMW11 10/20/2009 Cobalt 7440-48-4 0.00025 U 0.0050 0.00025TMW11 10/20/2009 Copper 7440-50-8 0.0021 U 0.020 0.0021TMW11 10/20/2009 Iron 7439-89-6 0.0097 U 0.30 0.0097TMW11 10/20/2009 Lead 7439-92-1 0.0018 U 0.0050 0.0018TMW11 10/20/2009 Magnesium 7439-95-4 3 ― 0.50 0.0085TMW11 10/20/2009 Manganese 7439-96-5 0.02 ― 0.0010 0.00034TMW11 10/20/2009 Mercury 7439-97-6 0.000050 U 0.00020 0.000050TMW11 10/20/2009 Nickel 7440-02-0 0.00071 U 0.0020 0.00071TMW11 10/20/2009 Potassium 7440-09-7 0.52 ― 0.50 0.056TMW11 10/20/2009 Selenium 7782-49-2 0.018 ― 0.010 0.0056TMW11 10/20/2009 Silver 7440-22-4 0.00072 U 0.0050 0.00072TMW11 10/20/2009 Sodium 7440-23-5 490 ― 50 6.2TMW11 10/20/2009 Thallium 7440-28-0 0.0026 U 0.0050 0.0026TMW11 10/20/2009 Vanadium 7440-62-2 0.0056 ― 0.0050 0.0011TMW11 10/20/2009 Zinc 7440-66-6 0.0026 E 0.010 0.0012TMW13 10/22/2009 Aluminum 7429-90-5 0.016 U 0.050 0.016TMW13 10/22/2009 Antimony 7440-36-0 0.0034 U 0.0060 0.0034TMW13 10/22/2009 Arsenic 7440-38-2 0.0067 ― 0.0050 0.0044TMW13 10/22/2009 Barium 7440-39-3 0.015 ― 0.0030 0.00024TMW13 10/22/2009 Beryllium 7440-41-7 0.00005 U 0.0010 0.00005TMW13 10/22/2009 Cadmium 7440-43-9 0.0012 E 0.0050 0.00043TMW13 10/22/2009 Calcium 7440-70-2 27 ― 5.0 0.090TMW13 10/22/2009 Chromium 7440-47-3 0.00075 E 0.0020 0.00050TMW13 10/22/2009 Cobalt 7440-48-4 0.00025 U 0.0050 0.00025TMW13 10/22/2009 Copper 7440-50-8 0.0029 E 0.020 0.0021

Table 1–2 49
Table 1–2. Dissolved cations and mercury analyzed according to the U.S. Environmental Protection Agency’s methods SW846 6010B/6020 and SW846 7471, respectively.—Continued
[CAS, Chemical Abstract Services; mg/L, milligrams per liter; U, undetected; ―, unqualified result; E, estimated concentration]
Site designation
Collection date
Analyte CAS number1 Result (mg/L)
QualifierLaboratory
reporting level (mg/L)
Laboratory detection limit
(mg/L)
TMW13 10/22/2009 Iron 7439-89-6 0.0097 U 0.30 0.0097TMW13 10/22/2009 Lead 7439-92-1 0.0018 U 0.0050 0.0018TMW13 10/22/2009 Magnesium 7439-95-4 5.2 ― 0.50 0.0085TMW13 10/22/2009 Manganese 7439-96-5 0.00034 U 0.0010 0.00034TMW13 10/22/2009 Mercury 7439-97-6 0.000050 U 0.00020 0.000050TMW13 10/22/2009 Nickel 7440-02-0 0.00071 U 0.0020 0.00071TMW13 10/22/2009 Potassium 7440-09-7 0.43 E 0.50 0.056TMW13 10/22/2009 Selenium 7782-49-2 0.0089 E 0.010 0.0056TMW13 10/22/2009 Silver 7440-22-4 0.00072 U 0.0050 0.00072TMW13 10/22/2009 Sodium 7440-23-5 570 ― 50 6.2TMW13 10/22/2009 Thallium 7440-28-0 0.0027 E 0.0050 0.0026TMW13 10/22/2009 Vanadium 7440-62-2 0.0083 ― 0.0050 0.0011TMW13 10/22/2009 Zinc 7440-66-6 0.0021 E 0.010 0.0012TMW15 10/26/2009 Aluminum 7429-90-5 0.016 U 0.050 0.016TMW15 10/26/2009 Antimony 7440-36-0 0.0034 U 0.0060 0.0034TMW15 10/26/2009 Arsenic 7440-38-2 0.0044 U 0.0050 0.0044TMW15 10/26/2009 Barium 7440-39-3 0.019 ― 0.0030 0.00024TMW15 10/26/2009 Beryllium 7440-41-7 0.00005 U 0.0010 0.00005TMW15 10/26/2009 Cadmium 7440-43-9 0.00043 U 0.0050 0.00043TMW15 10/26/2009 Calcium 7440-70-2 18 ― 5.0 0.090TMW15 10/26/2009 Chromium 7440-47-3 0.00050 U 0.0020 0.00050TMW15 10/26/2009 Cobalt 7440-48-4 0.00025 U 0.0050 0.00025TMW15 10/26/2009 Copper 7440-50-8 0.0021 U 0.020 0.0021TMW15 10/26/2009 Iron 7439-89-6 0.0097 U 0.30 0.0097TMW15 10/26/2009 Lead 7439-92-1 0.0018 U 0.0050 0.0018TMW15 10/26/2009 Magnesium 7439-95-4 3.3 E 0.50 0.0085TMW15 10/26/2009 Manganese 7439-96-5 0.0019 ― 0.0010 0.00034TMW15 10/26/2009 Mercury 7439-97-6 0.000050 U 0.00020 0.000050TMW15 10/26/2009 Nickel 7440-02-0 0.00071 U 0.0020 0.00071TMW15 10/26/2009 Potassium 7440-09-7 0.44 E 0.50 0.056TMW15 10/26/2009 Selenium 7782-49-2 0.0078 E 0.010 0.0056TMW15 10/26/2009 Silver 7440-22-4 0.00072 U 0.0050 0.00072TMW15 10/26/2009 Sodium 7440-23-5 580 ― 50 6.2TMW15 10/26/2009 Thallium 7440-28-0 0.0026 U 0.0050 0.0026TMW15 10/26/2009 Vanadium 7440-62-2 0.0061 ― 0.0050 0.0011TMW15 10/26/2009 Zinc 7440-66-6 0.027 ― 0.010 0.0012TMW21 10/24/2009 Aluminum 7429-90-5 0.016 U 0.050 0.016TMW21 10/24/2009 Antimony 7440-36-0 0.0034 U 0.0060 0.0034TMW21 10/24/2009 Arsenic 7440-38-2 0.0044 U 0.0050 0.0044TMW21 10/24/2009 Barium 7440-39-3 0.02 ― 0.0030 0.00024TMW21 10/24/2009 Beryllium 7440-41-7 0.00005 U 0.0010 0.00005TMW21 10/24/2009 Cadmium 7440-43-9 0.00043 U 0.0050 0.00043

50 Geochemical Evidence of Groundwater Flow Paths and the Fate and Transport of Constituents of Concern
Table 1–2. Dissolved cations and mercury analyzed according to the U.S. Environmental Protection Agency’s methods SW846 6010B/6020 and SW846 7471, respectively.—Continued
[CAS, Chemical Abstract Services; mg/L, milligrams per liter; U, undetected; ―, unqualified result; E, estimated concentration]
Site designation
Collection date
Analyte CAS number1 Result (mg/L)
QualifierLaboratory
reporting level (mg/L)
Laboratory detection limit
(mg/L)
TMW21 10/24/2009 Calcium 7440-70-2 33 ― 5.0 0.090TMW21 10/24/2009 Chromium 7440-47-3 0.00050 U 0.0020 0.00050TMW21 10/24/2009 Cobalt 7440-48-4 0.00025 U 0.0050 0.00025TMW21 10/24/2009 Copper 7440-50-8 0.021 ― 0.020 0.0021TMW21 10/24/2009 Iron 7439-89-6 0.0097 U 0.30 0.0097TMW21 10/24/2009 Lead 7439-92-1 0.0018 U 0.0050 0.0018TMW21 10/24/2009 Magnesium 7439-95-4 7.3 E 0.50 0.0085TMW21 10/24/2009 Manganese 7439-96-5 0.13 ― 0.0010 0.00034TMW21 10/24/2009 Mercury 7439-97-6 0.000050 U 0.00020 0.000050TMW21 10/24/2009 Nickel 7440-02-0 0.00071 U 0.0020 0.00071TMW21 10/24/2009 Potassium 7440-09-7 0.63 ― 0.50 0.056TMW21 10/24/2009 Selenium 7782-49-2 0.0056 U 0.010 0.0056TMW21 10/24/2009 Silver 7440-22-4 0.00072 U 0.0050 0.00072TMW21 10/24/2009 Sodium 7440-23-5 660 ― 50 6.2TMW21 10/24/2009 Thallium 7440-28-0 0.0026 U 0.0050 0.0026TMW21 10/24/2009 Vanadium 7440-62-2 0.009 ― 0.0050 0.0011TMW21 10/24/2009 Zinc 7440-66-6 0.0022 E 0.010 0.0012TMW22 10/19/2009 Aluminum 7429-90-5 0.17 ― 0.050 0.016TMW22 10/19/2009 Antimony 7440-36-0 0.0034 U 0.0060 0.0034TMW22 10/19/2009 Arsenic 7440-38-2 0.0049 E 0.0050 0.0044TMW22 10/19/2009 Barium 7440-39-3 0.02 ― 0.0030 0.00024TMW22 10/19/2009 Beryllium 7440-41-7 0.00005 U 0.0010 0.00005TMW22 10/19/2009 Cadmium 7440-43-9 0.00043 U 0.0050 0.00043TMW22 10/19/2009 Calcium 7440-70-2 28 ― 5.0 0.090TMW22 10/19/2009 Chromium 7440-47-3 0.0009 E 0.0020 0.00050TMW22 10/19/2009 Cobalt 7440-48-4 0.00025 U 0.0050 0.00025TMW22 10/19/2009 Copper 7440-50-8 0.0021 U 0.020 0.0021TMW22 10/19/2009 Iron 7439-89-6 0.081 E 0.30 0.0097TMW22 10/19/2009 Lead 7439-92-1 0.0018 U 0.0050 0.0018TMW22 10/19/2009 Magnesium 7439-95-4 10 ― 5.0 0.085TMW22 10/19/2009 Manganese 7439-96-5 0.057 E 0.0010 0.00034TMW22 10/19/2009 Mercury 7439-97-6 0.000050 U 0.00020 0.000050TMW22 10/19/2009 Nickel 7440-02-0 0.0021 ― 0.0020 0.00071TMW22 10/19/2009 Potassium 7440-09-7 1.0 ― 0.50 0.056TMW22 10/19/2009 Selenium 7782-49-2 0.0056 U 0.010 0.0056TMW22 10/19/2009 Silver 7440-22-4 0.00072 U 0.0050 0.00072TMW22 10/19/2009 Sodium 7440-23-5 830 ― 50 6.2TMW22 10/19/2009 Thallium 7440-28-0 0.0026 U 0.0050 0.0026TMW22 10/19/2009 Vanadium 7440-62-2 0.012 ― 0.0050 0.0011TMW22 10/19/2009 Zinc 7440-66-6 0.0067 E 0.010 0.0012TMW23 10/19/2009 Aluminum 7429-90-5 0.44 ― 0.050 0.016TMW23 10/19/2009 Antimony 7440-36-0 0.0034 U 0.0060 0.0034

Table 1–2 51
Table 1–2. Dissolved cations and mercury analyzed according to the U.S. Environmental Protection Agency’s methods SW846 6010B/6020 and SW846 7471, respectively.—Continued
[CAS, Chemical Abstract Services; mg/L, milligrams per liter; U, undetected; ―, unqualified result; E, estimated concentration]
Site designation
Collection date
Analyte CAS number1 Result (mg/L)
QualifierLaboratory
reporting level (mg/L)
Laboratory detection limit
(mg/L)
TMW23 10/19/2009 Arsenic 7440-38-2 0.0044 U 0.0050 0.0044TMW23 10/19/2009 Barium 7440-39-3 0.024 ― 0.0030 0.00024TMW23 10/19/2009 Beryllium 7440-41-7 0.00005 U 0.0010 0.00005TMW23 10/19/2009 Cadmium 7440-43-9 0.00043 U 0.0050 0.00043TMW23 10/19/2009 Calcium 7440-70-2 16 ― 5.0 0.090TMW23 10/19/2009 Chromium 7440-47-3 0.0024 ― 0.0020 0.00050TMW23 10/19/2009 Cobalt 7440-48-4 0.00025 U 0.0050 0.00025TMW23 10/19/2009 Copper 7440-50-8 0.0021 U 0.020 0.0021TMW23 10/19/2009 Iron 7439-89-6 0.22 E 0.30 0.0097TMW23 10/19/2009 Lead 7439-92-1 0.0018 U 0.0050 0.0018TMW23 10/19/2009 Magnesium 7439-95-4 4.9 ― 0.50 0.0085TMW23 10/19/2009 Manganese 7439-96-5 0.023 E 0.0010 0.00034TMW23 10/19/2009 Mercury 7439-97-6 0.000050 U 0.00020 0.000050TMW23 10/19/2009 Nickel 7440-02-0 0.00071 U 0.0020 0.00071TMW23 10/19/2009 Potassium 7440-09-7 0.53 ― 0.50 0.056TMW23 10/19/2009 Selenium 7782-49-2 0.0056 U 0.010 0.0056TMW23 10/19/2009 Silver 7440-22-4 0.00072 U 0.0050 0.00072TMW23 10/19/2009 Sodium 7440-23-5 770 ― 50 6.2TMW23 10/19/2009 Thallium 7440-28-0 0.0026 U 0.0050 0.0026TMW23 10/19/2009 Vanadium 7440-62-2 0.0094 ― 0.0050 0.0011TMW23 10/19/2009 Zinc 7440-66-6 0.004 E 0.010 0.0012TMW24 10/19/2009 Aluminum 7429-90-5 0.016 U 0.050 0.016TMW24 10/19/2009 Antimony 7440-36-0 0.0034 U 0.0060 0.0034TMW24 10/19/2009 Arsenic 7440-38-2 0.0057 ― 0.0050 0.0044TMW24 10/19/2009 Barium 7440-39-3 0.036 ― 0.0030 0.00024TMW24 10/19/2009 Beryllium 7440-41-7 0.00005 U 0.0010 0.00005TMW24 10/19/2009 Cadmium 7440-43-9 0.00043 U 0.0050 0.00043TMW24 10/19/2009 Calcium 7440-70-2 26 ― 5.0 0.090TMW24 10/19/2009 Chromium 7440-47-3 0.0019 E 0.0020 0.00050TMW24 10/19/2009 Cobalt 7440-48-4 0.00025 U 0.0050 0.00025TMW24 10/19/2009 Copper 7440-50-8 0.0021 U 0.020 0.0021TMW24 10/19/2009 Iron 7439-89-6 0.0097 U 0.30 0.0097TMW24 10/19/2009 Lead 7439-92-1 0.0018 U 0.0050 0.0018TMW24 10/19/2009 Magnesium 7439-95-4 8.1 ― 0.50 0.0085TMW24 10/19/2009 Manganese 7439-96-5 0.14 E 0.0010 0.00034TMW24 10/19/2009 Mercury 7439-97-6 0.000050 U 0.00020 0.000050TMW24 10/19/2009 Nickel 7440-02-0 0.0019 E 0.0020 0.00071TMW24 10/19/2009 Potassium 7440-09-7 0.46 E 0.50 0.056TMW24 10/19/2009 Selenium 7782-49-2 0.0056 U 0.010 0.0056TMW24 10/19/2009 Silver 7440-22-4 0.00072 U 0.0050 0.00072TMW24 10/19/2009 Sodium 7440-23-5 890 ― 50 6.2TMW24 10/19/2009 Thallium 7440-28-0 0.0026 U 0.0050 0.0026

52 Geochemical Evidence of Groundwater Flow Paths and the Fate and Transport of Constituents of Concern
Table 1–2. Dissolved cations and mercury analyzed according to the U.S. Environmental Protection Agency’s methods SW846 6010B/6020 and SW846 7471, respectively.—Continued
[CAS, Chemical Abstract Services; mg/L, milligrams per liter; U, undetected; ―, unqualified result; E, estimated concentration]
Site designation
Collection date
Analyte CAS number1 Result (mg/L)
QualifierLaboratory
reporting level (mg/L)
Laboratory detection limit
(mg/L)
TMW24 10/19/2009 Vanadium 7440-62-2 0.0092 ― 0.0050 0.0011TMW24 10/19/2009 Zinc 7440-66-6 0.0037 E 0.010 0.0012TMW25 10/23/2009 Aluminum 7429-90-5 0.016 U 0.050 0.016TMW25 10/23/2009 Antimony 7440-36-0 0.0034 U 0.0060 0.0034TMW25 10/23/2009 Arsenic 7440-38-2 0.0044 U 0.0050 0.0044TMW25 10/23/2009 Barium 7440-39-3 0.01 ― 0.0030 0.00024TMW25 10/23/2009 Beryllium 7440-41-7 0.00005 U 0.0010 0.00005TMW25 10/23/2009 Cadmium 7440-43-9 0.00043 U 0.0050 0.00043TMW25 10/23/2009 Calcium 7440-70-2 58 ― 5.0 0.090TMW25 10/23/2009 Chromium 7440-47-3 0.00052 E 0.0020 0.00050TMW25 10/23/2009 Cobalt 7440-48-4 0.00025 U 0.0050 0.00025TMW25 10/23/2009 Copper 7440-50-8 0.0021 U 0.020 0.0021TMW25 10/23/2009 Iron 7439-89-6 0.0097 U 0.30 0.0097TMW25 10/23/2009 Lead 7439-92-1 0.0018 U 0.0050 0.0018TMW25 10/23/2009 Magnesium 7439-95-4 13 E 5.0 0.085TMW25 10/23/2009 Manganese 7439-96-5 0.098 ― 0.0010 0.00034TMW25 10/23/2009 Mercury 7439-97-6 0.000050 U 0.00020 0.000050TMW25 10/23/2009 Nickel 7440-02-0 0.00071 U 0.0020 0.00071TMW25 10/23/2009 Potassium 7440-09-7 0.26 E 0.50 0.056TMW25 10/23/2009 Selenium 7782-49-2 0.0056 U 0.010 0.0056TMW25 10/23/2009 Silver 7440-22-4 0.00072 U 0.0050 0.00072TMW25 10/23/2009 Sodium 7440-23-5 880 ― 50 6.2TMW25 10/23/2009 Thallium 7440-28-0 0.0026 U 0.0050 0.0026TMW25 10/23/2009 Vanadium 7440-62-2 0.011 ― 0.0050 0.0011TMW25 10/23/2009 Zinc 7440-66-6 0.0091 E 0.010 0.0012TMW26 10/17/2009 Aluminum 7429-90-5 0.077 ― 0.050 0.016TMW26 10/17/2009 Antimony 7440-36-0 0.0034 U 0.0060 0.0034TMW26 10/17/2009 Arsenic 7440-38-2 0.0044 U 0.0050 0.0044TMW26 10/17/2009 Barium 7440-39-3 0.016 ― 0.0030 0.00024TMW26 10/17/2009 Beryllium 7440-41-7 0.00005 U 0.0010 0.00005TMW26 10/17/2009 Cadmium 7440-43-9 0.00043 U 0.0050 0.00043TMW26 10/17/2009 Calcium 7440-70-2 16 ― 5.0 0.090TMW26 10/17/2009 Chromium 7440-47-3 0.00050 U 0.0020 0.00050TMW26 10/17/2009 Cobalt 7440-48-4 0.00025 U 0.0050 0.00025TMW26 10/17/2009 Copper 7440-50-8 0.0021 E 0.020 0.0021TMW26 10/17/2009 Iron 7439-89-6 0.022 E 0.30 0.0097TMW26 10/17/2009 Lead 7439-92-1 0.0018 U 0.0050 0.0018TMW26 10/17/2009 Magnesium 7439-95-4 7.4 ― 0.50 0.0085TMW26 10/17/2009 Manganese 7439-96-5 0.094 E 0.0010 0.00034TMW26 10/17/2009 Mercury 7439-97-6 0.000050 U 0.00020 0.000050TMW26 10/17/2009 Nickel 7440-02-0 0.0037 ― 0.0020 0.00071TMW26 10/17/2009 Potassium 7440-09-7 0.48 E 0.50 0.056

Table 1–2 53
Table 1–2. Dissolved cations and mercury analyzed according to the U.S. Environmental Protection Agency’s methods SW846 6010B/6020 and SW846 7471, respectively.—Continued
[CAS, Chemical Abstract Services; mg/L, milligrams per liter; U, undetected; ―, unqualified result; E, estimated concentration]
Site designation
Collection date
Analyte CAS number1 Result (mg/L)
QualifierLaboratory
reporting level (mg/L)
Laboratory detection limit
(mg/L)
TMW26 10/17/2009 Selenium 7782-49-2 0.0056 U 0.010 0.0056TMW26 10/17/2009 Silver 7440-22-4 0.00072 U 0.0050 0.00072TMW26 10/17/2009 Sodium 7440-23-5 800 ― 50 6.2TMW26 10/17/2009 Thallium 7440-28-0 0.0026 U 0.0050 0.0026TMW26 10/17/2009 Vanadium 7440-62-2 0.010 ― 0.0050 0.0011TMW26 10/17/2009 Zinc 7440-66-6 0.0078 E 0.010 0.0012TMW27 10/24/2009 Aluminum 7429-90-5 0.016 U 0.050 0.016TMW27 10/24/2009 Antimony 7440-36-0 0.0034 U 0.0060 0.0034TMW27 10/24/2009 Arsenic 7440-38-2 0.019 ― 0.0050 0.0044TMW27 10/24/2009 Barium 7440-39-3 0.1 ― 0.0030 0.00024TMW27 10/24/2009 Beryllium 7440-41-7 0.00005 U 0.0010 0.00005TMW27 10/24/2009 Cadmium 7440-43-9 0.00043 U 0.0050 0.00043TMW27 10/24/2009 Calcium 7440-70-2 24 ― 5.0 0.090TMW27 10/24/2009 Chromium 7440-47-3 0.00050 U 0.0020 0.00050TMW27 10/24/2009 Cobalt 7440-48-4 0.00025 U 0.0050 0.00025TMW27 10/24/2009 Copper 7440-50-8 0.0021 U 0.020 0.0021TMW27 10/24/2009 Iron 7439-89-6 0.0097 U 0.30 0.0097TMW27 10/24/2009 Lead 7439-92-1 0.0018 U 0.0050 0.0018TMW27 10/24/2009 Magnesium 7439-95-4 6.4 E 0.50 0.0085TMW27 10/24/2009 Manganese 7439-96-5 0.54 ― 0.010 0.0034TMW27 10/24/2009 Mercury 7439-97-6 0.00014 E 0.00020 0.000050TMW27 10/24/2009 Nickel 7440-02-0 0.0023 ― 0.0020 0.00071TMW27 10/24/2009 Potassium 7440-09-7 0.46 E 0.50 0.056TMW27 10/24/2009 Selenium 7782-49-2 0.0056 U 0.010 0.0056TMW27 10/24/2009 Silver 7440-22-4 0.00072 U 0.0050 0.00072TMW27 10/24/2009 Sodium 7440-23-5 340 ― 50 6.2TMW27 10/24/2009 Thallium 7440-28-0 0.0026 U 0.0050 0.0026TMW27 10/24/2009 Vanadium 7440-62-2 0.005 E 0.0050 0.0011TMW27 10/24/2009 Zinc 7440-66-6 0.0083 E 0.010 0.0012TMW28 10/19/2009 Aluminum 7429-90-5 0.016 U 0.050 0.016TMW28 10/19/2009 Antimony 7440-36-0 0.0034 U 0.0060 0.0034TMW28 10/19/2009 Arsenic 7440-38-2 0.0044 U 0.0050 0.0044TMW28 10/19/2009 Barium 7440-39-3 0.042 ― 0.0030 0.00024TMW28 10/19/2009 Beryllium 7440-41-7 0.00005 U 0.0010 0.00005TMW28 10/19/2009 Cadmium 7440-43-9 0.00043 U 0.0050 0.00043TMW28 10/19/2009 Calcium 7440-70-2 43 ― 5.0 0.090TMW28 10/19/2009 Chromium 7440-47-3 0.00050 U 0.0020 0.00050TMW28 10/19/2009 Cobalt 7440-48-4 0.00025 U 0.0050 0.00025TMW28 10/19/2009 Copper 7440-50-8 0.0021 U 0.020 0.0021TMW28 10/19/2009 Iron 7439-89-6 0.090 U 0.30 0.0097TMW28 10/19/2009 Lead 7439-92-1 0.0018 U 0.0050 0.0018TMW28 10/19/2009 Magnesium 7439-95-4 14 ― 5.0 0.085

54 Geochemical Evidence of Groundwater Flow Paths and the Fate and Transport of Constituents of Concern
Table 1–2. Dissolved cations and mercury analyzed according to the U.S. Environmental Protection Agency’s methods SW846 6010B/6020 and SW846 7471, respectively.—Continued
[CAS, Chemical Abstract Services; mg/L, milligrams per liter; U, undetected; ―, unqualified result; E, estimated concentration]
Site designation
Collection date
Analyte CAS number1 Result (mg/L)
QualifierLaboratory
reporting level (mg/L)
Laboratory detection limit
(mg/L)
TMW28 10/19/2009 Manganese 7439-96-5 0.22 E 0.010 0.0034TMW28 10/19/2009 Mercury 7439-97-6 0.000050 U 0.00020 0.000050TMW28 10/19/2009 Nickel 7440-02-0 0.00071 U 0.0020 0.00071TMW28 10/19/2009 Potassium 7440-09-7 1.0 ― 0.50 0.056TMW28 10/19/2009 Selenium 7782-49-2 0.0056 U 0.010 0.0056TMW28 10/19/2009 Silver 7440-22-4 0.00072 U 0.0050 0.00072TMW28 10/19/2009 Sodium 7440-23-5 300 ― 50 6.2TMW28 10/19/2009 Thallium 7440-28-0 0.0026 U 0.0050 0.0026TMW28 10/19/2009 Vanadium 7440-62-2 0.0069 E 0.0050 0.0011TMW28 10/19/2009 Zinc 7440-66-6 0.0078 E 0.010 0.0012TMW29 10/20/2009 Aluminum 7429-90-5 0.016 U 0.050 0.016TMW29 10/20/2009 Antimony 7440-36-0 0.0034 U 0.0060 0.0034TMW29 10/20/2009 Arsenic 7440-38-2 0.0052 ― 0.0050 0.0044TMW29 10/20/2009 Barium 7440-39-3 0.019 ― 0.0030 0.00024TMW29 10/20/2009 Beryllium 7440-41-7 0.00005 U 0.0010 0.00005TMW29 10/20/2009 Cadmium 7440-43-9 0.00043 U 0.0050 0.00043TMW29 10/20/2009 Calcium 7440-70-2 39 ― 5.0 0.090TMW29 10/20/2009 Chromium 7440-47-3 0.00050 U 0.0020 0.00050TMW29 10/20/2009 Cobalt 7440-48-4 0.00025 U 0.0050 0.00025TMW29 10/20/2009 Copper 7440-50-8 0.0021 U 0.020 0.0021TMW29 10/20/2009 Iron 7439-89-6 0.017 E 0.30 0.0097TMW29 10/20/2009 Lead 7439-92-1 0.0018 U 0.0050 0.0018TMW29 10/20/2009 Magnesium 7439-95-4 8.5 ― 0.50 0.0085TMW29 10/20/2009 Manganese 7439-96-5 0.01 ― 0.0010 0.00034TMW29 10/20/2009 Mercury 7439-97-6 0.000050 U 0.00020 0.000050TMW29 10/20/2009 Nickel 7440-02-0 0.00071 U 0.0020 0.00071TMW29 10/20/2009 Potassium 7440-09-7 1.1 ― 0.50 0.056TMW29 10/20/2009 Selenium 7782-49-2 0.021 ― 0.010 0.0056
TMW29 10/20/2009 Silver 7440-22-4 0.00072 U 0.0050 0.00072TMW29 10/20/2009 Sodium 7440-23-5 550 ― 50 6.2TMW29 10/20/2009 Thallium 7440-28-0 0.0026 U 0.0050 0.0026TMW29 10/20/2009 Vanadium 7440-62-2 0.012 ― 0.0050 0.0011TMW29 10/20/2009 Zinc 7440-66-6 0.0037 E 0.010 0.0012
1CAS Registry Numbers, which is a registered trademark of the American Chemical Society. CAS recommends the verification of the CAS Registry Numbers through CAS Client Services.

Table 1–3 55
Table 1–3
Table 1–3. Total cations and mercury analyzed according to the U.S. Environmental Protection Agency’s methods SW846 6010B/6020 and SW846 7471, respectively.—Continued
[CAS, Chemical Abstract Services; mg/L, milligrams per liter; ―, unqualified result; U, undetected; E, estimated concentration]
Site designation
Collection date
Analyte CAS number1 Result (mg/L)
QualifierLaboratory
reporting level (mg/L)
Laboratory detection limit
(mg/L)
MW01 10/22/2009 Aluminum 7429-90-5 4.6 ― 0.050 0.016MW01 10/22/2009 Antimony 7440-36-0 0.0034 U 0.0060 0.0034MW01 10/22/2009 Arsenic 7440-38-2 0.0044 U 0.0050 0.0044MW01 10/22/2009 Barium 7440-39-3 0.063 ― 0.0030 0.00024MW01 10/22/2009 Beryllium 7440-41-7 0.000050 U 0.0010 0.000050MW01 10/22/2009 Cadmium 7440-43-9 0.00086 E 0.0050 0.00043MW01 10/22/2009 Calcium 7440-70-2 27 ― 5.0 0.090MW01 10/22/2009 Chromium 7440-47-3 0.0045 ― 0.0020 0.00050MW01 10/22/2009 Cobalt 7440-48-4 0.00025 U 0.0050 0.00025MW01 10/22/2009 Copper 7440-50-8 0.0065 E 0.020 0.0021MW01 10/22/2009 Iron 7439-89-6 2.8 E 0.30 0.0097MW01 10/22/2009 Lead 7439-92-1 0.0047 E 0.0050 0.0018MW01 10/22/2009 Magnesium 7439-95-4 8.2 ― 5.0 0.085MW01 10/22/2009 Manganese 7439-96-5 0.20 ― 0.010 0.0034MW01 10/22/2009 Mercury 7439-97-6 0.000050 U 0.00020 0.000050MW01 10/22/2009 Nickel 7440-02-0 0.0049 ― 0.0020 0.00071MW01 10/22/2009 Potassium 7440-09-7 1.4 ― 0.50 0.056MW01 10/22/2009 Selenium 7782-49-2 0.024 ― 0.010 0.0056MW01 10/22/2009 Silver 7440-22-4 0.00072 U 0.0050 0.00072MW01 10/22/2009 Sodium 7440-23-5 730 ― 50 6.2MW01 10/22/2009 Thallium 7440-28-0 0.0026 U 0.0050 0.0026MW01 10/22/2009 Vanadium 7440-62-2 0.015 ― 0.010 0.0011MW01 10/22/2009 Zinc 7440-66-6 0.11 E 0.10 0.012MW02 10/22/2009 Aluminum 7429-90-5 14 ― 0.50 0.16MW02 10/22/2009 Antimony 7440-36-0 0.0034 U 0.0060 0.0034MW02 10/22/2009 Arsenic 7440-38-2 0.0044 U 0.0050 0.0044MW02 10/22/2009 Barium 7440-39-3 0.21 ― 0.030 0.0024MW02 10/22/2009 Beryllium 7440-41-7 0.00046 E 0.0010 0.000050MW02 10/22/2009 Cadmium 7440-43-9 0.00087 E 0.0050 0.00043MW02 10/22/2009 Calcium 7440-70-2 220 ― 50 0.90MW02 10/22/2009 Chromium 7440-47-3 0.011 ― 0.0020 0.00050MW02 10/22/2009 Cobalt 7440-48-4 0.0059 ― 0.0050 0.00025MW02 10/22/2009 Copper 7440-50-8 0.0070 E 0.020 0.0021MW02 10/22/2009 Iron 7439-89-6 10 E 3.0 0.097MW02 10/22/2009 Lead 7439-92-1 0.0093 ― 0.0050 0.0018MW02 10/22/2009 Magnesium 7439-95-4 46 ― 5.0 0.085MW02 10/22/2009 Manganese 7439-96-5 0.91 ― 0.010 0.0034MW02 10/22/2009 Mercury 7439-97-6 0.000050 U 0.00020 0.000050MW02 10/22/2009 Nickel 7440-02-0 0.0091 ― 0.0020 0.00071MW02 10/22/2009 Potassium 7440-09-7 3.0 ― 0.50 0.056MW02 10/22/2009 Selenium 7782-49-2 0.0056 U 0.010 0.0056MW02 10/22/2009 Silver 7440-22-4 0.00072 U 0.0050 0.00072
Table 1–3. Total cations and mercury analyzed according to the U.S. Environmental Protection Agency’s methods SW846 6010B/6020 and SW846 7471, respectively.
[CAS, Chemical Abstract Services; mg/L, milligrams per liter; ―, unqualified result; U, undetected; E, estimated concentration]

56 Geochemical Evidence of Groundwater Flow Paths and the Fate and Transport of Constituents of Concern
Table 1–3. Total cations and mercury analyzed according to the U.S. Environmental Protection Agency’s methods SW846 6010B/6020 and SW846 7471, respectively.—Continued
[CAS, Chemical Abstract Services; mg/L, milligrams per liter; ―, unqualified result; U, undetected; E, estimated concentration]
Site designation
Collection date
Analyte CAS number1 Result (mg/L)
QualifierLaboratory
reporting level (mg/L)
Laboratory detection limit
(mg/L)
MW02 10/22/2009 Sodium 7440-23-5 360 ― 50 6.2MW02 10/22/2009 Thallium 7440-28-0 0.0026 U 0.0050 0.0026MW02 10/22/2009 Vanadium 7440-62-2 0.025 ― 0.010 0.0011MW02 10/22/2009 Zinc 7440-66-6 0.98 E 0.10 0.012MW03 10/23/2009 Aluminum 7429-90-5 0.016 U 0.050 0.016MW03 10/23/2009 Antimony 7440-36-0 0.0034 U 0.0060 0.0034MW03 10/23/2009 Arsenic 7440-38-2 0.0044 U 0.0050 0.0044MW03 10/23/2009 Barium 7440-39-3 0.0093 ― 0.0030 0.00024MW03 10/23/2009 Beryllium 7440-41-7 0.000050 U 0.0010 0.000050MW03 10/23/2009 Cadmium 7440-43-9 0.00087 E 0.0050 0.00043MW03 10/23/2009 Calcium 7440-70-2 79 ― 5.0 0.090MW03 10/23/2009 Chromium 7440-47-3 0.00050 U 0.0020 0.00050MW03 10/23/2009 Cobalt 7440-48-4 0.00025 U 0.0050 0.00025MW03 10/23/2009 Copper 7440-50-8 0.0034 E 0.020 0.0021MW03 10/23/2009 Iron 7439-89-6 0.0097 U 0.30 0.0097MW03 10/23/2009 Lead 7439-92-1 0.0018 U 0.0050 0.0018MW03 10/23/2009 Magnesium 7439-95-4 16 ― 5.0 0.085MW03 10/23/2009 Manganese 7439-96-5 0.045 ― 0.0010 0.00034MW03 10/23/2009 Mercury 7439-97-6 0.000050 U 0.00020 0.000050MW03 10/23/2009 Nickel 7440-02-0 0.00071 U 0.0020 0.00071MW03 10/23/2009 Potassium 7440-09-7 0.55 ― 0.50 0.056MW03 10/23/2009 Selenium 7782-49-2 0.012 ― 0.010 0.0056MW03 10/23/2009 Silver 7440-22-4 0.00072 U 0.0050 0.00072MW03 10/23/2009 Sodium 7440-23-5 1,200 ― 500 62MW03 10/23/2009 Thallium 7440-28-0 0.0026 U 0.0050 0.0026MW03 10/23/2009 Vanadium 7440-62-2 0.012 ― 0.010 0.0011MW03 10/23/2009 Zinc 7440-66-6 0.041 ― 0.010 0.0012MW18D 10/23/2009 Aluminum 7429-90-5 0.83 ― 0.050 0.016MW18D 10/23/2009 Antimony 7440-36-0 0.0034 U 0.0060 0.0034MW18D 10/23/2009 Arsenic 7440-38-2 0.0044 U 0.0050 0.0044MW18D 10/23/2009 Barium 7440-39-3 0.023 ― 0.0030 0.00024MW18D 10/23/2009 Beryllium 7440-41-7 0.000050 U 0.0010 0.000050MW18D 10/23/2009 Cadmium 7440-43-9 0.00043 U 0.0050 0.00043MW18D 10/23/2009 Calcium 7440-70-2 67 ― 5.0 0.090MW18D 10/23/2009 Chromium 7440-47-3 0.0014 E 0.0020 0.00050MW18D 10/23/2009 Cobalt 7440-48-4 0.00025 U 0.0050 0.00025MW18D 10/23/2009 Copper 7440-50-8 0.0056 E 0.020 0.0021MW18D 10/23/2009 Iron 7439-89-6 0.90 ― 0.30 0.0097MW18D 10/23/2009 Lead 7439-92-1 0.0018 U 0.0050 0.0018MW18D 10/23/2009 Magnesium 7439-95-4 20 ― 5.0 0.085MW18D 10/23/2009 Manganese 7439-96-5 0.77 ― 0.010 0.0034MW18D 10/23/2009 Mercury 7439-97-6 0.000050 U 0.00020 0.000050

Table 1–3 57
Table 1–3. Total cations and mercury analyzed according to the U.S. Environmental Protection Agency’s methods SW846 6010B/6020 and SW846 7471, respectively.—Continued
[CAS, Chemical Abstract Services; mg/L, milligrams per liter; ―, unqualified result; U, undetected; E, estimated concentration]
Site designation
Collection date
Analyte CAS number1 Result (mg/L)
QualifierLaboratory
reporting level (mg/L)
Laboratory detection limit
(mg/L)
MW18D 10/23/2009 Nickel 7440-02-0 0.0054 ― 0.0020 0.00071MW18D 10/23/2009 Potassium 7440-09-7 1.0 ― 0.50 0.056MW18D 10/23/2009 Selenium 7782-49-2 0.0056 U 0.010 0.0056MW18D 10/23/2009 Silver 7440-22-4 0.00072 U 0.0050 0.00072MW18D 10/23/2009 Sodium 7440-23-5 1,900 ― 500 62MW18D 10/23/2009 Thallium 7440-28-0 0.0026 U 0.0050 0.0026MW18D 10/23/2009 Vanadium 7440-62-2 0.016 ― 0.010 0.0011MW18D 10/23/2009 Zinc 7440-66-6 0.26 ― 0.10 0.012MW20 10/23/2009 Aluminum 7429-90-5 0.016 U 0.050 0.016MW20 10/23/2009 Antimony 7440-36-0 0.0034 U 0.0060 0.0034MW20 10/23/2009 Arsenic 7440-38-2 0.0044 U 0.0050 0.0044MW20 10/23/2009 Barium 7440-39-3 0.015 ― 0.0030 0.00024MW20 10/23/2009 Beryllium 7440-41-7 0.000050 U 0.0010 0.000050MW20 10/23/2009 Cadmium 7440-43-9 0.00043 U 0.0050 0.00043MW20 10/23/2009 Calcium 7440-70-2 510 ― 50 0.90MW20 10/23/2009 Chromium 7440-47-3 0.0015 E 0.0020 0.00050MW20 10/23/2009 Cobalt 7440-48-4 0.00025 U 0.0050 0.00025MW20 10/23/2009 Copper 7440-50-8 0.0064 E 0.020 0.0021MW20 10/23/2009 Iron 7439-89-6 0.67 ― 0.30 0.0097MW20 10/23/2009 Lead 7439-92-1 0.0045 E 0.0050 0.0018MW20 10/23/2009 Magnesium 7439-95-4 110 ― 50 0.85MW20 10/23/2009 Manganese 7439-96-5 2.8 ― 0.10 0.034MW20 10/23/2009 Mercury 7439-97-6 0.000050 U 0.00020 0.000050MW20 10/23/2009 Nickel 7440-02-0 0.0085 ― 0.0020 0.00071MW20 10/23/2009 Potassium 7440-09-7 2.2 ― 0.50 0.056MW20 10/23/2009 Selenium 7782-49-2 0.23 ― 0.10 0.056MW20 10/23/2009 Silver 7440-22-4 0.00093 E 0.0050 0.00072MW20 10/23/2009 Sodium 7440-23-5 4,200 ― 500 62MW20 10/23/2009 Thallium 7440-28-0 0.0026 U 0.0050 0.0026MW20 10/23/2009 Vanadium 7440-62-2 0.0011 U 0.010 0.0011MW20 10/23/2009 Zinc 7440-66-6 0.35 ― 0.10 0.012MW22D 10/21/2009 Aluminum 7429-90-5 0.048 UE 0.050 0.016MW22D 10/21/2009 Antimony 7440-36-0 0.0053 E 0.0060 0.0034MW22D 10/21/2009 Arsenic 7440-38-2 0.0044 U 0.0050 0.0044MW22D 10/21/2009 Barium 7440-39-3 0.0094 ― 0.0030 0.00024MW22D 10/21/2009 Beryllium 7440-41-7 0.000050 U 0.0010 0.000050MW22D 10/21/2009 Cadmium 7440-43-9 0.00043 U 0.0050 0.00043MW22D 10/21/2009 Calcium 7440-70-2 81 ― 5.0 0.090MW22D 10/21/2009 Chromium 7440-47-3 0.0011 E 0.0020 0.00050MW22D 10/21/2009 Cobalt 7440-48-4 0.00025 U 0.0050 0.00025MW22D 10/21/2009 Copper 7440-50-8 0.0024 E 0.020 0.0021MW22D 10/21/2009 Iron 7439-89-6 0.18 E 0.30 0.0097

58 Geochemical Evidence of Groundwater Flow Paths and the Fate and Transport of Constituents of Concern
Table 1–3. Total cations and mercury analyzed according to the U.S. Environmental Protection Agency’s methods SW846 6010B/6020 and SW846 7471, respectively.—Continued
[CAS, Chemical Abstract Services; mg/L, milligrams per liter; ―, unqualified result; U, undetected; E, estimated concentration]
Site designation
Collection date
Analyte CAS number1 Result (mg/L)
QualifierLaboratory
reporting level (mg/L)
Laboratory detection limit
(mg/L)
MW22D 10/21/2009 Lead 7439-92-1 0.0018 U 0.0050 0.0018MW22D 10/21/2009 Magnesium 7439-95-4 15 E 5.0 0.085MW22D 10/21/2009 Manganese 7439-96-5 0.10 ― 0.0010 0.00034MW22D 10/21/2009 Mercury 7439-97-6 0.000050 U 0.00020 0.000050MW22D 10/21/2009 Nickel 7440-02-0 0.0030 ― 0.0020 0.00071MW22D 10/21/2009 Potassium 7440-09-7 0.59 ― 0.50 0.056MW22D 10/21/2009 Selenium 7782-49-2 0.051 ― 0.010 0.0056MW22D 10/21/2009 Silver 7440-22-4 0.00075 E 0.0050 0.00072MW22D 10/21/2009 Sodium 7440-23-5 1,100 ― 500 62MW22D 10/21/2009 Thallium 7440-28-0 0.0026 U 0.0050 0.0026MW22D 10/21/2009 Vanadium 7440-62-2 0.013 ― 0.010 0.0011MW22D 10/21/2009 Zinc 7440-66-6 0.069 ― 0.010 0.0012MW22S 10/20/2009 Aluminum 7429-90-5 13 ― 0.50 0.16MW22S 10/20/2009 Antimony 7440-36-0 0.0034 U 0.0060 0.0034MW22S 10/20/2009 Arsenic 7440-38-2 0.0078 ― 0.0050 0.0044MW22S 10/20/2009 Barium 7440-39-3 0.20 ― 0.030 0.0024MW22S 10/20/2009 Beryllium 7440-41-7 0.0012 ― 0.0010 0.000050MW22S 10/20/2009 Cadmium 7440-43-9 0.00043 U 0.0050 0.00043MW22S 10/20/2009 Calcium 7440-70-2 130 ― 50 0.90MW22S 10/20/2009 Chromium 7440-47-3 0.011 ― 0.0020 0.00050MW22S 10/20/2009 Cobalt 7440-48-4 0.0046 E 0.0050 0.00025MW22S 10/20/2009 Copper 7440-50-8 0.0090 E 0.020 0.0021MW22S 10/20/2009 Iron 7439-89-6 8.4 ― 0.30 0.0097MW22S 10/20/2009 Lead 7439-92-1 0.027 ― 0.0050 0.0018MW22S 10/20/2009 Magnesium 7439-95-4 28 ― 5.0 0.085MW22S 10/20/2009 Manganese 7439-96-5 0.40 ― 0.010 0.0034MW22S 10/20/2009 Mercury 7439-97-6 0.000050 U 0.00020 0.000050MW22S 10/20/2009 Nickel 7440-02-0 0.0076 ― 0.0020 0.00071MW22S 10/20/2009 Potassium 7440-09-7 2.5 ― 0.50 0.056MW22S 10/20/2009 Selenium 7782-49-2 0.057 ― 0.010 0.0056MW22S 10/20/2009 Silver 7440-22-4 0.00072 U 0.0050 0.00072MW22S 10/20/2009 Sodium 7440-23-5 1,100 ― 50 6.2MW22S 10/20/2009 Thallium 7440-28-0 0.0026 U 0.0050 0.0026MW22S 10/20/2009 Vanadium 7440-62-2 0.021 ― 0.010 0.0011MW22S 10/20/2009 Zinc 7440-66-6 0.038 ― 0.010 0.0012SMW01 10/24/2009 Aluminum 7429-90-5 0.33 ― 0.050 0.016SMW01 10/24/2009 Antimony 7440-36-0 0.0034 U 0.0060 0.0034SMW01 10/24/2009 Arsenic 7440-38-2 0.0044 E 0.0050 0.0044SMW01 10/24/2009 Barium 7440-39-3 0.022 ― 0.0030 0.00024SMW01 10/24/2009 Beryllium 7440-41-7 0.000050 U 0.0010 0.000050SMW01 10/24/2009 Cadmium 7440-43-9 0.00075 E 0.0050 0.00043SMW01 10/24/2009 Calcium 7440-70-2 22 ― 5.0 0.090

Table 1–3 59
Table 1–3. Total cations and mercury analyzed according to the U.S. Environmental Protection Agency’s methods SW846 6010B/6020 and SW846 7471, respectively.—Continued
[CAS, Chemical Abstract Services; mg/L, milligrams per liter; ―, unqualified result; U, undetected; E, estimated concentration]
Site designation
Collection date
Analyte CAS number1 Result (mg/L)
QualifierLaboratory
reporting level (mg/L)
Laboratory detection limit
(mg/L)
SMW01 10/24/2009 Chromium 7440-47-3 0.00053 E 0.0020 0.00050SMW01 10/24/2009 Cobalt 7440-48-4 0.00025 U 0.0050 0.00025SMW01 10/24/2009 Copper 7440-50-8 0.0026 E 0.020 0.0021SMW01 10/24/2009 Iron 7439-89-6 0.27 E 0.30 0.0097SMW01 10/24/2009 Lead 7439-92-1 0.0018 U 0.0050 0.0018SMW01 10/24/2009 Magnesium 7439-95-4 7.2 ― 0.50 0.0085SMW01 10/24/2009 Manganese 7439-96-5 0.059 ― 0.0010 0.00034SMW01 10/24/2009 Mercury 7439-97-6 0.000050 U 0.00020 0.000050SMW01 10/24/2009 Nickel 7440-02-0 0.0022 ― 0.0020 0.00071SMW01 10/24/2009 Potassium 7440-09-7 0.21 E 0.50 0.056SMW01 10/24/2009 Selenium 7782-49-2 0.0056 U 0.010 0.0056SMW01 10/24/2009 Silver 7440-22-4 0.00072 U 0.0050 0.00072SMW01 10/24/2009 Sodium 7440-23-5 470 ― 50 6.2SMW01 10/24/2009 Thallium 7440-28-0 0.0026 U 0.0050 0.0026SMW01 10/24/2009 Vanadium 7440-62-2 0.0095 E 0.010 0.0011SMW01 10/24/2009 Zinc 7440-66-6 0.0057 E 0.010 0.0012TMW01 10/14/2009 Aluminum 7429-90-5 0.016 U 0.050 0.016TMW01 10/14/2009 Antimony 7440-36-0 0.0034 U 0.0060 0.0034TMW01 10/14/2009 Arsenic 7440-38-2 0.011 ― 0.0050 0.0044TMW01 10/14/2009 Barium 7440-39-3 0.011 ― 0.0030 0.00024TMW01 10/14/2009 Beryllium 7440-41-7 0.000050 U 0.0010 0.000050TMW01 10/14/2009 Cadmium 7440-43-9 0.00043 U 0.0050 0.00043TMW01 10/14/2009 Calcium 7440-70-2 100 ― 50 0.90TMW01 10/14/2009 Chromium 7440-47-3 0.00056 E 0.0020 0.00050TMW01 10/14/2009 Cobalt 7440-48-4 0.00025 U 0.0050 0.00025TMW01 10/14/2009 Copper 7440-50-8 0.012 E 0.020 0.0021TMW01 10/14/2009 Iron 7439-89-6 0.0097 U 0.30 0.0097TMW01 10/14/2009 Lead 7439-92-1 0.0018 U 0.0050 0.0018TMW01 10/14/2009 Magnesium 7439-95-4 20 ― 5.0 0.085TMW01 10/14/2009 Manganese 7439-96-5 0.0047 ― 0.0010 0.00034TMW01 10/14/2009 Mercury 7439-97-6 0.000050 U 0.00020 0.000050TMW01 10/14/2009 Nickel 7440-02-0 0.00071 U 0.0020 0.00071TMW01 10/14/2009 Potassium 7440-09-7 0.54 ― 0.50 0.056TMW01 10/14/2009 Selenium 7782-49-2 0.020 ― 0.010 0.0056TMW01 10/14/2009 Silver 7440-22-4 0.00072 U 0.0050 0.00072TMW01 10/14/2009 Sodium 7440-23-5 560 ― 50 6.2TMW01 10/14/2009 Thallium 7440-28-0 0.0026 U 0.0050 0.0026TMW01 10/14/2009 Vanadium 7440-62-2 0.021 ― 0.010 0.0011TMW01 10/14/2009 Zinc 7440-66-6 0.0067 E 0.010 0.0012TMW03 10/14/2009 Aluminum 7429-90-5 0.016 U 0.050 0.016TMW03 10/14/2009 Antimony 7440-36-0 0.0034 U 0.0060 0.0034TMW03 10/14/2009 Arsenic 7440-38-2 0.010 ― 0.0050 0.0044

60 Geochemical Evidence of Groundwater Flow Paths and the Fate and Transport of Constituents of Concern
Table 1–3. Total cations and mercury analyzed according to the U.S. Environmental Protection Agency’s methods SW846 6010B/6020 and SW846 7471, respectively.—Continued
[CAS, Chemical Abstract Services; mg/L, milligrams per liter; ―, unqualified result; U, undetected; E, estimated concentration]
Site designation
Collection date
Analyte CAS number1 Result (mg/L)
QualifierLaboratory
reporting level (mg/L)
Laboratory detection limit
(mg/L)
TMW03 10/14/2009 Barium 7440-39-3 0.015 ― 0.0030 0.00024TMW03 10/14/2009 Beryllium 7440-41-7 0.000050 U 0.0010 0.000050TMW03 10/14/2009 Cadmium 7440-43-9 0.00043 U 0.0050 0.00043TMW03 10/14/2009 Calcium 7440-70-2 47 ― 5.0 0.090TMW03 10/14/2009 Chromium 7440-47-3 0.00064 E 0.0020 0.00050TMW03 10/14/2009 Cobalt 7440-48-4 0.00025 U 0.0050 0.00025TMW03 10/14/2009 Copper 7440-50-8 0.0021 E 0.020 0.0021TMW03 10/14/2009 Iron 7439-89-6 0.0097 U 0.30 0.0097TMW03 10/14/2009 Lead 7439-92-1 0.0018 U 0.0050 0.0018TMW03 10/14/2009 Magnesium 7439-95-4 12 ― 5.0 0.085TMW03 10/14/2009 Manganese 7439-96-5 0.057 ― 0.0010 0.00034TMW03 10/14/2009 Mercury 7439-97-6 0.000050 U 0.00020 0.000050TMW03 10/14/2009 Nickel 7440-02-0 0.00071 U 0.0020 0.00071TMW03 10/14/2009 Potassium 7440-09-7 0.53 ― 0.50 0.056TMW03 10/14/2009 Selenium 7782-49-2 0.083 ― 0.010 0.0056TMW03 10/14/2009 Silver 7440-22-4 0.00072 U 0.0050 0.00072TMW03 10/14/2009 Sodium 7440-23-5 940 ― 50 6.2TMW03 10/14/2009 Thallium 7440-28-0 0.0033 E 0.0050 0.0026TMW03 10/14/2009 Vanadium 7440-62-2 0.0089 E 0.010 0.0011TMW03 10/14/2009 Zinc 7440-66-6 0.047 ― 0.010 0.0012TMW04 10/14/2009 Aluminum 7429-90-5 0.016 U 0.050 0.016TMW04 10/14/2009 Antimony 7440-36-0 0.0034 U 0.0060 0.0034TMW04 10/14/2009 Arsenic 7440-38-2 0.0078 ― 0.0050 0.0044TMW04 10/14/2009 Barium 7440-39-3 0.0088 ― 0.0030 0.00024TMW04 10/14/2009 Beryllium 7440-41-7 0.000050 U 0.0010 0.000050TMW04 10/14/2009 Cadmium 7440-43-9 0.00043 U 0.0050 0.00043TMW04 10/14/2009 Calcium 7440-70-2 29 ― 5.0 0.090TMW04 10/14/2009 Chromium 7440-47-3 0.0018 E 0.0020 0.00050TMW04 10/14/2009 Cobalt 7440-48-4 0.00025 U 0.0050 0.00025TMW04 10/14/2009 Copper 7440-50-8 0.0021 U 0.020 0.0021TMW04 10/14/2009 Iron 7439-89-6 1.4 ― 0.30 0.0097TMW04 10/14/2009 Lead 7439-92-1 0.0018 U 0.0050 0.0018TMW04 10/14/2009 Magnesium 7439-95-4 6.1 ― 0.50 0.0085TMW04 10/14/2009 Manganese 7439-96-5 0.0040 ― 0.0010 0.00034TMW04 10/14/2009 Mercury 7439-97-6 0.000050 U 0.00020 0.000050TMW04 10/14/2009 Nickel 7440-02-0 0.00071 U 0.0020 0.00071TMW04 10/14/2009 Potassium 7440-09-7 0.89 ― 0.50 0.056TMW04 10/14/2009 Selenium 7782-49-2 0.11 ― 0.010 0.0056TMW04 10/14/2009 Silver 7440-22-4 0.00072 U 0.0050 0.00072TMW04 10/14/2009 Sodium 7440-23-5 950 ― 50 6.2TMW04 10/14/2009 Thallium 7440-28-0 0.0026 U 0.0050 0.0026TMW04 10/14/2009 Vanadium 7440-62-2 0.035 ― 0.010 0.0011
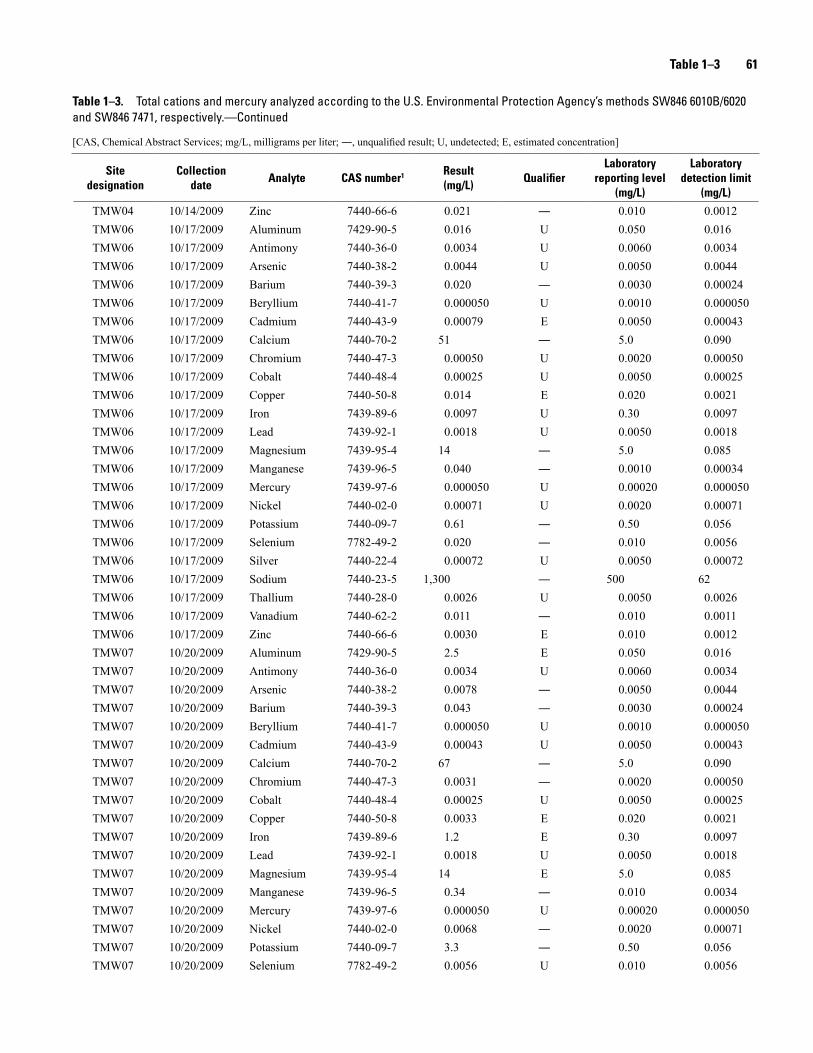
Table 1–3 61
Table 1–3. Total cations and mercury analyzed according to the U.S. Environmental Protection Agency’s methods SW846 6010B/6020 and SW846 7471, respectively.—Continued
[CAS, Chemical Abstract Services; mg/L, milligrams per liter; ―, unqualified result; U, undetected; E, estimated concentration]
Site designation
Collection date
Analyte CAS number1 Result (mg/L)
QualifierLaboratory
reporting level (mg/L)
Laboratory detection limit
(mg/L)
TMW04 10/14/2009 Zinc 7440-66-6 0.021 ― 0.010 0.0012TMW06 10/17/2009 Aluminum 7429-90-5 0.016 U 0.050 0.016TMW06 10/17/2009 Antimony 7440-36-0 0.0034 U 0.0060 0.0034TMW06 10/17/2009 Arsenic 7440-38-2 0.0044 U 0.0050 0.0044TMW06 10/17/2009 Barium 7440-39-3 0.020 ― 0.0030 0.00024TMW06 10/17/2009 Beryllium 7440-41-7 0.000050 U 0.0010 0.000050TMW06 10/17/2009 Cadmium 7440-43-9 0.00079 E 0.0050 0.00043TMW06 10/17/2009 Calcium 7440-70-2 51 ― 5.0 0.090TMW06 10/17/2009 Chromium 7440-47-3 0.00050 U 0.0020 0.00050TMW06 10/17/2009 Cobalt 7440-48-4 0.00025 U 0.0050 0.00025TMW06 10/17/2009 Copper 7440-50-8 0.014 E 0.020 0.0021TMW06 10/17/2009 Iron 7439-89-6 0.0097 U 0.30 0.0097TMW06 10/17/2009 Lead 7439-92-1 0.0018 U 0.0050 0.0018TMW06 10/17/2009 Magnesium 7439-95-4 14 ― 5.0 0.085TMW06 10/17/2009 Manganese 7439-96-5 0.040 ― 0.0010 0.00034TMW06 10/17/2009 Mercury 7439-97-6 0.000050 U 0.00020 0.000050TMW06 10/17/2009 Nickel 7440-02-0 0.00071 U 0.0020 0.00071TMW06 10/17/2009 Potassium 7440-09-7 0.61 ― 0.50 0.056TMW06 10/17/2009 Selenium 7782-49-2 0.020 ― 0.010 0.0056TMW06 10/17/2009 Silver 7440-22-4 0.00072 U 0.0050 0.00072TMW06 10/17/2009 Sodium 7440-23-5 1,300 ― 500 62TMW06 10/17/2009 Thallium 7440-28-0 0.0026 U 0.0050 0.0026TMW06 10/17/2009 Vanadium 7440-62-2 0.011 ― 0.010 0.0011TMW06 10/17/2009 Zinc 7440-66-6 0.0030 E 0.010 0.0012TMW07 10/20/2009 Aluminum 7429-90-5 2.5 E 0.050 0.016TMW07 10/20/2009 Antimony 7440-36-0 0.0034 U 0.0060 0.0034TMW07 10/20/2009 Arsenic 7440-38-2 0.0078 ― 0.0050 0.0044TMW07 10/20/2009 Barium 7440-39-3 0.043 ― 0.0030 0.00024TMW07 10/20/2009 Beryllium 7440-41-7 0.000050 U 0.0010 0.000050TMW07 10/20/2009 Cadmium 7440-43-9 0.00043 U 0.0050 0.00043TMW07 10/20/2009 Calcium 7440-70-2 67 ― 5.0 0.090TMW07 10/20/2009 Chromium 7440-47-3 0.0031 ― 0.0020 0.00050TMW07 10/20/2009 Cobalt 7440-48-4 0.00025 U 0.0050 0.00025TMW07 10/20/2009 Copper 7440-50-8 0.0033 E 0.020 0.0021TMW07 10/20/2009 Iron 7439-89-6 1.2 E 0.30 0.0097TMW07 10/20/2009 Lead 7439-92-1 0.0018 U 0.0050 0.0018TMW07 10/20/2009 Magnesium 7439-95-4 14 E 5.0 0.085TMW07 10/20/2009 Manganese 7439-96-5 0.34 ― 0.010 0.0034TMW07 10/20/2009 Mercury 7439-97-6 0.000050 U 0.00020 0.000050TMW07 10/20/2009 Nickel 7440-02-0 0.0068 ― 0.0020 0.00071TMW07 10/20/2009 Potassium 7440-09-7 3.3 ― 0.50 0.056TMW07 10/20/2009 Selenium 7782-49-2 0.0056 U 0.010 0.0056

62 Geochemical Evidence of Groundwater Flow Paths and the Fate and Transport of Constituents of Concern
Table 1–3. Total cations and mercury analyzed according to the U.S. Environmental Protection Agency’s methods SW846 6010B/6020 and SW846 7471, respectively.—Continued
[CAS, Chemical Abstract Services; mg/L, milligrams per liter; ―, unqualified result; U, undetected; E, estimated concentration]
Site designation
Collection date
Analyte CAS number1 Result (mg/L)
QualifierLaboratory
reporting level (mg/L)
Laboratory detection limit
(mg/L)
TMW07 10/20/2009 Silver 7440-22-4 0.00072 U 0.0050 0.00072TMW07 10/20/2009 Sodium 7440-23-5 1,300 ― 500 62TMW07 10/20/2009 Thallium 7440-28-0 0.0026 U 0.0050 0.0026TMW07 10/20/2009 Vanadium 7440-62-2 0.015 ― 0.010 0.0011TMW07 10/20/2009 Zinc 7440-66-6 0.029 ― 0.010 0.0012TMW08 10/17/2009 Aluminum 7429-90-5 0.016 U 0.050 0.016TMW08 10/17/2009 Antimony 7440-36-0 0.0034 U 0.0060 0.0034TMW08 10/17/2009 Arsenic 7440-38-2 0.0044 U 0.0050 0.0044TMW08 10/17/2009 Barium 7440-39-3 0.0080 ― 0.0030 0.00024TMW08 10/17/2009 Beryllium 7440-41-7 0.000050 U 0.0010 0.000050TMW08 10/17/2009 Cadmium 7440-43-9 0.00043 U 0.0050 0.00043TMW08 10/17/2009 Calcium 7440-70-2 260 ― 50 0.90TMW08 10/17/2009 Chromium 7440-47-3 0.00084 E 0.0020 0.00050TMW08 10/17/2009 Cobalt 7440-48-4 0.00025 U 0.0050 0.00025TMW08 10/17/2009 Copper 7440-50-8 0.0021 U 0.020 0.0021TMW08 10/17/2009 Iron 7439-89-6 2.7 ― 0.30 0.0097TMW08 10/17/2009 Lead 7439-92-1 0.0018 U 0.0050 0.0018TMW08 10/17/2009 Magnesium 7439-95-4 76 ― 5.0 0.085TMW08 10/17/2009 Manganese 7439-96-5 0.36 ― 0.010 0.0034TMW08 10/17/2009 Mercury 7439-97-6 0.000050 U 0.00020 0.000050TMW08 10/17/2009 Nickel 7440-02-0 0.0030 ― 0.0020 0.00071TMW08 10/17/2009 Potassium 7440-09-7 3.2 ― 0.50 0.056TMW08 10/17/2009 Selenium 7782-49-2 0.021 ― 0.010 0.0056TMW08 10/17/2009 Silver 7440-22-4 0.00072 U 0.0050 0.00072TMW08 10/17/2009 Sodium 7440-23-5 4,100 ― 500 62TMW08 10/17/2009 Thallium 7440-28-0 0.0026 U 0.0050 0.0026TMW08 10/17/2009 Vanadium 7440-62-2 0.0056 E 0.010 0.0011TMW08 10/17/2009 Zinc 7440-66-6 0.016 ― 0.010 0.0012TMW10 10/19/2009 Aluminum 7429-90-5 0.21 ― 0.050 0.016TMW10 10/19/2009 Antimony 7440-36-0 0.0034 U 0.0060 0.0034TMW10 10/19/2009 Arsenic 7440-38-2 0.0044 U 0.0050 0.0044TMW10 10/19/2009 Barium 7440-39-3 0.014 ― 0.0030 0.00024TMW10 10/19/2009 Beryllium 7440-41-7 0.000050 U 0.0010 0.000050TMW10 10/19/2009 Cadmium 7440-43-9 0.00043 U 0.0050 0.00043TMW10 10/19/2009 Calcium 7440-70-2 45 ― 5.0 0.090TMW10 10/19/2009 Chromium 7440-47-3 0.0044 ― 0.0020 0.00050TMW10 10/19/2009 Cobalt 7440-48-4 0.00025 U 0.0050 0.00025TMW10 10/19/2009 Copper 7440-50-8 0.023 ― 0.020 0.0021TMW10 10/19/2009 Iron 7439-89-6 0.34 ― 0.30 0.0097TMW10 10/19/2009 Lead 7439-92-1 0.0018 U 0.0050 0.0018TMW10 10/19/2009 Magnesium 7439-95-4 15 ― 5.0 0.085TMW10 10/19/2009 Manganese 7439-96-5 0.028 ― 0.0010 0.00034

Table 1–3 63
Table 1–3. Total cations and mercury analyzed according to the U.S. Environmental Protection Agency’s methods SW846 6010B/6020 and SW846 7471, respectively.—Continued
[CAS, Chemical Abstract Services; mg/L, milligrams per liter; ―, unqualified result; U, undetected; E, estimated concentration]
Site designation
Collection date
Analyte CAS number1 Result (mg/L)
QualifierLaboratory
reporting level (mg/L)
Laboratory detection limit
(mg/L)
TMW10 10/19/2009 Mercury 7439-97-6 0.000050 U 0.00020 0.000050TMW10 10/19/2009 Nickel 7440-02-0 0.0023 ― 0.0020 0.00071TMW10 10/19/2009 Potassium 7440-09-7 0.76 ― 0.50 0.056TMW10 10/19/2009 Selenium 7782-49-2 0.017 ― 0.010 0.0056TMW10 10/19/2009 Silver 7440-22-4 0.00072 U 0.0050 0.00072TMW10 10/19/2009 Sodium 7440-23-5 1,200 ― 500 62TMW10 10/19/2009 Thallium 7440-28-0 0.0027 E 0.0050 0.0026TMW10 10/19/2009 Vanadium 7440-62-2 0.010 ― 0.010 0.0011TMW10 10/19/2009 Zinc 7440-66-6 0.0029 E 0.010 0.0012TMW11 10/20/2009 Aluminum 7429-90-5 0.60 E 0.050 0.016TMW11 10/20/2009 Antimony 7440-36-0 0.0034 U 0.0060 0.0034TMW11 10/20/2009 Arsenic 7440-38-2 0.0059 ― 0.0050 0.0044TMW11 10/20/2009 Barium 7440-39-3 0.020 ― 0.0030 0.00024TMW11 10/20/2009 Beryllium 7440-41-7 0.000050 U 0.0010 0.000050TMW11 10/20/2009 Cadmium 7440-43-9 0.00043 U 0.0050 0.00043TMW11 10/20/2009 Calcium 7440-70-2 15 ― 5.0 0.090TMW11 10/20/2009 Chromium 7440-47-3 0.00066 E 0.0020 0.00050TMW11 10/20/2009 Cobalt 7440-48-4 0.00025 U 0.0050 0.00025TMW11 10/20/2009 Copper 7440-50-8 0.0021 U 0.020 0.0021TMW11 10/20/2009 Iron 7439-89-6 0.89 E 0.30 0.0097TMW11 10/20/2009 Lead 7439-92-1 0.0018 U 0.0050 0.0018TMW11 10/20/2009 Magnesium 7439-95-4 3.2 E 0.50 0.0085TMW11 10/20/2009 Manganese 7439-96-5 0.024 ― 0.0010 0.00034TMW11 10/20/2009 Mercury 7439-97-6 0.000050 U 0.00020 0.000050TMW11 10/20/2009 Nickel 7440-02-0 0.00071 U 0.0020 0.00071TMW11 10/20/2009 Potassium 7440-09-7 0.65 ― 0.50 0.056TMW11 10/20/2009 Selenium 7782-49-2 0.028 ― 0.010 0.0056TMW11 10/20/2009 Silver 7440-22-4 0.00072 U 0.0050 0.00072TMW11 10/20/2009 Sodium 7440-23-5 520 ― 50 6.2TMW11 10/20/2009 Thallium 7440-28-0 0.0026 U 0.0050 0.0026TMW11 10/20/2009 Vanadium 7440-62-2 0.0069 E 0.010 0.0011TMW11 10/20/2009 Zinc 7440-66-6 0.024 ― 0.010 0.0012TMW13 10/22/2009 Aluminum 7429-90-5 0.053 UE 0.050 0.016TMW13 10/22/2009 Antimony 7440-36-0 0.0034 U 0.0060 0.0034TMW13 10/22/2009 Arsenic 7440-38-2 0.0069 ― 0.0050 0.0044TMW13 10/22/2009 Barium 7440-39-3 0.016 ― 0.0030 0.00024TMW13 10/22/2009 Beryllium 7440-41-7 0.000050 U 0.0010 0.000050TMW13 10/22/2009 Cadmium 7440-43-9 0.00043 U 0.0050 0.00043TMW13 10/22/2009 Calcium 7440-70-2 27 ― 5.0 0.090TMW13 10/22/2009 Chromium 7440-47-3 0.00081 E 0.0020 0.00050TMW13 10/22/2009 Cobalt 7440-48-4 0.00025 U 0.0050 0.00025TMW13 10/22/2009 Copper 7440-50-8 0.0035 E 0.020 0.0021

64 Geochemical Evidence of Groundwater Flow Paths and the Fate and Transport of Constituents of Concern
Table 1–3. Total cations and mercury analyzed according to the U.S. Environmental Protection Agency’s methods SW846 6010B/6020 and SW846 7471, respectively.—Continued
[CAS, Chemical Abstract Services; mg/L, milligrams per liter; ―, unqualified result; U, undetected; E, estimated concentration]
Site designation
Collection date
Analyte CAS number1 Result (mg/L)
QualifierLaboratory
reporting level (mg/L)
Laboratory detection limit
(mg/L)
TMW13 10/22/2009 Iron 7439-89-6 0.051 UE 0.30 0.0097TMW13 10/22/2009 Lead 7439-92-1 0.0018 U 0.0050 0.0018TMW13 10/22/2009 Magnesium 7439-95-4 5.0 E 0.50 0.0085TMW13 10/22/2009 Manganese 7439-96-5 0.00098 E 0.0010 0.00034TMW13 10/22/2009 Mercury 7439-97-6 0.000050 U 0.00020 0.000050TMW13 10/22/2009 Nickel 7440-02-0 0.00071 U 0.0020 0.00071TMW13 10/22/2009 Potassium 7440-09-7 0.44 E 0.50 0.056TMW13 10/22/2009 Selenium 7782-49-2 0.0099 E 0.010 0.0056TMW13 10/22/2009 Silver 7440-22-4 0.00086 E 0.0050 0.00072TMW13 10/22/2009 Sodium 7440-23-5 560 ― 50 6.2TMW13 10/22/2009 Thallium 7440-28-0 0.0026 U 0.0050 0.0026TMW13 10/22/2009 Vanadium 7440-62-2 0.0094 E 0.010 0.0011TMW13 10/22/2009 Zinc 7440-66-6 0.0012 U 0.010 0.0012TMW15 10/26/2009 Aluminum 7429-90-5 0.016 U 0.050 0.016TMW15 10/26/2009 Antimony 7440-36-0 0.0034 E 0.0060 0.0034TMW15 10/26/2009 Arsenic 7440-38-2 0.0044 U 0.0050 0.0044TMW15 10/26/2009 Barium 7440-39-3 0.020 ― 0.0030 0.00024TMW15 10/26/2009 Beryllium 7440-41-7 0.000050 U 0.0010 0.000050TMW15 10/26/2009 Cadmium 7440-43-9 0.0012 E 0.0050 0.00043TMW15 10/26/2009 Calcium 7440-70-2 16 ― 5.0 0.090TMW15 10/26/2009 Chromium 7440-47-3 0.0014 E 0.0020 0.00050TMW15 10/26/2009 Cobalt 7440-48-4 0.00025 U 0.0050 0.00025TMW15 10/26/2009 Copper 7440-50-8 0.0021 U 0.020 0.0021TMW15 10/26/2009 Iron 7439-89-6 0.0097 U 0.30 0.0097TMW15 10/26/2009 Lead 7439-92-1 0.0018 U 0.0050 0.0018TMW15 10/26/2009 Magnesium 7439-95-4 3.6 ― 0.50 0.0085TMW15 10/26/2009 Manganese 7439-96-5 0.0021 ― 0.0010 0.00034TMW15 10/26/2009 Mercury 7439-97-6 0.000050 U 0.00020 0.000050TMW15 10/26/2009 Nickel 7440-02-0 0.00071 U 0.0020 0.00071TMW15 10/26/2009 Potassium 7440-09-7 0.50 E 0.50 0.056TMW15 10/26/2009 Selenium 7782-49-2 0.014 ― 0.010 0.0056TMW15 10/26/2009 Silver 7440-22-4 0.00072 U 0.0050 0.00072TMW15 10/26/2009 Sodium 7440-23-5 500 ― 50 6.2TMW15 10/26/2009 Thallium 7440-28-0 0.0026 U 0.0050 0.0026TMW15 10/26/2009 Vanadium 7440-62-2 0.0075 E 0.010 0.0011TMW15 10/26/2009 Zinc 7440-66-6 0.037 ― 0.010 0.0012TMW21 10/24/2009 Aluminum 7429-90-5 4.2 ― 0.050 0.016TMW21 10/24/2009 Antimony 7440-36-0 0.0034 U 0.0060 0.0034TMW21 10/24/2009 Arsenic 7440-38-2 0.0044 U 0.0050 0.0044TMW21 10/24/2009 Barium 7440-39-3 0.062 ― 0.0030 0.00024TMW21 10/24/2009 Beryllium 7440-41-7 0.000050 U 0.0010 0.000050TMW21 10/24/2009 Cadmium 7440-43-9 0.00043 U 0.0050 0.00043
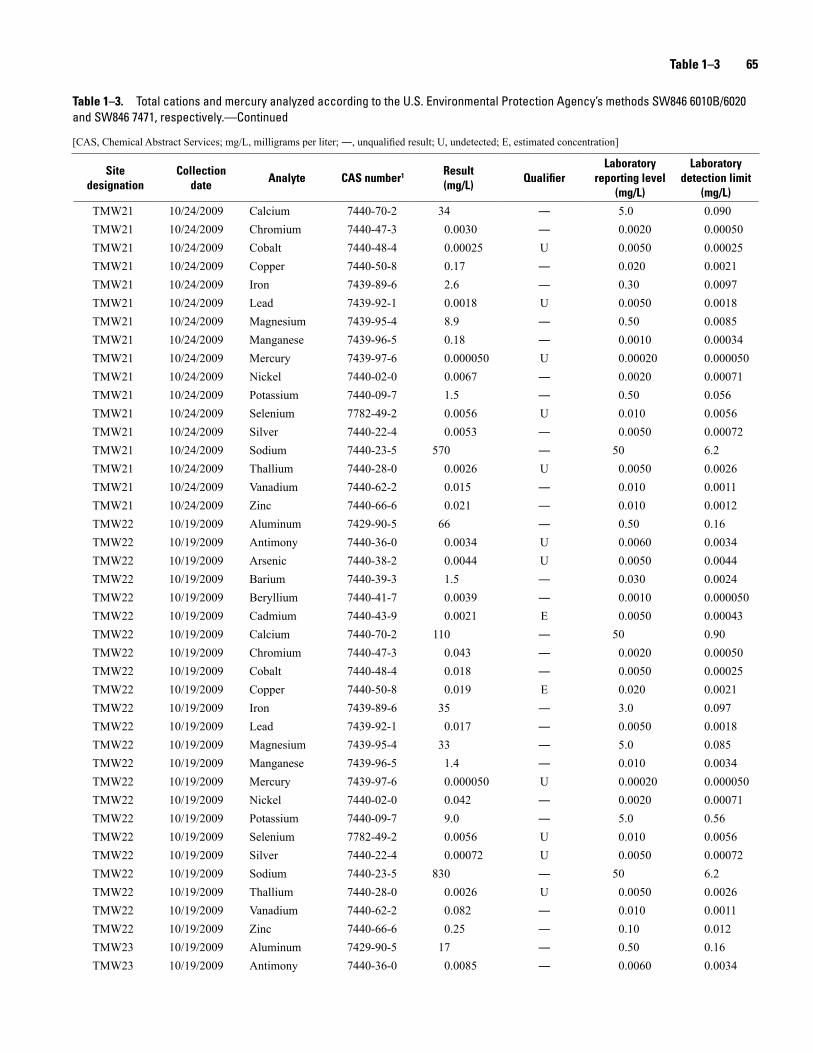
Table 1–3 65
Table 1–3. Total cations and mercury analyzed according to the U.S. Environmental Protection Agency’s methods SW846 6010B/6020 and SW846 7471, respectively.—Continued
[CAS, Chemical Abstract Services; mg/L, milligrams per liter; ―, unqualified result; U, undetected; E, estimated concentration]
Site designation
Collection date
Analyte CAS number1 Result (mg/L)
QualifierLaboratory
reporting level (mg/L)
Laboratory detection limit
(mg/L)
TMW21 10/24/2009 Calcium 7440-70-2 34 ― 5.0 0.090TMW21 10/24/2009 Chromium 7440-47-3 0.0030 ― 0.0020 0.00050TMW21 10/24/2009 Cobalt 7440-48-4 0.00025 U 0.0050 0.00025TMW21 10/24/2009 Copper 7440-50-8 0.17 ― 0.020 0.0021TMW21 10/24/2009 Iron 7439-89-6 2.6 ― 0.30 0.0097TMW21 10/24/2009 Lead 7439-92-1 0.0018 U 0.0050 0.0018TMW21 10/24/2009 Magnesium 7439-95-4 8.9 ― 0.50 0.0085TMW21 10/24/2009 Manganese 7439-96-5 0.18 ― 0.0010 0.00034TMW21 10/24/2009 Mercury 7439-97-6 0.000050 U 0.00020 0.000050TMW21 10/24/2009 Nickel 7440-02-0 0.0067 ― 0.0020 0.00071TMW21 10/24/2009 Potassium 7440-09-7 1.5 ― 0.50 0.056TMW21 10/24/2009 Selenium 7782-49-2 0.0056 U 0.010 0.0056TMW21 10/24/2009 Silver 7440-22-4 0.0053 ― 0.0050 0.00072TMW21 10/24/2009 Sodium 7440-23-5 570 ― 50 6.2TMW21 10/24/2009 Thallium 7440-28-0 0.0026 U 0.0050 0.0026TMW21 10/24/2009 Vanadium 7440-62-2 0.015 ― 0.010 0.0011TMW21 10/24/2009 Zinc 7440-66-6 0.021 ― 0.010 0.0012TMW22 10/19/2009 Aluminum 7429-90-5 66 ― 0.50 0.16TMW22 10/19/2009 Antimony 7440-36-0 0.0034 U 0.0060 0.0034TMW22 10/19/2009 Arsenic 7440-38-2 0.0044 U 0.0050 0.0044TMW22 10/19/2009 Barium 7440-39-3 1.5 ― 0.030 0.0024TMW22 10/19/2009 Beryllium 7440-41-7 0.0039 ― 0.0010 0.000050TMW22 10/19/2009 Cadmium 7440-43-9 0.0021 E 0.0050 0.00043TMW22 10/19/2009 Calcium 7440-70-2 110 ― 50 0.90TMW22 10/19/2009 Chromium 7440-47-3 0.043 ― 0.0020 0.00050TMW22 10/19/2009 Cobalt 7440-48-4 0.018 ― 0.0050 0.00025TMW22 10/19/2009 Copper 7440-50-8 0.019 E 0.020 0.0021TMW22 10/19/2009 Iron 7439-89-6 35 ― 3.0 0.097TMW22 10/19/2009 Lead 7439-92-1 0.017 ― 0.0050 0.0018TMW22 10/19/2009 Magnesium 7439-95-4 33 ― 5.0 0.085TMW22 10/19/2009 Manganese 7439-96-5 1.4 ― 0.010 0.0034TMW22 10/19/2009 Mercury 7439-97-6 0.000050 U 0.00020 0.000050TMW22 10/19/2009 Nickel 7440-02-0 0.042 ― 0.0020 0.00071TMW22 10/19/2009 Potassium 7440-09-7 9.0 ― 5.0 0.56TMW22 10/19/2009 Selenium 7782-49-2 0.0056 U 0.010 0.0056TMW22 10/19/2009 Silver 7440-22-4 0.00072 U 0.0050 0.00072TMW22 10/19/2009 Sodium 7440-23-5 830 ― 50 6.2TMW22 10/19/2009 Thallium 7440-28-0 0.0026 U 0.0050 0.0026TMW22 10/19/2009 Vanadium 7440-62-2 0.082 ― 0.010 0.0011TMW22 10/19/2009 Zinc 7440-66-6 0.25 ― 0.10 0.012TMW23 10/19/2009 Aluminum 7429-90-5 17 ― 0.50 0.16TMW23 10/19/2009 Antimony 7440-36-0 0.0085 ― 0.0060 0.0034

66 Geochemical Evidence of Groundwater Flow Paths and the Fate and Transport of Constituents of Concern
Table 1–3. Total cations and mercury analyzed according to the U.S. Environmental Protection Agency’s methods SW846 6010B/6020 and SW846 7471, respectively.—Continued
[CAS, Chemical Abstract Services; mg/L, milligrams per liter; ―, unqualified result; U, undetected; E, estimated concentration]
Site designation
Collection date
Analyte CAS number1 Result (mg/L)
QualifierLaboratory
reporting level (mg/L)
Laboratory detection limit
(mg/L)
TMW23 10/19/2009 Arsenic 7440-38-2 0.0044 U 0.0050 0.0044TMW23 10/19/2009 Barium 7440-39-3 0.34 ― 0.030 0.0024TMW23 10/19/2009 Beryllium 7440-41-7 0.0013 ― 0.0010 0.000050TMW23 10/19/2009 Cadmium 7440-43-9 0.00043 U 0.0050 0.00043TMW23 10/19/2009 Calcium 7440-70-2 47 ― 5.0 0.090TMW23 10/19/2009 Chromium 7440-47-3 0.016 ― 0.0020 0.00050TMW23 10/19/2009 Cobalt 7440-48-4 0.0072 ― 0.0050 0.00025TMW23 10/19/2009 Copper 7440-50-8 0.010 E 0.020 0.0021TMW23 10/19/2009 Iron 7439-89-6 11 ― 3.0 0.097TMW23 10/19/2009 Lead 7439-92-1 0.0067 ― 0.0050 0.0018TMW23 10/19/2009 Magnesium 7439-95-4 10 ― 5.0 0.085TMW23 10/19/2009 Manganese 7439-96-5 0.60 ― 0.010 0.0034TMW23 10/19/2009 Mercury 7439-97-6 0.000050 U 0.00020 0.000050TMW23 10/19/2009 Nickel 7440-02-0 0.015 ― 0.0020 0.00071TMW23 10/19/2009 Potassium 7440-09-7 3.7 ― 0.50 0.056TMW23 10/19/2009 Selenium 7782-49-2 0.0056 U 0.010 0.0056TMW23 10/19/2009 Silver 7440-22-4 0.00072 U 0.0050 0.00072TMW23 10/19/2009 Sodium 7440-23-5 820 ― 50 6.2TMW23 10/19/2009 Thallium 7440-28-0 0.0026 U 0.0050 0.0026TMW23 10/19/2009 Vanadium 7440-62-2 0.035 ― 0.010 0.0011TMW23 10/19/2009 Zinc 7440-66-6 0.047 ― 0.010 0.0012TMW24 10/19/2009 Aluminum 7429-90-5 0.016 U 0.050 0.016TMW24 10/19/2009 Antimony 7440-36-0 0.0091 ― 0.0060 0.0034TMW24 10/19/2009 Arsenic 7440-38-2 0.0066 ― 0.0050 0.0044TMW24 10/19/2009 Barium 7440-39-3 0.038 ― 0.0030 0.00024TMW24 10/19/2009 Beryllium 7440-41-7 0.000050 U 0.0010 0.000050TMW24 10/19/2009 Cadmium 7440-43-9 0.00043 U 0.0050 0.00043TMW24 10/19/2009 Calcium 7440-70-2 28 ― 5.0 0.090TMW24 10/19/2009 Chromium 7440-47-3 0.00050 U 0.0020 0.00050TMW24 10/19/2009 Cobalt 7440-48-4 0.00025 U 0.0050 0.00025TMW24 10/19/2009 Copper 7440-50-8 0.0021 U 0.020 0.0021TMW24 10/19/2009 Iron 7439-89-6 0.0097 U 0.30 0.0097TMW24 10/19/2009 Lead 7439-92-1 0.0018 U 0.0050 0.0018TMW24 10/19/2009 Magnesium 7439-95-4 8.2 ― 0.50 0.0085TMW24 10/19/2009 Manganese 7439-96-5 0.15 ― 0.0010 0.00034TMW24 10/19/2009 Mercury 7439-97-6 0.000050 U 0.00020 0.000050TMW24 10/19/2009 Nickel 7440-02-0 0.0028 ― 0.0020 0.00071TMW24 10/19/2009 Potassium 7440-09-7 0.59 ― 0.50 0.056TMW24 10/19/2009 Selenium 7782-49-2 0.0056 U 0.010 0.0056TMW24 10/19/2009 Silver 7440-22-4 0.00072 U 0.0050 0.00072TMW24 10/19/2009 Sodium 7440-23-5 900 ― 50 6.2TMW24 10/19/2009 Thallium 7440-28-0 0.0026 U 0.0050 0.0026

Table 1–3 67
Table 1–3. Total cations and mercury analyzed according to the U.S. Environmental Protection Agency’s methods SW846 6010B/6020 and SW846 7471, respectively.—Continued
[CAS, Chemical Abstract Services; mg/L, milligrams per liter; ―, unqualified result; U, undetected; E, estimated concentration]
Site designation
Collection date
Analyte CAS number1 Result (mg/L)
QualifierLaboratory
reporting level (mg/L)
Laboratory detection limit
(mg/L)
TMW24 10/19/2009 Vanadium 7440-62-2 0.0099 E 0.010 0.0011TMW24 10/19/2009 Zinc 7440-66-6 0.0048 E 0.010 0.0012TMW25 10/23/2009 Aluminum 7429-90-5 0.016 U 0.050 0.016TMW25 10/23/2009 Antimony 7440-36-0 0.0034 U 0.0060 0.0034TMW25 10/23/2009 Arsenic 7440-38-2 0.0071 ― 0.0050 0.0044TMW25 10/23/2009 Barium 7440-39-3 0.014 ― 0.0030 0.00024TMW25 10/23/2009 Beryllium 7440-41-7 0.000050 U 0.0010 0.000050TMW25 10/23/2009 Cadmium 7440-43-9 0.00043 U 0.0050 0.00043TMW25 10/23/2009 Calcium 7440-70-2 56 ― 5.0 0.090TMW25 10/23/2009 Chromium 7440-47-3 0.00050 U 0.0020 0.00050TMW25 10/23/2009 Cobalt 7440-48-4 0.00025 U 0.0050 0.00025TMW25 10/23/2009 Copper 7440-50-8 0.0031 E 0.020 0.0021TMW25 10/23/2009 Iron 7439-89-6 1.6 ― 0.30 0.0097TMW25 10/23/2009 Lead 7439-92-1 0.0018 U 0.0050 0.0018TMW25 10/23/2009 Magnesium 7439-95-4 13 ― 5.0 0.085TMW25 10/23/2009 Manganese 7439-96-5 0.23 ― 0.010 0.0034TMW25 10/23/2009 Mercury 7439-97-6 0.000050 U 0.00020 0.000050TMW25 10/23/2009 Nickel 7440-02-0 0.0029 ― 0.0020 0.00071TMW25 10/23/2009 Potassium 7440-09-7 0.31 E 0.50 0.056TMW25 10/23/2009 Selenium 7782-49-2 0.0081 E 0.010 0.0056TMW25 10/23/2009 Silver 7440-22-4 0.00072 U 0.0050 0.00072TMW25 10/23/2009 Sodium 7440-23-5 860 ― 50 6.2TMW25 10/23/2009 Thallium 7440-28-0 0.0026 U 0.0050 0.0026TMW25 10/23/2009 Vanadium 7440-62-2 0.017 ― 0.010 0.0011TMW25 10/23/2009 Zinc 7440-66-6 0.038 ― 0.010 0.0012TMW26 10/17/2009 Aluminum 7429-90-5 1.2 ― 0.050 0.016TMW26 10/17/2009 Antimony 7440-36-0 0.011 ― 0.0060 0.0034TMW26 10/17/2009 Arsenic 7440-38-2 0.0061 ― 0.0050 0.0044TMW26 10/17/2009 Barium 7440-39-3 0.037 ― 0.0030 0.00024TMW26 10/17/2009 Beryllium 7440-41-7 0.000050 U 0.0010 0.000050TMW26 10/17/2009 Cadmium 7440-43-9 0.00043 U 0.0050 0.00043TMW26 10/17/2009 Calcium 7440-70-2 17 ― 5.0 0.090TMW26 10/17/2009 Chromium 7440-47-3 0.00080 E 0.0020 0.00050TMW26 10/17/2009 Cobalt 7440-48-4 0.00025 U 0.0050 0.00025TMW26 10/17/2009 Copper 7440-50-8 0.0039 E 0.020 0.0021TMW26 10/17/2009 Iron 7439-89-6 0.61 ― 0.30 0.0097TMW26 10/17/2009 Lead 7439-92-1 0.0018 U 0.0050 0.0018TMW26 10/17/2009 Magnesium 7439-95-4 7.2 ― 0.50 0.0085TMW26 10/17/2009 Manganese 7439-96-5 0.11 ― 0.0010 0.00034TMW26 10/17/2009 Mercury 7439-97-6 0.000050 U 0.00020 0.000050TMW26 10/17/2009 Nickel 7440-02-0 0.0037 ― 0.0020 0.00071TMW26 10/17/2009 Potassium 7440-09-7 0.71 ― 0.50 0.056

68 Geochemical Evidence of Groundwater Flow Paths and the Fate and Transport of Constituents of Concern
Table 1–3. Total cations and mercury analyzed according to the U.S. Environmental Protection Agency’s methods SW846 6010B/6020 and SW846 7471, respectively.—Continued
[CAS, Chemical Abstract Services; mg/L, milligrams per liter; ―, unqualified result; U, undetected; E, estimated concentration]
Site designation
Collection date
Analyte CAS number1 Result (mg/L)
QualifierLaboratory
reporting level (mg/L)
Laboratory detection limit
(mg/L)
TMW26 10/17/2009 Selenium 7782-49-2 0.0056 U 0.010 0.0056TMW26 10/17/2009 Silver 7440-22-4 0.00072 U 0.0050 0.00072TMW26 10/17/2009 Sodium 7440-23-5 840 ― 50 6.2TMW26 10/17/2009 Thallium 7440-28-0 0.0026 U 0.0050 0.0026TMW26 10/17/2009 Vanadium 7440-62-2 0.012 ― 0.010 0.0011TMW26 10/17/2009 Zinc 7440-66-6 0.012 ― 0.010 0.0012TMW27 10/24/2009 Aluminum 7429-90-5 0.016 U 0.050 0.016TMW27 10/24/2009 Antimony 7440-36-0 0.0034 U 0.0060 0.0034TMW27 10/24/2009 Arsenic 7440-38-2 0.029 ― 0.0050 0.0044TMW27 10/24/2009 Barium 7440-39-3 0.13 ― 0.0030 0.00024TMW27 10/24/2009 Beryllium 7440-41-7 0.000050 U 0.0010 0.000050TMW27 10/24/2009 Cadmium 7440-43-9 0.00043 U 0.0050 0.00043TMW27 10/24/2009 Calcium 7440-70-2 24 ― 5.0 0.090TMW27 10/24/2009 Chromium 7440-47-3 0.00050 U 0.0020 0.00050TMW27 10/24/2009 Cobalt 7440-48-4 0.00025 U 0.0050 0.00025TMW27 10/24/2009 Copper 7440-50-8 0.0021 U 0.020 0.0021TMW27 10/24/2009 Iron 7439-89-6 0.83 ― 0.30 0.0097TMW27 10/24/2009 Lead 7439-92-1 0.0018 U 0.0050 0.0018TMW27 10/24/2009 Magnesium 7439-95-4 6.6 ― 0.50 0.0085TMW27 10/24/2009 Manganese 7439-96-5 0.58 ― 0.010 0.0034TMW27 10/24/2009 Mercury 7439-97-6 0.000050 U 0.00020 0.000050TMW27 10/24/2009 Nickel 7440-02-0 0.00071 U 0.0020 0.00071TMW27 10/24/2009 Potassium 7440-09-7 0.50 E 0.50 0.056TMW27 10/24/2009 Selenium 7782-49-2 0.0056 U 0.010 0.0056TMW27 10/24/2009 Silver 7440-22-4 0.00072 U 0.0050 0.00072TMW27 10/24/2009 Sodium 7440-23-5 320 ― 50 6.2TMW27 10/24/2009 Thallium 7440-28-0 0.0026 U 0.0050 0.0026TMW27 10/24/2009 Vanadium 7440-62-2 0.0067 E 0.010 0.0011TMW27 10/24/2009 Zinc 7440-66-6 0.049 ― 0.010 0.0012TMW28 10/19/2009 Aluminum 7429-90-5 0.26 ― 0.050 0.016TMW28 10/19/2009 Antimony 7440-36-0 0.0040 E 0.0060 0.0034TMW28 10/19/2009 Arsenic 7440-38-2 0.0069 ― 0.0050 0.0044TMW28 10/19/2009 Barium 7440-39-3 0.053 ― 0.0030 0.00024TMW28 10/19/2009 Beryllium 7440-41-7 0.000050 U 0.0010 0.000050TMW28 10/19/2009 Cadmium 7440-43-9 0.0016 E 0.0050 0.00043TMW28 10/19/2009 Calcium 7440-70-2 42 ― 5.0 0.090TMW28 10/19/2009 Chromium 7440-47-3 0.00050 U 0.0020 0.00050TMW28 10/19/2009 Cobalt 7440-48-4 0.00025 U 0.0050 0.00025TMW28 10/19/2009 Copper 7440-50-8 0.0021 U 0.020 0.0021TMW28 10/19/2009 Iron 7439-89-6 1.1 ― 0.30 0.0097TMW28 10/19/2009 Lead 7439-92-1 0.0018 U 0.0050 0.0018TMW28 10/19/2009 Magnesium 7439-95-4 15 ― 5.0 0.085

Table 1–3 69
Table 1–3. Total cations and mercury analyzed according to the U.S. Environmental Protection Agency’s methods SW846 6010B/6020 and SW846 7471, respectively.—Continued
[CAS, Chemical Abstract Services; mg/L, milligrams per liter; ―, unqualified result; U, undetected; E, estimated concentration]
Site designation
Collection date
Analyte CAS number1 Result (mg/L)
QualifierLaboratory
reporting level (mg/L)
Laboratory detection limit
(mg/L)
TMW28 10/19/2009 Manganese 7439-96-5 0.24 ― 0.010 0.0034TMW28 10/19/2009 Mercury 7439-97-6 0.000050 U 0.00020 0.000050TMW28 10/19/2009 Nickel 7440-02-0 0.00071 U 0.0020 0.00071TMW28 10/19/2009 Potassium 7440-09-7 1.2 ― 0.50 0.056TMW28 10/19/2009 Selenium 7782-49-2 0.0056 U 0.010 0.0056TMW28 10/19/2009 Silver 7440-22-4 0.00072 U 0.0050 0.00072TMW28 10/19/2009 Sodium 7440-23-5 320 ― 50 6.2TMW28 10/19/2009 Thallium 7440-28-0 0.0026 U 0.0050 0.0026TMW28 10/19/2009 Vanadium 7440-62-2 0.0081 E 0.010 0.0011TMW28 10/19/2009 Zinc 7440-66-6 0.92 ― 0.10 0.012TMW29 10/20/2009 Aluminum 7429-90-5 49 E 0.50 0.16TMW29 10/20/2009 Antimony 7440-36-0 0.0034 U 0.0060 0.0034TMW29 10/20/2009 Arsenic 7440-38-2 0.0045 E 0.0050 0.0044TMW29 10/20/2009 Barium 7440-39-3 0.25 ― 0.030 0.0024TMW29 10/20/2009 Beryllium 7440-41-7 0.00093 E 0.0010 0.000050TMW29 10/20/2009 Cadmium 7440-43-9 0.00043 U 0.0050 0.00043TMW29 10/20/2009 Calcium 7440-70-2 60 ― 5.0 0.090TMW29 10/20/2009 Chromium 7440-47-3 0.012 ― 0.0020 0.00050TMW29 10/20/2009 Cobalt 7440-48-4 0.0066 ― 0.0050 0.00025TMW29 10/20/2009 Copper 7440-50-8 0.0064 E 0.020 0.0021TMW29 10/20/2009 Iron 7439-89-6 8.5 E 0.30 0.0097TMW29 10/20/2009 Lead 7439-92-1 0.0038 E 0.0050 0.0018TMW29 10/20/2009 Magnesium 7439-95-4 17 E 5.0 0.085TMW29 10/20/2009 Manganese 7439-96-5 0.35 ― 0.010 0.0034TMW29 10/20/2009 Mercury 7439-97-6 0.000050 U 0.00020 0.000050TMW29 10/20/2009 Nickel 7440-02-0 0.016 ― 0.0020 0.00071TMW29 10/20/2009 Potassium 7440-09-7 3.7 ― 0.50 0.056TMW29 10/20/2009 Selenium 7782-49-2 0.019 ― 0.010 0.0056TMW29 10/20/2009 Silver 7440-22-4 0.00072 U 0.0050 0.00072TMW29 10/20/2009 Sodium 7440-23-5 570 ― 50 6.2TMW29 10/20/2009 Thallium 7440-28-0 0.0026 U 0.0050 0.0026TMW29 10/20/2009 Vanadium 7440-62-2 0.034 ― 0.010 0.0011TMW29 10/20/2009 Zinc 7440-66-6 0.041 ― 0.010 0.0012
1CAS Registry Numbers, which is a registered trademark of the American Chemical Society. CAS recommends the verification of the CAS Registry Numbers through CAS Client Services.

70 Geochemical Evidence of Groundwater Flow Paths and the Fate and Transport of Constituents of Concern
Table 1–4
Table 1–4. Total anions analyzed according to the U.S. Environmental Protection Agency’s method SW-846 9056A.—Continued
[CAS, Chemical Abstract Services; mg/L, milligrams per liter; U, undetected; ―, unqualified result; E, estimated concentration]
Site designation
Collection date
Analyte CAS number1 Result (mg/L)
QualifierLaboratory
reporting level (mg/L)
Laboratory detection limit
(mg/L)
MW01 10/22/2009 Bromide 7726-95-6 0.23 U 0.40 0.23MW01 10/22/2009 Chloride 16887-00-6 48 ― 6.0 0.51MW01 10/22/2009 Fluoride 7782-41-4 0.70 E 1.0 0.12MW01 10/22/2009 Sulfate 18785-72-3 950 ― 100 4.6MW02 10/22/2009 Bromide 7726-95-6 0.21 ― 0.20 0.11MW02 10/22/2009 Chloride 16887-00-6 11 ― 3.0 0.25MW02 10/22/2009 Fluoride 7782-41-4 0.25 E 0.50 0.060MW02 10/22/2009 Sulfate 18785-72-3 750 ― 100 4.6MW03 10/23/2009 Bromide 7726-95-6 0.38 E 0.40 0.23MW03 10/23/2009 Chloride 16887-00-6 160 ― 15 1.3MW03 10/23/2009 Fluoride 7782-41-4 0.45 E 1.0 0.12MW03 10/23/2009 Sulfate 18785-72-3 1,600 ― 250 12MW18D 10/23/2009 Bromide 7726-95-6 1.4 ― 1.0 0.56MW18D 10/23/2009 Chloride 16887-00-6 630 ― 150 13MW18D 10/23/2009 Fluoride 7782-41-4 0.56 E 2.5 0.30MW18D 10/23/2009 Sulfate 18785-72-3 2,100 ― 250 12MW20 10/23/2009 Bromide 7726-95-6 5.7 ― 4.0 2.3MW20 10/23/2009 Chloride 16887-00-6 3,600 ― 600 51MW20 10/23/2009 Fluoride 7782-41-4 1.2 U 10 1.2MW20 10/23/2009 Sulfate 18785-72-3 5,700 ― 1000 46MW22D 10/21/2009 Bromide 7726-95-6 0.53 ― 0.40 0.23MW22D 10/21/2009 Chloride 16887-00-6 250 ― 30 2.5MW22D 10/21/2009 Fluoride 7782-41-4 0.41 E 1.0 0.12MW22D 10/21/2009 Sulfate 18785-72-3 1,400 ― 250 12MW22S 10/23/2009 Bromide 7726-95-6 2.1 ― 0.40 0.23MW22S 10/23/2009 Chloride 16887-00-6 340 ― 30 2.5MW22S 10/23/2009 Fluoride 7782-41-4 0.27 E 1.0 0.12MW22S 10/23/2009 Sulfate 18785-72-3 1,100 ― 250 12SMW01 10/24/2009 Bromide 7726-95-6 0.20 ― 0.20 0.11SMW01 10/24/2009 Chloride 16887-00-6 120 ― 30 2.5SMW01 10/24/2009 Fluoride 7782-41-4 0.82 ― 0.50 0.060SMW01 10/24/2009 Sulfate 18785-72-3 310 ― 50 2.3TMW01 10/14/2009 Bromide 7726-95-6 1.7 ― 0.20 0.11TMW01 10/14/2009 Chloride 16887-00-6 180 ― 15 1.3TMW01 10/14/2009 Fluoride 7782-41-4 0.44 E 0.50 0.060TMW01 10/14/2009 Sulfate 18785-72-3 840 ― 250 12TMW03 10/14/2009 Bromide 7726-95-6 0.23 U 0.40 0.23TMW03 10/14/2009 Chloride 16887-00-6 170 ― 30 2.5TMW03 10/14/2009 Fluoride 7782-41-4 0.98 E 1.0 0.12TMW03 10/14/2009 Sulfate 18785-72-3 970 ― 250 12TMW04 10/14/2009 Bromide 7726-95-6 0.80 ― 0.40 0.23TMW04 10/14/2009 Chloride 16887-00-6 150 ― 15 1.3
Table 1–4. Total anions analyzed according to the U.S. Environmental Protection Agency's method SW-846 9056A.
[CAS, Chemical Abstract Services; mg/L, milligrams per liter; U, undetected; ―, unqualified result; E, estimated concentration]

Table 1–4 71
Table 1–4. Total anions analyzed according to the U.S. Environmental Protection Agency’s method SW-846 9056A.—Continued
[CAS, Chemical Abstract Services; mg/L, milligrams per liter; U, undetected; ―, unqualified result; E, estimated concentration]
Site designation
Collection date
Analyte CAS number1 Result (mg/L)
QualifierLaboratory
reporting level (mg/L)
Laboratory detection limit
(mg/L)
TMW04 10/14/2009 Fluoride 7782-41-4 1.1 ― 1.0 0.12TMW04 10/14/2009 Sulfate 18785-72-3 1,200 ― 250 12TMW06 10/17/2009 Bromide 7726-95-6 0.42 ― 0.40 0.23TMW06 10/17/2009 Chloride 16887-00-6 140 ― 15 1.3TMW06 10/17/2009 Fluoride 7782-41-4 0.53 E 1.0 0.12TMW06 10/17/2009 Sulfate 18785-72-3 1,300 ― 250 12TMW07 10/20/2009 Bromide 7726-95-6 0.40 ― 0.40 0.23TMW07 10/20/2009 Chloride 16887-00-6 200 ― 15 1.3TMW07 10/20/2009 Fluoride 7782-41-4 0.43 E 1.0 0.12TMW07 10/20/2009 Sulfate 18785-72-3 1,900 ― 250 12TMW08 10/17/2009 Bromide 7726-95-6 4.2 ― 2.0 1.1TMW08 10/17/2009 Chloride 16887-00-6 1,700 ― 150 13TMW08 10/17/2009 Fluoride 7782-41-4 0.60 U 5.0 0.60TMW08 10/17/2009 Sulfate 18785-72-3 6,700 ― 1000 46TMW10 10/19/2009 Bromide 7726-95-6 0.27 E 0.40 0.23TMW10 10/19/2009 Chloride 16887-00-6 430 ― 60 5.1TMW10 10/19/2009 Fluoride 7782-41-4 0.57 E 1.0 0.12TMW10 10/19/2009 Sulfate 18785-72-3 1,200 ― 250 12TMW11 10/20/2009 Bromide 7726-95-6 0.58 ― 0.20 0.11TMW11 10/20/2009 Chloride 16887-00-6 59 ― 15 1.3TMW11 10/20/2009 Fluoride 7782-41-4 1.9 ― 0.50 0.060TMW11 10/20/2009 Sulfate 18785-72-3 220 ― 25 1.2TMW13 10/22/2009 Bromide 7726-95-6 0.56 ― 0.20 0.11TMW13 10/22/2009 Chloride 16887-00-6 69 ― 15 1.3TMW13 10/22/2009 Fluoride 7782-41-4 1.7 ― 0.50 0.060TMW13 10/22/2009 Sulfate 18785-72-3 340 ― 50 2.3TMW15 10/26/2009 Bromide 7726-95-6 0.49 ― 0.20 0.11TMW15 10/26/2009 Chloride 16887-00-6 61 ― 15 1.3TMW15 10/26/2009 Fluoride 7782-41-4 1.7 ― 0.50 0.060TMW15 10/26/2009 Sulfate 18785-72-3 240 ― 25 1.2TMW21 10/24/2009 Bromide 7726-95-6 0.39 ― 0.20 0.11TMW21 10/24/2009 Chloride 16887-00-6 49 ― 3.0 0.25TMW21 10/24/2009 Fluoride 7782-41-4 0.98 ― 0.50 0.060TMW21 10/24/2009 Sulfate 18785-72-3 560 ― 100 4.6TMW22 10/19/2009 Bromide 7726-95-6 0.58 ― 0.40 0.23TMW22 10/19/2009 Chloride 16887-00-6 140 ― 15 1.3TMW22 10/19/2009 Fluoride 7782-41-4 0.92 E 1.0 0.12TMW22 10/19/2009 Sulfate 18785-72-3 780 ― 100 4.6TMW23 10/19/2009 Bromide 7726-95-6 0.40 ― 0.40 0.23TMW23 10/19/2009 Chloride 16887-00-6 86 ― 15 1.3TMW23 10/19/2009 Fluoride 7782-41-4 0.79 E 1.0 0.12TMW23 10/19/2009 Sulfate 18785-72-3 680 ― 100 4.6

72 Geochemical Evidence of Groundwater Flow Paths and the Fate and Transport of Constituents of Concern
Table 1–4. Total anions analyzed according to the U.S. Environmental Protection Agency’s method SW-846 9056A.—Continued
[CAS, Chemical Abstract Services; mg/L, milligrams per liter; U, undetected; ―, unqualified result; E, estimated concentration]
Site designation
Collection date
Analyte CAS number1 Result (mg/L)
QualifierLaboratory
reporting level (mg/L)
Laboratory detection limit
(mg/L)
TMW24 10/19/2009 Bromide 7726-95-6 1.3 ― 0.40 0.23TMW24 10/19/2009 Chloride 16887-00-6 340 ― 60 5.1TMW24 10/19/2009 Fluoride 7782-41-4 0.98 E 1.0 0.12TMW24 10/19/2009 Sulfate 18785-72-3 530 ― 100 4.6TMW25 10/22/2009 Bromide 7726-95-6 1.0 ― 0.40 0.23TMW25 10/22/2009 Chloride 16887-00-6 220 ― 30 2.5TMW25 10/22/2009 Fluoride 7782-41-4 0.60 E 1.0 0.12TMW25 10/22/2009 Sulfate 18785-72-3 930 ― 250 12TMW26 10/17/2009 Bromide 7726-95-6 0.96 ― 0.40 0.23TMW26 10/17/2009 Chloride 16887-00-6 250 ― 60 5.1TMW26 10/17/2009 Fluoride 7782-41-4 1.8 ― 1.0 0.12TMW26 10/17/2009 Sulfate 18785-72-3 640 ― 100 4.6TMW27 10/24/2009 Bromide 7726-95-6 0.39 ― 0.20 0.11TMW27 10/24/2009 Chloride 16887-00-6 120 ― 15 1.3TMW27 10/24/2009 Fluoride 7782-41-4 0.99 ― 0.50 0.060TMW27 10/24/2009 Sulfate 18785-72-3 120 ― 25 1.2TMW29 10/20/2009 Bromide 7726-95-6 0.56 ― 0.20 0.11TMW29 10/20/2009 Chloride 16887-00-6 71 ― 15 1.3TMW29 10/20/2009 Fluoride 7782-41-4 0.91 ― 0.50 0.060TMW29 10/20/2009 Sulfate 18785-72-3 520 ― 100 4.6
1CAS Registry Numbers, which is a registered trademark of the American Chemical Society. CAS recommends the verification of the CAS Registry Numbers through CAS Client Services.

Table 1–5 73
Table 1–5
Table 1–5. Acid neutralizing capacity analyzed according to the U.S. Environmental Protection Agency’s Methods for Chemical Analysis of Water and Wastes (MCAWW) 310.1.—Continued
[mg/L, milligrams per liter; ―, unqualified result; U, undetected; E, estimated concentration]
Site designation
Collection date
AnalyteResult (mg/L)
QualifierLaboratory
reporting level (mg/L)
Laboratory detection limit
(mg/L)
MW01 10/22/2009 Bicarbonate, as calcium carbonate 920 ― 5.0 1.1MW01 10/22/2009 Carbonate, as calcium carbonate 1.1 U 5.0 1.1MW01 10/22/2009 Hydroxide, as calcium carbonate 1.1 U 5.0 1.1MW01 10/22/2009 Total acid neutralizing capacity, as
calcium carbonate920 ― 5.0 1.1
MW02 10/22/2009 Bicarbonate, as calcium carbonate 700 ― 5.0 1.1MW02 10/22/2009 Carbonate, as calcium carbonate 1.1 U 5.0 1.1MW02 10/22/2009 Hydroxide, as calcium carbonate 1.1 U 5.0 1.1MW02 10/22/2009 Total acid neutralizing capacity, as
calcium carbonate700 ― 5.0 1.1
MW03 10/23/2009 Bicarbonate, as calcium carbonate 950 ― 5.0 1.1MW03 10/23/2009 Carbonate, as calcium carbonate 1.1 U 5.0 1.1MW03 10/23/2009 Hydroxide, as calcium carbonate 1.1 U 5.0 1.1MW03 10/23/2009 Total acid neutralizing capacity, as
calcium carbonate950 ― 5.0 1.1
MW18D 10/23/2009 Bicarbonate, as calcium carbonate 1,600 ― 5.0 1.1MW18D 10/23/2009 Carbonate, as calcium carbonate 1.1 U 5.0 1.1MW18D 10/23/2009 Hydroxide, as calcium carbonate 1.1 U 5.0 1.1MW18D 10/23/2009 Total acid neutralizing capacity, as
calcium carbonate1,600 ― 5.0 1.1
MW20 10/23/2009 Bicarbonate, as calcium carbonate 1,200 ― 5.0 1.1MW20 10/23/2009 Carbonate, as calcium carbonate 1.1 U 5.0 1.1MW20 10/23/2009 Hydroxide, as calcium carbonate 1.1 U 5.0 1.1MW20 10/23/2009 Total acid neutralizing capacity, as
calcium carbonate1,200 ― 5.0 1.1
MW22D 10/21/2009 Bicarbonate, as calcium carbonate 830 ― 5.0 1.1MW22D 10/21/2009 Carbonate, as calcium carbonate 1.1 U 5.0 1.1MW22D 10/21/2009 Hydroxide, as calcium carbonate 1.1 U 5.0 1.1MW22D 10/21/2009 Total acid neutralizing capacity, as
calcium carbonate830 ― 5.0 1.1
MW22S 10/23/2009 Bicarbonate, as calcium carbonate 1,000 ― 5.0 1.1MW22S 10/23/2009 Carbonate, as calcium carbonate 1.1 U 5.0 1.1MW22S 10/23/2009 Hydroxide, as calcium carbonate 1.1 U 5.0 1.1MW22S 10/23/2009 Total acid neutralizing capacity, as
calcium carbonate1,000 ― 5.0 1.1
SMW01 10/24/2009 Bicarbonate, as calcium carbonate 610 ― 5.0 1.1SMW01 10/24/2009 Carbonate, as calcium carbonate 2.0 E 5.0 1.1SMW01 10/24/2009 Hydroxide, as calcium carbonate 1.1 U 5.0 1.1SMW01 10/24/2009 Total acid neutralizing capacity, as
calcium carbonate610 ― 5.0 1.1
TMW01 10/14/2009 Bicarbonate, as calcium carbonate 400 ― 5.0 1.1TMW01 10/14/2009 Carbonate, as calcium carbonate 1.1 U 5.0 1.1TMW01 10/14/2009 Hydroxide, as calcium carbonate 1.1 U 5.0 1.1
Table 1–5. Acid neutralizing capacity analyzed according to the U.S. Environmental Protection Agency’s Methods for Chemical Analysis of Water and Wastes (MCAWW) 310.1.
[mg/L, milligrams per liter; ―, unqualified result; U, undetected; E, estimated concentration]

74 Geochemical Evidence of Groundwater Flow Paths and the Fate and Transport of Constituents of Concern
Table 1–5. Acid neutralizing capacity analyzed according to the U.S. Environmental Protection Agency’s Methods for Chemical Analysis of Water and Wastes (MCAWW) 310.1.—Continued
[mg/L, milligrams per liter; ―, unqualified result; U, undetected; E, estimated concentration]
Site designation
Collection date
AnalyteResult (mg/L)
QualifierLaboratory
reporting level (mg/L)
Laboratory detection limit
(mg/L)
TMW01 10/14/2009 Total acid neutralizing capacity, as calcium carbonate
400 ― 5.0 1.1
TMW03 10/14/2009 Bicarbonate, as calcium carbonate 460 ― 5.0 1.1TMW03 10/14/2009 Carbonate, as calcium carbonate 1.1 U 5.0 1.1TMW03 10/14/2009 Hydroxide, as calcium carbonate 1.1 U 5.0 1.1TMW03 10/14/2009 Total acid neutralizing capacity, as
calcium carbonate460 ― 5.0 1.1
TMW04 10/14/2009 Bicarbonate, as calcium carbonate 440 ― 5.0 1.1TMW04 10/14/2009 Carbonate, as calcium carbonate 1.1 U 5.0 1.1TMW04 10/14/2009 Hydroxide, as calcium carbonate 1.1 U 5.0 1.1TMW04 10/14/2009 Total acid neutralizing capacity, as
calcium carbonate440 ― 5.0 1.1
TMW06 10/17/2009 Bicarbonate, as calcium carbonate 1,100 ― 5.0 1.1TMW06 10/17/2009 Carbonate, as calcium carbonate 1.1 U 5.0 1.1TMW06 10/17/2009 Hydroxide, as calcium carbonate 1.1 U 5.0 1.1TMW06 10/17/2009 Total acid neutralizing capacity, as
calcium carbonate1,100 ― 5.0 1.1
TMW07 10/20/2009 Bicarbonate, as calcium carbonate 740 ― 5.0 1.1TMW07 10/20/2009 Carbonate, as calcium carbonate 1.1 U 5.0 1.1TMW07 10/20/2009 Hydroxide, as calcium carbonate 1.1 U 5.0 1.1TMW07 10/20/2009 Total acid neutralizing capacity, as
calcium carbonate740 ― 5.0 1.1
TMW08 10/17/2009 Bicarbonate, as calcium carbonate 830 ― 5.0 1.1TMW08 10/17/2009 Carbonate, as calcium carbonate 1.1 U 5.0 1.1TMW08 10/17/2009 Hydroxide, as calcium carbonate 1.1 U 5.0 1.1TMW08 10/17/2009 Total acid neutralizing capacity, as
calcium carbonate830 ― 5.0 1.1
TMW10 10/19/2009 Bicarbonate, as calcium carbonate 680 ― 5.0 1.1TMW10 10/19/2009 Carbonate, as calcium carbonate 1.1 U 5.0 1.1TMW10 10/19/2009 Hydroxide, as calcium carbonate 1.1 U 5.0 1.1TMW10 10/19/2009 Total acid neutralizing capacity, as
calcium carbonate680 ― 5.0 1.1
TMW11 10/20/2009 Bicarbonate, as calcium carbonate 880 ― 5.0 1.1TMW11 10/20/2009 Carbonate, as calcium carbonate 1.1 U 5.0 1.1TMW11 10/20/2009 Hydroxide, as calcium carbonate 1.1 U 5.0 1.1TMW11 10/20/2009 Total acid neutralizing capacity, as
calcium carbonate880 ― 5.0 1.1
TMW13 10/22/2009 Bicarbonate, as calcium carbonate 830 ― 5.0 1.1TMW13 10/22/2009 Carbonate, as calcium carbonate 1.1 U 5.0 1.1TMW13 10/22/2009 Hydroxide, as calcium carbonate 1.1 U 5.0 1.1TMW13 10/22/2009 Total acid neutralizing capacity, as
calcium carbonate830 ― 5.0 1.1
TMW15 10/26/2009 Bicarbonate, as calcium carbonate 900 ― 5.0 1.1TMW15 10/26/2009 Carbonate, as calcium carbonate 1.1 U 5.0 1.1

Table 1–5 75
Table 1–5. Acid neutralizing capacity analyzed according to the U.S. Environmental Protection Agency’s Methods for Chemical Analysis of Water and Wastes (MCAWW) 310.1.—Continued
[mg/L, milligrams per liter; ―, unqualified result; U, undetected; E, estimated concentration]
Site designation
Collection date
AnalyteResult (mg/L)
QualifierLaboratory
reporting level (mg/L)
Laboratory detection limit
(mg/L)
TMW15 10/26/2009 Hydroxide, as calcium carbonate 1.1 U 5.0 1.1TMW15 10/26/2009 Total acid neutralizing capacity, as
calcium carbonate900 ― 5.0 1.1
TMW21 10/24/2009 Bicarbonate, as calcium carbonate 770 ― 5.0 1.1TMW21 10/24/2009 Carbonate, as calcium carbonate 1.1 U 5.0 1.1TMW21 10/24/2009 Hydroxide, as calcium carbonate 1.1 U 5.0 1.1TMW21 10/24/2009 Total acid neutralizing capacity, as
calcium carbonate770 ― 5.0 1.1
TMW22 10/19/2009 Bicarbonate, as calcium carbonate 820 ― 5.0 1.1TMW22 10/19/2009 Carbonate, as calcium carbonate 1.1 U 5.0 1.1TMW22 10/19/2009 Hydroxide, as calcium carbonate 1.1 U 5.0 1.1TMW22 10/19/2009 Total acid neutralizing capacity, as
calcium carbonate820 ― 5.0 1.1
TMW23 10/19/2009 Bicarbonate, as calcium carbonate 790 ― 5.0 1.1TMW23 10/19/2009 Carbonate, as calcium carbonate 1.1 U 5.0 1.1TMW23 10/19/2009 Hydroxide, as calcium carbonate 1.1 U 5.0 1.1TMW23 10/19/2009 Total acid neutralizing capacity, as
calcium carbonate790 ― 5.0 1.1
TMW24 10/19/2009 Bicarbonate, as calcium carbonate 1,000 ― 5.0 1.1TMW24 10/19/2009 Carbonate, as calcium carbonate 1.1 U 5.0 1.1TMW24 10/19/2009 Hydroxide, as calcium carbonate 1.1 U 5.0 1.1TMW24 10/19/2009 Total acid neutralizing capacity, as
calcium carbonate1,000 ― 5.0 1.1
TMW25 10/22/2009 Bicarbonate, as calcium carbonate 850 ― 5.0 1.1TMW25 10/22/2009 Carbonate, as calcium carbonate 1.1 U 5.0 1.1TMW25 10/22/2009 Hydroxide, as calcium carbonate 1.1 U 5.0 1.1TMW25 10/22/2009 Total Acid Neutralizing Capacity, as
calcium carbonate850 ― 5.0 1.1
TMW26 10/17/2009 Bicarbonate, as calcium carbonate 830 ― 5.0 1.1TMW26 10/17/2009 Carbonate, as calcium carbonate 8.5 ― 5.0 1.1TMW26 10/17/2009 Hydroxide, as calcium carbonate 1.1 U 5.0 1.1TMW26 10/17/2009 Total Acid Neutralizing Capacity, as
calcium carbonate840 ― 5.0 1.1
TMW27 10/24/2009 Bicarbonate, as calcium carbonate 540 ― 5.0 1.1TMW27 10/24/2009 Carbonate, as calcium carbonate 1.1 U 5.0 1.1TMW27 10/24/2009 Hydroxide, as calcium carbonate 1.1 U 5.0 1.1TMW27 10/24/2009 Total Acid Neutralizing Capacity, as
calcium carbonate540 ― 5.0 1.1
TMW29 10/20/2009 Bicarbonate, as calcium carbonate 770 ― 5.0 1.1TMW29 10/20/2009 Carbonate, as calcium carbonate 1.1 U 5.0 1.1TMW29 10/20/2009 Hydroxide, as calcium carbonate 1.1 U 5.0 1.1TMW29 10/20/2009 Total Acid Neutralizing Capacity, as
calcium carbonate770 ― 5.0 1.1

76 Geochemical Evidence of Groundwater Flow Paths and the Fate and Transport of Constituents of Concern
Table 1–6
Table 1–6. Explosives analyzed according to the U.S. Environmental Protection Agency’s method SW-846 8330B.—Continued
[CAS, Chemical Abstract Services; μg/L, micrograms per liter; U, undetected; E, estimated concentration; UE,undetected but detection limit estimated, ―, unqualified result]
Site designation
Collection date
AnalyteCAS
number1 Result (μg/L)
QualifierLaboratory
reporting level (μg/L)
Laboratory detection limit
(μg/L)MW01 10/22/2009 Dinitrobenzene, 1,3- 99-65-0 0.12 U 0.50 0.12MW01 10/22/2009 Dinitrotoluene, 2,4- 121-14-2 0.20 U 0.50 0.20MW01 10/22/2009 Dinitrotoluene, 2,6- 606-20-2 0.24 U 0.50 0.24MW01 10/22/2009 Dinitrotoluene, 2-Amino-4,6- 35572-78-2 0.12 U 0.50 0.12MW01 10/22/2009 Dinitrotoluene, 4-Amino-2,6- 19406-51-0 0.26 U 0.50 0.26MW01 10/22/2009 Hexahydro-1,3,5-Trinitro-1,3,5-
Triazine (RDX)121-82-4 0.28 U 0.50 0.28
MW01 10/22/2009 Nitrobenzene 98-95-3 0.22 U 0.50 0.22MW01 10/22/2009 Nitrotoluene, m- 99-08-1 0.26 U 0.50 0.26MW01 10/22/2009 Nitrotoluene, o- 88-72-2 0.16 U 0.50 0.16MW01 10/22/2009 Nitrotoluene, p- 99-99-0 0.30 U 0.50 0.30MW01 10/22/2009 Octahydro-1,3,5,7-tetranitro-1,3,5,7-
tetrazocine (HMX)2691-41-0 0.18 UE 0.99 0.18
MW01 10/22/2009 Tetryl (Trinitrophenylmethylnitramine)
479-45-8 0.18 U 0.50 0.18
MW01 10/22/2009 Trinitrobenzene, 1,3,5- 99-35-4 0.20 U 0.50 0.20MW01 10/22/2009 Trinitrotoluene, 2,4,6- 118-96-7 0.28 U 0.50 0.28MW02 10/22/2009 Dinitrobenzene, 1,3- 99-65-0 0.070 U 0.29 0.070MW02 10/22/2009 Dinitrotoluene, 2,4- 121-14-2 0.12 U 0.29 0.12MW02 10/22/2009 Dinitrotoluene, 2,6- 606-20-2 0.14 U 0.29 0.14MW02 10/22/2009 Dinitrotoluene, 2-Amino-4,6- 35572-78-2 0.070 U 0.29 0.070MW02 10/22/2009 Dinitrotoluene, 4-Amino-2,6- 19406-51-0 0.15 U 0.29 0.15MW02 10/22/2009 Hexahydro-1,3,5-Trinitro-1,3,5-
Triazine (RDX)121-82-4 0.16 U 0.29 0.16
MW02 10/22/2009 Nitrobenzene 98-95-3 0.13 U 0.29 0.13MW02 10/22/2009 Nitrotoluene, m- 99-08-1 0.15 U 0.29 0.15MW02 10/22/2009 Nitrotoluene, o- 88-72-2 0.090 U 0.29 0.090MW02 10/22/2009 Nitrotoluene, p- 99-99-0 0.17 U 0.29 0.17MW02 10/22/2009 Octahydro-1,3,5,7-tetranitro-1,3,5,7-
tetrazocine (HMX)2691-41-0 0.10 UE 0.58 0.10
MW02 10/22/2009 Tetryl (Trinitrophenylmethylnitramine)
479-45-8 0.10 U 0.29 0.10
MW02 10/22/2009 Trinitrobenzene, 1,3,5- 99-35-4 0.12 U 0.29 0.12MW02 10/22/2009 Trinitrotoluene, 2,4,6- 118-96-7 0.16 U 0.29 0.16MW03 10/23/2009 Dinitrobenzene, 1,3- 99-65-0 0.11 U 0.46 0.11MW03 10/23/2009 Dinitrotoluene, 2,4- 121-14-2 0.18 U 0.46 0.18MW03 10/23/2009 Dinitrotoluene, 2,6- 606-20-2 0.22 U 0.46 0.22MW03 10/23/2009 Dinitrotoluene, 2-Amino-4,6- 35572-78-2 0.11 U 0.46 0.11MW03 10/23/2009 Dinitrotoluene, 4-Amino-2,6- 19406-51-0 0.24 U 0.46 0.24MW03 10/23/2009 Hexahydro-1,3,5-Trinitro-1,3,5-
Triazine (RDX)121-82-4 0.25 U 0.46 0.25
MW03 10/23/2009 Nitrobenzene 98-95-3 0.20 U 0.46 0.20MW03 10/23/2009 Nitrotoluene, m- 99-08-1 0.24 U 0.46 0.24MW03 10/23/2009 Nitrotoluene, o- 88-72-2 0.14 U 0.46 0.14MW03 10/23/2009 Nitrotoluene, p- 99-99-0 0.27 U 0.46 0.27
Table 1–6. Explosives analyzed according to the U.S. Environmental Protection Agency’s method SW-846 8330B.
[CAS, Chemical Abstract Services; μg/L, micrograms per liter; U, undetected; E, estimated concentration; UE,undetected but detection limit estimated, ―, unqualified result]

Table 1–6 77
Table 1–6. Explosives analyzed according to the U.S. Environmental Protection Agency’s method SW-846 8330B.—Continued
[CAS, Chemical Abstract Services; μg/L, micrograms per liter; U, undetected; E, estimated concentration; UE,undetected but detection limit estimated, ―, unqualified result]
Site designation
Collection date
AnalyteCAS
number1 Result (μg/L)
QualifierLaboratory
reporting level (μg/L)
Laboratory detection limit
(μg/L)MW03 10/23/2009 Octahydro-1,3,5,7-tetranitro-1,3,5,7-
tetrazocine (HMX)2691-41-0 0.16 U 0.91 0.16
MW03 10/23/2009 Tetryl (Trinitrophenylmethylnitramine)
479-45-8 0.16 U 0.46 0.16
MW03 10/23/2009 Trinitrobenzene, 1,3,5- 99-35-4 0.18 U 0.46 0.18MW03 10/23/2009 Trinitrotoluene, 2,4,6- 118-96-7 0.25 U 0.46 0.25MW18D 10/23/2009 Dinitrobenzene, 1,3- 99-65-0 0.12 U 0.48 0.12MW18D 10/23/2009 Dinitrotoluene, 2,4- 121-14-2 0.19 U 0.48 0.19MW18D 10/23/2009 Dinitrotoluene, 2,6- 606-20-2 0.23 U 0.48 0.23MW18D 10/23/2009 Dinitrotoluene, 2-Amino-4,6- 35572-78-2 0.12 U 0.48 0.12MW18D 10/23/2009 Dinitrotoluene, 4-Amino-2,6- 19406-51-0 0.25 U 0.48 0.25MW18D 10/23/2009 Hexahydro-1,3,5-Trinitro-1,3,5-
Triazine (RDX)121-82-4 0.27 U 0.48 0.27
MW18D 10/23/2009 Nitrobenzene 98-95-3 0.21 U 0.48 0.21MW18D 10/23/2009 Nitrotoluene, m- 99-08-1 0.25 U 0.48 0.25MW18D 10/23/2009 Nitrotoluene, o- 88-72-2 0.16 U 0.48 0.16MW18D 10/23/2009 Nitrotoluene, p- 99-99-0 0.29 U 0.48 0.29MW18D 10/23/2009 Octahydro-1,3,5,7-tetranitro-1,3,5,7-
tetrazocine (HMX)2691-41-0 0.17 U 0.97 0.17
MW18D 10/23/2009 Tetryl (Trinitrophenylmethylnitramine)
479-45-8 0.17 U 0.48 0.17
MW18D 10/23/2009 Trinitrobenzene, 1,3,5- 99-35-4 0.19 U 0.48 0.19MW18D 10/23/2009 Trinitrotoluene, 2,4,6- 118-96-7 0.27 U 0.48 0.27MW20 10/23/2009 Dinitrobenzene, 1,3- 99-65-0 0.12 UE 0.50 0.12MW20 10/23/2009 Dinitrotoluene, 2,4- 121-14-2 0.20 UE 0.50 0.20MW20 10/23/2009 Dinitrotoluene, 2,6- 606-20-2 0.24 UE 0.50 0.24MW20 10/23/2009 Dinitrotoluene, 2-Amino-4,6- 35572-78-2 0.12 UE 0.50 0.12MW20 10/23/2009 Dinitrotoluene, 4-Amino-2,6- 19406-51-0 0.26 UE 0.50 0.26MW20 10/23/2009 Hexahydro-1,3,5-Trinitro-1,3,5-
Triazine (RDX)121-82-4 0.28 UE 0.50 0.28
MW20 10/23/2009 Nitrobenzene 98-95-3 0.22 UE 0.50 0.22MW20 10/23/2009 Nitrotoluene, m- 99-08-1 0.26 UE 0.50 0.26MW20 10/23/2009 Nitrotoluene, o- 88-72-2 0.16 UE 0.50 0.16MW20 10/23/2009 Nitrotoluene, p- 99-99-0 0.30 UE 0.50 0.30MW20 10/23/2009 Octahydro-1,3,5,7-tetranitro-1,3,5,7-
tetrazocine (HMX)2691-41-0 0.18 UE 0.99 0.18
MW20 10/23/2009 Tetryl (Trinitrophenylmethylnitramine)
479-45-8 0.18 UE 0.50 0.18
MW20 10/23/2009 Trinitrobenzene, 1,3,5- 99-35-4 0.20 UE 0.50 0.20MW20 10/23/2009 Trinitrotoluene, 2,4,6- 118-96-7 0.28 UE 0.50 0.28MW22D 10/21/2009 Dinitrobenzene, 1,3- 99-65-0 0.11 U 0.46 0.11MW22D 10/21/2009 Dinitrotoluene, 2,4- 121-14-2 0.19 U 0.46 0.19MW22D 10/21/2009 Dinitrotoluene, 2,6- 606-20-2 0.22 U 0.46 0.22MW22D 10/21/2009 Dinitrotoluene, 2-Amino-4,6- 35572-78-2 0.11 U 0.46 0.11MW22D 10/21/2009 Dinitrotoluene, 4-Amino-2,6- 19406-51-0 0.24 U 0.46 0.24

78 Geochemical Evidence of Groundwater Flow Paths and the Fate and Transport of Constituents of Concern
Table 1–6. Explosives analyzed according to the U.S. Environmental Protection Agency’s method SW-846 8330B.—Continued
[CAS, Chemical Abstract Services; μg/L, micrograms per liter; U, undetected; E, estimated concentration; UE,undetected but detection limit estimated, ―, unqualified result]
Site designation
Collection date
AnalyteCAS
number1 Result (μg/L)
QualifierLaboratory
reporting level (μg/L)
Laboratory detection limit
(μg/L)MW22D 10/21/2009 Hexahydro-1,3,5-Trinitro-1,3,5-
Triazine (RDX)121-82-4 0.26 U 0.46 0.26
MW22D 10/21/2009 Nitrobenzene 98-95-3 0.20 UE 0.46 0.20MW22D 10/21/2009 Nitrotoluene, m- 99-08-1 0.24 U 0.46 0.24MW22D 10/21/2009 Nitrotoluene, o- 88-72-2 0.15 U 0.46 0.15MW22D 10/21/2009 Nitrotoluene, p- 99-99-0 0.28 U 0.46 0.28MW22D 10/21/2009 Octahydro-1,3,5,7-tetranitro-1,3,5,7-
tetrazocine (HMX)2691-41-0 0.17 UE 0.93 0.17
MW22D 10/21/2009 Tetryl (Trinitrophenylmethylnitramine)
479-45-8 0.17 UE 0.46 0.17
MW22D 10/21/2009 Trinitrobenzene, 1,3,5- 99-35-4 0.19 U 0.46 0.19MW22D 10/21/2009 Trinitrotoluene, 2,4,6- 118-96-7 0.26 U 0.46 0.26MW22S 10/22/2009 Dinitrobenzene, 1,3- 99-65-0 0.11 U 0.46 0.11MW22S 10/22/2009 Dinitrotoluene, 2,4- 121-14-2 0.19 U 0.46 0.19MW22S 10/22/2009 Dinitrotoluene, 2,6- 606-20-2 0.22 U 0.46 0.22MW22S 10/22/2009 Dinitrotoluene, 2-Amino-4,6- 35572-78-2 0.11 U 0.46 0.11MW22S 10/22/2009 Dinitrotoluene, 4-Amino-2,6- 19406-51-0 0.24 U 0.46 0.24MW22S 10/22/2009 Hexahydro-1,3,5-Trinitro-1,3,5-
Triazine (RDX)121-82-4 0.26 U 0.46 0.26
MW22S 10/22/2009 Nitrobenzene 98-95-3 0.20 U 0.46 0.20MW22S 10/22/2009 Nitrotoluene, m- 99-08-1 0.24 U 0.46 0.24MW22S 10/22/2009 Nitrotoluene, o- 88-72-2 0.15 U 0.46 0.15MW22S 10/22/2009 Nitrotoluene, p- 99-99-0 0.28 U 0.46 0.28MW22S 10/22/2009 Octahydro-1,3,5,7-tetranitro-1,3,5,7-
tetrazocine (HMX)2691-41-0 0.17 UE 0.93 0.17
MW22S 10/22/2009 Tetryl (Trinitrophenylmethylnitramine)
479-45-8 0.17 U 0.46 0.17
MW22S 10/22/2009 Trinitrobenzene, 1,3,5- 99-35-4 0.19 U 0.46 0.19MW22S 10/22/2009 Trinitrotoluene, 2,4,6- 118-96-7 0.26 U 0.46 0.26TMW03 10/14/2009 Dinitrobenzene, 1,3- 99-65-0 0.11 U 0.47 0.11TMW03 10/14/2009 Dinitrotoluene, 2,4- 121-14-2 0.33 E 0.47 0.19TMW03 10/14/2009 Dinitrotoluene, 2,6- 606-20-2 0.22 U 0.47 0.22TMW03 10/14/2009 Dinitrotoluene, 2-Amino-4,6- 35572-78-2 1.5 ― 0.47 0.11TMW03 10/14/2009 Dinitrotoluene, 4-Amino-2,6- 19406-51-0 1.3 ― 0.47 0.24TMW03 10/14/2009 Hexahydro-1,3,5-Trinitro-1,3,5-
Triazine (RDX)121-82-4 370 ― 47 26
TMW03 10/14/2009 Nitrobenzene 98-95-3 4.1 ― 0.47 0.21TMW03 10/14/2009 Nitrotoluene, m- 99-08-1 0.24 U 0.47 0.24TMW03 10/14/2009 Nitrotoluene, o- 88-72-2 0.15 U 0.47 0.15TMW03 10/14/2009 Nitrotoluene, p- 99-99-0 0.28 U 0.47 0.28TMW03 10/14/2009 Octahydro-1,3,5,7-tetranitro-1,3,5,7-
tetrazocine (HMX)2691-41-0 0.17 U 0.94 0.17
TMW03 10/14/2009 Tetryl (Trinitrophenylmethylnitramine)
479-45-8 0.17 U 0.47 0.17
TMW03 10/14/2009 Trinitrobenzene, 1,3,5- 99-35-4 2.0 ― 0.47 0.19TMW03 10/14/2009 Trinitrotoluene, 2,4,6- 118-96-7 0.26 U 0.47 0.26

Table 1–6 79
Table 1–6. Explosives analyzed according to the U.S. Environmental Protection Agency’s method SW-846 8330B.—Continued
[CAS, Chemical Abstract Services; μg/L, micrograms per liter; U, undetected; E, estimated concentration; UE,undetected but detection limit estimated, ―, unqualified result]
Site designation
Collection date
AnalyteCAS
number1 Result (μg/L)
QualifierLaboratory
reporting level (μg/L)
Laboratory detection limit
(μg/L)TMW04 10/14/2009 Dinitrobenzene, 1,3- 99-65-0 0.060 U 0.25 0.060TMW04 10/14/2009 Dinitrotoluene, 2,4- 121-14-2 0.18 E 0.25 0.10TMW04 10/14/2009 Dinitrotoluene, 2,6- 606-20-2 0.12 U 0.25 0.12TMW04 10/14/2009 Dinitrotoluene, 2-Amino-4,6- 35572-78-2 2.8 ― 0.25 0.060TMW04 10/14/2009 Dinitrotoluene, 4-Amino-2,6- 19406-51-0 2.4 ― 0.25 0.13TMW04 10/14/2009 Hexahydro-1,3,5-Trinitro-1,3,5-
Triazine (RDX)121-82-4 2.3 ― 0.25 0.14
TMW04 10/14/2009 Nitrobenzene 98-95-3 5.4 ― 0.25 0.11TMW04 10/14/2009 Nitrotoluene, m- 99-08-1 0.13 U 0.25 0.13TMW04 10/14/2009 Nitrotoluene, o- 88-72-2 0.080 U 0.25 0.080TMW04 10/14/2009 Nitrotoluene, p- 99-99-0 0.15 U 0.25 0.15TMW04 10/14/2009 Octahydro-1,3,5,7-tetranitro-1,3,5,7-
tetrazocine (HMX)2691-41-0 0.090 U 0.50 0.090
TMW04 10/14/2009 Tetryl (Trinitrophenylmethylnitramine)
479-45-8 0.090 U 0.25 0.090
TMW04 10/14/2009 Trinitrobenzene, 1,3,5- 99-35-4 5.2 ― 0.25 0.10TMW04 10/14/2009 Trinitrotoluene, 2,4,6- 118-96-7 0.14 U 0.25 0.14TMW06 10/17/2009 Dinitrobenzene, 1,3- 99-65-0 0.060 UE 0.26 0.060TMW06 10/17/2009 Dinitrotoluene, 2,4- 121-14-2 0.10 UE 0.26 0.10TMW06 10/17/2009 Dinitrotoluene, 2,6- 606-20-2 0.12 UE 0.26 0.12TMW06 10/17/2009 Dinitrotoluene, 2-Amino-4,6- 35572-78-2 0.060 UE 0.26 0.060TMW06 10/17/2009 Dinitrotoluene, 4-Amino-2,6- 19406-51-0 0.14 UE 0.26 0.14TMW06 10/17/2009 Hexahydro-1,3,5-Trinitro-1,3,5-
Triazine (RDX)121-82-4 0.14 UE 0.26 0.14
TMW06 10/17/2009 Nitrobenzene 98-95-3 0.11 UE 0.26 0.11TMW06 10/17/2009 Nitrotoluene, m- 99-08-1 0.14 UE 0.26 0.14TMW06 10/17/2009 Nitrotoluene, o- 88-72-2 0.080 UE 0.26 0.080TMW06 10/17/2009 Nitrotoluene, p- 99-99-0 0.16 UE 0.26 0.16TMW06 10/17/2009 Octahydro-1,3,5,7-tetranitro-1,3,5,7-
tetrazocine (HMX)2691-41-0 0.090 UE 0.52 0.090
TMW06 10/17/2009 Tetryl (Trinitrophenylmethylnitramine)
479-45-8 0.090 UE 0.26 0.090
TMW06 10/17/2009 Trinitrobenzene, 1,3,5- 99-35-4 0.10 UE 0.26 0.10TMW06 10/17/2009 Trinitrotoluene, 2,4,6- 118-96-7 0.14 UE 0.26 0.14TMW07 10/20/2009 Dinitrobenzene, 1,3- 99-65-0 0.12 U 0.50 0.12TMW07 10/20/2009 Dinitrotoluene, 2,4- 121-14-2 0.20 U 0.50 0.20TMW07 10/20/2009 Dinitrotoluene, 2,6- 606-20-2 0.24 U 0.50 0.24TMW07 10/20/2009 Dinitrotoluene, 2-Amino-4,6- 35572-78-2 0.12 U 0.50 0.12TMW07 10/20/2009 Dinitrotoluene, 4-Amino-2,6- 19406-51-0 0.26 U 0.50 0.26TMW07 10/20/2009 Hexahydro-1,3,5-Trinitro-1,3,5-
Triazine (RDX)121-82-4 0.28 U 0.50 0.28
TMW07 10/20/2009 Nitrobenzene 98-95-3 0.22 UE 0.50 0.22TMW07 10/20/2009 Nitrotoluene, m- 99-08-1 0.26 U 0.50 0.26TMW07 10/20/2009 Nitrotoluene, o- 88-72-2 0.16 U 0.50 0.16TMW07 10/20/2009 Nitrotoluene, p- 99-99-0 0.30 U 0.50 0.30

80 Geochemical Evidence of Groundwater Flow Paths and the Fate and Transport of Constituents of Concern
Table 1–6. Explosives analyzed according to the U.S. Environmental Protection Agency’s method SW-846 8330B.—Continued
[CAS, Chemical Abstract Services; μg/L, micrograms per liter; U, undetected; E, estimated concentration; UE,undetected but detection limit estimated, ―, unqualified result]
Site designation
Collection date
AnalyteCAS
number1 Result (μg/L)
QualifierLaboratory
reporting level (μg/L)
Laboratory detection limit
(μg/L)TMW07 10/20/2009 Octahydro-1,3,5,7-tetranitro-1,3,5,7-
tetrazocine (HMX)2691-41-0 0.18 U 1.0 0.18
TMW07 10/20/2009 Tetryl (Trinitrophenylmethylnitramine)
479-45-8 0.18 U 0.50 0.18
TMW07 10/20/2009 Trinitrobenzene, 1,3,5- 99-35-4 0.20 U 0.50 0.20TMW07 10/20/2009 Trinitrotoluene, 2,4,6- 118-96-7 0.28 U 0.50 0.28TMW10 10/19/2009 Dinitrobenzene, 1,3- 99-65-0 0.11 U 0.47 0.11TMW10 10/19/2009 Dinitrotoluene, 2,4- 121-14-2 0.19 U 0.47 0.19TMW10 10/19/2009 Dinitrotoluene, 2,6- 606-20-2 0.22 U 0.47 0.22TMW10 10/19/2009 Dinitrotoluene, 2-Amino-4,6- 35572-78-2 0.11 U 0.47 0.11TMW10 10/19/2009 Dinitrotoluene, 4-Amino-2,6- 19406-51-0 0.24 U 0.47 0.24TMW10 10/19/2009 Hexahydro-1,3,5-Trinitro-1,3,5-
Triazine (RDX)121-82-4 0.26 U 0.47 0.26
TMW10 10/19/2009 Nitrobenzene 98-95-3 0.21 UE 0.47 0.21TMW10 10/19/2009 Nitrotoluene, m- 99-08-1 0.24 U 0.47 0.24TMW10 10/19/2009 Nitrotoluene, o- 88-72-2 0.15 U 0.47 0.15TMW10 10/19/2009 Nitrotoluene, p- 99-99-0 0.28 U 0.47 0.28TMW10 10/19/2009 Octahydro-1,3,5,7-tetranitro-1,3,5,7-
tetrazocine (HMX)2691-41-0 0.17 U 0.94 0.17
TMW10 10/19/2009 Tetryl (Trinitrophenylmethylnitramine)
479-45-8 0.17 U 0.47 0.17
TMW10 10/19/2009 Trinitrobenzene, 1,3,5- 99-35-4 0.19 U 0.47 0.19TMW10 10/19/2009 Trinitrotoluene, 2,4,6- 118-96-7 0.26 U 0.47 0.26TMW11 10/20/2009 Dinitrobenzene, 1,3- 99-65-0 0.12 U 0.50 0.12TMW11 10/20/2009 Dinitrotoluene, 2,4- 121-14-2 0.20 U 0.50 0.20TMW11 10/20/2009 Dinitrotoluene, 2,6- 606-20-2 0.24 U 0.50 0.24TMW11 10/20/2009 Dinitrotoluene, 2-Amino-4,6- 35572-78-2 0.12 U 0.50 0.12TMW11 10/20/2009 Dinitrotoluene, 4-Amino-2,6- 19406-51-0 0.26 U 0.50 0.26TMW11 10/20/2009 Hexahydro-1,3,5-Trinitro-1,3,5-
Triazine (RDX)121-82-4 0.43 E 0.50 0.28
TMW11 10/20/2009 Nitrobenzene 98-95-3 0.22 UE 0.50 0.22TMW11 10/20/2009 Nitrotoluene, m- 99-08-1 0.26 U 0.50 0.26TMW11 10/20/2009 Nitrotoluene, o- 88-72-2 0.16 U 0.50 0.16TMW11 10/20/2009 Nitrotoluene, p- 99-99-0 0.30 U 0.50 0.30TMW11 10/20/2009 Octahydro-1,3,5,7-tetranitro-1,3,5,7-
tetrazocine (HMX)2691-41-0 0.18 U 1.0 0.18
TMW11 10/20/2009 Tetryl (Trinitrophenylmethylnitramine)
479-45-8 0.18 U 0.50 0.18
TMW11 10/20/2009 Trinitrobenzene, 1,3,5- 99-35-4 0.20 U 0.50 0.20TMW11 10/20/2009 Trinitrotoluene, 2,4,6- 118-96-7 0.28 U 0.50 0.28TMW15 10/26/2009 Dinitrobenzene, 1,3- 99-65-0 0.080 U 0.34 0.080TMW15 10/26/2009 Dinitrotoluene, 2,4- 121-14-2 0.13 U 0.34 0.13TMW15 10/26/2009 Dinitrotoluene, 2,6- 606-20-2 0.16 U 0.34 0.16TMW15 10/26/2009 Dinitrotoluene, 2-Amino-4,6- 35572-78-2 0.080 U 0.34 0.080TMW15 10/26/2009 Dinitrotoluene, 4-Amino-2,6- 19406-51-0 0.17 U 0.34 0.17

Table 1–6 81
Table 1–6. Explosives analyzed according to the U.S. Environmental Protection Agency’s method SW-846 8330B.—Continued
[CAS, Chemical Abstract Services; μg/L, micrograms per liter; U, undetected; E, estimated concentration; UE,undetected but detection limit estimated, ―, unqualified result]
Site designation
Collection date
AnalyteCAS
number1 Result (μg/L)
QualifierLaboratory
reporting level (μg/L)
Laboratory detection limit
(μg/L)TMW15 10/26/2009 Hexahydro-1,3,5-Trinitro-1,3,5-
Triazine (RDX)121-82-4 0.19 U 0.34 0.19
TMW15 10/26/2009 Nitrobenzene 98-95-3 0.15 U 0.34 0.15TMW15 10/26/2009 Nitrotoluene, m- 99-08-1 0.17 U 0.34 0.17TMW15 10/26/2009 Nitrotoluene, o- 88-72-2 0.11 U 0.34 0.11TMW15 10/26/2009 Nitrotoluene, p- 99-99-0 0.20 U 0.34 0.20TMW15 10/26/2009 Octahydro-1,3,5,7-tetranitro-1,3,5,7-
tetrazocine (HMX)2691-41-0 0.12 U 0.67 0.12
TMW15 10/26/2009 Tetryl (Trinitrophenylmethylnitramine)
479-45-8 0.12 U 0.34 0.12
TMW15 10/26/2009 Trinitrobenzene, 1,3,5- 99-35-4 0.13 U 0.34 0.13TMW15 10/26/2009 Trinitrotoluene, 2,4,6- 118-96-7 0.19 U 0.34 0.19TMW21 10/24/2009 Dinitrobenzene, 1,3- 99-65-0 0.12 UE 0.50 0.12TMW21 10/24/2009 Dinitrotoluene, 2,4- 121-14-2 0.20 UE 0.50 0.20TMW21 10/24/2009 Dinitrotoluene, 2,6- 606-20-2 0.24 UE 0.50 0.24TMW21 10/24/2009 Dinitrotoluene, 2-Amino-4,6- 35572-78-2 0.12 UE 0.50 0.12TMW21 10/24/2009 Dinitrotoluene, 4-Amino-2,6- 19406-51-0 0.26 UE 0.50 0.26TMW21 10/24/2009 Hexahydro-1,3,5-Trinitro-1,3,5-
Triazine (RDX)121-82-4 0.28 UE 0.50 0.28
TMW21 10/24/2009 Nitrobenzene 98-95-3 0.22 UE 0.50 0.22TMW21 10/24/2009 Nitrotoluene, m- 99-08-1 0.26 UE 0.50 0.26TMW21 10/24/2009 Nitrotoluene, o- 88-72-2 0.16 UE 0.50 0.16TMW21 10/24/2009 Nitrotoluene, p- 99-99-0 0.30 UE 0.50 0.30TMW21 10/24/2009 Octahydro-1,3,5,7-tetranitro-1,3,5,7-
tetrazocine (HMX)2691-41-0 0.18 UE 1.0 0.18
TMW21 10/24/2009 Tetryl (Trinitrophenylmethylnitramine)
479-45-8 0.18 UE 0.50 0.18
TMW21 10/24/2009 Trinitrobenzene, 1,3,5- 99-35-4 0.20 UE 0.50 0.20TMW21 10/24/2009 Trinitrotoluene, 2,4,6- 118-96-7 0.28 UE 0.50 0.28TMW22 10/19/2009 Dinitrobenzene, 1,3- 99-65-0 0.090 U 0.39 0.090TMW22 10/19/2009 Dinitrotoluene, 2,4- 121-14-2 0.16 U 0.39 0.16TMW22 10/19/2009 Dinitrotoluene, 2,6- 606-20-2 0.19 U 0.39 0.19TMW22 10/19/2009 Dinitrotoluene, 2-Amino-4,6- 35572-78-2 0.090 U 0.39 0.090TMW22 10/19/2009 Dinitrotoluene, 4-Amino-2,6- 19406-51-0 0.20 U 0.39 0.20TMW22 10/19/2009 Hexahydro-1,3,5-Trinitro-1,3,5-
Triazine (RDX)121-82-4 0.22 U 0.39 0.22
TMW22 10/19/2009 Nitrobenzene 98-95-3 0.17 UE 0.39 0.17TMW22 10/19/2009 Nitrotoluene, m- 99-08-1 0.20 U 0.39 0.20TMW22 10/19/2009 Nitrotoluene, o- 88-72-2 0.12 U 0.39 0.12TMW22 10/19/2009 Nitrotoluene, p- 99-99-0 0.23 U 0.39 0.23TMW22 10/19/2009 Octahydro-1,3,5,7-tetranitro-1,3,5,7-
tetrazocine (HMX)2691-41-0 0.14 U 0.78 0.14
TMW22 10/19/2009 Tetryl (Trinitrophenylmethylnitramine)
479-45-8 0.14 U 0.39 0.14
TMW22 10/19/2009 Trinitrobenzene, 1,3,5- 99-35-4 0.16 U 0.39 0.16TMW22 10/19/2009 Trinitrotoluene, 2,4,6- 118-96-7 0.22 U 0.39 0.22

82 Geochemical Evidence of Groundwater Flow Paths and the Fate and Transport of Constituents of Concern
Table 1–6. Explosives analyzed according to the U.S. Environmental Protection Agency’s method SW-846 8330B.—Continued
[CAS, Chemical Abstract Services; μg/L, micrograms per liter; U, undetected; E, estimated concentration; UE,undetected but detection limit estimated, ―, unqualified result]
Site designation
Collection date
AnalyteCAS
number1 Result (μg/L)
QualifierLaboratory
reporting level (μg/L)
Laboratory detection limit
(μg/L)TMW23 10/19/2009 Dinitrobenzene, 1,3- 99-65-0 0.10 UE 0.40 0.10TMW23 10/19/2009 Dinitrotoluene, 2,4- 121-14-2 0.16 UE 0.40 0.16TMW23 10/19/2009 Dinitrotoluene, 2,6- 606-20-2 0.19 UE 0.40 0.19TMW23 10/19/2009 Dinitrotoluene, 2-Amino-4,6- 35572-78-2 0.10 UE 0.40 0.10TMW23 10/19/2009 Dinitrotoluene, 4-Amino-2,6- 19406-51-0 0.21 UE 0.40 0.21TMW23 10/19/2009 Hexahydro-1,3,5-Trinitro-1,3,5-
Triazine (RDX)121-82-4 12 E 0.40 0.23
TMW23 10/19/2009 Nitrobenzene 98-95-3 0.18 UE 0.40 0.18TMW23 10/19/2009 Nitrotoluene, m- 99-08-1 0.21 UE 0.40 0.21TMW23 10/19/2009 Nitrotoluene, o- 88-72-2 0.13 UE 0.40 0.13TMW23 10/19/2009 Nitrotoluene, p- 99-99-0 0.24 UE 0.40 0.24TMW23 10/19/2009 Octahydro-1,3,5,7-tetranitro-1,3,5,7-
tetrazocine (HMX)2691-41-0 0.14 UE 0.81 0.14
TMW23 10/19/2009 Tetryl (Trinitrophenylmethylnitramine)
479-45-8 0.14 UE 0.40 0.14
TMW23 10/19/2009 Trinitrobenzene, 1,3,5- 99-35-4 0.16 UE 0.40 0.16TMW23 10/19/2009 Trinitrotoluene, 2,4,6- 118-96-7 0.23 UE 0.40 0.23TMW24 10/19/2009 Dinitrobenzene, 1,3- 99-65-0 0.070 UE 0.28 0.070TMW24 10/19/2009 Dinitrotoluene, 2,4- 121-14-2 0.11 UE 0.28 0.11TMW24 10/19/2009 Dinitrotoluene, 2,6- 606-20-2 0.13 UE 0.28 0.13TMW24 10/19/2009 Dinitrotoluene, 2-Amino-4,6- 35572-78-2 0.070 UE 0.28 0.070TMW24 10/19/2009 Dinitrotoluene, 4-Amino-2,6- 19406-51-0 0.14 UE 0.28 0.14TMW24 10/19/2009 Hexahydro-1,3,5-Trinitro-1,3,5-
Triazine (RDX)121-82-4 0.15 UE 0.28 0.15
TMW24 10/19/2009 Nitrobenzene 98-95-3 0.12 UE 0.28 0.12TMW24 10/19/2009 Nitrotoluene, m- 99-08-1 0.14 UE 0.28 0.14TMW24 10/19/2009 Nitrotoluene, o- 88-72-2 0.090 UE 0.28 0.090TMW24 10/19/2009 Nitrotoluene, p- 99-99-0 0.16 UE 0.28 0.16TMW24 10/19/2009 Octahydro-1,3,5,7-tetranitro-1,3,5,7-
tetrazocine (HMX)2691-41-0 0.10 UE 0.55 0.10
TMW24 10/19/2009 Tetryl (Trinitrophenylmethylnitramine)
479-45-8 0.10 UE 0.28 0.10
TMW24 10/19/2009 Trinitrobenzene, 1,3,5- 99-35-4 0.11 UE 0.28 0.11TMW24 10/19/2009 Trinitrotoluene, 2,4,6- 118-96-7 0.15 UE 0.28 0.15
1CAS Registry Numbers, which is a registered trademark of the American Chemical Society. CAS recommends the verification of the CAS Registry Numbers through CAS Client Services.

Table 1–7 83
Table 1–7
Table 1–7. Nitrate and Nitrite analyzed according to the U.S. Environmental Protection Agency’s method 300.1.
[CAS, Chemical Abstract Services; mg/L, milligrams per liter; ―, unqualified result; U, undetected; E, estimated concentration]
Site designation
Collection date
AnalyteCAS
number1
Result (mg/L)
QualifierLaboratory
reporting level (mg/L)
Laboratory detection limit
(mg/L)MW01 10/22/2009 Nitrate as nitrogen 14797-55-8 8.2 ― 0.50 0.017MW01 10/22/2009 Nitrite as nitrogen 14797-65-0 0.040 E 0.50 0.015MW02 10/22/2009 Nitrate as nitrogen 14797-55-8 0.55 ― 0.50 0.017MW02 10/22/2009 Nitrite as nitrogen 14797-65-0 0.015 U 0.50 0.015MW03 10/23/2009 Nitrate as nitrogen 14797-55-8 14 ― 0.50 0.017MW03 10/23/2009 Nitrite as nitrogen 14797-65-0 0.14 E 0.50 0.015MW18D 10/23/2009 Nitrate as nitrogen 14797-55-8 0.23 E 0.50 0.017MW18D 10/23/2009 Nitrite as nitrogen 14797-65-0 0.015 U 0.50 0.015MW20 10/23/2009 Nitrate as nitrogen 14797-55-8 30 ― 0.50 0.017MW20 10/23/2009 Nitrite as nitrogen 14797-65-0 4.4 ― 0.50 0.015MW22D 10/21/2009 Nitrate as nitrogen 14797-55-8 18 ― 0.50 0.017MW22D 10/21/2009 Nitrite as nitrogen 14797-65-0 0.015 U 0.50 0.015SMW01 10/24/2009 Nitrate as nitrogen 14797-55-8 0.017 U 0.50 0.017SMW01 10/24/2009 Nitrite as nitrogen 14797-65-0 0.020 E 0.50 0.015TMW01 10/14/2009 Nitrate as nitrogen 14797-55-8 9.1 ― 0.50 0.017TMW01 10/14/2009 Nitrite as nitrogen 14797-65-0 0.10 E 0.50 0.015TMW03 10/14/2009 Nitrate as nitrogen 14797-55-8 170 ― 5.00 0.170TMW03 10/14/2009 Nitrite as nitrogen 14797-65-0 0.66 ― 0.50 0.015TMW04 10/14/2009 Nitrate as nitrogen 14797-55-8 51 ― 0.50 0.017TMW04 10/14/2009 Nitrite as nitrogen 14797-65-0 0.20 E 0.50 0.015TMW06 10/17/2009 Nitrate as nitrogen 14797-55-8 26 E 0.50 0.017TMW06 10/17/2009 Nitrite as nitrogen 14797-65-0 0.15 E 0.50 0.015TMW07 10/20/2009 Nitrate as nitrogen 14797-55-8 0.18 E 0.50 0.017TMW07 10/20/2009 Nitrite as nitrogen 14797-65-0 0.015 U 0.50 0.015TMW08 10/17/2009 Nitrate as nitrogen 14797-55-8 0.42 E 0.50 0.017TMW08 10/17/2009 Nitrite as nitrogen 14797-65-0 1.6 E 0.50 0.015TMW10 10/19/2009 Nitrate as nitrogen 14797-55-8 0.080 E 0.50 0.017TMW10 10/19/2009 Nitrite as nitrogen 14797-65-0 0.015 U 0.50 0.015TMW11 10/20/2009 Nitrate as nitrogen 14797-55-8 0.25 E 0.50 0.017TMW11 10/20/2009 Nitrite as nitrogen 14797-65-0 0.030 E 0.50 0.015TMW13 10/22/2009 Nitrate as nitrogen 14797-55-8 2.2 ― 0.50 0.017TMW13 10/22/2009 Nitrite as nitrogen 14797-65-0 0.015 U 0.50 0.015TMW15 10/26/2009 Nitrate as nitrogen 14797-55-8 1.0 ― 0.50 0.017TMW15 10/26/2009 Nitrite as nitrogen 14797-65-0 0.015 U 0.50 0.015TMW21 10/24/2009 Nitrate as nitrogen 14797-55-8 9.1 ― 0.50 0.017TMW21 10/24/2009 Nitrite as nitrogen 14797-65-0 0.060 E 0.50 0.015TMW22 10/19/2009 Nitrate as nitrogen 14797-55-8 7.5 ― 0.50 0.017TMW22 10/19/2009 Nitrite as nitrogen 14797-65-0 0.24 E 0.50 0.015TMW23 10/19/2009 Nitrate as nitrogen 14797-55-8 39 ― 0.50 0.017TMW23 10/19/2009 Nitrite as nitrogen 14797-65-0 0.10 E 0.50 0.015TMW24 10/19/2009 Nitrate as nitrogen 14797-55-8 0.017 U 0.50 0.017TMW24 10/19/2009 Nitrite as nitrogen 14797-65-0 0.015 U 0.50 0.015TMW25 10/23/2009 Nitrate as nitrogen 14797-55-8 0.89 ― 0.50 0.017TMW25 10/23/2009 Nitrite as nitrogen 14797-65-0 0.015 U 0.50 0.015TMW26 10/17/2009 Nitrate as nitrogen 14797-55-8 0.050 E 0.50 0.017TMW26 10/17/2009 Nitrite as nitrogen 14797-65-0 0.015 U 0.50 0.015TMW29 10/20/2009 Nitrate as nitrogen 14797-55-8 4.7 ― 0.50 0.017TMW29 10/20/2009 Nitrite as nitrogen 14797-65-0 0.11 E 0.50 0.015
1CAS Registry Numbers, which is a registered trademark of the American Chemical Society. CAS recommends the verification of the CAS Registry Numbers through CAS Client Services.

84 Geochemical Evidence of Groundwater Flow Paths and the Fate and Transport of Constituents of Concern
Table 1–8
Table 1–8. Perchlorate analyzed according to the U.S. Environmental Protection Agency’s method SW-846 6860.
[CAS, Chemical Abstract Services; μg/L, micrograms per liter; U, undetected; ―, unqualified result; E, estimated concentration]
Site designation
Collection date
Analyte CAS number1 Result (μg/L)
QualifierLaboratory
reporting level (μg/L)
Laboratory detection limit
(μg/L)
MW22D 10/21/2009 Perchlorate 14797-73-0 0.062 U 0.2 0.062MW22S 10/22/2009 Perchlorate 14797-73-0 0.062 U 0.2 0.062TMW01 10/14/2009 Perchlorate 14797-73-0 260 ― 2.0 0.62TMW03 10/14/2009 Perchlorate 14797-73-0 1.0 ― 0.2 0.062TMW04 10/14/2009 Perchlorate 14797-73-0 0.85 ― 0.2 0.062TMW10 10/19/2009 Perchlorate 14797-73-0 0.62 U 2.0 0.62TMW11 10/20/2009 Perchlorate 14797-73-0 0.12 E 0.2 0.062TMW15 10/26/2009 Perchlorate 14797-73-0 0.062 U 0.2 0.062TMW16 10/20/2009 Perchlorate 14797-73-0 0.062 U 0.2 0.062TMW22 10/19/2009 Perchlorate 14797-73-0 0.62 U 2.0 0.62TMW23 10/19/2009 Perchlorate 14797-73-0 0.062 U 0.2 0.062TMW24 10/19/2009 Perchlorate 14797-73-0 0.62 U 2.0 0.62TMW29 10/20/2009 Perchlorate 14797-73-0 0.062 U 0.2 0.062
1CAS Registry Numbers, which is a registered trademark of the American Chemical Society. CAS recommends the verification of the CAS Registry Numbers through CAS Client Services

Table 1–9 85
Table 1–9
Table 1–9. Detected volatile organic compounds and diesel and gasoline range organics (U.S. Environmental Protection Agency, 2009b).
[CAS, Chemical Abstract Services; μg/L, micrograms per liter; E, estimated concentration; ―, unqualified result; *, exceeds the U.S. Environmental Protection Agency’s Maximum Contaminant Limit of 5.0 μg/L for 1,2-dichloroethane.]
Site designation
Collection date
AnalyteCAS
number1
Result (μg/L)
QualifierLaboratory
reporting level (μg/L)
Laboratory detection limit
(μg/L)
Detected volatile organic compounds analyzed according to the U.S. Environmental Protection Agency’s method SW-846 8260C
MW01 10/22/2009 Dichloroethane, 1,2- 107-06-2 1.2 E 0.50 0.20
MW02 10/22/2009 Methyl tert-Butyl Ether (MTBE)
1634-04-4 0.40 E 0.50 0.20
MW02 10/22/2009 Dichloroethane, 1,2- 107-06-2 0.70 ― 0.50 0.20
MW18D 10/23/2009 Carbon Disulfide 75-15-0 1.2 ― 0.50 0.10
MW18D 10/23/2009 Dichloroethane, 1,2- 107-06-2 120* ― 0.50 0.20
MW20 10/23/2009 Bromomethane 74-83-9 1.2 E 0.50 0.10
MW20 10/23/2009 Dichloroethane, 1,1- 75-34-3 0.20 E 0.50 0.10
MW20 10/23/2009 Dichloroethane, 1,2- 107-06-2 10* E 0.50 0.20
MW20 10/23/2009 Chlormethane 74-87-3 0.40 E 0.50 0.10
MW20 10/23/2009 Toluene 108-88-3 0.20 E 0.50 0.20
MW22S 10/19/2009 Dichloroethane, 1,1- 75-34-3 0.60 ― 0.50 0.20
MW22S 10/19/2009 Dichloroethane, 1,2- 107-06-2 0.70 ― 0.50 0.20
MW22S 10/19/2009 Trichloroethane, 1,1,1- 75-09-2 3.40 ― 0.50 0.10
Diesel and gasoline range organics analyzed according to the U.S. Environmental Protection Agency’s method SW-846 8015B
MW18D 10/23/2009 Diesel Range Organics none 58 ― 53 36
MW20 10/23/2009 Diesel Range Organics none 61 ― 50 34
MW22S 10/19/2009 Diesel Range Organics none 58 ― 50 34
MW22D 10/21/2009 Diesel Range Organics none 70 ― 50 34
MW18D 10/23/2009 Gasoline Range Organics
none 12 E 1,000 10
MW20 10/23/2009 Gasoline Range Organics
none 15 E 1,000 10
1CAS Registry Numbers, which is a registered trademark of the American Chemical Society. CAS recommends the verification of the CAS Registry Numbers through CAS Client Services.

86 Geochemical Evidence of Groundwater Flow Paths and the Fate and Transport of Constituents of Concern
Table 1–10
Table 1–10. Field parameters.—Continued
[μS/cm, microsiemens per centimeter at 25 degrees Celsius; mg/L, milligrams per liter; NTU, Nephelometric turbidity units]
Site designation Collection date Field parameter Result Units
MW01 10/13/2009 Conductivity 3,560 μS/cm
MW01 10/13/2009 Dissolved oxygen 2.99 mg/L
MW01 10/13/2009 pH 7.63 Standard units
MW01 10/13/2009 Temperature 14.58 Degrees Celsius
MW01 10/13/2009 Turbidity 366.80 NTU
MW02 10/13/2009 Conductivity 2,450 μS/cm
MW02 10/13/2009 Dissolved oxygen 3.34 mg/L
MW02 10/13/2009 pH 7.00 Standard units
MW02 10/13/2009 Temperature 14.80 Degrees Celsius
MW03 10/23/2009 Conductivity 5,380 μS/cm
MW03 10/23/2009 Dissolved oxygen 1.52 mg/L
MW03 10/23/2009 pH 7.28 Standard units
MW03 10/23/2009 Temperature 14.38 Degrees Celsius
MW03 10/23/2009 Turbidity 0.61 NTU
MW20 10/23/2009 Conductivity 1,900 μS/cm
MW20 10/23/2009 Dissolved oxygen 1.14 mg/L
MW20 10/23/2009 pH 6.87 Standard units
MW20 10/23/2009 Temperature 13.81 Degrees Celsius
MW20 10/23/2009 Turbidity 4.30 NTU
MW22D 10/21/2009 Conductivity 5,330 μS/cm
MW22D 10/21/2009 Dissolved oxygen 0.90 mg/L
MW22D 10/21/2009 pH 7.34 Standard units
MW22D 10/21/2009 Temperature 14.12 Degrees Celsius
MW22D 10/21/2009 Turbidity 0.64 NTU
MW22S 10/19/2009 Conductivity 4,640 μS/cm
MW22S 10/19/2009 Dissolved oxygen 5.66 mg/L
MW22S 10/19/2009 pH 7.41 Standard units
MW22S 10/19/2009 Temperature 15.17 Degrees Celsius
MW22S 10/19/2009 Turbidity 137.10 NTU
SMW01 10/24/2009 Conductivity 2,050 μS/cm
SMW01 10/24/2009 Dissolved oxygen 1.28 mg/L
SMW01 10/24/2009 pH 7.75 Standard units
SMW01 10/24/2009 Temperature 11.62 Degrees Celsius
SMW01 10/24/2009 Turbidity 7.07 NTU
TMW01 10/14/2009 Conductivity 2,810 μS/cm
TMW01 10/14/2009 Dissolved oxygen 2.91 mg/L
TMW01 10/14/2009 pH 7.65 Standard units
TMW01 10/14/2009 Temperature 15.91 Degrees Celsius
TMW01 10/14/2009 Turbidity 4.87 NTU
TMW03 10/14/2009 Conductivity 4,320 μS/cm
TMW03 10/14/2009 Dissolved oxygen 2.26 mg/L
Table 1–10. Field parameters.
[μS/cm, microsiemens per centimeter at 25 degrees Celsius; mg/L, milligrams per liter; NTU, Nephelometric turbidity units]

Table 1–10 87
Table 1–10. Field parameters.—Continued
[μS/cm, microsiemens per centimeter at 25 degrees Celsius; mg/L, milligrams per liter; NTU, Nephelometric turbidity units]
Site designation Collection date Field parameter Result Units
TMW03 10/14/2009 pH 7.80 Standard units
TMW03 10/14/2009 Temperature 14.54 Degrees Celsius
TMW03 10/14/2009 Turbidity 13.85 NTU
TMW04 10/14/2009 Conductivity 3,940 μS/cm
TMW04 10/14/2009 Dissolved oxygen 2.58 mg/L
TMW04 10/14/2009 pH 7.97 Standard units
TMW04 10/14/2009 Temperature 13.74 Degrees Celsius
TMW04 10/14/2009 Turbidity 246.90 NTU
TMW06 10/17/2009 Conductivity 4,950 μS/cm
TMW06 10/17/2009 Dissolved oxygen 1.61 mg/L
TMW06 10/17/2009 pH 7.52 Standard units
TMW06 10/17/2009 Temperature 15.92 Degrees Celsius
TMW06 10/17/2009 Turbidity 1.20 NTU
TMW07 10/19/2009 Conductivity 5,340 μS/cm
TMW07 10/19/2009 Dissolved oxygen 3.93 mg/L
TMW07 10/19/2009 pH 7.81 Standard units
TMW07 10/19/2009 Temperature 13.20 Degrees Celsius
TMW07 10/19/2009 Turbidity 459.00 NTU
TMW08 10/17/2009 Conductivity 1,640 μS/cm
TMW08 10/17/2009 Dissolved oxygen 1.28 mg/L
TMW08 10/17/2009 pH 7.38 Standard units
TMW08 10/17/2009 Temperature 14.82 Degrees Celsius
TMW08 10/17/2009 Turbidity 78.42 NTU
TMW10 10/19/2009 Conductivity 6,740 μS/cm
TMW10 10/19/2009 Dissolved oxygen 0.06 mg/L
TMW10 10/19/2009 pH 7.65 Standard Units
TMW10 10/19/2009 Temperature 15.20 Degrees Celsius
TMW10 10/19/2009 Turbidity 7.09 NTU
TMW11 10/20/2009 Conductivity 2,200 μS/cm
TMW11 10/20/2009 Dissolved oxygen 2.62 mg/L
TMW11 10/20/2009 pH 7.95 Standard Units
TMW11 10/20/2009 Temperature 18.05 Degrees Celsius
TMW11 10/20/2009 Turbidity 49.05 NTU
TMW13 10/22/2009 Conductivity 2,350 μS/cm
TMW13 10/22/2009 Dissolved oxygen 1.62 mg/L
TMW13 10/22/2009 pH 7.51 Standard Units
TMW13 10/22/2009 Temperature 14.45 Degrees Celsius
TMW13 10/22/2009 Turbidity 0.33 NTU
TMW15 10/26/2009 Conductivity 2,300 μS/cm
TMW15 10/26/2009 Dissolved oxygen 1.85 mg/L
TMW15 10/26/2009 pH 7.61 Standard Units

88 Geochemical Evidence of Groundwater Flow Paths and the Fate and Transport of Constituents of Concern
Table 1–10. Field parameters.—Continued
[μS/cm, microsiemens per centimeter at 25 degrees Celsius; mg/L, milligrams per liter; NTU, Nephelometric turbidity units]
Site designation Collection date Field parameter Result Units
TMW15 10/26/2009 Temperature 13.07 Degrees Celsius
TMW15 10/26/2009 Turbidity 1.55 NTU
TMW21 10/24/2009 Conductivity 2,640 μS/cm
TMW21 10/24/2009 Dissolved oxygen 0.83 mg/L
TMW21 10/24/2009 pH 7.71 Standard Units
TMW21 10/24/2009 Temperature 14.28 Degrees Celsius
TMW21 10/24/2009 Turbidity 131.10 NTU
TMW22 10/13/2009 Conductivity 3,490 μS/cm
TMW22 10/13/2009 Dissolved oxygen 0.24 mg/L
TMW22 10/13/2009 pH 7.77 Standard Units
TMW22 10/13/2009 Temperature 12.85 Degrees Celsius
TMW23 10/13/2009 Conductivity 3,250 μS/cm
TMW23 10/13/2009 Dissolved oxygen 0.40 mg/L
TMW23 10/13/2009 pH 7.79 Standard Units
TMW23 10/13/2009 Temperature 13.05 Degrees Celsius
TMW23 10/13/2009 Turbidity 110.60 NTU
TMW24 10/19/2009 Conductivity 3,840 μS/cm
TMW24 10/19/2009 Dissolved oxygen 2.12 mg/L
TMW24 10/19/2009 pH 7.84 Standard Units
TMW24 10/19/2009 Temperature 19.97 Degrees Celsius
TMW24 10/19/2009 Turbidity 1.88 NTU
TMW26 10/17/2009 Conductivity 3,590 uS/cm
TMW26 10/17/2009 DO 1.01 mg/L
TMW26 10/17/2009 pH 7.96 Standard Units
TMW26 10/17/2009 Temperature 14.67 Degrees Celsius
TMW26 10/17/2009 Turbidity 39.68 NTU
TMW27 10/24/2009 Conductivity 1,530 uS/cm
TMW27 10/24/2009 DO 1.10 mg/L
TMW27 10/24/2009 pH 7.77 Standard Units
TMW27 10/24/2009 Temperature 14.07 Degrees Celsius
TMW27 10/24/2009 Turbidity 3.10 NTU
TMW28 10/19/2009 Conductivity 1,590 uS/cm
TMW28 10/19/2009 DO 0.08 mg/L
TMW28 10/19/2009 pH 7.65 Standard Units
TMW28 10/19/2009 Temperature 17.38 Degrees Celsius
TMW28 10/19/2009 Turbidity 25.80 NTU
TMW29 10/14/2009 Conductivity 2,520 uS/cm
TMW29 10/14/2009 DO 4.41 mg/L
TMW29 10/14/2009 pH 7.88 Standard Units
TMW29 10/14/2009 Temperature 12.76 Degrees Celsius
TMW29 10/14/2009 Turbidity 705.40 NTU

Table 1–11 89
Table 1–11
Table 1–11. Stable isotopes of water.
[‰, per mil; stable isotope ratios for 2Hydrogen(2H)/1Hydrogen (1H) and 18Oxygen(18O)/16Oxygen (16O) are reported in the standard delta notation (δ), the ratio of the heavier isotope to the more common lighter isotope of that element, relative to Vienna Mean Standard Ocean Water]
Publishing support provided byLafayette Publishing Service Center
Site designation
Collection date
AnalyteResult
(‰)Site
designationCollection
dateAnalyte
Result (‰)
MW01 10/22/2009 δ2H -99.4 TMW07 10/20/2009 δ18O -10.16
MW01 10/22/2009 δ18O -13.35 TMW08 10/17/2009 δ2H -82.3
MW02 10/22/2009 δ2H -102.0 TMW08 10/17/2009 δ18O -10.73
MW02 10/22/2009 δ18O -13.75 TMW10 10/19/2009 δ2H -99.4
MW03 10/23/2009 δ2H -93.7 TMW10 10/19/2009 δ18O -13.37
MW03 10/23/2009 δ18O -12.49 TMW11 10/20/2009 δ2H -79.2
MW18D 10/23/2009 δ2H -79.9 TMW11 10/20/2009 δ18O -10.62
MW18D 10/23/2009 δ18O -10.38 TMW13 10/22/2009 δ2H -83.2
MW20 10/23/2009 δ2H -75.0 TMW13 10/22/2009 δ18O -11.11
MW20 10/23/2009 δ18O -9.55 TMW15 10/26/2009 δ2H -80.6
MW22D 10/21/2009 δ2H -98.3 TMW15 10/26/2009 δ18O -10.80
MW22D 10/21/2009 δ18O -13.14 TMW21 10/24/2009 δ2H -85.6
MW22S 10/19/2009 δ2H -83.1 TMW21 10/24/2009 δ18O -11.64
MW22S 10/19/2009 δ18O -10.99 TMW22 10/19/2009 δ2H -79.7
Production well 11/9/2009 δ2H -107.0 TMW22 10/19/2009 δ18O -10.53
Production well 11/9/2009 δ18O -14.35 TMW23 10/19/2009 δ2H -84.2
SMW01 10/24/2009 δ2H -78.3 TMW23 10/19/2009 δ18O -11.17
SMW01 10/24/2009 δ18O -10.56 TMW24 10/19/2009 δ2H -75.8
TMW01 10/14/2009 δ2H -78.2 TMW24 10/19/2009 δ18O -9.99
TMW01 10/14/2009 δ18O -10.26 TMW25 10/23/2009 δ2H -79.1
TMW03 10/14/2009 δ2H -82.0 TMW25 10/23/2009 δ18O -10.33
TMW03 10/14/2009 δ18O -10.48 TMW26 10/17/2009 δ2H -74.3
TMW04 10/14/2009 δ2H -84.0 TMW26 10/17/2009 δ18O -9.99
TMW04 10/14/2009 δ18O -10.64 TMW27 10/24/2009 δ2H -74.1
TMW06 10/17/2009 δ2H -83.2 TMW27 10/24/2009 δ18O -9.91
TMW06 10/17/2009 δ18O -11.04 TMW29 10/20/2009 δ2H -83.2
TMW07 10/20/2009 δ2H -78.5 TMW29 10/20/2009 δ18O -11.20
Robertson and others—G
eochemical Evidence of G
roundwater Flow
Paths and the Fate and Transport of Constituents of Concern—SIR 2013–5098