Geoarchaeology of the Nehalem Spit: Redistribution of Beeswax ...
26
Geoarchaeology: An International Journal, Vol. 26, No. 2, 219–244 (2011) © 2011 Wiley Periodicals, Inc. Published online in Wiley Online Library (wileyonlinelibrary.com). DOI:10.1002/gea.20349 Geoarchaeology of the Nehalem Spit: Redistribution of Beeswax Galleon Wreck Debris by Cascadia Earthquake and Tsunami (A.D. 1700), Oregon, USA Curt D. Peterson, 1, * Scott S. Williams, 2 Kenneth M. Cruikshank, 1 and John R. Dubè 3 1 Portland State University, Portland, Oregon 97207 2 Washington State Department of Transportation, Olympia, Washington 98501 3 P.O. Box 212, Manzanita, Oregon 97130 A coincidence of the Beeswax galleon shipwreck (ca. A.D. 1650–1700) and the last Cascadia earthquake tsunami and coastal subsidence at A.D. 1700 redistributed and buried wreck artifacts on the Nehalem Bay spit, Oregon, USA. Ground-penetrating radar profiles ( 7 km total distance), sand auger probes, trenches, cutbank exposures (29 in number), and surface cob- ble counts (49 sites) were collected from the Nehalem spit (5 km 2 area). The field data demonstrate (1) the latest prehistoric integrity of the spit, (2) tsunami spit overtopping, and (3) coseismic beach retreat since the A.D. 1700 great earthquake in the Cascadia subduction zone. Wreck debris was (1) initially scattered along the spit ocean beaches, (2) washed over the spit by nearfield tsunami (6–8 m elevation), and (3) remobilized in beach strandlines by cat- astrophic beach retreat. Historic recovery of the spit (150 m beach progradation) and modern foredune accretion (5 m depth) have buried both the retreat scarp strandlines and associ- ated wreck artifacts. The recent onshore sand transport might re-expose heavy ship remains in the offshore area if the wreck grounded in shallow water (20 m water depth of closure). © 2011 Wiley Periodicals, Inc. INTRODUCTION In this paper we propose a mechanism for the dispersal and burial of Beeswax wreck debris on the Nehalem spit at about A.D. 1700 (Figure 1). Recovered debris from this wreck is reported to include substantial quantities of beeswax blocks and candles, teak ship’s timbers, and Chinese porcelains (Hult, 1968; Marshall, 1984; Woodward, 1986a, 1986b). The extensive deposits of beeswax blocks and candles found widely spread around Nehalem Spit and Bay throughout the 19th century lent their name to the vessel, which wrecked prior to European exploration and settle- ment of this part of the coast (Marshall, 1984; Williams, 2008). Large teak timbers were reportedly recovered during the mid to late 19th and early 20th centuries from the interior of the northern end of the Nehalem sand spit *Corresponding author; E-mail: [email protected]. GEA262_05_20349.qxd 2/1/11 1:04 PM Page 219
Transcript of Geoarchaeology of the Nehalem Spit: Redistribution of Beeswax ...

Geoarchaeology: An International Journal, Vol. 26, No. 2, 219–244 (2011)© 2011 Wiley Periodicals, Inc.Published online in Wiley Online Library (wileyonlinelibrary.com). DOI:10.1002/gea.20349
Geoarchaeology of the Nehalem Spit:Redistribution of Beeswax GalleonWreck Debris by Cascadia Earthquakeand Tsunami (!A.D. 1700), Oregon, USA
Curt D. Peterson,1,* Scott S. Williams,2
Kenneth M. Cruikshank,1 and John R. Dubè3
1Portland State University, Portland, Oregon 972072Washington State Department of Transportation, Olympia, Washington 985013P.O. Box 212, Manzanita, Oregon 97130
A coincidence of the Beeswax galleon shipwreck (ca. A.D. 1650–1700) and the last Cascadiaearthquake tsunami and coastal subsidence at !A.D. 1700 redistributed and buried wreckartifacts on the Nehalem Bay spit, Oregon, USA. Ground-penetrating radar profiles (!7 km totaldistance), sand auger probes, trenches, cutbank exposures (29 in number), and surface cob-ble counts (49 sites) were collected from the Nehalem spit (!5 km2 area). The field datademonstrate (1) the latest prehistoric integrity of the spit, (2) tsunami spit overtopping, and(3) coseismic beach retreat since the A.D. 1700 great earthquake in the Cascadia subductionzone. Wreck debris was (1) initially scattered along the spit ocean beaches, (2) washed overthe spit by nearfield tsunami (6–8 m elevation), and (3) remobilized in beach strandlines by cat-astrophic beach retreat. Historic recovery of the spit (150 m beach progradation) and modernforedune accretion (!5 m depth) have buried both the retreat scarp strandlines and associ-ated wreck artifacts. The recent onshore sand transport might re-expose heavy ship remainsin the offshore area if the wreck grounded in shallow water ("20 m water depth of closure).© 2011 Wiley Periodicals, Inc.
INTRODUCTION
In this paper we propose a mechanism for the dispersal and burial of Beeswaxwreck debris on the Nehalem spit at about A.D. 1700 (Figure 1). Recovered debrisfrom this wreck is reported to include substantial quantities of beeswax blocks andcandles, teak ship’s timbers, and Chinese porcelains (Hult, 1968; Marshall, 1984;Woodward, 1986a, 1986b). The extensive deposits of beeswax blocks and candlesfound widely spread around Nehalem Spit and Bay throughout the 19th century lenttheir name to the vessel, which wrecked prior to European exploration and settle-ment of this part of the coast (Marshall, 1984; Williams, 2008).
Large teak timbers were reportedly recovered during the mid to late 19th andearly 20th centuries from the interior of the northern end of the Nehalem sand spit
*Corresponding author; E-mail: [email protected].
GEA262_05_20349.qxd 2/1/11 1:04 PM Page 219
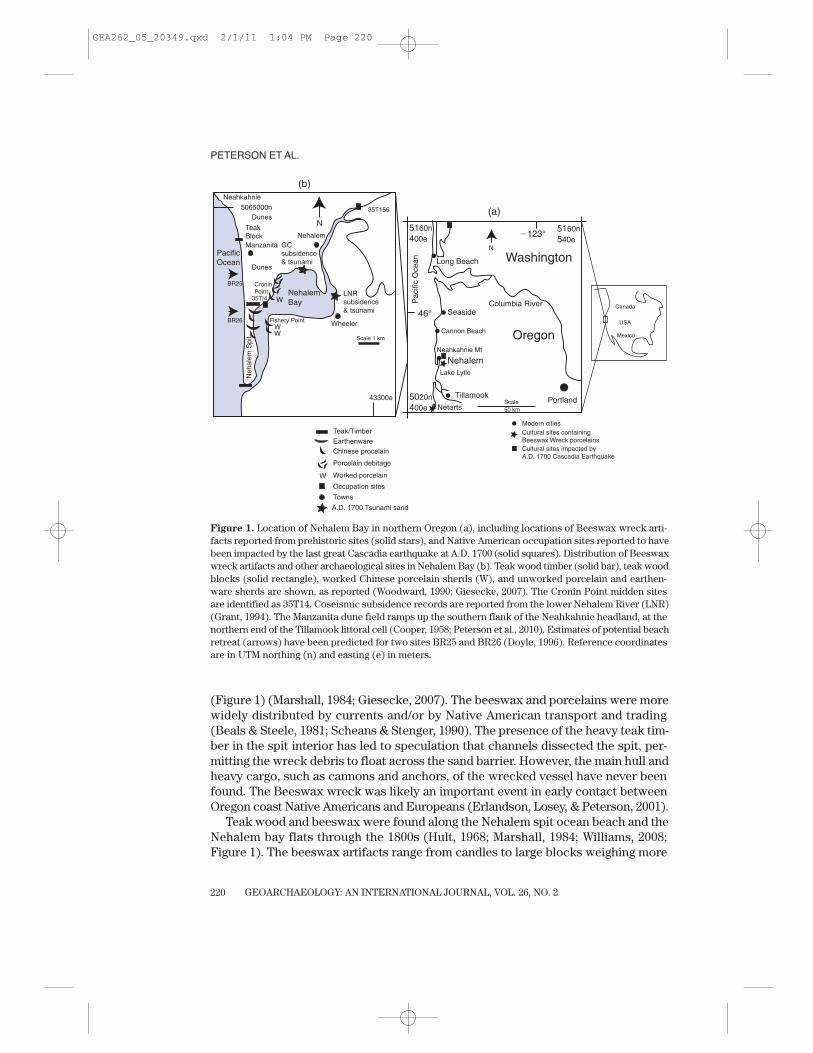
(Figure 1) (Marshall, 1984; Giesecke, 2007). The beeswax and porcelains were morewidely distributed by currents and/or by Native American transport and trading(Beals & Steele, 1981; Scheans & Stenger, 1990). The presence of the heavy teak tim-ber in the spit interior has led to speculation that channels dissected the spit, per-mitting the wreck debris to float across the sand barrier. However, the main hull andheavy cargo, such as cannons and anchors, of the wrecked vessel have never beenfound. The Beeswax wreck was likely an important event in early contact betweenOregon coast Native Americans and Europeans (Erlandson, Losey, & Peterson, 2001).
Teak wood and beeswax were found along the Nehalem spit ocean beach and theNehalem bay flats through the 1800s (Hult, 1968; Marshall, 1984; Williams, 2008;Figure 1). The beeswax artifacts range from candles to large blocks weighing more
PETERSON ET AL.
GEOARCHAEOLOGY: AN INTERNATIONAL JOURNAL, VOL. 26, NO. 2220
5020n400e
5160n400e
Pac
ific
Oce
an
5160n540e
Portland
Long Beach
Columbia RiverSeaside
Nehalem
Tillamook
Washington
Oregon
Canada
USA
Mexico
46°
!123°
Netarts
Modern cities
Cultural sites impacted byA.D. 1700 Cascadia Earthquake
Cultural sites containingBeeswax Wreck porcelains
Lake Lytle
Neahkahnie Mt
Cannon Beach
Scale50 km
N
N
NehalemBay
Fishery Point
Cronin Point
35T156
Manzanita
Scale 1 km
Neh
alem
Spi
t
Teak Block
W
WW
Nehalem
Wheeler
43300e
5065000nNeahkahnie
LNRsubsidence& tsunami
GCsubsidence& tsunami
W
Teak/TimberEarthenwareChinese procelain
Porcelain debitage
Worked porcelain
TownsOccupation sites
A.D. 1700 Tsunami sand
35TI4
BR25
BR26
Dunes
Dunes
(b)
(a)
PacificOcean
Figure 1. Location of Nehalem Bay in northern Oregon (a), including locations of Beeswax wreck arti-facts reported from prehistoric sites (solid stars), and Native American occupation sites reported to havebeen impacted by the last great Cascadia earthquake at A.D. 1700 (solid squares). Distribution of Beeswaxwreck artifacts and other archaeological sites in Nehalem Bay (b). Teak wood timber (solid bar), teak woodblocks (solid rectangle), worked Chinese porcelain sherds (W), and unworked porcelain and earthen-ware sherds are shown, as reported (Woodward, 1990; Giesecke, 2007). The Cronin Point midden sitesare identified as 35T14. Coseismic subsidence records are reported from the lower Nehalem River (LNR)(Grant, 1994). The Manzanita dune field ramps up the southern flank of the Neahkahnie headland, at thenorthern end of the Tillamook littoral cell (Cooper, 1958; Peterson et al., 2010). Estimates of potential beachretreat (arrows) have been predicted for two sites BR25 and BR26 (Doyle, 1996). Reference coordinatesare in UTM northing (n) and easting (e) in meters.
GEA262_05_20349.qxd 2/1/11 1:04 PM Page 220

GEOARCHAEOLOGY: AN INTERNATIONAL JOURNAL, VOL. 26, NO. 2
GEOARCHAEOLOGY OF THE NEHALEM SPIT
221
than 80 kg (Giesecke, 2007). Beeswax samples have been radiocarbon dated, withsamples dated in the 1960s and 1980s yielding date ranges of A.D. 1485–1800, with the most likely overlaps being from 1600 to 1700 (Erlandson, Losey, & Peterson,2001; Williams, 2007). A sample dated by high-precision accelerator mass spec-trometry (AMS) dating in 2008 yielded a date range of 1660–1800 (Beta 249345).Many of the beeswax blocks are reported to have the initials “IHS” or symbols carvedinto them, typical of Spanish shipping marks (Marshall, 1984; Giesecke, 2007).
Efforts to identify the wrecked ship have recently shifted to the use of the wreck’sporcelain sherds. The sherds date the wreck to the Spanish galleon trade from thePhilippines to Mexico at about A.D. 1650–1700 (Lally, 2008). Using visual attributes,Lally (2008) derived a mean ceramic date of A.D. 1686. This ceramic date is basedon 1189 sherds collected over a period (15 years) from the Nehalem area. Two pos-sible galleon wrecks, as yet unaccounted for, include the Santo Christo de Burgoslost in A.D. 1693 and the San Francisco Xavier lost in A.D. 1705 (Levesque, 2002; Lally,2008). The Oregon coast is well north of the normal Manila galleon trade routes(Schurz, 1939), leading to much speculation about the circumstances of the wreckin the Nehalem area (Giesecke, 2007; Marshall, 1984; Williams, 2007).
Some of the Chinese porcelain was flaked into tools by Native Americans, asshown by scattered debitage, finished points, and scrapers in Nehalem Bay (Figure 1).Other unworked porcelains and larger earthenware fragments have been found onthe bay shoreline of the Nehalem spit (Figure 2). The earthenware fragments, thoughtto be storage jar fragments, are not suitable for tool making, so they were unlikely tohave been traded or manually transported by the native populations. The recent, butrare, appearances of these earthenware fragments suggest that they are currentlybeing released from bayside cutbanks of the Nehalem sand spit.
In this paper we review the geomorphic conditions and littoral processes thatcould account for the apparent dispersal of the Beeswax wreck debris across theNehalem spit. The results presented here also address the episodic remobilizationand exposure of wreck debris that are reported from the Nehalem beaches and bayspit shorelines. Coincidences between the archaeologically determined wreck age(A.D. 1680–1700) and the last Cascadia great earthquake (Mw 9) and tsunami at A.D.1700 (Satake et al., 1996) are proposed to account for the across-spit dispersal ofwreck debris. The disappearance of beach wreck debris by the early 20th century isrelated to historic beach recovery, following the earthquake-induced coseismic beachretreat (Peterson, Doyle, & Barnett, 2000).
STUDY AREA
The Nehalem spit is 5–6 km in length and ranges from 0.5 to 1.0 km in width(Figure 1). It is fronted by a large foredune of 10–15 m elevation (NAVD88). [TheNAVD88 0 m datum is about 1 m below mean tidal level (MTL) in the study area.] The foredune vertically accreted to its present height since the middle 1900s due to the introduction of European dune grass. The spit narrows in its middle section,located 1–3 km south Cronin Point (Figures 1, 3). The narrow middle section of thespit is located adjacent to a right-angle bend of the Nehalem channel, opposite to
GEA262_05_20349.qxd 2/1/11 1:04 PM Page 221

PETERSON ET AL.
GEOARCHAEOLOGY: AN INTERNATIONAL JOURNAL, VOL. 26, NO. 2222
(a)
(b)
(c)
Figure 2. (a) Beeswax wreck ceramics from the Nehalem spit bay shoreline. Large earthenware fragment(10 cm size) and smaller porcelain fragments (1–2 cm size) are unworked. The porcelain fragments havenot been rounded by wind or water abrasion, suggesting recent release from eroding cutbank sites. (b) Recently discovered Chinese porcelain from the spit interior (site CP#1), showing 6-cm-wide sherd,at end of hand held pen, in sand trail, and associated half-buried cobbles (dark line circles) in grass. (c) Enlargement of Chinese porcelain sherd showing blue-on-white floral scroll motif (photo by GaryMcDaniel).
GEA262_05_20349.qxd 2/1/11 1:04 PM Page 222

GEOARCHAEOLOGY: AN INTERNATIONAL JOURNAL, VOL. 26, NO. 2
GEOARCHAEOLOGY OF THE NEHALEM SPIT
223
Fishery Point on the mainland (Figure 1). A deflation plain behind the foredunedecreases in height from the spit interior (!5 m elevation) to cutbanks (!2 m ele-vation) along the bay shoreline.
The Nehalem spit developed at the northern end of the Tillamook littoral cell(Figure 1). Littoral drift reverses seasonally in the northern Oregon coast (Komar,1992), but in the Nehalem area it is dominated by winter waves approaching shorefrom the southwest. A long-term net littoral transport to the north in the Nehalemlittoral cell is demonstrated by the large build-up of sand in the Manzanita dune fieldon the southern slope of the Neahkahnie headland (Cooper, 1958; Peterson et al.,2009). Driftwood accumulates on the ocean beaches from the spit north to theNeahkahnie headland, located near the town of Manzanita. Some drift logs havebeen observed floating northward around the Neahkahnie headland during majorwinter storms.
Evidence for Cascadia Earthquakes in Nehalem Bay
Four abrupt subsidence events are recorded by buried peaty horizons in theNehalem Bay wetlands (Table I), as reported by Grant (1994) at a lower Nehalem Riversite (LNR) and near a prehistoric archaeological site (35T156; Figure 1) (Minor &Grant, 1996). The dated subsidence events are correlated to the last four ruptures ofthe central Cascadia mega-thrust fault. The Cascadia subduction zone extends fromBritish Columbia, Canada, to northernmost California, possibly producing Mw 9earthquakes (Heaton & Kanamori, 1984). The last four ruptures in northern Oregonand southern Washington are regionally dated at 0.3 ka, 1.1 ka, 1.3 ka, and 1.7 ka(Darienzo, Peterson, & Clough,1994; Darienzo & Peterson, 1995; Atwater et al., 2004).The Cascadia ruptures are associated with nearfield tsunami that are recorded by sandsheets in back-barrier wetlands (Cannon Beach) and back-barrier ponds (Crescentand Lytle barrage ponds) (Figure 1). The last Cascadia rupture could correlate to ahistoric farfield tsunami runup in Japan, dated to the year A.D. 1700, as reported bySatake et al. (1996).
Catastrophic Beach Retreat
The coseismic subsidence events in the northern Oregon Coast range from 0.5 to1.5 m (Barnett, 1997), with the last event at A.D. 1700 representing about 1.5 m ofsubsidence in the Nehalem Bay area, Oregon (Grant, 1994). The coseismic subsi-dence submerged tidal marshes for decades to centuries (Barnett, 1997), and causedwidespread catastrophic beach erosion (Doyle, 1996). The catastrophic beach ero-sion events are identified by retreat scarps (5–15 m in height), which are preservedin episodically prograded beach profiles (Meyers et al., 1996). The subsurface scarpsare imaged by ground-penetrating radar (GPR) in large barrier beaches and beachplains located in Long Beach, Washington, and north of Seaside, Oregon, located oneither side of the Columbia River mouth (Figure 1) (Woxell, 1998; Peterson et al.,2010).
GEA262_05_20349.qxd 2/1/11 1:04 PM Page 223

Potential beach retreat of about 100 m is predicted for two sites (BR25 and BR26)in the Nehalem spit area, following potential coseismic subsidence of 1.25 m (Figure 1)(Doyle, 1996). The beach retreat estimates are based on a modified Brunn Rule(Komar et al., 1991) and on modern across-shore profiles. Postseismic rebound andinterseismic uplift should eventually return the displaced beach sand back to theshoreline. Assuming no net gain or loss of beach sand from the littoral cell, the inter-seismic beach recovery should accrete the shoreline back to pre-earthquake positions.
Tsunami Deposit Confirmation in Nehalem Bay
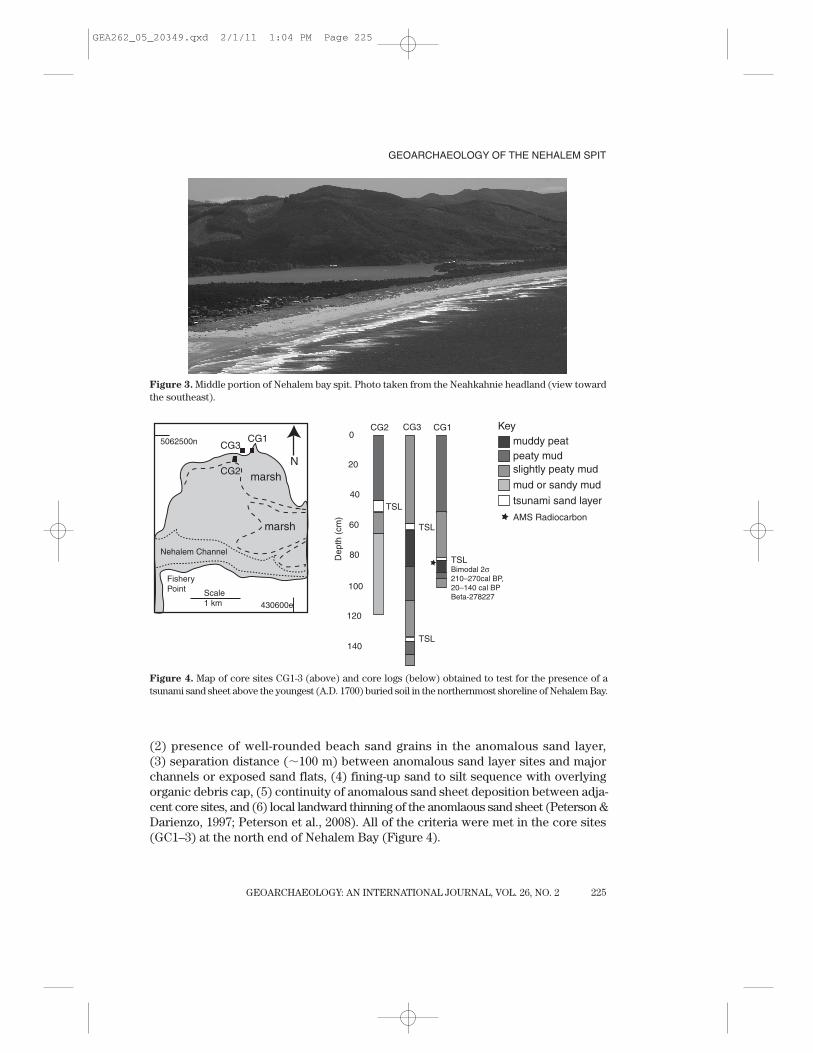
Tsunami sand sheets were not fomally identified by Grant (1994) in the lowerNehalem River (LNR), but a 10-cm-thick layer of sand and silt was observed to dire-clty overlie the uppermost buried wetland soil. To confirm the presence of A.D. 1700tsunami deposits in Nehalem Bay, several cores (sites GC1–3) were taken at thenorthernmost margin of the lower Nehalem Bay (Figure 4). Only the shallowestburied wetland (!A.D. 1700 ) was targeted for paleotsunami deposition in this lim-ited confirmation study of tsunami inundation in Nehalem Bay.
The criteria used to verify tsunami deposition in northern Oregon estuaries include(1) anomalous sand layer(s) directly overlying an abruptly buried marsh surface,
PETERSON ET AL.
GEOARCHAEOLOGY: AN INTERNATIONAL JOURNAL, VOL. 26, NO. 2224
Table I. Radiocarbon dates of reported coseismic subsidence and associated tsunami or beach retreatevents for Nehalem Bay (a), Crescent and Lytle Lakes (b), Cannon Beach (c), and Clatsop (d).
Impact/Age Event 1 A.D. 1700 Event 2 !1.1 ka Event 3 !1.3 ka Event 4 !1.7 ka
(a)Subsidence 1.5 m 0.5–1.0 m 0.5–1.0 m 1.5 mSample dates N ! 12 N ! 9 N ! 2 N ! 6Mean age yr B.P. 230 " 18 846 " 22 1395 " 57 1752 " 25Calibrated yr B.P. 0–304 724–890 1260–1400 1608–1725
(b)Tsunami runup Small Medium LargeMean age cal. B.P. 265 1145 1350
(c)Subsidence Large Medium Small LargeTsunami runup !7 m #8 m ##8 mAge cal. B.P. 2s 0–510 930–1280 1276–1411
(d)Subsidence 1.5–2.0 m 1.0–1.5 m 0.5–1.0 m 1.5–2.0 mRetreat Scarp Large Medium Small LargeMean Age 0.3 ka 1.1 ka 1.3 ka 1.7 ka
Note: Regional Cascadia rupture ages (Events 1–4) from Atwater et al. (2004).Nehalem data from Grant (1994); Minor and Grant (1996).Crescent and Lytle Lakes data from Schlichting (2000) and Schlichting and Peterson (2006).Cannon Beach data from Peterson et al. (2008).Clatsop data from Peterson et al. (2010).
GEA262_05_20349.qxd 2/1/11 1:04 PM Page 224
GEOARCHAEOLOGY: AN INTERNATIONAL JOURNAL, VOL. 26, NO. 2
GEOARCHAEOLOGY OF THE NEHALEM SPIT
225
(2) presence of well-rounded beach sand grains in the anomalous sand layer, (3) separation distance (!100 m) between anomalous sand layer sites and majorchannels or exposed sand flats, (4) fining-up sand to silt sequence with overlyingorganic debris cap, (5) continuity of anomalous sand sheet deposition between adja-cent core sites, and (6) local landward thinning of the anomlaous sand sheet (Peterson &Darienzo, 1997; Peterson et al., 2008). All of the criteria were met in the core sites(GC1–3) at the north end of Nehalem Bay (Figure 4).
Figure 3. Middle portion of Nehalem bay spit. Photo taken from the Neahkahnie headland (view towardthe southeast).
Scale1 km
N
marsh
Nehalem Channel
CG1
CG2
CG35062500n
430600e
FisheryPoint
marsh
0
20
40
60
80
100
120
140
CG1
TSL
CG2
TSL
TSL
Dep
th (
cm)
CG3
TSLBimodal 2!210–270cal BP,20–140 cal BPBeta-278227
peaty mudmuddy peat
slightly peaty mudmud or sandy mudtsunami sand layerAMS Radiocarbon
Key
Figure 4. Map of core sites CG1-3 (above) and core logs (below) obtained to test for the presence of atsunami sand sheet above the youngest (A.D. 1700) buried soil in the northernmost shoreline of Nehalem Bay.
GEA262_05_20349.qxd 2/1/11 1:04 PM Page 225
The GC paleotsunami locality is located about 2.0 km in distance from the mainNehalem channel, and about 3.5 km from the middle section of the Nehalem spit. Thefirst buried wetland soil (muddy peat) is overlain by a thin sand layer (3–6 cm inthickness) that fines upward to a silt and/or organic debris cap. The buried soil in GC1at 84 cm depth yields 2-sigma dates of 210–270 cal. B.P. and 20–140 cal. B.P. (Beta#278227). The bimodal calibration curve results obtained for this shallowest buriedsoil are not unexpected due to high radiocarbon production at about A.D. 1700, andto potential descending roots from the post-rebound marsh. Our objective here is todiscriminate between the A.D. 1700 tsunami and older events at 800 to 1000 yr B.P.(Peterson et al., 2008). The reported age(s) for the buried soil in CG1at 84 cm depthreflects paleotsunami inundation and coseismic subsidence from the last Cascadiarupture at A.D. 1700. The sand layer represents tsunami inundation(s) well land-ward of the Nehalem Bay spit. Inundation from the A.D. 1700 tsunami might havereached a subsidence-impacted archaeology site 35T156 (Figure 1) at a distance of10 km upriver from the Nehalem spit (Minor & Grant, 1996).
Early Historic Geomorphology of Nehalem Bay
Several features of the Nehalem spit suggest recent instability, including its rela-tively thin aspect, the acute southward deflection of the Nehalem River channel,and the low heights (3–5 m elevation) of the spit interior. However, the early surveymaps of the Nehalem coast (U.S. Coast Survey, 1875) show the spit extending southof the present tidal inlet (Figure 5). The presence of Beeswax wreck timber in thespit interior could argue for (1) a tidal inlet channel breach of the spit, or (2) a morelandward position of the spit shoreline at the time of the shipwreck. Some spit inte-rior sites that are reported to have yielded Beeswax wreck debris range from 6 to 8m elevation (Figure 1). These elevations exceed the expected maximum combinedreach of tides (!3 m elevation) and sustained storm surge (1.5 m) on the Oregon coast(Pittock et al., 1982). Nevertheless, the first geoarchaeological investigation in thisstudy focused on the possibilities of (1) tidal inlet breaching of the middle sectionof the spit, and (2) changing beach shoreline positions in the Nehalem spit.
METHODS
Ground-Penetrating Radar Profiling
Ground-penetrating radar (GPR) was used to profile the Nehalem spit for evi-dence of tidal inlet breaches and changes in shoreline position. A PulseEkko 100Asystem, with 50 MHz antennae and 900 V transmitter, was used for profiling the spitat 0.5 or 1.0 m step spacing. Digital stacking of 16 or 32 pulses per trace was used toincrease signal-to-noise ratio. Penetration generally reached 10–20 m depth, basedon a velocity of 0.08 m ns!1 in the saturated barrier sand (Jol, Smith, & Meyers, 1996).Profiles were collected along the spit (north to south) and across the spit (east towest) (Figure 6). Elevation control for the along-spit profiles is based on interpolations
PETERSON ET AL.
GEOARCHAEOLOGY: AN INTERNATIONAL JOURNAL, VOL. 26, NO. 2226
GEA262_05_20349.qxd 2/1/11 1:04 PM Page 226

GEOARCHAEOLOGY: AN INTERNATIONAL JOURNAL, VOL. 26, NO. 2
GEOARCHAEOLOGY OF THE NEHALEM SPIT
227
between 3 m contours from U.S. Geological Survey topographic maps (!1.5 mNAVD88) at endpoints georeferenced by GPS wass-12 channel (!5 m EPE). Elevationcontrol for the across-spit profiles is based on total station surveying to registeredbench marks (!0.1 m elevation NAVD88). All GPR profiles are processed withadjusted gain control (AGC) to enhance reflections at depth (Jol & Bristow, 2003).
Figure 5. Historic (1875) Nehalem spit shoreline map. Map from U.S. Coast Survey (1875). Grid lines arealigned north–south (vertical) and east–west (horizontal).
GEA262_05_20349.qxd 2/1/11 1:04 PM Page 227
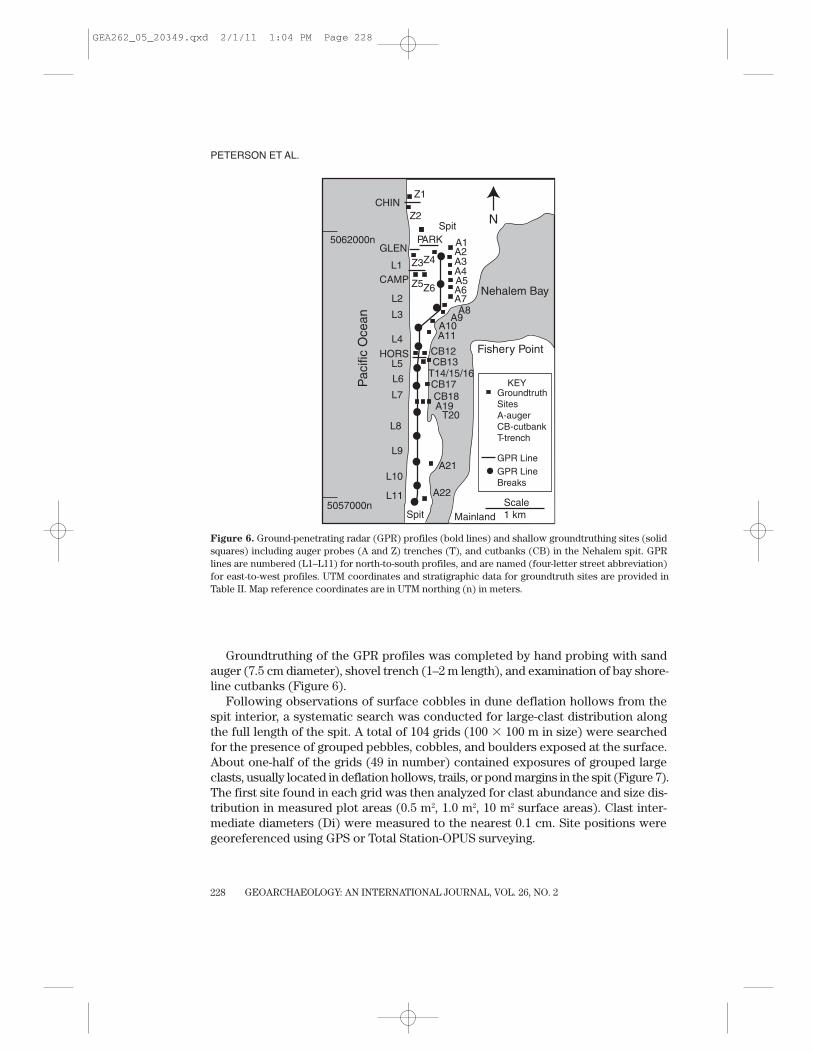
Groundtruthing of the GPR profiles was completed by hand probing with sandauger (7.5 cm diameter), shovel trench (1–2 m length), and examination of bay shore-line cutbanks (Figure 6).
Following observations of surface cobbles in dune deflation hollows from thespit interior, a systematic search was conducted for large-clast distribution along the full length of the spit. A total of 104 grids (100 ! 100 m in size) were searchedfor the presence of grouped pebbles, cobbles, and boulders exposed at the surface.About one-half of the grids (49 in number) contained exposures of grouped largeclasts, usually located in deflation hollows, trails, or pond margins in the spit (Figure 7).The first site found in each grid was then analyzed for clast abundance and size dis-tribution in measured plot areas (0.5 m2, 1.0 m2, 10 m2 surface areas). Clast inter-mediate diameters (Di) were measured to the nearest 0.1 cm. Site positions weregeoreferenced using GPS or Total Station-OPUS surveying.
PETERSON ET AL.
GEOARCHAEOLOGY: AN INTERNATIONAL JOURNAL, VOL. 26, NO. 2228
L11
L10
L9
L8
L7
L6L5
L3
L4
L2
L1
Nehalem Bay
Fishery Point
N
Pac
ific
Oce
an
Scale1 km
Z1
Z2CHIN
PARK
Z5CAMP
GLENZ4Z3
Z6
A8A7A6A5A4A3
A1A2
A9A10A11
CB12CB13
T14/15/16CB17CB18A19
T20
A21
A22
HORS
5057000n
5062000n
Spit
Spit
Mainland
GPR Line Breaks
Groundtruth SitesA-augerCB-cutbankT-trench
GPR Line
KEY
Figure 6. Ground-penetrating radar (GPR) profiles (bold lines) and shallow groundtruthing sites (solidsquares) including auger probes (A and Z) trenches (T), and cutbanks (CB) in the Nehalem spit. GPRlines are numbered (L1–L11) for north-to-south profiles, and are named (four-letter street abbreviation)for east-to-west profiles. UTM coordinates and stratigraphic data for groundtruth sites are provided inTable II. Map reference coordinates are in UTM northing (n) in meters.
GEA262_05_20349.qxd 2/1/11 1:04 PM Page 228

GEOARCHAEOLOGY: AN INTERNATIONAL JOURNAL, VOL. 26, NO. 2
GEOARCHAEOLOGY OF THE NEHALEM SPIT
229
RESULTS
The earliest historic stability of the Nehalem spit was tested for tidal inlet breachesby continuous GPR profiling from north to south along a packed sand–gravel accessroad (Figure 6). GPR penetration reached 10–15 m depth, with abrupt signal loss belowconvolute basal reflections (Figure 8). Reflections above the basal deposits in GPRprofile L2 are discontinuous, but they are generally horizontal to subhorizontal in ori-entation. The upward transition from shallow cut-and-fill reflections to subhorizon-tal reflections likely represents the vertical accretion of the spit by wave overwash,followed by eolian sand transport and deposition. Net dune accretion in the narrowspit is favored by rising groundwater surface, which follows net sea level rise in thebarrier sand systems. No large cut-and-fill reflections (5–10 m height) are observedin the upper 5–10 m of the GPR profile L2.
Line drawings of high-amplitude semi-continuous reflections are constructed forthe composite GPR profiles (L1–L11) extending along the full 5-km length of theNehalem spit (Figure 6). Subhorizontal to horizontal reflections occur throughout the linked profiles, ruling out any evidence of tidal inlet channel breaches during thelatest prehistoric or early historic time (Figure 9). Small-scale irregularities, 1–5 m
Figure 7. Surface cobble sites (black circles) measured for frequency and size distributions of exposedlarge clasts (pebble, cobble, and boulder) in the Nehalem sand spit. Recently discovered Chinese porce-lain sherd is denoted by the site CP#1 (black star) in the exposed cobble sheet from the interior of thecentral spit. Cobble and Chinese porcelain sherd site UTM coordinates and clast data are presented inTable III. Map reference coordinates are in UTM northing (n) in meters.
GEA262_05_20349.qxd 2/1/11 1:04 PM Page 229

in depth, are common in the GPR reflections, and likely indicate localized scouringand/or deflation between periods of net vertical accretion.
Across-shore GPR profiling of the Nehalem spit ocean beaches was performed totest for recent changes in shoreline position (Figure 6). These profiles demonstratea large beach retreat scarp that extends about 100 m landward of the present beach(Figure 10). This latest, or most seaward, scarp in the prograded Nehalem spit cor-responds to the last Cascadia rupture and coseismic subsidence event at A.D. 1700(Table I). The retreat scarp is of catastrophic scale by comparison to erosion fromhistoric winter storm events. However, the backedge of the retreat scarp does notreach the spit interior, which is reported to host wreck timber artifacts. The retreatscarp is entirely buried by the modern foredune. Attempts to hand-probe with sandauger to the retreat scarp were unsuccessful due to either penetration refusal in
PETERSON ET AL.
GEOARCHAEOLOGY: AN INTERNATIONAL JOURNAL, VOL. 26, NO. 2230
Figure 8. Ground-penetrating radar (GPR) plot from the second north-to-south profile (L2), located nearthe north end of the Nehalem spit (Figure 7). The profile was collected with a 50-MHz antenna mountedon a trailer system. Topographic control is provided at profile endpoints (!500 m distance intervals).
Ele
v. (m
) L2L1
L3 L4 L5 L6 L7 L8 L9 L10 L11
10
0
5
!5
0
Distance (km)
5.0 2.5
North South
Vertical Exaggeration 50x
Nehalem Spit
Figure 9. Line diagram of high-amplitude semicontinuous reflections from linked GPR profiles (L1–L11)in the Nehalem spit (Figure 7). No large cut-and-fill features or epsilon strata are imaged in the upper 10m of the spit deposits.
GEA262_05_20349.qxd 2/1/11 1:04 PM Page 230

GEOARCHAEOLOGY: AN INTERNATIONAL JOURNAL, VOL. 26, NO. 2
GEOARCHAEOLOGY OF THE NEHALEM SPIT
231
large debris, which was not recovered, or hole collapse at the groundwater surface(Table II).
Subsurface Probes
The small-scale stratigraphic development of the shallowest spit deposits (1–3 mdepth), are revealed in auger probe, trench, and bayshore cutbank sites (Figure 6,Table II). Very well-sorted dune sand predominates in all of the shallow groundtruthsites. Probe depths were limited by hole collapse in saturated sand deposits at thegroundwater surface (GWS), at 1–3 m depth in many sites.
Anomalous large clasts, including pebbles (less than 6.5 cm Di), cobbles (6.5–25.6cm Di), and small boulders (greater than 25.6 cm Di) are found in 12 subsurface sitesfrom the middle section of the spit, between sites A10 and T20 (Figure 6, Table II). Thelarge clasts occur in one or two distinct layers, which are distinguished by dark sandthat contains granule-size lithic fragments (Figure 11). The uppermost large clastlayer is correlated between probe sites that cross the interior of the spit’s middle sec-tion (Figure 12). In one transect (CB13 to T16), the uppermost large clast layer over-lies a buried beach cobble berm on the west side of the spit interior at T16.
The large clast layer(s) reflect catastrophic flooding event(s) that crossed the mid-dle section of the Nehalem spit (Figure 12). The large clast layers in the spit interior
10
5
0
!5
!10!15
Projected Foredune CrestZ3
0
10
5
!5
!10
!15
Z5 Camp
Glen
GWS
GWS
Spit Beach
Ele
vatio
n (m
) N
AV
D88
Ele
vatio
n (m
) N
AV
D88
Distance (m)
Distance (m)
Retreat Scarp
Retreat Scarp
Figure 10. Across-shore GPR profiles from the Nehhalem spit (Figure 7), crossing the modern foreduneand terminating at the saltwater intrusion interface (beach backshore) at right. Large beach retreat scarpsare imaged under the modern foredune. Sand auger probes Z5 and Z2 (Table II) failed to reach the deeplyburied retreat scarp due to hole collapse at the groundwater surface (GWS).
GEA262_05_20349.qxd 2/1/11 1:04 PM Page 231

occur 100–200 m seaward of the reach of the 1964 river flood, as documented by rem-nant drift logs from the 1964 high water line. The 1964 flood represents a 100–500year flood in many rivers of the north Oregon coast. No historic cobble or pebbledeposits are associated with the 1964 high water line. The presence of large cobblesin discrete strata that cross the spit argue for catastrophic flooding that far exceeds100–500 yr river flooding in the lower Nehalem Bay. The cobble sheets are interpretedto be of tsunami origin.
A sand sample was taken from a depth of 100 cm in cutbank site CB13 for opti-cally stimulated luminescence (OSL) dating by James Feathers at the University of
PETERSON ET AL.
GEOARCHAEOLOGY: AN INTERNATIONAL JOURNAL, VOL. 26, NO. 2232
Table II. Auger probe, cutbank, and trench sites in the Nehalem Bay spit.
Elevation (m) Total Depth 1st Clast Layer 2nd Clast LayerSite UTM-N (m) UTM-E (m) NAVD88 (cm) Depth (cm) Depth (cm)
Z1* 5062302 426886 10 450 450Z2* 5062316 426872 12 465 450Z3* 5061532 426929 10 525 525Z4 5061593 427287 12 225A1 5061405 427624 10 185A2 5061339 427578 9 115A3 5061290 427484 9 190A4 5061189 427491 8 150Z5* 5061165 426975 10 415Z6 5061132 427164 7 235A5 5061073 427515 7 80A6 5060882 427565 6 120A7 5060756 427576 5 130A8 5060613 427548 4 140A9 5060392 427464 2 195A10 5060259 427316 3 205 120–130A11 5060139 427256 2 165 80–90CB12 5059749 427169 2 105 12–29Z7* 5059615 426986 8 360 360CB13 5059396 427154 2 205 57–78 150–160T14 5059389 427110 2 120 23–30 110–120T15 5059389 427110 3 140 110–130T16 5059500 427033 5 95 10–95CB17 5059211 427169 2 201 80–100 190–200CB18 5058633 427176 2 205 50–57 103–160A19 5058620 427166 3 130 15–30 115–125T20 5058620 427100 4 265 130–152 190–194A21 5057693 427204 4 265A22 5057022 427100 5 285* Auger sites taken near extrapolated backedge of GPR beach retreat scarp. Penetration refusal in clasts, debris,or water table prohibited sample recovery with hand sand auger. Mechanical testing is required.
GEA262_05_20349.qxd 2/1/11 1:04 PM Page 232
GEOARCHAEOLOGY: AN INTERNATIONAL JOURNAL, VOL. 26, NO. 2
GEOARCHAEOLOGY OF THE NEHALEM SPIT
233
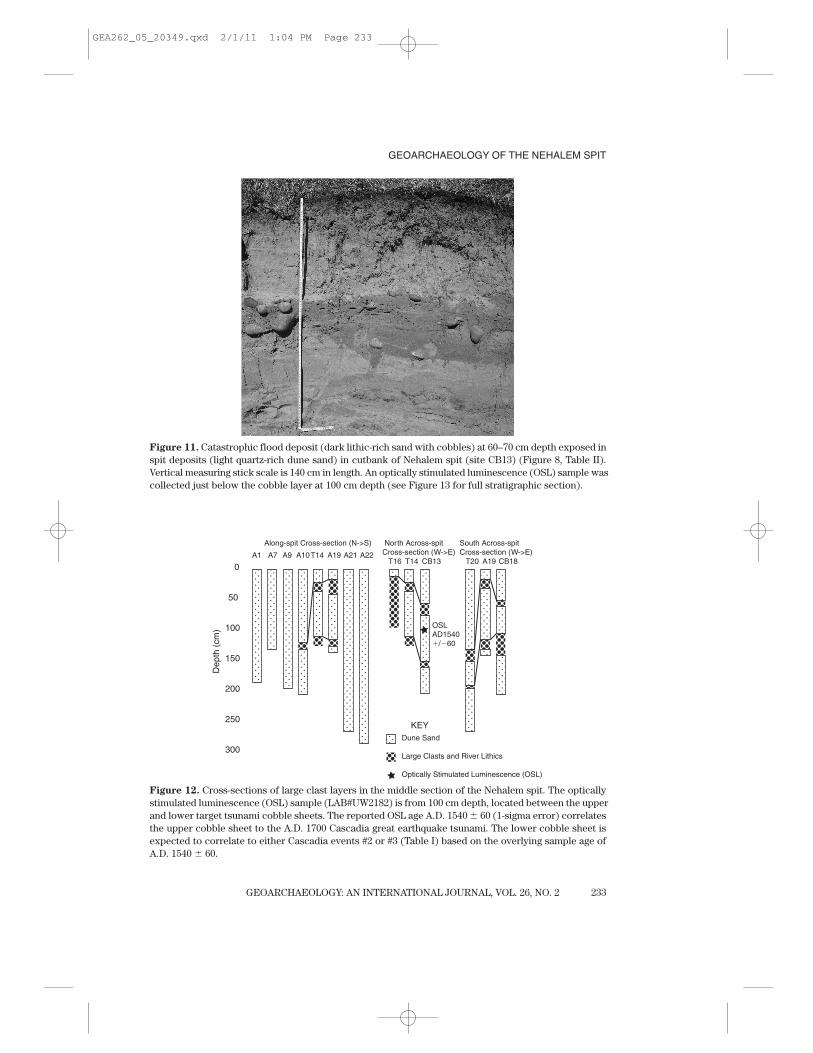
Figure 11. Catastrophic flood deposit (dark lithic-rich sand with cobbles) at 60–70 cm depth exposed inspit deposits (light quartz-rich dune sand) in cutbank of Nehalem spit (site CB13) (Figure 8, Table II).Vertical measuring stick scale is 140 cm in length. An optically stimulated luminescence (OSL) sample wascollected just below the cobble layer at 100 cm depth (see Figure 13 for full stratigraphic section).
A1 A7 A10A9 T14 A19 A21 A22
Along-spit Cross-section (N->S)
T16 T14 CB13
North Across-spitCross-section (W->E)
T20 A19 CB18
South Across-spitCross-section (W->E)
0
50
100
150
200
250
300
Dep
th (
cm)
Dune Sand
Large Clasts and River Lithics
KEY
OSLAD1540!/"60
Optically Stimulated Luminescence (OSL)
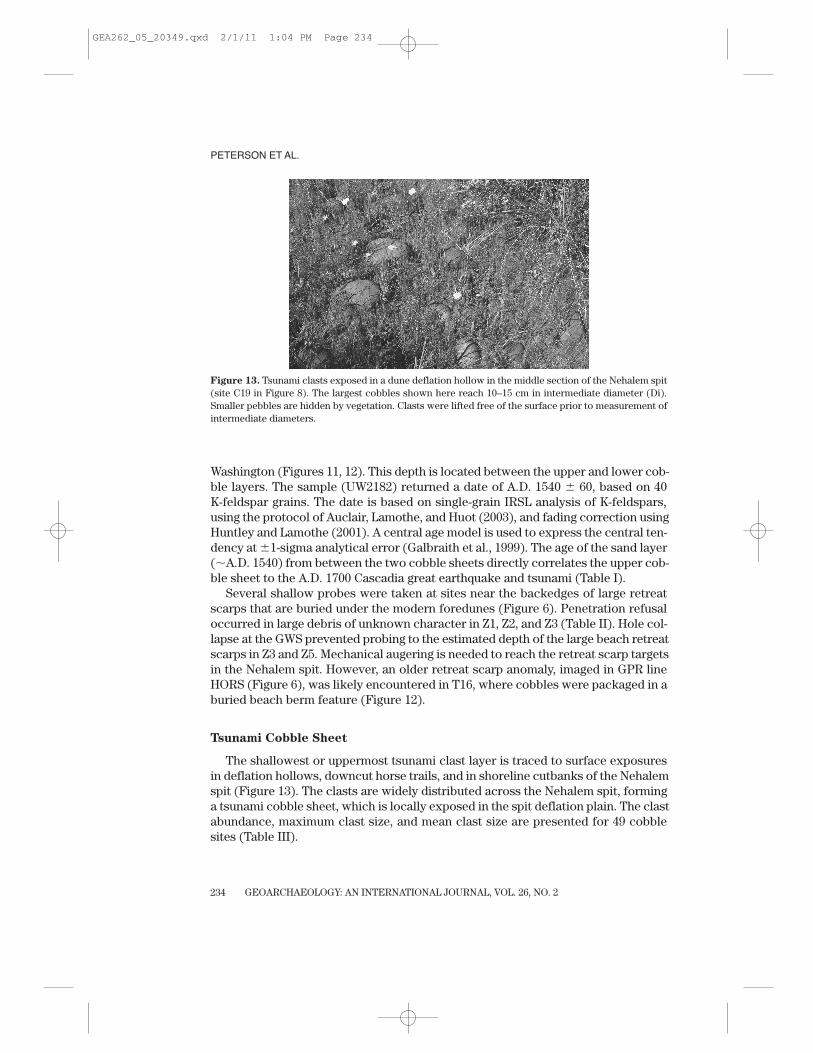
Figure 12. Cross-sections of large clast layers in the middle section of the Nehalem spit. The opticallystimulated luminescence (OSL) sample (LAB#UW2182) is from 100 cm depth, located between the upperand lower target tsunami cobble sheets. The reported OSL age A.D. 1540 # 60 (1-sigma error) correlatesthe upper cobble sheet to the A.D. 1700 Cascadia great earthquake tsunami. The lower cobble sheet isexpected to correlate to either Cascadia events #2 or #3 (Table I) based on the overlying sample age ofA.D. 1540 # 60.
GEA262_05_20349.qxd 2/1/11 1:04 PM Page 233
PETERSON ET AL.
GEOARCHAEOLOGY: AN INTERNATIONAL JOURNAL, VOL. 26, NO. 2234
Washington (Figures 11, 12). This depth is located between the upper and lower cob-ble layers. The sample (UW2182) returned a date of A.D. 1540 ! 60, based on 40 K-feldspar grains. The date is based on single-grain IRSL analysis of K-feldspars,using the protocol of Auclair, Lamothe, and Huot (2003), and fading correction usingHuntley and Lamothe (2001). A central age model is used to express the central ten-dency at !1-sigma analytical error (Galbraith et al., 1999). The age of the sand layer(!A.D. 1540) from between the two cobble sheets directly correlates the upper cob-ble sheet to the A.D. 1700 Cascadia great earthquake and tsunami (Table I).
Several shallow probes were taken at sites near the backedges of large retreatscarps that are buried under the modern foredunes (Figure 6). Penetration refusaloccurred in large debris of unknown character in Z1, Z2, and Z3 (Table II). Hole col-lapse at the GWS prevented probing to the estimated depth of the large beach retreatscarps in Z3 and Z5. Mechanical augering is needed to reach the retreat scarp targetsin the Nehalem spit. However, an older retreat scarp anomaly, imaged in GPR lineHORS (Figure 6), was likely encountered in T16, where cobbles were packaged in aburied beach berm feature (Figure 12).
Tsunami Cobble Sheet
The shallowest or uppermost tsunami clast layer is traced to surface exposuresin deflation hollows, downcut horse trails, and in shoreline cutbanks of the Nehalemspit (Figure 13). The clasts are widely distributed across the Nehalem spit, forminga tsunami cobble sheet, which is locally exposed in the spit deflation plain. The clastabundance, maximum clast size, and mean clast size are presented for 49 cobblesites (Table III).
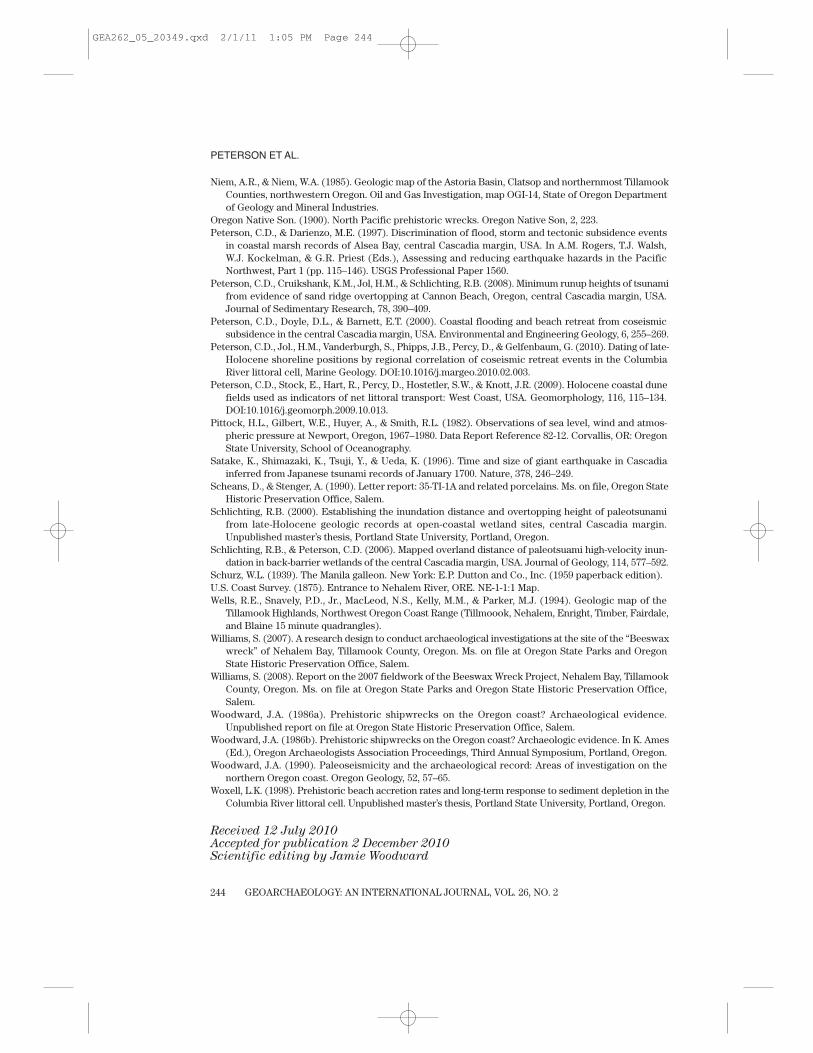
Figure 13. Tsunami clasts exposed in a dune deflation hollow in the middle section of the Nehalem spit(site C19 in Figure 8). The largest cobbles shown here reach 10–15 cm in intermediate diameter (Di).Smaller pebbles are hidden by vegetation. Clasts were lifted free of the surface prior to measurement ofintermediate diameters.
GEA262_05_20349.qxd 2/1/11 1:04 PM Page 234

Table III. Sites containing large clasts exposed at the surface of the Nehalem spit.
UTM-N (m) UTM-E (m) Elevation (m) Clast Number Maximum Mean Clast Std. Site EPE !5 m EPE !5 m NAVD88 in Plot Area Clast Size (cm) Size (cm) Dev. 1s
C1 5060162 427150 5 3 34 21 12C2 5060129 427173 4 6 37 14 4C3 5060111 427161 2 4 24 17 4.7C4 5060014 427183 3 21 9.1 3.6 2.4C5 5059862 427077 5 25 35 4.8 1.9C6* 5059823 427201 3 7 12.5 7.9 3.3C7 5059780 427186 2 8 13.2 9.4 1.4C8 5059768 427095 5 3 10 10 3.5C9 5059758 427116 4 12 28.0 10.3 6C10 5059699 427168 2 3 40 15 2.5C11 5059692 427202 1 25 14 3.6 1.5C12* 5059628 427073 5 26 15 4.3 2.2C13 5059610 427160 3 5 24 12 3.8C14 5059532 427119 3 10 23.3 8.2 3.8C15 5059530 427178 1 15 26.7 13.1 7.4C16 5059512 427032 5 10 16.1 6.6 3.5C17 5059449 427072 4 3 24 12.7 7C18 5059419 427069 4 5 16 10 3.2C19* 5059408 427116 3 14 16 7.1 4.1C20 5059398 427158 1 19 28.5 6.2 3.2C21* 5059336 427112 3 20 18 3.8 2.4C22 5059269 427109 5 23 14 5.5 2.6C23 5059257 427050 4 10 18 10 3.7C24* 5059193 427133 3 22 19 4.7 2.6C25 5059055 427123 3 17 21 9.4 4.4C26 5059052 427063 4 14 16 8 3.5CP#1 5059046 427121 4 1 sherd 6 — —C27* 5059039 427177 2 12 22 8 5C28 5058959 427063 4 11 14.2 7.4 3.1C29* 5058920 427192 1 20 14 6.2 3.5C30 5058703 427195 2 23 14.5 4.4 2.1C31 5058632 427100 2 21 14 7.3 2.3C32* 5058590 427071 4 25 4 2.5 0.9C33 5058539 427312 1 25 10.5 3.2 7.5C34 5058522 427135 3 7 4.5 6.3 2.5C35 5058498 427137 3 7 12.3 8.2 3.5C36 5058443 427160 3 11 14.4 8.3 4.1C37 5058384 427150 3 5 14.4 11 1.7C38 5058302 427207 3 5 13 4.5 3.6C39* 5058297 427129 3 3 11.1 8.2 4C40 5058203 427231 3 1 11 11 —C41 5058057 427313 2 1 4 4 —C42 5057976 427059 4 2 5 4 0.7C43 5057971 427301 2 5 14 7.4 2.6C44† 5057920 427233 3 8 12.5 9.3 1.9C45 5057886 427311 3 5 14 5.9 1.7C46† 5057765 427200 3 7 2.7 2.3 0.8C47 5057680 427263 2 2 2.5 2.2 0.3C48† 5057632 427238 3 8 6.5 4.2 1.7C49† 5057609 427237 2 5 2.5 2.3 0.4
Note: Plot area size is shown as follows: 1.0 m2 (default), !0.5 m2 (*), and ! 10 m2 (†).Mean and standard deviation (SD in cm) are based on the total clast number counted for the plot area.CP#1 is the Chinese porcelain sherd exposed in a trail that crosses the exposed tsunami cobble layer in the cen-tral part of the Nehalem spit (see Figures 3, 8, and 16).
GEA262_05_20349.qxd 2/1/11 1:04 PM Page 235

PETERSON ET AL.
GEOARCHAEOLOGY: AN INTERNATIONAL JOURNAL, VOL. 26, NO. 2236
The tsunami clasts mantle the full width and length of the middle section of theNehalem spit, extending over a surface area of 2.25 km2 (Figure 7). The maximumclast size ranges from 3 to 40 cm in intermediate diameter (Table III). Clast abundanceand size generally decrease from north to south along the spit. A trend surface analy-sis confirms a fining of clast size from north to south at greater than 95 percent con-fidence interval. No significant across-spit trends of clast abundance or size areapparent in the 49 sites analyzed, possibly due to the narrowness of the spit.
The presence of the A.D. 1700 tsunami cobble sheet throughout much of theNehalem spit confirms the integrity and stability of the spit since early historic timesin the area. The second tsunami cobble sheet (Figure 12) must correlate to an olderCascadia tsunami of about 1000 yrs in age (Table I), indicating stability of the mid-dle spit section back to that time period.
The trends of decreasing clast size with distance south of the Nehalem channel bendat Fishery Point suggest a cobble origin from the Nehalem channel. To establish theorigin of the tsunami cobbles, their representative lithologies are compared to endmember samples from the Nehalem River and from a beach cobble berm at the baseof the Neahkahnie headland (Table IV). The Neahkahnie Mountain headland is formed
Table IV. Lithologies of A.D. 1700 tsunami cobbles and of end member cobble sources from the beachand the Nehalem River.
Lithology Tsunami C9, C19 Beach River Main River NF
Gabbro-diabase, Columbia River Basalt 3 27 2 3(CRB) Fm
Aphyric basalt or basaltic-andesite, 4 3 7 5undifferentiated Fm
Porphyritic basaltic-andesite, or andesite, 6 0 8 5Tillamook Volcanics
Aphyric basaltic-andesite, or andesite, 6 0 6 3Tillamook Volcanics
Porphyritic pyroxene or plagioclase basalt, 4 0 5 3Tillamook Volcanics
Vesicular basalt, basaltic-andesite, andesite, 3 — 2 1or dacite, Tillamook Volcanics
Baked pebbly sandstone, or coarse sandstone, 1 0 0 0Astoria Fm
Baked burrowed mudstone-siltstone, Smugglers 2 0 0 6Cove Fm
Baked tuffaceous siltstone-mudstone, Oswald 1 0 0 4West Fm or Kesey Fm
Total 30 30 30 30
Note: Cobbles from the Main and North Forks (NF) of the Nehalem River were each collected at bridge sites about 15 km upriver of their mutual confluence at UTM 5063530n, 439950e, and UTM 507358-n, 440140e, respectively.Cobbles from the Manzanita beach cobble berm (Beach) were collected about 1.5 km southeast of the Neahkahnieheadland. Cobble lithologies were indentified from fresh fracture faces examined under hand lens. Cobblelithologies are tied to bedrock units in the Neahkahnie headland and in the Nehalem River drainages followingNiem and Niem (1985) and Wells et al. (1994).
GEA262_05_20349.qxd 2/1/11 1:04 PM Page 236

GEOARCHAEOLOGY: AN INTERNATIONAL JOURNAL, VOL. 26, NO. 2
GEOARCHAEOLOGY OF THE NEHALEM SPIT
237
from the gabbro-diabase Columbia River Basalt (CRB) Grand Ronde flow (Niem &Niem, 1985). The beach cobbles (90% gabbro-diabase CRB) directly reflect this sourcelithology. The Nehalem drainage contains a wide variety of volcanic and sedimentaryformations with distinctive lithologies (Niem & Niem, 1985; Wells et al., 1994). Thedrainage of the Nehalem Main Fork is much larger than the Nehalem North Fork, butthe North Fork contains some very distinctive sill-baked sedimentary rocks. Thetsunami cobbles from sites C9 and C19 reflect the mixed lithologies of the NehalemRiver source(s), and not the nearly uniform lithology of the beach cobbles from theNeahkahnie Mountain volcanic sill. The tsunami cobbles on the Nehalem spit arederived from tsunami return flow(s) directed down the Nehalem Channel and aroundFishery Point. This is the first reported evidence of tsunami backwash flow inunda-tion and associated large clast deposition in the Cascadia margin.
Recently, a porcelain sherd associated with the wreck was found on the Nehalemspit (Figure 2), exposed on the surface of the tsunami cobble layer (G. McDaniel,Oregon State Parks, personal communication, 2010) (Figure 7). The sherd wasexposed in a horse trail (Table III) that crosses the tsunami cobble layer. Althoughit could not be determined if the sherd was deposited with the cobbles by the tsunamior had been dropped on the cobble surface at a later date, the location away fromany known Indian sites on the spit combined with the relatively large size of thesherd suggests that the cobble layer may contain in situ sherds, deposited by thereversing tsunami surges but originating from wrecked cargo scattered on the beachor just offshore. The fragment is 6 by 3.5 cm in size, and it contains a blue-on-whitefloral scroll motif of either a tiger lily or a modified chrysanthemum.
DISCUSSION
A wrecked Manila galleon would have littered the Nehalem area shorelines withabundant cargo and ship structural debris (Konstam, 2004) and beeswax, which wasa cargo that only the Spanish shipped (Schurz, 1939; Marshall, 1984; Williams, 2007;Figure 1). Pioneers routinely collected these artifacts from the Nehalem spit beachesin the mid to late 19th century (Giesecke, 2001; Williams, 2007). Finds of either teakwood or beeswax blocks from the Nehalem ocean beaches became rare by the mid-1900s (Giesecke, 2007; Williams, 2007).
We propose the following sequence of events to have distributed, and then buried,the Beeswax wreck debris on the Nehalem spit. A Spanish galleon, possibly theSanto Christo de Burgos, lost in A.D. 1693, wrecked offshore of the Nehalem spit areain the late 1600s (Lally, 2008). The wreck debris was distributed along the spit and/orthe Neahkahnie headland area by seasonally reversing currents for several years ordecades. The A.D. 1700 Cascadia earthquake produced a moderate-sized tsunamirunup in the Nehalem area (Schlichting, 2000) that swept wreck debris across theNehalem spit and into Nehalem Bay. Tsunami backwash from Nehalem Bay wasdirected down the Nehalem channel and over the low-lying sections of the middlespit (Figure 14). Shallow reversing surges could account for the chaotic depositionof mixed beach sand, coarse river sand, and river cobbles in thin tsunami layers
GEA262_05_20349.qxd 2/1/11 1:04 PM Page 237

across the spit interior. Shipwreck porcelain and earthenware sherds from ship-wreck debris on the spit beaches were remobilized and deposited over the middlespit by the reversing tsunami surges. Wreck debris was better retained in the northspit in tsunami inflow strandlines (!6–8 m elevation) that exceeded the heights ofthe tsunami return flows (!4–6 m elevation) over the middle spit.
Wreck debris deposited on the Nehalem Bay tidal flats, by tsunami inundationover the Nehalem spit, has been buried by interseismic sedimentation (40–80 cm)(Figure 4) that followed the coseismic coastal subsidence from the A.D. 1700 rup-ture. The regional coseismic subsidence, !1.5 m in Nehalem Bay (Grant, 1994), ledto catastrophic beach retreat (Figure 10). Remaining Beeswax wreck debris on theocean beach was carried landward against the retreating beach face by winter surf.The wreck debris is reported to have remained exposed until settlers reached thecoast in the early 1800s (Geisecke, 2007; Marshall, 1984). Following interseismicrebound and uplift, the beach began to recover, eventually burying wood and waxartifacts in strandlines under beach progradation and foredune accretion by theearly 1900s.
The interseismic accretion of the Nehalem spit is measured by horizontal dis-placement of the 0 m datum intercept between the coseismic beach retreat scarp and
PETERSON ET AL.
GEOARCHAEOLOGY: AN INTERNATIONAL JOURNAL, VOL. 26, NO. 2238
Figure 14. Map of tsunami maximum clast size (boulders, cobbles, pebbles in black circles) from rep-resentative surface exposure sites in the Nehalem spit. Tsunami inflow and outflow (arrows), reportedwreck teak timbers (X), and recently discovered Chinese porcelain (black star) are shown relative tomodern elevations (dotted lines in m NAVD88) in the spit deflation plain. Modern foredune elevations atthe ocean beach are not shown.
GEA262_05_20349.qxd 2/1/11 1:04 PM Page 238

GEOARCHAEOLOGY: AN INTERNATIONAL JOURNAL, VOL. 26, NO. 2
GEOARCHAEOLOGY OF THE NEHALEM SPIT
239
the modern beach face. The beach progradational recovery is measured at two GPRprofiles, Camp and Glen (Figure 15). The measured beach recovery is !150 m inacross-shore distance. Assuming no net gain or loss of beach sand from the Nehalemnearshore during the last 300 years, the measured beach recovery possibly reflectsthe coseismic retreat distance. Catastrophic retreat of !150 m, following 1.5 m ofcoastal subsidence, is within tolerances of predicted beach retreat using the modi-fied Brunn relation for the Nehalem spit setting (Doyle, 1996).
Northward migration or fluctuation of the Nehalem tidal inlet prior to jetty sta-bilization in the early 1900s probably accounts for the sightings of wreck debris atthe south end of the spit at the turn of the century (Williams, 2008). The relativelyrecent finds of teak wood at the north end of the spit likely reflects the lack of netsand accretion at the south side of the Neahkahnie headland. Episodic erosionexposes beach boulder berms near Manzanita, possibly releasing trapped wreckdebris.
Dune sand migration over the spit occurred until the mid 1900s (Cooper, 1958),when non-native dune grass stabilized the foredune, and deflation locally exposedthe spit interior. Sand dunes ramped up against the south side of the Manzanita dunesheet (see Figure 16 below), possibly burying the A.D. 1700 tsunami strand line.
Figure 15. Beach recovery and net accretion to present time since catastrophic retreat at A.D. 1700.Topographic surveying was carried seaward of the saltwater limitation of GPR recording, as shown bysolid circles. Profile extension to –1 m MTL is based on gradients measured in the Nehalem spit duringprevious beach surveys (Doyle, 1996).
GEA262_05_20349.qxd 2/1/11 1:05 PM Page 239

However, deflation dominated in the middle spit section, thereby locally exposing the A.D. 1700 tsunami cobble sheet. At least one pioneer traced a “freshet silt layer”(i.e., the tsunami debris layer) under the dune sand to find beeswax candles andother shipwreck artifacts in the spit interior (Hult, 1968; Oregon Native Son, 1900).
Episodic erosion of the Nehalem spit bayshore locally entrenches the bayside cut-banks, which release unworked earthenware and porcelain sherds from the A.D. 1700tsunami sand and cobble layer. Channel bank erosion at Cronin Point is also releas-ing worked porcelain sherds and debitage, which are transported north to bay flatsby tidal flood and wind-wave currents (Figure 1). The flaked porcelain found alongthe bay shoreline south of Fishery Point could be related to the use of this shorelineas a travel route in late prehistoric and early historic time.
Wreck Debris Target Areas
The northward limit of tsunami river cobbles in the Nehalem spit probably demarksthe northward extent of tsunami outflow over the spit (Figure 14). The lower outflowheights, relative to higher inflow heights, should preserve the tsunami inundationstrandline(s) and any accompanying wreck woody debris. We target an area thatshould have the highest probability of preserving wreck timber and beeswax asso-ciated with the A.D. 1700 tsunami inflow strandline(s). The target area is based onthe following criteria: (1) predicted tsunami runup (A.D. 1700 event) not exceeding
PETERSON ET AL.
GEOARCHAEOLOGY: AN INTERNATIONAL JOURNAL, VOL. 26, NO. 2240
Figure 16. Historic (1960) air photo of the north end of the Nehalem spit, showing (1) early foredune anddeflation plain morphology, (2) modern spot elevations, (3) mapped A.D. 1700 beach retreat scarp (dot-ted line), (4) A.D. 1700 tsunami outflow cobbles (open circles), and most likely preservation of buoyantartifacts including wood and wax (box) in areas of tsunami inflow strandlines in the spit interior.
GEA262_05_20349.qxd 2/1/11 1:05 PM Page 240

GEOARCHAEOLOGY: AN INTERNATIONAL JOURNAL, VOL. 26, NO. 2
GEOARCHAEOLOGY OF THE NEHALEM SPIT
241
8 m (Peterson et al., 2008), (2) modern spit interior heights (5–10 m elevation), (3) historic accounts of wreck wood debris (Giesecke, 2007), (4) dune cover of 1–3m thickness (Table II), and (5) the limit of outflow cobble deposition (Figure 16).
Foredune accretion has likely buried debris at the back edge of beach retreatscarps below the reach of hand probing (Figure 16). However, deflation behind theforedune could put the wreck debris within reach of shallow probing or trenching.The more deeply buried retreat scarp, and any associated post–A.D. 1700 beachstrandline debris, located under the foredune will require mechanical drilling forartifact recovery and wreck debris verification.
The wreck’s heavy cargo is likely located offshore of the Nehalem spit orNeahkahnie headland. An offshore wreck site will require offshore surveying forexposed debris and/or magnetic artifacts. The return of offshore sand to the beaches,during the last 100 years of interseismic recovery (Figure 15), could re-expose off-shore Beeswax wreck debris. Optimal exposure would occur if the galleon ranaground within a conservative depth of closure (less than 20 m water depth) in theNehalem area (Doyle, 1996).
Impact of A.D. 1700 Tsunami and Coastal Subsidence on Nehalem Archaeological Sites
Nehalem–Tillamook flooding myths were recounted in 1934 by Clara Pearson(Jacobs & Jacobs, 1959), who was reported to be one of the last fluent speakers ofthe Nehalem language on the Oregon coast (Woodward, 1990). Whether or not therecorded myths refer to the A.D. 1700 Cascadia tsunami, there is physical evidence ofarchaeological site impact(s) from the event in Nehalem Bay. Abrupt subsidence bur-ial of a Native American occupation site (35T156) is reported from an intertidal reachof the North Fork of the Nehalem River (Figure 2) (Minor & Grant, 1996). The tim-ing of the radiocarbon-dated occupation (660 ! 60 yr B.P. hearth charcoal date)slightly predates the age of the buried forest floor (430 ! 60 yr B.P.) and the age ofa possible tsunami sand (370 ! 60 yr B.P.) (Minor & Grant, 1996). However, the esti-mated submergence (1.5 m) would have made wetland sites in Nehalem Bay unin-habitable for decades following the coseismic subsidence.
Additional evidence of impact from the A.D. 1700 event is found at Cronin Point35TI4 (Figure 1), where a horizon with fire-cracked rock is buried by woody debrisand silt. A woven mat in the top of the debris layer is dated at 380 ! 60 yr B.P.(Woodward, 1986b). The wood and silt layers are interpreted to represent tsunamidebris layer from the A.D. 1700 event (Woodward, 1990). In this study we confirmthe inundation and burial of the Cronin Point site by the A.D. 1700 tsunami, whichinundated the full extent of the northern Nehalem Bay (Figure 4). Though this eventwas temporarily catastrophic to some low-lying shorelines, the Native Americansdid not permanently abandon their occupation sites in Nehalem Bay (Losey, 2002).
Catastrophic tsunami inundation and/or post-subsidence burial of Native Americanoccupation sites, at about A.D. 1700, are also reported from Willapa Bay and theCopalis River mouth area in southwest Washington (Figure 1) (Cole et al., 1996).
GEA262_05_20349.qxd 2/1/11 1:05 PM Page 241

The study presented here and its relation to the Beeswax wreck debris is the firstreport of the A.D. 1700 tsunami and coseismic subsidence impacting an earlyEuropean archaeological site in the Cascadia margin.
CONCLUSIONS
This study of the geomorphology, littoral processes, and coseismic impacts onthe Nehalem spit argue for a Beeswax shipwreck date that precedes the last Cascadiaearthquake and tsunami at !A.D. 1700. Shipwreck teak wood, beeswax, and Chineseporcelain sherds were carried over the spit by tsunami inflow. Wreck debris is likelypreserved on the higher north spit section, located above the reach of tsunami out-flow. A widespread river-cobble sheet represents the course of tsunami outflow overthe lower mid-spit section. Coseismic subsidence resulted in catastrophic beachretreat, which remobilized post-tsunami beach debris to more landward beach stran-dlines. However, interseismic beach recovery and recent foredune accretion haveburied the catastrophic retreat strandlines and associated wreck debris during the last 150 years. The concurrent onshore movement of nearshore sand could exposesome offshore heavy wreck debris if the ship wrecked in shallow water. These resultsprovide intriguing evidence of an important early shipwreck site that was impactedby the A.D. 1700 tsunami and post-subsidence beach retreat in the central Cascadiamargin. Perhaps the greatest significance of the Beeswax wreck is that it representsthe earliest archaeological evidence of contact between Euroamericans and NativeAmericans on the northern Oregon coast.
Rick Rogers served as co-leader of the Beeswax Wreck Team. Eb Giesecke pointed out reported sites ofwreck artifacts from the interior of the Nehalem spit. Alan Niem performed the cobble lithology identifi-cations and, together with Wendy Niem, provided the cobble lithology correlations to mapped bedrock for-mations in the Nehalem River drainages. Dave Wellman performed Total Station-Opus GPS surveying. BillSpurlock provided details about galleon construction and characteristics of wreckage debris. Paul Seeprovided descriptions of wreck timber being harvested from the Manzanita shorelines during the early1900s. In 2007, Timothy Blazina, Darrick Boschman, Scott Braunsten, Mathew Brown, Ezzell Brandon,Adam Cambell, Annie Donehey, Erin Dunbar, Aspen Gillam, Thomas Schepker, Joshua Theule, and StephenWilson assisted with preliminary GPR profiling, total station surveying, and sand auger probing. In 2009,Kate Mickelson, Kendra Williams, Beth Paulson, Kristin McGlothen, Stacy Smith, and Hollie Heesacker per-formed auger and trench probing and tsunami clast size measurement. Galen Peterson assisted with OSLsampling in bayside cutbank exposures of the Nehalem spit. Russ Mathews provided GPR maintenancefees support. Lewis Scott and the Naga Research Group provided support for radiocarbon dating. TheOregon State Park at Nehlalem Bay, Oregon, provided access and logistical support. Gary McDaniel assistedwith Chinese porcelain artifact collection on the Nehalem spit in 2010. We thank Rick Minor, Jon Erlandson,and an anonymous reviewer for helpful comments that improved this manuscript.
REFERENCES
Atwater, B.F., Tuttle, M.P., Schweig, E.S., Rubin, C.M., Yamaguchi, D.K., & Hemphill-Haley, E. (2004).Earthquake recurrence, inferred from paleoseismology. In A.R. Gillespie, S.C. Porter, & B.F. Atwater(Eds.), The Quaternary period in the United States (pp. 331–350). Amsterdam: Elsevier.
Auclair, M., Lamothe, M., & Huot, S. ( 2003). Measurement of anomalous fading for feldspar IRSL usingSAR. Radiation Measurements, 37, 487–492.
PETERSON ET AL.
GEOARCHAEOLOGY: AN INTERNATIONAL JOURNAL, VOL. 26, NO. 2242
GEA262_05_20349.qxd 2/1/11 1:05 PM Page 242

GEOARCHAEOLOGY: AN INTERNATIONAL JOURNAL, VOL. 26, NO. 2
GEOARCHAEOLOGY OF THE NEHALEM SPIT
243
Barnett, E.T. (1997). Potential for coastal flooding due to coseismic subsidence in the central Cascadiamargin. Unpublished master’s thesis, Portland State University, Portland, Oregon.
Beals, H.K., & Steele, H. (1981). Chinese porcelains from site 35-TI-1, Netarts sand spit, Tillamook County,Oregon. University of Oregon Anthropological Papers No. 23. Portland: University of Oregon.
Cole, S.C., Atwater, B.F., McCutcheon, P.T., & Stein, J.K. (1996). Earthquake-induced burial of archaeo-logical sites along the southern Washington coast about 1700 AD. Geoarchaeology, 11, 165–177.
Cooper, W.S. (1958). Coastal sand dunes of Oregon and Washington. Geological Society of America Memoir72. New York: Geological Society of America.
Darienzo, M.E., & Peterson, C.D. (1995). Magnitude and frequency of subduction-zone earthquakes alongthe northern Oregon coast in the past 3,000 years. Oregon Geology, 57, 3–12.
Darienzo, M.E., Peterson, C.D., & Clough, C. (1994). Stratigraphic evidence for great subduction zoneearthquakes at four estuaries in northern Oregon. Journal of Coastal Research, 10, 850–876.
Doyle, D.L. (1996). Beach response to subsidence following a Cascadia subduction zone earthquake alongthe Washington-Oregon coast. Unpublished master’s thesis, Portland State University, Portland, Oregon.
Erlandson, J., Losey, R., & Peterson, N. (2001). Early maritime contact on the northern Oregon coast:Some notes on the 17th century Nehalem Beeswax ship. In J. Younker, M. Tveskov, & D. Lewis (Eds.),Telling out stories: Proceedings of the fourth annual Coquille Cultural Preservation Conference (pp 45–53). North Bend, OR: Coquille Indian Tribe.
Galbraith, R.F., Roberts, R.G., Laslett, G.M., Yoshida, H., & Olley, J.M. (1999). Optical dating of single andmultiple grains of quartz from Jinmium rock shelter, northern Australia, Part I: Experimental designand statistical models. Archaeometry, 41, 339–364.
Giesecke, E.W. (2007). Beeswax, teak, and castaways: Searching for Oregon’s lost protohistoric Asianship. Manzanita, OR: Nehalem Valley Historical Society.
Grant, W.C. (1994). Paleoseismic evidence for late Holocene episodic subsidence on the northern Oregoncoast. Unpublished master’s project, University of Washington.
Heaton, T.H., & Kanamori, H. (1984). Seismic potential associated with subduction in the northwesternUnited States. Bulletin of the Seismological Society of America, 74, 933–941.
Hult, R.E. (1968). Lost mines and treasures of the Pacific Northwest. Portland, OR: Binford & Mort.Huntley, D.J., & Lamothe, M. (2001). Ubiquity of anomalous fading in K-feldspars and the measurements
and correction for it in optical dating. Canadian Journal of Earth Science, 38, 1093–1106.Jacobs, E.D., & Jacobs, M. (1959). Nehalem Bay tales. Monographs, Studies in Anthropology. Eugene,
OR: University of Oregon.Jol, H.M., & Bristow, C.S. (2003). GPR in sediments: Advice on data collection, basic processing and inter-
pretation, a good practice guide. In C.S. Bristow & H.M. Jol (Eds.), Ground penetrating radar in sed-iments (pp. 9–27). Special Publication No. 211. London: Geological Society of London.
Jol, H.M., Smith, D.G., & Meyers, R.A. (1996). Digital ground penetrating radar (GPR): An improved andvery effective geophysical tool for studying modern coastal barriers (examples for the Atlantic, Gulfand Pacific coasts, U.S.A.). Journal of Coastal Research, 12, 960–968.
Komar, P.D. (1992). Ocean processes and hazards along the Oregon coast. Oregon Geology, 54, 65–76.Komar, P., Lanfredi, N., Baba, M., Dean, R., Dyrer, K., Healy, T., Terwindt, J., & Thom, B. (1991). The
response of beaches to sea-level change: A review of predictive models. Journal of Coastal Research,7, 895–921.
Konstam, A. (2004). Spanish galleon 1530–1690. Oxford: Osprey Publishing.Lally, J. (2008). Analysis of the Chinese porcelain associated with the “Beeswax wreck,” Nehalem, Oregon.
Unpublished master’s thesis, Department of Anthropology, Central Washington University, Ellensburg,Washington.
Lévesque, R. (2002). History of Micronesia. Gatineau, Québec: Lévesque Publications.Losey, R.J. (2002). Communities and catastrophe: Tillamook response to the AD 1700 earthquake and
tsunami, Northern Oregon coast. Unpublished PhD thesis, University of Oregon, Eugene, Oregon.Marshall, D. (1984). Oregon shipwrecks. Portland, OR: Binford & Mort.Meyers, R.A., Smith, D.G., Jol, H.M., & Peterson, C.D. (1996). Evidence for eight great earthquake-subsidence
events detected with ground-penetrating radar, Willapa barrier, Washington. Geology, 24, 99–102.Minor, R., & Grant, W.C. (1996). Earthquake-induced subsidence and burial of the late Holocene archae-
ological sites, Northern Oregon Coast. American Antiquity, 61, 772–781.
GEA262_05_20349.qxd 2/1/11 1:05 PM Page 243
Niem, A.R., & Niem, W.A. (1985). Geologic map of the Astoria Basin, Clatsop and northernmost TillamookCounties, northwestern Oregon. Oil and Gas Investigation, map OGI-14, State of Oregon Departmentof Geology and Mineral Industries.
Oregon Native Son. (1900). North Pacific prehistoric wrecks. Oregon Native Son, 2, 223.Peterson, C.D., & Darienzo, M.E. (1997). Discrimination of flood, storm and tectonic subsidence events
in coastal marsh records of Alsea Bay, central Cascadia margin, USA. In A.M. Rogers, T.J. Walsh, W.J. Kockelman, & G.R. Priest (Eds.), Assessing and reducing earthquake hazards in the PacificNorthwest, Part 1 (pp. 115–146). USGS Professional Paper 1560.
Peterson, C.D., Cruikshank, K.M., Jol, H.M., & Schlichting, R.B. (2008). Minimum runup heights of tsunamifrom evidence of sand ridge overtopping at Cannon Beach, Oregon, central Cascadia margin, USA.Journal of Sedimentary Research, 78, 390–409.
Peterson, C.D., Doyle, D.L., & Barnett, E.T. (2000). Coastal flooding and beach retreat from coseismicsubsidence in the central Cascadia margin, USA. Environmental and Engineering Geology, 6, 255–269.
Peterson, C.D., Jol., H.M., Vanderburgh, S., Phipps, J.B., Percy, D., & Gelfenbaum, G. (2010). Dating of late-Holocene shoreline positions by regional correlation of coseismic retreat events in the ColumbiaRiver littoral cell, Marine Geology. DOI:10.1016/j.margeo.2010.02.003.
Peterson, C.D., Stock, E., Hart, R., Percy, D., Hostetler, S.W., & Knott, J.R. (2009). Holocene coastal dunefields used as indicators of net littoral transport: West Coast, USA. Geomorphology, 116, 115–134.DOI:10.1016/j.geomorph.2009.10.013.
Pittock, H.L., Gilbert, W.E., Huyer, A., & Smith, R.L. (1982). Observations of sea level, wind and atmos-pheric pressure at Newport, Oregon, 1967–1980. Data Report Reference 82-12. Corvallis, OR: OregonState University, School of Oceanography.
Satake, K., Shimazaki, K., Tsuji, Y., & Ueda, K. (1996). Time and size of giant earthquake in Cascadiainferred from Japanese tsunami records of January 1700. Nature, 378, 246–249.
Scheans, D., & Stenger, A. (1990). Letter report: 35-TI-1A and related porcelains. Ms. on file, Oregon StateHistoric Preservation Office, Salem.
Schlichting, R.B. (2000). Establishing the inundation distance and overtopping height of paleotsunamifrom late-Holocene geologic records at open-coastal wetland sites, central Cascadia margin.Unpublished master’s thesis, Portland State University, Portland, Oregon.
Schlichting, R.B., & Peterson, C.D. (2006). Mapped overland distance of paleotsuami high-velocity inun-dation in back-barrier wetlands of the central Cascadia margin, USA. Journal of Geology, 114, 577–592.
Schurz, W.L. (1939). The Manila galleon. New York: E.P. Dutton and Co., Inc. (1959 paperback edition).U.S. Coast Survey. (1875). Entrance to Nehalem River, ORE. NE-1-1:1 Map.Wells, R.E., Snavely, P.D., Jr., MacLeod, N.S., Kelly, M.M., & Parker, M.J. (1994). Geologic map of the
Tillamook Highlands, Northwest Oregon Coast Range (Tillmoook, Nehalem, Enright, Timber, Fairdale,and Blaine 15 minute quadrangles).
Williams, S. (2007). A research design to conduct archaeological investigations at the site of the “Beeswaxwreck” of Nehalem Bay, Tillamook County, Oregon. Ms. on file at Oregon State Parks and OregonState Historic Preservation Office, Salem.
Williams, S. (2008). Report on the 2007 fieldwork of the Beeswax Wreck Project, Nehalem Bay, TillamookCounty, Oregon. Ms. on file at Oregon State Parks and Oregon State Historic Preservation Office,Salem.
Woodward, J.A. (1986a). Prehistoric shipwrecks on the Oregon coast? Archaeological evidence.Unpublished report on file at Oregon State Historic Preservation Office, Salem.
Woodward, J.A. (1986b). Prehistoric shipwrecks on the Oregon coast? Archaeologic evidence. In K. Ames(Ed.), Oregon Archaeologists Association Proceedings, Third Annual Symposium, Portland, Oregon.
Woodward, J.A. (1990). Paleoseismicity and the archaeological record: Areas of investigation on thenorthern Oregon coast. Oregon Geology, 52, 57–65.
Woxell, L.K. (1998). Prehistoric beach accretion rates and long-term response to sediment depletion in theColumbia River littoral cell. Unpublished master’s thesis, Portland State University, Portland, Oregon.
Received 12 July 2010Accepted for publication 2 December 2010Scientific editing by Jamie Woodward
PETERSON ET AL.
GEOARCHAEOLOGY: AN INTERNATIONAL JOURNAL, VOL. 26, NO. 2244
GEA262_05_20349.qxd 2/1/11 1:05 PM Page 244