A Holocene Geoarchaeological Record for the Upper Willamette
Geoarchaeological survey at Camp Varouf, L’Erée, Guernsey
Interim Report
Duncan Garrow & Fraser Sturt
April 2008
1
Geoarchaeological survey at Camp Varouf, L’Erée, Guernsey
Interim Report
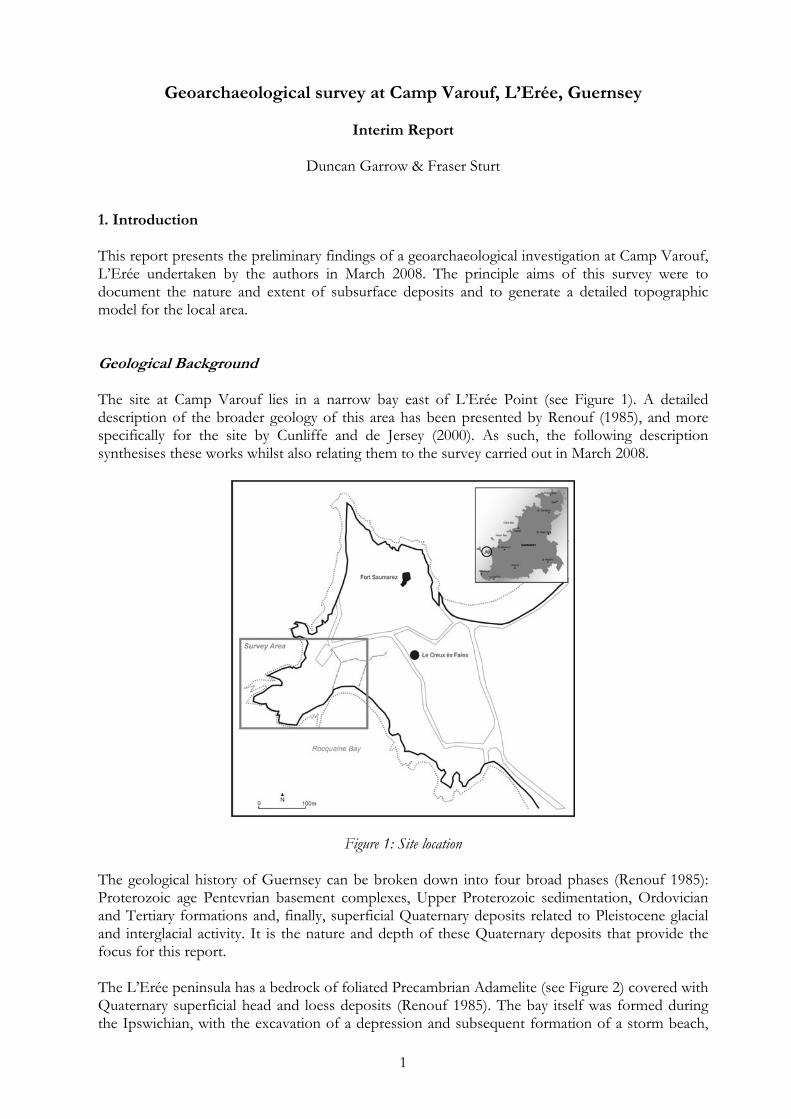
Duncan Garrow & Fraser Sturt 1. Introduction This report presents the preliminary findings of a geoarchaeological investigation at Camp Varouf, L’Erée undertaken by the authors in March 2008. The principle aims of this survey were to document the nature and extent of subsurface deposits and to generate a detailed topographic model for the local area. Geological Background The site at Camp Varouf lies in a narrow bay east of L’Erée Point (see Figure 1). A detailed description of the broader geology of this area has been presented by Renouf (1985), and more specifically for the site by Cunliffe and de Jersey (2000). As such, the following description synthesises these works whilst also relating them to the survey carried out in March 2008.
Figure 1: Site location The geological history of Guernsey can be broken down into four broad phases (Renouf 1985): Proterozoic age Pentevrian basement complexes, Upper Proterozoic sedimentation, Ordovician and Tertiary formations and, finally, superficial Quaternary deposits related to Pleistocene glacial and interglacial activity. It is the nature and depth of these Quaternary deposits that provide the focus for this report. The L’Erée peninsula has a bedrock of foliated Precambrian Adamelite (see Figure 2) covered with Quaternary superficial head and loess deposits (Renouf 1985). The bay itself was formed during the Ipswichian, with the excavation of a depression and subsequent formation of a storm beach,
2
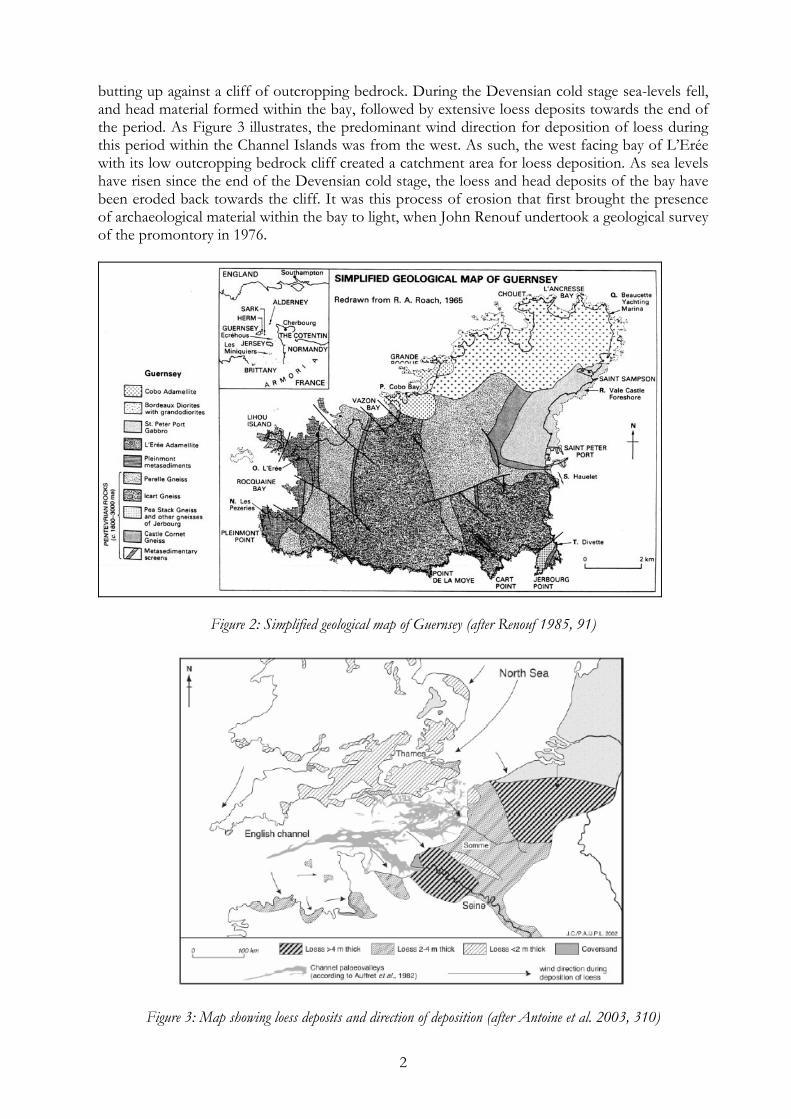
butting up against a cliff of outcropping bedrock. During the Devensian cold stage sea-levels fell, and head material formed within the bay, followed by extensive loess deposits towards the end of the period. As Figure 3 illustrates, the predominant wind direction for deposition of loess during this period within the Channel Islands was from the west. As such, the west facing bay of L’Erée with its low outcropping bedrock cliff created a catchment area for loess deposition. As sea levels have risen since the end of the Devensian cold stage, the loess and head deposits of the bay have been eroded back towards the cliff. It was this process of erosion that first brought the presence of archaeological material within the bay to light, when John Renouf undertook a geological survey of the promontory in 1976.
Figure 2: Simplified geological map of Guernsey (after Renouf 1985, 91)
Figure 3: Map showing loess deposits and direction of deposition (after Antoine et al. 2003, 310)
3
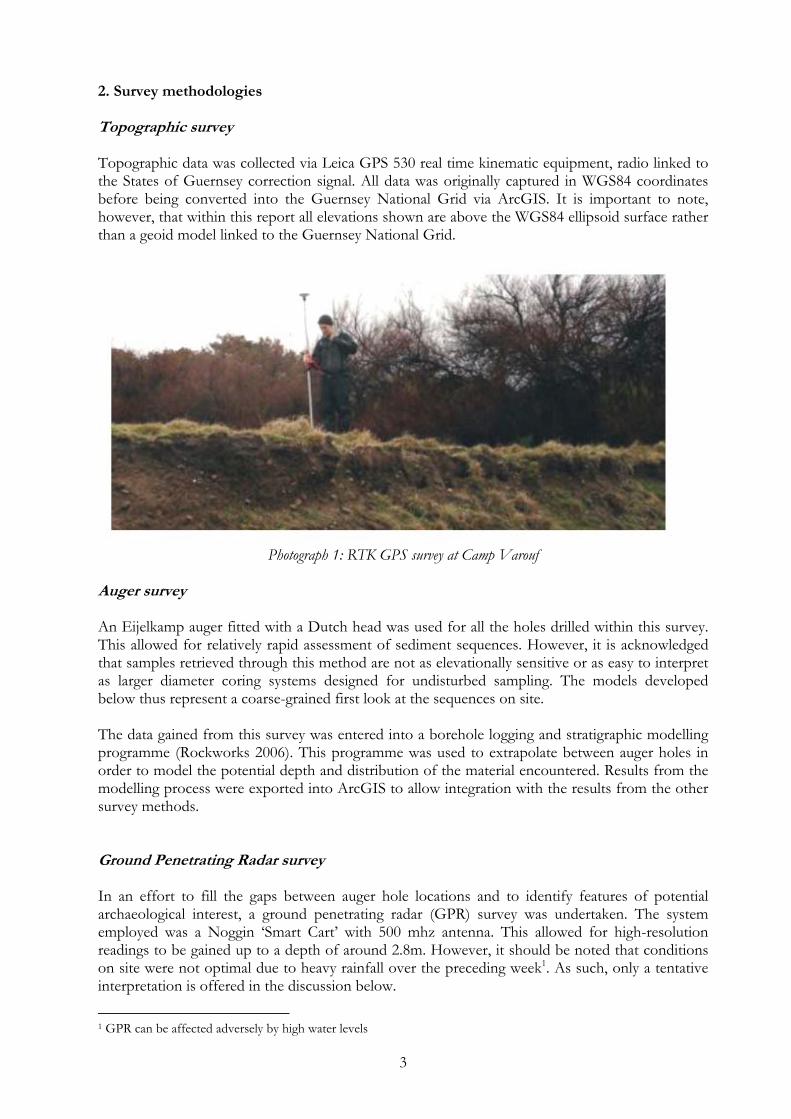
2. Survey methodologies Topographic survey Topographic data was collected via Leica GPS 530 real time kinematic equipment, radio linked to the States of Guernsey correction signal. All data was originally captured in WGS84 coordinates before being converted into the Guernsey National Grid via ArcGIS. It is important to note, however, that within this report all elevations shown are above the WGS84 ellipsoid surface rather than a geoid model linked to the Guernsey National Grid.
Photograph 1: RTK GPS survey at Camp Varouf
Auger survey An Eijelkamp auger fitted with a Dutch head was used for all the holes drilled within this survey. This allowed for relatively rapid assessment of sediment sequences. However, it is acknowledged that samples retrieved through this method are not as elevationally sensitive or as easy to interpret as larger diameter coring systems designed for undisturbed sampling. The models developed below thus represent a coarse-grained first look at the sequences on site. The data gained from this survey was entered into a borehole logging and stratigraphic modelling programme (Rockworks 2006). This programme was used to extrapolate between auger holes in order to model the potential depth and distribution of the material encountered. Results from the modelling process were exported into ArcGIS to allow integration with the results from the other survey methods. Ground Penetrating Radar survey In an effort to fill the gaps between auger hole locations and to identify features of potential archaeological interest, a ground penetrating radar (GPR) survey was undertaken. The system employed was a Noggin ‘Smart Cart’ with 500 mhz antenna. This allowed for high-resolution readings to be gained up to a depth of around 2.8m. However, it should be noted that conditions on site were not optimal due to heavy rainfall over the preceding week1. As such, only a tentative interpretation is offered in the discussion below.
1 GPR can be affected adversely by high water levels
4
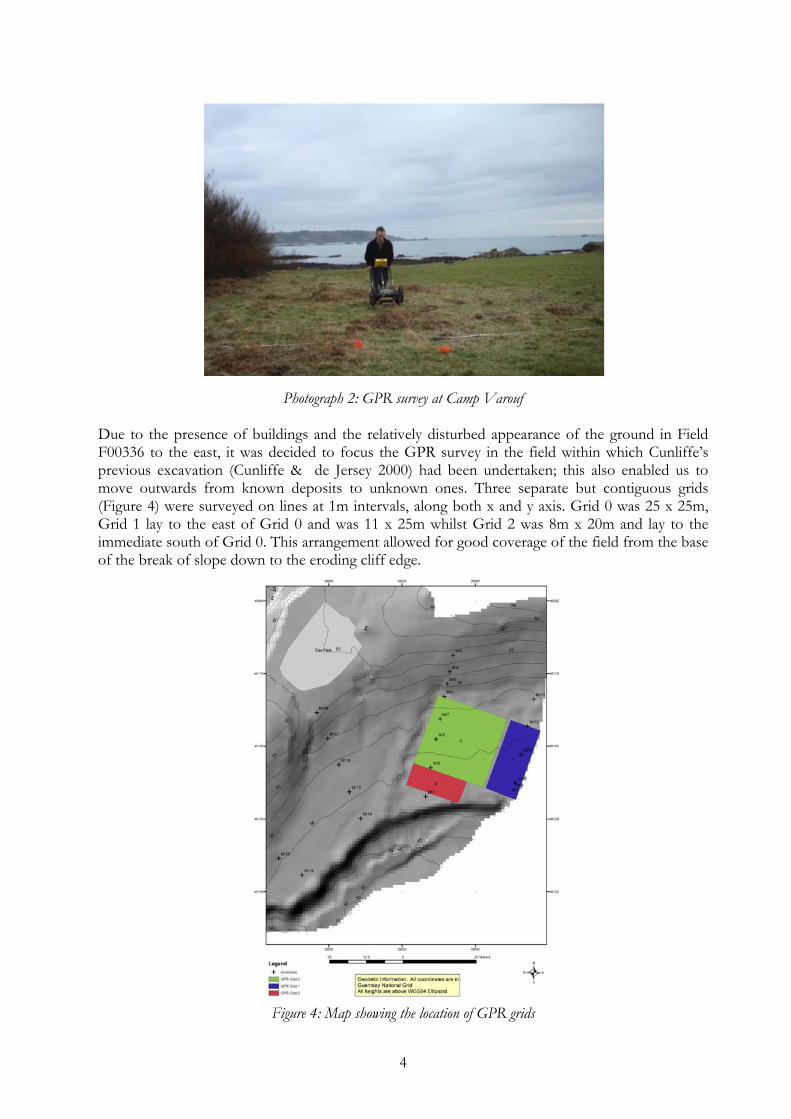
Photograph 2: GPR survey at Camp Varouf Due to the presence of buildings and the relatively disturbed appearance of the ground in Field F00336 to the east, it was decided to focus the GPR survey in the field within which Cunliffe’s previous excavation (Cunliffe & de Jersey 2000) had been undertaken; this also enabled us to move outwards from known deposits to unknown ones. Three separate but contiguous grids (Figure 4) were surveyed on lines at 1m intervals, along both x and y axis. Grid 0 was 25 x 25m, Grid 1 lay to the east of Grid 0 and was 11 x 25m whilst Grid 2 was 8m x 20m and lay to the immediate south of Grid 0. This arrangement allowed for good coverage of the field from the base of the break of slope down to the eroding cliff edge.
Figure 4: Map showing the location of GPR grids
5
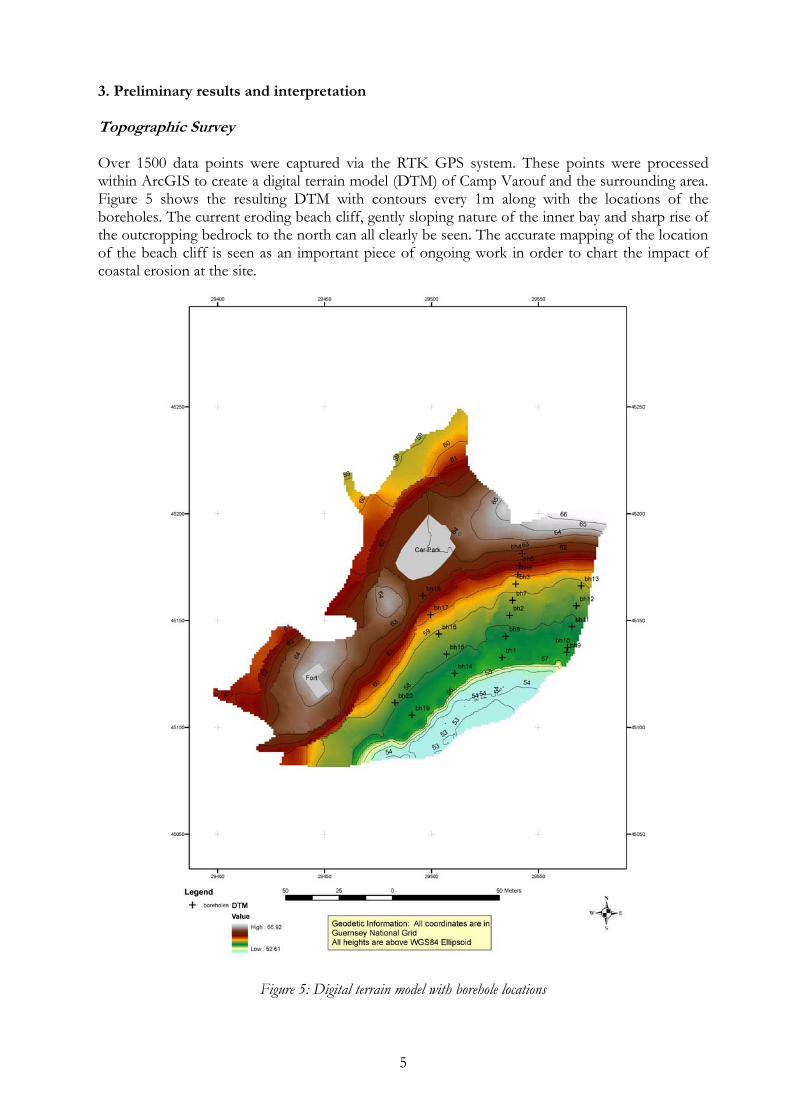
3. Preliminary results and interpretation Topographic Survey Over 1500 data points were captured via the RTK GPS system. These points were processed within ArcGIS to create a digital terrain model (DTM) of Camp Varouf and the surrounding area. Figure 5 shows the resulting DTM with contours every 1m along with the locations of the boreholes. The current eroding beach cliff, gently sloping nature of the inner bay and sharp rise of the outcropping bedrock to the north can all clearly be seen. The accurate mapping of the location of the beach cliff is seen as an important piece of ongoing work in order to chart the impact of coastal erosion at the site.
Figure 5: Digital terrain model with borehole locations
6
Auger Survey Twenty hand-auger boreholes (shown as crosses in Figure 5) were drilled along four transects providing broad coverage across the survey area. Each transect was sited specifically to capture any change in deposits between the top of the slope and the eroding beach cliff edge. Broadly, the results of this survey confirm the sequence established for the site by Renouf and Urry (in Cunliffe and de Jersey 2000). Within this schema the stratigraphic sequence is as follows:
1. Bedrock 2. Head 3. Loess 4. Redeposited loess 5. Cultivation Soil 6. Modern Turf
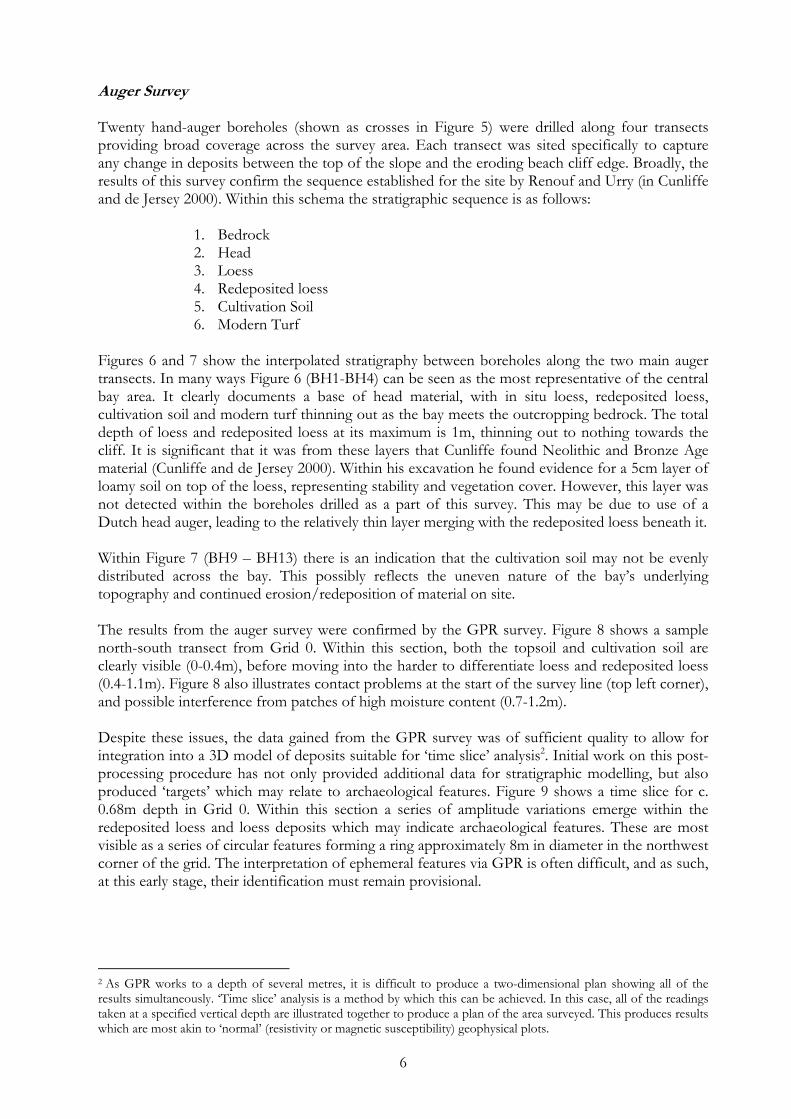
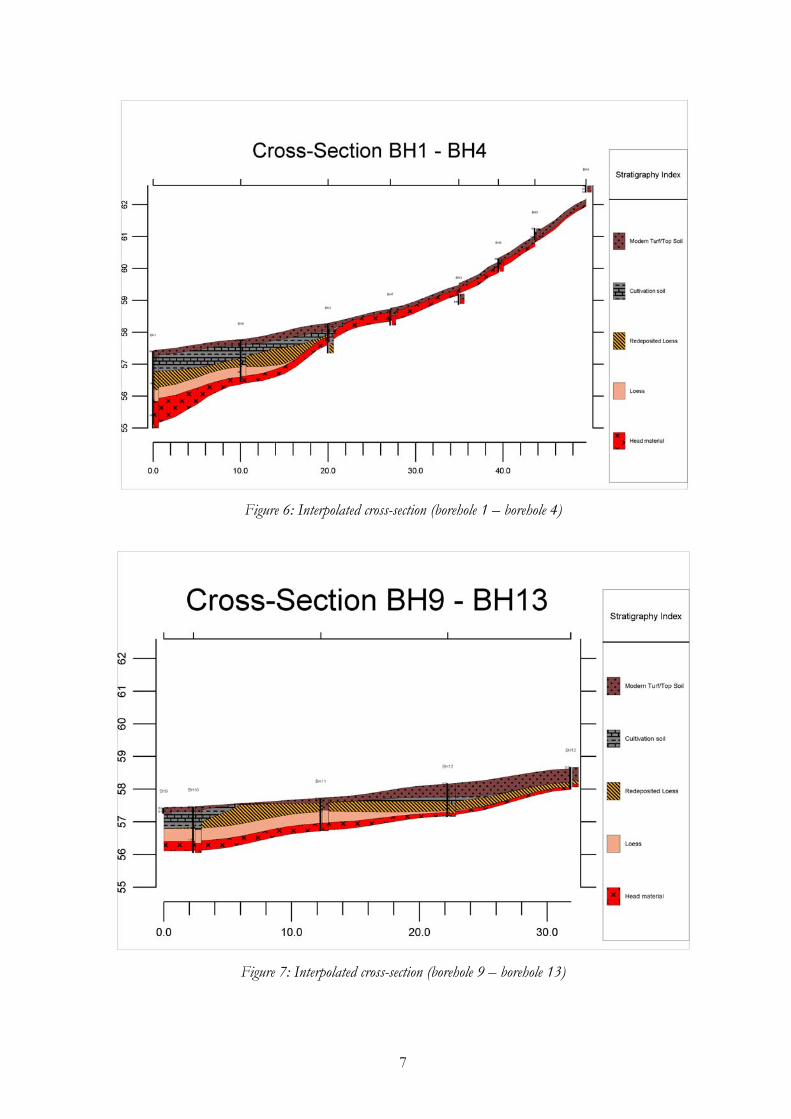
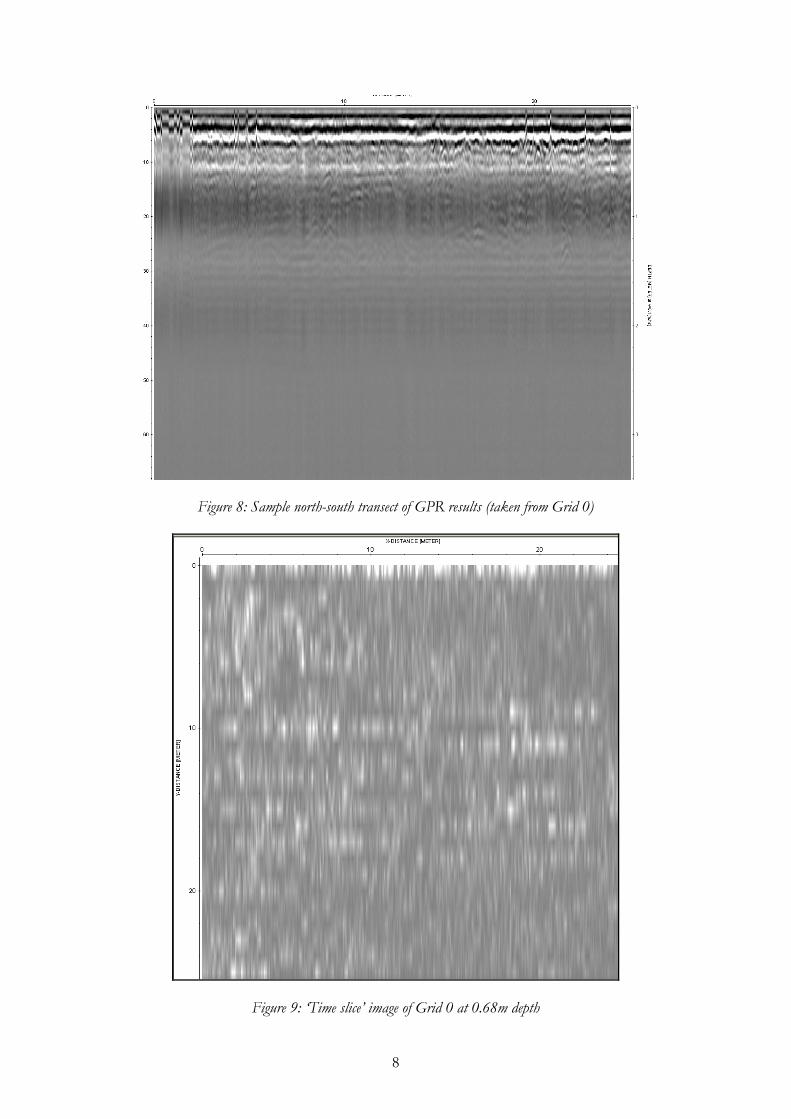
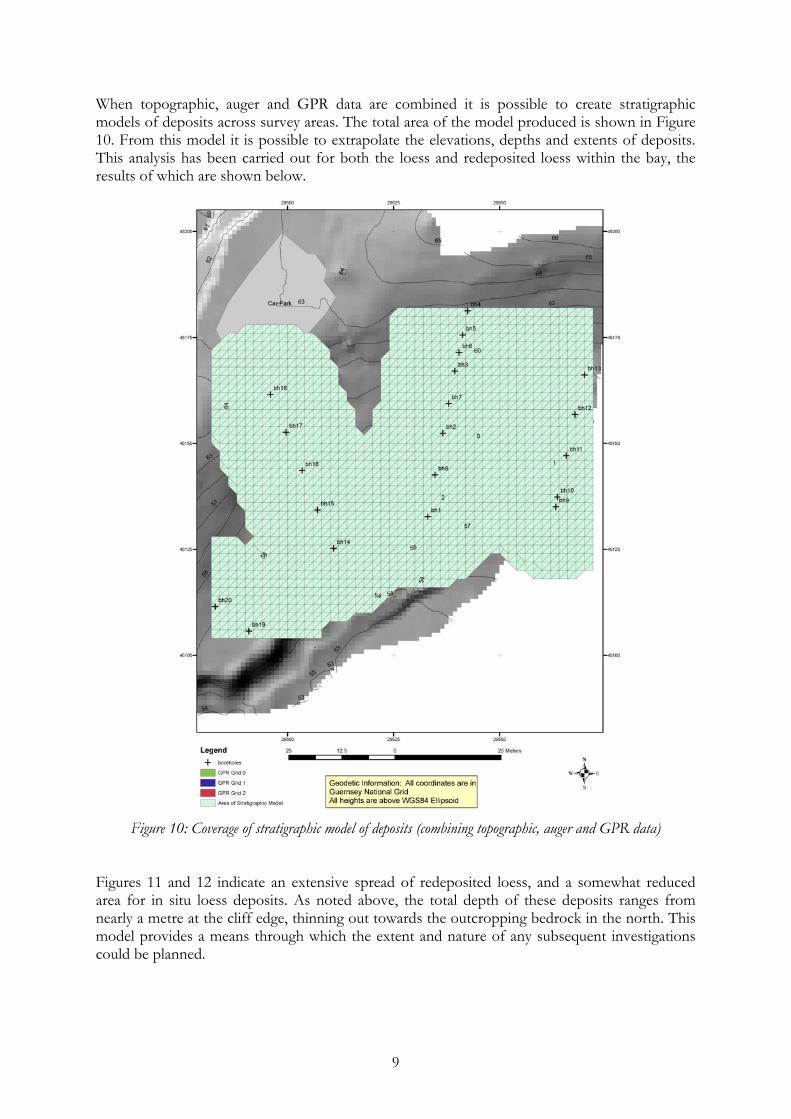
Figures 6 and 7 show the interpolated stratigraphy between boreholes along the two main auger transects. In many ways Figure 6 (BH1-BH4) can be seen as the most representative of the central bay area. It clearly documents a base of head material, with in situ loess, redeposited loess, cultivation soil and modern turf thinning out as the bay meets the outcropping bedrock. The total depth of loess and redeposited loess at its maximum is 1m, thinning out to nothing towards the cliff. It is significant that it was from these layers that Cunliffe found Neolithic and Bronze Age material (Cunliffe and de Jersey 2000). Within his excavation he found evidence for a 5cm layer of loamy soil on top of the loess, representing stability and vegetation cover. However, this layer was not detected within the boreholes drilled as a part of this survey. This may be due to use of a Dutch head auger, leading to the relatively thin layer merging with the redeposited loess beneath it. Within Figure 7 (BH9 – BH13) there is an indication that the cultivation soil may not be evenly distributed across the bay. This possibly reflects the uneven nature of the bay’s underlying topography and continued erosion/redeposition of material on site. The results from the auger survey were confirmed by the GPR survey. Figure 8 shows a sample north-south transect from Grid 0. Within this section, both the topsoil and cultivation soil are clearly visible (0-0.4m), before moving into the harder to differentiate loess and redeposited loess (0.4-1.1m). Figure 8 also illustrates contact problems at the start of the survey line (top left corner), and possible interference from patches of high moisture content (0.7-1.2m). Despite these issues, the data gained from the GPR survey was of sufficient quality to allow for integration into a 3D model of deposits suitable for ‘time slice’ analysis2. Initial work on this post-processing procedure has not only provided additional data for stratigraphic modelling, but also produced ‘targets’ which may relate to archaeological features. Figure 9 shows a time slice for c. 0.68m depth in Grid 0. Within this section a series of amplitude variations emerge within the redeposited loess and loess deposits which may indicate archaeological features. These are most visible as a series of circular features forming a ring approximately 8m in diameter in the northwest corner of the grid. The interpretation of ephemeral features via GPR is often difficult, and as such, at this early stage, their identification must remain provisional.
2 As GPR works to a depth of several metres, it is difficult to produce a two-dimensional plan showing all of the results simultaneously. ‘Time slice’ analysis is a method by which this can be achieved. In this case, all of the readings taken at a specified vertical depth are illustrated together to produce a plan of the area surveyed. This produces results which are most akin to ‘normal’ (resistivity or magnetic susceptibility) geophysical plots.
7
Figure 6: Interpolated cross-section (borehole 1 – borehole 4)
Figure 7: Interpolated cross-section (borehole 9 – borehole 13)
8
Figure 8: Sample north-south transect of GPR results (taken from Grid 0)
Figure 9: ‘Time slice’ image of Grid 0 at 0.68m depth
9
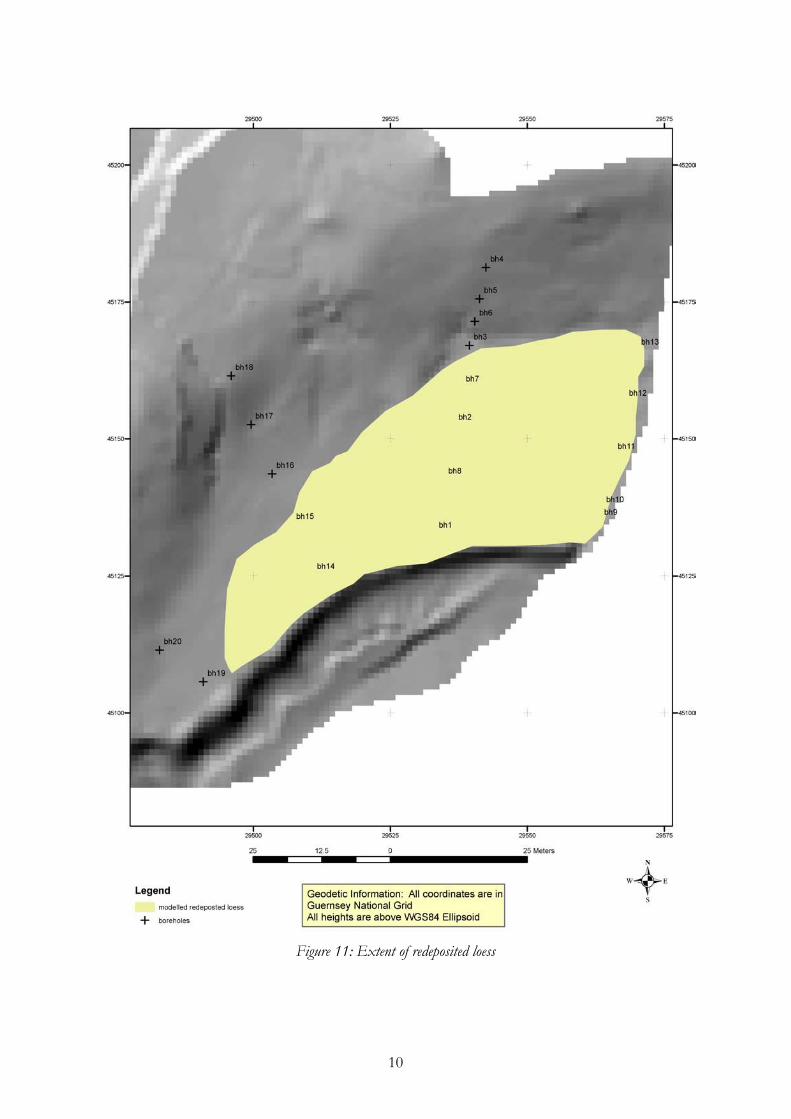
When topographic, auger and GPR data are combined it is possible to create stratigraphic models of deposits across survey areas. The total area of the model produced is shown in Figure 10. From this model it is possible to extrapolate the elevations, depths and extents of deposits. This analysis has been carried out for both the loess and redeposited loess within the bay, the results of which are shown below.
Figure 10: Coverage of stratigraphic model of deposits (combining topographic, auger and GPR data)
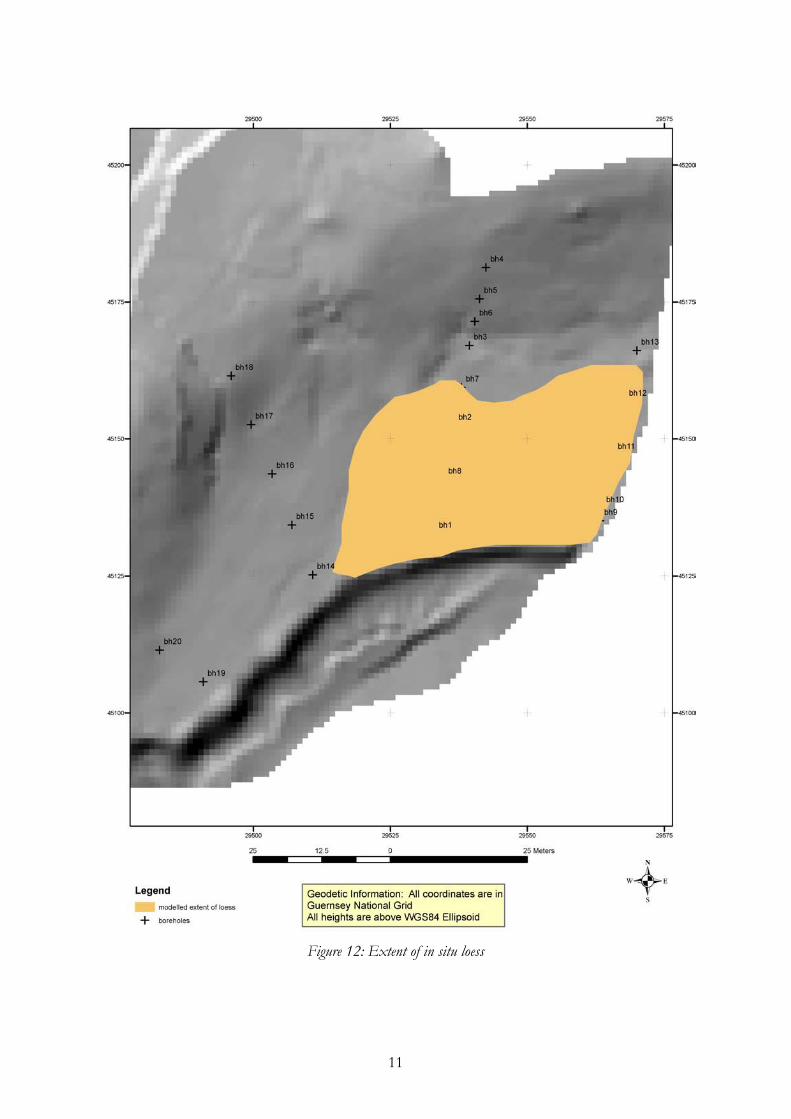
Figures 11 and 12 indicate an extensive spread of redeposited loess, and a somewhat reduced area for in situ loess deposits. As noted above, the total depth of these deposits ranges from nearly a metre at the cliff edge, thinning out towards the outcropping bedrock in the north. This model provides a means through which the extent and nature of any subsequent investigations could be planned.
10
Figure 11: Extent of redeposited loess
11
Figure 12: Extent of in situ loess
12
4. Summary of results Through a combination of augur and GPR survey, it was possible to produce a three-dimensional model of the sub-surface deposits at Camp Varouf. The most significant archaeological outcome of this modelling process was the definition of the full extent of the loess and redeposited loess layers (which have previously produced significant quantities of archaeological material) surviving within the area. These were shown to extend across an area of approximately 100 x 40m, immediately to the north of the cliff face. In addition, through ‘time slice’ analysis of the GPR results, it was also possible to identify a number of potential archaeological features (at a depth of 0.50-1.00m below the surface). At this stage, due to the inherent difficulties of interpreting plots such as these, it is difficult to say anything more definite. However, it does indicate that the assemblages of Neolithic and EBA material previously recovered may well be associated with cut features (as Cunliffe’s excavation also suggested). 5. Possible areas for future research • Excavation in order to investigate further the loess/redeposited loess deposits; to gain
access to the soils for scientific analysis (see below); and to establish whether there are any archaeological features on the site associated with the material culture already recovered. The size and location of any archaeological excavation would of course need to be considered at length, given the nature of the archaeological deposits and the site’s Ramsar status.
• Soil micromorphology in order to investigate the character of the buried soil(s), and to
ascertain what kind of human activities occurred on the site. • Off-site core sampling in order to establish the local environmental sequence for the
Neolithic and EBA, providing an important context for the site and the deposits which accrued there.
Acknowledgements We are very grateful to Philip de Jersey and Jason Monaghan at the Museums Service for their support, to Barry Cunliffe for his advice about the site, to Tanya Walls for her help at the beginning of the survey, to Mr T. Queripel and the States of Guernsey for allowing us access to the land, and to Janice Dockerill for her assistance in gaining planning permission. References Antoine, P., J. Catt, J.-P. Lautridou & J. Somme, 2003. The loess and coversands of northern France and southern Engalnd. Journal of Quaternary Science, 309-318. Cunliffe, B. & P. de Jersey, 2000. Rescue excavations on coastal sites on Guernsey and Herm, 1998 and 1999. Report and transactions of La Société Guernesiaise 24 V, 867-944. Renouf, J. 1985. Geological excursion guide 1: Jersey and Guernsey, Channel Islands. Geology Today May-June 1985.