Geo Book Cover13 - Menlo Park City School District … · 13. Probability CHAPTER 13 Probability...
50
Chapter 13
Transcript of Geo Book Cover13 - Menlo Park City School District … · 13. Probability CHAPTER 13 Probability...
Chapter 13

www.ck12.org Chapter 13. Probability
CHAPTER 13 ProbabilityChapter Outline
13.1 INTRODUCTION TO PROBABILITY
13.2 PERMUTATIONS AND COMBINATIONS
13.3 THE FUNDAMENTAL COUNTING PRINCIPLE
13.4 THE BINOMIAL THEOREM
13.5 VENN DIAGRAMS AND INDEPENDENCE
This chapter introduces the concepts of probability. We will begin looking at sample spaces (the number of ways inwhich multiple events can occur) using the fundamental counting principle, factorials, permutations, combinationsand binomial expansion. Next, we will learn how to calculate probability based on these sample spaces for singularand multiple events. Finally, we will exam the difference between independent, mutually exclusive and dependentevents.
845

13.1. Introduction to Probability www.ck12.org
13.1 Introduction to Probability
Objective
Develop an understanding of the probability of a particular outcome of an event and to calculate this probability.
Review Queue
1. Simplify(
53
)(2x)5−3(−y)3.
2. Expand (m−n)4.
3. Find the term containing x5 in the expansion of (x−4)7.
Finding the Probability of an Event
Objective
Determine the probability of an event with a known sample space.
Guidance
The probability of a particular outcome of an event occurring is a measure of how likely the desired outcome is tooccur. In this concept we will calculate the probability of an event using the ratio of the number of ways the desiredoutcome can occur to the number of items in the sample space. The sample space is essentially a list of all thepossible outcomes. For example, when we roll a single die, the sample space is {1,2,3,4,5,6} because these areall the possible outcomes. So, the probability of rolling a 3 is 1
6 because there is one way to roll a 3 and there are6 elements in the sample space. We can write a rule for probability when all the outcomes in the sample space areequally likely:
P(event) =number of desirable outcomes
number of outcomes in the sample space
Example A
What is the probability of rolling a single die and obtaining a prime number?
Solution: In this example there are exactly 3 prime numbers on the die {2,3,5} and there are six elements in thesample space {1,2,3,4,5,6} so P(prime) = 3
6 = 12 .
Example B
What is the probability of rolling a four and a three when two dice are rolled? How about a sum of six when twodice are rolled? What is the most likely sum to roll?
Solution: In this case it is useful to make a diagram of the sample space when two dice are rolled.
846

www.ck12.org Chapter 13. Probability
1,1 2,1 3,1 4,1 5,1 6,1
1,2 2,2 3,2 4,2 5,2 6,2
1,3 2,3 3,3 4,3 5,3 6,3
1,4 2,4 3,4 4,4 5,4 6,4
1,5 2,5 3,5 4,5 5,5 6,5
1,6 2,6 3,6 4,6 5,6 6,6
From this diagram we can see that there are 36 possible outcomes when two dice are rolled.
• To answer the first part of the question, we can observe in the table that there are two ways (shown in red) thatcan we roll a 4 and a 3 so the probability of rolling a 4 and a 3 is 2
36 = 118 .
• For the second part, there are 5 ways (shown in blue) that a sum of six can be rolled. Therefore the probabilityof rolling a sum of six is 6
36 = 16 .
More Guidance
The examples above are more accurately described as theoretical probabilities because the theory is that if all theoutcomes have an equal likelihood of occurring then the probability is the ratio described about. Does this meanhowever that when we flip a coin four times we will get 2 heads and 2 tails? Theoretically, this is the mostlikely outcome, but it is possible that in an experiment we get very different results. When we use the results ofan experiment to determine probabilities they are referred to as experimental probabilities. Each flip of the coinComplete the table below to investigate the connection between theoretical and experimental probabilities.
TABLE 13.1:
Number of flips ofa coin
Number of Heads Number of Tails Probability of flip-ping a Head
Probability of flip-ping a Tail
510501001000∗
Theoretical 12
12
∗ You may wish to use a probability simulator to investigate how many heads and tails are achieved with 1000 flipsor combine your results for the 100 flips with 9 other classmates.
Is the experimental probability the same as the theoretical probability? What do you notice as the number of flipsincreases?
Example C
In a case study of an experimental drug, there were 80 participants. Of the 80 participants, 65 of them experiencedno significant side effects from the treatment. What is the probability of a person taking the drug to experiencesignificant side effects? How accurate do you think this probability is? Justify your answer.
Solution: If 65 of the 80 participants did not experience significant side effects, then 15 of them did. So thelikelihood of someone in the future experiencing a significant side effect to the drug is 15
80 = 316 . This is experimental
probability and as we learned in the investigation, the accuracy of this type of probability will increase as the numberof trials in the study increases. Also, as individuals and their general health vary, so will the likelihood of a particular
847

13.1. Introduction to Probability www.ck12.org
person to experience side effects from a drug vary.
Guided Practice
1. What is the probability of selecting a red chip from a bag containing 10 red chips, 12 blue chips and 15 whitechips?
2. What is the probability of rolling doubles when two dice are rolled?
3. Over the course of a month, Sally and Stan recorded how many times their cell phones dropped a call. During thistime Sally made 55 phone calls and 4 of them were dropped while Stan made 36 calls and 3 were dropped. Whatis the probability that Sally’s cell phone drops a call? How about Stan’s? Who appears to have to more reliableservice?
Answers
1. P(red) = 1010+12+15 = 10
37 .
2. There are six ways to roll doubles (1,1),(2,2), etc (refer back to the diagram in Example B). So P(doubles) =636 = 1
6 .
3. Sally, P(dropped call) = 455 ≈ 0.0727; Stan, P(dropped call) = 3
36 = 112 ≈ 0.0833; Sally appears to have the more
reliable service.
Vocabulary
ProbabilityThe measurement of the likelihood of the desired outcome of an event.
Sample SpaceThe set of all the possible outcomes of an event
Theoretical ProbabilityThe ratio of the number of ways a desired outcome can be achieved to the number of outcomes in the samplespace.
Experimental ProbabilityThe ratio of the number of ways a desired outcome can be achieved to the number of outcomes in the samplespace determined by an experiment with multiple trials.
TrialEach flip of a coin, roll of the dice or other event which results in one of a set number of possible results.
Problem Set
Determine the following probabilities.
In a standard deck of cards there are 4 suits (two black suits: spades and clubs, and two red suits: hearts anddiamonds) and in each suit there are cards numbered 2 through 10, a jack, a queen, a king and an ace. Use thisinformation to answer questions 1-5.
1. What is the probability of randomly drawing a queen?2. What is the probability of randomly drawing a black card?3. What is the probability of randomly drawing a face card (jack, queen or king)?4. What is the probability of randomly drawing a red five?5. What is the probability of drawing an even numbered card?
848
www.ck12.org Chapter 13. Probability
Use the table of outcomes for rolling two fair dice (Example B) to answer questions 6-10.
6. What is the probability of rolling a sum greater than 8?7. What is the probability of rolling doubles?8. What is the probability of rolling two prime numbers?9. What is the probability of rolling a sum that is prime?
10. What is the probability of rolling an even sum?
In a bag of goodies at a party there are 8 gum balls, 5 gobstoppers and 10 fireball candies. When children win aparty game they get to reach in the bag and pull out a prize. All three candies are spherical and the same size andthus indistinguishable to the touch ensuring a random selection.
11. What is the probability of selecting a gobstopper?12. What is the probability of selecting a fireball?13. You are the third person to select a candy from the bag and the first two party goers selected a gum ball and a
gobstopper, respectively. What is the probability that you will get a gumball?
Calculating Probabilities of Combined Events
Objective
Calculate the probability of events which require the using of permutations or combinations to determine the numberof elements in the sample space and the number of desired outcomes in the sample space.
Guidance
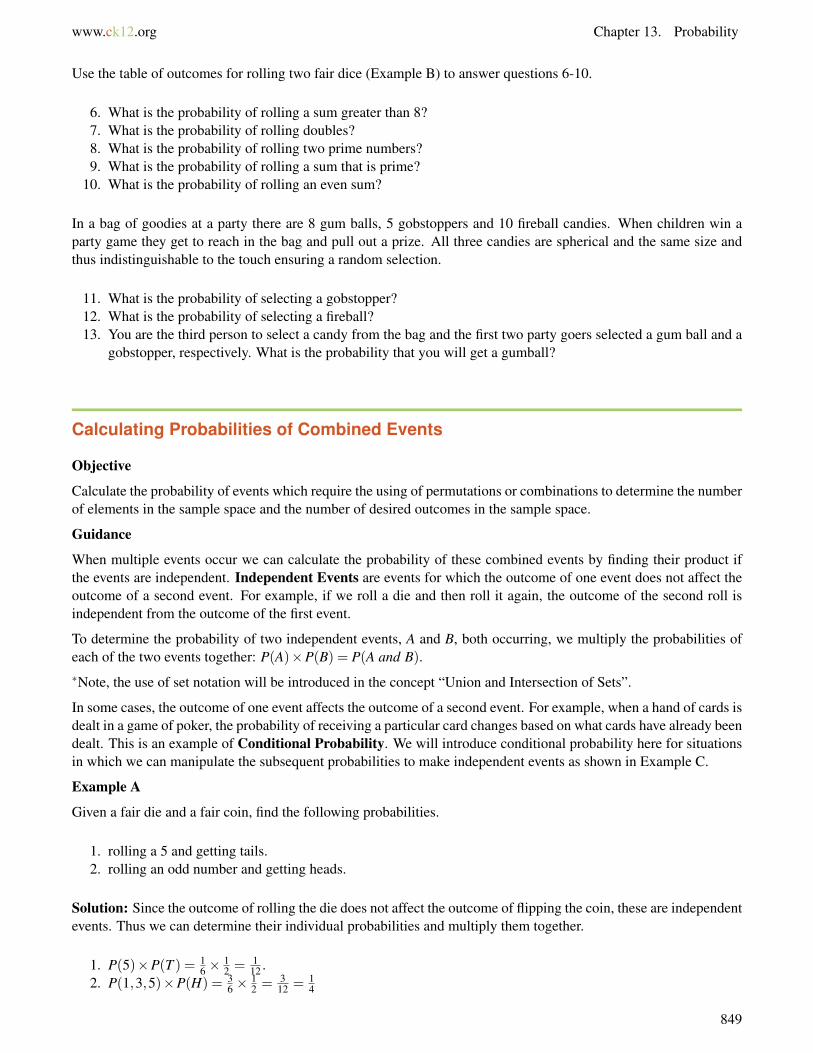
When multiple events occur we can calculate the probability of these combined events by finding their product ifthe events are independent. Independent Events are events for which the outcome of one event does not affect theoutcome of a second event. For example, if we roll a die and then roll it again, the outcome of the second roll isindependent from the outcome of the first event.
To determine the probability of two independent events, A and B, both occurring, we multiply the probabilities ofeach of the two events together: P(A)×P(B) = P(A and B).∗Note, the use of set notation will be introduced in the concept “Union and Intersection of Sets”.
In some cases, the outcome of one event affects the outcome of a second event. For example, when a hand of cards isdealt in a game of poker, the probability of receiving a particular card changes based on what cards have already beendealt. This is an example of Conditional Probability. We will introduce conditional probability here for situationsin which we can manipulate the subsequent probabilities to make independent events as shown in Example C.
Example A
Given a fair die and a fair coin, find the following probabilities.
1. rolling a 5 and getting tails.2. rolling an odd number and getting heads.
Solution: Since the outcome of rolling the die does not affect the outcome of flipping the coin, these are independentevents. Thus we can determine their individual probabilities and multiply them together.
1. P(5)×P(T ) = 16 ×
12 = 1
12 .2. P(1,3,5)×P(H) = 3
6 ×12 = 3
12 = 14
849

13.1. Introduction to Probability www.ck12.org
Example B
What is the probability of rolling doubles twice in a row? Three times in a row?
Solution: Each of these rolls are independent events. It is human nature to think that just because we have rolleddoubles once or twice already that we are unlikely to roll them another time. It is true that that probability of rollingdoubles three times in a row is smaller than rolling doubles once but this is not because the probability changes foreach roll. Let’s look at why this occurs:
P(doubles) = 636 = 1
6 , since there are six ways to roll doubles.
P(doubles twice) = 16 ×
16 = 1
36
P(doubles three times) = 16 ×
16 ×
16 = 1
216
Example C
What is the probability that you draw an ace from a deck of cards three times if each card is replaced before the nextcard is drawn? What if each card is not replaced?
Solution: There are 4 aces in a deck of cards, so there is a 452 = 1
13 chance of drawing an ace each time a card isselected. For the first part of the question which requires each card chosen to be replaced, the probability of selectingan ace does not chance so the events are independent of one another.
P(three aces, with replacement) =( 1
13
)3= 1
2197 .
The second part of the question does not require replacement. Now the events are not strictly independent. Wecan, however, determine the probability of an independent event and use multiplication to find the probability of thecombined events. For the first selection, there are 4 aces in the 52 card deck. After an ace is selected, how manycards remain? Well, to determine the probability of selecting three aces, we must assume the first selected was anace so now there are 3 aces remaining in a deck of 51 cards. After the second ace is selected, there are 2 aces in adeck of 50 cards. Now we can find the product of these probabilities.
P(three aces, without replacement) = 452 ×
351 ×
250 = 1
13 ×1
17 ×125 = 1
5525 .
Notice that the probability of selecting an ace diminishes with each selection in this situation because the number ofaces in the deck is being reduced.
Guided Practice
Determine the following probabilities.
1. Rolling snake eyes (double ones) and then rolling a sum of seven on a pair of dice.
2. Turning over a face card (jack, queen or king) followed by an ace from a full, shuffled deck of cards.
3. Drawing a hand of five cards which contains exactly 2 jacks, from a full, shuffled deck of cards.
4. Randomly selecting a pair of black socks followed by a pair of navy blue socks and then a pair of white socksfrom a drawer containing 5 black pairs, 4 navy blue pairs and 8 white pairs if each selection is replaced before thenext pair is chosen. What if each pair is not replaced?
Answers
1. P(snake eyes)×P(seven) = 136 ×
16 = 1
216 .
2. P(jack, queen, king)×P(ace) = 1252 ×
451 = 4
221
3. P(jack)×P(jack)×P(non jack)×P(non jack)×P(non jack) = 452 ×
351 ×
4850 ×
4749 ×
4648 = 1081
270725 ≈ 0.00399298
We aren’t quite finished, however, because what we have determined here is the probability that the first two cardsare the jacks and the last three are the non jacks. These cards could have been dealt in any order so we need todetermine the number of permutations of these cards and multiply by that value. Keep in mind that the jacks are“non distinguishable” and the non jacks are “non distinguishable”. The permutations are: 5!
2!3! = 10. This could also
850

www.ck12.org Chapter 13. Probability
be described as the number of combinations of selecting two jacks from a set of five cards: 5C2 = 5!2!(5−2)! = 10.
These are just two ways to find the same result. Now that we have the number of combinations or arrangements, wecan multiple our probability by this value:
1081270725 ×10≈ 0.0399298181.
4. For the first part of the question, the total number of socks in the drawer remains the same for each selection,17. So, P(black, then blue, then white) = 5
17 ×4
17 ×817 = 160
4913 ≈ 0.032567. Now, if we do not replace the socks, thenumber of socks decreases with each sock selected: P(black, then blue, then white) = 5
17 ×4
16 ×8
15 = 1604080 = 2
51 ≈0.039216. This probability is slightly higher because removing one pair of black socks makes it more likely that wewill select a different color pair of socks for the next pair and so on.
Vocabulary
Independent EventsMultiple events for which the outcome of one event does not affect the outcome of a second or subsequentevent. The probability of multiple independent events occurring is the product of the probabilities of theindividual events.
Conditional EventsEvents for which the outcome of one event is influenced by the outcome of a previous event. In this concept,we can manipulate the probabilities of the subsequent events to reflect the desired outcome of previous eventsand thus create pseudo-independent events.
Problem Set
Given a spinner as shown in the illustration below, two fair six sided dice and a standard deck of 52 playing cards,calculate the probability of each compound event below.
1. Spin a 4 and roll doubles.2. Spin an odd number and roll an odd sum.3. Draw four red cards in a row without replacement.4. Draw three face cards (jack, queen, king) without replacement.5. Rolling a sum of eight and spinning a 2.6. Spin a three, three times in a row.7. Roll an even sum and spin a prime number.8. Draw a five card hand containing exactly 3 red and 2 black cards.9. Draw a five card flush (a hand in which all cards are the same suit).
10. Draw a hand of five cards containing exactly two hearts.11. Draw a hand of three cards that contains at least one spade.12. Roll a sum of 7 or 11 and draw three cards in which at least one is a face card.
851

13.1. Introduction to Probability www.ck12.org
Tree Diagrams and Probability Distributions
Objective
Use Tree Diagrams, combinations or permutations to determine the probabilities of multiple events and probabilitydistributions.
Guidance
Sometimes it is useful to create a tree diagram to illustrate the possible outcomes of multiple events and theirindividual probabilities, calculate the probabilities of the combined events and the sample space. In other cases, wemight use combinations or permutations to create a Probability Distribution table. A Probability Distribution is atable which includes all possible outcomes (sample space) and their respective probabilities.
Example A
A game of chance involves flipping a coin and selecting a chip from one of two urns. If the coin toss results inheads, then you select from urn A which contains 8 yellow chips and 5 green chips. If the coin toss results in tails,then you select from urn B which contains 6 yellow chips and 6 green chips. Use this information to create a treediagram illustrating the possible outcomes and their probabilities and then determine the probability of selecting ayellow chip.
Solution: First, we need to make a tree diagram. The first branches of the diagram show the coin toss results andthe second sets of branches show the chip selection results. Notice that each set of branches in the tree diagram hasprobabilities which sum to 1. This happens because one of the outcomes must occur. In other words, you eitherselect a yellow or a green chip (there is no other outcome in the sample space) so the sum of the probabilities willbe 1. These types of events are called Complimentary Events.
By multiplying “across” the branches, we can determine the probabilities of the combined events. Now, look at thesum of the probabilities on the far right: 4
13 +5
26 +14 +
14 = 1. The entire sample space is shown here so the sum of
the probabilities of all the possible outcomes should be 1. This is an excellent way to check for accuracy in your treediagram calculations.
Now, to answer the question: What is the probability of selecting a yellow chip? Looking at the diagram, there aretwo ways to select a yellow chip. One, we could toss the coin and get heads and then select a yellow chip from urn Aand this probability is 4
13 . Two, we could toss the coin and get tails and then select a yellow chip and this probabilityis 1
4 . We can add the probabilities of these two “paths” to the same end result and get 413 +
14 = 29
52 ≈ 0.5577.
Example B
852

www.ck12.org Chapter 13. Probability
In a box of 20 candies, there are 8 which contain nuts. If 5 pieces are randomly selected and consumed, create aprobability distribution table to show the probability of selecting 0, 1, 2, 3, 4, or 5 candies which contain nuts in thesample.
Solution: First, let’s create a formula for determining the probability of each of the outcomes. We can usecombinations to help us do this. First, how many ways are there to select 5 pieces of candy from a box of 20
pieces? This is a combination, so 20C5 or(
205
). This value will be the total number of possible outcomes and thus
the denominator of our probability ratio. Now, how many ways are there to select 0 of the 8 candies with nut and 5of the 12 candies without nuts? Again, we have combinations and their product can be found for the numerator of
our probability ratio:(
80
)(125
). Now we can put it all together and find the probability of selecting 0 candies with
nuts:
(80
)(125
)(
205
) = 33646 ≈ 0.05108.
Similarly, for 1 candy containing nuts:
(81
)(124
)(
205
) = 165646 ≈ 0.25542.
For 2 candies with nuts we get:
(82
)(123
)(
205
) = 385969 ≈ 0.39732, and so on.
The table to the right shows all of the final probabilities for each outcome in the sample space. This is called aProbability Distribution Table.
What happens if we add up all of the probabilities in this table?
0.05108+0.25542+0.39732+0.23839+0.05418+0.00361 = 1
This means that the probability of getting one of these outcomes is 100%. Also, this shows that our probabilitydistribution is correct because we have included all of the possible outcomes and the sum of their probabilities is 1.In other words, this illustrates that there are no other possible outcomes since there is a 100% chance of getting oneof these results.
TABLE 13.2:
Number of Candies Selected Containing Nuts Probability0 33
646 ≈ 0.051081 165
646 ≈ 0.255422 385
969 ≈ 0.397323 77
323 ≈ 0.238394 35
646 ≈ 0.054185 7
1938 ≈ 0.00361
Example C
Over time, Ronald has shown that in 2 of 5 attempts he makes a bulls eye with a bow and arrow. Create a probabilitydistribution table which shows the possible outcomes and the associated probabilities when Ronald shoots threearrows.
Solution: First, we will consider each bulls eye a success and each non bulls eye a failure. So, the probabilityof a success is 2
5 and the probability of a failure is 35 . The probability of zero successes is
(35
)3= 27
125 = 0.216.
853

13.1. Introduction to Probability www.ck12.org
Similarly, the probability of three successes is(2
5
)3= 8
125 = 0.064. With three shots, there are two other possibilitiesto consider. Ronald could also have one success and two failures or two successes and one failure. In thesecases, we must consider that any one or two of the shots could be successes so we will multiply by the number
of “combinations” that are possible. For example, if Ronald has one success, then there are(
31
)or 3 ways this
could occur: SFF, FSF or FFS. So we will multiple the combinations by the probability of one success and twofailures:
(31
)(25
)1 (35
)2= 54
125 = 0.432. For two successes and one failure we have(3
2
)(25
)2 (35
)1= 36
125 = 0.288.Now, make a probability distribution table:
TABLE 13.3:
Number of Bulls Eyes Probability0 0.2161 0.4322 0.2883 0.064
This is an example of a special type of probability called a Binomial Probability because its rule resembles theBinomial Theorem. In order for a problem to be a binomial probability it must consist of multiple independent trials,called Bernoulli Trials, in which there is either a success or a failure. In other words, P(success)+P(failure) = 1and the result of each trial is independent of the result of a previous trial.
If we let n = number of trials, p = probability of a success and r = number of successes, we can use the followingformula to determine the probability of any number of successes.
P(r successes) =(
nr
)(p)r(1− p)n−r.
Notice that this formula is exactly what we did to find the probability of Ronald shooting two bulls eyes:
For two bulls eyes, n = 3, p = 25 , and r = 2:
(32
)(25
)2 (1− 25
)3−2=
(32
)(25
)2 (35
)1= 36
125 = 0.288.
Guided Practice
1. Sarah either walks or rides the bus to school. When she walks she is more likely to be late to school than whenshe rides the bus. Complete the tree diagram and find the probability that Sarah is late for school.
854

www.ck12.org Chapter 13. Probability
2. In a case of 15 light bulbs there are 2 defective bulbs. Create a probability distribution which illustrates thepossible outcomes and their respective probabilities if we randomly select 3 bulbs from the box. Show that the sumof the probabilities is 1.
3. On any given workday, there is a 15% chance that Professor Calculus will cause an explosion in his laboratory.Use the Binomial Probability formula to determine the probability that Professor Calculus will cause less than threeexplosions in a five day work week.
Answers
1.
To find the probability that Sarah is late we need to add the probabilities of the two different ways she can be late.She can walk and be late or she can ride the bus and be late:
P(walk and late)+P(bus and late) =(2
3
)( 110
)+(1
3
)( 120
)= 1
12 ≈ 0.08333
2.
TABLE 13.4:
Number of defectiteve bulbs Probability
0
(20
)(133
)(
153
) = 0.628571
1
(21
)(132
)(
153
) = 0.342857
2
(22
)(131
)(
153
) = 0.028571
0.62857+0.342857+0.028571 = 0.999998
Since we rounded the individual probabilities, the sum may reflect this inaccuracy. For all intents and purposes, thisanswer is 1.
855
13.1. Introduction to Probability www.ck12.org
Note that it is not possible to select a sample containing 3 defective bulbs because there are only 2 defective bulbs inthe box.
3. Less than three explosions implies that Professor Calculus could cause 0, 1 or 2 explosions in the work week. Wecan add these individual probabilities to determine the probability. For the Binomial Probability, n = 5 (since thereare 5 days in the work week), p = 0.15 and r takes on the values 0, 1 and 2.
(50
)(0.15)0(0.85)5 +
(51
)(0.15)1(0.85)4 +
(52
)(0.15)2(0.85)3 = 0.443705+0.391505+0.138178 = 0.973388
Vocabulary
Probability DistributionA summary, usually a table, of the possible outcomes of an experiment or series of events and all thecorresponding probabilities.
Complimentary EventsA pair of events such that if one event does not occur the other one will. As a result, the sum of theirprobabilities must be equal to 1.
Problem Set
Jamie and Olivia are best friends and neighbors. As such they often eat dinner together at one of their houses. About30% of the time, they eat at Jamie’s house and her mother makes a non vegetarian meal 65% of the time. The rest ofthe time, they eat at Olivia’s house and her mother serves a vegetarian meal 55% of the time.
1. Make a tree diagram, including the appropriate probabilities to illustrate this scenario.2. What is the probability of going to Olivia’s house and eating a meal containing meat?3. What is the probability that the girls will eat a vegetarian dinner?
Tommy has 20 water balloons in bucket. There is a 18 chance of each balloon exploding on him before he even has a
chance to throw it. Use a Binomial Probability Distribution to answer the following questions.
4. What is the probability that Tommy throws eight without any breaking on him?5. What is the probability that exactly five of the eight balloons he attempts to throw explode on him?6. What is the probability that more than two of the eight explode on him?
A vaccine has a 92% success rate. The vaccine is given to 50 patients in a medical practice. Use a BinomialProbability Distribution to answer the following questions.
7. What is the probability that it works for all patients?8. What is the probability that is fails for exactly 9 patients?9. What is the probability that it fails for more than 1 patient?
Five cards are randomly selected from a deck of cards.
10. Create a probability distribution table for the number of “high” cards (jack, queen, king or ace) in a 5 cardhand chosen at random.
11. What is the probability of getting at least one high card?12. What is the probability of getting at least two?
856

www.ck12.org Chapter 13. Probability
Basic Geometric Probabilities
Objective
Determine the probabilities of events occurring based on Geometric properties.
Guidance
Sometimes we need to use our knowledge of geometry to determine the likelihood of an event occurring. We mayuse areas, volumes, angles, polygons or circles.
Example A
A game of pin-the-tale-on-the-donkey has a rectangular poster that is 2ft by 2ft. The area in which the tale should bepinned is shown as a circle with radius 1 inch. Assuming that the pinning of the tale is completely random and thatit will be pinned on the poster (or the player gets another try), find the probability of pinning the tale in the circle?
Solution: This probability can be found by dividing the area of the circle target by the area of the poster. We musthave the same units of measure for each area so we will convert the feet to inches.
12π
242 ≈ 0.005454 or about 0.5% chance.
Example B
In a game of chance, a pebble is dropped onto the board shown below. If the radius of each of blue circle is 1 cm,find the probability that the pebble will land in a blue circle.
Solution: The area of the square is 16 cm2. The area of each of the 16 circles is 12π = π. The probability of thepebble landing in a circle is the sum of the areas of the circles divided by the area of the square.
P(blue circle) = 16π
64 ≈ 0.785
Example C
What is the probability that a randomly thrown dart will land in a red area on the dart board shown? What is theprobability that exactly two of three shots will land in the red? The radius of the inner circle is 1 unit and the radiusof each annulus is 1 unit as well.
857

13.1. Introduction to Probability www.ck12.org
Solution: First we need to determine the probability of landing in the red. There are four rings of width 1 and theradius of the center circle is also 1 so the total radius is 5 units. The area of the whole target is thus 25π square units.Now, we need to find the areas of the two red rings and the red circular center. The center circle area is π squareunits. The outside ring area can be found by subtracting the area inside from the entire circle’s area. The insidecircle will have a radius of 4 units, the area of the outer ring is 25π−16π = 9π square units. This smaller red ring’sarea can be found similarly. The circle with this red ring on the outside has a radius of 3 and the circle inside has aradius of 2 so, 9π−4π = 5π square units. Finally, we can add them together to get the total red area and divide bythe area of the entire target. 9π+5π+π
25π= 15π
25π= 3
5 . So the probability of hitting the red area is 35 or 60%.
For the second part of the problem we will use a binomial probability. There are 3 trials, 2 successes and the
probability of a success is 0.6:(
32
)(0.6)2(0.4) = 0.432
Guided Practice
1. Consider the picture below. If a “circle” is randomly chosen, what is the probability that it will be:
a. red
b. yellow
c. blue or green
d. not orange
858
www.ck12.org Chapter 13. Probability
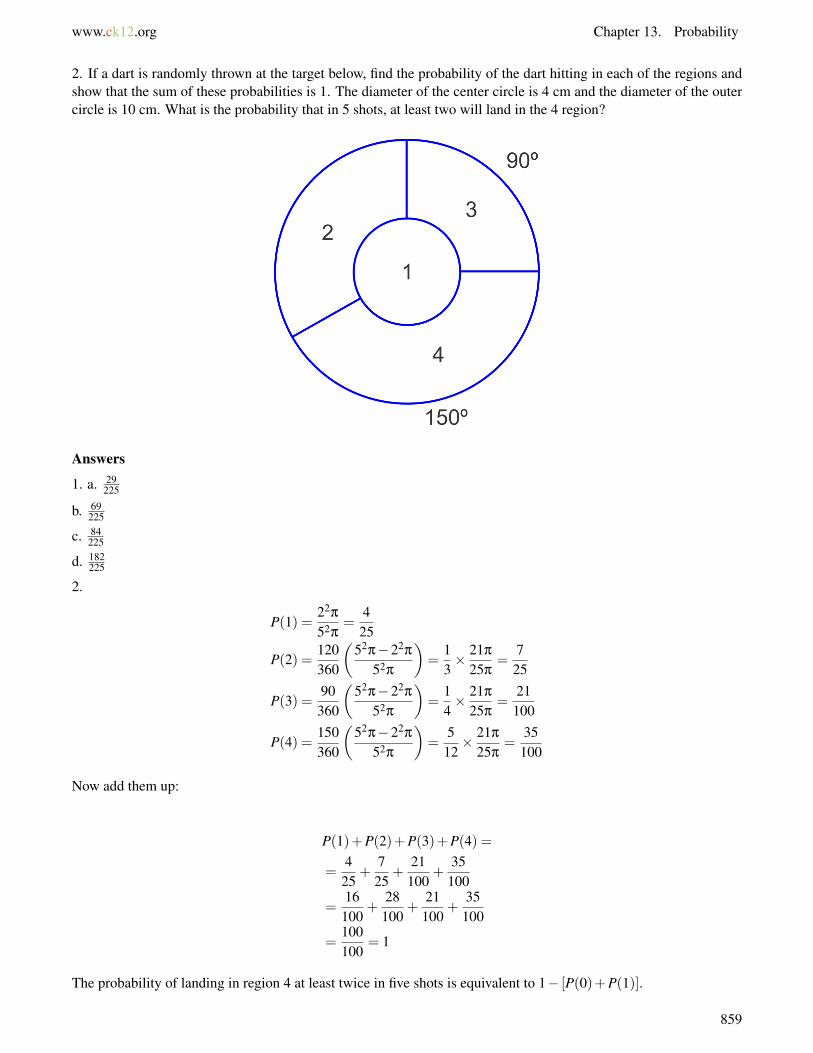
2. If a dart is randomly thrown at the target below, find the probability of the dart hitting in each of the regions andshow that the sum of these probabilities is 1. The diameter of the center circle is 4 cm and the diameter of the outercircle is 10 cm. What is the probability that in 5 shots, at least two will land in the 4 region?
Answers
1. a. 29225
b. 69225
c. 84225
d. 182225
2.
P(1) =22π
52π=
425
P(2) =120360
(52π−22π
52π
)=
13× 21π
25π=
725
P(3) =90360
(52π−22π
52π
)=
14× 21π
25π=
21100
P(4) =150360
(52π−22π
52π
)=
512× 21π
25π=
35100
Now add them up:
P(1)+P(2)+P(3)+P(4) =
=425
+7
25+
21100
+35100
=16100
+28100
+21100
+35
100
=100100
= 1
The probability of landing in region 4 at least twice in five shots is equivalent to 1− [P(0)+P(1)].
859
13.1. Introduction to Probability www.ck12.org
Use binomial probability to determine these probabilities:
1−
[(50
)(35100
)0( 65100
)5
+
(51
)(35
100
)1( 65100
)4
]= 1− (0.116029+0.062477)
≈ 0.821
Problem Set
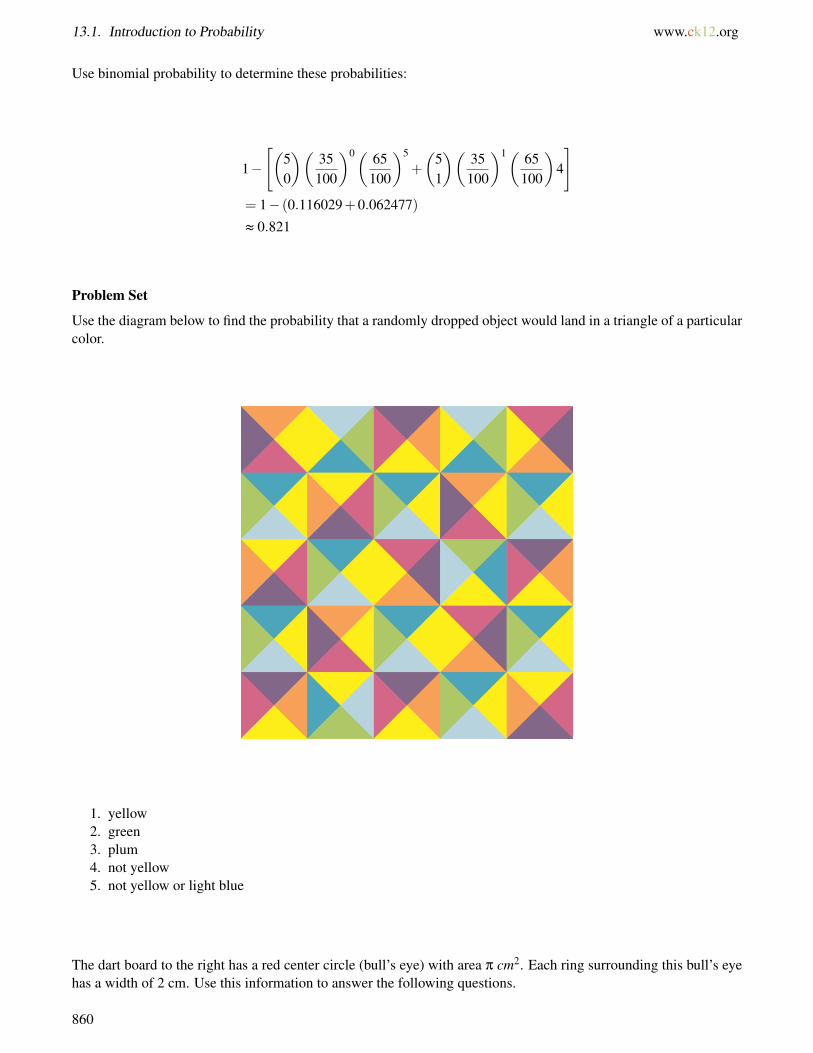
Use the diagram below to find the probability that a randomly dropped object would land in a triangle of a particularcolor.
1. yellow2. green3. plum4. not yellow5. not yellow or light blue
The dart board to the right has a red center circle (bull’s eye) with area π cm2. Each ring surrounding this bull’s eyehas a width of 2 cm. Use this information to answer the following questions.
860

www.ck12.org Chapter 13. Probability
6. Given a random throw of a dart, what is the probability that it will land in a white ring?7. What is the probability of a bull’s eye?8. What is the probability that in 10 throws, exactly 6 land in the black regions?9. What is the probability that in 10 throws, at least one will land in the bull’s eye?
10. How many darts must be thrown to have a 95% chance of making a bull’s eye?
861

13.2. Permutations and Combinations www.ck12.org
13.2 Permutations and Combinations
Objective
To define and use factorials to determine the numbers of permutations or combinations that can be made of multipleitems.
Review Queue
1. The summer reading requirement for an English course is to read one of 6 novels, one of 3 biographies and oneof 4 other nonfiction selections. How many different assignments might be completed?
2. How many six-digit identification numbers can be formed if digits may be repeated but none can start with zero?
3. How many ways can seven DVD’s be arranged on a shelf?
Define and Apply Permutations and Factorials
Objective
To define and use factorials to determine the number of permutations or arrangements of objects.
Guidance
The number of permutations of objects is the number of possible arrangements of the objects. Consider questionthree in the review queue: How many ways can seven DVD’s be arranged on a shelf? This is an example of apermutation. We used the Fundamental Counting Principle without repetition to determine the permutations ofDVD’s.
Example A
How many ways can 5 students sit in a row?
Solution: If we consider the students sitting in one of five seats, then we have 5 students to choose from for the firstseat, four remaining to choose from for the second seat and so on until all the seats are filled.
5×4×3×2×1 = 120 So there are 120 ways to seat the students.
More Guidance
The way we just wrote out 5× 4× 3× 2× 1 can also be expressed as a factorial. A factorial is the product of anumber with each number less than itself. We use the notation, 5!, which is read as “five factorial” to represent theexpression 5×4×3×2×1. It is important to note that 0!= 1!= 1. Students are often perplexed that both zero andone factorial are equal to one but think back to the context for illustration. If you want to arrange zero items, howmany ways can you do it? If you want to arrange one item, how many ways can you do it? There is only one way to“arrange” zero or one item.
To evaluate a factorial on the TI-83 or 84 graphing calculator, type in the number, then press MATH→NUM, 4!.Press ENTER to evaluate.
Example B
Evaluate 10!6!
Solution: We should expand the numerator and the denominator to see which common factors the numerator anddenominator that we can cancel out to simplify the expression.
862

www.ck12.org Chapter 13. Probability
10×9×8×7×6×5×4×3×2×16×5×4×3×2×1
=10×9×8×7×��6!
��6!= 10×9×8×7 = 5040
Example C
On a shelf there are 6 different math books, 4 different science books and 8 novels. How many ways can the booksbe arranged if the groupings are maintained (meaning all the math books are together, the science books are togetherand the novels are together).
Solution: There are 6 math books so if we think of filling 6 slots with the six books, then we start with 6 books forthe first slot, then 5, then 4, etc: 6×5×4×3×2×1 = 720 ways.
There are 4 science books so we can arrange them in 4×3×2×1 = 24 ways.
There are 8 novels so we can arrange them in 8×7×6×5×4×3×2×1 = 40,320 ways.
Now, if each type of book can be arranged in so many ways and there are three types of books which can be displayedin 3×2×1 = 6 ways, then there are:
720×24×40320×6 = 4,180,377,600 total ways to arrange the books.
Guided Practice
Evaluate the following expressions with factorials.
1. 12!9!
2. 4×8!3!5!
3. How many ways can nine children line up?
4. How many ways can 3 cookbooks, 5 textbooks, 7 novels and 4 nonfiction books be arranged on a shelf if thegroupings are maintained?
Answers
1. 12×11×10×��9!��9!
= 1320
2. 4×8×7×6×��5!3×2×1×��5!
= 4×8×7×�6�3×�2×1
= 224
3. 9!= 362,880
4. 3!×5!×7!×4!×4!= 2,090,188,800
Vocabulary
PermutationsThe number of ways items in a set can be arranged or ordered.
FactorialOperation in which a number is multiplied by each positive number less than itself.
Problem Set
Evaluate the following factorial expressions.
1. 5!2!3!
2. 10!2!7!
3. 4!8!9!
4. 5!10!12!
863

13.2. Permutations and Combinations www.ck12.org
5. How many ways can a baseball team manager arrange nine players in a lineup?6. How many ways can the letters in the word FACTOR be arranged?7. How many ways can 12 school buses line up?8. How many ways can eight girls sit together in a row?9. If the two of the eight girls in problem eight must sit together, how many ways can the 8 girls be arranged in
the row such that the two girls sit together?10. How many ways can seven diners sit around a circular table. (Hint: It is not 7!, consider how a circular seating
arrangement is different than a linear arrangement.)11. How many ways can three cookbooks, four novels and two nonfiction books be arranged on a shelf if the
groupings are maintained?12. How many ways can two teachers, four male students, five female students and one administrator be arranged
if the teachers must sit together, the male students must sit together and the female students must sit together?
Permutations of Subsets and Permutations with Repetition
Objective
To calculate the permutations of a subset of items and to calculate permutations of a set with indistinguishableobjects, i.e. two or more objects are identical.
Guidance
Sometimes we want to order a select subset of a group. For example, suppose we go to an ice cream shop thatoffers 15 flavors. If we want to layer 3 scoops of different flavors on an ice cream cone, how many arrangements arepossible? Here, the order matters so a chocolate, strawberry and vanilla cone is different than a strawberry, vanillaand chocolate cone. This is an example of permutations of a subset. We don’t need to know how many ways we canorder all 15 flavors, just three choices. You have actually solved problems like this already using the FundamentalCounting Principle. There are 15 choices for scoop one, 14 choices for scoop two and 13 choices for scoop 3, so15×14×13 = 2730.
We can use factorials to solve this as well. Consider the expression: 15×14×13×12!12! = 15!
(15−3)! =n!
(n−r)! , where nrepresents the total number of elements in the set and r represents the number of elements in the subset we areselecting. Mathematically, this can be written using the notation 15P3 or nPr. To summarize, if we wish to find thenumber of permutations of r elements selected from a larger set containing n elements, we can use the formula:nPr =
n!(n−r)! .
∗ Note that some textbooks use the notation Pnr to represent nPr.
We can evaluate this expression easily on the calculator as well. First, enter the value of n(15), then go to MATH→PRB,select 2: nPr. Now enter the value of r(3) to get the expression 15 nPr 3 on your screen. Press ENTER one moretime and the result is 2730.
Example A
How many ways can a President, Vice President, Secretary and Treasurer be selecting from a club with ten members?
Solution: In the selection process here, the order matters so we are calculating the number of permutations of asubset of 4 members of the 10 member club. So,
10P4 =10!
(10−4)!=
10×9×8×7×6!6!
= 10×9×8×7 = 5040.
Example B
Consider the word, VIRGINIA. How many unique ways can these letters be arranged?
864

www.ck12.org Chapter 13. Probability
Solution: There are eight letters which can be arranged 8! ways. However, some of these arrangements will not beunique because there are multiple I’s in the word VIRGINIA. For example, if we let the three I’s be different colors,then we can see that there are several indistinguishable ways the I’s can be arranged.
VIRGINIA, VIRGINIA, VIRGINIA, VIRGINIA, VIRGINIA, VIRGINIA
In fact, there are 3! or 6 ways that the three I’s can be arranged that are indistinguishable when the arrangement ofthe remaining letters is constant. To figure out the number of unique arrangements of the 8 letters with 3 that areindistinguishable we can find the permutations of the 8 letters and divide by the permutations of the indistinguishableitems.
8!3!
=8×7×6×5×4×3!
3!= 8×7×6×5×4 = 6720
Example C
Consider the word PEPPERS. How many unique arran gements can be made of these letters?
Solution: There are seven letters in total, three of which are P and two of which are E. We can expand upon whatwe did in the last example and divide by the number of ways each of these letters can be arranged.
7!3!2!
=7×6×5×4×3!
3!×2×1=
7×6×5× (2× �2)�2
= 7×6×5×2 = 420
More Guidance
We can generalize the rule used in Examples B and C as follows. In a set with n elements, in which n1,n2,n3, . . . areindistinguishable, we can find the number of unique permutations of the n elements using the formula:
n!n1!×n2!×n3!× . . .
Guided Practice
1. Find 10P6
2. On a team of 12 players, how many ways can the coach select players to receive on of each of the followingawards (one award per player): most valuable player, best sportsmanship, most improved player.
3. How many ways can 5 yellow, 4 red and 3 green balls be arranged in a row?
Answers
1. 10P6 =10!
(10−6)! =10×9×8×7×6×5×4!
4! = 151,200
2. 12P3 =12!
(12−3)! =12×11×10×9!
9! = 1,320
3. 12!5!×4!×3! =
12×11×10×9×8×7×6×5!4!×4!×3! = 12×11×10×9×(4×2)7×6
(4×3)×2×3×2 = 11×10×9×4×7 = 27,720
Problem Set
Evaluate the following expressions.
1. 8P5
865

13.2. Permutations and Combinations www.ck12.org
2. 11P83. Evaluate and explain the results of each of the following: 5P5, 5P0, 5P14. Sarah needs to go to five different stores. How many ways can she go to two of them before lunch?5. In a race there are eleven competitors in a particular age group. How many possible arrangements are there
for the top five finishers in this age group?6. How many ways can eight distinct raffle prizes be awarded to fifteen ticket holders.7. In a class of 24 students, there are six groups of four students. How many ways can a teacher select one group
for each of three classroom maintenance responsibilities?8. At a birthday party there are 6 unique prizes to be given randomly to the 6 quests such that no one guest
receives more than one prize. How many ways can this be done?9. How many unique ways can the letters in MISSISSIPPI be arranged?
10. How many ways can two Geometry books, eight Algebra books and three Pre-Calculus books be arranged ona shelf if all the books of each respective subject are identical.
11. At a math department luncheon, the department chair has three $20 gift certificates to the local coffee shop,five $25 gift certificates to a local bookstore and two state of the art calculators to give as prizes amongst the10 department members. If each teacher receives one prize, how many unique distributions of prizes can bemade?
Define and Apply Combinations
Objective
To define and calculate combinations of objects and to recognize the difference between a combination and apermutation.
Guidance
Combinations of a subset of a larger set of objects refer to the number of ways we can choose items in any order.For comparison, look at the table below to see when order matters and when order doesn’t matter.
TABLE 13.5:
Combinations Permutations
• Ways to select the members of a committee froma larger population
• Ways to select specific officers in a club-president, vice president, treasurer, etc.
• Ways to select a set number of pizza toppingsfrom a larger list of choices
• Ways to select and arrange scoops of ice creamon a cone
• Ways to select books from a reading list • Ways to select and order in which to read booksselected from a reading list.
The simplest way to describe the difference between a combination and a permutation is to say that in a combinationthe order doesn’t matter. The members of a committee could be selected in any order but the officers in a club areassigned a specific position and therefore the order does matter. Be careful of the use of these words in the real world
866

www.ck12.org Chapter 13. Probability
as they are sometimes misused. For example, a locker combination. The ways to select and order the three numbersfor a locker combination is not actually a combination, but a permutation since the order does matter.
Example A
How many ways can we choose three different flavors of ice cream from a selection of 15 flavors to place in a bowl?
Solution: First, does order matter in the bowl? When we created an ice cream cone with three scoops in anearlier concept the order did matter but here it does not. Let’s work from the example of the ice cream cone. Wedetermined the number of permutations of a subset of three flavors from the total 15 flavors using the formula:
n!(n−r)! =
15!(15−3)! =
15!12! =
15×14×13×��12!��12! = 2730. Now that order doesn’t matter, this number includes the 3! ways
to arrange each combination of 3 flavors. We can divide 2,730 by 3! to determine the number of combinations:2730
3×2×1 = 27306 = 455.
The notation and formula for combinations can be written as:(
nr
)= nCr = Cn
r = n!r!(n−r)! , where n represents the
number of elements in the set and r represents the number of elements in the subset.
Example B
Evaluate the following expressions:
1.(
85
)2. 8C0
3. 8C8
4. C107
5. Explain why the answers to 2 and 3 are the same.
Solution: All of the notations in problems 1-4 indicate that we should use the formula for a combination. We can usethe graphing calculator to evaluate these as well. Problems 2 and 3 are set up in the form of the calculator notationso we will use the calculator to evaluate those two and the formula for the other two.
1.(
85
)= 8!
5!(8−5)! =8×7×6×��5!��5!×3×2×1
= 8×71 = 56.
2. Type in 8 on the TI-83 Graphing calculator, then MATH→PRB, select 3: nCr. Now type in 0 and your screenshould read 8 nCr 0 before your press ENTER to get the answer 1.
3. Type in 8 on the TI-83 Graphing calculator, then MATH→PRB, select 3: nCr. Now type in 8 and your screenshould read 8 nCr 8 before your press ENTER to get the answer 1.
4. C107 = 10!
7!(10−7)! =10×9×8×��7!��7!×3!
= 10×�3×3×4×�2�3×�2
= 120
5. In problem 2, we are looking at the ways to choose 0 items from 8 choices. There is only one way to do this. Inproblem 3 we are looking at the ways to choose 8 items from 8 choices. Well, the only way to do that is to chooseall 8 items. So, there is only 1 way to choose zero items or all the items from a set.
Example C
How many ways can a team of five players be selected from a class of 20 students?
Solution: We can express this problem using the notation(
205
)and then use the formula to evaluate.
(205
)=
20!5!×15!
=��20×19× �6×3×17×16×��15!
���5×4×���3×2×��15!= 15,504.
Guided Practice
867

13.2. Permutations and Combinations www.ck12.org
1. Evaluate the following using the formula for combinations of the calculator.
a.(
75
)b. 20C12
c. C157
2. How many ways can a committee of three students be formed from a club of fifteen members?
3. How many three-topping pizzas can be made if there are 10 topping choices?
Answers
1. Using the calculator for each of these we get:
a. 7 nCr 5 = 21
b. 20 nCr 12 = 125,970
c. 15 nCr 7 = 6,435
2.(
153
)= 15!
3!(15−3)! =�3×5×�2×7×13×��12!���3×2×��12! = 455.
3. C103 = 10 nCr 3 = 120.
Vocabulary
CombinationsThe number of ways a subset of items can be selected from a larger set disregarding order of selection.
Problem Set
Evaluate the following combinations with or without a calculator.
1. 13C102. C10
6
3.(
1810
)4. Explain why 9C5 = 9C4 = 126.5. Decide whether the following situations are permutations and which are combinations.
1. Ways to arrange students in a row.2. Ways to select a group of students.3. Ways to organize books on a shelf.4. Ways to select books to read from a larger collection.5. Ways to select three different yogurt flavors from a collection of ten flavors.
In each scenario described below, use either a combination or permutation as appropriate to answer the question.
6. There are seven selections for appetizers on a caterer’s menu. How many ways can you select three of them?7. You only have time for seven songs on your workout playlist. If you have 10 favorites, how many ways can
you select seven of them for the list? Now, how many ways can you select them in a particular order?8. How many ways can you select two teams of five players each from a group of ten players?9. At the local frozen yogurt shop a sundae comes with your choice of three toppings. If there are 12 choices for
toppings, how many combinations of toppings are possible?10. How many ways can four people be selected from a group of 30 to serve on a committee? What if each of the
four people was selected to fill a specific position on the committee?11. A soccer team has 20 players, but only 11 play at any one time.
868

www.ck12.org Chapter 13. Probability
1. How many ways can the coach select a group of eleven players to start (disregard positions)?2. Now, of the eleven players on the field, one is a goalie, four play defense, three play midfield and three
play offense. How many ways are there to assign the eleven players to these positions?3. Considering your answers to parts a and b, how many ways can the coach select eleven players and
assign them positions on the field? Assume all players can play each position.
869

13.3. The Fundamental Counting Principle www.ck12.org
13.3 The Fundamental Counting Principle
Objective
To develop an understanding of and use the Fundamental Counting Principle to determine the number of uniquearrangements that can be made of multiple items.
Review Queue
Write the nth term rules for the following sequences.
1. 21,26,31,36,41, . . .
2. −16,8,−4,2,−1, . . .
Find the sums of the following series.
3.6∑
n=1(n+1)2
4.∞
∑n=1
5(1
2
)n−1
Applying the Fundamental Counting Principle
Objective
Define and apply the Fundamental Counting Principle.
Guidance
Sometimes we want to know how many different combinations can be made of a variety of items. The fundamentalcounting principle which states that the number of ways in which multiple events can occur can be determined bymultiplying the number of possible outcomes for each event together. In other words, if events A, B, and C have 5, 3and 4 possible outcomes respectively, then the possible combinations of outcomes is 5×3×4 = 60.
The following examples will aid in developing an understanding of this concept and its application.
Example A
Sofia works in a clothing store. He has been given the task of setting up a mannequin with a skirt, a shirt and a pairof shoes from a display of coordinating skirts, shirts and shoes. Since they all coordinate she can pick any shirt, anyskirt and any pair of shoes and the outfit will work. If there are 3 skirts, 5 shirts and 2 pairs of shoes, how manyways can she dress the mannequin?
Solution: Let’s use a tree to help us visualize the possibilities. If we start with Shirt A, we get the followingpossibilities for the remainder of the outfit:
So we could have the following 6 combinations with Shirt A:
870

www.ck12.org Chapter 13. Probability
Shirt A, Skirt A, Shoe A
Shirt A, Skirt A, Shoe B
Shirt A, Skirt B, Shoe A
Shirt A, Skirt B, Shoe B
Shirt A, Skirt C, Shoe A
Shirt A, Skirt C, Shoe B
Consider that there are four other shirts that will also have 6 combinations of skirts and shirts that will go with them.Now, there are 5×6 total combinations which is 30 ways that Sofia could dress the mannequin.
Example B
Ralph is trying to purchase a new car. The salesperson tells him that there are 8 different possible interior colors, 5exterior colors and 3 car models to choose from. How many different unique cars does he have to choose from?
Solution: Instead of making a tree diagram this time, let’s look at a more efficient method for determining thenumber of combinations. If we consider what happens in the tree diagram, the 8 different interior colors would eachbe matched with each of the 5 exterior colors and those combinations would then be linked to the 3 different models,we can see that:
8 interior colors×5 exterior colors× 3 models = 8×5×3 = 120 combinations
Example C
Monique is having a 5 course dinner in the dining room on a cruise. The menu consists of 2 appetizers, 3 soups, 2salads, 4 entrees and 3 desserts. How many different meals could be configured if she chooses one of each course?
Solution: Following the method described in example B, we can multiply the number of chooses for each coursetogether to determine the total combinations:
2×3×2×4×3 = 144 unique 5 course meals.
Guided Practice
1. A coffee shop offers a special espresso deal. You choose one of three sizes, one of 5 flavored syrups and whole,nonfat or soy milk. How many drink combinations can be made?
2. Sarah goes to a local deli which offers a soup, salad and sandwich lunch. There are 3 soups, 3 salads and 6sandwiches from which to choose. How many different lunches can be formed?
3. A design your own t-shirt website offers 5 sizes, 8 colors and 25 designs for their shirts. How many differentt-shirts can be designed?
Answers
1. There are 3 sizes, 5 syrups and 3 kinds of milk from which to choose. So, 3×5×3 = 45 drinks.
2. 3 soups×3 salads×6 sandwiches = 54 lunch combos.
3. 5 sizes×8 colors×25 designs = 1000 shirts.
Vocabulary
The Fundamental Counting Principlestates that the number of ways in which multiple events can occur can be determined by multiplying thenumber of possible outcomes for each event together.
Problem Set
871
13.3. The Fundamental Counting Principle www.ck12.org
Use the Fundamental Counting Principle to answer the following questions.
1. A frozen yogurt shop has a half price Sunday Sundae special. Customers can get one of four flavors, one ofthree syrups and one of twelve toppings on their sundae. How many possible sundae combinations can bemade?
2. At a neighborhood restaurant wings are the specialty. The restaurant offers 3 sizes of wings, 4 levels of heatand ranch or blue cheese dipping sauce. How many different orders are possible?
3. A noodle restaurant offers five types of noodles to choose from and each dish comes with a choice of one offour meats and six different sauces. How many combinations can be made?
4. Charlie flips a coin and then rolls a die. How many different outcomes are possible?5. On a one week cruise, the ship stops in four ports. At each port there are six different excursions to choose
from. If a passenger chooses one excursion at each port, how many different vacation experiences can becreated?
6. Samuel wants to know if he can go a whole month without wearing the exact same outfit twice. He has threepairs of pants, six shirts and two pairs of shoes. Can he make a unique outfit for each day of the month?
7. A car dealership has four different models to choose from in six exterior colors. If there are three differentinterior colors to choose from, how many different vehicles can be designed?
8. A burrito bar offers a lunch special burrito. Customers can choose a flour or corn tortilla; chicken, steak orcarnitas; white or brown rice; black beans or pinto beans; cheese, guacamole, or sour cream; and one of foursalsas for a special price. How many different burritos can be made?
9. Maria rolls a die, spins a spinner with four numbers and then flips a coin. How many possible outcomes arethere?
10. A local restaurant offers a dinner special. Diners can choose one of six entrees, one of three appetizers andone of 3 desserts. How many different meals can be formed?
Using the Fundamental Counting Principle with and without Repetition
Objective
To determine the number of possible combinations in situations where elements may be repeated.
Guidance
Consider a phone number. A phone number consists entirely of numbers or repeated items. In this concepts we willlook at how to determine the total number of possible combinations of items which may be repeated.
Example A
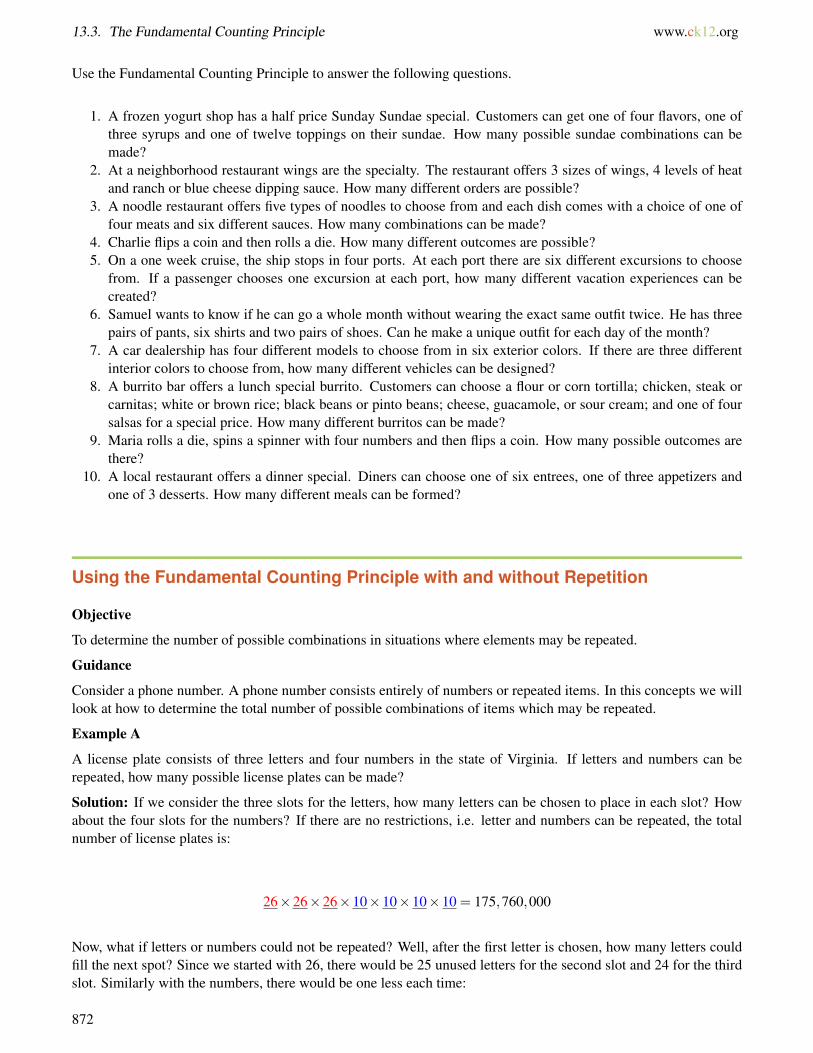
A license plate consists of three letters and four numbers in the state of Virginia. If letters and numbers can berepeated, how many possible license plates can be made?
Solution: If we consider the three slots for the letters, how many letters can be chosen to place in each slot? Howabout the four slots for the numbers? If there are no restrictions, i.e. letter and numbers can be repeated, the totalnumber of license plates is:
26×26×26×10×10×10×10 = 175,760,000
Now, what if letters or numbers could not be repeated? Well, after the first letter is chosen, how many letters couldfill the next spot? Since we started with 26, there would be 25 unused letters for the second slot and 24 for the thirdslot. Similarly with the numbers, there would be one less each time:
872
www.ck12.org Chapter 13. Probability
26×25×24×10×9×8×7 = 78,624,000
Example B
How many unique five letter passwords can be made? How many can be made if no letter is to be repeated?
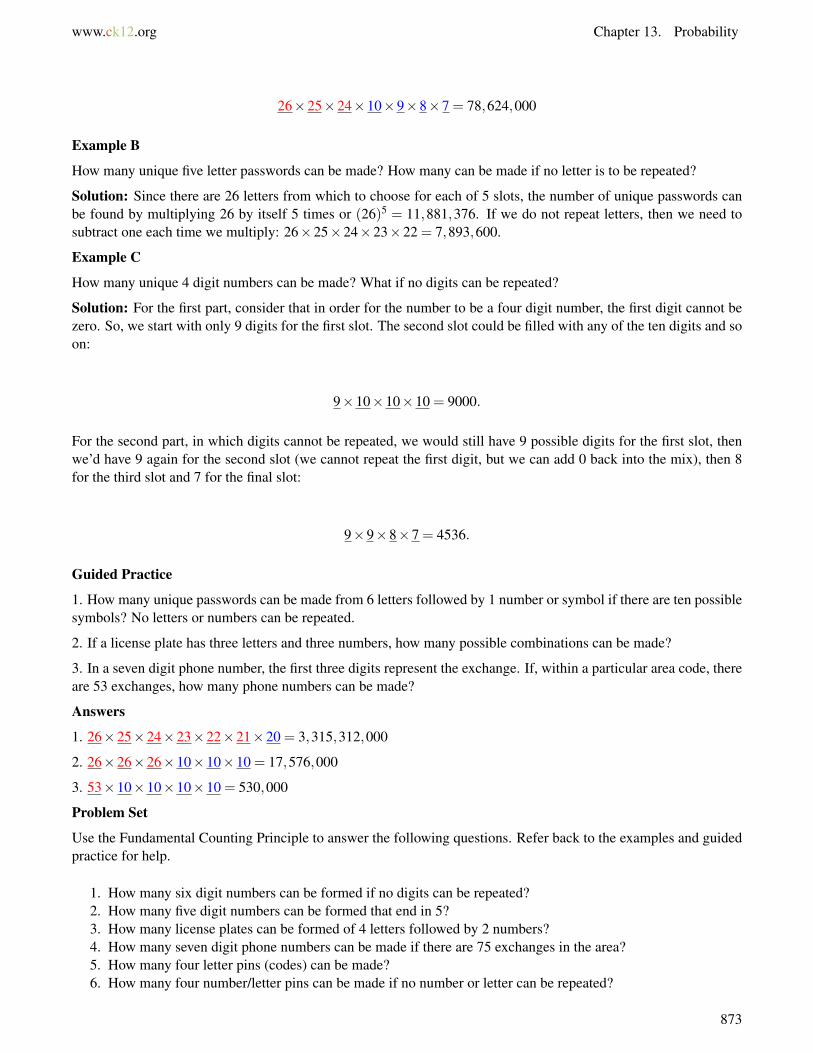
Solution: Since there are 26 letters from which to choose for each of 5 slots, the number of unique passwords canbe found by multiplying 26 by itself 5 times or (26)5 = 11,881,376. If we do not repeat letters, then we need tosubtract one each time we multiply: 26×25×24×23×22 = 7,893,600.
Example C
How many unique 4 digit numbers can be made? What if no digits can be repeated?
Solution: For the first part, consider that in order for the number to be a four digit number, the first digit cannot bezero. So, we start with only 9 digits for the first slot. The second slot could be filled with any of the ten digits and soon:
9×10×10×10 = 9000.
For the second part, in which digits cannot be repeated, we would still have 9 possible digits for the first slot, thenwe’d have 9 again for the second slot (we cannot repeat the first digit, but we can add 0 back into the mix), then 8for the third slot and 7 for the final slot:
9×9×8×7 = 4536.
Guided Practice
1. How many unique passwords can be made from 6 letters followed by 1 number or symbol if there are ten possiblesymbols? No letters or numbers can be repeated.
2. If a license plate has three letters and three numbers, how many possible combinations can be made?
3. In a seven digit phone number, the first three digits represent the exchange. If, within a particular area code, thereare 53 exchanges, how many phone numbers can be made?
Answers
1. 26×25×24×23×22×21×20 = 3,315,312,000
2. 26×26×26×10×10×10 = 17,576,000
3. 53×10×10×10×10 = 530,000
Problem Set
Use the Fundamental Counting Principle to answer the following questions. Refer back to the examples and guidedpractice for help.
1. How many six digit numbers can be formed if no digits can be repeated?2. How many five digit numbers can be formed that end in 5?3. How many license plates can be formed of 4 letters followed by 2 numbers?4. How many seven digit phone numbers can be made if there are 75 exchanges in the area?5. How many four letter pins (codes) can be made?6. How many four number/letter pins can be made if no number or letter can be repeated?
873

13.3. The Fundamental Counting Principle www.ck12.org
7. How many different ways can nine unique novels be arranged on a shelf?8. How many different three scoop cones can be made from 12 flavors of ice cream allowing for repetition? What
if no flavors can be repeated?9. How many different driver’s license numbers can be formed by 2 letters followed by 6 numbers?
10. How many student ID numbers can be made by 4 random digits (zero cannot come first) followed by thestudent’s grade (9, 10, 11 or 12). Example: 5422-12 for a 12th grader.
874

www.ck12.org Chapter 13. Probability
13.4 The Binomial Theorem
Objective
To recognize the connection between the elements in Pascal’s Triangle and the expansion of Binomials and to usethe Binomial Theorem to expand binomials.
Review Queue
1. How many ways can seven different floats be ordered in a parade?
2. How many unique ways can the letters in the word COMMITTEE be arranged?
3. How many combinations of 4 sundae toppings can be made from a selection of 12?
Pascal’s Triangle and the Coefficients in the Expansion of Binomials
Objective
Observe and use the connection between Pascal’s Triangle and expanded binomials to assist in expanding binomials.
Guidance
Pascal’s Triangle:
Each row begins and ends with a one. Each “interior” value in each row is the sum of the two numbers above it. Forexample, 2+1 = 3 and 10+10 = 20. This pattern produces the symmetry in the triangle.
Another pattern that can be observed is that the row number is equal to the number of elements in that row. Row 1,for example has 1 element, 1. Row 2 has 2 elements, 1 and 1. Row 3 has 3 elements, 1, 2 and 1.
A third pattern is that the second element in the row is equal to one less than the row number. For example, in row 5we have 1, 4, 6, 4 and 1.
Example A
Continue the triangle to determine the elements in the 9th row of Pascal’s Triangle.
Solution: Following the pattern of adding adjacent elements to get the elements in the next row, we find hat theeighth row is: 1 7 21 35 35 21 7 1
875
13.4. The Binomial Theorem www.ck12.org
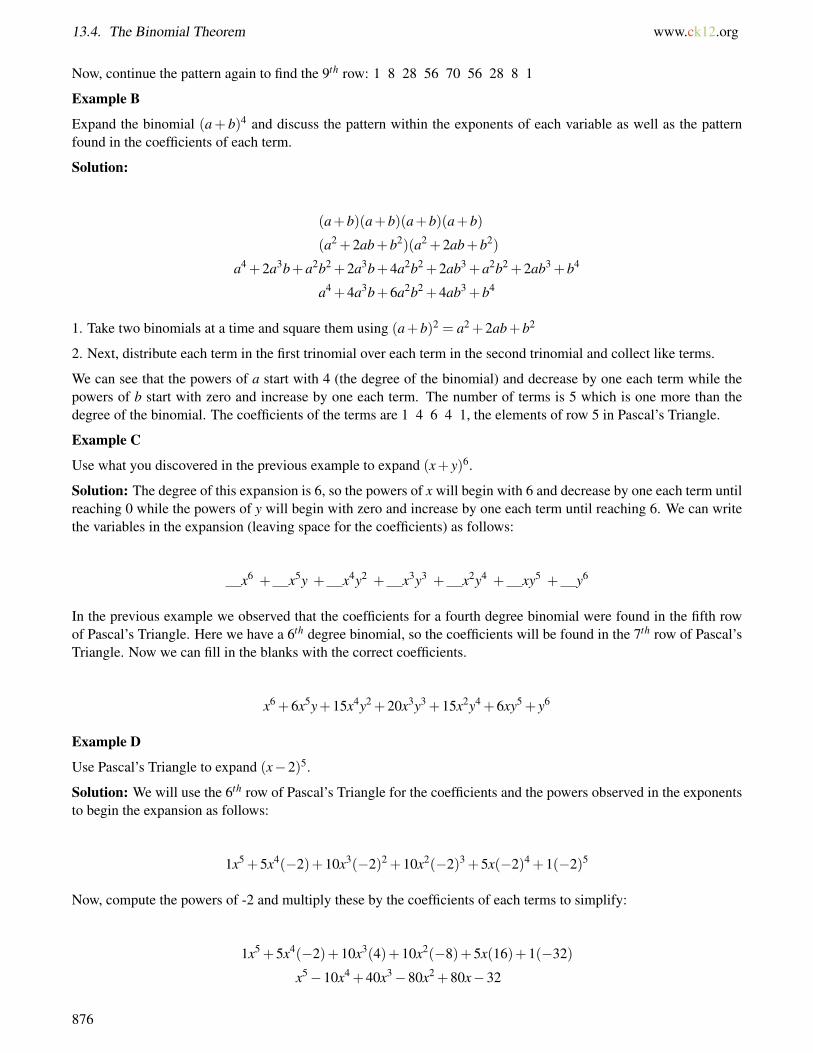
Now, continue the pattern again to find the 9th row: 1 8 28 56 70 56 28 8 1
Example B
Expand the binomial (a+ b)4 and discuss the pattern within the exponents of each variable as well as the patternfound in the coefficients of each term.
Solution:
(a+b)(a+b)(a+b)(a+b)
(a2 +2ab+b2)(a2 +2ab+b2)
a4 +2a3b+a2b2 +2a3b+4a2b2 +2ab3 +a2b2 +2ab3 +b4
a4 +4a3b+6a2b2 +4ab3 +b4
1. Take two binomials at a time and square them using (a+b)2 = a2 +2ab+b2
2. Next, distribute each term in the first trinomial over each term in the second trinomial and collect like terms.
We can see that the powers of a start with 4 (the degree of the binomial) and decrease by one each term while thepowers of b start with zero and increase by one each term. The number of terms is 5 which is one more than thedegree of the binomial. The coefficients of the terms are 1 4 6 4 1, the elements of row 5 in Pascal’s Triangle.
Example C
Use what you discovered in the previous example to expand (x+ y)6.
Solution: The degree of this expansion is 6, so the powers of x will begin with 6 and decrease by one each term untilreaching 0 while the powers of y will begin with zero and increase by one each term until reaching 6. We can writethe variables in the expansion (leaving space for the coefficients) as follows:
x6 + x5y + x4y2 + x3y3 + x2y4 + xy5 + y6
In the previous example we observed that the coefficients for a fourth degree binomial were found in the fifth rowof Pascal’s Triangle. Here we have a 6th degree binomial, so the coefficients will be found in the 7th row of Pascal’sTriangle. Now we can fill in the blanks with the correct coefficients.
x6 +6x5y+15x4y2 +20x3y3 +15x2y4 +6xy5 + y6
Example D
Use Pascal’s Triangle to expand (x−2)5.
Solution: We will use the 6th row of Pascal’s Triangle for the coefficients and the powers observed in the exponentsto begin the expansion as follows:
1x5 +5x4(−2)+10x3(−2)2 +10x2(−2)3 +5x(−2)4 +1(−2)5
Now, compute the powers of -2 and multiply these by the coefficients of each terms to simplify:
1x5 +5x4(−2)+10x3(4)+10x2(−8)+5x(16)+1(−32)
x5−10x4 +40x3−80x2 +80x−32
876

www.ck12.org Chapter 13. Probability
Guided Practice
1. Write out the elements in row 10 of Pascal’s Triangle.
2. Expand (a+4)3
3. Write out the coefficients in the expansion of (2x−3)4
Answers
1. The 9th row was determined in Example A to be: 1 8 28 56 70 56 28 8 1
Subsequently, the 10th row is: 1 9 36 84 126 126 84 36 9 1
2.
a3 +3a2(4)+3a(4)2 +(4)3
a3 +12a2 +48a+64
3.
(2x)4 +4(2x)3(−3)+6(2x)2(−3)2 +4(2x)(−3)3 +(−3)4
16x4−96x3 +216x2−216x+81
Problem Set
1. Write out the elements in row 7 of Pascal’s Triangle.2. Write out the elements in row 13 of Pascal’s Triangle.
Use Pascal’s Triangle to expand the following binomials.
3. (x−6)4
4. (2x+5)6
5. (3− x)7
6. (x2−2)3
7. (x+4)5
8. (2− x3)4
9. (a−b)6
10. (x+1)10
Using the Binomial Theorem
Objective
Define and apply the binomial theorem to determine the expansions of binomials.
Guidance
Using Pascal’s Triangle and the patterns within it are only one way to expand binomials. The Binomial Theoremcan also be used to expand binomials and is sometimes more efficient, particularly for higher degree binomials. TheBinomial Theorem is given by:
(a+b)n =
(n0
)anb0 +
(n1
)an−1b1 +
(n2
)an−2b2 + . . .+
(n
n−1
)a1bn−1 +
(nn
)a0bn
877
13.4. The Binomial Theorem www.ck12.org
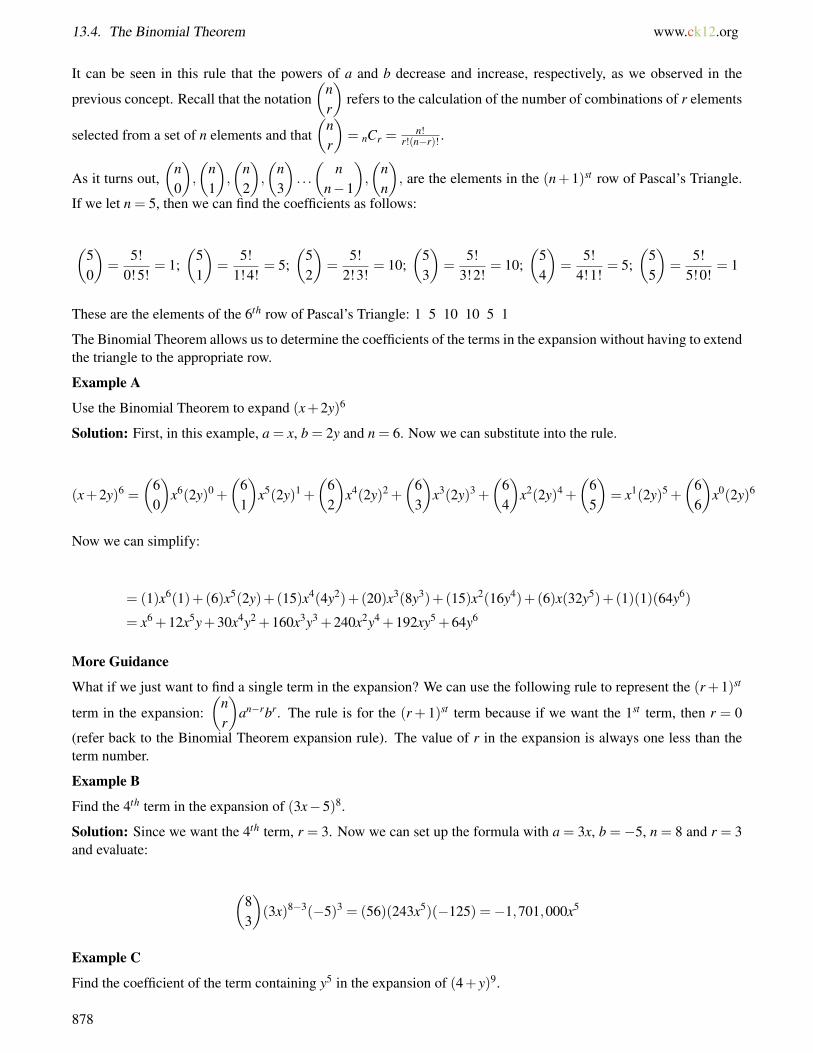
It can be seen in this rule that the powers of a and b decrease and increase, respectively, as we observed in the
previous concept. Recall that the notation(
nr
)refers to the calculation of the number of combinations of r elements
selected from a set of n elements and that(
nr
)= nCr =
n!r!(n−r)! .
As it turns out,(
n0
),
(n1
),
(n2
),
(n3
). . .
(n
n−1
),
(nn
), are the elements in the (n+1)st row of Pascal’s Triangle.
If we let n = 5, then we can find the coefficients as follows:
(50
)=
5!0!5!
= 1;(
51
)=
5!1!4!
= 5;(
52
)=
5!2!3!
= 10;(
53
)=
5!3!2!
= 10;(
54
)=
5!4!1!
= 5;(
55
)=
5!5!0!
= 1
These are the elements of the 6th row of Pascal’s Triangle: 1 5 10 10 5 1
The Binomial Theorem allows us to determine the coefficients of the terms in the expansion without having to extendthe triangle to the appropriate row.
Example A
Use the Binomial Theorem to expand (x+2y)6
Solution: First, in this example, a = x, b = 2y and n = 6. Now we can substitute into the rule.
(x+2y)6 =
(60
)x6(2y)0 +
(61
)x5(2y)1 +
(62
)x4(2y)2 +
(63
)x3(2y)3 +
(64
)x2(2y)4 +
(65
)= x1(2y)5 +
(66
)x0(2y)6
Now we can simplify:
= (1)x6(1)+(6)x5(2y)+(15)x4(4y2)+(20)x3(8y3)+(15)x2(16y4)+(6)x(32y5)+(1)(1)(64y6)
= x6 +12x5y+30x4y2 +160x3y3 +240x2y4 +192xy5 +64y6
More Guidance
What if we just want to find a single term in the expansion? We can use the following rule to represent the (r+1)st
term in the expansion:(
nr
)an−rbr. The rule is for the (r+ 1)st term because if we want the 1st term, then r = 0
(refer back to the Binomial Theorem expansion rule). The value of r in the expansion is always one less than theterm number.
Example B
Find the 4th term in the expansion of (3x−5)8.
Solution: Since we want the 4th term, r = 3. Now we can set up the formula with a = 3x, b =−5, n = 8 and r = 3and evaluate:
(83
)(3x)8−3(−5)3 = (56)(243x5)(−125) =−1,701,000x5
Example C
Find the coefficient of the term containing y5 in the expansion of (4+ y)9.
878
www.ck12.org Chapter 13. Probability
Solution:
This time, think about the rule,(
nr
)an−rbr, and that we know that br = y5 and thus r = 5. We also know that n = 9
and a = 4. Now we can fill in the rest of the rule:
(95
)(4)9−5y5 = (126)(256)y5 = 32,256y5
Guided Practice
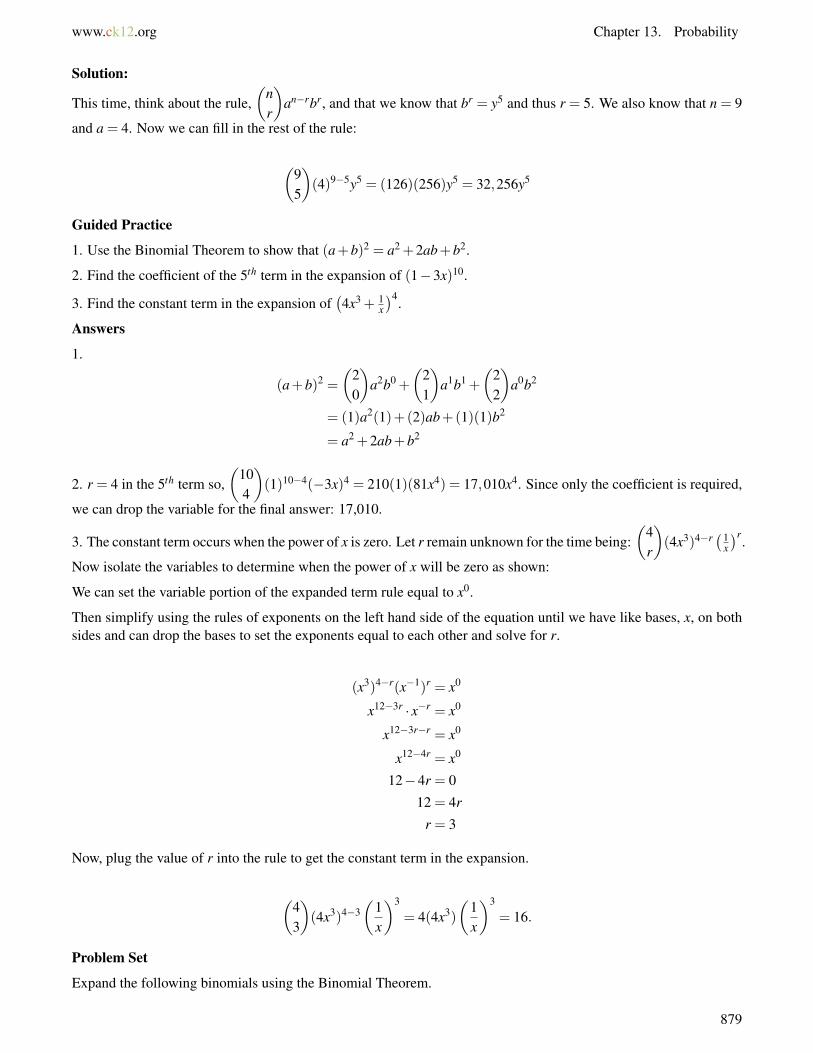
1. Use the Binomial Theorem to show that (a+b)2 = a2 +2ab+b2.
2. Find the coefficient of the 5th term in the expansion of (1−3x)10.
3. Find the constant term in the expansion of(4x3 + 1
x
)4.
Answers
1.
(a+b)2 =
(20
)a2b0 +
(21
)a1b1 +
(22
)a0b2
= (1)a2(1)+(2)ab+(1)(1)b2
= a2 +2ab+b2
2. r = 4 in the 5th term so,(
104
)(1)10−4(−3x)4 = 210(1)(81x4) = 17,010x4. Since only the coefficient is required,
we can drop the variable for the final answer: 17,010.
3. The constant term occurs when the power of x is zero. Let r remain unknown for the time being:(
4r
)(4x3)4−r
(1x
)r.
Now isolate the variables to determine when the power of x will be zero as shown:
We can set the variable portion of the expanded term rule equal to x0.
Then simplify using the rules of exponents on the left hand side of the equation until we have like bases, x, on bothsides and can drop the bases to set the exponents equal to each other and solve for r.
(x3)4−r(x−1)r = x0
x12−3r · x−r = x0
x12−3r−r = x0
x12−4r = x0
12−4r = 0
12 = 4r
r = 3
Now, plug the value of r into the rule to get the constant term in the expansion.
(43
)(4x3)4−3
(1x
)3
= 4(4x3)
(1x
)3
= 16.
Problem Set
Expand the following binomials using the Binomial Theorem.
879
13.4. The Binomial Theorem www.ck12.org
1. (x−a)7
2. (2a+3)4
Find the nth term in the expansions of the following binomials.
3. (7x−2)5; n = 44.(6x+ 1
2
)7 ; n = 35. (5−a)9; n = 76.(2
3 x+9y)6 ; n = 4
7. Find the term with x5 in the expansion of (3x−2)7.8. Find the term with y6 in the expansion of (5− y)8.9. Find the term with a3 in the expansion of (2a−b)10.
10. Find the term with x4 in the expansion of (8−3x)5.11. Find the constant term in the expansion of
(x2 + 3
x
)6.
12. Find the constant term in the expansion of( 5
x3 − x)8
.
880
www.ck12.org Chapter 13. Probability
13.5 Venn Diagrams and Independence
Objective
To use Venn diagrams and the related set notation to show the relationships between sets.
Review Queue
1. A fair pair of dice is rolled twice. What is the probability of obtaining a sum of six on both rolls?
2. A drawer contains 4 pairs of brown socks and 5 pairs of black socks. If two pairs are randomly selected withoutreplacement, what is the probability of selecting at least one pair of black socks?
3. Three cards are selected randomly from a deck of 52 playing cards. What is the probability of selecting cards ofthe same suit (all three are either red or black) if the cards are replaced between each drawing? What if the cards arenot replaced?
Union and Intersection of Sets
Objective
Define and apply the notations for union and intersection of sets and the compliment of a set.
Guidance
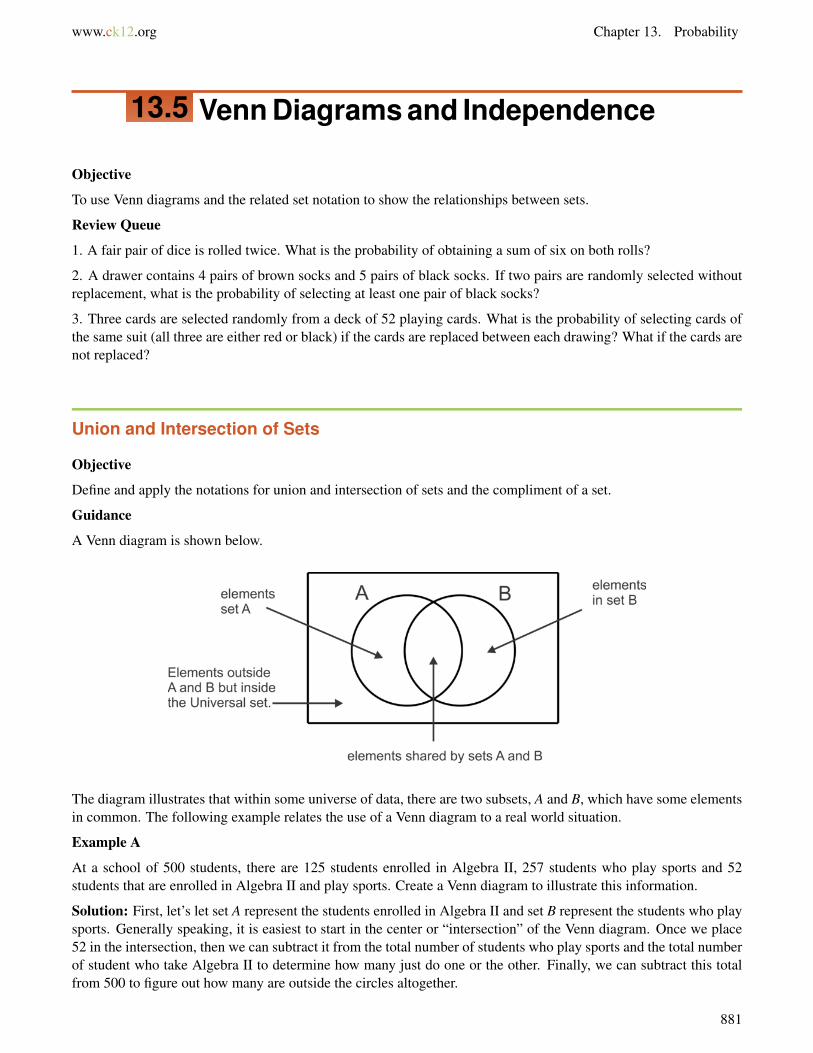
A Venn diagram is shown below.
The diagram illustrates that within some universe of data, there are two subsets, A and B, which have some elementsin common. The following example relates the use of a Venn diagram to a real world situation.
Example A
At a school of 500 students, there are 125 students enrolled in Algebra II, 257 students who play sports and 52students that are enrolled in Algebra II and play sports. Create a Venn diagram to illustrate this information.
Solution: First, let’s let set A represent the students enrolled in Algebra II and set B represent the students who playsports. Generally speaking, it is easiest to start in the center or “intersection” of the Venn diagram. Once we place52 in the intersection, then we can subtract it from the total number of students who play sports and the total numberof student who take Algebra II to determine how many just do one or the other. Finally, we can subtract this totalfrom 500 to figure out how many are outside the circles altogether.
881

13.5. Venn Diagrams and Independence www.ck12.org
There symbols that can be used to describe the number of elements in each region in the diagram as well.
TABLE 13.6:
Symbol Description Value for this Problemn(A) The number of elements in set A 125n(A∩B) The number of elements in the in-
tersection of sets A and B (all theelements that are in both sets-theoverlap)
52
n(A∪B) The number of elements in theunion of sets A and B (all the ele-ments that are in one or both of thesets)
330
n(A′) The number of elements in the com-pliment of A (the number of ele-ments outside set A)
375
n((A∪B)′) The number of elements in the com-pliment of A∪B (everything outsidethe union of A and B)
170
n((A∩B)′) The number of elements in the com-pliment of A∩B (everything outsidethe intersection of A and B)
448
n(A∩B′) The number of elements in the in-tersection of A and B’s compliment(the number of elements in A but notin B)
73
Example B
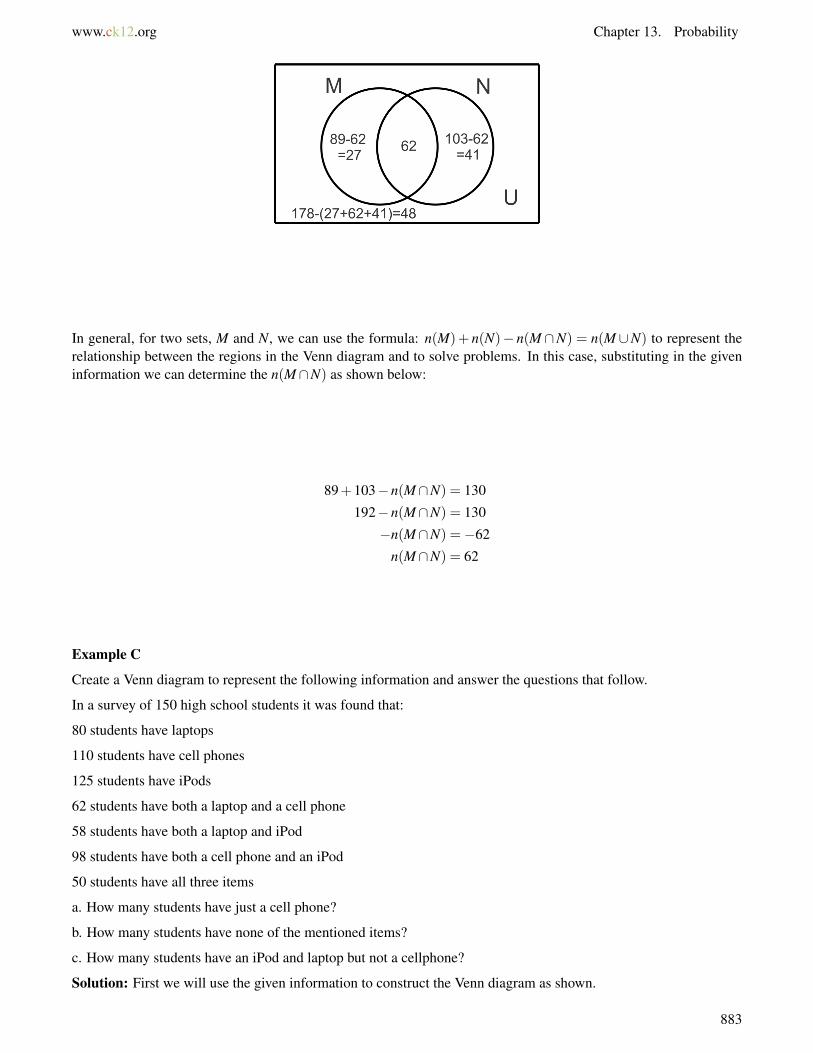
Create a Venn diagram to illustrate the following information regarding the subsets M and N in universe U :
n(M) = 89; n(N) = 103; n(M∪N) = 130; n(U) = 178
Solution: Again, we will start in the middle or intersection. We must determine how many elements are in theintersection. Let’s consider that when we add the elements in M to the elements in N, we are adding the elements inthe intersection twice. This happens because they are counted in set M and counted again in set N. Did you noticethat n(M)+n(N) = 89+103 = 192 while the n(M∪N) = 130? We have double counted the 62 (192-130) elementsin M∩N. Now we can put this number in the Venn diagram and work our way out as we did in the previous example.
882
www.ck12.org Chapter 13. Probability
In general, for two sets, M and N, we can use the formula: n(M)+ n(N)− n(M∩N) = n(M∪N) to represent therelationship between the regions in the Venn diagram and to solve problems. In this case, substituting in the giveninformation we can determine the n(M∩N) as shown below:
89+103−n(M∩N) = 130
192−n(M∩N) = 130
−n(M∩N) =−62
n(M∩N) = 62
Example C
Create a Venn diagram to represent the following information and answer the questions that follow.
In a survey of 150 high school students it was found that:
80 students have laptops
110 students have cell phones
125 students have iPods
62 students have both a laptop and a cell phone
58 students have both a laptop and iPod
98 students have both a cell phone and an iPod
50 students have all three items
a. How many students have just a cell phone?
b. How many students have none of the mentioned items?
c. How many students have an iPod and laptop but not a cellphone?
Solution: First we will use the given information to construct the Venn diagram as shown.
883

13.5. Venn Diagrams and Independence www.ck12.org
We can start by putting 50 in the center where students have all three items. Next we can find the values in blueby subtracting 50 from each of the “overlapping” values. For example, there are 62 students with both a laptop anda cell phone and 50 of them also have an iPod. To find the number that have a laptop and cell phone but no iPod,subtract 62−50 = 12. Once the blue values are found we can find the green values by subtracting the blue and redvalues in each subset from the total in the subset. For example, the number of students with a cell phone but no othertechnology item is 110− (50+ 12+ 48) = 0. Finally we can add up all the values in the circles and subtract thisfrom 150, the total number of students surveyed to determine that 3 students have none of the items.
Now that the Venn diagram is complete, we can use it to answer the questions.
a. There are 0 students that just have a cell phone.
b. There are 3 students with none of the mentioned technology.
c. There are 8 students with an iPod and laptop but no cell phone.
Guided Practice
Use the Venn diagram to determine the number of elements in each set described in the problems.
1. n(A)
2. n(C)
3. n(A′)
4. n(A∩B)
884

www.ck12.org Chapter 13. Probability
5. n(A∪B∪C)
6. n(A∩C′)
7. n(A∩B∩C)
8. n(A′∩B′∩C′)
Answers
1. 3+7+8+8 = 26
2. 8+8+4+12 = 32
3. 8+4+12+6 = 30
4. 7+8 = 15
5. 3+7+8+8+8+4+12 = 50
6. 3+7 = 10.
7. 8
8. 6
Problem Set
Use the information below for problems 1-5.
In a survey of 80 households, it was found that:
30 had at least one dog
42 had at least one cat
21 had at least one “other” pet (fish, turtle, reptile, hamster, etc.)
20 had dog(s) and cat(s)
10 had cat(s) and “other” pet(s)
8 had dog(s) and “other” pet(s)
5 had all three types of pets
1. Make a Venn diagram to illustrate the results of the survey.2. How many have dog(s) and cat(s) but no “other” pet(s)?3. How many have only dog(s)?4. How many have no pets at all?5. How many “other” pet(s) owners also have dog(s) or cat(s) but not both?
Use the letters in the Venn diagram below to describe the region for each of the sets.
6. A∩B
885

13.5. Venn Diagrams and Independence www.ck12.org
7. A8. A∪B9. A∩B′
10. (A∩B)′
11. (A∪B)′
12. A′
13. B′∪A
Probability Using a Venn Diagram and Conditional Probability
Objective
Use Venn diagrams to solve probability problems.
Guidance
It is often useful to use a Venn diagram to visualize the probabilities of multiple events. In Example A we explorethe use of a Venn diagram to determine the probabilities of individual events, the intersection of events and thecompliment of an event. In Example C we will continue to explore the concept of a conditional probability and howto use a Venn diagram to solve these problems as well as the formula for conditional probability first introduced inthe concept “Calculating Probabilities of Combined Events”.
Example A
Use the Venn diagram to find the probabilities.
a. P(A)
b. P(B)
c. P(A∩B)
d. P(A∪B)
e. P(A′∩B′)
Solution: Essentially we will do exactly what we did in the previous concept with probabilities rather than wholenumbers. Notice that the sum of all the values in the diagram is 0.4+0.3+0.2+0.1 = 1. This diagram representsthe entire sample space for two events, A and B.
a. To find the P(A), we will add the probability that only A occurs to the probability that A and B occur to get0.4+0.3 = 0.7. So P(A) = 0.7.
b. Similarly, P(B) = 0.2+0.3 = 0.5.
c. Now, P(A∩B) is the value in the overlapping region 0.3.
886
www.ck12.org Chapter 13. Probability
d. P(A∪B) = 0.4+ 0.3+ 0.2 = 0.9. Which can also be found using the formula P(A)+P(B)−P(A∩B) = 0.7+0.5−0.3 = 0.9.
e. P(A′∩B′) needs to be determined by finding where in the diagram everything outside of A overlaps with everythingoutside of B. That will be the region outside of both circles and that probability is 0.1. Another way to think of thisis P(A∪B)′, or 1−P(A∪B).
More Guidance
There are a couple of equivalent set notations or probabilities and they are called De Morgan’s Laws.
(A∩B)′ = (A′∪B′) for sets or P(A∩B)′ = P(A′∪B′) for probabilities.
and
(A∪B)′ = (A′∩B′) for sets or P(A∪B)′ = P(A′∩B′) for probabilities.
We looked at the second one in part e of Example A. We will look at the first one in the next Example.
Example B
Given P(A) = 0.6, P(B) = 0.3 and P(A∪B) = 0.7, find P(A∩B) and P(A′∪B′).
Solution: First, we can use the formula for the union of two sets to determine the intersection.
P(A)+P(B)−P(A∩B) = P(A∪B)
0.6+0.3−P(A∩B) = 0.7
0.9−0.7 = P(A∩B)
0.2 = P(A∩B)
Now we can use De Morgan’s Law to find P(A′∪B′).
P(A′∪B′) = P(A∩B)′ = 1−P(A∪B) = 1−0.2 = 0.8.
We could have also created a Venn diagram for the probabilities and interpreted P(A′∪B′) and the regions outsideA union with the regions outside B which would be everything in the Venn diagram except the overlap of the tworegions or P(A∩B).
Example C
The data from a survey of 140 students showed that 37 study music, 103 play a sport and 25 do neither. Create aVenn diagram to illustrate the data collected and then determine the probability that if a student is selected at random,
a. he or she will study music
b. he or she will study music given that he or she plays a sport.
Solution: Let M represent the set of students who study music and S represent the set of students who play sports.First let’s determine the number of students that study music and play a sport to fill in the overlapping region in thediagram and then we can find the other values.
n(M)+n(S)−n(M∩S) = n(M∪S)
37+103−n(M∩S) = 115
n(M∩S) = 25
887

13.5. Venn Diagrams and Independence www.ck12.org
a. The probability that a randomly selected student studies music is the number of students who study music dividedby the total number of students surveyed or P(M) = n(M)
140 = 37140 ≈ 0.264.
b. The probability that a randomly selected student will study music given that he/she plays a sport is called aconditional probability. We use the notation P(M|S) to represent the P(M) given that S has already occurred. To findthis probability using a Venn diagram, we find the number of student who study music and play a sport and divideby the number of students who play a sport or P(M|S) = n(M∩S)
n(S) = 25103 ≈ 0.243. Think of it this way, when we say
that we know that the student plays a sport, then the numerator is limited to those students who study music and playa sport and the denominator is limited to those who play a sport.
There is also a formula for conditional probability: P(A|B) = P(A∩B)P(B)
In the context of our problem, it is: P(M|S) = P(M∩S)P(S) =
25140103140
= 25140 ·
140103 = 25
103 .
Notice that the resulting probability is the same as previously determined. Either method can be used.
Guided Practice
1. In a class of 260 seniors, 125 study Spanish, 95 study Chemistry, 165 study Mathematics, 18 study Spanish andChemistry, 75 study Chemistry and Math, 20 study Math and Spanish and 15 study all three subjects. Make a Venndiagram to illustrate the data and then find the probability that a student selected at random studies:
a. just Spanish
b. Math and Chemistry but not Spanish
c. none of these subjects
d. Spanish, given that he/she studies Math
2.Given P(A∩B) = 0.4, P(A∩B′) = 0.2 and P(A′∩B′) = 0.3, find P(B) and P(A|B).
Answers
1.
888
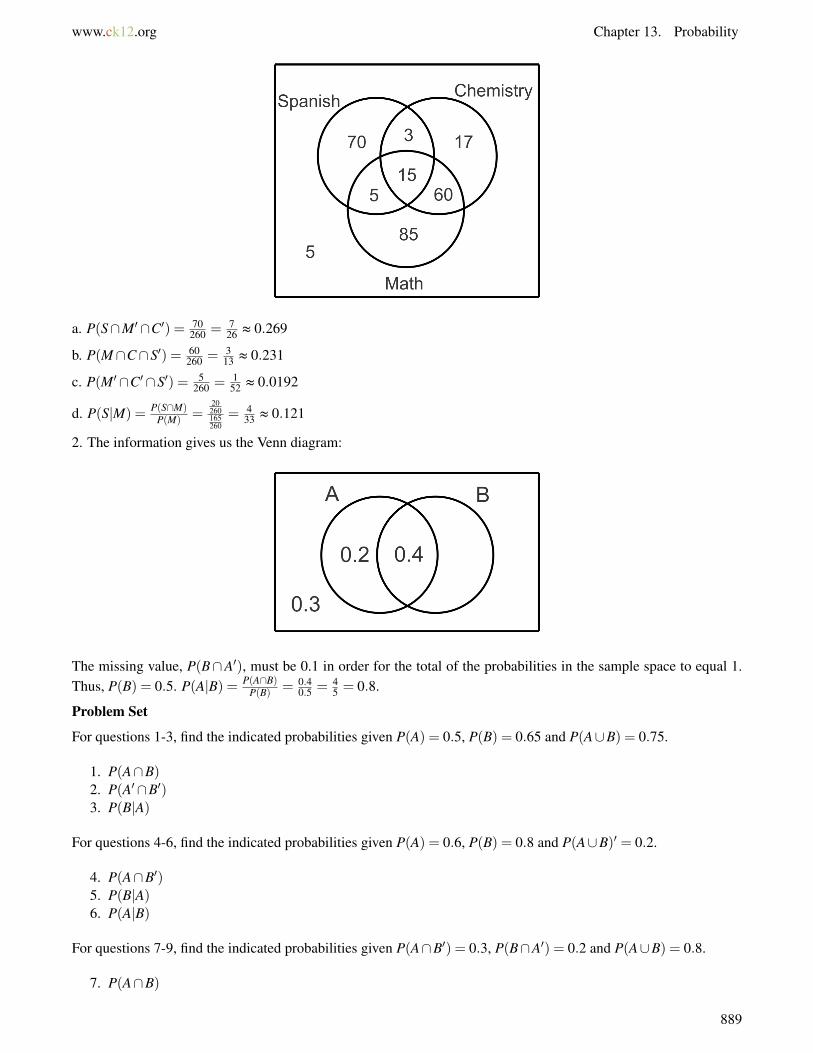
www.ck12.org Chapter 13. Probability
a. P(S∩M′∩C′) = 70260 = 7
26 ≈ 0.269
b. P(M∩C∩S′) = 60260 = 3
13 ≈ 0.231
c. P(M′∩C′∩S′) = 5260 = 1
52 ≈ 0.0192
d. P(S|M) = P(S∩M)P(M) =
20260165260
= 433 ≈ 0.121
2. The information gives us the Venn diagram:
The missing value, P(B∩A′), must be 0.1 in order for the total of the probabilities in the sample space to equal 1.Thus, P(B) = 0.5. P(A|B) = P(A∩B)
P(B) = 0.40.5 = 4
5 = 0.8.
Problem Set
For questions 1-3, find the indicated probabilities given P(A) = 0.5, P(B) = 0.65 and P(A∪B) = 0.75.
1. P(A∩B)2. P(A′∩B′)3. P(B|A)
For questions 4-6, find the indicated probabilities given P(A) = 0.6, P(B) = 0.8 and P(A∪B)′ = 0.2.
4. P(A∩B′)5. P(B|A)6. P(A|B)
For questions 7-9, find the indicated probabilities given P(A∩B′) = 0.3, P(B∩A′) = 0.2 and P(A∪B) = 0.8.
7. P(A∩B)
889

13.5. Venn Diagrams and Independence www.ck12.org
8. P(A)9. P(B|A)
10. Given P(A) = 2P(B), P(A∪B) = 0.8 and P(A∩B) = 0.1, find P(A).11. The international club at a school has 105 members, many of whom speak multiple languages. The most
commonly spoken languages in the club are English, Spanish and Chinese. Use the Venn Diagram below todetermine the probability of selecting a student who:
1. does not speak English.2. speaks Spanish given that he/she speaks English.3. speaks English given that he/she speaks Chinese.4. speaks Spanish and English but not Chinese.
Independent, Conditional and Mutually Exclusive Events
Objective
Define and apply the appropriate formulas to determine probabilities of combined events which are Independent,Conditional or Mutually Exclusive.
Guidance
We have already discussed the formula for conditional probabilities: P(A|B) = P(A∩B)P(B) . These events are not
independent, they are conditional because the outcome of event B affects the outcome of event A. When eventsare independent, P(A|B) = P(A), meaning that it doesn’t matter that event B has occurred, the result of event Bdoes not affect the result of event A. Now we can replace P(A|B) with P(A∩B)
P(B) in the previous statement to getP(A∩B)
P(B) = P(A). Finally, multiply both sides by P(B) to get P(A∩B) = P(A)×P(B) for independent events A and B.We can use this rule to determine if events are independent or to find the intersection of known independent events.
It is also possible for two events to have not intersection, or P(A∩B) = 0. When this occurs we say that the events(or sets) are Mutually Exclusive. If one has occurred, then the other cannot occur. Examples of Mutually Exclusivesets are Boys and Girls, Juniors and Seniors-it is not possible to be both. It is important to note here that mutuallyexclusive events cannot be independent unless the probability of one of the events is zero since for independentevents P(A∩B) = P(A)×P(B) and the only way a product can equal zero is if one of the factors is equal to zero.
Example A
Given two events, A and B, such that P(A) = 0.3, P(B) = 0.5 and P(A∪B) = 0.65
a. Find P(A∩B).
890

www.ck12.org Chapter 13. Probability
b. State with a reason whether the events are independent.
c. State with a reason whether the events are mutually exclusive.
Solution:
a. Since we are not told that the events are independent, we do not know that P(A∩B) = P(A)×P(B). However, forall events, independent or otherwise, it is true that P(A)+P(B)−P(A∩B) = P(A∪B) so
0.3+0.5−P(A∩B) = 0.65
P(A∩B) = 0.15
b. To determine if the events are independent we will test the rule P(A∩B) = P(A)×P(B).
P(A)×P(B) = 0.3×0.5 = 0.15 = P(A∩B).
Thus, the events are independent since the product of their probabilities is equal to the probability of their intersec-tion.
c. The events are not mutually exclusive because P(A∩B) = 0.15 6= 0.
Example B
Given that A and B are independent events such that P(A) = 0.4 and P(A∪B) = 0.76, find
a. P(B)
b. Probability of A or B but not both occurring.
Solution:
a. Since we know the two events are independent, we know that P(A∩B) = 0.4P(B). Now we can use the formulafor the probability of the union of the two sets and substitute this product for the probability of the intersection:
0.4+P(B)−0.4P(B) = 0.76
0.6P(B) = 0.36
P(B) = 0.6
b. To find the probability of either A or B occurring but not both, we need to find P(A∩B) and subtract this fromP(A∪B).
0.76− (0.4)(0.6) = 0.76−0.24 = 0.52
Example C
Events A and B are independent such that P(B∩A′) = 0.2 and P(A∩B) = 0.3. Find P(A∪B).
Solution: For this problem, a Venn diagram might be useful to illustrate the given information.
891
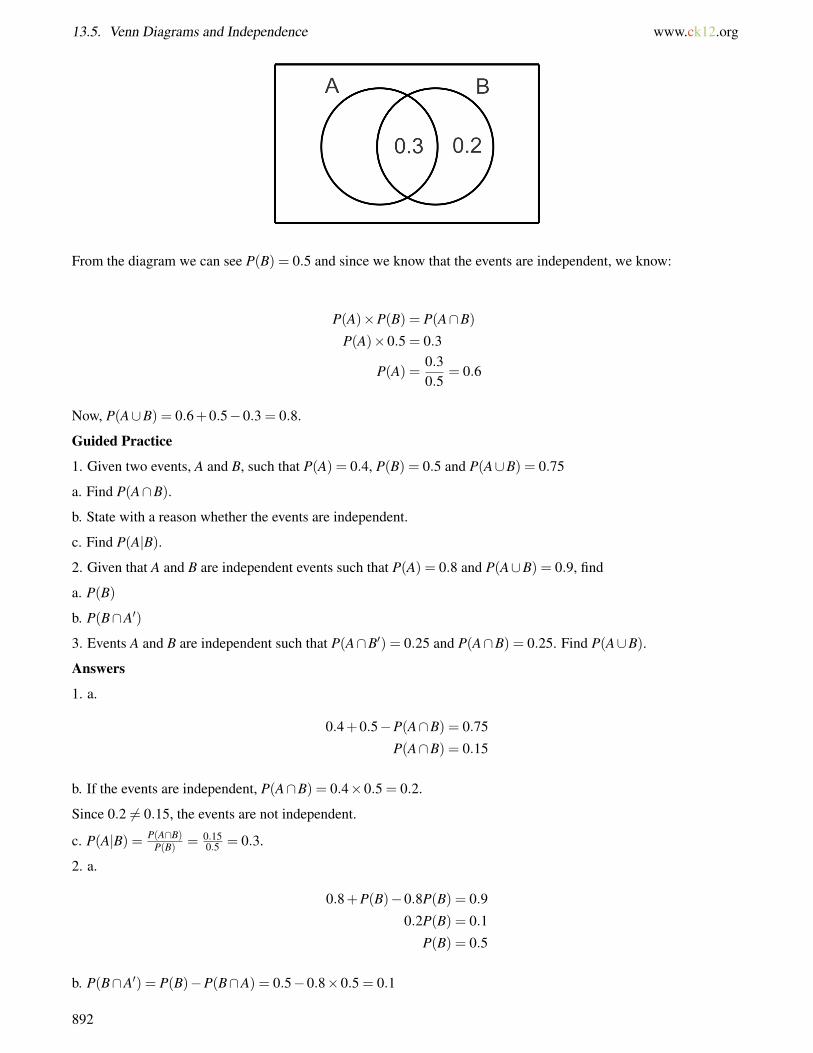
13.5. Venn Diagrams and Independence www.ck12.org
From the diagram we can see P(B) = 0.5 and since we know that the events are independent, we know:
P(A)×P(B) = P(A∩B)
P(A)×0.5 = 0.3
P(A) =0.30.5
= 0.6
Now, P(A∪B) = 0.6+0.5−0.3 = 0.8.
Guided Practice
1. Given two events, A and B, such that P(A) = 0.4, P(B) = 0.5 and P(A∪B) = 0.75
a. Find P(A∩B).
b. State with a reason whether the events are independent.
c. Find P(A|B).
2. Given that A and B are independent events such that P(A) = 0.8 and P(A∪B) = 0.9, find
a. P(B)
b. P(B∩A′)
3. Events A and B are independent such that P(A∩B′) = 0.25 and P(A∩B) = 0.25. Find P(A∪B).
Answers
1. a.
0.4+0.5−P(A∩B) = 0.75
P(A∩B) = 0.15
b. If the events are independent, P(A∩B) = 0.4×0.5 = 0.2.
Since 0.2 6= 0.15, the events are not independent.
c. P(A|B) = P(A∩B)P(B) = 0.15
0.5 = 0.3.
2. a.
0.8+P(B)−0.8P(B) = 0.9
0.2P(B) = 0.1
P(B) = 0.5
b. P(B∩A′) = P(B)−P(B∩A) = 0.5−0.8×0.5 = 0.1
892
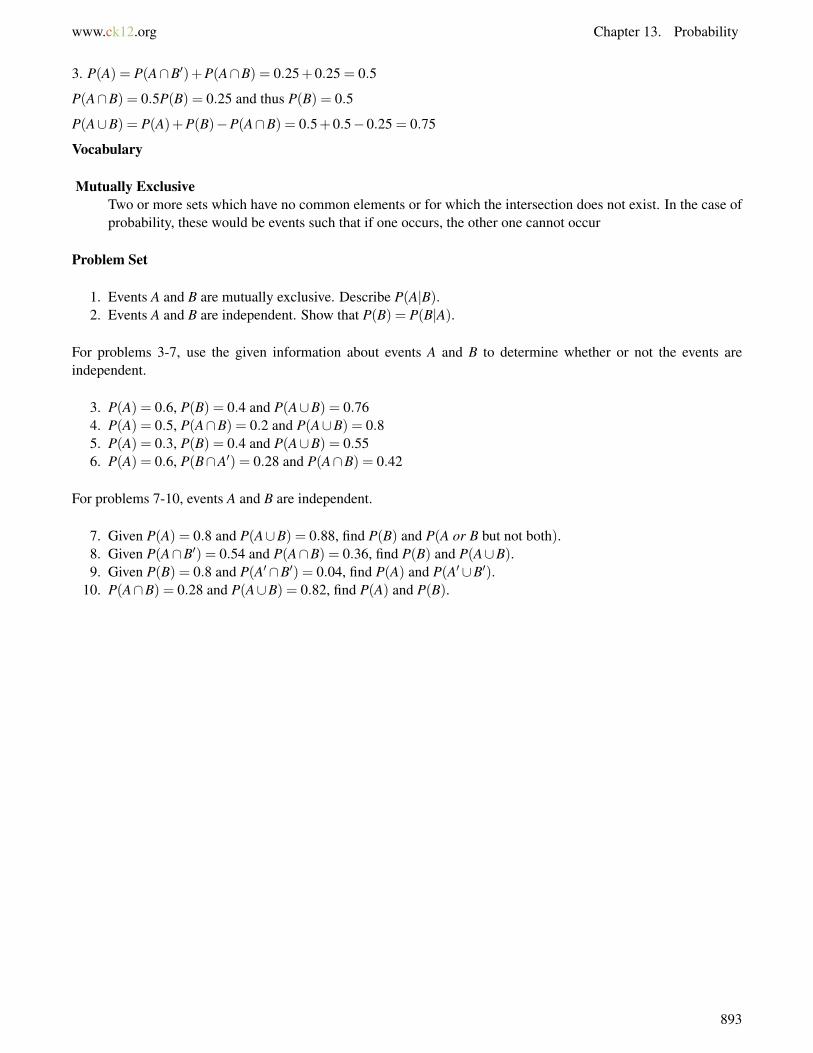
www.ck12.org Chapter 13. Probability
3. P(A) = P(A∩B′)+P(A∩B) = 0.25+0.25 = 0.5
P(A∩B) = 0.5P(B) = 0.25 and thus P(B) = 0.5
P(A∪B) = P(A)+P(B)−P(A∩B) = 0.5+0.5−0.25 = 0.75
Vocabulary
Mutually ExclusiveTwo or more sets which have no common elements or for which the intersection does not exist. In the case ofprobability, these would be events such that if one occurs, the other one cannot occur
Problem Set
1. Events A and B are mutually exclusive. Describe P(A|B).2. Events A and B are independent. Show that P(B) = P(B|A).
For problems 3-7, use the given information about events A and B to determine whether or not the events areindependent.
3. P(A) = 0.6, P(B) = 0.4 and P(A∪B) = 0.764. P(A) = 0.5, P(A∩B) = 0.2 and P(A∪B) = 0.85. P(A) = 0.3, P(B) = 0.4 and P(A∪B) = 0.556. P(A) = 0.6, P(B∩A′) = 0.28 and P(A∩B) = 0.42
For problems 7-10, events A and B are independent.
7. Given P(A) = 0.8 and P(A∪B) = 0.88, find P(B) and P(A or B but not both).8. Given P(A∩B′) = 0.54 and P(A∩B) = 0.36, find P(B) and P(A∪B).9. Given P(B) = 0.8 and P(A′∩B′) = 0.04, find P(A) and P(A′∪B′).
10. P(A∩B) = 0.28 and P(A∪B) = 0.82, find P(A) and P(B).
893