Genuine Parts Company - Amazon S3 · Genuine Parts Company, founded in 1928, is a service...
48
Genuine Parts Company 2007 annual report 8 0 y e a r s o f p r o g r e s s
Transcript of Genuine Parts Company - Amazon S3 · Genuine Parts Company, founded in 1928, is a service...

Genuine Parts Company2007 annual report
80 years of progress

IncomeBefore Shareholders’Year NetSales IncomeTaxes IncomeTaxes NetIncome EquityEndofYear1928 $ 75,129 $ -2,570 $ - $ -2,570 $ 38,7561929 227,978 8,027 599 7,428 49,8371930 339,732 15,666 1,158 14,508 60,5911931 402,463 21,516 1,857 19,659 78,0971932 482,525 16,839 2,787 14,052 90,1871933 629,751 34,614 6,160 28,454 109,0251934 904,580 52,115 10,159 41,956 149,1761935 1,035,477 38,503 7,140 31,363 171,2381936 1,299,185 70,234 13,187 57,047 185,1191937 1,520,199 72,622 17,647 54,975 240,1401938 1,858,252 78,305 18,185 60,120 358,6211939 3,180,241 136,902 27,320 109,582 476,7501940 3,928,342 176,301 50,505 125,796 623,5211941 6,109,724 348,690 149,020 199,670 738,5361942 6,592,707 337,252 204,234 133,018 859,4491943 8,205,316 430,634 260,084 170,550 1,032,1821944 10,084,893 489,547 310,082 179,465 1,202,9551945 11,355,633 532,944 323,302 209,642 1,415,9741946 19,237,291 1,621,541 650,060 971,481 2,379,0011947 18,531,472 1,088,967 429,045 659,922 3,029,3341948 20,729,280 1,176,590 438,498 738,092 4,005,9101949 19,845,875 1,067,096 420,175 646,921 4,372,8311950 24,447,042 1,454,832 636,275 818,557 4,966,0861951 26,244,669 1,168,405 601,386 567,019 5,325,5611952 28,468,962 1,416,235 744,330 671,905 5,647,5531953 29,731,105 1,408,213 736,190 672,023 6,022,0771954 30,744,504 1,642,148 864,331 777,817 6,449,8941955 34,073,288 1,921,777 1,020,148 901,629 7,001,5231956 41,325,377 2,473,384 1,309,667 1,163,717 7,815,2411957 48,140,313 3,328,598 1,752,800 1,575,798 8,969,2721958 56,504,293 4,251,175 2,261,582 1,989,593 10,807,3201959 71,581,580 6,001,005 3,165,042 2,835,963 13,285,2151960 75,010,726 5,661,551 2,988,000 2,673,551 14,967,6971961 80,533,146 6,491,113 3,481,000 3,010,113 17,142,6871962 90,248,450 7,107,524 3,795,000 3,312,524 19,213,2731963 96,651,445 7,210,807 3,850,000 3,360,807 21,189,8801964 120,313,692 9,324,827 4,620,000 4,704,827 29,268,2891965 171,545,228 12,262,510 5,890,000 6,372,510 45,565,9261966 175,132,785 12,409,363 6,030,000 6,379,363 47,308,1631967 204,893,008 14,918,758 7,272,000 7,491,411 55,679,2561968 245,443,798 19,330,334 10,362,000 8,794,941 63,649,2751969 303,455,677 24,228,557 13,240,000 10,778,467 77,437,6791970 340,036,395 28,163,228 14,600,000 13,290,852 85,290,9451971 387,138,252 33,897,667 16,966,000 16,535,006 95,476,1471972 450,500,768 36,104,767 18,200,000 17,567,931 108,053,4651973 501,189,438 42,088,098 21,280,000 20,341,677 121,548,6381974 572,833,282 50,234,298 25,408,000 24,005,057 137,156,9651975 678,353,280 63,552,088 32,650,000 29,981,108 163,092,9411976 846,192,692 79,321,897 40,538,000 37,763,166 206,861,4021977 942,958,756 88,365,511 44,918,000 42,243,015 233,641,2921978 1,148,632,000 105,070,000 53,429,000 50,263,000 275,127,0001979 1,337,468,000 121,953,000 58,808,000 61,715,000 320,706,0001980 1,431,713,000 133,996,000 64,545,000 67,833,000 359,889,0001981 1,584,642,000 154,271,000 74,471,000 77,543,000 410,689,0001982 1,936,524,000 193,560,000 92,552,000 100,167,000 581,915,0001983 2,068,231,000 200,822,000 97,188,000 103,634,000 636,218,0001984 2,303,594,000 234,713,000 115,046,000 119,667,000 701,113,0001985 2,332,544,000 245,203,000 118,962,000 126,241,000 729,231,0001986 2,394,072,000 240,565,000 119,013,000 121,552,000 758,493,0001987 2,606,246,000 262,068,000 113,776,000 148,292,000 760,256,0001988 2,941,963,000 290,445,000 109,072,000 181,373,000 863,159,0001989 3,161,198,000 321,877,000 122,389,000 199,488,000 971,764,0001990 3,319,394,000 333,219,000 126,623,000 206,596,000 1,033,100,0001991 3,434,642,000 335,027,000 127,350,000 207,677,000 1,126,718,0001992 3,668,814,000 353,998,000 134,210,000 219,788,000 1,235,366,0001993 4,384,294,000 425,829,000 166,961,000 257,813,000 1,445,263,0001994 4,858,415,000 474,868,000 186,320,000 288,548,000 1,526,165,0001995 5,261,904,000 510,794,000 201,626,000 309,168,000 1,650,882,0001996 5,697,592,000 545,233,000 215,157,000 330,076,000 1,732,054,0001997 5,981,224,000 565,600,000 223,203,000 342,397,000 1,859,468,0001998 6,587,576,000 589,117,000 233,323,000 355,794,000 2,053,332,0001999 7,950,822,000 628,067,000 250,445,000 377,622,000 2,177,517,0002000 8,369,857,000 646,750,000 261,427,000 385,323,000 2,260,806,0002001 8,220,668,000 603,813,000 242,289,000 361,524,000 2,345,123,0002002 8,258,927,000 605,736,000 238,236,000 367,500,000 2,130,009,0002003 8,449,300,000 571,743,000 218,101,000 353,642,000 2,312,283,0002004 9,097,267,000 635,919,000 240,367,000 395,552,000 2,544,377,0002005 9,783,050,000 709,064,000 271,630,000 437,434,000 2,693,957,0002006 10,457,942,000 770,916,000 295,511,000 475,405,000 2,549,991,0002007 10,843,195,000 816,745,000 310,406,000 506,339,000 2,716,716,000FinancialinformationasreportedintheCompany’sannualreports(includesdiscontinuedoperations)*Excludesfacilityconsolidationandimpairmentcharges**Excludescumulativeeffectadjustment
* * * ** **

Genuine Parts Company, founded in 1928, is a service organization
engaged in the distribution of automotive replacement parts, industrial
replacement parts, office products and electrical/electronic materials.
The Company serves numerous customers from more than 2,000
operations and has approximately 32,000 employees.
Business Segments at a Glance - 2 Letter to Our Shareholders - 4 Business Narratives - 6 Selected Financial Data - 13 Stock Performance - 14
Segment Data - 15 Management’s Discussion and Analysis - 16 Report of Management - 24 Reports of Independent Registered Public Accountants - 25
Consolidated Balance Sheets - 26 Consolidated Statements of Income - 27 Consolidated Statements of Shareholders’ Equity - 28 Consolidated
Statements of Cash Flows - 29 Notes to Consolidated Financial Statements - 30 Officers - 42 Board of Directors - 44 Shareholder Information - IBC
Financial Highlights
2007 Increase 2006 Increase 2005
NetSales $ 10,843,195,000 4% $10,457,942,000 7% $9,783,050,000IncomeBeforeIncomeTaxes 816,745,000 6% 770,916,000 9% 709,064,000IncomeTaxes 310,406,000 5% 295,511,000 9% 271,630,000NetIncome 506,339,000 7% 475,405,000 9% 437,434,000Shareholders’Equity 2,716,716,000 7% 2,549,991,000 -5% 2,693,957,000RateEarnedonShareholders’EquityattheBeginningoftheYear 19.9% - 17.6% - 17.2%AverageCommonSharesOutstanding- AssumingDilution 170,135,000 - 172,486,000 - 175,007,000PerCommonShare: DilutedNetIncome $2.98 8% $2.76 10% $2.50 DividendsDeclared $1.46 8% $1.35 8% $1.25
GPC Net Sales by Segment
automotive - 49 percent
motion industries - 31 percent
sp richards - 16 percent
eis - 4 percent
80 years of progress
1

The Automotive Parts Group, the largest division of GPC, distributes automotive
replacement parts, accessory items and service items.
Locations in the U.S.: 58 NAPADistributionCenters 4 BalkampDistributionCenters 4 RaylocFacilities 2 AltromImportPartsDistributionCenters 8 HeavyVehiclePartsDistributionCentersandFacilities 1,100 CompanyOwnedNAPAAUTOPARTSstores in Canada: 245 NAPA/UAPandHeavyVehicleFacilities in Mexico: 16 AutoTodoFacilities
Intotal,servesapprox.5,800NAPAAUTOPARTSstoresthroughouttheU.S.andover670wholesalersinCanada.
Market Emphasis:OffersabroadassortmentofautomotiverelatedproductsandservicestobothWholesale/Do-it-for-MeandRetail/Do-it-Yourselfcustomers.
Major Products:Accesstoover375,000itemsincluding:AutomotiveReplacementParts FarmandMarineSuppliesPaintandRefinishingSupplies ToolsandEquipmentAutomotiveAccessories HeavyDutyParts
Theseproductscoversubstantiallyalldomesticandforeignmotorvehiclemodels.
Web site:napaonline.com Headquarters:Atlanta,Georgia
industrial parts group
31%of total GPC net sales
2
The Industrial Parts Group offers access to nearly 3 million industrial replacement
(MRO) parts. Customers represent virtually all industry segments, including
automotive; food; forest products; primary metal; paper; mining; petrochemical;
and pharmaceutical.
Locations in U.S., Puerto Rico and Canada: 10DistributionCenters 470Branches 35ServiceCenters
Market Emphasis:Serveswellover100,000industrialcompaniesthroughoutNorthAmericaandinallindustrysegments.
Service Capabilities Include:24/7/365productdelivery ApplicationanddesignRepairandfabrication InventorymanagementandLogisticsQualityprocesses(ISO) TrainingprogramsTechnicalexpertise E-businesstechnologiesAssetrepairtracking Storeroomandreplenishmenttracking
Major Products:Bearings MechanicalPowerTransmissionIndustrialAutomation HoseHydraulicandPneumaticComponents MaterialHandlingIndustrialSupplyProducts
Web site:motionindustries.com Headquarters:Birmingham,Alabama
automotive parts group
49%of total GPC net sales

officeproducts group
16%of total GPC net sales
electrical/electronic materials group
3%of total GPC net sales
3
The Office Products Group distributes over 40,000 business products from 44 distribution centers in the U.S. and Canada. Sells through a network of thousands of customers, including independent business product resellers, large contract stationers, national office supply superstores, mail order distributors and Internet resellers.
locations: 37 Full-StockingDistributionCenters 2 FurnitureOnlyDistributionCenters 5 S.P.RichardsCanadaDistributionCenters
Market Emphasis:Makesavailableforresalemostproductsusedinbusinessorbybusiness.AllowstheCompany’sresellerstobecomethesinglesourceforthebusinessproductsenduser.
Major Products:FilingandGeneralOfficeSupplies OfficeFurnitureCleaningandBreakroomSupplies ConsumerElectronicsTechnologySuppliesandAccessories SchoolSuppliesBusinessMachines WritingInstrumentsDeskAccessories PaperProductsHealthcareSupplies Safety&IndustrialProducts
proprietary brands of Products:SparcoBrandofficesupplies LorellofficefurnitureCompucessorycomputeraccessories EliteImageprintersuppliesNatureSaverrecycledpaperproducts IntegrawritinginstrumentsGenuineJoecleaningandbreakroomsuppliesAtlanticBreezeandHeatRunnerclimatecontrolproducts
Web site:sprichards.com Headquarters:Atlanta,Georgia
electrical/electronic materials group
4%of total GPC net sales
The Electrical/Electronic Materials Group distributes process materials,
production supplies, industrial MRO and value added fabricated parts.
Primary markets are the electrical OEM, apparatus repair and assembly
markets. Products range from insulating and conductive materials to
assembly tools, test equipment, safety and shop supplies, industrial
products and customized parts.
Locations in U.S., Puerto Rico, Dominican Republic, Mexico and Canada:
31Branchesand3FabricationFacilities
Market Emphasis:Bystockingabroadproductlinelocally,offeringavarietyofinven-torymanagementsolutionsandprovidingvalue-addedcustom-engineeredproducts,EISispositionedasthesinglesourcesuppliertoelectricalandelectronicassemblymanufacturersthroughoutNorthAmerica.
Major Products:Suppliesover100,000criticalproductsincluding:Adhesives,SiliconeandEncapsulants MagnetWireHandTools/SolderingEquipment PressureSensitiveTapesStaticControlProducts EMI/RFIShieldingInsulatingPapers MotorsandBearingsSolderandChemicals VarnishandResinsIndustrialMROMaterials
Web site:eis-inc.com Headquarters:Atlanta,Georgia
office products group
16%of total GPC net sales
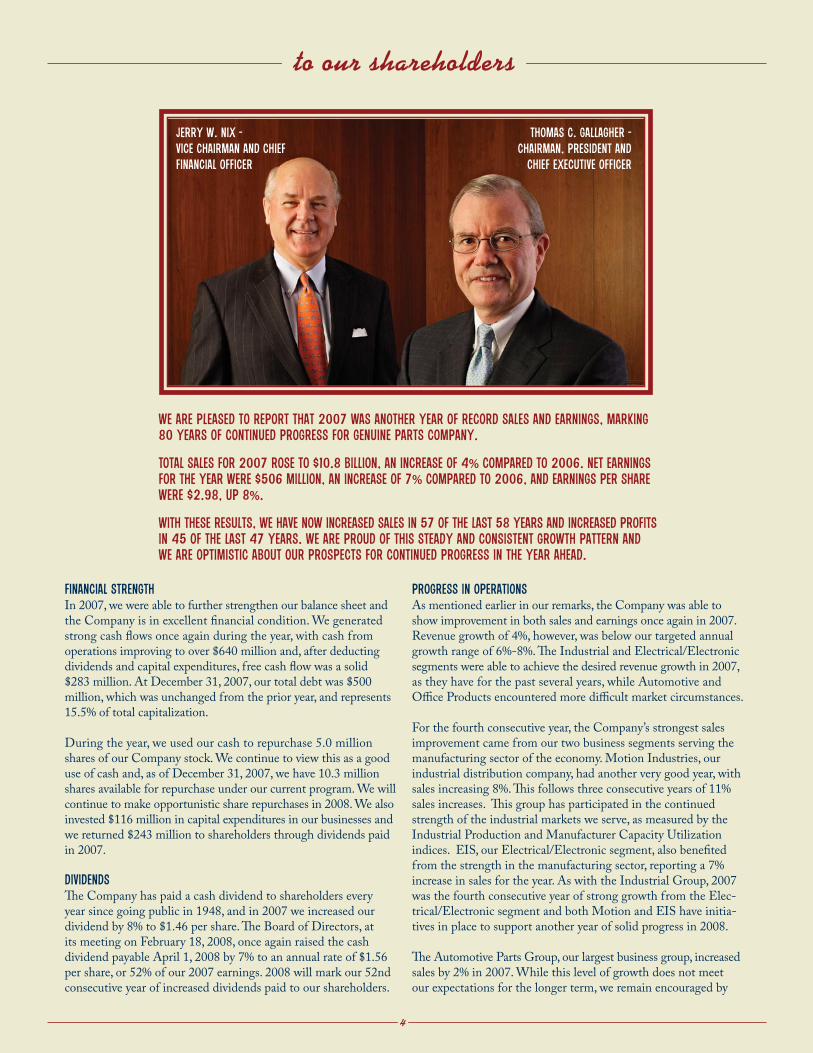
We are pleased to report that 2007 was another year of record sales and earnings, marking
80 years of continued progress for Genuine Parts Company.
Total sales for 2007 rose to $10.8 billion, an increase of 4% compared to 2006. Net earnings
for the year were $506 million, an increase of 7% compared to 2006, and earnings per share
were $2.98, up 8%.
With these results, we have now increased sales in 57 of the last 58 years and increased profits
in 45 of the last 47 years. We are proud of this steady and consistent growth pattern and
we are optimistic about our prospects for continued progress in the year ahead.
to our shareholders
Financial Strength
In2007,wewereabletofurtherstrengthenourbalancesheetandtheCompanyisinexcellentfinancialcondition.Wegeneratedstrongcashflowsonceagainduringtheyear,withcashfromoperationsimprovingtoover$640millionand,afterdeductingdividendsandcapitalexpenditures,freecashflowwasasolid$283million.AtDecember31,2007,ourtotaldebtwas$500million,whichwasunchangedfromtheprioryear,andrepresents15.5%oftotalcapitalization.
Duringtheyear,weusedourcashtorepurchase5.0millionsharesofourCompanystock.Wecontinuetoviewthisasagooduseofcashand,asofDecember31,2007,wehave10.3millionsharesavailableforrepurchaseunderourcurrentprogram.Wewillcontinuetomakeopportunisticsharerepurchasesin2008.Wealsoinvested$116millionincapitalexpendituresinourbusinessesandwereturned$243milliontoshareholdersthroughdividendspaidin2007.
Dividends
TheCompanyhaspaidacashdividendtoshareholderseveryyearsincegoingpublicin1948,andin2007weincreasedourdividendby8%to$1.46pershare.TheBoardofDirectors,atitsmeetingonFebruary18,2008,onceagainraisedthecashdividendpayableApril1,2008by7%toanannualrateof$1.56pershare,or52%ofour2007earnings.2008willmarkour52ndconsecutiveyearofincreaseddividendspaidtoourshareholders.
Progress In Operations
Asmentionedearlierinourremarks,theCompanywasabletoshowimprovementinbothsalesandearningsonceagainin2007.Revenuegrowthof4%,however,wasbelowourtargetedannualgrowthrangeof6%-8%.TheIndustrialandElectrical/Electronicsegmentswereabletoachievethedesiredrevenuegrowthin2007,astheyhaveforthepastseveralyears,whileAutomotiveandOfficeProductsencounteredmoredifficultmarketcircumstances.
Forthefourthconsecutiveyear,theCompany’sstrongestsalesimprovementcamefromourtwobusinesssegmentsservingthemanufacturingsectoroftheeconomy.MotionIndustries,ourindustrialdistributioncompany,hadanotherverygoodyear,withsalesincreasing8%.Thisfollowsthreeconsecutiveyearsof11%salesincreases.Thisgrouphasparticipatedinthecontinuedstrengthoftheindustrialmarketsweserve,asmeasuredbytheIndustrialProductionandManufacturerCapacityUtilizationindices.EIS,ourElectrical/Electronicsegment,alsobenefitedfromthestrengthinthemanufacturingsector,reportinga7%increaseinsalesfortheyear.AswiththeIndustrialGroup,2007wasthefourthconsecutiveyearofstronggrowthfromtheElec-trical/ElectronicsegmentandbothMotionandEIShaveinitia-tivesinplacetosupportanotheryearofsolidprogressin2008.
TheAutomotivePartsGroup,ourlargestbusinessgroup,increasedsalesby2%in2007.Whilethislevelofgrowthdoesnotmeetourexpectationsforthelongerterm,weremainencouragedby
jerry w. nix -
vice chairman and chief
financial officer
thomas c. gallagher -
chairman, president and
chief executive officer
4

thisgroup’sdrivetogeneratepositiveandconsistentsalesgrowthintheyearahead.Demandintheautomotiveaftermarkethasbeenimpactedbymacro-economictrends,includinghighgaspricesanditseffectonmilesdrivenandconsumerspending.Althoughwecurrentlyexpecttheseeconomicconditionstoremainmuchthesamein2008,specificplanstogrowsalesareinplaceand,withgoodexecutionoftheseinitiatives,weanticipateasolidperfor-mancefromtheAutomotivesegmentinthecomingyear.
S.P.Richards,ourOfficeProductsGroup,reporteda1%decreaseinsalesfortheyear,reflectingweakdemandintheoverallofficeproductsindustry.Ourprimarychallengewasdepressedactivitywithournationalaccountscustomerbase,whichoffsetoursteadysalesgrowthtoindependentdealersduringtheyear.Historically,theOfficeProductsGrouphasbeenoneofourmostconsistentandsteadyperformersamongourfourbusinesses,andweexpecttoseegradualstrengtheningintheofficeproductsindustryin2008.Thisanticipatedindustryimprovement,combinedwiththeproperexecutionofourgrowthinitiatives,willhelpdrivestrongerresultsfortheOfficeProductsGroupintheyearahead.
Althoughweexperiencedmixedresultsamongourbusinesssegmentsthispastyear,wearepleasedtooperateinfouressentialandgrowingindustries.Webelievethatthisdiversificationprovidesusexcellentbalancewhenwelookatthecompanyasawholeandasweplanforfuturegrowth.
Management
During2007,therewereanumberofmanagementchangesandpromotionsthatwewouldliketosharewithyou.EffectiveJune2007,PaulD.DonahuejoinedtheGPCHeadquartersstaffandatourAugust2007BoardmeetinghewaselectedExecutiveVicePresidentoftheCompany.Previously,PaulwasPresidentandChiefOperatingOfficerofS.P.RichardsCompany,ourofficeproductsbusiness.AsExecutiveVicePresident,Paulisinvolvedintheactivitiesatseveralofourautomotivebusinessesinadditiontohisworkwithourglobalsourcinginitiative.CharlesA.ChesnuttalsomovedtoGPCheadquartersin2007andattheAugustBoardmeetinghewaselectedSeniorVicePresident,TechnologyandProcessImprovement.CharliewaspreviouslytheChiefFinancialOfficeratEIS,ourElectrical/Electronicsegment.Inhisnewrole,heisengagedincorporatewideITandtelecommunicationinitiativesaswellasprocessimprovementprogramsacrossGPC.WearepleasedtohavePaulandCharlieinthesekeyleadershippositionsandwelookforwardtotheirfuturecontributions.
IntheAutomotivePartsGroup,DanielF.AskeyhasbeenpromotedtoSeniorVicePresident,Sales,effectiveAugust2007.DanjoinedtheCompanyin1979andhasheldavarietyofimportantautomo-tivepositionsovertheyears,includinghismostrecentroleastheU.S.APGWesternGroupVicePresident.EffectiveJanuary2008,ScottW.LeProhonjoinedtheAutomotivePartsGroupasSeniorVicePresident,MerchandisingandProductStrategy.ScottstartedwiththeCompanyin1987andhasdoneanoutstandingjobinhismanyautomotiveassignments,mostrecentlyatBalkamp,wherehewasPresident.ReplacingScottasPresidentofBalkampisTipTollison,amemberoftheGPCteamsince1977and,priortothispromotion,Balkamp’sExecutiveVicePresident,Administration.Dan,ScottandTipareverytalentedandwellpreparedfortheirnewduties.
Inanotherkeyautomotivemove,GarySilvawaspromotedtoPresidentoftheHeavyVehiclePartsGroup,effectiveDecember2007.SincejoiningtheCompanyin1985,Garyhasservedinnumerousautomotivepositionsandwithhisexpertiseinsales,productsourcingandbusinessdevelopment,wearepleasedtohavehimleadingthiskeyareaofgrowthforGPC.
AtEIS,RobertR.Gannon,ExecutiveVicePresident,retiredfromtheCompanyinMay2007.BobjoinedEISin1985andheldmanyimportantmanagementrolesoverhis22-yearcareerwiththeCompany.WethankBobforhisvaluedcontributionsandwishhimallthebestinhisretirement.ToreplaceBob,AlexanderGonzalezwaspromotedtoSeniorVicePresident,ElectricalandAssembly.AlexbeganhiscareeratEISin1989andhassuccess-fullyheldavarietyofkeysalesandmanagementpositionswiththeCompany.Also,MatthewC.TyserjoinedEISinOctober2007toreplaceCharlieChesnuttasChiefFinancialOfficer.MattcametoEISwithmorethan20yearsoffinancialmanagementexperienceandisagreatadditiontotheEISteam.
Conclusion
Asweenter2008,werecognizethatwefaceamoreuncertaineconomicenvironment.However,ourgrowthplanshavebeenbuiltwiththisinmind,ashaveourOperatingInitiatives,AssetManagementandWorkingCapitalprograms.ContinuedprogressineachoftheseareasisatoppriorityfortheGPCManagementTeamandyoucanreadmoreabouttheindividualinitiativesineachofthefourbusinesssegmentsinthepagesthatfollow.
Inclosing,wewanttoexpressourappreciationtoouremployees,customers,vendorsandshareholdersforyourcommitmenttoandongoingsupportofGenuinePartsCompany.
Respectfullysubmitted,
ThomasC.Gallagher JerryW.NixChairman,Presidentand ViceChairmanandChiefExecutiveOfficer ChiefFinancialOfficer
February29,2008
1.16 1.18 1.201.25
1.35
1.001.04
1.101.14
5
Dividends per sharein dollars
1.46
98 99 00 01 02 03 04 05 06 07
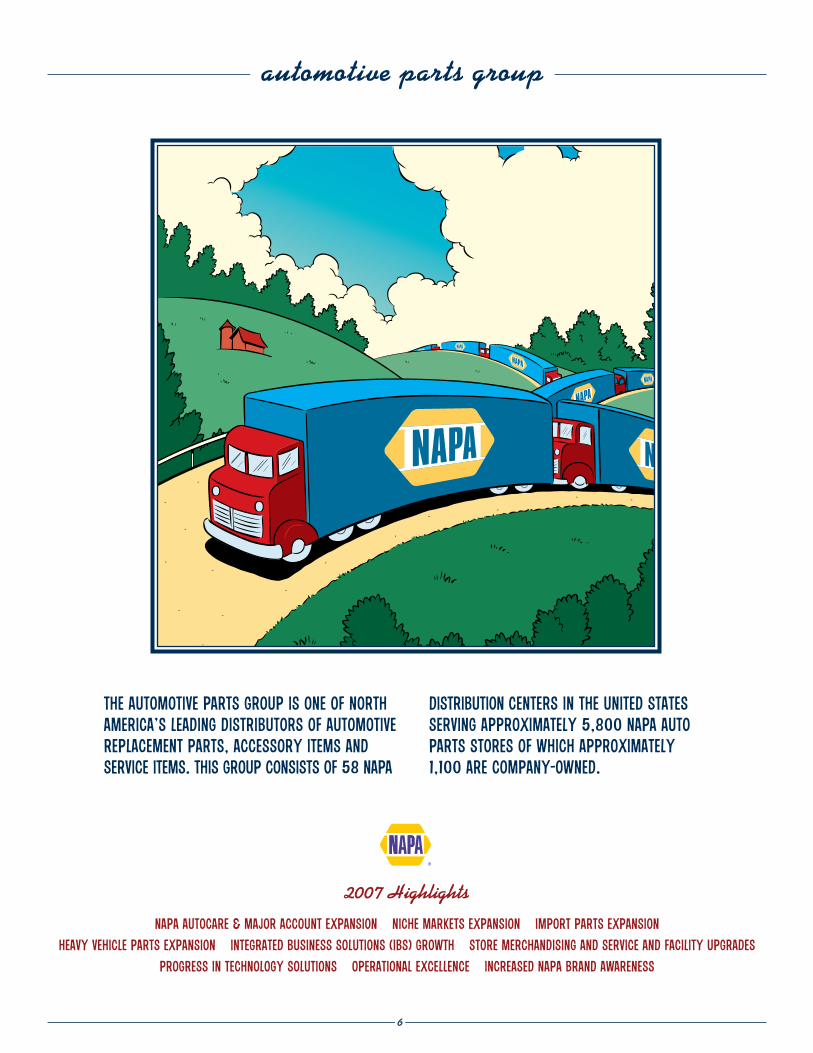
automotive parts group
The Automotive Parts Group is one of North
America’s leading distributors of automotive
replacement parts, accessory items and
service items. This group consists of 58 NAPA
Distribution Centers in the United States
serving approximately 5,800 NAPA AUTO
PARTS stores of which approximately
1,100 are company-owned.
2007 Highlightsnapa autocare & major account expansion niche markets expansion import parts expansion
heavy vehicle parts expansion integrated business solutions (ibs) growth store merchandising and service and facility upgrades
progress in technology solutions operational excellence increased napa brand awareness
6

TheAutomotivePartsGroupalsoincludesBalkamp,Inc.,amajority-ownedsubsidiarythatpurchases,packagesanddistributesover40,000serviceandsupplyitemsthroughtheNAPAsystem.UnderthenameRayloc,weoperatefourfacilitieswhereautomotivepartsareremanufacturedanddistributedthroughtheNAPAsystem.
Thisyear,ourU.S.platformwasexpandedfurtherwithourHeavyDutyandImportPartsoperations.WecurrentlyoperateoneheavyvehiclepartsdistributioncenterunderthenameTractionandtwoimportpartsdistributioncentersunderthenameAltrom.
OutsidetheU.S.,weoperateNAPACanada/UAPInc.,oneofCanada’sleadingautomotivedistributorsaswellasCanada’slargestindependentheavyvehiclepartsdistributor.TheoperatingprogramsandmarketinginitiativesutilizedinourCanadianoperationsarefullyintegratedwithourU.S.NAPAsystem.WearerepresentedinMexicobyAutoTodo,oneofthatcountry’slargestautomotiveaftermarketorganizations.WeareencouragedbytheprospectsofcontinuedgrowththroughouttheNorthAmericanmarketsweserve.
2007 PerformanceTheAutomotivePartsGroupposteda2%increaseinrevenuein2007,consistentwithoursalesgrowthin2006.Weremainencouragedbythisgroup’sabilitytogeneratepositivesalesgrowthovertheseperiods,asdemandintheautomotiveaftermarkethasbeenimpactedbymacro-economictrends,includinghighgaspricesanditseffectonmilesdrivenandconsumerspending.Ongoingsalesgrowthinitiatives,combinedwitheffectivecostmanagement,supportoureffortstoconsistentlyimproveouroperatingperformance.
Automotive AftermarketThegrowingautomotiveaftermarketindustryiscurrentlyestimatedat$89billion.TheWholesaleorDo-it-for-Me(DIFM)marketrepresentsprofessionalserviceandrepairfacilitiesandaccountsforanestimated75%oftheindustry.TheRetailmarketrepresentstheDo-it-Yourself(DIY)customerandisapproximately25%oftheindustry.TheAutomotivegroupworksinconcertwithourNAPAAUTOPARTSstorestocontinuallygrowourbusinesswithbothwholesaleandretailcustomers.
Wholesale ProgramsOvertheyears,NAPAhasdevelopedasignificantnumberofprogramofferings,whichwebelievebestmeetthedemandsofourwholesalecustomers.ExamplesincludeNAPAAutoCare,NAPACollisionCentersandNAPATruckServiceCenterprograms,whicheachprovidebusinesstoolsandsupporttooneofthenation’slargestindependentautomotiveserviceandrepairnetworks.TheNAPAMajorAccountsProgramassiststheNAPAAUTOPARTSstoresinsecuringpreferredvendoragreementswithnationallyrecognizedcompanies.In2007,theautomotivegroupwonseveralnewandsignificantsupplyagreementsthroughthisprogram.IntegratedBusinessSolutions(IBS)isasophisticatedinventorymanagementservicethateffectivelyhandlestheinventoryprocurementandstockingrequire-mentsforlargerwholesalecustomers,includingselectAutoCareCenters.WeweresuccessfulinsecuringanumberofnewIBScontractsduringtheyearandprospectsforcontinuedexpansionofthisservicearepromising.
Specialty MarketsWearealsofocusedonthespecialtymarketscomponentofourwholesalebusinessandwecontinuetoinvestintrainedpersonnel,tailoredinventoryandaggressivepromotion.Specializedmarketssuchasheavyduty,paint,body&equipment,farmandmarine,tools&equipmentandimportpartsofferusmanygrowthopportunities.Thisyear,weopenedourfirstdistribu-tioncenterdedicatedtoreplacementpartsforheavydutytrucksandtrailers.Inaddition,wecurrentlyhavetwodistributioncenterslocatedintheU.S.,dedicatedtooriginalequipmentimportparts.
StoresWecontinuetopositionourNAPAAUTOPARTSstorebaseinmarketareaswhereweanticipatesignificantgrowthopportunities.Wealsoaimto
createaninvitingshoppingexperiencefortheDIYcustomerandsupportourcompleteanddominantproductoffering.Toaccomplishthis,wearefocusedoninitiativessuchasimprovedstoremerchandising,in-storeserviceandfacilityupgrades.Ensuringeffectiveandconsistentplanograms,competitiveretailpricing,convenientretailhours,well-trainedpersonnelandstoreupgradesandresetsalsohelpdrivethegrowthofourretailbusi-ness.Inaddition,ourproprietarystoreinventorymanagementsystem,MarketplaceInventoryClassification(MIC),providesthedatanecessarytoaccuratelyaligneachstore’sinventorywithitsspecificmarket.
Technology SolutionsTechnologyandconnectivityremainessentialelementsinourcustomerservicestrategy.TherolloutofnewandimprovedtechnologyhasbetterenabledNAPAandNAPAAUTOPARTSstorestoconductbusinesswithbothretailandwholesalecustomers.TheNAPAWideAreaNetwork(WAN)connectsthousandsofstoresandprovidesbusiness-buildingtoolsforboththeNAPAstoresandtheircommercialaccounts.Inaddition,NAPATRACS,aleadingshopmanagementsystem,providesrepairestimating,managementandtechnicalsolutionsforanywholesalecustomer.Italsocontainselectronicordering,eProcurementand24/7accesstotheon-lineNAPAPartsPROcatalog,whichhasover375,000partsandproductimages,amongotherinformation.OthertechnologicalapplicationsatNAPAincludeNAPAONLINE.com,usedprimarilybyourretailcustomers,andNAPAPROLinkandNAPAWebConnectCRM,usedbyourwholesalecustomers.
Operational ExcellenceTheAutomotivePartsGroupcontinuestoshowprogressinrealizingmoreefficientandcosteffectiveoperations.ViaOperationalExcellence,wehavemadeanumberofwarehouseproductivityenhancements,improvedourcustomerserviceanddevelopedevenmoremeaningfulcriteriaformanag-ingsupplychaincosts.Ongoingprogressintheseareasaswellasmanyothersremainsanimportantpartofouroverallstrategy.
NAPA BrandTheNAPAbrandiswidelyrecognizedbyNorthAmericanconsumersandprofessionaltechniciansanditscontinuedstrengthgivesusacompetitiveadvantageintheindustry.Ournationalandlocaladvertisingisdesignedtorein-forcethisawarenessofNAPAandbuildonthebenefitsofqualityparts,qualityserviceandknowledgeablepeople.TheNAPAadvertisingprogramdelivershighvisibilityexposurethroughnationaltelevision,radio,printandinternetadvertising,targetedsponsorshipsandhigh-qualitylocaladvertisingmaterials.
2008 OutlookWeseeopportunitiesforadditionalgrowthintheAutomotivePartsGroupin2008.Althoughwecurrentlyexpectthemacroeconomicconditionstoremainmuchthesameagainin2008,ourinitiativestogrowsalesandcontrolcostsareinplacetoimprovethisgroup’soperatingperformanceandfurtherstrengthenourleadershippositionintheindustry.
7
automotive parts group net salesin billion of dollars
4.48
03 04 05 06 07
4.74
5.01
5.19
5.31

industrial parts group
Motion Industries is a leading North American
industrial distributor of MRO (Maintenance,
Repair, and Operations) products including
bearings, mechanical power transmission, indus-
trial automation, hose, hydraulic and pneumatic
components, industrial products and material
handling. We provide a comprehensive product
offering and specialized services to well over
100,000 customers in virtually all industry
segments, including the automotive, food, forest
products, primary metal, paper, mining, energy,
petrochemical and pharmaceutical industries.
2007 Highlights8% increase in revenues Strengthened joint supplier initiatives product line expansion
targeted industries branch expansion acquisitions specialized service offerings operational excellence
8

MotionIndustriesended2007with515locationsconsistingof470branches,10distributioncentersand35servicecentersthroughouttheU.S.andCanada.Throughthisextensiveoperatingnetwork,ourcustomershaveaccesstooverthreemillionqualityparts,sourcedfromaglobalmanufacturingbase.OurNorthAmericannetworkenablesusto“DelivertheDifference”toourcustomersbyprovidingMROproductsandservicesthatdistinguishMotionfromthecompetition.
2007 Performance
MotionIndustrieshadanotherverygoodyearin2007,withsalesincreasing8%followingthreeconsecutiveyearsof11%revenuegrowth.Wehaveparticipatedinthecontinuedstrengthoftheindustrialmarketsweservethroughinitiativessuchasproductlineexpansion,targetedindustryprograms,branchexpansionandacquisitions.OurongoingemphasisonthesesalesinitiativesarecomplementedbyoureffortstoenhanceoperationsbyincreasingproductivityandreducingcostsviaourOperationalExcellenceinMotionprogram.SuccessintheseareashelpedusachieveanotheryearofimprovedoperatingperformanceatMotionIndustries.Services and Solutions
Motionfeaturesexpeditiousproductdeliveryandservicefromourdistributionfacilities.Wealsoprovidecustomerswithexpertrepairandfabricationservicesaswellasinventorymanagementandlogisticssolutions.Inaddition,ourhighlytrainedstaffofover1,400salesrepresentativesand200fieldproductspecialistsprovidescustomerswithon-sitetechnicalassistance,partsandservicesolutions,andinventoryandcostsavingsconsultations.
Joint Supplier Sales and Marketing Initiatives
Wehavestrengthenedoursalesgrowtheffortthroughjointsuppliersalesandmarketinginitiativestotargetandpromotespecificproductcategoriesintotargetedindustrymarkets.ExamplesincludeindustrysegmentproductpromotionsandTargetingMROmarketdevelop-mentprograms.TheseprogramsarestrategicallydevelopedandexecutedasajointinitiativewithMotionIndustries’suppliersandarecreatedtomeetspecificcustomers’needs.Weareencouragedbythesuccessoftheseprogramsandtheirpotentialtogenerateadditionalrevenuegrowth.
Product Line Expansion & Targeted Industries
WecontinuetoexpandourproductofferingtobetterpositionMotionIndustriesforadditionalsalestocurrentcustomersandgaincoverageforpotentialnewMROmarkets.Overthepastfewyears,wehaveinvestedmoreheavilyinproductcategoriessuchasindustrialautomationproducts.Thiscategoryencompassesafullrangeofproductsolutionsfromelectricaldrivesandcontrols,panelsandprocesscomponents,tothefullintegrationofplantequipment.Inaddition,ourindustrialproductsofferinghasbeensignificantlyexpandedviaseveralacquisitionsand,today,formsourIndustrialProductsGroup.Wearealsopursuingsalesopportunitiesintargetedindustries,whichwebelievewillbenefitfromcurrentmanufacturingtrends,bothgloballyandwithinNorthAmerica.Thisstrategyhasledustoindustrysectorssuchaswastewatertreatment,solidwasterecycling,windpowergeneration,ethanolproduction,railtransportationandports,amongothers.
Branch Expansion and Acquisitions
WecontinuetogrowourgeographicalfootprintinNorthAmericaviabranchexpansionandacquisitions.In2007,weexpandedourdistributionnetworkwithfournewMotionIndustrieslocationsandanadditionaleightlocationsthroughfiveacquisitions.
ThisexpansionallowsMotionIndustriestocaptureandretainbusi-nessintheevolvingmarketsacrossNorthAmerica.OurgrowthstrategyforMotionIndustriesincludesongoingacquisitionsaswellascontinuedbranchexpansion.
Specialized Service Offerings
OurspecializedserviceofferingsincludeCostManagementProcesses(CMP),AssetandRepairTrackingprogram(ART),StoreroomandReplenishmentTracking(START)andourMotionInstituteTrain-ingCenter.CMPdeliversplantsolutionsthroughcostsavingsandproductivityprograms.ARTisdesignedtotrackcustomers’warrantyandrepairinformationandaddsvaluebyallowingourcustomerstostreamlinetheirentirerepairprocessandtrackthestatuswithcus-tomized,on-linereportingcapabilities.STARTaddsvaluebyprovidingsignificanttransactionalefficienciestoplantstoreroommanagement.During2007,theMotionInstituteutilizedliveandwebcasttrainingclassestosuccessfullyeducatethousandsofcustomersandemployeesincurrentindustrialtechnologyandprocesses.
Operational Excellence
TheOperationalExcellenceprogramatMotionIndustriessupportsourgrowthinitiativesthroughmoreefficientandeffectiveoperationsacrossthecompany.OurfocusonOperationalExcellenceservestoreducecostsandenhanceoverallperformanceviaincreasedproduc-tivity.Theendresultsareimprovedprofitabilityandgreatercapabilitiesfor“DeliveringtheDifference”toourcustomers.
Motion’ssystemsande-businesscapabilitiescontinuetoimproveunderthisprogram.MiSupplierConnect,forexample,providesintegrationbetweenMotion’sinformationtechnologynetworkandsuppliers’systems,creatingnumerousbenefitsforboththesupplierandMotion.Likewise,onourinternetsite,motionindustries.com,customershaveaccesstoallthebenefitsofonlinelookupandorderingcapabilities,aswellas24-hourcustomerservice.Internally,MotionIndustries’intranetsite,inMotion,improvesemployeecommunicationsthroughonlineaccesstocurrentannouncements,customerperformanceresults,bestpractices,salestools,andmarket-ingprograms.
2008 Outlook
WeexpectMotionIndustriestoshowsolidprogressagainin2008,supportedbytheongoingsteadydemandfromourmanufacturingcustomerbase,consistentexecutionofourgrowthstrategyandspecialattentiontoourvaluedcustomerrelationships.Werecognizewhatittakestoremainaleaderintheindustryandprovideacom-petitiveadvantageforourcustomersby“DeliveringtheDifference”asaleadingsuppliertotheMROindustrialmarket.
9
industrial parts group net salesin billion of dollars
2.25
03 04 05 06 07
2.512.80
3.11
3.35

office products group
S.P. Richards Company is one of North America’s
leading business products wholesalers, offering
over 40,000 items to thousands of office products
resellers across the U.S. and Canada from a net-
work of 44 distribution centers. the Company’s
vast assortment of business products include
filing and general office supplies, office furniture,
cleaning and breakroom supplies, technology
supplies and accessories, consumer electronics,
school supplies, business machines, writing
instruments, desk accessories, paper products,
healthcare supplies and safety and industrial
products.
2007 HighlightsNew products Product line expansion strong proprietary brands New customer channels Operational excellence
Improved Marketing programs and dealer services enhanced management support tools SPR Advantage Program Benefits
10

office products group net salesin billion of dollars
11
1.46
03 04 05 06 07
1.541.66
1.78 1.77
S.P.Richards’comprehensivearrayofspecializedservices,logisticalcapabilitiesandmarketingprogramscreatevalueforourcustomers,whichincludeindependentresellers,largecontractstationers,nationalofficesupplysuperstores,mailorderdistributorsandInternetresellers.Ourfulfillmentcapabilitiesallowustoservealltypesofresellers,eventhosewithvirtuallystocklessbusinessmodels.Inaddition,ournationaldistribu-tionnetworkenablesresellerstoservetheircustomersonanationwidebasis.Byprovidingconvenientaccesstoabroadrangeofqualityproducts,excellentserviceandinnovativeprograms,wecontinuetoprovideourcustomerswiththetoolstheyneedtosuccessfullygrowtheirbusinesses.
2007 PerformanceDemandintheoverallofficeproductsindustrywasweakin2007andS.P.Richardsfinishedtheyearwithrevenuedown1%from2006.Thisfollowssalesgrowthof7%,8%and6%in2006,2005and2004,respectively,reflectingstrongerbusinessconditionsineachoftheprecedingthreeyears.In2007,theprimarychallengeforusrelatedtodepressedactivitywithournationalaccountscustomerbase.Salestoindependentdealers,ontheotherhand,continuedtoshowsteadygrowthwhencomparedtotheprioryear.Likewise,in2007,wewereabletogrowourrevenuesatS.P.RichardsCanada,whereweaddedanewdistributioncenterinEd-monton,Alberta,expandingourinfrastructuretofivedistributioncentersservingCanada.
Our2007growthinitiativesemphasizedproductlineexpansionandnewproducts,enhancedmarketingmaterialsande-contentandcontinueddevelopmentofnewcustomerchannels.Also,wesignificantlyexpandedourLosAngelesdistributioncenterandrelocatedourSt.Louisopera-tionintoalargerfacilityin2007.WefurtherexpandedournetworkwithaU.S.redistributioncenterthatsupportsS.P.Richards’centralizedpurchasingstrategy,includingourgrowingglobalsourcingprogram. Inaddition,weremainedfocusedoninitiativestostreamlineoperationsandrealizecostsavingsviaOperationalExcellence.Combined,theseinitiativesreflectourongoingeffortstocreatefuturegrowthopportunitiesandfurtherimproveS.P.Richards’operatingperformance.
New Products and Product Line ExpansionS.P.Richardsdistributesabroadrangeofbusinessproductssourcedfromhundredsofleadingmanufacturersworldwide.Thesemanufacturerpartnersprovideinnovation,trainingandcontinuedinvestmentinquality,whichallowfortheongoingrolloutofanexpandedproductofferingtoourcustomers.Thisisanessentialvalueaddedservice,asadynamicproductofferingfurtherstrengthensourresellers’positionasthesinglesourcesolutiontotheircustomers’businessproductsneeds.Thecontin-uedexpansionofourofficefurnitureandemergingproductcategories,suchascleaningandbreakroomsupplies,schoolsuppliesandhealthcareproducts,hashelpedourresellersacquirenewcustomersandfurtherpenetratetheirexistingclientbase.Currently,wearealsoextendingourproductofferingsinavarietyofsafetyandindustrialproducts.
Proprietary BrandsWemeetourcustomers’growingdemandforcompetitivelypricedprod-uctsthroughS.P.Richards’proprietarybrandprogram.Workingcloselywithdomesticsuppliersandleveragingourglobalsourcingcapabilitiesenablesustoprovideourresellersabroadofferingofproductsthatdeliverbothqualityandvalue.Proprietarybrandsaleswerestrongagainin2007andthesevaluealternativesprovideuswithopportunitiesformoregrowthintheyearsahead.Ourproprietarylinesinclude:Sparcoofficesupplybasics;EliteImagenewandremanufacturedtonercartridgesandpremiumpapers;Lorellofficefurniture;Compucessorycomputeraccessories;NatureSaverrecycledpaperproducts;Integrawritinginstruments;GenuineJoecleaningandbreakroomsupplies;andAtlanticBreezeandHeatRunnerclimatecontrolproducts.
Marketing Programs, Dealer Services and Management Support ToolsS.P.Richardscontinuestomakeconsiderableinvestmentsinnewtech-nologiesonbehalfofourcustomers.Thisinvestmentisoftenintheform
ofimprovedmarketingprograms,dealerservicesandmanagementsup-porttools.Allaredesignedtohelpthecompanyanditsresellerscapturenewbusiness,retainandgrowexistingcustomeraccountsandmaximizetherelationshipsthatbuildthefoundationforprofitablelongtermgrowth.Examplesincludeawidevarietyofcatalogofferings,suchasthefulllinecatalogrepresentingourmostcompleteproductoffering,andtheinnovativeSignatureSeriesflyerprogram,whichcomplementsourcatalogoffering.Wehavealsointroducednewcatalogstofurthersupportourrapidlygrowingcleaningandbreakroomcategoryandproprietarybrands.
Otherprogramsandservicesfortheresellerincludeacomprehensiveofferingofmanagementsupporttoolsthataddresssuchdisciplinesas:e-contentande-commerce;technology;operationsandprofitability;humanresourcesandtraining;nationaldistribution;andfurnituresupportservices.Forexample,inJanuary2007,wereleasedournewEnhancedE-contenttoolthatourresellersuseontheirwebsitestodrivebusiness.Thesuperiorfunctionalityofferedbythistoolwasmadeavailablethroughourjointmarketingagreementwithseveralestablishedsoftwareprovidersthathavedemonstratedtheabilitytosupporttheuniquerequirementsoftheindependentofficeproductsdealer.Wefeelverygoodabouttheop-portunitiesthisagreementwillprovideresellersinthefuture.Inaddition,weareintheprocessofimplementingasophisticatedpricinganalysisprogram,myanalyst™,thatwillallowbothS.P.Richardsandourresellerstoimprovesalesandmarginsthroughenhancedanalyticalreportingandpricingtools.
WecontinuetodeliverbothproductandsalestrainingviaSPRUniversity,aconvenientandcosteffectiveon-linetrainingplatformavailabletoourresellers.
SPR Advantage ProgramAnothersignificantoffering,theSPRAdvantageProgram,representsacollectionofservices,tools,educationandtrainingresourcesthatsupportour“firstcall”independentofficeproductsdealers.Theservicesandsupporttoolsinthisprogramareimprovedeachyeartobestenabletheresellertocompetemoreeffectivelyintheirmarketplaces,thusposition-ingS.P.Richardsasavaluedresourceandconsultanttoourcustomers.
Operational ExcellenceIn2007,S.P.RichardsremainedfocusedonourOperationalExcellenceinitiativetostreamlineoperationsandrealizecostsavings.Benefitsfromthisinitiativerangefromimprovedfreightmanagementandenhancedfuelprogramstogreaterutilizationofourwarehousemanagementsystemsandcentralizedservices.WeareencouragedbythecontinuedprogressmadetowardsOperationalExcellenceandtheopportunitytofurtherimproveourhighstandardofcustomerserviceandoperatingperformance.
2008 OutlookIn2008,weexpecttoseeagradualimprovementintheofficeproductsindustryand,combinedwiththeproperexecutionofourgrowthinitia-tivesandthecontinuedtraditionofdeliveringexcellentsupportandservicetobusinessproductsresellers,welooktoreportimprovedsalesandearningsfortheyear.

electrical/electronics product group
EIS is one of North America’s leading distribu-
tors of process materials, production supplies,
industrial MRO and value added fabricated parts.
Primary markets for EIS are the electrical OEM,
apparatus repair and assembly markets.
2007 Highlights7% increase in revenues New products and markets geographic expansion operational excellence
technical and service solutions proprietary inventory management systems key account and supplier development
12
electrical/electronics group net salesin million of dollars
EISprovidesourmanyvaluedsupplierswithanattractivedistributionchannelviaanetworkof31stockinglocationsintheU.S.,PuertoRico,DominicanRepublic,MexicoandCanada.Additionally,EISoperatesthreeplantsstrategicallylocatedinNorthAmericathatprovidevalueaddedfabricatedmaterialtoourcustomers.Combined,theselocationsofferourcustomersaccesstocompleteinventories,capablepeopleandacomprehen-siverangeofinnovativelogisticsservices.
2007 PerformanceTotalrevenuesincreasedby7%in2007andthisfollowsa20%growthinrevenuesin2006.ThesalesprogressatEISreflectsfavorablemarketcondi-tions,asevidentthroughcontinuedmanufacturingexpansionintheU.S.Inaddition,ourongoingcommitmenttokeysalesinitiatives,costmanage-mentandoperationalprocessimprovementhelpeddriveourimprovedoperatingperformancein2007.
Ourfocusonnewproductsandmarkets,geographicexpansion,operationalexcellenceandstrategiccustomerandsupplierrelationshipsserveaskeygrowthinitiativesatEIS.Theseinitiativeshavestrengthenedourpositionasthepreferredsourceformaterials,supplies,partsandsystemsatelectricalandassemblymanufacturersthroughoutNorthAmerica.
New Products and MarketsWecontinuetoaddnewproductlinessuchasanexpandedofferingofmotorsandmotorpartsfortheapparatusrepairindustryandothernichemarkets.EIShasalsoimprovedourMROsuppliesandleadwireoffering.Furthermore,wecontinuetoexploreadjacentmarkets,suchaswireandcable,whichofferlargeopportunitiesforfuturegrowth.
Inaddition,weremainfocusedoncoreandvalueaddedfabricationopportunitiesintraditionalelectricalmarketsaswellasnewandadjacentmarkets,includingmedicaldevice,automotiveandenergy.
Geographic ExpansionAnothersourceofgrowthforEIShasbeengeographicexpansionbeyondtheU.S.WecontinuetoimproveourNorthAmericandistributionfoot-printandexpecttheevolvingelectricalandassemblymarketsinCanada,MexicoandtheCaribbeantogrowfasterthantheoverallindustry.Wehaveplansforadditionalbusinessexpansionineachoftheseareas.
Operational ExcellenceEIShasemployedOperationalExcellence,acontinuousimprovementprogram,toaddressandsolvebusinessoperationalissues.Thisdisciplinedapproachtoprocessimprovementhasresultedinincreasinglyefficientop-erationsandcontributedtoourimprovedoperatingperformancein2007.Weseefurtheropportunitiesforimprovementin2008.
Customer and Supplier RelationshipsInitiativestoalignEISwithstrongcustomerandsupplierrelationshipsfurtherenhanceourlong-termgrowthstrategy.Throughclosersupplierrelationshipsandcontinuedfocusonourtopcustomers,weaimtodiffer-entiateEISthroughproduct,technicalandservicesolutionsthatmeetourcustomers’uniquerequirements.OurstandardsforhighperformancemakeusthepreferredsourceinthemarketplaceandpositionEISforcontinuedgrowth.
2008 OutlookOurstrategicinitiatives,coupledwithstablemarketconditions,provideEISwithadditionalopportunitiestogrowrevenuesin2008andbeyond.Wewillsupportthissalesgrowthwithacontinuedfocusoncostman-agementandhighperformanceoperationalprocessestoinsureongoingimprovementinourearningsresults.
298
03 04 05 06 07
336342
408
436

Selected Financial Data
(in thousands, except per share data) Year ended December 31, 2007 2006 2005 2004 2003
Netsales $ 10,843,195 $10,457,942 $ 9,783,050 $ 9,097,267 $ 8,449,300Costofgoodssold* 7,625,972 7,353,447 6,884,964 6,439,544 5,992,684Operatingandnon-operatingexpenses,net* 2,400,478 2,333,579 2,189,022 2,021,804 1,884,873Incomebeforetaxesandaccountingchange 816,745 770,916 709,064 635,919 571,743Incometaxes 310,406 295,511 271,630 240,367 218,101Incomebeforecumulativeeffectofachange inaccountingprinciple 506,339 475,405 437,434 395,552 353,642Cumulativeeffectofachangeinaccountingprinciple** - - - - 19,541Netincome $ 506,339 $ 475,405 $ 437,434 $ 395,552 $ 334,101Weightedaveragecommonsharesoutstandingduringyear- assumingdilution 170,135 172,486 175,007 175,660 174,480Percommonshare: Dilutednetincome,excludingcumulativeeffect $ 2.98 $ 2.76 $ 2.50 $ 2.25 $ 2.03Dilutednetincome 2.98 2.76 2.50 2.25 1.91Dividendsdeclared 1.46 1.35 1.25 1.20 1.18December31closingstockprice 46.30 47.43 43.92 44.06 33.20Long-termdebt,lesscurrentmaturities 250,000 500,000 500,000 500,000 625,108Shareholders’equity 2,716,716 2,549,991 2,693,957 2,544,377 2,312,283Totalassets $ 4,774,069 $ 4,496,984 $ 4,771,538 $ 4,455,247 $ 4,127,956
* TheCompanyreclassifiedcertainwarehousing,distributionandhandlingcostsfromoperatingexpensestocostofgoodssoldforallperiodspresented. Thesecostsamountto$176million,$171million,$166million,$172millionand$166millionforfiscalyears2007,2006,2005,2004and2003,respectively. Thereclassificationhadnoeffectonnetsales,operatingmargins,ornetincome. ** Thecumulativeeffectofachangeinaccountingprinciplein2003representsanon-cashchargerelatedtocashconsiderationreceivedfromvendorsin conjunctionwiththeFinancialAccountingStandardsBoard’sEITF02-16.
Market Price and Dividend InformationHighandLowSalesPriceandDividendsperCommonShareTradedontheNewYorkStockExchange
SalesPriceofCommonShares
Quarter 2007 2006
High Low High LowFirst $50.75 $46.19 $45.74 $41.41Second 51.65 48.39 46.16 40.00Third 51.68 46.00 43.90 40.09Fourth 50.97 46.30 48.34 42.60
DividendsDeclaredPerShare
2007 2006
First $0.3650 $0.3375Second 0.3650 0.3375Third 0.3650 0.3375Fourth 0.3650 0.3375
Number of Record Holders of Common Stock as of December 31, 2007: 6,538
13

Stock Performance
SetforthbelowisalinegraphcomparingtheyearlydollarchangeinthecumulativetotalshareholderreturnontheCompany’sCom-monStockagainstthecumulativetotalshareholderreturnoftheStandardandPoor’s500StockIndexandapeergroupcompositeindexstructuredbytheCompanyassetforthbelowforthefiveyearperiodthatcommencedDecember31,2002andendedDecem-ber31,2007.Thisgraphassumesthat$100wasinvestedonDecember31,2002inGenuinePartsCompanyCommonStock,theS&P500StockIndex(theCompanyisamemberoftheS&P500,anditscumulativetotalshareholderreturnwentintocalculatingtheS&P500resultssetforthinthegraph)andthepeergroupcompositeindexassetforthbelowandassumesreinvestmentofalldividends.
Comparison of Five Year Cumulative Total Shareholder Return
2002 2003 2004 2005 2006 2007
250
225
200
175
150
125
100
75
50
25
0
Genuine Parts Company, S&P 500 Index & Peer Group Composite Index
Inconstructingthepeergroupcompositeindex(“PeerIndex”)foruseinthestockperformancegraphabove,theCompanyusedthesharehold-erreturnsofvariouspubliclyheldcompanies(weightedinaccordancewitheachcompany’sstockmarketcapitalizationatDecember31,2002andincludingreinvestmentofdividends)thatcompetewiththeCompanyinthreeindustrysegments:automotiveparts,industrialpartsandofficeproducts(eachgroupofcompaniesincludedinthePeerIndexascompetingwiththeCompanyinaseparateindustrysegmentisherein-afterreferredtoasa“PeerGroup”).IncludedintheautomotivepartsPeerGrouparethosecompaniesmakinguptheDowJonesAutoPartsandEquipmentIndex(theCompanyisamemberofsuchindustrygroup,anditsindividualshareholderreturnwasincludedwhencalculatingthePeerIndexresultssetforthintheperformancegraph).IncludedintheindustrialpartsPeerGroupareAppliedIndustrialTechnologies,Inc.andKamanCorporationandincludedintheofficeproductsPeerGroupisUnitedStationersInc.ThePeerIndexfor2007doesnotbreakoutaseparateelectrical/electronicpeergroupduetothatfactthatthereiscurrentlynotruemarketcomparativetoEIS.Theelectrical/electroniccomponentofsalesisredistributedtotheCompany’sothersegmentsonaproratabasistocalculatethefinalPeerIndex.
IndeterminingthePeerIndex,eachPeerGroupwasweightedtoreflecttheCompany’sannualnetsalesineachindustrysegment.Eachindus-trysegmentoftheCompanycomprisedthefollowingpercentagesoftheCompany’snetsalesforthefiscalyearsshown:
Cumulative Total Shareholder Return $ at Fiscal Year End 2002 2003 2004 2005 2006 2007
GenuinePartsCompany 100.00 111.93 153.22 157.13 175.01 176.03S&P500 100.00 128.68 142.68 149.69 173.32 182.84PeerIndex 100.00 136.78 162.00 168.67 192.02 226.95
Industry Segment 2002 2003 2004 2005 2006 2007
AutomotiveParts 52% 53% 52% 51% 49% 49%IndustrialParts 27% 27% 27% 29% 30% 31%OfficeProducts 17% 17% 17% 17% 17% 16%Electrical/ElectronicMaterials 4% 3% 4% 3% 4% 4%
Dol
lars
14
GenuinePartsCompany
S&PIndex
PeerIndex
15
Segment Data
(in thousands) Year ended December 31, 2007 2006 2005 2004 2003
Netsales: Automotive $ 5,311,873 $ 5,185,080 $ 5,013,460 $ 4,739,261 $ 4,477,508 Industrial 3,350,954 3,107,593 2,795,699 2,511,597 2,253,947 Officeproducts 1,765,055 1,779,832 1,662,393 1,540,878 1,457,149 Electrical/electronicmaterials 436,318 408,138 341,513 335,605 297,618 Other (21,005) (22,701) (30,015) (30,074) (36,922)Totalnetsales $ 10,843,195 $ 10,457,942 $ 9,783,050 $ 9,097,267 $ 8,449,300
Operatingprofit: Automotive $ 413,180 $ 399,931 $ 398,494 $ 396,015 $ 363,022 Industrial 281,762 257,022 214,222 173,760 151,109 Officeproducts 156,781 166,573 157,408 150,817 143,263 Electrical/electronicmaterials 30,435 22,630 17,470 14,611 7,112Totaloperatingprofit 882,158 846,156 787,594 735,203 664,506
Interestexpense,net (21,056) (26,445) (29,564) (37,260) (51,538)Corporateexpense (38,300) (44,341) (45,299) (58,980) (37,121)Intangibleassetamortization (1,118) (463) (396) (356) (1,539)Minorityinterests (4,939) (3,991) (3,271) (2,688) (2,565)Incomebeforeincometaxesandaccountingchange $ 816,745 $ 770,916 $ 709,064 $ 635,919 $ 571,743
Assets: Automotive $ 2,785,619 $ 2,625,846 $ 2,711,620 $ 2,521,906 $ 2,369,969 Industrial 969,666 910,734 976,903 955,029 957,735 Officeproducts 659,838 669,303 722,813 681,992 621,523 Electrical/electronicmaterials 101,419 105,623 113,913 104,918 97,195 Corporate 175,074 123,224 183,572 133,730 23,506 Goodwillandintangibleassets 82,453 62,254 62,717 57,672 58,028Totalassets $ 4,774,069 $ 4,496,984 $ 4,771,538 $ 4,455,247 $ 4,127,956
Depreciationandamortization: Automotive $ 65,810 $ 52,565 $ 44,102 $ 39,222 $ 42,681 Industrial 8,565 7,941 8,345 8,972 10,265 Officeproducts 9,159 9,518 9,551 10,245 10,639 Electrical/electronicmaterials 1,566 1,394 1,612 2,011 2,729 Corporate 1,484 1,542 1,523 1,401 1,160 Intangibleassetamortization 1,118 463 396 356 1,539Totaldepreciationandamortization $ 87,702 $ 73,423 $ 65,529 $ 62,207 $ 69,013
Capitalexpenditures: Automotive $ 91,359 $ 111,644 $ 68,062 $ 52,263 $ 58,754 Industrial 8,340 6,187 5,695 3,922 6,824 Officeproducts 13,294 6,002 8,893 12,354 7,211 Electrical/electronicmaterials 2,340 904 1,550 1,552 394 Corporate 315 1,307 1,514 1,986 721Totalcapitalexpenditures $ 115,648 $ 126,044 $ 85,714 $ 72,077 $ 73,904
Netsales: UnitedStates $ 9,609,225 $ 9,314,970 $ 8,768,737 $ 8,198,368 $ 7,666,389 Canada 1,158,515 1,071,095 954,317 845,563 731,200 Mexico 96,460 94,578 90,011 83,410 88,633 Other (21,005) (22,701) (30,015) (30,074) (36,922)Totalnetsales $ 10,843,195 $ 10,457,942 $ 9,783,050 $ 9,097,267 $ 8,449,300 Netlong-livedassets: UnitedStates $ 419,289 $ 415,569 $ 388,916 $ 368,345 $ 339,020 Canada 85,532 72,556 62,842 65,649 57,906 Mexico 3,621 3,389 3,254 3,066 4,094Totalnetlong-livedassets $ 508,442 $ 491,514 $ 455,012 $ 437,060 $ 401,020

Management’s Discussion and Analysis of Financial Condition and Results of Operations
2007
Overview
GenuinePartsCompanyisaserviceorganizationengagedinthedistributionofautomotivereplacementparts,industrialreplace-mentparts,officeproductsandelectrical/electronicmaterials.TheCompanyhasalongtraditionofgrowthdatingbackto1928,theyearwewerefoundedinAtlanta,Georgia.2007wastheCompany’s80thyearofoperations.Wehaveincreasedsalesin57ofthelast58yearsandincreasedprofitsin45ofthelast47years.In2007,businesswasconductedthroughouttheUnitedStates,inPuertoRico,inCanadaandinMexicofromapproxi-mately2,000locations.
Werecordedconsolidatednetsalesof$10.8billionfortheyearendedDecember31,2007,anincreaseof4%comparedto$10.5billionin2006.ConsolidatednetincomefortheyearendedDecember31,2007,was$506million,up7%from$475millionin2006.Ourtwobusinesssegmentsservingthemanufacturingsectoroftheeconomyrecordedthestrongestresultsamongourfourgroupsin2007.Thesebusinesseshaveparticipatedinthecontinuedstrengthoftheirendmarketsandprovidedustheopportunitytoachieveanotheryearofrecordsalesandearnings.Ourautomotiveandofficeproductsbusinessesencounteredmoredifficultmarketcircumstancesin2007.
Ourprogressin2007followsa7%and8%increaseinrevenuesin2006and2005,respectively.Likewise,ourimprovedearningsin2007followthreeconsecutiveyearsofdouble-digitgrowthinearningspershare.Duringtheseperiods,theCompanyhasimplementedavarietyofinitiativestogrowsalesandearnings,includingtheintroductionofnewandexpandedproductlines,geographicexpansion,salestonewmarkets,enhancedcustomermarketingprogramsandcostsavingsinitiatives.Eachofourbusinesssegmentsparticipatedindevelopingtheseinitiatives,asdiscussedfurtherbelow.
ThemajorcategoriesontheDecember31,2007consolidatedbalancesheetwererelativelyconsistentwiththeDecember31,2006balancesheetcategories,subjecttocertainexceptionsexplainedbelow.Ourcashbalancesincreased$96millionor71%fromDecember31,2006,dueprimarilytoimprovedearningsandworkingcapitalmanagement.Inaddition,theCompanyreceived$56millioninnetproceedsonasale-leasebacktransactioninthefourthquarterof2007,discussedfurtherunderContractualandOtherObligations.Accountsreceivabledecreasedbyapproximately1%,whichissignificantlyfavorabletoourincreaseinrevenues,andinventorywasup4%.AccountsPayableincreased$80millionor9%fromtheprioryear,dueprimarilytoincreasedpurchasesrelatedtosalesgrowth,extendedtermswithcertainsuppliersandtheincreasedutilizationofprocurementcardsduring2007.Thecurrentportionofdebtwas$250millionatDecember31,2007,duetothereclassificationoflong-termdebtmaturingNovember2008.TotaldebtoutstandingatDecember31,2007wasunchangedfromDecember31,2006.
ResultsofOperations
OurresultsofoperationsaresummarizedforthethreeyearsendedDecember31,2007,2006and2005,asfollows:
YearendedDecember31,(in thousands, except per share data) 2007 2006 2005 NetSales $10,843,195 $10,457,942 $ 9,783,050GrossProfit* 3,217,223 3,104,495 2,898,086NetIncome 506,339 475,405 437,434DilutedEarningsPerShare 2.98 2.76 2.50
*TheCompanyreclassifiedcertainwarehousing,distributionand handlingcostsfromoperatingexpensestocostofgoodssold forthepriorperiodstoconformwithcurrentperiodpresentation. Thesecostsamountto$171millionand$166millionforfiscal years2006and2005,respectively.Thereclassificationhadno effectonnetsales,netincomeordilutedearningspershare.
Net SalesConsolidatednetsalesfortheyearendedDecember31,2007totaled$10.8billion,anotherrecordsaleslevelfortheCompanyanda4%increasefrom2006.In2007,theIndustrialandElectricalbusinesssegmentsshowedthestrongestsalesimprovementamongouroperations.TheAutomotiveandOfficesegmentsencounteredmoredifficultmarketcircumstances,withAutomotiveshowingslightprogressinrevenuegrowthandOfficereportingaslightdecreaseinrevenuesfortheyear.Fortheyear,priceswereupapproximately2%intheAutomotivesegment,5%intheIndustrialandElectricalsegmentsand3%intheOfficesegment.
NetsalesfortheyearendedDecember31,2006totaled$10.5billion,a7%increasefrom2005.Allofthebusinesssegmentscontributedtooursalesgrowthin2006,asourinternalinitia-tives,healthyeconomyandpositivetrendsintheindustriesweserveenhancedthesalesvolumeineachofourfourgroups.Priceswereupapproximately2%intheAutomotivesegment,3%intheIndustrialandOfficesegmentsand7%intheElectricalsegmentin2006.
Automotive GroupNetsalesfortheAutomotiveGroup(“Automotive”)were$5.3billionin2007,anincreaseof2%from2006.Oursalesgrowthwasrelativelyconsistentduringtheyear,rangingfrom2%to3%byquarter,asthemorechallengingmarketconditionswebegantoseeinthelasthalfof2006continuedthroughout2007withoutanysignificantchange.Weobservedtheongoingpres-sureofhighgaspricesonmilesdrivenandconsumerspending,whichnegativelyimpactaftermarketdemand.Thecontinuedeffectivenessofourgrowthinitiatives,suchasourmajoraccountsprograms,servedtooffsettheseconditionsand,asaresult,
16

Automotivereportedprogressin2007.Whilethislevelofgrowthdoesnotmeetourexpectationsforthelongerterm,weremainencouragedbythisgroup’sdrivetogeneratepositiveandconsistentsalesgrowthintheyearahead.
Automotivesalesincreasedby3%to$5.2billionin2006.Afterachievingsalesincreasesof5%inboththefirstandsecondquartersof2006,oursalesgrowthslowedto1%growthinthethirdquarter,followedbya2%increaseinthefourthquarter.Automotive’ssalesinitiatives,includingtheadditionof64netnewNAPAAUTOPARTSstoresandthecontinuedexpansionofNAPAAutoCareprograms,weresomewhatimpactedbytheeffectofhighergasolinepricesonvehiclemilesdrivenandaftermarketproductdemand.Bothofthesefactorsinfluencedoursalestrendsfortheyear.Additionally,ourcoreNAPAsalesincreaseof5%wasoffsetbyasalesdecreaseatJohnsonIndus-tries,whichwasdownsizedin2005.
Industrial GroupNetsalesforMotionIndustries,ourIndustrialGroup(“Indus-trial”),were$3.4billionin2007,anincreaseof8%comparedto2006.In2007,thisgrouprecordedstrongandconsistentsalesgrowth,withrevenuesincreasingfrom7%to9%ineachquarteroftheyear.Industrialhasparticipatedinthecontinuedstrengthofthemarketsitservesthroughinitiativessuchasproductlineexpansion,targetedindustryprograms,branchexpansionandacquisitions.Thisyear,Industrialexpandeditsdistributionnetworkbyopeningfournewlocationsandbyaddinganothereightlocationsviafiveacquisitions.Industrial’sgrowthplans,combinedwithongoingsteadydemandfromitsmanufacturingcustomerbase,shouldallowthisgrouptogeneratemorestrongresultsin2008.
Netsalesin2006were$3.1billion,representingthethirdcon-secutiveyearof11%salesgrowth.In2006,thisgrouprecordedsteadyprogressthroughouttheyear,withdouble-digitgrowthineachquarter.Inaddition,Industrialexpandeditsdistributionnetworkin2006byopening10newlocationsandbyaddinganother31locationsviatwoacquisitions.
Office GroupNetsalesforS.P.Richards,ourOfficeProductsGroup(“Office”),were$1.8billion,down1%comparedtotheprioryear.Officeiscommonlyrecognizedasourmoststeadyperformerfromyeartoyear,butweakdemandintheoverallofficeproductsindustry,whichwebegantoseein2006,negativelyimpactedourresultsin2007.Primarily,thedepressedsalesactivitywithournationalaccountscustomerbaseoffsetthesteadysalesgrowthtoindependentdealersduringtheyear.Aftera3%salesdecreaseinthefirstquarter,salesincreased1%inthesecondquarter,wereflatinthethirdquarteranddecreased1%inthefourthquarter.Agradualstrengtheningintheindustrycombinedwithproductand
customerexpansioneffortsandthecontinueddevelopmentofeffectivemarketingprogramsanddealerservicesshouldsupportgrowthforOfficeintheyearahead.
Netsalesin2006were$1.8billion,up7%over2005.ThisrepresentedasolidincreasefortheOfficegroupandreflectsthesuccessofitsongoingbusinessexpansionstrategy.Amongthequarters,however,therateofsalesgrowthdecreasedasmarketconditionsbecamemoredifficultduringtheyear.Salesincreased13%inthefirstquarter,6%inthesecondquarter,5%inthethirdquarterand4%inthefourthquarter.
Electrical GroupNetsalesforEIS,ourElectricalandElectronicGroup(“Electrical”),increasedby7%to$436millionin2007.ThesalesprogressatElectricalreflectsfavorablemarketconditions,asevidentthroughcontinuedmanufacturingexpansionintheU.S.Also,thisgroup’sfocusonnewproductsandmarkets,geographicexpansionandstrategiccustomerandsupplierrelationshipsserveaskeysalesinitiativesatElectrical.During2007,saleswereup12%inthefirstquarter,7%inthesecondquarter,4%inthethirdquarterand6%inthefourthquarter.WeexpectthestrategicinitiativesinplaceatElectricalaswellasstablemarketconditionstodriveadditionalsalesprogressforElectricalin2008.
Netsaleswereup20%to$408millionin2006comparedtotheprioryear.ThisstronggrowthreflectedthecontinuedmanufacturingexpansionintheU.S.duringtheyear,aswellasthisgroup’scom-mitmenttoongoingsalesinitiatives.During2006,saleswereup13%inthefirstquarter,24%inthesecondquarter,23%inthethirdquarterand17%inthefourthquarter.
Cost of Goods SoldCostofgoodssoldwas$7.6billion,$7.4billionand$6.9billionin2007,2006and2005,respectively,representing70.3%ofnetsalesin2007and2006,downslightlyfrom70.4%ofnetsalesin2005.Overtheseperiods,ongoinggrossmargininitiativestoenhanceourpricingstrategies,promoteandsellhighermarginproductsandminimizematerialacquisitioncostswereoffsetbyincreasingcompetitivepricingpressuresinthemarketsweserve.
In2005,2006and2007,eachofourfourbusinesssegmentsexperiencedvendorpriceincreases,andbyworkingwithourcustomerswewereabletopasssomeofthesealongtothem,particularlyinIndustrial.
Operating Expenses Selling,administrativeandotherexpenses(“SG&A”)increasedto$2.3billionin2007,representing21.0%ofnetsalesanddownslightlyfrom21.2%ofnetsalesin2006.SG&Aexpensesasapercentageofnetsalesreflectthebenefitsofourongoingcostcontrolinitiatives.Ourcostmanagementinitiativescontinue
17

18
Management’s Discussion and Analysis of Financial Condition and Results of Operations (continued)
2007
toemphasizecontinuousimprovementprogramsdesignedtooptimizeourutilizationofpeopleandsystems.Wewerepleasedwiththesuccessofourinitiativesin2007andexpectourSG&Aexpensesasapercentageofsalestoshowadditionalprogressintheforeseeablefuture.Depreciationandamortizationexpensein2007was$88million,up19%from2006,andrelatestoanincreasedlevelofcapitalexpendituresin2006and2007relativeto2005.Theprovisionfordoubtfulaccountswas$14millionin2007,downfroma$16millionbaddebtexpensein2006.In2006,SG&Aincreasedslightlyto$2.2billion,or21.2%ofnetsales,consistentwithSG&Aasapercentofnetsalesin2005.Depreciationandamortizationexpensein2006was$73million,up12%from2005,andcorrespondstotheincreaseincapitalexpendituresin2006relativetotheprioryear.Theprovisionfordoubtfulaccountswas$16millionin2006,consistentwithourbaddebtexpensein2005.
Non-Operating Expenses and IncomeNon-operatingexpensesconsistprimarilyofinterest.Interestexpensewas$31million,$32millionand$34millionin2007,2006and2005,respectively.Thedecreaseininterestexpensein2006comparedto2005wasprimarilyduetotheterminationofaninterestrateswapagreementin2006.
In“Other”,interestincomenetofminorityinterestsincreasedin2007fromthepriortwoyearsduetothechangeininterestincomeearnedontheCompany’simprovedcashbalancesduringtheyear.
Income Before Income TaxesIncomebeforeincometaxeswas$817millionin2007,anincreaseof5.9%from$771millionin2006.Asapercentageofnetsales,incomebeforeincometaxeswas7.5%in2007,reflectingaslightincreasefrom7.4%in2006.Theimprovementin2007representsacontinuingtrendfortheCompany.In2006,incomebeforeincometaxesof$771millionwasup8.7%from$709millionin2005andasapercentageofnetsaleswas7.4%,upfrom7.2%in2005.
Automotive GroupAutomotiveoperatingprofitasapercentageofnetsales,whichwerefertoasoperatingmargin,increasedto7.8%in2007from7.7%in2006.Ourprogressin2007primarilyrelatedtocertainnon-recurringcostsincurredin2006forcertainclosingandconsolidationexpensesatJohnsonIndustriesandourre-manufacturingopera-tions.Basedonourinitiativestogrowsalesandcontrolcostsin2008,weexpectAutomotiveoperatingmarginstoshowimprove-mentintheyearahead.
Automotiveoperatingmarginsdecreasedto7.7%in2006from7.9%in2005.During2006,theCompanyrecordednon-recurringcostsassociatedwithcertainclosingandconsolidationexpensesatJohnsonIndustriesandourre-manufacturingoperations.At
JohnsonIndustries,wesoldorclosedeightoftwelvelocationsduring2005,resultinginsellingandclosurecostsinthatyear,andweincurredadditionalclosingcoststodownsizetheseoper-ationsin2006.Atourre-manufacturingoperations,weincurredcostsduringtheyearrelatedtocertainfacilityconsolidations.
Industrial GroupIndustrialoperatingmarginsincreasedto8.4%in2007from8.3%in2006and7.7%in2005.ThisongoingmarginimprovementforIndustrialreflectstheeffectivenessofoursalesandoperatingini-tiatives,aswellastherelativestrengthoftheindustriesservedbyIndustrialovertheseperiods.WeexpecttoshowmoreprogressinIndustrialin2008.
Office GroupOperatingmarginsinOfficewere8.9%in2007,downfrom9.4%in2006and9.5%in2005.Officecontinuestogenerateindustryleadingoperatingmargins,buttheimpactofweakeningdemandintheofficeproductsindustryexperiencedoverthelasthalfof2006andin2007hasnegativelyinfluencedthistrend.Inaddition,competitivepricingpressuresovertheseperiodshaveaffectedthemarginsatOffice.Thesepressuresarepartiallyoffsetbyongoingproductandcustomerexpansioneffortsandthecontinueddevelopmentofeffectivemarketingprogramsanddealerservices.Throughtheseinitiatives,webelieveOfficewillshowprogressin2008.
Electrical GroupOperatingmarginsinElectricalincreasedto7.0%in2007from5.5%in2006.ThisrepresentsthefourthconsecutiveyearofmarginimprovementforElectricalandreflectsthecontinuedstrengthinthemanufacturingsectoroftheeconomyin2007,combinedwithElectrical’ssuccessfulgrowthstrategyduringthisperiod.OperatingmarginsinElectricalincreasedto5.5%in2006from5.1%in2005.WeareencouragedbytheongoingprogressweseeinElectrical.
Income TaxesTheeffectiveincometaxratedecreasedto38.0%in2007from38.3%in2006.Thedecreaseintheeffectiveratein2007wasprimarilyduetolowerstatetaxesandfavorabletaxratechangesinCanada.Theeffectiveincometaxrateof38.3%in2006wasunchangedfromtheeffectiveincometaxratein2005.
Net IncomeNetincomewas$506millionin2007,anincreaseof7%from$475millionin2006.Onapersharedilutedbasis,netincomewas$2.98in2007comparedto$2.76in2006,up8%.Thisincreasefollowstwoconsecutiveyearsofdouble-digitgrowthindilutedearningspershare.Netincomein2007was4.7%ofnetsalescomparedto4.5%ofnetsalesin2006.

19
Netincomewas$475millionin2006,up9%from$437millionin2005,andonapersharedilutedbasis,netincomewas$2.76in2006comparedto$2.50in2005.Netincomein2006and2005was4.5%ofnetsales.
Share-Based CompensationEffectiveJanuary1,2006theCompanyadoptedStatementofFinancialAccountingStandards(“SFAS”)No.123(R)choosingthe“modifiedprospective”method.CompensationcostrecognizedfortheyearendedDecember31,2006includes:(a)compensationcostforallshare-basedpaymentsgrantedpriorto,butnotyetvestedasofJanuary1,2006,basedonthegrantdatefairvalueestimatedinaccordancewiththeoriginalprovisionsofSFASNo.123,and(b)compensationcostforallshare-basedpaymentsgrantedsubsequenttoJanuary1,2006,basedonthegrantdatefairvalueestimatedwiththeprovisionsofSFASNo.123(R).Resultsforpriorperiodshavenotbeenrestated.Mostoptionsmaybeexercisednotearlierthantwelvemonthsnorlaterthantenyearsfromthedateofgrant.AsofJanuary1,2006,therewasapproximately$1.2millionofunrecog-nizedcompensationcostforallawardsgrantedpriortoJanuary1,2003toemployeesthatremainedunvestedpriortotheeffectivedateofSFASNo.123(R).Thiscompensationcostisbeingrecognizedoveraweighted-averageperiodofapproximatelyfouryears.FortheyearendedDecember31,2007,totalcompensationcostrelatedtononvestedawardsnotyetrecognizedwasapproximately$21.7million.Theweighted-averageperiodoverwhichthiscompensationcostisexpectedtoberecognizedisapproximatelythreeyears.FortheyearsendedDecember31,2007,2006and2005,$14.3mil-lion,$11.9millionand$6.9millionofshare-basedcompensationcostwasrecorded,respectively.TherehavebeennomodificationstovaluationmethodologiesormethodssubsequenttotheadoptionofSFASNo.123(R).
FinancialCondition
ThemajorconsolidatedbalancesheetcategoriesatDecember31,2007,withtheexceptionoftheaccountsdiscussedbelow,wererelativelyconsistentwiththeDecember31,2006balancesheetcategories.TheCompany’scashbalancesincreased$96millionor71%fromDecember31,2006,dueprimarilytoimprovedearningsandworkingcapitalmanagement.TheCompanyalsoreceived$56millioninnetproceedsonasale-leasebacktrans-actioninthefourthquarterof2007,discussedfurtherunderContractualandOtherObligations.OuraccountsreceivablebalanceatDecember31,2007decreased1%comparedtotheprioryear,whichisconsiderablyfavorabletoourincreaseinrevenuesforthefourthquarterandyear.InventoryatDecember31,2007,wasup4%fromDecember31,2006,inlinewithourincreaseinrevenuesfortheyear.Prepaidexpensesandothercurrentassetsincreased$34millionor15%fromDecember31,2006,reflectingtheincreaseinreceivablesduefromvendors.AccountspayableatDecember31,2007increased$80millionor9%fromtheprioryear,dueprimarilytoincreasedpurchases
relatedtosalesgrowth,extendedtermswithcertainsuppliersandtheincreasedutilizationofprocurementcardsin2007.LiquidityandCapitalResources
Theratioofcurrentassetstocurrentliabilitieswas2.6to1atDecember31,2007comparedto3.2to1atDecember31,2006.Thechangeincurrentratiowasprimarilyduetothereclassificationof$250millioninlong-termdebtmaturingNovember2008.Ourcashpositionremainsstrong.TheCompanyhad$500millionintotaldebtoutstandingatDecember31,2007and2006.
AsummaryoftheCompany’sconsolidatedstatementsofcashflowsisasfollows:
Year Ended December 31,NetCash (in thousands) PercentChangeProvidedby 2007vs.2006vs.(Usedin): 2007 2006 2005 2006 2005
OperatingActivities $ 641,471 $ 433,500 $440,517 48% -2%InvestingActivities (87,598) (145,599)(70,174) -40% 107%FinancingActivities (469,496) (340,729) (317,469) 38% 7%
Net Cash Provided by Operating Activities:TheCompanycontinuestogenerateexcellentcashflowsand2007wasanespeciallystrongyear,withnetcashprovidedbyoperatingactivitiesincreasing48%to$641million.The7%increaseinnetincomeandworkingcapitalgainsduringtheyearresultedinasignificantincreaseincashfromoperationscom-paredto2006.In2006,theCompanygenerated$434millionincashfromoperations,aslightdecreasefrom2005primarilyduetotheuseofcashforworkingcapitalrequirementsduringtheyear,whichoffsetthe9%increaseinnetincomecomparedto2005.TheCompanybelievesexistingcreditfacilitiesandcashgeneratedfromoperationswillbesufficienttofunditsfutureoperations,andtomeetitscashrequirements.
Net Cash Used in Investing Activities:Cashflowusedininvestingactivitieswas$88millionin2007comparedto$146millionin2006,adecreaseof40%.Primarily,thedecreaseininvestingactivitieswasduetothesale-leasebacktransactionforcertainrealproperties,whichclosedduringtheyear.ThistransactionprovidedtheCompany$56millionincashproceeds.Thedecreaseincapitalexpendituresandincreaseincashusedforacquisitionsrelativeto2006wereoffsettinginvestingactivitiesin2007.In2006,cashflowusedininvestingactivitiesincreasedsubstantiallyfrom2005,ascapitalexpendituresincreasedto$126millionin2006comparedtoapproximately$86millionin2005.

20
Management’s Discussion and Analysis of Financial Condition and Results of Operations (continued)
2007
Net Cash Used in Financing Activities:TheCompanyused$469millionofcashinfinancingactivitiesin2007,primarilyfordividendstoshareholdersandtherepurchaseoftheCompany’scommonstock.Dividendsandsharerepurchaseswerealsotheprimaryfinancingactivitiesin2006and2005.TheCompanypaiddividendstoshareholdersof$243million,$228million,and$216millionduring2007,2006,and2005,respec-tively.TheCompanyexpectsthistrendofincreasingdividendstocontinueintheforeseeablefuture.During2007,2006and2005,theCompanyrepurchased$241million,$123millionand$119million,respectively,intheCompany’scommonstock.Weplantoremainactiveinoursharerepurchaseprogram,buttheamountandvalueofsharesrepurchasedwillvaryannually.
Totaldebtof$500millionatDecember31,2007iscomprisedoftwo$250milliontermnoteswithaconsortiumoffinancialandinsuranceinstitutionsduein2008and2011.Thetermnoteduein2008wasclassifiedasacurrentliabilityatDecember31,2007.TheCompanydoesnotanticipaterepayingthesenotespriortotheirscheduledexpiration.
Notes and Other Borrowings TheCompanymaintainsa$350millionunsecuredrevolvinglineofcreditwithaconsortiumoffinancialinstitutions,whichmaturesinDecember2012andbearsinterestatLIBORplus.23%.(5.08%atDecember31,2007).AtDecember31,2007and2006,noamountswereoutstandingunderthelineofcredit.Duetotheworkerscompensationandinsurancereserverequirementsincertainstates,theCompanyalsohadunusedlettersofcreditof$56,453,000and$58,955,000outstandingatDecember31,2007and2006,respectively.
AtDecember31,2007,theCompanyhadunsecuredSeniorNotesoutstandingundera$500millionfinancingarrangementasfollows:$250million,SeriesA,5.86%fixed,due2008;and$250million,SeriesB,6.23%fixed,due2011.Certainborrowingscontaincovenantsrelatedtoamaximumdebt-to-capitalizationratioandcertainlimitationsonadditionalborrowings.AtDecember31,2007,theCompanywasincompliancewithallsuchcovenants.TheweightedaverageinterestrateontheCompany’soutstandingborrowingswasapproximately6.05%atDecember31,2007and2006.Totalinterestexpense,netofinterestincome,forallborrowingswas$21.1million,$26.4millionand$29.6millionin2007,2006and2005,respectively.
Construction and Lease Agreement TheCompanyalsohasan$85millionconstructionandleaseagreementwithanunaffiliatedthirdparty.PropertiesacquiredbythelessorareconstructedandthenleasedtotheCompanyunderoperatingleaseagreements.ThetotalamountadvancedandoutstandingunderthisagreementatDecember31,2007wasapproximately$72million.Sincetheresultingleasesareoperatingleases,nodebtobligationisrecordedontheCompany’sconsolidatedbalancesheet.Thisconstructionandleaseagreementexpires
in2009andnoadditionalpropertiesarebeingaddedtothisagreement,astheconstructiontermhasended.LeasepaymentsfluctuatebaseduponcurrentinterestratesandaregenerallybaseduponLIBORplus.50%.Theleaseagreementcontainsresidualvalueguaranteeprovisionsandguaranteesundereventsofdefault.Althoughmanagementbelievesthelikelihoodoffundingtoberemote,themaximumguaranteeobligation,whichrepresentsourresidualvalueguarantee,undertheconstructionandleaseagreementisapproximately$63millionatDecember31,2007.RefertoNotes4and8totheConsolidatedFinancialStatementsforfurtherinformationregardingthisarrangement.
Contractual and Other Obligations InOctober2007,theCompanyenteredintoasale-leasebacktransactionwithafinancialinstitution.Inconnectionwiththetransaction,theCompanysoldcertainautomotiveretailstorepropertiesandimmediatelyleasedthepropertiesbackoveraleasetermoftwentyyears.Theleasewasclassifiedasanoperatinglease.Netproceedsfromthetransactionamountedtoapproximately$56million.TheCompanyrealizedanetgainofapproximately$20million,whichwasdeferredandwillbeamortizedovertheleaseterm.
ThefollowingtableshowstheCompany’sapproximateobligationsandcommitments,includinginterestdueoncreditfacilities,tomakefuturepaymentsundercontractualobligationsasofDecember31,2007:
PaymentDuebyPeriod Lessthan Over(in thousands) Total 1year 1-3yrs 4-5yrs 5years
Creditfacilities $574,427 $279,000 $ 31,150 $264,277 $ —Capitalleases 11,106 2,344 3,918 2,005 2,839Operatingleases 584,077 131,659 171,938 97,861 182,619Totalcontractualcashobligations $1,169,610 $413,003 $207,006 $364,143 $185,458
DuetotheuncertaintyofthetimingoffuturecashflowsassociatedwiththeCompany’sunrecognizedtaxbenefitsatDecember31,2007,theCompanyisunabletomakereasonablyreliableestimatesoftheperiodofcashsettlementwiththerespectivetaxingauthorities.Therefore,$32millionofunrescognizedtaxbenefitshavebeenexcludedfromthecontractualobligationstableabove.RefertoNote6totheConsolidatedFinancialStatementsforadiscussiononincometaxes.
Purchaseordersorcontractsforthepurchaseofinventoryandothergoodsandservicesarenotincludedinourestimates.Wearenotabletodeterminetheaggregateamountofsuchpurchaseordersthatrepresentcontractualobligations,aspurchaseordersmayrepresentauthorizationstopurchaseratherthanbindingagreements.Ourpurchaseordersarebasedonourcurrent

21
distributionneedsandarefulfilledbyourvendorswithinshorttimehorizons.TheCompanydoesnothavesignificantagreementsforthepurchaseofinventoryorothergoodsspecifyingminimumquantitiesorsetpricesthatexceedourexpectedrequirements.
Asdiscussedin‘ConstructionandLeaseAgreement’above,theCompanyhasapproximately$72millionoutstandingunderacon-structionandleaseagreementwhichexpiresin2009.Inaddition,theCompanyguaranteestheborrowingsofcertainindependentlycontrolledautomotivepartsstores(independents)andcertainotheraffiliatesinwhichtheCompanyhasaminorityequityownershipinterest(affiliates).TheCompany’smaximumexposuretolossasaresultofitsinvolvementwiththeseindependentsandaffiliatesisequaltothetotalborrowingssubjecttotheCompany’sguarantee.Todate,theCompanyhashadnosignificantlossesinconnectionwithguaranteesofindependents’andaffiliates’borrowings.Thefol-lowingtableshowstheCompany’sapproximatecommercialcom-mitmentsunderthesetwoarrangementsasofDecember31,2007:
AmountofCommitmentExpirationperPeriod Total Amounts Lessthan Over(in thousands) Committed 1year 1-3yrs 4-5yrs 5years
Lineofcredit – – – – –Standbylettersofcredit $ 56,453 $ 56,453 $ – $ – $ –Guaranteedborrowingsofindependentsandaffiliates 173,928 48,669 19,343 12,895 93,021Residualvalueguaranteeunderoperatingleases 62,678 – 62,678 – –Totalcommercialcommitments $293,059 $105,122 $ 82,021 $ 12,895 $ 93,021
Inaddition,theCompanysponsorsdefinedbenefitpensionplansthatmayobligateustomakecontributionstotheplansfromtimetotime.Contributionsin2007were$35million.Weex-pecttomakeacashcontributiontoourqualifieddefinedbenefitplansin2008,andcontributionsrequiredfor2009andfutureyearswilldependonanumberofunpredictablefactorsincludingthemarketperformanceoftheplans’assetsandfuturechangesininterestratesthataffecttheactuarialmeasurementoftheplans’obligations.
Share Repurchases OnApril19,1999,ourBoardofDirectorsauthorizedtherepur-chaseof15millionsharesofourcommonstock,andonAugust21,2006,theBoardauthorizedtherepurchaseofanadditional15millionshares.SuchrepurchaseplanswereannouncedonApril20,1999andAugust21,2006,respectively.Theauthorizationfor
theserepurchaseplanscontinuesuntilallsuchshareshavebeenrepurchased,ortherepurchaseplanisterminatedbyactionoftheBoardofDirectors.In2007,theCompanyrepurchasedtheapproximately300,000remainingsharesunderthe1999authorizationandthisauthorizationisclosed.ThroughDecember31,2007,approximately4.7millionshareshavebeenrepurchasedundertheAugust21,2006authorization.
CriticalAccoutingEstimates
GeneralManagement’sDiscussionandAnalysisofFinancialConditionandResultsofOperationsisbaseduponourconsolidatedfinancialstatements,whichhavebeenpreparedinaccordancewithU.S.generallyacceptedaccountingprinciples.Theprepara-tionofthesefinancialstatementsrequiresmanagementtomakeestimatesandassumptionsthataffectthereportedamountsofassets,liabilities,netsalesandexpensesandrelateddisclosureofcontingentassetsandliabilities.Managementbasesitsestimatesonhistoricalexperienceandonvariousotherassumptionsthatarebelievedtobereasonableunderthecircumstances,theresultsofwhichformthebasisformakingjudgmentsaboutthecarryingvaluesofassetsandliabilitiesthatarenotreadilyapparentfromothersources.Actualresultsmaydifferfromtheseestimatesunderdifferentassumptionsorconditions.
Anaccountingpolicyisdeemedtobecriticalifitrequiresanaccountingestimatetobemadebasedonassumptionsaboutmattersthatareuncertainatthetimetheestimateismadeandifdifferentestimatesthatreasonablycouldhavebeenused,orchangesintheaccountingestimatesthatarereasonablylikelytooccurperiodically,couldmateriallyimpacttheconsolidatedfinancialstatements.Managementbelievesthefollowingcriticalaccountingpoliciesreflectitsmostsignificantestimatesandassumptionsusedinthepreparationoftheconsolidatedfinancialstatements.Forfurtherinformationonthecriticalaccountingpolicies,seeNote1ofthenotestoourconsolidatedfinancialstatements.
Inventories – Provisions for Slow Moving and ObsolescenceTheCompanyidentifiesslowmovingorobsoleteinventoriesandestimatesappropriatelossprovisionsrelatedthereto.Historically,theselossprovisionshavenotbeensignificantasthevastmajorityoftheCompany’sinventoriesarenothighlysusceptibletoobso-lescenceandareeligibleforreturnundervariousvendorreturnprograms.WhiletheCompanyhasnoreasontobelieveitsinventoryreturnprivilegeswillbediscontinuedinthefuture,itsriskoflossassociatedwithobsoleteorslowmovinginventorieswouldincreaseifsuchweretooccur.
Allowance for Doubtful Accounts – MethodologyTheCompanyevaluatesthecollectibilityofaccountsreceivablebasedonacombinationoffactors.Initially,theCompanyesti-matesanallowancefordoubtfulaccountsasapercentageofnet

22
Management’s Discussion and Analysis of Financial Condition and Results of Operations (continued)
2007
salesbasedonhistoricalbaddebtexperience.ThisinitialestimateisperiodicallyadjustedwhentheCompanybecomesawareofaspecificcustomer’sinabilitytomeetitsfinancialobligations(e.g.,bankruptcyfiling)orasaresultofchangesintheoverallagingofaccountsreceivable.WhiletheCompanyhasalargecustomerbasethatisgeographicallydispersed,ageneraleco-nomicdownturninanyoftheindustrysegmentsinwhichtheCompanyoperatescouldresultinhigherthanexpecteddefaultsand,therefore,theneedtoreviseestimatesforbaddebts.FortheyearsendedDecember31,2007,2006and2005,theCompanyrecordedprovisionsforbaddebtsof$13.5million,$16.5millionand$16.4million,respectively.
Consideration Received from VendorsTheCompanyentersintoagreementsatthebeginningofeachyearwithmanyofitsvendorsprovidingforinventorypurchaseincentivesandadvertisingallowances.Generally,theCompanyearnsinventorypurchaseincentivesuponachievingspecifiedvol-umepurchasinglevelsandadvertisingallowancesuponfulfillingitsobligationsrelatedtocooperativeadvertisingprograms.TheCompanyaccruesforthereceiptofinventorypurchaseincentivesaspartofitsinventorycostbasedoncumulativepurchasesofinventorytodateandprojectedinventorypurchasesthroughtheendoftheyearand,inthecaseofadvertisingallowances,uponcompletionoftheCompany’sobligationsrelatedthereto.WhilemanagementbelievestheCompanywillcontinuetoreceivesuchamountsin2008andbeyond,therecanbenoassurancethatvendorswillcontinuetoprovidecomparableamountsofincen-tivesandallowancesinthefuture.
Impairment of Property, Plant and Equipment and Goodwill and Other Intangible Assets Atleastannually,theCompanyevaluatesproperty,plantandequipment,goodwillandotherintangibleassetsforpotentialimpairmentindicators.TheCompany’sjudgmentsregardingtheexistenceofimpairmentindicatorsarebasedonmarketcondi-tionsandoperationalperformance,amongotherfactors.FutureeventscouldcausetheCompanytoconcludethatimpairmentindicatorsexistandthatassetsassociatedwithaparticularoperationareimpaired.EvaluatingtheimpairmentalsorequirestheCompanytoestimatefutureoperatingresultsandcashflowswhichrequirejudgmentbymanagement.Anyresultingimpair-mentlosscouldhaveamaterialadverseimpactontheCompany’sfinancialconditionandresultsofoperations.
Employee Benefit Plans TheCompany’sbenefitplancommitteesintheU.S.andCanadaestablishinvestmentpoliciesandstrategiesandregularlymonitortheperformanceoftheCompany’spensionplanassets.Thepen-sionplaninvestmentstrategyimplementedbytheCompany’smanagementistoachievelong-termobjectivesandinvestthepen-sionassetsinaccordancewiththeapplicablepensionlegislation
intheU.S.andCanadaandfiduciarystandards.Thelong-termprimaryobjectivesforthepensionplanfundsaretoprovideforareasonableamountoflong-termgrowthofcapitalwithoutundueexposuretorisk,protecttheassetsfromerosionofpurchasingpowerandprovideinvestmentresultsthatmeetorexceedthepensionplan’sactuariallyassumedlongtermrateofreturn.
BasedontheinvestmentpolicyfortheU.S.pensionplan,aswellasanassetstudythatwasperformedbasedontheCompany’sassetallocationsandfutureexpectations,theCompany’sexpectedrateofreturnonplanassetsformeasuring2008pensionexpenseorincomeis8.25%fortheU.S.plan.TheassetstudyforecastedexpectedratesofreturnfortheapproximatedurationoftheCompany’sbenefitobligations,usingcapitalmarketdataandhistoricalrelationships.
Thediscountrateischosenastherateatwhichpensionobliga-tionscouldbeeffectivelysettledandisbasedoncapitalmarketconditionsasofthemeasurementdate.Wehavematchedthetiminganddurationoftheexpectedcashflowsofourpensionobligationstoayieldcurvegeneratedfromabroadportfolioofhigh-qualityfixedincomedebtinstrumentstoselectourdiscountrate.Baseduponthiscashflowmatchinganalysis,weselectedaweightedaveragediscountratefortheU.S.plansof6.49%atDecember31,2007.
Netperiodiccostforourdefinedbenefitpensionplanswas$51.2million,$48.2millionand$32.4millionfortheyearsendedDecember31,2007,2006and2005,respectively.Theincreasingtrendinpensioncostovertheseperiodswasprimarilyduetothechangeinassumptionsfortherateofreturnonplanassets,thediscountrateandtherateofcompensationincreases.RefertoNote7totheConsolidatedFinancialStatementsformoreinformationregardingemployeebenefitplans.
OnSeptember29,2006,theFinancialAccountingStandardsBoardissuedSFASNo.158,Employers’AccountingforDefinedBenefitPensionandOtherPostretirementPlans.SFASNo.158waseffectiveforpubliccompaniesforfiscalyearsendingafterDecember15,2006.TheCompanyadoptedthebalancesheetrec-ognitionprovisionsofSFASNo.158attheendoffiscalyear2006.
TheCompanyhasevaluatedthepotentialimpactofthePensionProtectionAct(“theAct”),whichwaspassedintolawonAugust17,2006,onfutureU.S.pensionplanfundingrequirementsbasedoncurrentmarketconditions.TheActisnotanticipatedtohaveamaterialeffectontheleveloffuturefundingrequirementsorontheCompany’sliquidityandcapitalresources.

23
QuarterlyResultsofOperations
Thepreparationofinterimconsolidatedfinancialstatementsrequiresmanagementtomakeestimatesandassumptionsfortheamountsreportedintheinterimcondensedconsolidatedfinancialstatements.Specifically,theCompanymakescertainestimatesinitsinterimconsolidatedfinancialstatementsfortheaccrualofbaddebts,inventoryadjustmentsanddiscountsandvolumeincentivesearned.Baddebtsareaccruedbasedonapercentageofsales,andvolumeincentivesareestimatedbaseduponcumulativeandprojectedpurchasinglevels.InventoryadjustmentsareaccruedonaninterimbasisandadjustedinthefourthquarterbasedontheannualOctober31book-to-physicalinventoryadjustment.Themethodologyandpracticesusedinderivingestimatesforinterimreportingtypicallyresultinadjust-mentsuponaccuratedeterminationatyear-end.Theeffectoftheseadjustmentsin2007and2006wasnotsignificant.
ThefollowingisasummaryofthequarterlyresultsofoperationsfortheyearsendedDecember31,2007and2006:
ThreeMonthsEnded March31, June30, Sept.30, Dec.31, (in thousands except per share data)2007 NetSales $2,648,843 $2,769,527 $2,797,556 $2,627,269GrossProfit* 789,944 824,585 824,488 778,206NetIncome 121,553 130,121 128,580 126,085EarningsPerShare: Basic .71 .76 .76 .76Diluted .71 .76 .76 .75 2006 NetSales $2,553,552 $2,661,805 $2,699,641 $2,542,944GrossProfit* 760,477 782,182 787,295774,541NetIncome 113,925 120,680 121,333 119,467EarningsPerShare: Basic .66 .70 .71 .70Diluted .66 .70 .71 .70
*TheCompanyreclassifiedcertainwarehousing,distribution andhandlingcostsfromoperatingexpensestocostofgoods sold,resultinginareductiontogrossprofitfortheperiods presented.Thesecostsamountto$42million,$45million, $46millionand$43millioninthefirst,second,thirdand fourthquartersoffiscal2007,respectively,and$43million, $43million,$44millionand$41millioninthefirst,second, thirdandfourthquartersoffiscal2006,respectively.The reclassificationhadnoeffectonnetsales,netincome,basic earningspershareordilutedearningspershare.
Werecordedthequarterlyearningspershareamountsasifeachquarterwasadiscreteperiod.Asaresult,thesumofthebasicanddilutedearningspersharebyquarterwillnotnecessarilytotaltheannualbasicanddilutedearningspershare.
Forward-LookingStatements
Somestatementsinthisreport,aswellasinothermaterialswefilewiththeSECorotherwisereleasetothepublicandinmaterialsthatwemakeavailableonourwebsite,constituteforward-lookingstatementsthataresubjecttothesafeharborprovisionsofthePrivateSecuritiesLitigationReformActof1995.Seniorofficersmayalsomakeverbalstatementstoanalysts,investors,themediaandothersthatareforward-looking.Forward-lookingstatementsmayrelate,forexample,tofutureoperations,prospects,strategies,financialcondition,economicperformance(includinggrowthandearnings),industryconditionsanddemandforourproductsandservices.TheCompanycautionsthatitsforward-lookingstatementsinvolverisksanduncertainties,andwhilewebelievethatourexpectationsforthefuturearereasonableinviewofcurrentlyavailableinformation,youarecautionednottoplaceunduerelianceonourforward-lookingstatements.Actualresultsoreventsmaydiffermateriallyfromthoseindicatedasaresultofvariousimportantfactors.Suchfactorsinclude,butarenotlimitedto,changesingeneraleconomicconditions,thegrowthrateofthemarketfortheCompany’sproductsandservices,theabilitytomaintainfavorablesupplierarrangementsandrela-tionships,competitiveproductandpricingpressures,includinginternetrelatedinitiatives,theeffectivenessoftheCompany’spromotional,marketingandadvertisingprograms,changesinlawsandregulations,includingchangesinaccountingandtaxa-tionguidance,theuncertaintiesoflitigation,aswellasotherrisksanduncertaintiesdiscussedfromtimetotimeintheCompany’sfilingswiththeSEC.
Forward-lookingstatementsareonlyasofthedatetheyaremade,andtheCompanyundertakesnodutytoupdateitsforward-lookingstatementsexceptasrequiredbylaw.Youareadvised,however,toreviewanyfurtherdisclosureswemakeonrelatedsubjectsinourForm10-Q,Form8-KandotherreportstotheSEC.

24
report of management
GenuinePartsCompany
Management’s Responsibility for the Financial StatementsWehavepreparedtheaccompanyingconsolidatedfinancialstatementsandrelatedinformationincludedhereinfortheyearsendedDecember31,2007,2006and2005.TheopinionofErnst&YoungLLP,theCompany’sindependentregisteredpublicaccountingfirm,onthoseconsolidatedfinancialstatementsisincludedherein.Theprimaryresponsibilityfortheintegrityofthefinancialinformationincludedinthisannualreportrestswithmanagement.Suchinformationwaspreparedinaccordancewithgenerallyacceptedaccountingprinciplesappropriateinthecircumstancesbasedonourbestestimatesandjudgmentsandgivingdueconsiderationtomateriality.
Management’s Report on Internal Control over Financial ReportingThemanagementofGenuinePartsCompanyanditssubsidiaries(the“Company”)isresponsibleforestablishingandmaintainingadequateinternalcontroloverfinancialreportingasdefinedinRule13a-15(f )undertheSecuritiesExchangeActof1934.
TheCompany’sinternalcontrolsystemwasdesignedtoprovidereasonableassurancetotheCompany’smanagementandtotheboardofdirectorsregardingthepreparationandfairpresentationoftheCompany’spublishedconsolidatedfinancialstatements.TheCompany’sinternalcontroloverfinancialreportingincludesthosepoliciesandproceduresthat:
i. pertaintothemaintenanceofrecordsthat,inreasonable detail,accuratelyandfairlyreflectthetransactionsand dispositionsoftheassetsoftheCompany;
ii. providereasonableassurancethattransactionsarerecorded asnecessarytopermitpreparationoffinancialstatementsin accordancewithU.S.generallyacceptedaccountingprinciples, andthatreceiptsandexpendituresoftheCompanyarebeing madeonlyinaccordancewithauthorizationsofmanagement anddirectorsoftheCompany;and
iii. providereasonableassuranceregardingpreventionortimely detectionofunauthorizedacquisition,useordispositionof theCompany’sassetsthatcouldhaveamaterialeffecton thefinancialstatements.
Allinternalcontrolsystems,nomatterhowwelldesigned,haveinherentlimitationsandmaynotpreventordetectmisstate-ments.Therefore,eventhosesystemsdeterminedtobeeffectivecanprovideonlyreasonableassurancewithrespecttofinancialstatementpreparationandpresentation.Also,projectionsofanyevaluationofeffectivenesstofutureperiodsaresubjecttotheriskthatcontrolsmaybecomeinadequatebecauseofchangesinconditionsorthatthedegreeofcompliancewiththepoliciesorproceduresmaydeteriorate.
TheCompany’smanagement,includingourChiefExecutiveOfficerandChiefFinancialOfficer,assessedtheeffectivenessoftheCompany’sinternalcontroloverfinancialreportingasofDecember31,2007.Inmakingthisassessment,itusedthecriteriasetforthbytheCommitteeofSponsoringOrganizationsoftheTreadwayCom-mission(COSO)in“InternalControl-IntegratedFramework.”Basedonthisassessment,managementconcludedthat,asofDecember31,2007,theCompany’sinternalcontroloverfinan-cialreportingwaseffective.
Ernst&YoungLLPhasissuedanauditreportontheCompany’soperatingeffectivenessofinternalcontroloverfinancialreportingasofDecember31,2007.Thisreportappearsonpage25.
Audit Committee ResponsibilityTheAuditCommitteeofGenuinePartsCompany’sBoardofDirectorsisresponsibleforreviewingandmonitoringtheCompany’sfinancialreportsandaccountingpracticestoascertainthattheyarewithinacceptablelimitsofsoundpracticeinsuchmatters.ThemembershipoftheCommitteeconsistsofnon-employeeDirectors.Atperiodicmeetings,theAuditCommitteediscussesauditandfinancialreportingmattersandtheinternalauditfunctionwithrepresentativesoffinancialmanagementandwithrepresentativesfromErnst&YoungLLP.
JERRYW.NIXViceChairmanandChiefFinancialOfficerFebruary26,2008

Report of Independent Registered Public Accounting Firm on Internal Control over Financial Reporting
The Board of Directors and Shareholders of Genuine Parts Company
WehaveauditedGenuinePartsCompany’sinternalcontroloverfinancialreportingasofDecember31,2007,basedoncriteriaestablishedinInternalControl—IntegratedFrameworkissuedbytheCommitteeofSponsoringOrganizationsoftheTreadwayCommission(theCOSOcriteria).GenuinePartsCompany’smanagementisresponsibleformaintainingeffectiveinternalcontroloverfinancialreporting,andforitsassessmentoftheeffectivenessofinternalcontroloverfinancialreportingincludedintheaccompanyingReportofManagement.Ourrespon-sibilityistoexpressanopinionontheCompany’sinternalcontroloverfinancialreportingbasedonouraudit.
WeconductedourauditinaccordancewiththestandardsofthePublicCompanyAccountingOversightBoard(UnitedStates).Thosestandardsrequirethatweplanandperformtheaudittoobtainreasonableassuranceaboutwhethereffectiveinternalcontroloverfinancialreportingwasmaintainedinallmaterialrespects.Ourauditincludedobtaininganun-derstandingofinternalcontroloverfinancialreporting,assessingtheriskthatamaterialweaknessexists,testingandevaluatingthedesignandoperatingeffectivenessofinternalcontrolbasedontheassessedrisk,andperformingsuchotherproceduresasweconsiderednecessaryinthecircumstances.Webelievethatourauditprovidesareasonablebasisforouropinion.
Acompany’sinternalcontroloverfinancialreportingisaprocessdesignedtoprovidereasonableassuranceregardingthereliabilityoffinancialre-portingandthepreparationoffinancialstatementsforexternalpurposesinaccordancewithgenerallyacceptedaccountingprinciples.Acompany’sinternalcontroloverfinancialreportingincludesthosepoliciesandpro-ceduresthat(1)pertaintothemaintenanceofrecordsthat,inreasonabledetail,accuratelyandfairlyreflectthetransactionsanddispositionsoftheassetsofthecompany;(2)providereasonableassurancethattransactions
arerecordedasnecessarytopermitpreparationoffinancialstatementsinaccordancewithgenerallyacceptedaccountingprinciples,andthatreceiptsandexpendituresofthecompanyarebeingmadeonlyinaccor-dancewithauthorizationsofmanagementanddirectorsofthecompany;and(3)providereasonableassuranceregardingpreventionortimelyde-tectionofunauthorizedacquisition,use,ordispositionofthecompany’sassetsthatcouldhaveamaterialeffectonthefinancialstatements.
Becauseofitsinherentlimitations,internalcontroloverfinancialreport-ingmaynotpreventordetectmisstatements.Also,projectionsofanyevaluationofeffectivenesstofutureperiodsaresubjecttotheriskthatcontrolsmaybecomeinadequatebecauseofchangesinconditions,orthatthedegreeofcompliancewiththepoliciesorproceduresmaydeteriorate.
Inouropinion,GenuinePartsCompanymaintained,inallmaterialrespects,effectiveinternalcontroloverfinancialreportingasofDecember31,2007,basedontheCOSOcriteria.
Wealsohaveaudited,inaccordancewiththestandardsofthePublicCompanyAccountingOversightBoard(UnitedStates),theconsolidatedbalancesheetsofGenuinePartsCompanyasofDecember31,2007and2006,andtherelatedconsolidatedstatementsofincome,shareholders’equity,andcashflowsforeachofthethreeyearsintheperiodendedDecember31,2007ofGenuinePartsCompanyandourreportdatedFebruary26,2008expressedanunqualifiedopinionthereon.
Atlanta,GeorgiaFebruary26,2008
Report of Independent Registered Public Accounting Firm on the Financial Statements
The Board of Directors and Shareholders of Genuine Parts Company
WehaveauditedtheaccompanyingconsolidatedbalancesheetsofGenuinePartsCompanyasofDecember31,2007and2006,andtherelatedconsolidatedstatementsofincome,shareholders’equity,andcashflowsforeachofthethreeyearsintheperiodendedDecember31,2007.ThesefinancialstatementsaretheresponsibilityoftheCompany’sman-agement.Ourresponsibilityistoexpressanopiniononthesefinancialstatementsbasedonouraudits.
WeconductedourauditsinaccordancewiththestandardsofthePublicCompanyAccountingOversightBoard(UnitedStates).ThosestandardsrequirethatweplanandperformtheaudittoobtainreasonableassurancewhetherthefinancialstatementsarefreeofmaterialmisstatementAnauditincludesexamining,onatestbasis,evidencesupportingtheamountsanddisclosuresinthefinancialstatements.Anauditalsoincludesassessingtheaccountingprinciplesusedandsignificantestimatesmadebymanage-ment,aswellasevaluatingtheoverallfinancialstatementpresentation.Webelievethatourauditsprovideareasonablebasisforouropinion.
Inouropinion,thefinancialstatementsreferredtoabovepresentfairly,inallmaterialrespects,theconsolidatedfinancialpositionofGenuinePartsCompanyatDecember31,2007and2006,andtheconsolidated
resultsofitsoperationsanditscashflowsforeachofthethreeyearsintheperiodendedDecember31,2007,inconformitywithU.S.generallyacceptedaccountingprinciples.
AsdiscussedinNote7,effectiveDecember31,2006,theCompanyad-optedStatementofFinancialAccountingStandardsNo.158,Employers’AccountingforDefinedBenefitPensionandOtherPostretirementPlans.
Wealsohaveaudited,inaccordancewiththestandardsofthePublicCompanyAccountingOversightBoard(UnitedStates),GenuinePartsCompany’sinternalcontroloverfinancialreportingasofDecember31,2007,basedoncriteriaestablishedinInternalControl-IntegratedFrameworkissuedbytheCommitteeofSponsoringOrganizationsoftheTreadwayCommissionandourreportdatedFebruary26,2008expressedanunqualifiedopinionthereon.
Atlanta,GeorgiaFebruary26,2008
25
2626
Consolidated Balance Sheets
(in thousands, except share data and per share amounts) December 31, 2007 2006 Assets Currentassets: Cashandcashequivalents $ 231,837 $ 135,973 Tradeaccountsreceivable,net 1,216,220 1,227,805 Merchandiseinventories,net 2,335,716 2,236,368 Prepaidexpensesandothercurrentassets 269,239 234,981Totalcurrentassets 4,053,012 3,835,127 Goodwillandintangibleassets,less accumulatedamortization 82,453 62,254 Otherassets 212,615 170,343 Property,plant,andequipment: Land 47,415 50,726 Buildings,lessallowancefordepreciation (2007–$153,869;2006–$142,324) 143,685 162,679 Machineryandequipment,lessallowancefor depreciation(2007–$469,909;2006–$418,815) 234,889 215,855Netproperty,plant,andequipment 425,989 429,260 $ 4,774,069 $ 4,496,984
Liabilities and Shareholders’ Equity Currentliabilities: Tradeaccountspayable $ 989,816 $ 910,263 Currentportionofdebt 250,000 – Accruedcompensation 102,027 95,770 Otheraccruedexpenses 99,766 97,284 Dividendspayable 60,789 57,552 Incometaxespayable 45,578 37,899Totalcurrentliabilities 1,547,976 1,198,768 Long-termdebt 250,000 500,000Minorityinterestsinsubsidiaries 66,230 60,716Otherlong-termliabilities 193,147 187,509 Shareholders’equity: Preferredstock,parvalue$1pershare– authorized10,000,000shares;noneissued – – Commonstock,parvalue$1pershare– authorized450,000,000shares;issued andoutstanding166,065,250in2007 and170,530,874sharesin2006 166,065 170,531 Accumulatedothercomprehensive(loss)income (123,715) (242,534) Retainedearnings 2,674,366 2,621,994Totalshareholders’equity 2,716,716 2,549,991 $ 4,774,069 $ 4,496,984
See accompanying notes.

2727
Consolidated Statements of Income
(in thousands, except per share amounts) Year ended December 31, 2007 2006 2005 Netsales $ 10,843,195 $ 10,457,942 $ 9,783,050 Costofgoodssold 7,625,972 7,353,447 6,884,964Grossmargin 3,217,223 3,104,495 2,898,086 Operatingexpenses: Selling,administrative,andotherexpenses 2,278,155 2,217,882 2,078,308 Depreciationandamortization 87,702 73,423 65,529 Provisionfordoubtfulaccounts 13,514 16,472 16,356Totaloperatingexpenses 2,379,371 2,307,777 2,160,193 Non-operatingexpenses(income): Interestexpense 31,327 31,576 34,024 Other (10,220) (5,774) (5,195)Totalnon-operatingexpenses 21,107 25,802 28,829 Incomebeforeincometaxes 816,745 770,916 709,064Incometaxes 310,406 295,511 271,630Netincome $ 506,339 $ 475,405 $ 437,434 Basicnetincomepercommonshare $ 2.99 $ 2.77 $ 2.51 Dilutednetincomepercommonshare $ 2.98 $ 2.76 $ 2.50 Weightedaveragecommonsharesoutstanding 169,129 171,576 174,054Dilutiveeffectofstockoptionsandnon-vested restrictedstockawards 1,006 910 953Weightedaveragecommonsharesoutstanding- assumingdilution 170,135 172,486 175,007 See accompanying notes.

28
Consolidated Statements of Shareholders’ Equity
Accumulated Additional Other Total CommonStock Paid-In Comprehensive Retained Shareholders’(in thousands, except share and per share amounts) Shares Amount Capital Income(Loss) Earnings Equity
BalanceatJanuary1,2005 174,964,884 $ 174,965 $ 56,571 $ 26,478 $ 2,286,363 $2,544,377 Netincome – – – – 437,434 437,434 Foreigncurrencytranslationadjustment – – – 14,351 – 14,351 Changesinfairvalueofderivative instruments,netofincometaxesof$2,041 – – – 3,372 – 3,372 Changeinminimumpensionliability, netofincometaxesof$(258) – – – 1,334 – 1,334 Comprehensiveincome 456,491 Cashdividendsdeclared,$1.25pershare – – – – (217,523) (217,523) Stockoptionsexercised,including taxbenefitof$5,242 852,745 853 22,114 – – 22,967 Stock-basedcompensation – – 6,884 – – 6,884 Purchaseofstock (2,784,932) (2,785) (85,569) – (30,885) (119,239)BalanceatDecember31,2005 173,032,697 173,033 – 45,535 2,475,389 2,693,957 Netincome – – – – 475,405 475,405 Foreigncurrencytranslationadjustment – – – (2,341) – (2,341) Changesinfairvalueofderivative instruments,netofincometaxesof$201 – – – 322 – 322 Changeinminimumpensionliability, netofincometaxesof$922 – – – (1,265) – (1,265) Comprehensiveincome 472,121 Pensionandpostretirementbenefit adjustment,netofincometaxes of$187,371(1) – – – (284,785) – (284,785) Cashdividendsdeclared,$1.35pershare – – – – (231,454) (231,454) Stockoptionsexercised,including taxbenefitof$3,005 432,694 433 11,249 – – 11,682 Stock-basedcompensation – – 11,948 – – 11,948 Purchaseofstock (2,934,517) (2,935) (23,197) – (97,346) (123,478)
BalanceatDecember31,2006 170,530,874 170,531 – (242,534) 2,621,994 2,549,991 Netincome – – – – 506,339 506,339 Foreigncurrencytranslationadjustment – – – 78,877 – 78,877 Changesinfairvalueofderivative instruments,netofincometaxesof$184 – – – 296 – 296 Pensionandpostretirementbenefit adjustment,netofincometaxesof$24,278 – – – 39,646 – 39,646 Comprehensiveincome 625,158 Cashdividendsdeclared,$1.46pershare – – – – (246,481) (246,481) Stockoptionsexercised,including taxbenefitof$4,438 530,262 530 14,438 – – 14,968 Stock-basedcompensation – – 14,300 – – 14,300 Purchaseofstock (4,995,886) (4,996) (28,738) – (207,486) (241,220)
BalanceatDecember31,2007 166,065,250 $ 166,065 $ – $(123,715) $ 2,674,366 $2,716,716
See accompanying notes.
(1) The pension and postretirement benefit adjustment relates to the adoption of SFAS No. 158 as described further in Note 7.

29
Consolidated Statements of Cash Flows
(in thousands) Year ended December 31, 2007 2006 2005 Operating activities Netincome $ 506,339 $ 475,405 $ 437,434Adjustmentstoreconcilenetincome tonetcashprovidedbyoperatingactivities: Depreciationandamortization 87,702 73,423 65,529 Excesstaxbenefitsfromshare-basedcompensation (4,438) (3,005) – (Gain)lossonsaleofproperty,plant,andequipment (2,214) 509 (2,675) Deferredincometaxes (8,066) (5,481) 43,935 Minorityinterests 4,939 3,991 3,271 Stock-basedcompensation 14,300 11,948 12,126 Changesinoperatingassetsandliabilities: Tradeaccountsreceivable,net 38,330 (31,821) (59,949) Merchandiseinventories,net (42,087) (7,240) (19,869) Tradeaccountspayable 65,103 (66,116) 112,087 Otherlong-termassets (11,806) (7,052) (118,358) Other,net (6,631) (11,061) (33,014) 135,132 (41,905) 3,083Netcashprovidedbyoperatingactivities 641,471 433,500 440,517 Investing activities Purchasesofproperty,plantandequipment (115,648) (126,044) (85,714)Proceedsfromsaleofproperty,plant,andequipment 67,656 4,452 7,110Acquisitionofbusinessesandotherinvestments (44,855) (29,007) (27,518)Proceedsfromdisposalofbusinesses 5,249 – 35,948Other – 5,000 –Netcashusedininvestingactivities (87,598) (145,599) (70,174) Financing activities Proceedsfromcreditfacilities – 160,000 113,432Paymentsoncreditfacilities – (160,881) (113,519)Stockoptionsexercised 10,530 8,677 17,725Excesstaxbenefitsfromshare-basedcompensation 4,438 3,005 –Dividendspaid (243,244) (228,052) (215,868)Purchaseofstock (241,220) (123,478) (119,239)Netcashusedinfinancingactivities (469,496) (340,729) (317,469)Effectofexchangeratechangesoncash 11,487 (110) 1,097Netincrease(decrease)incashandcashequivalents 95,864 (52,938) 53,971Cashandcashequivalentsatbeginningofyear 135,973 188,911 134,940Cashandcashequivalentsatendofyear $ 231,837 $ 135,973 $ 188,911 Supplemental disclosures of cash flow information Cashpaidduringtheyearfor: Incometaxes $ 324,399 $ 285,696 $ 235,384 Interest $ 31,540 $ 32,521 $ 33,544 See accompanying notes.

30
notes to consolidated financial statements
december 31, 2007
1.SummaryofSignificantAccountingPolicies
BusinessGenuinePartsCompanyandallofitsmajority-ownedsubsidiaries(theCompany)isadistributorofautomotivereplacementparts,industrialreplacementparts,officeproducts,andelectrical/elec-tronicmaterials.TheCompanyservesadiversecustomerbasethroughmorethan2,000locationsinNorthAmericaand,there-fore,haslimitedexposurefromcreditlossestoanyparticularcustomer,region,orindustrysegment.TheCompanyperformsperiodiccreditevaluationsofitscustomers’financialconditionandgenerallydoesnotrequirecollateral.
Principles of ConsolidationTheconsolidatedfinancialstatementsincludealloftheaccountsoftheCompany.Incomeapplicabletominorityinterestsisincludedinothernon-operatingexpenses(income).Significantintercompanyaccountsandtransactionshavebeeneliminatedinconsolidation.
Use of EstimatesThepreparationoftheconsolidatedfinancialstatements,inconformitywithU.S.generallyacceptedaccountingprinciples,requiresmanagementtomakeestimatesandassumptionsthataffecttheamountsreportedintheconsolidatedfinancialstate-mentsandaccompanyingnotes.Actualresultsmaydifferfromthoseestimatesandthedifferencescouldbematerial.
Revenue RecognitionTheCompanyrecognizesrevenuesfromproductsalesuponshipmenttoitscustomers.
Foreign Currency TranslationTheconsolidatedbalancesheetsandstatementsofincomeoftheCompany’sforeignsubsidiarieshavebeentranslatedintoU.S.dollarsatthecurrentandaverageexchangerates,respectively.Theforeigncurrencytranslationadjustmentisincludedasacomponentofaccumulatedothercomprehensive(loss)income.Cash and Cash EquivalentsTheCompanyconsidersallhighlyliquidinvestmentswithmaturi-tiesofthreemonthsorlesswhenpurchasedtobecashequivalents.
Trade Accounts Receivable and the Allowance for Doubtful AccountsTheCompanyevaluatesthecollectabilityoftradeaccountsre-ceivablebasedonacombinationoffactors.Initially,theCompanyestimatesanallowancefordoubtfulaccountsasapercentageofnetsalesbasedonhistoricalbaddebtexperience.ThisinitialestimateisperiodicallyadjustedwhentheCompanybecomesawareofaspecificcustomer’sinabilitytomeetitsfinancialobligations(e.g.,bankruptcyfiling)orasaresultofchangesintheoverallagingofaccountsreceivable.WhiletheCompanyhasalargecustomerbasethatisgeographicallydispersed,
ageneraleconomicdownturninanyoftheindustrysegmentsinwhichtheCompanyoperatescouldresultinhigherthanexpecteddefaults,and,therefore,theneedtoreviseestimatesforbaddebts.FortheyearsendedDecember31,2007,2006,and2005,theCompanyrecordedprovisionsforbaddebtsofapproximately$13,514,000,$16,472,000,and$16,356,000,respectively.AtDecember31,2007and2006,theallowancefordoubtfulaccountswasapproximately$15,521,000and$13,456,000,respectively.
Merchandise Inventories, Including Consideration Received From VendorsMerchandiseinventoriesarevaluedatthelowerofcostormarket.Costisdeterminedbythelast-in,first-out(LIFO)methodforamajorityofautomotiveparts,electrical/electronicmaterials,andindustrialparts,andbythefirst-in,first-out(FIFO)methodforofficeproductsandcertainotherinventories.IftheFIFOmethodhadbeenusedforallinventories,costwouldhavebeenapproximately$326,816,000and$293,464,000higherthanreportedatDecember31,2007and2006,respectively.
TheCompanyidentifiesslowmovingorobsoleteinventoriesandestimatesappropriateprovisionsrelatedthereto.Historically,theselosseshavenotbeensignificantasthevastmajorityoftheCompany’sinventoriesarenothighlysusceptibletoobsolescenceandareeligibleforreturnundervariousvendorreturnprograms.WhiletheCom-panyhasnoreasontobelieveitsinventoryreturnprivilegeswillbediscontinuedinthefuture,itsriskoflossassociatedwithobsoleteorslowmovinginventorieswouldincreaseifsuchweretooccur.TheCompanyentersintoagreementsatthebeginningofeachyearwithmanyofitsvendorsprovidingforinventorypurchaseincentivesandadvertisingallowances.Generally,theCompanyearnsinventorypurchaseincentivesandadvertisingallowancesuponachievingspecifiedvolumepurchasinglevelsorothercri-teria.TheCompanyaccruesforthereceiptofinventorypurchaseincentivesandadvertisingallowancesaspartofitsinventorycostbasedoncumulativepurchasesofinventorytodateandprojectedinventorypurchasesthroughtheendoftheyear,or,inthecaseofspecificadvertisingallowances,uponcompletionoftheCompany’sobligationsrelatedthereto.WhilemanagementbelievestheCompanywillcontinuetoreceiveconsiderationfromvendorsin2008andbeyond,therecanbenoassurancethatvendorswillcontinuetoprovidecomparableamountsofincentivesandallowancesinthefuture.
Prepaid Expenses and Other Current AssetsPrepaidexpensesandothercurrentassetsconsistprimarilyofprepaidexpensesandamountsduefromvendors.

31
Goodwill and Other Intangible AssetsGoodwillandotherintangibleassetsprimarilyrepresenttheex-cessofthepurchasepricepaidoverthefairvalueofthenetassetsacquiredinconnectionwithbusinessacquisitions.StatementofFinancialAccountingStandards(SFAS)No.142,Goodwill and Other Intangible Assets(SFASNo.142)requiresthatwhenthefairvalueofgoodwillislessthantherelatedcarryingvalue,enti-tiesarerequiredtoreducetheamountofgoodwill.InaccordancewiththeprovisionsofSFASNo.142,theCompanyreviewsitsgoodwillannuallyinthefourthquarter,orsoonerifcircum-stancesindicatethatthecarryingamountmayexceedfairvalue.Nogoodwillimpairmentshavebeenrecordedin2007,2006,or2005.Theimpairment-onlyapproachrequiredbySFASNo.142mayhavetheeffectofincreasingthevolatilityoftheCompany’searningsifgoodwillimpairmentoccursatafuturedate.
SFASNo.142alsorequiresthatentitiesdiscontinueamortiza-tionofallpurchasedgoodwill,includingamortizationofgood-willrecordedinpastbusinesscombinations.Accordingly,theCompanynolongeramortizesgoodwill.Other AssetsOtherassetsarecomprisedofthefollowing:
(in thousands) December 31, 2007 2006 Retirementbenefitassets $ 45,680 $ 12,951Investmentaccountedforunderthecostmethod 21,400 21,400Cashsurrendervalueoflifeinsurancepolicies 55,937 49,294Deferredtaxasset 35,778 38,839Other 53,820 47,859Totalotherassets $ 212,615 $ 170,343
Property, Plant, and EquipmentProperty,plant,andequipmentarestatedatcost.Buildingsin-cludecertainleasescapitalizedatDecember31,2007and2006.Depreciationandamortizationisprimarilydeterminedonastraight-linebasisoverthefollowingestimatedusefullifeofeachasset:buildingsandimprovements,10to40years;machineryandequipment,5to15years.
Long-Lived Assets Other Than GoodwillTheCompanyassessesitslong-livedassetsotherthangoodwillforimpairmentwheneverfactsandcircumstancesindicatethatthecarryingamountmaynotbefullyrecoverable.Toanalyzerecoverability,theCompanyprojectsundiscountednetfuturecashflowsovertheremaininglifeofsuchassets.Iftheseprojectedcashflowsarelessthanthecarryingamount,animpairment
wouldberecognized,resultinginawrite-downofassetswithacorrespondingchargetoearnings.Impairmentlosses,ifany,aremeasuredbaseduponthedifferencebetweenthecarryingamountandthefairvalueoftheassets.
Other Long-Term LiabilitiesOtherlong-termliabilitiesarecomprisedofthefollowing:(in thousands) December 31, 2007 2006 Retirementandpost-employmentbenefitliabilities $ 100,060 $ 116,374Obligationsundercapitalandotherleases 13,707 12,248Insuranceliabilities 36,723 39,558Deferredgainonsale-leaseback 19,458 –Other 23,199 19,329Totalotherlong-termliabilities $ 193,147 $ 187,509
TheCompany’sretirementandpost-employmentbenefitliabilitiesconsistprimarilyofactuariallydeterminedobligationsrelatedtocertainretireebenefitsasdiscussedfurtherinNote7.SeeNote4forfurtherdiscussionoftheCompany’sobligationsundercapitalleasesandthesale-leasebacktransaction.
Insuranceliabilitiesconsistprimarilyofreservesfortheworkers’compensationprogram.TheCompanycarriesvariouslargeriskdeductibleworkers’compensationpoliciesforthemajorityofworkers’compensationliabilities.TheCompanyrecordstheworkers’compensationreservesbasedonananalysisperformedbyanindependentactuary.Theanalysiscalculatesdevelopmentfactors,whichareappliedtototalreservesasprovidedbythevariousinsurancecompanieswhounderwritetheprogram.WhiletheCompanybelievesthattheassumptionsusedtocalculatetheseliabilitiesareappropriate,significantdifferencesinactualexperienceorsignificantchangesintheseassumptionsmaymateriallyaffectworkers’compensationcosts.
Self-InsuranceTheCompanyisself-insuredforthemajorityofgrouphealthinsurancecosts.AreserveforclaimsincurredbutnotreportedisdevelopedbyanalyzinghistoricalclaimsdataprovidedbytheCompany’sclaimsadministrators.WhiletheCompanybelievesthattheassumptionsusedtocalculatetheseliabilitiesareap-propriate,significantdifferencesfromhistoricaltrendsmaymateriallyimpactfinancialresults.Thesereservesareincludedinaccruedexpensesintheaccompanyingconsolidatedbalancesheetsastheexpensesareexpectedtobepaidwithinoneyear.

32
notes to consolidated financial statements (continued)
december 31, 2007
1.SummaryofSignificantAccountingPolicies(continued)
Accumulated Other Comprehensive (Loss) IncomeAccumulatedothercomprehensive(loss)incomeiscomprisedofthefollowing:
(in thousands) December 31, 2007 2006 Foreigncurrencytranslation $ 129,700 $ 50,823Netunrealizedlossonderivativeinstruments,netoftaxes – (296)Unrecognizednetactuarialloss,netoftax (250,846) (290,461)Unrecognizedpriorservicecost,netoftax (2,569) (2,600)Totalaccumulatedothercomprehensiveloss $(123,715) $(242,534)
Fair Value of Financial InstrumentsThecarryingamountsreflectedintheconsolidatedbalancesheetsforcashandcashequivalents,tradeaccountsreceivableandtradeaccountspayableapproximatetheirrespectivefairvaluesbasedontheshort-termnatureoftheseinstruments.AtDecember31,2007and2006,thefairmarketvalueoffixedratedebtwasapproximately$529,000,000and$511,000,000,respectively,basedprimarilyonquotedpricesfortheseorsimilarinstruments.Thefairvalueoffixedratedebtwasestimatedbycalculatingthepresentvalueofanticipatedcashflows.Thediscountrateusedwasanestimatedborrowingrateforsimilardebtinstrumentswithlikematurities.
Shipping and Handling CostsShippingandhandlingcostsareclassifiedasselling,adminis-trativeandotherexpensesintheaccompanyingconsolidatedstatementsofincomeandtotaledapproximately$140,000,000,$130,000,000,and$100,000,000intheyearsendedDecember31,2007,2006,and2005,respectively.
Advertising CostsAdvertisingcostsareexpensedasincurredandtotaled$44,700,000,$49,700,000,and$44,100,000intheyearsendedDecember31,2007,2006,and2005,respectively.
Stock CompensationTheCompanymaintainsvariousLong-TermIncentivePlans,whichprovideforthegrantingofstockoptions,stockapprecia-tionrights,restrictedstock,restrictedstockunits,performanceawards,dividendequivalents,andothershare-basedawards.
EffectiveJanuary1,2003,theCompanyprospectivelyadoptedthefairvaluemethodofaccountingforstockcompensation.
TheCompanyrecognizescompensationexpensebasedonthestraight-linemethod.UntilJanuary1,2003,theCompanyhadelectedtofollowAccountingPrinciplesBoardOpinionNo.25,Accounting for Stock Issued to Employees(APBNo.25),andrelatedInterpretationsinaccountingforstockcompensation.UnderAPBNo.25,nocompensationexpensewasrecognizediftheexercisepriceofstockoptionsequaledorexceededthemarketpriceoftheunderlyingstockonthedateofgrant.ProformainformationregardingnetincomeandearningspershareisrequiredbySFASNo.123,asamended,determinedasiftheCompanyhadaccountedforitsemployeestockoptionsgrantedsubsequenttoDecember31,1994,underthefairvaluemethodofSFASNo.123.
EffectiveJanuary1,2006,theCompanyadoptedSFASNo.123(R)choosingthe“modifiedprospective”method.Compensa-tioncostrecognizedfortheyearsendedDecember31,2007and2006,includes:(a)compensationcostforallshare-basedpay-mentsgrantedpriorto,butnotyetvestedasofJanuary1,2006,basedonthegrantdatefairvalueestimatedinaccordancewiththeoriginalprovisionsofSFASNo.123;and(b)compensationcostforallshare-basedpaymentsgrantedsubsequenttoJanuary1,2006,basedonthegrantdatefairvalueestimatedwiththeprovisionsofSFASNo.123(R).Resultsforpriorperiodshavenotbeenrestated.Mostoptionsmaybeexercisednotearlierthantwelvemonthsnorlaterthantenyearsfromthedateofgrant.
Net Income per Common ShareBasicnetincomepercommonshareiscomputedbydividingnetincomebytheweightedaveragenumberofcommonsharesout-standingduringtheyear.Thecomputationofdilutednetincomepercommonshareincludesthedilutiveeffectofstockoptionsandnon-vestedrestrictedstockawards.
ReclassificationsCertainpriorperiodamountshavebeenreclassifiedtoconformtothecurrentyearpresentation.TheCompanydeterminedthatcertainofthebusiness’warehousing,distribution,andhandlingcostspreviouslyclassifiedintheconsolidatedstatementsofincomeascomponentsofselling,administrativeandotherexpensesshouldbeclassifiedascostofgoodssoldtobeconsistentwiththeCompany’spolicyofcapitalizingthesecostsininventory.Thesecostsamountto$171,000,000and$166,000,000forfiscalyears2006and2005,respectively.Thereclassificationhadnoeffectonnetsales,operatingmargins,netincomeordilutedearningpershare.Suchreclassificationswereconsideredtobeimmaterialforallperiods.
Recently Issued Accounting Pronouncements OnSeptember15,2006,theFASBissuedSFASNo.157,Fair Value Measurements (SFASNo.157).SFASNo.157definesfair

33
value,establishesaframeworkformeasuringfairvalueinaccordancewithaccountingprinciplesgenerallyacceptedintheUnitedStates,andexpandsdisclosuresaboutfairvaluemeasure-ments.SFASNo.157doesnotexpandtheuseoffairvalueinanynewcircumstances.Theprovisionsofthisstatementaretobeap-pliedprospectivelyasofthebeginningofthefiscalyearinwhichthisstatementisinitiallyapplied,withanytransitionadjustmentrecognizedasacumulative-effectadjustmenttotheopeningbalanceofretainedearnings.TheprovisionsofSFASNo.157,asissued,areeffectiveforthefiscalyearsbeginningafterNovember15,2007.However,attheFebruary6,2008meeting,theFASBagreedtodeferforoneyeartheeffectivedateofStatement157forallnon-financialassetsandnon-financialliabilities,exceptthosethatarerecognizedordisclosedatfairvalueinthefinancialstatementsonarecurringbasis(thatis,atleastannually).TheCompanydoesnotexpectthatSFASNo.157willhaveasignifi-cantimpactontheCompany’sconsolidatedfinancialstatements.
InDecember2007,theFASBissuedSFASNo.141(Revised2007)(SFASNo.141(R)),Business Combinations.SFASNo.141(R)willchangetheaccountingforbusinesscombinations.UnderSFASNo.141(R),anacquiringentitywillberequiredtorecognizealltheassetsacquiredandliabilitiesassumedinatrans-actionattheacquisition-datefairvaluewithlimitedexceptions.SFASNo.141(R)willchangetheaccountingtreatmentanddisclosureforcertainspecificitemsinabusinesscombination.SFASNo.141(R)appliesprospectivelytobusinesscombinationsforwhichtheacquisitiondateisonorafterthebeginningofthefirstannualreportingperiodbeginningonorafterDecember15,2008.SFASNo.141(R)willhaveanimpactonaccountingforbusinesscombinationsonceadopted,buttheeffectisdependentuponacquisitionsatthattime.
InDecember2007,theFASBissuedSFASNo.160(SFASNo.160),Noncontrolling Interests in Consolidated Financial Statements —An Amendment of ARB No. 51.SFASNo.160establishesnewaccountingandreportingstandardsforthenon-controllinginterestinasubsidiaryandforthedeconsolidationofasubsidiary.SFASNo.160iseffectiveforfiscalyearsbeginningonorafterDecember15,2008.TheCompanydoesnotexpectthatSFASNo.160willhaveasignificantimpactontheCompany’sconsoli-datedfinancialstatements.2.GoodwillandOtherIntangibleAssets
InaccordancewithSFASNo.142,theCompanyperformedanannualgoodwillandindefinitelivedintangibleassetimpairmenttestduringthefourthquarterof2007,2006,and2005.Thepresentvalueoffuturecashflowsapproachwasusedtodetermineanypotentialimpairment.TheCompanydeterminedthattheseassetswerenotimpairedand,therefore,noimpairmentwasrecognizedfortheyearsendedDecember31,2007,2006,and2005.
ThechangesinthecarryingamountofgoodwillduringtheyearsendedDecember31,2007,2006,and2005byreportablesegment,aswellasotheridentifiableintangibleassets,aresummarizedasfollows(inthousands):
Goodwill Identifiable Automotive Industrial Office Intangible Products Assets TotalBalanceasofJanuary1,2005 $21,617 $31,170 $2,131 $2,754 $57,672Additions 2,270 239 – 2,932 5,441Amortization – – – (396) (396)BalanceasofDecember31,2005 23,887 31,409 2,131 5,290 62,717Amortization – – – (463) (463)BalanceasofDecember31,2006 23,887 31,409 2,131 4,827 62,254Additions 300 13,593 – 7,424 21,317Amortization – – – (1,118) (1,118)BalanceasofDecember31,2007 $24,187 $45,002 $ 2,131 $11,133 $82,453
3.CreditFacilities
TherewerenoamountssubjecttovariableratesatDecember31,2007and2006.TheweightedaverageinterestrateontheCompany’soutstandingborrowingswasapproximately6.05%atDecember31,2007and2006.
TheCompanymaintainsa$350,000,000unsecuredrevolvinglineofcreditwithaconsortiumoffinancialinstitutionsthatmaturesinDecember2012andbearsinterestatLIBORplus.23%(5.08%atDecember31,2007).TheCompanyalsohastheoptionunderthisagreementtoincreaseitsborrowinganadditional$200,000,000.NoamountswereoutstandingunderthislineofcreditatDecem-ber31,2007and2006.Certainborrowingscontaincovenantsrelatedtoamaximumdebt-to-capitalizationratioandcertainlimitationsonadditionalborrowings.AtDecember31,2007,theCompanywasincompliancewithallsuchcovenants.Duetotheworkerscompensationandinsurancereserverequirementsincertainstates,theCompanyalsohadunusedlettersofcreditof$56,453,000and$58,955,000outstandingatDecember31,2007and2006,respectively.

34
notes to consolidated financial statements (continued)
december 31, 2007
AmountsoutstandingundertheCompany’screditfacilitiesconsistofthefollowing:
(in thousands) December 31, 2007 2006 Unsecuredtermnotes: November30,2002,SeriesASeniorNotes,$250,000,000,5.86%fixed,dueNovember30,2008 $ 250,000 $ 250,000November30,2002,SeriesBSeniorNotes,$250,000,000,6.23%fixed,dueNovember30,2011 250,000 250,000Totaldebt 500,000 500,000Lessdebtduewithinoneyear 250,000 –Long-termdebt,excludingcurrentportion $ 250,000 $ 500,000
ApproximatematuritiesundertheCompany’screditfacilitiesareasfollows(inthousands):
2008 $ 250,000 2009 – 2010 – 2011 250,000 $ 500,000
4.LeasedProperties
InJune2003,theCompanycompletedanamendedandre-statedmasteragreementtoour$85,000,000constructionandleaseagreement(theAgreement).ThelessorintheAgreementisanindependentthird-partylimitedliabilitycompany,whichhasasitssolememberapubliclytradedcorporation.Proper-tiesacquiredbythelessorareconstructedand/orthenleasedtotheCompanyunderoperatingleaseagreements.NoadditionalpropertiesarebeingaddedtothisAgreement,astheconstructiontermhasended.TheCompanydoesnotbelievethelessorisavariableinterestentity,asdefinedinFASBInterpretationNo.46(R),Consolidation of Variable Interest Entities, an interpre-tation of ARB No. 51 (FINNo.46).Inaddition,theCompanyhasverifiedthatevenifthelessorwasdeterminedtobeavariableinterestentity,theCompanywouldnothavetoconsolidatethelessornortheassetsandliabilitiesassociatedwithpropertiesleasedtotheCompany.ThisisbecausetheassetsleasedundertheAgreementdonotexceed50%ofthetotalfairvalueofthelessor’sassets,excludinganyassetsthatshouldbeexcludedfromsuchcalculationunderFINNo.46,nordidthelessorfinance95%ormoreoftheleasedbalancewithnon-recoursedebt,targetequityorsimilarfunding.TheAgreementhasbeenaccountedfor
asanoperatingleaseunderSFASNo.13,Accounting for Leases(SFASNo.13)andrelatedinterpretations.FutureminimumrentalcommitmentsundertheAgreementhavebeenincludedinthetableoffutureminimumpaymentsbelow.
RentexpenserelatedtotheAgreementisrecordedunderselling,administrative,andotherexpensesinourconsolidatedstatementsofincomeandwas$4,877,000,$4,797,000,and$3,338,000fortheyearsendedDecember31,2007,2006,and2005,respectively.
InOctober2007,theCompanyenteredintoasale-leasebacktransactionwithafinancialinstitution.Inconnectionwiththetransaction,theCompanysoldcertainautomotiveretailstorepropertiesandimmediatelyleasedthepropertiesbackoveraleasetermoftwentyyears.Theleasewasclassifiedasanop-eratinglease.Netproceedsfromthetransactionamountedtoapproximately$56,000,000.TheCompanyrealizedanetgainofapproximately$20,000,000,whichwasdeferredandisbeingamortizedovertheleaseterm.Thedeferredgainisincludedinotherlong-termliabilitiesintheconsolidatedbalancesheetatDecember31,2007.
AtDecember31,2007and2006,buildingsinclude$15,400,000withaccumulateddepreciationof$8,336,000and$6,917,000,respectively,forleasesofdistributioncentersandstorescapital-ized.Depreciationexpenseforcapitalleaseswasapproximately$2,509,000,$4,585,000,and$3,466,000in2007,2006,and2005,respectively.
Futureminimumpayments,byyearandintheaggregate,underthecapitalandnoncancelableoperatingleaseswithinitialorremainingtermsofoneyearormoreconsistedofthefollowingatDecember31,2007(inthousands):
Capital Operating Leases Leases2008 $ 2,344 $ 131,6592009 2,158 98,1822010 1,760 73,7562011 1,092 54,9352012 913 42,926Thereafter 2,839 182,619Totalminimumleasepayments 11,106 $ 584,077Amountsrepresentinginterest 4,041Presentvalueoffutureminimumleasepayments $ 7,065
Rentalexpenseforoperatingleaseswasapproximately$153,273,000in2007,$147,727,000in2006,and$147,187,000in2005.

35
5.StockOptionsandRestrictedStockAwards
TheCompanymaintainsvariousLong-TermIncentivePlans,whichprovideforthegrantingofstockoptions,stockapprecia-tionrights(SARs),restrictedstock,restrictedstockunits(RSUs),performanceawards,dividendequivalentsandothershare-basedawards.TheCompanyissuesnewsharesuponoptionexerciseundertheseplans.
EffectiveJanuary1,2003,theCompanyprospectivelyadoptedthefairvaluemethodofaccountingforstockcompensation.TheCompanyrecognizescompensationexpensebasedonthestraight-linemethodforallawardtypes,includingSARs,whicharesubjecttogradedvestingbasedonaservicecondition.UntilJanuary1,2003,theCompanyhadelectedtofollowAPBNo.25,Accounting for Stock Issued to Employees,andrelatedinterpreta-tionsinaccountingforstockcompensation.UnderAPBNo.25,nocompensationexpensewasrecognizediftheexercisepriceofstockoptionsequaledorexceededthemarketpriceoftheunder-lyingstockonthedateofgrant.ProformainformationregardingnetincomeandearningspershareisrequiredbySFASNo.123,asamended,determinedasiftheCompanyhadaccountedforitsemployeestockoptionsgrantedsubsequenttoDecember31,1994,underthefairvaluemethodofSFASNo.123.
EffectiveJanuary1,2006,theCompanyadoptedSFASNo.123(R)choosingthe“modifiedprospective”method.Compensa-tioncostrecognizedfortheyearsendedDecember31,2007and2006,includes:(a)compensationcostforallshare-basedpay-mentsgrantedpriorto,butnotyetvestedasofJanuary1,2006,basedonthegrantdatefairvalueestimatedinaccordancewiththeoriginalprovisionsofSFASNo.123;and(b)compensationcostforallshare-basedpaymentsgrantedsubsequenttoJanuary1,2006,basedonthegrantdatefairvalueestimatedwiththeprovisionsofSFASNo.123(R).Resultsforpriorperiodshavenotbeenrestated.Mostoptionsmaybeexercisednotearlierthantwelvemonthsnorlaterthantenyearsfromthedateofgrant.AsofJanuary1,2006,therewasapproximately$1.2millionofunrecognizedcompensationcostforallawardsgrantedpriortoJanuary1,2003,toemployeesthatremainedunvestedpriortotheeffectivedateofSFASNo.123(R).Thiscompensationcostisexpectedtoberecognizedoveraweighted-averageperiodofapproximatelyfouryears.
FortheyearendedDecember31,2007,totalcompensationcostrelatedtononvestedawardsnotyetrecognizedwasapproximately$21.7million.Theweighted-averageperiodoverwhichthiscom-pensationcostisexpectedtoberecognizedisapproximatelythreeyears.TheaggregateintrinsicvalueforoptionsandRSUsoutstandingatDecember31,2007and2006wasapproximately$58.5millionand$74.6million,respectively.Theaggregateintrin-sicvalueforoptionsandRSUsvestedtotaledapproximately
$37.9millionand$46.4millionatDecember31,2007and2006,respectively.AtDecember31,2007,theweighted-averagecontractuallifeforoutstandingandexercisableoptionsandRSUswassixyears.FortheyearsendedDecember31,2007,2006,and2005,$14.3million,$11.9million,and$6.9millionofshare-basedcompensationcostwasrecorded,respectively.Thetotalincometaxbenefitrecognizedintheincomestatementforshare-basedcompensationarrangementswasapproximately$5.7million,$4.8million,and$2.8millionfor2007,2006,and2005,respectively.TherehavebeennomodificationstovaluationmethodologiesormethodssubsequenttotheadoptionofSFASNo.123(R).
FortheyearsendedDecember31,2007,2006,and2005thefairvalueforoptionsandSARsgrantedwasestimatedusingaBlack-Scholesoptionpricingmodelwiththefollowingweighted-averageassumptions,respectively:risk-freeinterestrateof4.6%,4.8%,and4.1%;dividendyieldof3.1%,2.9%,and3.2%;annualhistoricalvolatilityfactoroftheexpectedmarketpriceoftheCompany’scommonstockof21%,21%,and23%;anaverageexpectedlifeandestimatedturnoverbasedonthehistoricalpat-ternofexistinggrantsofsixyearsand4.0%to5.6%,respectively.ThefairvalueofRSUsisbasedonthepriceoftheCompany’sstockonthedateofgrant.ThetotalfairvalueofsharesvestedduringtheyearsendedDecember31,2007,2006,and2005,was$10.5million,$6.9million,and$8.0million,respectively.
ForpurposesofproformadisclosuresunderSFASNo.123,asamendedbySFASNo.148,Accounting for Stock-Based Compensa-tion Transition and Disclosure,anamendmentofFASBStatementNo.123,theestimatedfairvalueoftheoptionsisamortizedtoexpenseovertheoptions’vestingperiod.ThefollowingtableillustratestheeffectonnetincomeandincomepershareifthefairvaluebasedmethodhadbeenappliedtoalloutstandingandunvestedawardsduringtheyearendedDecember31,2005(inthousands,exceptpershareamounts):
Year Ended December 31, 2005Netincome,asreported $437,434Add:Stock-basedemployeecompensationexpensere-latedtooptiongrantsafterJanuary1,2003,includedinreportednetincome,netofrelatedtaxeffects 4,247Deduct:Totalstock-basedemployeecompensationexpensedeterminedunderfairvaluebasedmethodforallawards,netofrelatedtaxeffects (6,225)Proformanetincome $435,456
Incomepershare:Basic—asreported $ 2.51Basic—proforma $ 2.50
Diluted—asreported $ 2.50Diluted—proforma $ 2.49

36
notes to consolidated financial statements (continued)
december 31, 2007
5.StockOptionsandRestrictedStockAwards(continued)
AsummaryoftheCompany’sstockoptionactivityandrelatedinformationisasfollows:
2007 Weighted Average Shares Exercise (000’s) PriceOutstandingatbeginningofyear 6,084 $ 35Granted(1) 1,367 49Exercised (986) 34Forfeited (150) 43Outstandingatendofyear(2) 6,315 $ 38
Exercisableatendofyear 3,506 $ 36
Sharesavailableforfuturegrants 6,636
(1)Totalincludes95,000RestrictedStockUnits(RSUs).TheweightedaverageexercisepriceexcludesRSUs.(2)TheexercisepricesforoptionsoutstandingasofDecember31,2007rangedfromapproximately$21to$49.Theweighted-averageremainingcontractuallifeofalloptionsoutstandingisapproximatelysevenyears.
Theweighted-averagegrantdatefairvalueofoptionsgrantedduringtheyears2007,2006,and2005was$9.64,$9.14,and$8.58,respectively.Theaggregateintrinsicvalueofoptionsexer-cisedduringtheyearsendedDecember31,2007,2006,and2005was$15.6million,$10.7million,and$19.6million.
In2007,theCompanygrantedapproximately1,272,000SARsand95,000RSUs.In2006,theCompanygrantedapproximately1,246,000SARsand94,000RSUs.In2005,theCompanygrantedapproximately1,169,000SARsand91,000RSUs.SARsrepresentarighttoreceivetheexcess,ifany,ofthefairmarketvalueofoneshareofcommonstockonthedateofexerciseoverthegrantprice.RSUsrepresentacontingentrighttoreceiveoneshareoftheCompany’scommonstockatafuturedateprovidedcertainpre-taxprofittargetsareachieved.Themajorityofawardsvestonapro-ratabasisforperiodsrangingfromonetofiveyearsandareexpensedaccordinglyonastraight-linebasis.AsummaryoftheCompany’snonvestedshareawards(RSUs)activityisasfollows: Weighted Average Shares GrantDateNonvestedShareAwards(RSUs) (000’s) FairValueNonvestedatJanuary1,2007 255 $ 41Granted 95 49Vested (15) 49ForfeitedorExpired (23) 42NonvestedatDecember31,2007 312 $ 43
PriortotheadoptionofSFASNo.123(R),theCompanypre-sentedalltaxbenefitsfordeductionsresultingfromtheexerciseofstockoptionsasoperatingcashflowsintheconsolidatedstatementsofcashflows.SFASNo.123(R)requiresthecashflowsresultingfromthetaxbenefitsrelatedtotaxdeductionsinexcessofthecompensationcostrecognizedforthoseoptions(excesstaxbenefits)tobeclassifiedasfinancingcashinflow.FortheyearsendedDecember31,2007and2006,approximately$4.4millionand$3.0million,respectively,ofexcesstaxbenefitswasclassifiedasafinancingcashinflow.6.IncomeTaxes
Deferredincometaxesreflectthenettaxeffectoftemporarydifferencesbetweenthecarryingamountsofassetsandliabilitiesforfinancialreportingpurposesandamountsusedforincometaxpurposes.UndistributedearningsoftheCompany’sforeignsub-sidiariesareconsideredtobeindefinitelyreinvested.Assuch,noU.S.federalandstateincometaxeshavebeenprovidedthereon,anditisnotpracticabletodeterminetheamountoftherelatedunrecognizeddeferredincometaxliability.Significantcompo-nentsoftheCompany’sdeferredtaxassetsandliabilitiesareasfollows:
(in thousands) December 31, 2007 2006
Deferredtaxassetsrelatedto: Expensesnotyetdeductedfortaxpurposes $ 136,432 $ 114,146Pensionliabilitynotyetdeductedfortaxpurposes 160,521 193,194 296,953 307,340 Deferredtaxliabilitiesrelatedto: Employeeandretireebenefits 164,909 160,798Inventory 98,196 88,672Propertyandequipment 19,849 24,787Other 6,918 9,605 289,872 283,862 Netdeferredtaxasset (7,081) (23,478)Currentportionofdeferredtaxliability 28,697 15,361Non-currentdeferredtaxasset $ (35,778) $ (38,839)
Thecurrentportionofthedeferredtaxliabilityisincludedinincometaxespayableandthenon-currentdeferredtaxassetisincludedinotherassetsintheconsolidatedbalancesheets.

37
Thecomponentsofincometaxexpenseareasfollows:
(in thousands) 2007 2006 2005Current: Federal $262,922 $ 243,089 $ 183,387State 42,101 41,361 32,977Foreign 13,449 16,542 11,331Deferred (8,066) (5,481) 43,935 $ 310,406 $ 295,511 $ 271,630
ThereasonsforthedifferencebetweentotaltaxexpenseandtheamountcomputedbyapplyingthestatutoryFederalincometaxratetoincomebeforeincometaxesareasfollows:
(in thousands) 2007 2006 2005
Statutoryrateappliedtoincome $285,861 $ 269,821 $248,172Plusstateincometaxes,netofFederaltaxbenefit 26,672 26,395 25,571Other (2,127) (705) (2,113) $ 310,406 $ 295,511 $271,630
TheCompanyoroneofitssubsidiariesfilesincometaxreturnsintheUSfederaljurisdiction,variousstates,andforeignjurisdictions.Withfewexceptions,theCompanyisnolongersubjecttofederal,stateandlocaltaxexaminationsbytaxauthoritiesforyearsbefore2004orsubjecttonon-UnitedStatesincometaxexaminationsforyearsendedpriorto2002.TheCompanydoesnotanticipatetotalunrecognizedtaxbenefitswillsignificantlychangeduringtheyearduetothesettlementofauditsandtheexpirationofstatutesoflimitations.TheCompanyadoptedtheprovisionsofFASBInterpretationNo.48,Accounting for Uncertainty in Income Taxes, aninterpretationofFASBStatementNo.109,(“FINNo.48”),onJanuary1,2007.ThecumulativeeffectofadoptingFINNo.48didnothaveamaterialimpactontheCompany’sfinancialposi-tionortheresultsofoperations.Areconciliationofthebeginningandendingamountofunrecognizedtaxbenefitsisasfollows:
UnrecognizedTaxBenefits (in thousands)
BalanceatJanuary1,2007 $ 29,215Additionsbasedontaxpositionsrelatedtothecurrentyear 7,929Additionsfortaxpositionsofprioryears 455Reductionsfortaxpositionsforprioryears (1,557)Reductionforlapseinstatuteoflimitations (2,897)Settlements (1,045)BalanceatDecember31,2007 $ 32,100
TheamountofgrosstaxeffectedunrecognizedtaxbenefitsasofDecember31,2007wasapproximately$32,100,000ofwhichapproximately$13,682,000,ifrecognized,wouldaffecttheeffectivetaxrate.DuringtheyearendingDecember31,2007,theCom-panyrecognizedinterestandpenaltiesofapproximately$600,000.TheCompanyhadapproximately$1,500,000and$900,000ofaccruedinterestandpenaltiesatDecember31,2007andJanuary1,2007,respectively.TheCompanyrecognizespotentialinterestandpenaltiesrelatedtounrecognizedtaxbenefitsasacomponentofincometaxexpense.
7.EmployeeBenefitPlans
TheCompany’sdefinedbenefitpensionplanscoversubstantiallyallofitsemployeesintheU.S.andCanada.TheplancoveringU.S.employeesisnoncontributoryandbenefitsarebasedontheemployees’compensationduringthehighestfiveoftheirlasttenyearsofcreditedservice.TheCanadianplaniscontributoryandbenefitsarebasedoncareeraveragecompensation.TheCom-pany’sfundingpolicyistocontributeanamountequaltotheminimumrequiredcontributionunderERISA.TheCompanymayincreaseitscontributionabovetheminimumifappropriatetoitstaxandcashpositionandtheplans’fundedposition.
TheCompanyalsosponsorsunfundedsupplementalretirementplanscoveringemployeesintheU.S.andCanadaandotherpostretirementbenefitplansintheU.S.TheCompanyusesameasurementdateofDecember31foritspensionandotherpostretirementbenefitplans.
OnSeptember29,2006,theFASBissuedSFASNo.158,Employers’AccountingforDefinedBenefitPensionandOtherRetirementPlans,whichamendsSFASNo.87andSFASNo.106torequirerecognitionoftheoverfundedorunderfundedstatusofpensionandotherpostretirementbenefitplansonthebalancesheet.UnderSFASNo.158,gainsandlosses,priorservicecostsandcredits,andanyremainingtransitionamountsunderSFASNo.87andSFASNo.106thathavenotyetbeenrecognizedthroughnetperiodicbenefitcostaretoberecognizedinaccumulatedothercomprehensiveincome,netoftaxeffects,untiltheyareamortizedasacomponentofnetperiodiccost.SFASNo.158iseffectiveforpubliclyheldcompaniesforfiscalyearsendingafterDecember31,2006.

38
notes to consolidated financial statements (continued)
december 31, 2007
7.EmployeeBenefitPlans(continued)
Other Pension Postretirement Benefits Benefits 2007 2006 2007 2006Changes in benefit obligation Benefitobligationatbeginningofyear $1,334,528 $1,236,379 $25,669 $24,267Servicecost 53,700 50,224 750 475Interestcost 82,029 72,246 1,441 1,327Planparticipants’contributions 3,203 2,709 3,721 1,173Planamendments – 1,708 – –Actuarial(gain)loss (61,447) 9,213 3,874 2,842Exchangerateloss(gain) 19,039 (349) – –Grossbenefitspaid (43,383) (37,602) (7,585) (5,263)Lessfederalsubsidy N/A N/A 770 848Benefitobligationatendofyear $1,387,669 $1,334,528 $28,640 $25,669
ThebenefitobligationfortheCompany’sU.S.pensionplansin-cludedintheabovewere$1,258,892,000and$1,225,020,000atDecember31,2007and2006,respectively.ThetotalaccumulatedbenefitobligationfortheCompany’sdefinedbenefitpensionplanswasapproximately$1,119,588,000and$1,068,895,000atDecember31,2007and2006,respectively.Theassumptionsusedtomeasurethepensionandotherpost-retirementplanobligationsfortheplansatDecember31,2007and2006,were:
Other Pension Postretirement Benefits Benefits 2007 2006 2007 2006Weighted-averagediscountrate 6.49% 6.00% 5.75% 5.75%Rateofincreaseinfuturecompensationlevels 3.75% 3.75% – –
An8%annualrateofincreaseinthepercapitacostofcoveredhealthcarebenefitswasassumedonDecember31,2007.Theratewasassumedtodecreaseratablyto5%atDecember31,2013,andthereafter.
Other Pension Postretirement Benefits Benefits(in thousands) 2007 2006 2007 2006
Changes in plan assets Fairvalueofplanassetsatbeginningofyear $1,260,538 $1,114,980 $ – $ –Actualreturnonplanassets 89,248 114,076 – –Exchangerategain(loss) 21,030 (441) – –Employercontributions 35,140 66,816 3,094 3,242Planparticipants’contribution 3,203 2,709 3,721 1,173Benefitspaid (43,383) (37,602) (6,815) (4,415)Fairvalueofplanassetsatendofyear $1,365,776 $1,260,538 $ – $ –
ThefairvaluesofplanassetsfortheCompany’sU.S.pensionplansincludedintheabovewere$1,222,686,000and$1,139,298,000atDecember31,2007and2006,respectively.FollowingaretheassetallocationsfortheCompany’sfundedpensionplansatDecember31,2007and2006,andthetargetallocationfor2008,byassetcategory: Target PercentageofPlan Allocation AssetsatDecember31 2008 2007 2006Asset Category Equitysecurities 70% 68% 67%Debtsecurities 29% 29% 31%Realestateandother 1% 3% 2% 100% 100% 100%
AtDecember31,2007and2006,theplanheld2,016,932sharesofcommonstockoftheCompanywithamarketvalueofap-proximately$93,384,000and$95,663,000,respectively.Divi-dendpaymentsreceivedbytheplanonCompanystocktotaledapproximately$2,945,000and$2,723,000in2007and2006,respectively.Feespaidduringtheyearforservicesrenderedbypartiesininterestwerebasedoncustomaryandreasonableratesforsuchservices.
39
TheCompany’sbenefitplancommitteesintheU.S.andCanadaestablishinvestmentpoliciesandstrategiesandregularlymonitortheperformanceofthefunds.Thepensionplanstrategyimple-mentedbytheCompany’smanagementistoachievelong-termobjectivesandinvestthepensionassetsinaccordancewiththeapplicablepensionlegislationintheU.S.andCanada,aswellasfiduciarystandards.Thelong-termprimaryobjectivesforthepensionplansaretoprovideforareasonableamountoflong-termgrowthofcapital,withoutundueexposuretorisk,protecttheassetsfromerosionofpurchasingpower,andprovideinvest-mentresultsthatmeetorexceedthepensionplans’actuariallyassumedlongtermratesofreturn.
Basedontheinvestmentpolicyforthepensionplans,aswellasanassetstudythatwasperformedbasedontheCompany’sassetallocationsandfutureexpectations,theCompany’sexpectedrateofreturnonplanassetsformeasuring2008pensionexpenseorincomeis8.25%fortheplans.TheassetstudyforecastedexpectedratesofreturnfortheapproximatedurationoftheCompany’sbenefitobligations,usingcapitalmarketdataandhistoricalrelationships.ThefollowingtablesetsforththefundedstatusoftheplansandtheamountsrecognizedintheconsolidatedbalancesheetsatDecember31:
Amountsrecognizedintheconsolidatedbalancesheetsconsistof:
Other Pension Postretirement Benefits Benefits(in thousands) 2007 2006 2007 2006 Otherlong-termasset $ 45,680 $ 12,951 $ N/A $ N/AOthercurrentliability (2,200) (2,272) (2,854) (2,764)Otherlong-termliability (65,373) (84,669) (25,786) (22,905) $(21,893) $(73,990) $(28,640) $(25,669)
Amountsrecognizedinaccumulatedothercomprehensive(loss)incomeconsistof: Other Pension Postretirement Benefits Benefits(in thousands) 2007 2006 2007 2006
Netactuarialloss $393,061 $459,478 $ 24,908 $ 22,457Priorservicecost 2,748 2,410 1,533 1,904 $395,809 $461,888 $ 26,441 $ 24,361
Forthepensionbenefits,thefollowingtablereflectsthetotalbenefitsexpectedtobepaidfromtheplans’ortheCompany’sassets.Ofthepensionbenefitsexpectedtobepaidin2008,$2,267,000isexpectedtobepaidfromemployerassets.Expectedcontributionsreflectamountsexpectedtobecontributedtofundedplans.Forotherpostretirementbenefits,thetablebelowreflectsonlytheCompany’sshareofthebenefitcostwithoutregardtoincomefromfederalsubsidypaymentsreceivedpursuanttotheMedicarePrescriptionDrugImprovementandModernizationActof2003(MMA).ExpectedMMAsubsidypayments,whichwillreducetheCompany’scostfortheplan,areshownseparately.
Informationabouttheexpectedcashflowsforthepensionplansandotherpostretirementbenefitplansfollows:
OtherPostretirementBenefits NetEmployer Contribution Pension (Excluding ValueDueto(in thousands) Benefits MMASubsidy) MMASubsidyEmployer contribution 2008(expected) $ 5,095 $ 2,935 $ –
Expected benefit payments 2008 43,643 3,711 7762009 47,593 3,706 5662010 51,677 3,721 5402011 56,749 3,646 –2012 64,556 3,541 –2013through2017 436,687 17,060 –

40
notes to consolidated financial statements (continued)
december 31, 2007
7.EmployeeBenefitPlans(continued)
Netperiodicbenefitcostincludedthefollowingcomponents:
PensionBenefits OtherPostretirementBenefits(in thousands) 2007 2006 2005 2007 2006 2005 Servicecost $ 53,700 $ 50,224 $ 41,910 $ 750 $ 475 $ 453Interestcost 82,029 72,246 64,102 1,441 1,327 1,310Expectedreturnonplanassets (110,131) (100,174) (89,422) – – –Amortizationofpriorservice(credit)cost (338) (471) (386) 371 371 371Amortizationofactuarialloss 25,909 26,379 16,172 1,424 1,291 1,224Netperiodicbenefitcost $ 51,169 $ 48,204 $ 32,376 $ 3,986 $ 3,464 $ 3,358
Otherchangesinplanassetsandbenefitobligationsrecognizedinothercomprehensive(loss)incomein2007areasfollows:
Other Pension Postretirement(in thousands) Benefits BenefitsCurrentyearactuarial(gain)loss $ (40,508) $ 3,874Amortizationofactuarialgain(loss) (25,909) (1,424)Amortizationofpriorservicecredit(cost) 338 (371)Totalrecognizedinothercomprehensive(loss)income $ (66,079) $ 2,079Totalrecognizedinnetperiodicbenefitcostandothercomprehensive(loss)income $ (14,910) $ 6,065
Theestimatedamountsthatwillbeamortizedfromaccumulatedothercomprehensive(loss)incomeintonetperiodicbenefitcostin2008areasfollows:
Other Pension Postretirement(in thousands) Benefits Benefits Actuarialloss $ 18,037 $ 1,616Priorservice(credit)/cost (8) 371Total $ 18,029 $ 1,987
Theassumptionsusedinmeasuringthenetperiodicbenefitcostsfortheplansfollow:
Other Postretirement PensionBenefits Benefits 2007 2006 2005 2007 2006 2005Weightedaveragediscountrate 6.00% 5.75% 6.00% 5.75% 5.75% 6.00%Rateofincreaseinfuturecompen-sationlevels 3.75% 3.75% 3.50% – – –Expectedlong-termrateofreturnonplanassets 8.25% 8.25% 8.50% – – –Healthcarecosttrendrate – – – 9.00% 9.00%10.00%
Theeffectofaone-percentagepointchangeintheassumedhealthcarecosttrendrateisasfollows:
(in thousands) Decrease IncreaseTotalserviceandinterestcostcomponentsof2007netperiodicpostretirementhealthcarebenefitcost $ (408) $ 622AccumulatedpostretirementbenefitobligationforhealthcarebenefitsatDecember31,2007 (5,609) 7,213
TheCompanyhasadefinedcontributionplanthatcoverssub-stantiallyallofitsdomesticemployees.TheCompany’smatchingcontributionsaredeterminedbasedon20%ofthefirst6%ofthecoveredemployee’ssalary.Totalplanexpensewasapproximately$7,245,000in2007,$6,824,000in2006,and$6,722,000in2005.

41
8.Guarantees
Theamendedandrestatedmasteragreementtoour$85,000,000constructionandleaseagreement(theAgreement),discussedfurtherinNote4,hasatermofsixyearsexpiringin2009andcontainsresidualvalueguaranteeprovisionsandotherguaranteeswhichwouldbecomedueintheeventofadefaultundertheoperatingleaseagreement,orattheexpirationoftheoperatingleaseagreementifthefairvalueoftheleasedpropertiesislessthantheguaranteedresidualvalue.ThemaximumamountoftheCompany’spotentialguaranteeobligation,representingtheresidualvalueguarantee,atDecember31,2007,isapproximately$62,678,000.TheCompanybelievesthelikelihoodoffundingtheguaranteeobligationunderanyprovisionoftheoperatingleaseagreementsisremote.
TheCompanyalsoguaranteestheborrowingsofcertaininde-pendentlycontrolledautomotivepartsstores(independents)andcertainotheraffiliatesinwhichtheCompanyhasaminorityequityownershipinterest(affiliates).Presently,theindependentsaregenerallyconsolidatedbyunaffiliatedenterprisesthathaveacontrollingfinancialinterestthroughownershipofamajorityvotinginterestintheentity.TheCompanyhasnovotinginterestorotherequityconversionrightsinanyoftheindependents.TheCompanydoesnotcontroltheindependentsortheaffiliates,butreceivesafeefortheguarantee.TheCompanyhasconcludedthatitisnottheprimarybeneficiarywithrespecttoanyoftheinde-pendentsandthattheaffiliatesarenotvariableinterestentities.TheCompany’smaximumexposuretolossasaresultofitsinvolvementwiththeseindependentsandaffiliatesisequaltothetotalborrowingssubjecttotheCompany’sguarantee.
AtDecember31,2007,thetotalborrowingsoftheindependentsandaffiliatessubjecttoguaranteebytheCompanywereapproxi-mately$173,928,000.Theseloansgenerallymatureoverperiodsfromonetotenyears.IntheeventthattheCompanyisrequiredtomakepaymentsinconnectionwithguaranteedobligationsoftheindependentsortheaffiliates,theCompanywouldobtainandliquidatecertaincollateral(e.g.,accountsreceivableandinventory)torecoveralloraportionoftheamountspaidundertheguarantee.WhenitisdeemedprobablethattheCompanywillincuralossinconnectionwithaguarantee,aliabilityisrecordedequaltothisestimatedloss.Todate,theCompanyhashadnosignificantlossesinconnectionwithguaranteesofinde-pendents’andaffiliates’borrowings.
EffectiveJanuary1,2003,theCompanyadoptedFINNo.45,Guarantor’s Accounting and Disclosure Requirements for Guarantees, Including Indirect Guarantees of Indebtedness of Others.InaccordancewithFINNo.45andbasedonavailableinformation,theCompanyhasaccruedforthoseguaranteesrelatedtotheinde-pendents’andaffiliates’borrowingsandtheconstructionandleaseagreementasofDecember31,2007and2006.
TheseliabilitiesarenotmaterialtothefinancialpositionoftheCompanyandareincludedinotherlong-termliabilitiesintheaccompanyingconsolidatedbalancesheets.
9.SegmentData
Thesegmentdataforthepastfiveyearspresentedonpage15isanintegralpartoftheseconsolidatedfinancialstatements.
TheCompany’sautomotivesegmentdistributesreplacementparts(otherthanbodyparts)forsubstantiallyallmakesandmodelsofautomobiles,trucks,andothervehicles.
TheCompany’sindustrialsegmentdistributesawidevarietyofindustrialbearings,mechanicalandfluidpowertransmissionequipment,includinghydraulicandpneumaticproducts,materialhandlingcomponents,andrelatedpartsandsupplies.TheCompany’sofficeproductssegmentdistributesawidevarietyofofficeproducts,computersupplies,officefurniture,andbusinesselectronics.
TheCompany’selectrical/electronicmaterialssegmentdistrib-utesawidevarietyofelectrical/electronicmaterials,includinginsulatingandconductivematerialsforuseinelectronicandelectricalapparatus.
TheCompany’sreportablesegmentsconsistofautomotive,industrial,officeproducts,andelectrical/electronicmaterials.Withinthereportablesegments,certainoftheCompany’soperatingsegmentsareaggregatedbecausetheyhavesimilareconomiccharacteristics,productsandservices,typeandclassofcustomers,anddistributionmethods.Inter-segmentsalesarenotsignificant.Operatingprofitforeachindustrysegmentiscalculatedasnetsaleslessoperatingexpensesexcludinggeneralcorporateexpenses,interestexpense,equityinincomefrominvestees,amortization,andminorityinterests.Approximately$46,900,000,$43,500,000and$39,700,000ofincomebeforeincometaxeswasgeneratedinjurisdictionsoutsidetheUnitedStatesfortheyearsendingDecember31,2007,2006,and2005,respectively.Netsalesandnetlong-livedassetsbycountryrelatedirectlytotheCompany’soperationsintherespectivecountry.Corporateassetsareprincipallycashandcashequivalentsandheadquarters’facilitiesandequipment.Formanagementpurposes,netsalesbysegmentexcludetheeffectofcertaindiscounts,incentives,andfreightbilledtocustomers.Thelineitem“other”representstheneteffectofthediscounts,incentives,andfreightbilledtocustomers,whicharereportedasacomponentofnetsalesintheCompany’sconsolidatedstatementsofincome.
corporate officers
ThomasC.Gallagher Chairman,Presidentand ChiefExecutiveOfficer
JerryW.Nix ViceChairmanand ChiefFinancialOfficer
PaulD.Donahue ExecutiveVicePresident
RobertJ.Susor ExecutiveVicePresident
CharlesA.Chesnutt SeniorVicePresident-Technology andProcessImprovement
R.BruceClayton SeniorVicePresident- HumanResources
FrankM.Howard SeniorVicePresidentandTreasurer
ScottC.Smith SeniorVicePresident- CorporateCounsel
CarolB.Yancey SeniorVicePresident- FinanceandCorporateSecretary
TregS.Brown VicePresident- PlanningandAcquisitions
PhilipC.Johnson VicePresident- CompensationandBenefits
SidneyG.Jones VicePresident-InvestorRelations
KarlJ.Koenig VicePresident-RealEstate andConstruction
MichaelJ.Fusaro VicePresident- ProcessImprovement-Distribution
RichardA.Geiger VicePresident-Finance
ThomasE.Hancock VicePresident-GrowthCapitalProgram
MarkW.Hohe VicePresident- StoreProcessImprovement
RonaldL.Koenigshofer VicePresident-Operations
GregA.Lancour VicePresident-NAPAGlobalSourcing
DavidB.Nicki VicePresident-MajorAccounts
J.MichaelPhillips VicePresident- OrganizationalDevelopment
GaylordM.Spencer VicePresident-MarketingStrategy
MichaelL.Swartz VicePresident- Inventory&Procurement
NancyM.Vepraskas VicePresident-HumanResources
KarlE.Wolfe VicePresident-Classification
divisions
M.ToddMcMurtrie VicePresident-AtlanticDivision
GrantL.Morris VicePresident-CentralDivision
MichaelJ.Kelleher VicePresident-EasternDivision
LeeA.Maher VicePresident-MidwestDivision
EricG.Fritsch VicePresident-MountainDivision
RocklenR.Justice VicePresident-SouthernDivision
StuartA.Kambury VicePresident-SouthwestDivision
BradleyA.Shaffer VicePresident-WesternDivision
HEAVY VEHICLE PARTS GROUP
D.GarySilva President
IMPORT PARTS GROUPPascalJ.Litscher President-AltromCanada
ScottS.Mountford President-AltromAmerica
RAYLOC (ATLANTA, GA)
J.RichardBorman President
DamonE.Elmore VicePresident-HumanResources
MichaelS.GaffneyII VicePresident-Marketing
DavidGonzales VicePresident-Product
JosephW.Lashley VicePresident-InformationServices
J.ScottMosteller VicePresident-SupplyChain
DebbieE.Niffin VicePresident-Finance
StevenC.Schwan VicePresident-ElectricalSales
u.s. automotive parts group
LarryR.Samuelson President
GlennM.Chambers ExecutiveVicePresident-Operations
DanielF.Askey SeniorVicePresident-Sales
R.CraigBierman SeniorVicePresident- ChiefInformationOfficer
CaryV.Carter SeniorVicePresident-Stores
JohnJ.HanighenIV SeniorVicePresident- AutoCareandWholesaleMarketing
ScottW.LeProhon SeniorVicePresident- MerchandisingandProductStrategy
W.LarryBevil VicePresident-InformationSystems
JerryW.Biggers VicePresident-OperationsControls
MichaelA.Briggs VicePresident-RetailProduct ManagementandMerchandising
JayC.Burnworth VicePresident- InformationTechnology
42

LindaL.Price VicePresident-MarketingandAdvertisingMarkR.Thompson VicePresident-CorporateAccountsM.KeithKnight VicePresident-BusinessSystemsR.J.WardWestgate VicePresident- Marketing-MotionCanadaMarekNesvadba VicePresident-MotionCanadaYvesR.Simard VicePresident-MotionCanada
S. P. Richards Company (Atlanta, GA)
C.WayneBeacham ChairmanoftheBoard andChiefExecutiveOfficerRobertJ.Fornal ExecutiveVicePresident-OperationsStevenE.Lynn SeniorVicePresident-MerchandisingDonaldC.Mikolasy SeniorVicePresident-SalesJamesF.O’Brien SeniorVicePresident-MarketingMichaelD.Orr SeniorVicePresident-Logistics/OperationsBoydE.Rice SeniorVicePresident- ChiefInformationOfficerRobertJ.Kelly VicePresident-SalesOperationsCharlesE.Macpherson VicePresident-DealerDevelopmentTomC.Maley VicePresident-BusinessDevelopmentG.HenryMartin VicePresident-HumanResourcesJamesC.Moseley VicePresident-InformationSystemsThomasM.Testa VicePresident-SalesJ.PhillipWelch,Jr. VicePresident-Finance,Controller, SecretaryandTreasurerBradB.Wolf VicePresident- OfficeSuppliesandFurnitureLesterP.Christian VicePresident-SoutheastDivisionBryanT.Hall VicePresident-SouthCentralDivisionGregoryL.Nissen VicePresident-WesternDivisionJamesP.O’Connor VicePresident-NortheastDivisionRichardA.Wiltz VicePresident-NorthCentralDivisionPeterR.Dalglish ManagingDirector-S.P.RichardsCanada
EIS, Inc. (Atlanta, GA)
RobertW.Thomas PresidentandChiefExecutiveOfficerAlexanderGonzalez SeniorVicePresident- ElectricalandAssemblyLarryL.Griffin SeniorVicePresident-MarketingThomasA.Jones SeniorVicePresident-ManufacturingWilliamC.Knight SeniorVicePresident- LogisticsandOperationsMatthewC.Tyser SeniorVicePresident- FinanceandSecretary
subsidiaries
Balkamp, Inc. (Indianapolis, IN)
D.TipTollison PresidentFrankC.Amato ExecutiveVicePresident-OperationsMaryF.Knudsen VicePresident-FinanceandTreasurer
Grupo Auto Todo (Puebla, Mexico)
JuanLujambio PresidentandChiefExecutiveOfficerJorgeOtero ExecutiveVicePresident-FinanceMiguelA.Rodriguez VicePresident-SalesandMarketing
NAPA Canada/UAP Inc. (Montreal, Canada)
JeanDouville ChairmanoftheBoardLarryR.Samuelson ViceChairmanand ChiefExecutiveOfficerRobertHattem PresidentandChiefOperatingOfficerKevinM.Chase ExecutiveVicePresident-AutoPartsPierreLefebvre VicePresident-FinanceandSecretary
Motion Industries (Birmingham, AL)
WilliamJ.Stevens PresidentandChiefExecutiveOfficerThomasL.Miller ExecutiveVicePresident andChiefOperatingOfficerG.HaroldDunaway,Jr. ExecutiveVicePresident- Finance&AdministrationandSecretaryM.WayneLaw ExecutiveVicePresident- Corp.Purchasing&DistributionRobertJ.Summerlin ExecutiveVicePresident- MarketingandCOO-IndustrialProducts, IntegratedServicesandAutomationEllenH.Holladay SeniorVicePresident,ChiefInformation OfficerandOperationalExcellenceOfficerWilliamE.Horn SeniorVicePresident-StrategicAccountsThomasS.Robertshaw SeniorVicePresident-Global DevelopmentandStrategicPlanningTimothyP.Breen GroupVicePresident-MidwestR.DavidJames GroupVicePresident-SoutheastC.JeffRouse GroupVicePresident-EastMarkW.Sheehan GroupVicePresident-Central andPresident-MotionCanadaKevinP.Storer GroupVicePresident-WestJohnD.Walters GroupVicePresident-SouthwestJamesH.McCullar GroupVicePresident-IndustrialProductsGeraldV.Sourbeer GroupVicePresident-IntegratedServicesJ.GaryGarris VicePresident-DistributionCenter Operations/CorporateLogisticsZahirudinK.Hameer VicePresident-InventoryManagementJamesR.Neill VicePresident-HumanResources
43

board of directors
Dr. Mary B. Bullock PresidentEmeritaofAgnesScottCollege
Richard W. Courts, II ChairmanoftheBoardofDirectorsofAtlanticInvestmentCompany
Jean Douville ChairmanoftheBoardofDirectorsofUAPInc.
Thomas C. Gallagher Chairman,PresidentandChiefExecutiveOfficer
George C. “Jack” Guynn RetiredPresidentandChiefExecutiveOfficeroftheFederalReserveBankofAtlanta
John D. Johns Chairman,PresidentandChiefExecutiveOfficerofProtectiveLifeCorporation
Michael M. E. Johns, MD ChancellorofEmoryUniversityandExecutiveVicePresidentforHealthAffairs,Emeritus
J. Hicks Lanier ChairmanoftheBoardofDirectorsandChiefExecutiveOfficerofOxfordIndustries,Inc.
Wendy B. Needham RetiredManagingDirector,GlobalAutomotiveResearchatCreditSuisseFirstBoston
Jerry W. Nix ViceChairmanandChiefFinancialOfficer
Larry L. Prince ChairmanoftheExecutiveCommittee
Gary W. Rollins ChiefExecutiveOfficer,PresidentandChiefOperatingOfficerofRollinsInc.
Lawrence G. Steiner RetiredChairmanoftheBoardofDirectorsofAmeriprideServices,Inc.
44

shareholder information
Stock ListingGenuinePartsCompany’scommonstockistradedontheNewYorkStockExchangeunderthesymbol“GPC”.
Stock Transfer Agent, Registrar of Stock, Dividend Disbursing Agent and other shareholder servicesCommunicationsconcerningsharetransferrequirements,duplicatemailings,directdepositofdividends,lostcertificatesordividendchecksorchangeofaddressshouldbedirectedtotheCompany’stransferagentat:
ComputersharePostOfficeBox43078Providence,RhodeIsland02940-3078800.568.3476404.588.7815(inGeorgia)
Dividend Reinvestment PlanShareholderscanbuildtheirinvestmentsinGenuinePartsCompanythroughalow-costplanforautomaticallyreinvest-ingdividendsandbymakingoptionalcashpurchasesoftheCompany’sstock.Forenrollmentinformation,writetotheStockTransferAgentlistedaboveorShareholderRelationsattheCompanyaddress.
Form 10-K Information
AcopyoftheCompany’sannualreportonForm10-K,filedwiththeSecuritiesandExchangeCommission,willbefurnishedtoanyshareholderwithoutchargeuponwrittenrequestto:ShareholderRelationsDepartmentGenuinePartsCompany2999Circle75ParkwayAtlanta,Georgia30339
CertificationsOurAnnualReportonForm10-KincludesthecertificationsofourchiefexecutiveofficerandchieffinancialofficerrequiredbySections302and906oftheSarbanes-OxleyActof2002.Additionally,wefiledwiththeNewYorkStockExchangethecertificationbyourchiefexecutiveofficerthatheisnotawareofanyviolationofNewYorkStockExchangecorporategovernancelistingstandards.
Investor RelationsInquiriesfromsecurityanalystsandinvestmentprofessionalsshouldbedirectedtotheCompany’sinvestorrelationscon-tacts:Mr.JerryNix,ChiefFinancialOfficer,orMr.SidJones,VicePresident-InvestorRelations,at770.953.1700.
Annual Shareholders’ MeetingThe2008annualmeetingoftheshareholdersofGenuinePartsCompanywillbeheldattheExecutiveOfficesoftheCompany,2999Circle75Parkway,Atlanta,Georgiaat10:00a.m.onMonday,April21,2008.
Independent registered public accounting firmErnst&YoungLLP-Atlanta,Georgia
General CounselAlston&BirdLLP-Atlanta,Georgia
Executive OfficesGenuinePartsCompany2999Circle75ParkwayAtlanta,Georgia30339770.953.1700
Cre
ated
and
prod
uced
by
Phela
nx,I
nc.
Atla
nta,
GA
ph
elanx
.com
Genuine Parts Company2999 circle 75 parkway atlanta, ga 30339
770 953 1700
www.genpt.com