LT36817 Engine Heating Cold Starting Aids - Cummins Filtration

GENSET ENGINE HEATING IN A DATA CENTER ENVIRONMENT
Performance analysis of forced circulation heaters versus thermosiphon heaters installed on standby generators.
October 2015Devin Parker
hotflow™ comparison report | data center genset heating test
TABLE OF CONTENTS
TABLE OF CONTENTS | 2
EXECUTIVE SUMMARY | 1Real-World Comparison Testing | 1
TEST PARAMETERS | 2Test Location | 2
Test Heater | 2
Test Premise | 3
Test Tools | 3
THERMOCOUPLES | 3
CURRENT TRANSFORMER SENSORS | 3
THERMAL IMAGING CAMERA | 4
TEST PLAN & PROCEDURES | 4Methods | 4
CSM Installation | 4
Heating Performance | 5
Energy Consumption | 5
Duration and Conditions | 5
TEST DATA | 6Average Engine Block Temperatures | 6
Average Heater Energy Consumption | 8
CONTROL ENGINE HEATER ENERGY CONSUMPTION | 9
TEST ENGINE HEATER ENERGY CONSUMPTION | 9
HEATER ENERGY CONSUMPTION COMPARISON | 10
TEST OUTCOMES & TAKEAWAYS | 10Post-Test Upgrades | 10

1hotflow™ comparison report | data center genset heating test
EXECUTIVE SUMMARY
REAL-WORLD COMPARISON TESTINGIn the generator set market, forced circulation heating systems are often touted as being a forward-thinking, environmentally-friendly, high efficiency alternative to the traditional thermosiphon engine heater. However, these claims often lack quantitative evidence. Facilities managers, tasked with purchasing engine heating systems for data center generators, must then decide whether the high efficiency claims of a forced circulation system outweigh the inexpensive and uncomplicated legacy technology of the thermosiphon heating option.
To put numbers to this comparison, HOTSTART partnered with a major data center, located near Minneapolis/St. Paul, Minnesota and Ziegler CAT — the regional Caterpillar dealer. For most organizations, data centers are critical to everyday operations and must be equipped to sustain maximum uptime. A typical data center relies on multiple onsite backup power generators. In turn, each of those generators must be equipped with an engine heating system to enable the generators to start and assume a full power load quickly enough to ensure uninterrupted data center operation. Because backup power is critical in these applications, testing in a data center environment presents the perfect opportunity for a true real-world comparison of thermosiphon and forced circulation performance and energy efficiency.
HOTSTART technicians set up a test to monitor two engines — one heated with a single HOTSTART HOTflow 6 kW CSM forced circulation heating system and the other employing two standard 6 kW thermosiphon heaters. Performance data (engine temperature and energy consumption) was collected and analyzed.
Testing revealed the forced circulation CSM to be a much more efficient heating system. However, our test data also indicated that the CSM actually outperformed the two 6 kW thermosiphon heaters in terms of heat distribution: The CSM consumed less energy while heating the engine more effectively.
For forced circulation systems, including the HOTSTART CSM, high-efficiency claims only tell half of the story — the data shows that forced circulation systems are more efficient and more effective heating systems overall. Therefore, facilities managers choosing a heating system must factor in ROI based both on the benefits of lower energy consumption and the benefits of better performance to ensure data centers in their care have the best possible generator set engine heating systems available.

2 hotflow™ comparison report | data center genset heating test
TEST PARAMETERS
TEST LOCATIONThis test was performed at a major data center located near Minneapolis/St. Paul. While Minnesota’s winters are known for their severity, our test generators were housed indoors in a heated generator room; the lowest ambient temperature the room was expected to experience over the course of a year was about 55 °F.
The data center generator room housed four generator sets rated at a two megawatt output; each was powered by a Caterpillar 3516 four-stroke diesel V-16 engine — 4210.64 cubic inches in displacement (69 liters).
Each generator set was preheated by two 6 kW vertically mounted thermosiphon heaters. To evenly distribute heat throughout the V-type engine, one 6 kW heater was mounted and plumbed to each side of the engine. The thermosiphon heaters were intended to be operated in unison for heat distribution purposes only; both units provided heat while the engine was shut off. This configuration was not intended to provide redundancy in the event of a single heater failure.
On hand to conduct and monitor the test were HOTSTART’s Jeff Thompson, HOTflow market manager and engine heating efficiency expert; Russell Maw, the CSM’s product design engineer; and Ziegler CAT’s Bob Eisenschenk, field service project manager. Data center management staff members were also onsite to directly observe and review testing.
TEST HEATERThe test heater was a 6 kW HOTSTART HOTflow CSM unit. While thermosiphon heaters rely on the natural expansion and rising of heated fluid to drive circulation, the CSM uses a centrifugal pump to circulate heated coolant, continually pumping coolant throughout the engine’s water jacket and activating the heating element when the temperature falls below a preset limit. This continual circulation is designed increase energy efficiency and heat distribution by minimizing hotspots and promoting uniform and consistent heating.
In an indoor environment with a minimum temperature no lower than 55 °F, HOTSTART technicians expect that a 6 kW CSM will adequately heat a 69 liter engine, such as the CAT 3516, and maintain a minimum internal engine temperature of 90 °F.
Figure 1. Generator sets housed in the data center facility. Each of the four generator sets is rated for 2 MW and is powered by a CAT 3516 engine.
Figure 2. HOTSTART 6 kW CSM heater, showing tank, pump and control box.

3hotflow™ comparison report | data center genset heating test
TEST PREMISEThe testing was intended to quantitatively answer two questions:
h Can a single forced circulation heater distribute effective heating throughout the engine block when compared to a pair of thermosiphon heaters operating in unison?
h Can a single forced circulation heater heat efficiently and deliver measurable cost savings in the form of energy conservation?
TEST TOOLSTo measure heating performance and efficiency, HOTSTART technicians used the following equipment:
Thermocouples
Thermocouples are electronic heat-sensing devices. Each thermocouple is designed to be attached to a surface by adhesive and converts temperature data to an electrical output. For thorough analysis, temperature data from multiple thermocouples was collected and recorded.
Current transformer sensors
Current transformer (CT) sensors are electronic devices designed to record the energy usage of a particular device or system and are commonly used in the energy utility industry. CT sensors were placed on both the thermosiphon heaters as well as the CSM’s pump and element to measure how much electrical energy each heating system consumed during testing.
FRONT/RIGHT THERMOCOUPLE
REAR/RIGHT THERMOCOUPLE
THERMOSIPHON HEATER CSM HEATER
FRONT/LEFT THERMOCOUPLE
REAR/LEFT THERMOCOUPLE
Figure 3. The test engine’s right side, showing CSM, thermocouples and thermosiphon heater. While the right thermosiphon heater remained in service at the facility manager’s request, it provided a negligible amount of engine heating.
Figure 6. The test engine’s left side, showing CSM supply port and thermocouples. To ensure effective heating was applied to both cylinder banks of the V-type engine using a single heater, the CSM supply port was installed on opposite side.
Figure 4. The test engine’s right side with installed CSM and thermosiphon heater. Both heaters share a single return port using a Y-fitting.
Figure 5. The test engine’s left side showing CSM supply port. The supply port is mounted to the opposite side to ensure even heat distribution.

4 hotflow™ comparison report | data center genset heating test
Thermal imaging camera
To view heat distribution in real-time, HOTSTART technicians viewed test generator sets with a thermal imaging camera. A thermal imaging camera uses the infrared spectrum to translate heating energy as a color-coded image. Thermal imaging cameras can visualize heat distribution during engine heating — detecting hot spots that may damage heater plumbing or cold spots inside an engine’s water jacket.
TEST PLAN & PROCEDURES
METHODSTo conduct the test, HOTSTART technicians removed one 6 kW thermosiphon heater from the designated test engine and replaced it with a single 6 kW CSM. By request, the remaining thermosiphon heater mounted to the right side of the test engine was left connected and energized, although the CSM’s forced circulation system ensured that it would provide most, if not all, engine heating. To determine whether the thermosiphon heater impacted the performance of the CSM, HOTSTART technicians collected data from the test engine heaters’ CT sensors and test engine block’s thermocouples.
To establish a performance baseline, thermocouples were also placed on an identical adjacent generator set as a control. The control engine was left with both 6 kW thermosiphon heaters operating normally. To establish a baseline energy consumption level, CT sensors were also placed on the control engine’s thermosiphon heaters.
CSM INSTALLATIONTo accommodate the CSM, the thermosiphon heater on the right side of the test engine was rotated 180 degrees and remounted in the same location. A Y-fitting was installed at the oil cooler and both the right thermosiphon and CSM return ports were routed to this location.
To allow the single CSM to effectively heat the entire engine block, the CSM’s supply line was installed on the opposite (left) side of the engine block. HOTSTART recommends this type of cross-installation for V-type configurations; cold coolant is drawn from the far bank of cylinders, while heated coolant is returned to the near cylinder bank. As the pump continuously circulates coolant, heat is effectively distributed across the entire engine jacket, eliminating the need for multiple heaters to preheat a single engine block.
The data center representative requested that the thermosiphon heater connected to the right side of test engine remain active due to concerns with heater redundancy during testing as all four generators remained in service during the testing and could potentially be called in to action during a power event. While not a HOTSTART recommended installation configuration, the thermosiphon heater on the right side remained installed and activated to address these concerns. Although our technicians expected the CSM to provide the bulk of the test engine’s heat, the remaining right thermosiphon heater was monitored during testing to measure how much, if any, engine heating it provided.
The thermosiphon heater that was previously connected to the left side of the test engine was removed for the entire test duration.
Fig 7. Thermocouple shown attached to the test engine block (above). Temperatures from all points were captured using a temperature data logger (below).

5hotflow™ comparison report | data center genset heating test
HEATING PERFORMANCEThe first temperature measuring point was the ambient temperature of the room, to establish a baseline for testing. To measure temperatures across the entire water jacket, four thermocouples were attached to each engine block; one thermocouple was placed toward the radiator end of the block and one toward the flywheel end on each side of both the test and control engines.
To measure the temperature of the heaters, a thermocouple was placed at the inlet and outlet of all four heaters. The ambient temperature of the room and the temperature of engine block sections were also recorded for analysis.
ENERGY CONSUMPTIONTo measure energy consumption, CT sensors were placed on the element power connections for the three thermosiphon heaters (one for each thermosiphon heater attached to the control engine, and one for the thermosiphon heater attached to test engine). To measure the CSM’s energy consumption, a CT sensor was placed on the power source for the element as well as the pump motor. For a more in-depth analysis, HOTSTART technicians sought to measure how much energy the CSM was drawing to circulate the fluid using its pump versus heating the fluid using the element.
DURATION AND CONDITIONSData, from both the CT sensors and thermocouples, was collected from July 17th to August 17th — a total of 32 days. Each day, temperatures were recorded at one minute intervals and averaged for the 24 hour period. Daily averages were also collected for energy consumption.
During two consecutive days of the test, July 21st and July 22nd, the generators were activated during approximately 30% of each day. This period is reflected in the test data, showing a decrease in engine heating provided by both the thermosiphon heaters and CSM as the engines supplied their own heat during operation. (All CSM heating systems are equipped with a relay intended to shut down the heating system during engine operation.) Once the engines were shut down, engine heating resumed as normal.
The thermosiphon heater installed on the left side of the control engine suffered a malfunctioning CT sensor and our technicians were unable to collect energy consumption data for this unit after July 22nd. However, once the data was reviewed, HOTSTART was able to estimate the energy consumption of this unit based on data collected from the two remaining thermosiphon heaters.
During testing, ambient temperatures were as expected for an enclosed generator room in Minnesota during July and August; temperatures in the room ranged from a low of 84 °F to 102 °F. These relatively high room temperatures meant the heaters were not tasked with raising the internal engine temperature above a low ambient temperature. Instead, the heating performance comparison centered on the heaters’ ability to maintain a consistent and even block temperature prior to engine start-up.

6 hotflow™ comparison report | data center genset heating test
TEST DATA
AVERAGE ENGINE BLOCK TEMPERATURESThe following table shows the daily average temperatures of the control engine block and the test engine as measured with attached thermocouples during testing:
DayControl Engine Test Engine
Left/Front °F
Left/Rear °F
Right/Front °F
Right/Rear °F
Left/Front °F
Left/Rear °F
Right/Front °F
Right/Rear °F
17 July 118.0 122.7 117.6 119.7 101.6 102.1 101.8 103.4
18 July 119.7 124.2 119.5 121.3 101.7 102.0 102.1 102.9
19 July 120.4 124.8 120.2 121.9 100.3 100.6 101.0 101.3
20 July 121.0 125.5 120.9 122.5 100.0 100.2 100.8 100.9
21 July* 144.6 138.6 111.6 110.7 107.3 132.2 134.8 132.0
22 July* 142.4 131.6 92.1 91.2 95.4 134.4 138.2 135.0
23 July 118.6 119.9 83.6 86.6 93.2 102.1 104.2 103.3
24 July 117.4 118.5 82.0 83.7 100.6 101.3 103.2 102.7
25 July 116.7 118.8 84.0 84.3 100.5 100.9 103.0 102.2
26 July 120.8 122.7 88.9 88.4 99.0 99.3 101.2 100.1
27 July 116.4 118.0 82.6 82.6 100.1 100.8 102.8 102.1
28 July 118.3 117.5 80.8 82.5 100.7 101.4 103.6 102.9
29 July 114.3 115.2 79.2 80.9 100.7 101.5 103.6 103.1
30 July 114.3 115.6 79.0 80.6 100.8 101.6 103.6 103.3
31 July 115.3 116.5 80.2 81.7 100.7 101.4 103.4 103.0
1 August 115.4 117.1 80.7 82.0 101.1 101.7 103.7 103.3
2 August 115.9 117.9 81.3 82.3 100.9 101.6 103.5 103.1
3 August 116.0 118.4 82.3 83.3 101.2 101.9 103.7 103.4
4 August 115.3 117.2 81.9 83.0 101.1 101.7 103.7 103.2
5 August 114.7 116.7 80.5 81.9 101.0 101.8 103.7 103.3
6 August 115.4 118.0 80.5 81.9 101.1 101.8 103.6 103.4
7 August 116.3 119.1 81.0 82.1 101.2 101.9 103.8 103.4
8 August 115.3 118.1 81.2 82.2 101.1 101.8 103.8 103.3
9 August 114.3 116.9 80.4 81.5 100.8 101.7 103.6 103.2
10 August 115.2 117.9 80.9 81.7 101.1 101.9 103.8 103.4
11 August 114.5 115.1 77.5 79.4 100.9 101.8 103.9 103.6
12 August 114.8 115.8 77.3 78.9 100.8 101.6 103.7 103.4
13 August 115.5 117.9 79.2 80.4 100.8 101.6 103.7 103.3
14 August 116.6 118.9 79.9 80.7 101.3 101.8 103.7 103.2
15 August 118.8 121.2 85.8 85.7 102.0 102.4 104.1 103.6
16 August 119.4 121.5 87.3 87.2 102.0 102.3 103.9 103.3
17 August 119.2 122.1 87.0 87.7 102.2 102.6 104.1 103.6
Average 116.8 °F 119.0 °F 86.8 °F 88.0 °F 100.7 °F 101.6 °F 103.3 °F 102.9 °F
117.9 °F 87.4 °F 101.15 °F 103.1 °F
Total 102.6 °F 102.1 °F
Table 1. Average engine block temperatures for both the control engine and test engine.
* The data from July 21 and July 22 was not included in the average temperatures. During these days the control engine and test engine were active and supplying power. Temperature data from these days was altered due to the engines’ own heat generated during operation.

7hotflow™ comparison report | data center genset heating test
Heating performance is comparable between the test and control engine blocks: the total block average temperature is within five tenths of a degree. However, when examining heat distribution throughout the blocks more closely, the test engine shows even heat distribution across all sections of the block. The difference between the hottest section of the block (front/right at 103.3 °F) and the coolest section of the block (front/left at 100.7 °F) is only 4.6 °F.
In contrast, the difference between the hottest section of the control engine block average (rear/left at 119.0 °F) and coolest section of the control engine block (front/right at 86.8 °F) is 32.2 °F. This large difference in temperature suggests that not all portions of the control engine may be at optimal temperature during an engine start-up — potentially causing unnecessary wear over the engine’s operating life.
Heating system performance itself may also be negatively impacted by uneven heating. Because thermosiphon heaters rely exclusively on thermal expansion to circulate coolant, outlet temperatures may be consistently higher than a comparable forced circulation system. These high temperatures may reduce the heating system’s hose longevity, resulting in more frequent heater service. As Ziegler CAT’s facility field service project manager, Bob Eisenschenk observed, “The one thing we see in systems that are poorly maintained is heater hose failure because it’s so hot all of the time. Whereas with a powered flow heater everything is consistent — you get a lot longer life out of your hoses and coolant as well.
THERMOSIPHON HEATER
LOWEST:HIGHEST:
AVERAGE:
78.9 ºF122.5 ºF88.0 ºF
LOWEST:HIGHEST:
AVERAGE:
77.3 ºF120.9 ºF86.8 ºF
THERMOSIPHON HEATER
LOWEST:HIGHEST:
AVERAGE:
114.3 ºF121.0 ºF116.8 ºF
LOWEST:HIGHEST:
AVERAGE:
115.1 ºF125.5 ºF119.0 ºF
Figure 9. The control engine right side (above) and left side (below), showing thermosiphon heater, thermocouples, and recorded temperatures.
While each thermosiphon was intended to supply heat evenly to the V-type engine, heating temperatures varied greatly across all sections of the block. The collected average temperatures suggest that difference in temperature from the warmest average section of the engine block (rear/left) and the coolest average section of the engine block could be as much as 32.2 °F.
While the engine’s onboard temperature alarm may not signal a low temperature, the temperature of the coolest section of the engine block may be below the recommended 90 ºF limit during start-up. Repeated engine starts at low temperatures may increase engine wear and reduce the engine’s operating life.
Figure 8. Thermal image of the outlet section of a thermosiphon heater. Consistently high average temperatures as recorded at the control engine’s left (170.6 °F) and right (158.5 °F) thermosiphon heater outlets may reduce hose and coolant longevity.

8 hotflow™ comparison report | data center genset heating test
AVERAGE HEATER ENERGY CONSUMPTIONTo establish a baseline for energy consumption, the power consumed by the control engine’s two thermosiphon heaters was measured. While the thermosiphon heaters are intended to operate in unison, in real-world scenarios it is likely that one thermosiphon heater will be active for longer periods of time and consequently will draw more power due to variances in installation and hose routing. Additionally, some sections of an engine block may lose heat more rapidly than others.
Table 2. Energy consumption of the control engine heaters and test engine heaters.
* The control engine’s left thermosiphon energy consumption after July 22nd is estimated due to a CT sensor malfunction.
† The data from July 21 and July 22 was not included in the average temperatures.
Day
Control Engine Test Engine
Left Thermosiphon
kWh
Right Thermosiphon
kWh
CSM Element kWh
CSM Pump kWh
Right Thermosiphon
kWh17 July 55.98 87.46 35.83 2.06 7.71
18 July 51.32 81.12 25.28 2.06 11.64
19 July 49.79 77.00 12.35 2.06 21.56
20 July 48.49 74.22 6.13 2.06 24.55
21 July† – – – – –
22 July† – – – – –
23 July 51.39* 70.46 24.86 2.06 14.63
24 July 51.39* 82.39 44.88 2.06 12.64
25 July 51.39* 92.82 27.26 2.06 17.14
26 July 51.39* 93.87 0.00 2.06 32.72
27 July 51.39* 94.67 46.89 2.06 14.13
28 July 51.39* 97.79 56.79 2.06 8.13
29 July 51.39* 114.32 57.00 2.06 7.97
30 July 51.39* 102.20 58.70 2.06 7.22
31 July 51.39* 112.95 56.97 2.06 8.64
1 August 51.39* 112.12 46.80 2.06 8.48
2 August 51.39* 110.21 53.24 2.06 8.84
3 August 51.39* 103.54 45.59 2.06 8.95
4 August 51.39* 106.91 46.22 2.06 9.19
5 August 51.39* 108.49 56.48 2.06 6.94
6 August 51.39* 98.15 55.42 2.06 7.64
7 August 51.39* 85.84 54.29 2.06 7.06
8 August 51.39* 95.88 49.12 2.06 7.54
9 August 51.39* 106.39 55.28 2.06 7.19
10 August 51.39* 98.71 53.65 2.06 6.82
11 August 51.39* 106.43 69.91 2.06 4.32
12 August 51.39* 102.52 62.54 2.06 5.80
13 August 51.39* 91.08 59.11 2.06 6.64
14 August 51.39* 86.90 51.38 2.06 7.90
15 August 51.39* 82.19 26.00 2.06 11.57
16 August 51.39* 79.19 21.04 2.06 12.69
17 August 51.39* 76.60 28.01 2.06 11.40
Average51.39* 94.41
42.90 2.06
10.9244.96
Total 145.8 kWh per day 55.88 kWh per day

9hotflow™ comparison report | data center genset heating test
Control Engine Heater Energy Consumption
As indicated by the data, the thermosiphon heaters on the control engine showed an approximate 60/40 split in energy consumption. However, the average block temperature for the right side of the control engine was about 31 degrees lower than the left side. This suggests that the right side of the engine may have lost heat more rapidly, causing the right thermosiphon to consume more energy to maintain an average temperature of only 87.4 °F. While the scope of this project did not entail discovering the cause of the heating discrepancy, this example of asymmetrical heating and power usage is expected even from similar heaters mounted in unison. Factors such as engine water jacket configuration, port selection, and hose routing may greatly alter a thermosiphon heater’s effectiveness and efficiency.
Test Engine Heater Energy Consumption
When measuring the energy consumption of the test engine, HOTSTART technicians also carefully monitored the remaining thermosiphon heater to ensure that it did not interfere with the direct evaluation of the CSM’s performance. The following table shows the energy consumption of the test engine’s thermosiphon heater and installed CSM.
The CSM’s pump drew a consistent amount of energy as it continuously circulated coolant throughout the engine’s water jacket while the CSM’s element shows fluctuating energy consumption — energizing only when the CSM thermostat measured a coolant temperature at or below its preset range. And while the CSM provided the majority of the engine heating and consumed most of the energy, the test engine thermosiphon is represented here as well — showing an approximate 20/80 split in energy consumption with the CSM.
To put the test engine’s thermosiphon heater’s consumption into context, the average daily energy consumed by the test engine’s right thermosiphon was compared to the control engine right thermosiphon heater. With the introduction of the CSM, the right thermosiphon heater (which normally would consume 94.41 kWh) consumed only 10.92 kWh, or only 11.57% of its expected energy consumption. This suggests that while the test engine thermosiphon heater remained connected and active, it consumed only a fraction of the power and provided a negligible amount of overall engine heating. The CSM forced circulation system was effectively preheating the test engine unassisted.
Test AveragesControl Engine Test Engine
Left Thermosiphon
Right Thermosiphon CSM Right
ThermosiphonBlock Temperature 117.9 °F 87.4 °F 103.6 °F
Energy Consumed 51.39 kWh 94.41 kWh 44.96 kWh 10.92 kWh
Energy Percentage 35.25% 64.75% 80.46% 19.54%
Left Thermosiphon
Right Thermosiphon
Right Thermosiphon
CSM
Table 3. Test averages for block temperatures and energy consumed. The control engine shows a split between left and right sides of the engine, both in the average heat as well as the energy consumed by the thermosiphon heater on that side.
When the CSM is added to the test engine scenario, the right thermosiphon, which we would expect to consume 94.41 kWh, consumes only 10.92 kWh as the CSM assumes the bulk of the engine heating duty.
10 hotflow™ comparison report | data center genset heating test
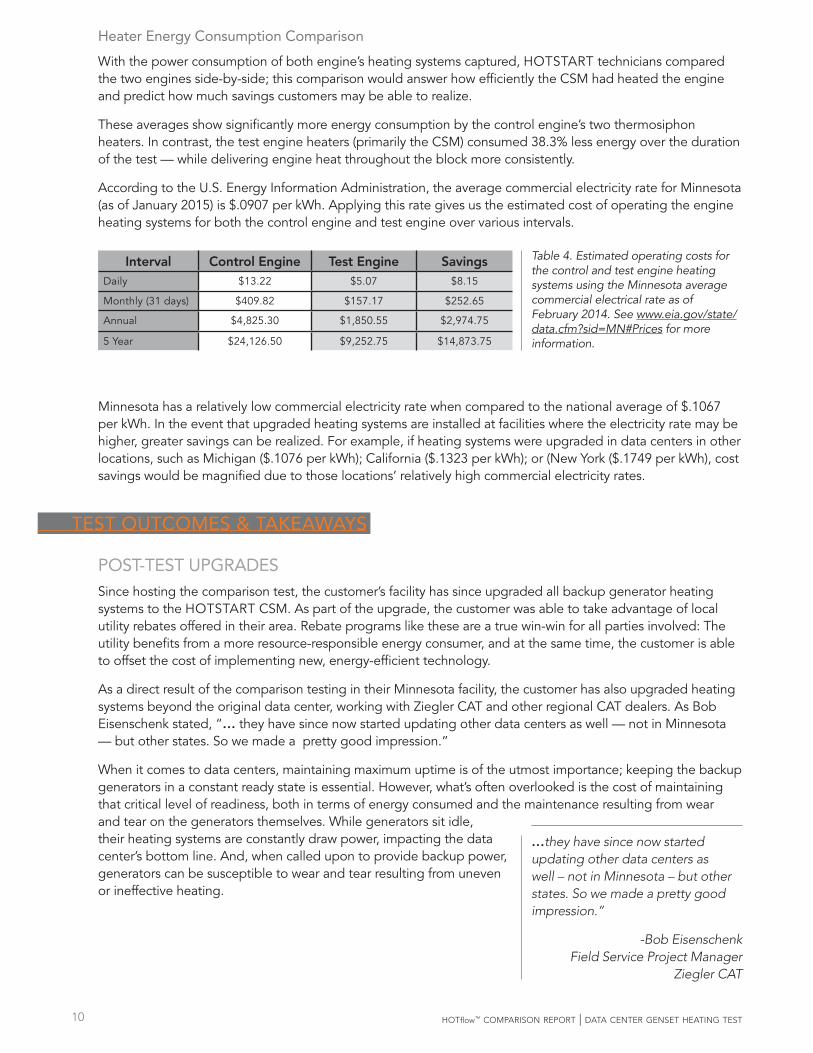
Heater Energy Consumption Comparison
With the power consumption of both engine’s heating systems captured, HOTSTART technicians compared the two engines side-by-side; this comparison would answer how efficiently the CSM had heated the engine and predict how much savings customers may be able to realize.
These averages show significantly more energy consumption by the control engine’s two thermosiphon heaters. In contrast, the test engine heaters (primarily the CSM) consumed 38.3% less energy over the duration of the test — while delivering engine heat throughout the block more consistently.
According to the U.S. Energy Information Administration, the average commercial electricity rate for Minnesota (as of January 2015) is $.0907 per kWh. Applying this rate gives us the estimated cost of operating the engine heating systems for both the control engine and test engine over various intervals.
Minnesota has a relatively low commercial electricity rate when compared to the national average of $.1067 per kWh. In the event that upgraded heating systems are installed at facilities where the electricity rate may be higher, greater savings can be realized. For example, if heating systems were upgraded in data centers in other locations, such as Michigan ($.1076 per kWh); California ($.1323 per kWh); or (New York ($.1749 per kWh), cost savings would be magnified due to those locations’ relatively high commercial electricity rates.
TEST OUTCOMES & TAKEAWAYS
POST-TEST UPGRADESSince hosting the comparison test, the customer’s facility has since upgraded all backup generator heating systems to the HOTSTART CSM. As part of the upgrade, the customer was able to take advantage of local utility rebates offered in their area. Rebate programs like these are a true win-win for all parties involved: The utility benefits from a more resource-responsible energy consumer, and at the same time, the customer is able to offset the cost of implementing new, energy-efficient technology.
As a direct result of the comparison testing in their Minnesota facility, the customer has also upgraded heating systems beyond the original data center, working with Ziegler CAT and other regional CAT dealers. As Bob Eisenschenk stated, “… they have since now started updating other data centers as well — not in Minnesota — but other states. So we made a pretty good impression.”
When it comes to data centers, maintaining maximum uptime is of the utmost importance; keeping the backup generators in a constant ready state is essential. However, what’s often overlooked is the cost of maintaining that critical level of readiness, both in terms of energy consumed and the maintenance resulting from wear and tear on the generators themselves. While generators sit idle, their heating systems are constantly draw power, impacting the data center’s bottom line. And, when called upon to provide backup power, generators can be susceptible to wear and tear resulting from uneven or ineffective heating.
Interval Control Engine Test Engine SavingsDaily $13.22 $5.07 $8.15
Monthly (31 days) $409.82 $157.17 $252.65
Annual $4,825.30 $1,850.55 $2,974.75
5 Year $24,126.50 $9,252.75 $14,873.75
Table 4. Estimated operating costs for the control and test engine heating systems using the Minnesota average commercial electrical rate as of February 2014. See www.eia.gov/state/data.cfm?sid=MN#Prices for more information.
…they have since now started updating other data centers as well – not in Minnesota – but other states. So we made a pretty good impression.”
-Bob Eisenschenk Field Service Project Manager
Ziegler CAT

This comparison testing reveals the need to properly assess forced circulation heaters when choosing an engine heating solution. When directly compared head-to-head against legacy thermosiphon heating solutions, forced circulation systems offer advantages in terms of lower energy consumption and lower maintenance costs — offering a significant return on initial investment.
For more information regarding this comparison test or to learn more about HOTSTART HOTflow engine heating solutions, contact HOTSTART directly:
Jeff Thompson, BEP HOTSTART Market Manager – HOTflow 509.536.8675 [email protected]
Russell Maw HOTSTART Product Design Engineer – HOTflow 509.536.8662 [email protected]
HOTSTART Sales 509.534.6171 [email protected]
WWW.HOTSTART.COMCustomer Service 509.536.8660